tni lod – concepts of...
TRANSCRIPT

DETECTIONTNI LOD – Concepts of

Detection is a binary decision –YES or NO.
What is DETECTION?
Can you see it or not?
The number associated with that detected analyte does not need to be accurate or precise. It’s just a ball park number…
1 234
5
Was it there or not?


The classic definition of “Detected” is from Lloyd Currie.
He called the value where you are almost positive your detection is not background the “Critical Level LC”.
What does detected mean?

The Critical Level
0 0.01 0.02 0.03 0.04 0.05
The Critical Level, LC, is where the detection decision is made, and has an acceptable rate of false positives (<1%)
Blanks – no analyte present
LC

There are lots of false negatives for a true value at LC
0 0.01 0.02 0.03 0.04 0.05
…if you have a true value at the LC, you’ll have up to 50% false negatives!
Blanks – no analyte present
LC
The LC is NOT the level at which you are confident of detecting and reporting an analyte…

Currie’s Limit of Detection, LD
0 0.01 0.02 0.03 0.04 0.05
The Detection Level, LD, is where my sample distribution minimally intersects the blank population.
Blanks – no analyte present
LC LD

What does detected mean?
In environmental analytical chemistry, there are two basic kinds of detecting…
One where the analyte starts to appear… like in GC
I see it!

What does detected mean?
…and one where your analyte is indistinguishable from background, like ICP… so you don’t “detect” this analyte until you are out of the background range.
ICP Detection based on Quantitated Value

What does detected mean?
GC analyses have noise just like ICP. It is just that the instrument signal cut-off value is set to eliminate the chatter so the report will not be overloaded with non-reportable noise.If you look below the that threshold, you will see the noise.
My Threshold

Inorganic Analysis…
Inorganic analyses like ICP and ICPMS always have signal, be it electronic noise,
contamination, interference or carryover.
“Detected” ≠
“Any Measurable Signal”

The EPA MDL (40 CFR Part 136)
If you plotted the distribution of your blanks, they might look like this
The MDL assumes that if you spike at a low concentration you’ll get the same distribution as the blanks.
0 0.01 0.02 0.03 0.04 0.05

The EPA MDL (40 CFR Part 136)
So we now have a derived distribution of blank results from the spikes.
Uses spike results as a substitute for blanks
0 0.01 0.02 0.03 0.04 0.05

The EPA MDL (40 CFR Part 136)
0 0.01 0.02 0.03 0.04 0.05
The MDL is calculated as the standard deviation
times the Student’s t value for n-1 observations using the 99th percent confidence interval.
(1 0.99, n-1) S MDL t α− == ×
Which puts MDL at 1% of the right-tail.

MDL, LC, and Limit of Detection
0 LC LD
The MDL is similar to LC
The MDL is not equivalent to Currie’s Limit of Detection, LD!
No analyte present
Analyte is present

LC, MDL and LD
0
No analyte present
Low concentration spikes
The LC
The LC is dependent on the background.The MDL is based on substituting low concentration spikes for blanks.
The MDLPretend that
The LD
LDThe LD is where you are really confident that there will be very minimal background interference (False positives) and confident that you will detect the analyte whenIt is present at the LD concentration.
Or MDLLC
STOP! Entering F+ zone!

The EPA MDL (40 CFR Part 136)
(1 0.99, n-1) S MDL t α− == ×
0 0.01 0.02 0.03 0.04 0.05
If your blanks have a positive bias (frequent detections), centering the spike distribution on zero can underestimate the MDL significantly.
From this:
To this

The EPA MDL (40 CFR Part 136)
(1 0.99, n-1) S MDL t α− == ×
0 0.01 0.02 0.03 0.04 0.05
One recommendation to minimize this type of error is to offset the MDL by the mean blank population.
(1 0.99, n-1) X + (S )MDL t α− == ×Mean Blank = 0.005

The EPA MDL (40 CFR Part 136)
0 0.01 0.02 0.03 0.04 0.05
What tolerance does your customer have for false positives? The common value chosen is <1%.
The idea is to minimize False Positives to 1% or less.
If you don’t report data down to the MDL, then it isn’t a problem.
F+ Zone

The EPA MDL (40 CFR Part 136)
0 0.01 0.02 0.03 0.04 0.05
Now >> 1% of reportable concentrations could be
due to background.
Report “Not Detected” Report detections
Un-corrected MDL
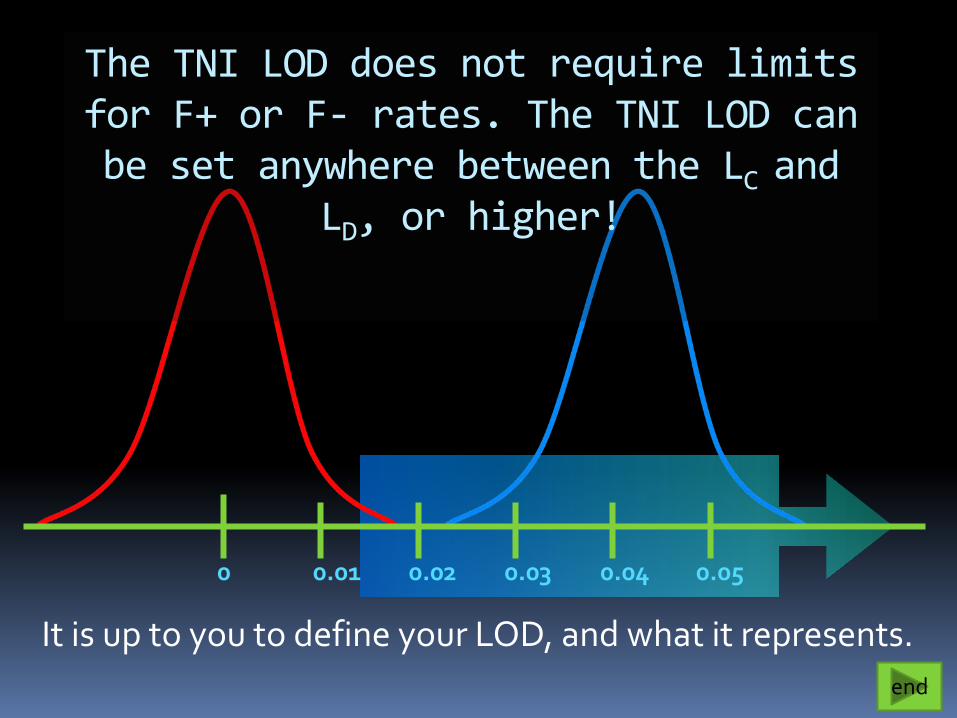
The TNI LOD does not require limits for F+ or F- rates. The TNI LOD can be set anywhere between the LC and
LD, or higher!
end
0 0.01 0.02 0.03 0.04 0.05
It is up to you to define your LOD, and what it represents.