title: the use of health warning labels to discourage
TRANSCRIPT

© Michelle Leon, Zoe Aslanpour & John Martin Corkery April 2021
1
TITLE PAGE
Title: The use of health warning labels to discourage sugar-sweetened beverage consumption by children (including adolescents)
Author names and affiliations: Michelle Leona RN, MSc; Zoe Aslanpoura PhD; John Martin Corkerya
MPhil.
a Department of Post-graduate Medicine
School of life & Medical Sciences
University of Hertfordshire
College Lane Campus
Hatfield, Hertfordshire
AL10 9AB, United Kingdom
Email: [email protected]
Email: [email protected] Tel: +44 (0)1707 284563 ORCID No: 0000-0002-2567-0540
Email: [email protected] Tel: +44 (0)1707 281053 ORCID No: 0000-0002- 3849-817X
Acknowledgements
No funding was received for this review.
2
Abstract
Introduction
Sugar-sweetened beverage (SSB) consumption is high among children and is linked to an increased
risk of diet-related diseases such as obesity and dental decay. This review aimed to investigate the
effectiveness of using health warning labels (HWLs) as a strategy to discourage SSB consumption by
children.
Methods
A systematic literature review of studies published from 2015 to 2019 was conducted using four
electronic databases and citation tracking. Search terms included “children*”, “schoolkid*”, “health
warning label*” and “sugar-sweetened beverage*”. Identified studies were reviewed using a quality
appraisal tool and narrative analysis was performed.
Results
Six studies with a low risk of bias were included for examination. Moderate quality evidence was
found for increases in risk perception and reductions in SSB beverage desirability and selection. Low
quality evidence was found for reductions in SSB consumption and positive body weight changes.
Discussion and implications for research and practice
Moderate to low quality evidence supports the use of SSB warning labels as an effective strategy to
discourage SSB consumption by children. In the included studies, parental and child exposure to a
HWL was shown to reduce the likelihood of SSB selection. HWLs show promise for efficacy but
more pragmatic research is required. Stronger evidence could facilitate more effective policy
development.
3
INTRODUCTION
Sugar-sweetened beverages (SSBs), defined as drinks containing a caloric sweetener, are one of the
largest added-sugar sources in children’s diets¹. Approximately two-thirds of children are reported
to consume SSBs daily²˒ ³. The World Health Organization (WHO) recommends that free sugar
intake for adults and children (up to the age of 19) should be less than 10% total daily intake⁴.
However, this recommendation can be easily exceeded by children with a single serving of most
types of SSBs⁵. These drinks are heavily marketed to children through various media such as
television and social media platforms⁶. There is strong evidence that links frequent SSB
consumption in children with increased risk of dental caries, weight gain and risk of obesity in
adulthood⁷˒⁸.
Risk perception is a person’s judgement on the likelihood of being susceptible to a threat⁹.
Manufacturers arguably attempt, through advertising, to reduce the consumers’ risk perception of
the health implications of SSBs by understating the levels of sugar in these products and the
consequences of high sugar consumption¹⁰. Advertisements present SSBs as trendy drinks and often
take advantage of ‘functional nutritionism’, whereby manufacturers emphasise the benefits of
specific nutrients in a product; for example, ‘this drink is high in vitamin C’ or ‘one of your 5 a day⁶.
This gives many SSB’s e.g. sports drinks, sweetened water, fruit drinks etc. a ‘health halo’, as these
products become perceived as healthy by the consumer⁶. It has been argued that many children
and parents may not be aware of or have distorted risk perceptions about the negative health
consequences of SSB consumption¹⁰.
4
The growing concern about the health risks of SSBs has prompted policymakers to look at strategies
to reduce their consumption. One strategy is the use of health warning labels (HWLs) on SSBs. The
belief that HWLs are effective in discouraging unhealthy behaviours stems from their successful use
in reducing tobacco consumption¹¹. Thus, the development of HWLs for SSBs has been based on the
principles of Article 11 of the Framework Convention on Tobacco Control (FCTC) that underpins
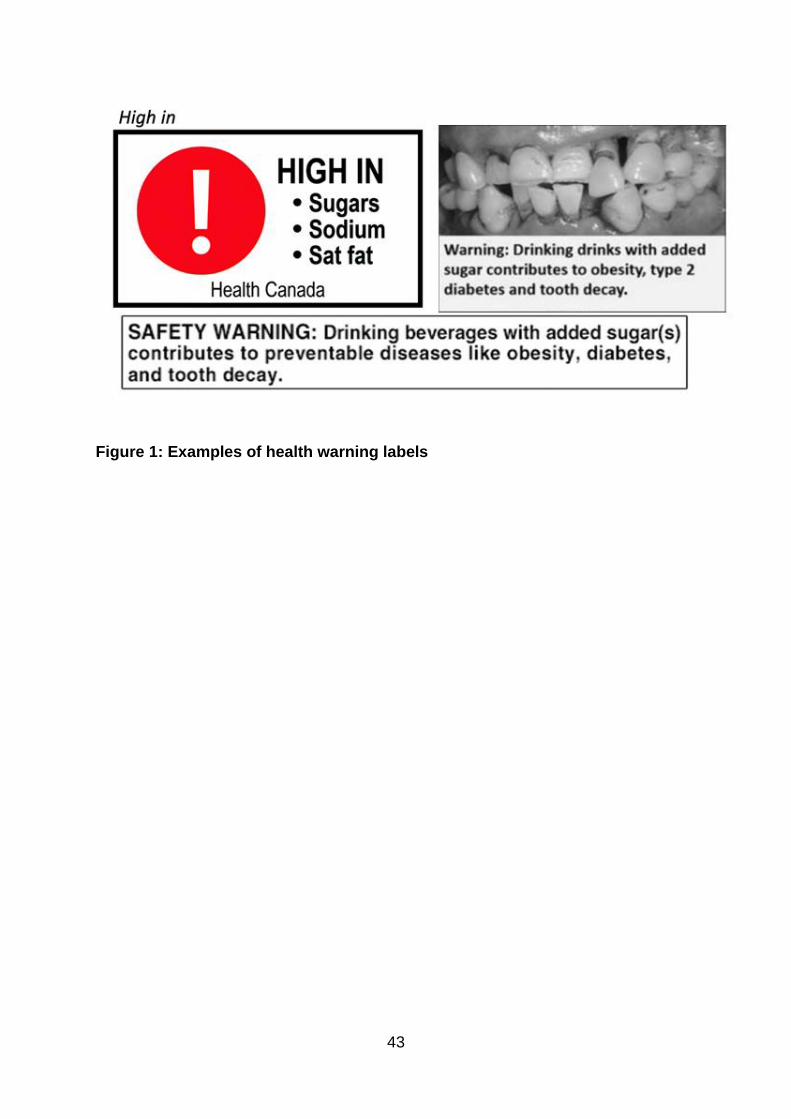
tobacco HWLs¹¹. Therefore, in a similar manner to tobacco HWLs, both text- and image-based labels
have been created¹¹. Figure 1 provides examples of SSB warning labels that have undergone
experimentation in studies¹² ¹³ ¹⁴. The consumer is warned about the sugar content of the beverage
through a combination of symbols, images, or bold text.
Environment significantly influences health-related behaviours, including choice of food and drink
consumption¹⁵. Altering these environments may provide a catalyst for healthier food purchasing
and consumption behaviours¹⁵. Improving the health environment and tackling unhealthy habits
(e.g. frequent SSB consumption) in childhood, is reported to be particularly useful in reducing the
burden of non-communicable disease, as this is the time where dietary and health habits are
forming¹⁶.
As explained by the risk perception attitude framework (RPAF), HWLs must act as an effective fear
appeal and activate increased consumer risk perception for desired health-protecting behaviours to
take place; e.g. reduced SSB selection and consumption¹⁷. In addition, the higher a consumer’s self-
efficacy is (the belief in one’s ability to effectively change an outcome), the quicker will be the
initiation of health-protecting behaviours¹⁸. According to the RPAF, at least 50% of consumers will
experience an increase in risk perception upon exposure to a fear appeal ¹⁸. There is evidence to
5
show that well-designed HWLs are effective in acting as a fear appeal and communicating health
risks to the population¹⁹.
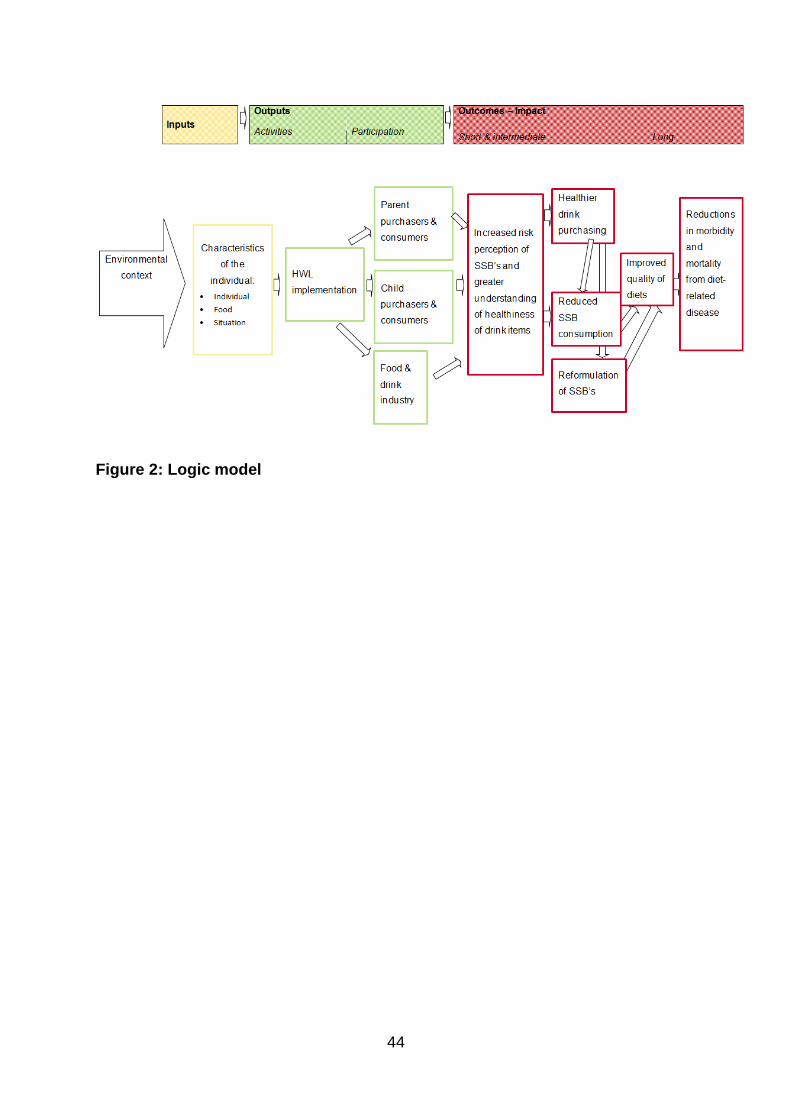
The adapted logic model (see Figure 2) by Crockett et al. ²⁰ seeks to explain the processes by which
exposure to an HWL on an SSB, might be expected to lead to reduced purchasing and consumption
behaviour of SSBs among children. Theoretically, in accordance with the RPAF, HWLs on SSBs seek
to quickly educate the consumer that such products are high in sugar and are, therefore, an
unhealthy option associated with health risks¹⁷. An HWL thus acts as a fear appeal and activates risk
perception in children who are old enough to buy their own food and drink and parents on behalf
of their children. This ideally leads to reduced SSB selection and consumption and, instead, to a
focus on healthier drink alternatives. Additionally, SSB manufacturers may also decide to initiate
positive drink reformulation due to their own increased risk perceptions of SSBs and reduced
consumer demand. Improvements in the quality of consumer diets from reduced purchasing and
consumption of SSBs and SSB product reformulation would then ultimately help to protect
population-level health, by reducing the risk of children developing non-communicable diseases
such as obesity and dental decay.
Research investigating the effectiveness of HWLs on reducing SSB consumption in children has
shown promising results. For example, a large randomised control trial (RCT) by Roberto et al.
(2016)¹² found that HWLs on SSBs led to significantly fewer parents deciding to purchase SSBs for
their children. Similarly, other RCTs have found that, compared to no label, different versions of
HWLs on SSBs have led to a significant increase in risk perception and discouraged SSB
selection¹²˒¹⁴˒²¹. However, no systematic review has been conducted to summarise research
6
findings. Additionally, no summative conclusion has been drawn for which type of HWL (i.e. image-
or text-based) is most effective at reducing SSB consumption.
A high proportion of children regularly consume SSBs⁵ and therefore the present systematic review
was undertaken to answer the following question - is there a reduction in the consumption of SSBs
by children when HWLs are used on such drinks? This review aimed to assess the impact HWLs have
on child (up to the age of 19) and parent risk perceptions about SSBs and changes in intended
purchasing behaviour after exposure to HWLs. The study also sought to assess the types of HWLs
(i.e. image- or text-based) that are most effective at educating and reducing the appeal of SSBs.
METHODS
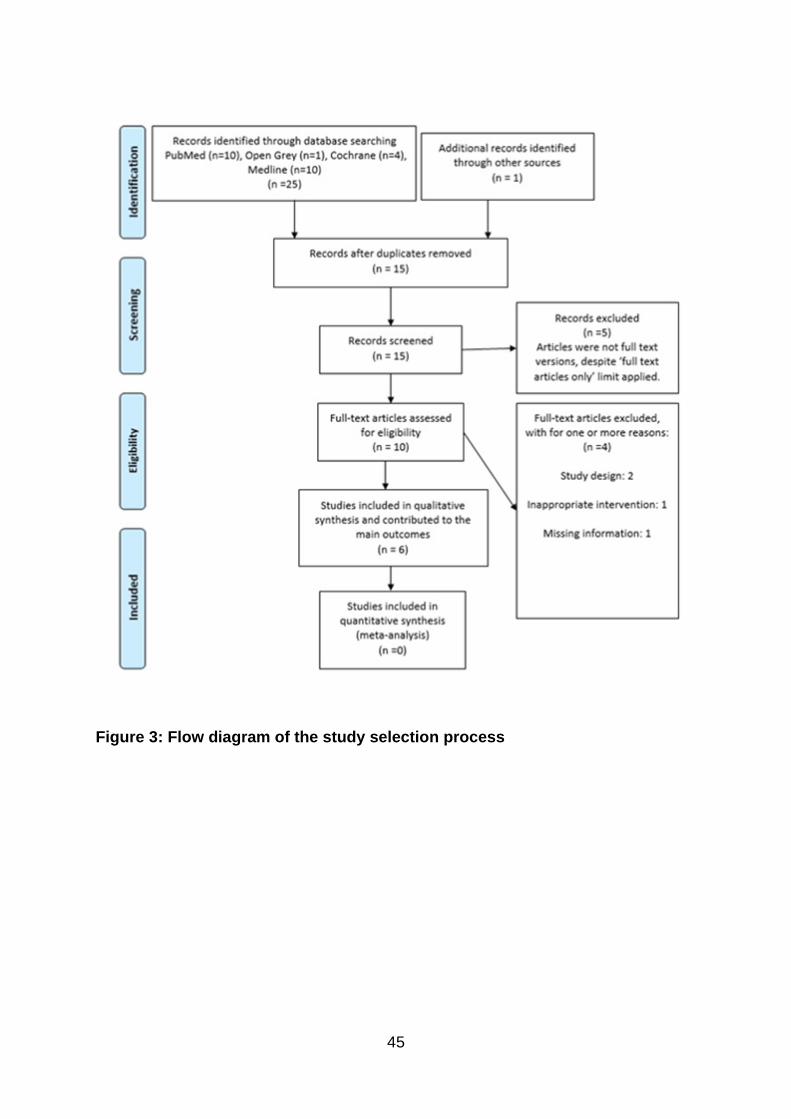
The review was conducted by three researchers from the University of Hertfordshire. The PRISMA
(Preferred Reporting Items for Systematic Reviews and Metal-Analyses) statement²² guided the
review protocol and thus the flow of information through the different phases of a systematic
review was recorded. A flow diagram outlining the study selection process is presented in Figure 3.
Search strategy
A systematic, all-language search of published and unpublished articles investigating HWLs as a
method to reduce SSB consumption by children was performed between 25th and 27th October
2019. Four databases (Cochrane Central, PubMed, OpenGrey and MEDLINE) were searched
systematically to identify relevant articles. The databases were chosen upon recommendations
from available guidance²³ ²⁴. Reference lists from retrieved articles were screened to identify
7
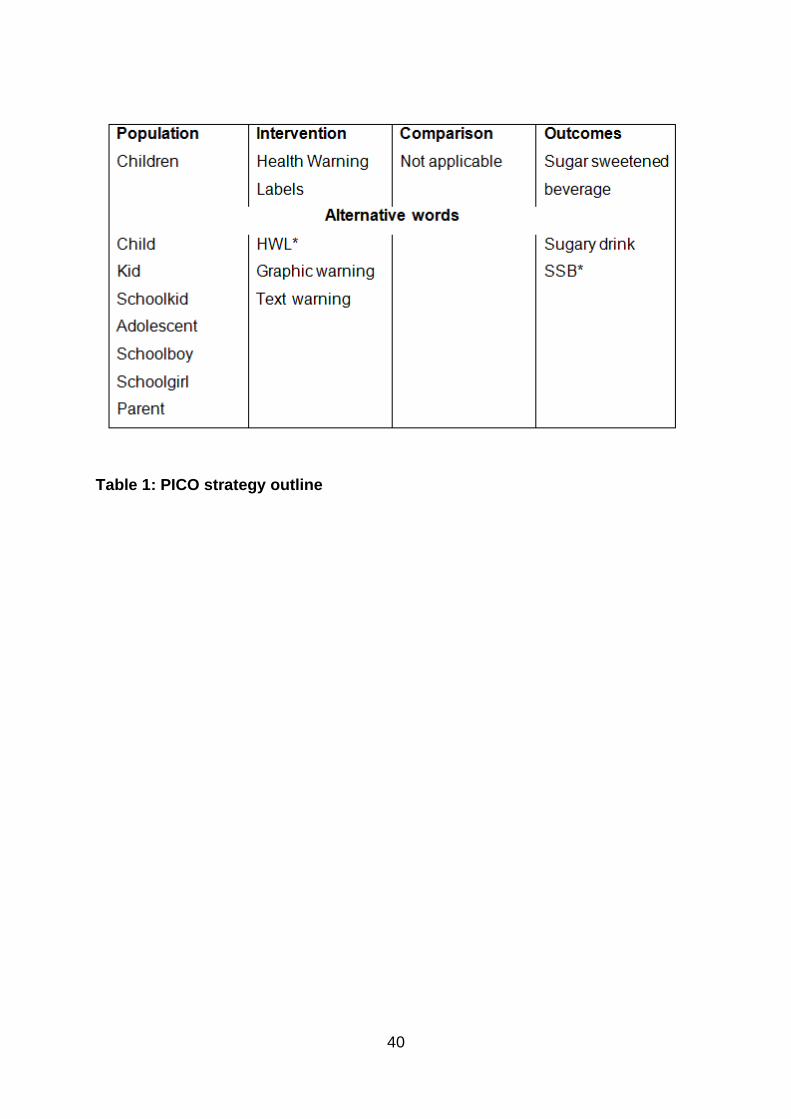
potential articles. The evidence-based PICO (Population-Intervention-Comparator-Outcome)
method²⁵ was used to manipulate the research question to generate search terms. Search terms
including “child*”, “adolescent*”, “health warning label*”, “text warning*”, “sugar-sweetened
beverage*” and “sugary drink*”were used. The PICO strategy outline is detailed in Table 1. See
supplementary resource for full details of the study identification protocol. There were no language
restrictions, but a full-text limit was applied. Only articles published from 2015 onwards were
considered; it was presumed that there would be an increase in research into sugar reduction
policies and interventions, in response to the World Health Organization’s sugar intake guidelines
introduced that year⁴.
Study selection and eligibility criteria
After all duplicates were removed, remaining relevant articles were then assessed independently by
two reviewers (ML & ZA), using predefined inclusion and exclusion criteria. Potentially eligible
studies met the following criteria: (1) any study with an experimental design, (2) compared an HWL
with a no-label control and (3) recruited children aged 11-19 or parents with a child aged 19 years
or younger. For inclusion, studies needed to have investigated the use of a text and/or image HWL
in relation to an SSB (for full details on selection criterion, see the supplementary online resource).
To assess heterogeneity, eligible studies had to report on changes in risk perception, purchasing
behaviour or any direct changes in SSB consumption as a result of the use of HWLs.
Data extraction and analysis
8
The required quantitative and qualitative information including participant, method and outcome
details, were sourced from the included studies using a data extraction form based on the
electronic Cochrane Public Health Template²³ (see the supplementary resource to view data). A
narrative synthesis of the data, which involves focusing on non-numerical data such as descriptions,
words and phrases, was chosen. A narrative method of synthesis was applied due to the nature of
the experimental studies included in the review being inadequately homogeneous for a meta-
analysis to be appropriate²⁶. Instead, key themes from qualitative data such as consumer attitudes
and types of SSB warning labels were explored and quantitative data were presented using
descriptive statistics which included percentage mean, median, ratio and standard deviation.
Citation criteria for significance (uniformly at p<.05) was adopted.
The Cochrane risk of bias tool (RoB 2) was used to assess the randomised controlled trials (RCTs)
identified²³. For the study with an interrupted time series (ITS) design, the Cochrane Public Health
Review Group Guidelines for assessing the risk of bias was implemented²⁷. After the risk of bias was
assessed, the GRADE (Grading of Recommendations Assessment, Development and Evaluation)
approach²⁸ was then applied to assess the quality of the evidence at the outcome level. Results
were displayed in a summary of findings table drafted from the GRADE handbook template²⁸.
RESULTS
The literature search yielded 15 unique records. The screening process led to 5 more articles being
excluded for not being full-text versions (see the supplementary resource for characteristics of
excluded studies). The 10 full-text articles that remained were assessed for eligibility and overall 6
9
studies met the inclusion criteria and a further 4 articles were excluded (see the supplementary
online resource for characteristics of excluded studies).
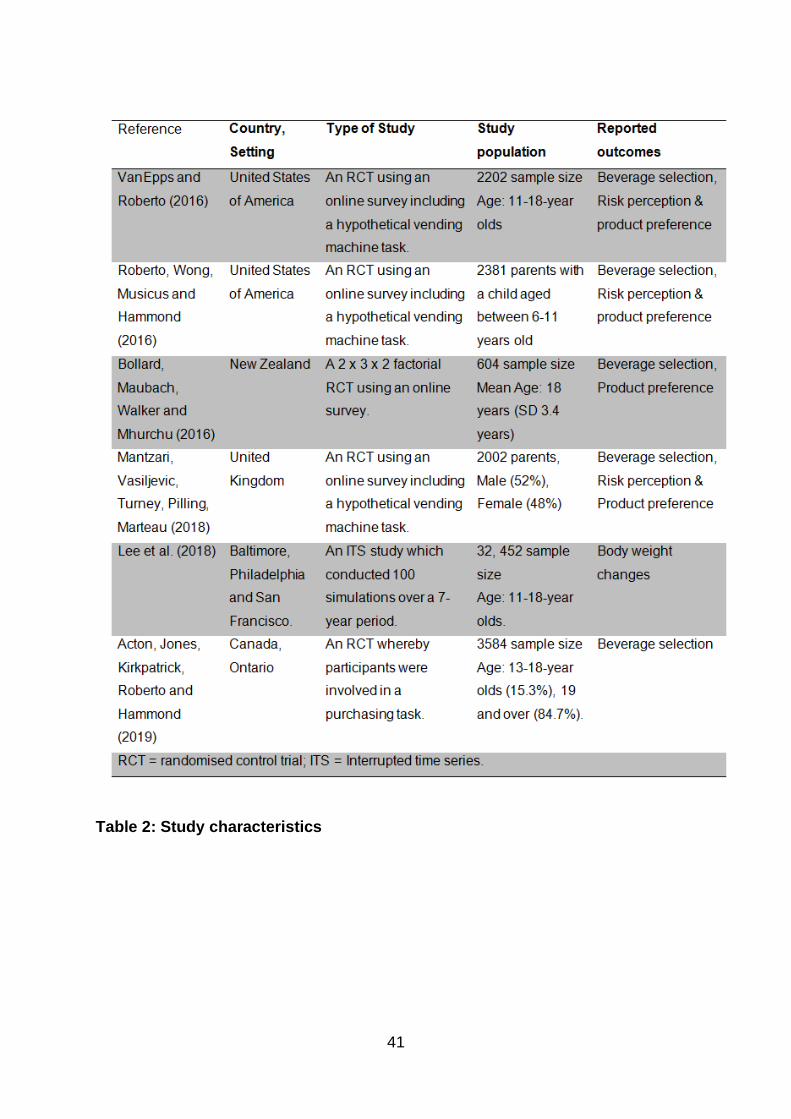
Study characteristics
In total, five RCTs and one study of an ITS design were included in this review. The characteristics of
the six studies¹²˒¹⁴˒²¹˒²⁹˒³⁰˒³¹ are summarised in Table 2 (for full details of the included studies see
supplementary resource). Study countries were Canada, New Zealand, United Kingdom and the
USA. Regarding study settings, one was a simulated intervention and one was conducted in a
pragmatic research setting where participants were given real money to buy items from a shop. The
remaining four studies used an online survey. All but two studies used a computer algorithm to
randomise participants. The most reported outcome was beverage selection, followed by SSB
desirability and perception of risk.
The median sample size of the included studies was 2381 participants. Four studies had an
approximately equal ratio of males to females. All the included studies described their participant
ethnic profile to be diverse. On average, the majority (69%) of participants were White, followed by
31% from a black and minority ethnic (BME) group. 67% of included studies recruited children with
an age range between 11-18 years old. 33% of studies recruited parents and of those parents
included in these studies, 88% had academic attainment at high school level or above. 50% of the
included studies that reported median BMI (body mass index); average median BMI from all of the
studies was calculated as 23kg/m² and therefore within a healthy range. Participant income
appeared to vary greatly in the included studies. In the studies that reported income (67%), some
10
reported on household or weekly income and others asked participants to rate their own income
situation as easy or difficult.
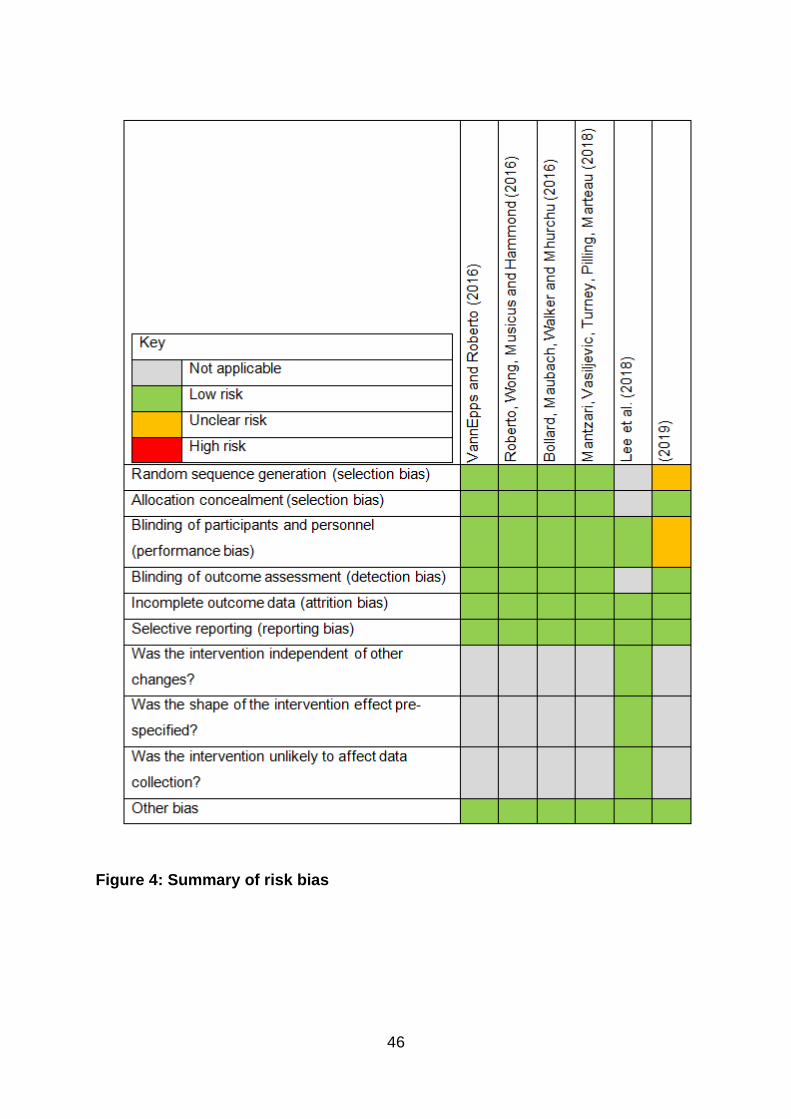
Due to the heterogeneity of the income data recorded, an appropriate descriptive statistic was not
performed. Overall, the included studies had a low risk of bias and thus were deemed to be of high
methodological quality. An overview of the risk of bias for each study is illustrated in Figure 4 (for
more details on how the risk of bias was determined, see the supplementary online resource). Only
one study did not give details of the method of randomisation. The majority of included studies
(67%) used an online survey platform to administer the intervention. Participants would be exposed
to different HWL scenarios and were then asked to decide if they would like to hypothetically
purchase an item by requesting coupons. Also, participant’s perceptions about the HWLs such as
changes in risk perception were also recorded. None of the included studies gave full details to the
participants about the research aim(s) which, therefore may have helped to reduce potential
performance bias. There was little evidence of attrition bias in any study. It was assumed, through
critical appraisal of the included studies, that there was a low risk of bias from selective reporting
because all studies fully reported all the outcomes specified in their methods sections. Also, the
biases specific to the ITS study were determined to be low risk.
Most (83%) of the studies compared the no HWL label/control group with four or more different
HWL conditions. The most common type of HWL used as an intervention was text-based health
warnings and HWLs were located on the front of the pack in all studies. Both text- and image-based
HWLs were found to be effective. Four of the studies implemented text-based warnings and two
studies implemented image-based warnings. The different phrasing of text-based warning labels
11
was not found to impact effectiveness. Only one study used both text- and image-based warnings
as interventions and concluded that the image-based warning was more effective (p<0.05).
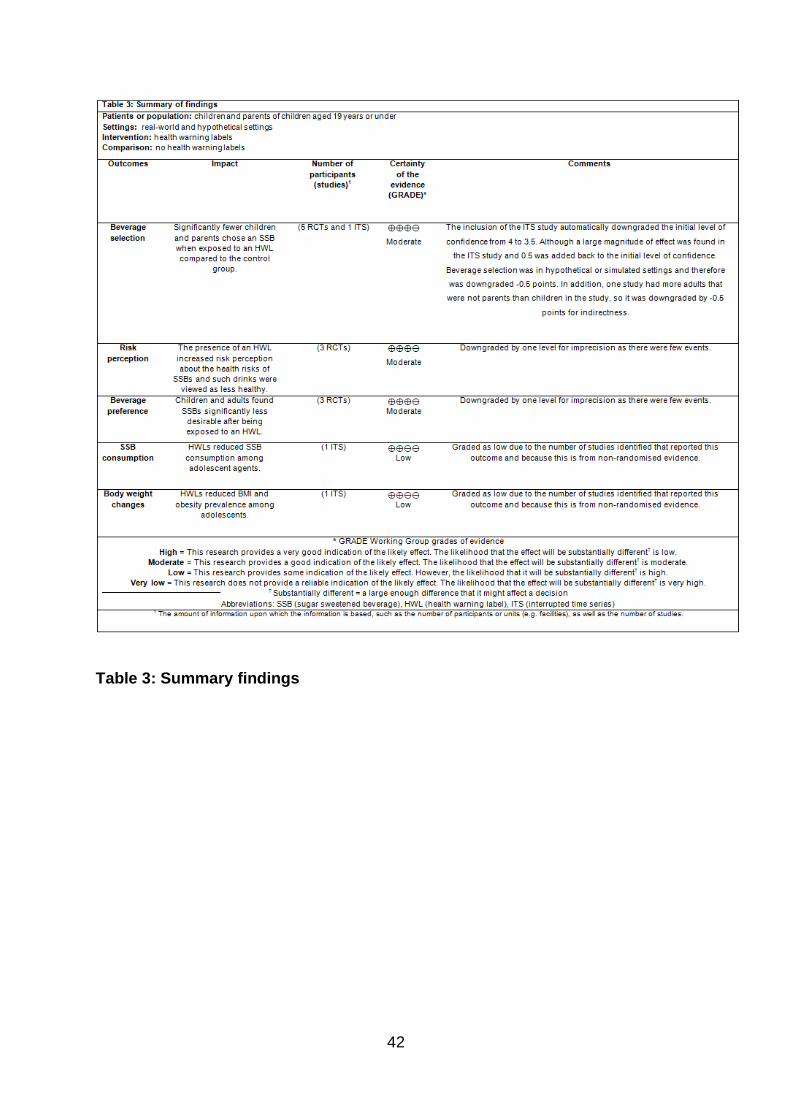
Reported outcomes
All studies examined beverage selection and found that fewer children and parents chose an SSB
when exposed to an HWL compared to the control group; total SSB selection reduction was 19%
(p<0.05). Half of the studies examined changes in risk perception and it was calculated that, on
average, the presence of an HWL increased risk perception about the health risks of SSBs by 11%
(p<0.05). Likewise, 50% of studies included examined beverage preference and found that children
and adults found SSBs less desirable after exposure to an HWL. Social desirability in favour of SSBs
reduced by 20.4% (p<0.05). Only one study³⁰ investigated a direct change in SSB consumption and
body weight after exposure to an HWL. The following study reported a 22% reduction in mean BMI
after the SSB warning label conditions were applied (p<0.001).
After applying GRADE, the quality of evidence at the outcome level was determined to be of
moderate to low quality. Moderate quality evidence was found for the presence of an HWL
increasing consumer risk perception on the health risks associated with SSBs. Also, moderate
quality evidence was found for fewer children and parents choosing an SSB when exposed to an
HWL compared to the control group. Low quality evidence was found for the ability of HWLs to
reduce SSB consumption among children and lead to reduced BMI and obesity prevalence in this
population. Findings from the studies included are summarised in Table 3.
DISCUSSION
12
Main issues
This review found moderate quality evidence exposing parents and children to HWLs on SSBs,
increased risk perceptions about the health risks associated with such drinks. The findings suggest
that HWLs on SSBs is a useful way of educating purchasers and consumers about the potential
health risks of these products. According to the RAPF, HWLs on SSBs appear to increase risk
perception by acting as an effective fear appeal. The ability of a fear appeal to increase risk
perception has been identified as an effective tool in positively influencing attitude, intentions, and
behaviours⁹. However, the RPAF explains that in regards to consumer behaviour, the ability of a
fear appeal to increase risk perception and initiate health protection behaviours is dictated by
consumer self-efficacy¹⁸. Therefore, according to the RPAF, a consumer’s level of self-efficacy is
likely to influence the ability of a HWL to increase risk perception and alter SSB selection and
consumption¹⁸.
A criticism of using HWLs for SSBs, due to its behavioural change approach background, is that it
assumes there is a direct link between knowledge and behaviour³². Individuals who are health-
conscious may still choose to consume SSBs due to impulse and emotion (i.e. perform ‘hyperbolic
discounting’³³), which are likely to be at play, especially when SSBs may contain ingredients with
addictive potential³⁴.
The present research found moderate quality evidence exposing parents and children to HWLs
reduced the desirability of SSBs. This finding and could mean that HWLs would be a useful tool in
counteracting the appeal of SSBs produced by the marketing techniques of SSB manufacturers.
13
Some SSBs, such as sport and fruit-based drinks, are often presented as healthy drinks due to the
presence of beneficial nutrients such as vitamin C⁶. Therefore, in agreement with Moran and
Roberto (2016)¹⁰, it could be argued that HWLs may be more effective in reducing desirability for
SSBs that consumers hold positive health beliefs (for example, flavoured water and fruit-based
SSBs) rather than traditional types of SSBs such as ‘soda’ and ‘cola’, that are conventionally
recognized as unhealthy.
Another concern to highlight is the use of an HWL on an SSB may only impact beverage selection
temporarily. An individual may decide to not buy a SSB with an HWL but instead buy an unlabelled
SSB or food high in sugar as an alternative. If this was true, it would imply that HWLs on SSBs only
delay consumption rather than lead to a permanent reduction in overall SSB intake. However,
according to “nudge theory”, which is supported by a growing body of evidence³⁵, using HWLs on
SSBs is still worthwhile. Repeated exposure to HWLs on SSBs could still help to induce consumers to
choose healthier drink options. Having rotational HWLs on SSBs could potentially help to reduce the
risk of desensitisation to the HWLs - which would ultimately lead to their ineffectiveness.
The present research found moderate quality evidence exposing parents and children to HWLs
reduced the likelihood of SSB selection. Both text- and image-based warning labels were found to
be effective at reducing the likelihood of SSB selection. However, there was little evidence to
identify what type of health warning label was superior in effectiveness. Only one included study
made comparisons between image- and text-based warning labels and found that image-based
labels were more effective at reducing the likelihood of SSB selection than text-based labels.
Additionally, the research found low quality evidence suggesting HWLs on SSBs can reduce SSB
consumption and subsequently have a positive influence on body weight by reducing BMI and
14
obesity levels amongst children. This is clearly a positive outcome and arguably the most direct
outcome identified from the narrative synthesis. Nevertheless, this outcome is not one where a
conclusion based on strong evidence can be drawn as only one study looked at this outcome.
Strength and weaknesses
The present systematic review used an extensive search strategy, which involved an appropriate
range of databases as well as the manual scanning of reference lists for relevant studies.
Unpublished research and articles in all languages were included to minimise bias. Additionally,
studies were only included if an HWL was compared to a no-warning label control group to increase
the likelihood of identifying the true effectiveness of HWLs on SSBs. Moreover, the present
research was conducted using best practice methods as recommended by the Cochrane
handbook²³. For example, the most up to date Cochrane risk of bias tools for the different study
types were used and the GRADE approach was applied to assess the quality of evidence at the
outcome level. In addition, the applicability of the evidence to different countries is strengthened
as study location of the included studies varied considerably.
In contrast, the external validity of this research may be potentially weakened due to the included
studies favouring hypothetical settings rather than a pragmatic research setting. Within these
studies, the intention to buy SSBs was used rather than measuring the actual behaviour of
purchasing SSBs from an authentic vendor setting. This was identified as a possible source of
indirect bias because measuring the intention to buy rather than actual purchasing behaviour could
be argued to be a surrogate outcome. In addition, although the risk of bias was low for all the
15
studies included, none of the outcomes identified achieved the highest GRADE score of 4, which is
the highest indication of certainty with regards to evidence according to the GRADE approach.
IMPLICATIONS FOR RESEARCH AND PRACTICE
Reducing SSB consumption, especially amongst children, has been identified as a global public
health priority³⁶. To the authors’ knowledge, this is the first systematic review to provide
policymakers with an evidence-based conclusion from current and relevant research findings on the
use of HWLs in efforts to reduce SSB consumption amongst children. Policymakers should seriously
consider the use of HWLs as a viable strategy to reduce SSB consumption. However, due to the
amount and quality of evidence from the present findings, it would be wise to wait for stronger
evidence to justify the enforcement of HWLs on SSBs. The reason for this recommendation is that it
is anticipated that SSB manufacturers will be resistant to HWLs being applied to SSBs and,
therefore, the evidence for this kind of intervention will require a greater level of scientific backing
to overcome oppositions. Lessons from the implementation of tobacco HWLs infer that enforcing
SSB warning labels would not be an easy public health task¹¹. Nevertheless, the possibility of HWLs
for SSBs as policy does look hopeful, given the level of public support that has been received by
consumers, including children¹² ¹⁴ ³⁷. Acceptability of this intervention by policymakers and the
public will be a critical factor in ensuring it is implemented successfully³⁸. It would be worthwhile
doing more to increase public awareness of the health implications of SSBs, for stronger public
backing of sugar warning label policies.
The evidence available for the research question was limited in quantity and this affected the
quality of the evidence at the outcome level. Therefore, more high-quality studies are needed in

16
this research area. Similarly, although the studies in the review were able to attain large sample
sizes largely due to using virtual settings, there is a need for more studies to be conducted in
settings closer to authentic purchasing experiences, such as in grocery stores and supermarkets, to
improve the quality of the evidence at outcome level.
There was limited evidence found to determine what type of label i.e. image- or text-based was
most effective. Future research could investigate this further and consider what type of HWL is best
to use on an SSB. As with tobacco warning labels, determining the gold standard for the format and
placement of HWLs for SSBs will be useful. With this in mind, it would be beneficial to investigate
the impact of socioeconomic and educational factors on the effectiveness of SSB warning labels.
Any disparities identified in receiving health information from SSB warning labels could then be
taken into consideration when making any necessary adaptations to HWL design and whether such
labels should be primarily text- or image-based.
Further research could investigate whether the effectiveness of SSB warning labels is influenced by
the type of packaging that is used. Branded packaging may potentially reduce the effectiveness of
HWLs by becoming a visual distraction³⁹ ˒ ⁴⁰. It would be interesting to see if this is also the case for
SSB warning labels.
Also, it would be interesting to know if the use of cultural targeting with HWLs for SSBs would
improve effectiveness in reducing SSB consumption amongst children in certain cultural groups,
where consumption may be high. For example, the font, colour and language used could be altered
on SSB warning labels to be more effective with particular cultural groups⁴¹. Cultural targeting of
17
materials for health promotion has been found in some studies to help promote behaviour
change⁴².
Future research may benefit from a more extensive logic model that considers the behavioural
interactions within the parent-child dyad that could influence the ability of HWLs for SSBs to lead to
healthier dietary choices. How much do requests from children to parents influence their choice to
purchase an SSB despite being exposed to an SSB warning label? Additionally, the impact of socio-
economic and educational factors on SSB purchasing and consumption behaviour should also be
considered.
ACKNOWLEDGEMENTS
The lead author would like to thank Emmanuel who provided inspiration for the project.
CONFLICT OF INTEREST
The authors have no conflicts of interests to declare.
REFERENCES
1. Bailey, RM, Fulgoni, VM, Cowan, AE and Gaine PC. Sources of Added Sugars in Young
Children, Adolescents, and Adults with Low and High Intakes of Added Sugars. Nutrients.
2018; 10:1.
2. Rosinger, A, Herrick, K, Gahche, J & Park, S. Sugar-sweetened beverage consumption among
U.S. youth, 2011–2014. NCHS Data Brief.2017; 271:1–8.
18
3. Naska, A, Bountziouka, V & Trichopoulou, A. DAFNE Participants. Soft drinks: time trends
and correlates in twenty-four European countries. A cross-national using the DAFNE (Data
Food Networking) databank. Public Health Nutrition.2010;13:1346-55.
4. World Health Organization (WHO). Guideline: Sugars intake for adults and children,
Geneva.2015.http://apps.who.int/iris/bitstream/10665/149782/1/9789241549028_eng.pdf
?ua=1 Accessed October, 20, 2019.
5. Hsiao, A, Wang, YC. Reducing Sugar-Sweetened Beverage Consumption: Evidence, Policies,
and Economics. Curr Obes Rep 2. 2013;191–199. https://doi.org/10.1007/s13679-013-0065-
8.
6. Brownbill AL, Miller CL, Braunack-Mayer AJ. The marketing of sugar-sweetened beverages to
young people on Facebook. Aust N Z J Public Health. 2018;42:354–60.
7. Te Morenga, L, Mallard, S & Mann, J. Dietary sugars and body weight: systematic review and
meta analyses of randomized controlled trials and cohort studies. British Medical Journal.
2013; 346.
8. Sohn, W, Burt, BA & Sowers, MR. Carbonated soft drinks and dental caries in the primary
dentition. Journal of Dental Research. 2006; 85: 262–266.
9. Paek, H.J & Hove, T. Risk perceptions and risk characteristics. Oxford Encyclopedia of
Intergroup Communication. 2017; 1–14.
10. Moran, A J & Roberto, C.A. Health Warning Labels Correct Parents’ Misperceptions About
Sugary Drink Options. American Journals Preventative Medicine. 2018; 10:102.
11. Popova, L. Sugar-sweetened beverage warning labels: lessons learned from the tobacco
industry. Journal of the California Dental Association. 2016; 44: 633–640.
12. Roberto, CA., Wong, D., Musicus, A & Hammond, D. The influence of sugar-sweetened
beverage health warning labels on parents' choices. Pediatrics.2016; 137.
19
13. Billich, N., Blake, M., Backholer, K., Cobcroft, M., Li, V & Peeters, A. The effect of sugar-
sweetened beverage front-of-pack labels on drink selection, health knowledge and
awareness: An online randomised controlled trial. Appetite.2018;128.
14. VanEpps, EM & Roberto, CA. The influence of sugar sweetened beverage warnings: a
randomized trial of adolescents’ choices and beliefs. American Journal of Preventative
Medicine. Elsevier.2016;51: 664-72.
15. Hollands, GJ, Shemilt, I, Marteau, TM., Jebb, SA., Kelly, MP., Nakamura, R., Suhrcke, M &
Ogilvie, D. Altering micro‐environments to change population health behaviour: towards an
evidence base for choice architecture interventions. BMC Public Health.2013;1213-18.
16. Health Committee. Childhood obesity: Time for action. Eight Report of Session 2017-19.
House of Commons. 2018. London: HMSO.
17. Su-Jung, N. An application of the risk perception attitude framework in food safety behavior.
Human and Ecological Risk Assessment: An International Journal. 2018; 1-14.
doi:10.1080/10807039.2018.1460193.
18. Thompson, T. L. Encyclopedia of health communication (Vols. 1-3). Risk Perception Attitude
Framework. Thousand Oaks, CA: SAGE Publications, 2014. doi: 10.4135/9781483346427
19. Lundgren, R. , and A. McMakin . Risk communication: A handbook for communicating
environmental, safety, and health risks. 1998. Columbus: OH, Batelle.
20. Crockett, RA, King, SE, Marteau, TM, Prevost, AT, Bignardi, G, Roberts, NW., Stubbs, B,
Hollands, GJ & Jebb, SA. Nutritional labelling for healthier food or non-alcoholic drink
purchasing and consumption. Cochrane Database Systematic Reviews. 2018; 27: CD009315
21. Mantzari, E, Vasiljevic, M, Turney, I, Pilling, M & Marteau, T. Impact of warning labels on
sugar-sweetened beverages on parental selection: An online experimental study.
Preventative medicine reports. 2018;12: 259-267.
20
22. Liberati A, Altman, DG, Tetzlaff, J, Mulrow, C, Gøtzsche, PC, Ioannidis, JP, Clarke, M,
Devereaux, P.J, Kleijnen, J & Moher, D. The PRISMA statement for reporting systematic
reviews and meta-analyses of studies that evaluate health care intervention: explanation
and elaboration. Annals of Internal Medicine. 2009; 151: W65-94.
23. Higgins, JPT & Green, S . Cochrane handbook for systematic reviews of interventions: The
Cochrane Collaboration, London, United Kingdom.
https://training.cochrane.org/handbook/archive/v5.1/ Accessed October 15, 2019.
24. Bramer WM, Rethlefsen, ML., Kleijnen, J, Franco OH. Optimal database combinations for
literature searches in systematic reviews: a prospective exploratory study. Syst Rev 6.2017;
245.
25. Huang, X, Lin, J & Demner-Fushman, D. Evaluation of PICO as a knowledge representation
for clinical questions. AMIA Annual Symposim Proc.2006; 359–363.
26. Snilstveit , B, Oliver, S & Martina Vojtkova. Narrative approaches to systematic review and
synthesis of evidence for international development policy and practice, Journal of
Development Effectiveness.2012;4: 409-429.
27. Cochrane Public Health Review Group. Cochrane Public Health Group. Developing a
Cochrane Protocol. In: Jackson N. Systematic Reviews of Health Promotion and Public Health
Interventions. Cochrane Collaboration. 2010.
ph.cochrane.org/sites/ph.cochrane.org/files/uploads/HPPH_systematic_review_handbook.
pdf. Accessed October, 28, 2019.
28. Schünemann, H, Brożek, J, Guyatt, G, Oxman A. GRADE handbook for grading quality of
evidence and strength of recommendations. Updated October 2013. The GRADE Working
Group.2013. https://gdt.gradepro.org/app/handbook/handbook.htmlAccessed October 17,
2019.
21
29. Bollard, T, Maubach, N, Walker, N. et al. Effects of plain packaging, warning labels, and taxes
on young people’s predicted sugar-sweetened beverage preferences: an experimental
study. Int J Behav Nutr Phys Act . 2016;13- 95. https://doi.org/10.1186/s12966-016-0421-7
30. Lee, B, Ferguson, MC, Hertenstein, DL, Adam, A, Zenkov, E, Wang, P, Wong, M, Gittelsohn J,
Mui, Y & Brown, ST. (2018). Simulating the impact of sugar-sweetened beverage warning
labels in three cities. American Journal of preventative medicine. 2018; 54: 197-204.
31. Acton, RB., Jones, AC., Kirkpatrick, SI. et al. Taxes and front-of-package labels improve the
healthiness of beverage and snack purchases: a randomized experimental marketplace. Int J
Behav Nutr Phys Act. 2019;16:46 . https://doi.org/10.1186/s12966-019-0799-0
32. Conner, M & Norman, P. Predicting health behaviour: research and practice with social
cognition models. Buckingham: Open University Press; 1996.
33. Harris, CJ & Laibson, D. Hyperbolic Discounting and Consumption. In: Dewatripont M,
Hansen LP, StephenTurnovsky Advances in Economics and Econometrics: Theory and
Applications, Volume 1. Eighth World Congress. 2002; 258-298.
34. Falbea, J, Thompson, HR, Patel, A & Madsen, KA. Potentially addictive properties of sugar-
sweetened beverages among adolescents. Appetite. 2019;130-137.
35. Arno, A & Thomas, S. The efficacy of nudge theory strategies in influencing adult dietary
behaviour: A systematic review and meta-analysis. BMC Public Health. 2016; 16: 1-11.
36. Lobstein, T. Reducing consumption of sugar-sweetened beverages to reduce the risk of
childhood overweight and obesity. 2017.
http://www.who.int/elena/titles/ssbs_childhood_obesity/en/ Accessed October 28, 2019.
37. Miller, CL., Dono, J, Wakefield, M.A., Pettigrew, S, Coveney, J, Roder, D, Durkin, SJ, Wittert,
Martin, J & Ettridge, K. Are Australians ready for warning labels, marketing bans and sugary
22
drink taxes? Two cross-sectional surveys measuring support for policy responses to sugar-
sweetened beverages. BMJ Open. 2019; 9: e027962.
38. Diepeveen, S, Ling, T, Suhrcke, M, Roland, M & Marteau, TM. Public acceptability of
government intervention to change health-related behaviours: a systematic review and
narrative synthesis. BMC Public Health. 2013; 13:756.
39. Blair, K, Smith, B & Mitchell, D. Modulation of emotion by cognition and cognition by
emotion. NeuroImage. 2007; 35: 430–440.
40. McRae, K, Hughes, B, Chopra, S, Gabrieli, JD., Gross, J.J & Ochsner, KN. The neural bases of
distraction and reappraisal. J. Cogn. Neurosci. 2010. 22:248–262.
41. Kreuter, MW, Lukwago, SN, Bucholtz, DC., Clark, EM & Sanders-Thompson, V. (2003).
Achieving Cultural Appropriateness in Health Promotion Programs: Targeted and Tailored
Approaches. Health Education & Behavior. 2003; 30: 133–146.
42. Nierkens, V, Hartman, MA, Nicolaou, M., Vissenberg, C, Beune, EJ., Hosper, K, van
Valkengoed, IG & Stronks, K. Effectiveness of cultural adaptations of interventions aimed at
smoking cessation, diet, and/or physical activity in ethnic minorities. a systematic
review. PLoS One. 2013;27:e73373.
23
SUPPLEMENTARY RESOURCE
Selection criteria………………………………………………………..…24
Study identification protocol …………………………………………….25
Characteristics of excluded studies …………………………………….27
Characteristics of included studies and risk of bias …………………..28
24
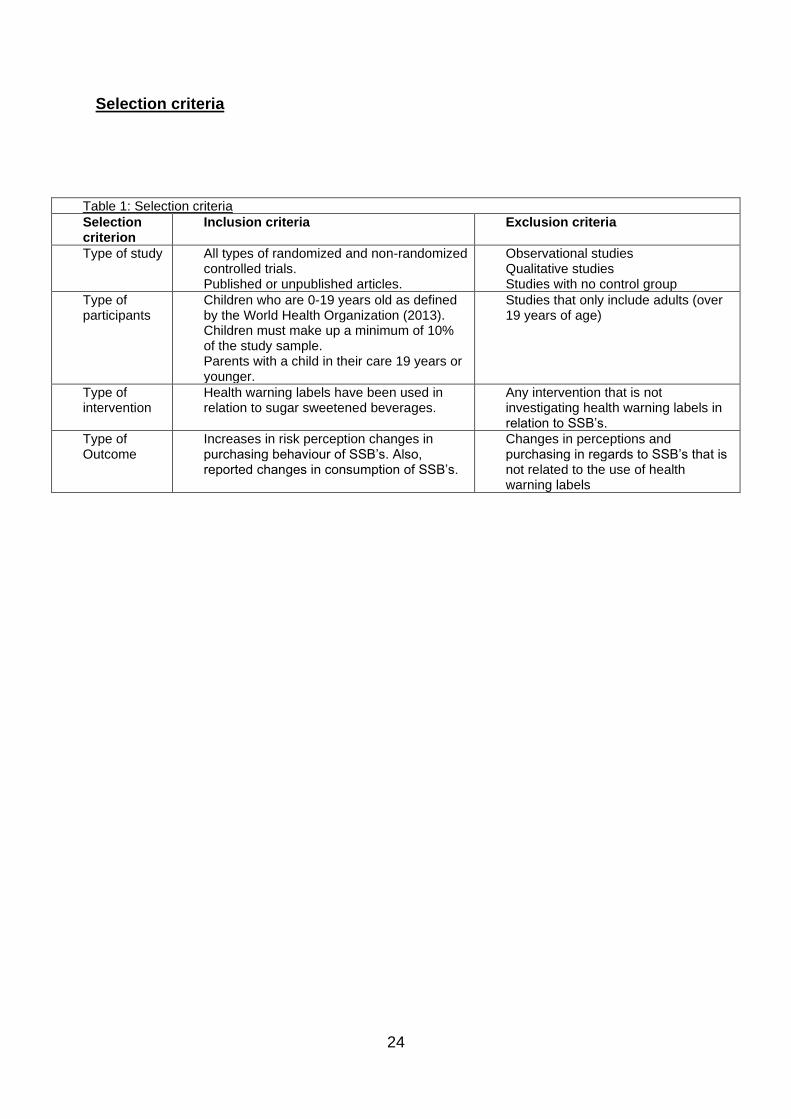
Selection criteria
Table 1: Selection criteria
Selection criterion
Inclusion criteria Exclusion criteria
Type of study All types of randomized and non-randomized controlled trials. Published or unpublished articles.
Observational studies Qualitative studies Studies with no control group
Type of participants
Children who are 0-19 years old as defined by the World Health Organization (2013). Children must make up a minimum of 10% of the study sample. Parents with a child in their care 19 years or younger.
Studies that only include adults (over 19 years of age)
Type of intervention
Health warning labels have been used in relation to sugar sweetened beverages.
Any intervention that is not investigating health warning labels in relation to SSB’s.
Type of Outcome
Increases in risk perception changes in purchasing behaviour of SSB’s. Also, reported changes in consumption of SSB’s.
Changes in perceptions and purchasing in regards to SSB’s that is not related to the use of health warning labels
25
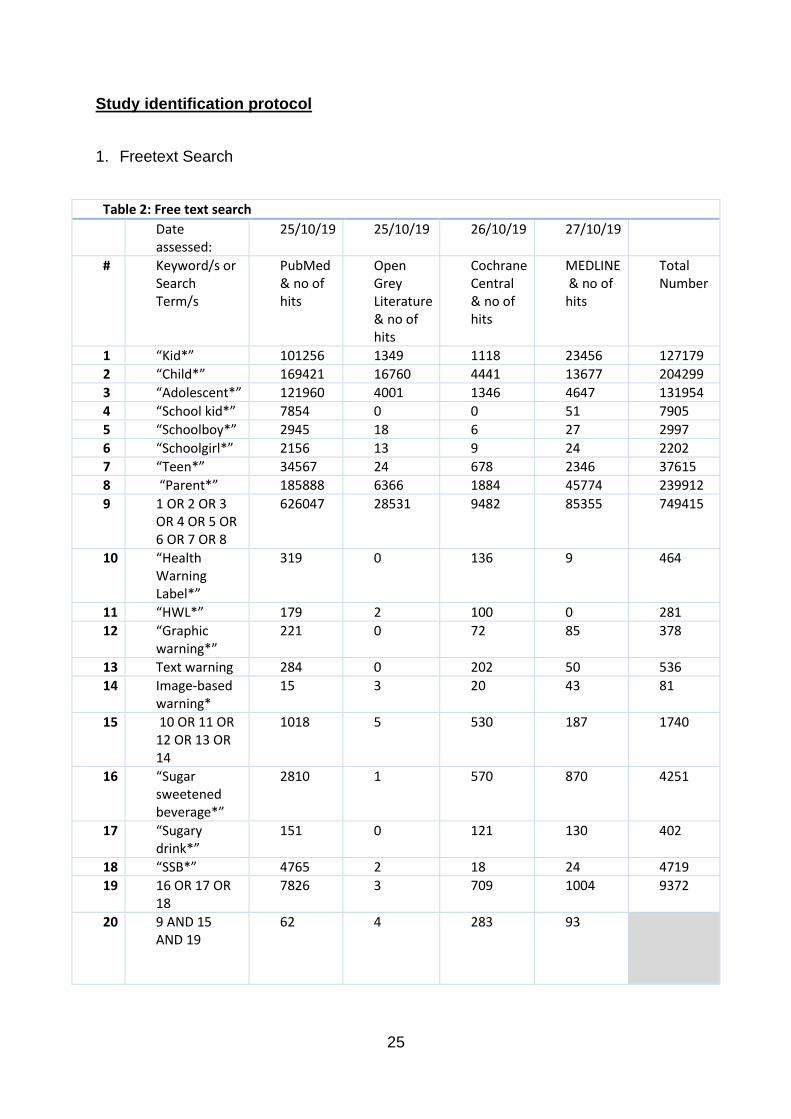
Study identification protocol
1. Freetext Search
Table 2: Free text search
Date assessed:
25/10/19
25/10/19
26/10/19
27/10/19
# Keyword/s or Search Term/s
PubMed & no of hits
Open Grey Literature & no of hits
Cochrane Central & no of hits
MEDLINE & no of hits
Total Number
1 “Kid*” 101256 1349 1118 23456 127179
2 “Child*” 169421 16760 4441 13677 204299
3 “Adolescent*” 121960 4001 1346 4647 131954
4 “School kid*” 7854 0 0 51 7905
5 “Schoolboy*” 2945 18 6 27 2997
6 “Schoolgirl*” 2156 13 9 24 2202
7 “Teen*” 34567 24 678 2346 37615
8 “Parent*” 185888 6366 1884 45774 239912
9 1 OR 2 OR 3 OR 4 OR 5 OR 6 OR 7 OR 8
626047 28531 9482 85355 749415
10 “Health Warning Label*”
319 0 136 9 464
11 “HWL*” 179 2 100 0 281
12 “Graphic warning*”
221 0 72 85 378
13 Text warning 284 0 202 50 536
14 Image-based warning*
15 3 20 43 81
15 10 OR 11 OR 12 OR 13 OR 14
1018 5 530 187 1740
16 “Sugar sweetened beverage*”
2810 1 570 870 4251
17 “Sugary drink*”
151 0 121 130 402
18 “SSB*” 4765 2 18 24 4719
19 16 OR 17 OR 18
7826 3 709 1004 9372
20 9 AND 15 AND 19
62 4 283 93
26
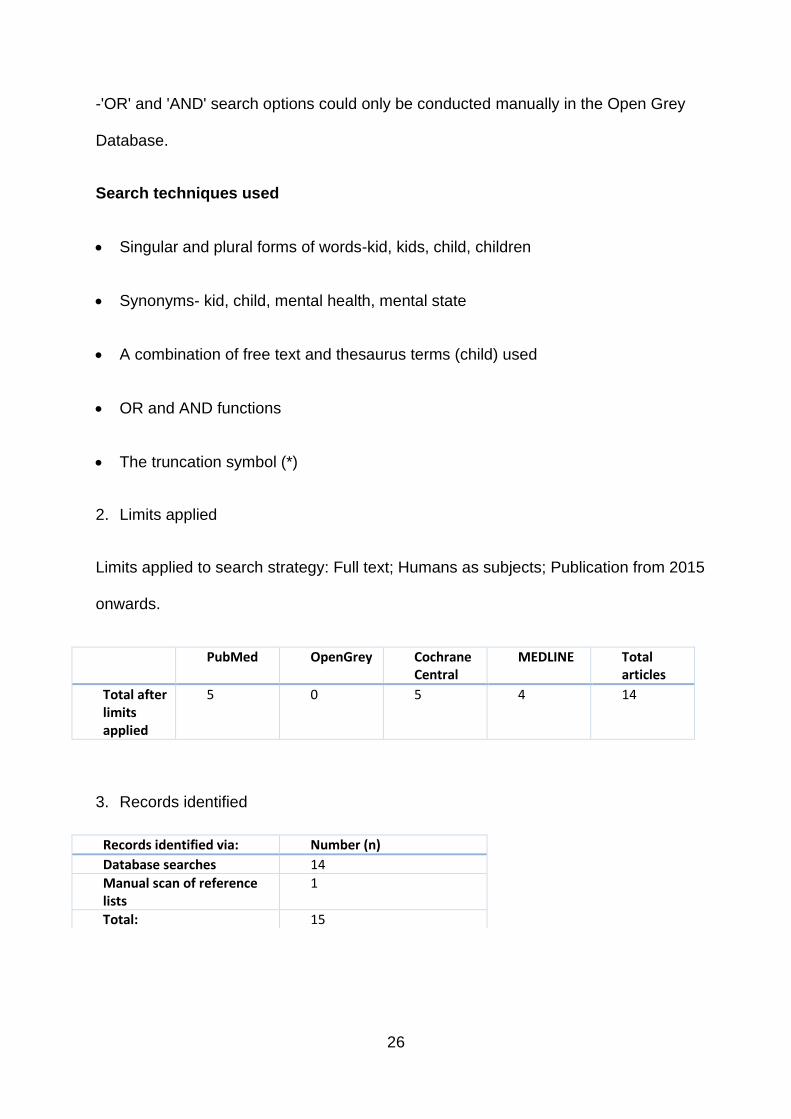
-'OR' and 'AND' search options could only be conducted manually in the Open Grey
Database.
Search techniques used
• Singular and plural forms of words-kid, kids, child, children
• Synonyms- kid, child, mental health, mental state
• A combination of free text and thesaurus terms (child) used
• OR and AND functions
• The truncation symbol (*)
2. Limits applied
Limits applied to search strategy: Full text; Humans as subjects; Publication from 2015
onwards.
PubMed OpenGrey Cochrane Central
MEDLINE Total articles
Total after limits applied
5 0 5 4 14
3. Records identified
Records identified via: Number (n)
Database searches 14
Manual scan of reference lists
1
Total: 15
27
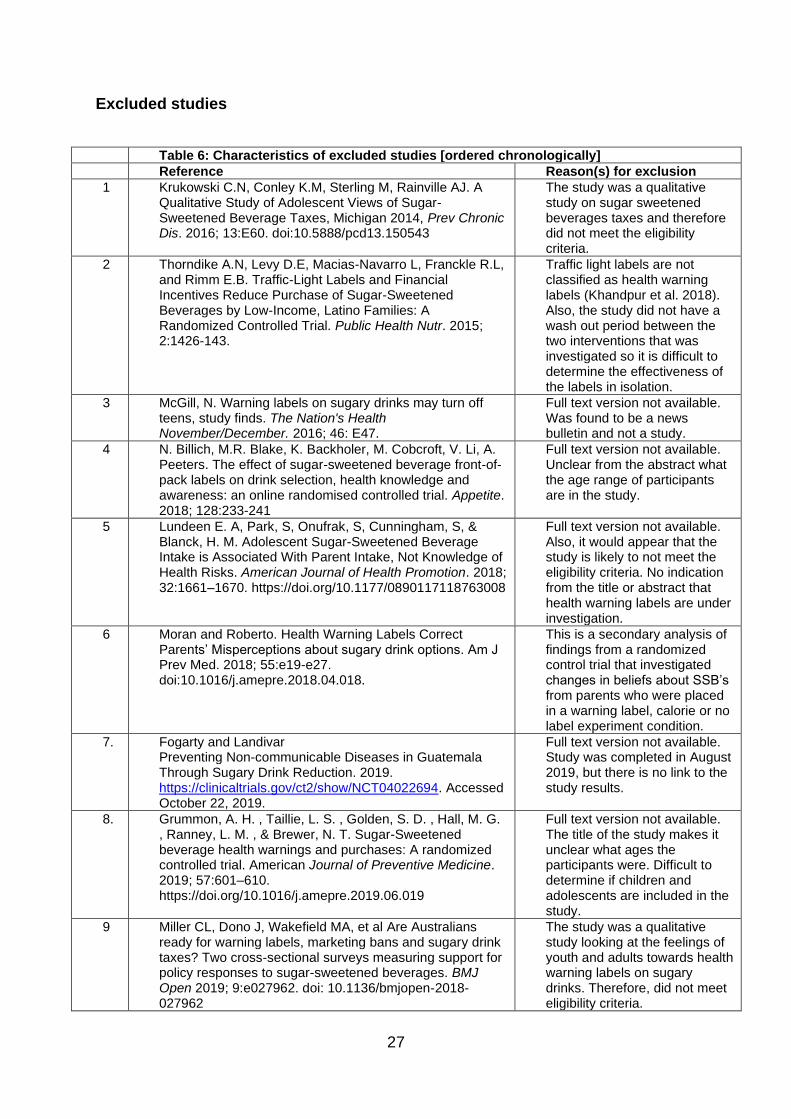
Excluded studies
Table 6: Characteristics of excluded studies [ordered chronologically]
Reference Reason(s) for exclusion
1 Krukowski C.N, Conley K.M, Sterling M, Rainville AJ. A Qualitative Study of Adolescent Views of Sugar-Sweetened Beverage Taxes, Michigan 2014, Prev Chronic Dis. 2016; 13:E60. doi:10.5888/pcd13.150543
The study was a qualitative study on sugar sweetened beverages taxes and therefore did not meet the eligibility criteria.
2 Thorndike A.N, Levy D.E, Macias-Navarro L, Franckle R.L, and Rimm E.B. Traffic-Light Labels and Financial Incentives Reduce Purchase of Sugar-Sweetened Beverages by Low-Income, Latino Families: A Randomized Controlled Trial. Public Health Nutr. 2015; 2:1426-143.
Traffic light labels are not classified as health warning labels (Khandpur et al. 2018). Also, the study did not have a wash out period between the two interventions that was investigated so it is difficult to determine the effectiveness of the labels in isolation.
3 McGill, N. Warning labels on sugary drinks may turn off teens, study finds. The Nation's Health November/December. 2016; 46: E47.
Full text version not available. Was found to be a news bulletin and not a study.
4 N. Billich, M.R. Blake, K. Backholer, M. Cobcroft, V. Li, A. Peeters. The effect of sugar-sweetened beverage front-of-pack labels on drink selection, health knowledge and awareness: an online randomised controlled trial. Appetite. 2018; 128:233-241
Full text version not available. Unclear from the abstract what the age range of participants are in the study.
5 Lundeen E. A, Park, S, Onufrak, S, Cunningham, S, & Blanck, H. M. Adolescent Sugar-Sweetened Beverage Intake is Associated With Parent Intake, Not Knowledge of Health Risks. American Journal of Health Promotion. 2018; 32:1661–1670. https://doi.org/10.1177/0890117118763008
Full text version not available. Also, it would appear that the study is likely to not meet the eligibility criteria. No indication from the title or abstract that health warning labels are under investigation.
6 Moran and Roberto. Health Warning Labels Correct Parents’ Misperceptions about sugary drink options. Am J Prev Med. 2018; 55:e19-e27. doi:10.1016/j.amepre.2018.04.018.
This is a secondary analysis of findings from a randomized control trial that investigated changes in beliefs about SSB’s from parents who were placed in a warning label, calorie or no label experiment condition.
7. Fogarty and Landivar Preventing Non-communicable Diseases in Guatemala Through Sugary Drink Reduction. 2019. https://clinicaltrials.gov/ct2/show/NCT04022694. Accessed October 22, 2019.
Full text version not available. Study was completed in August 2019, but there is no link to the study results.
8. Grummon, A. H. , Taillie, L. S. , Golden, S. D. , Hall, M. G. , Ranney, L. M. , & Brewer, N. T. Sugar-Sweetened beverage health warnings and purchases: A randomized controlled trial. American Journal of Preventive Medicine. 2019; 57:601–610. https://doi.org/10.1016/j.amepre.2019.06.019
Full text version not available. The title of the study makes it unclear what ages the participants were. Difficult to determine if children and adolescents are included in the study.
9 Miller CL, Dono J, Wakefield MA, et al Are Australians ready for warning labels, marketing bans and sugary drink taxes? Two cross-sectional surveys measuring support for policy responses to sugar-sweetened beverages. BMJ Open 2019; 9:e027962. doi: 10.1136/bmjopen-2018-027962
The study was a qualitative study looking at the feelings of youth and adults towards health warning labels on sugary drinks. Therefore, did not meet eligibility criteria.
28
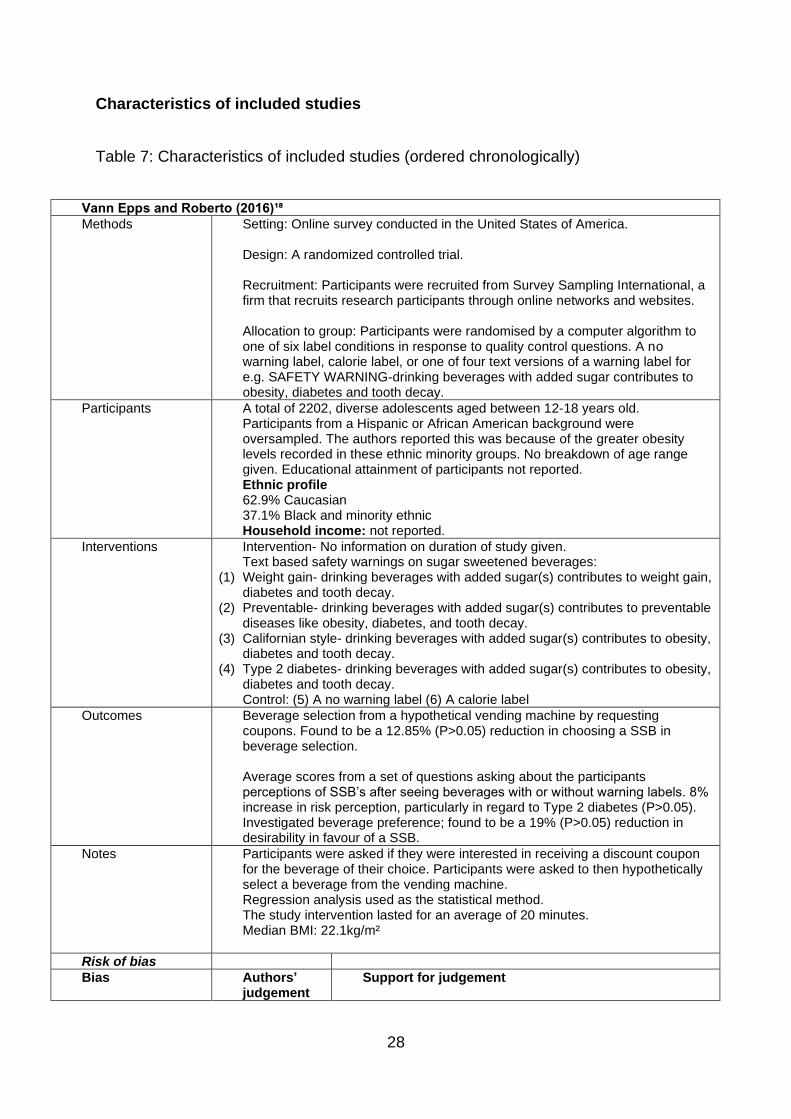
Characteristics of included studies
Table 7: Characteristics of included studies (ordered chronologically)
Vann Epps and Roberto (2016)¹⁸
Methods Setting: Online survey conducted in the United States of America. Design: A randomized controlled trial. Recruitment: Participants were recruited from Survey Sampling International, a firm that recruits research participants through online networks and websites. Allocation to group: Participants were randomised by a computer algorithm to one of six label conditions in response to quality control questions. A no warning label, calorie label, or one of four text versions of a warning label for e.g. SAFETY WARNING-drinking beverages with added sugar contributes to obesity, diabetes and tooth decay.
Participants A total of 2202, diverse adolescents aged between 12-18 years old. Participants from a Hispanic or African American background were oversampled. The authors reported this was because of the greater obesity levels recorded in these ethnic minority groups. No breakdown of age range given. Educational attainment of participants not reported. Ethnic profile 62.9% Caucasian 37.1% Black and minority ethnic Household income: not reported.
Interventions Intervention- No information on duration of study given. Text based safety warnings on sugar sweetened beverages:
(1) Weight gain- drinking beverages with added sugar(s) contributes to weight gain, diabetes and tooth decay.
(2) Preventable- drinking beverages with added sugar(s) contributes to preventable diseases like obesity, diabetes, and tooth decay.
(3) Californian style- drinking beverages with added sugar(s) contributes to obesity, diabetes and tooth decay.
(4) Type 2 diabetes- drinking beverages with added sugar(s) contributes to obesity, diabetes and tooth decay. Control: (5) A no warning label (6) A calorie label
Outcomes Beverage selection from a hypothetical vending machine by requesting coupons. Found to be a 12.85% (P>0.05) reduction in choosing a SSB in beverage selection. Average scores from a set of questions asking about the participants perceptions of SSB’s after seeing beverages with or without warning labels. 8% increase in risk perception, particularly in regard to Type 2 diabetes (P>0.05). Investigated beverage preference; found to be a 19% (P>0.05) reduction in desirability in favour of a SSB.
Notes Participants were asked if they were interested in receiving a discount coupon for the beverage of their choice. Participants were asked to then hypothetically select a beverage from the vending machine. Regression analysis used as the statistical method. The study intervention lasted for an average of 20 minutes. Median BMI: 22.1kg/m²
Risk of bias
Bias Authors’ judgement
Support for judgement
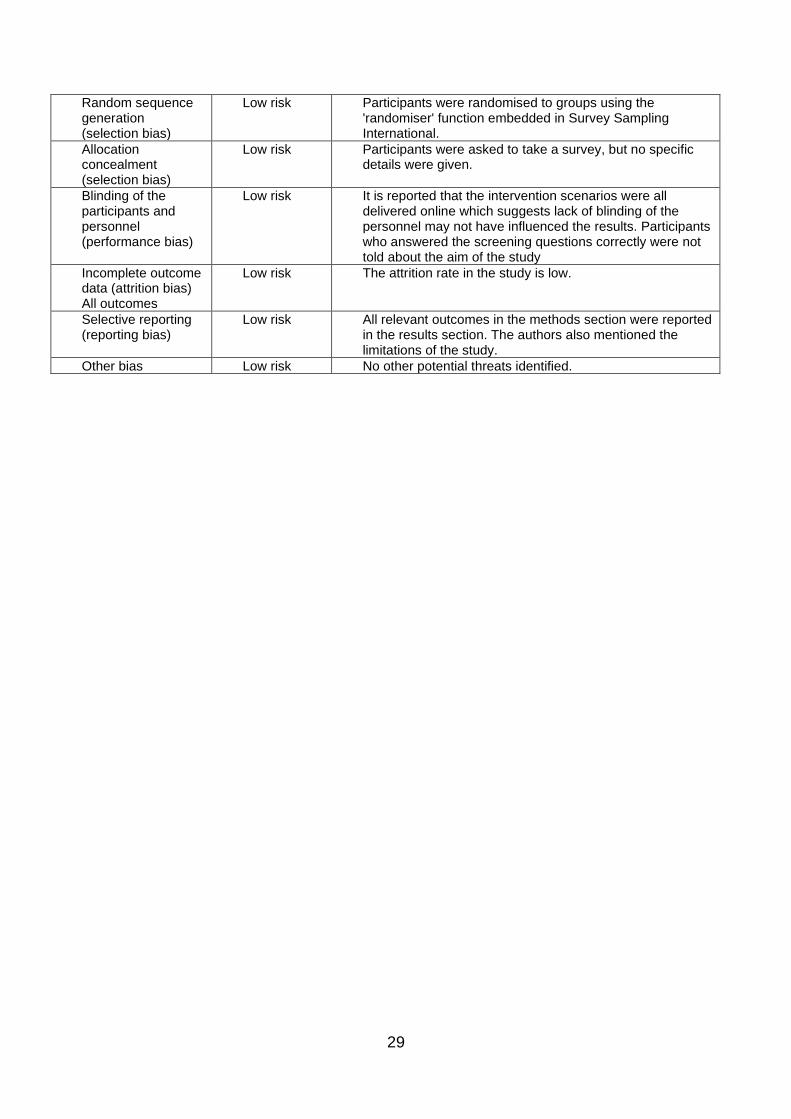
29
Random sequence generation (selection bias)
Low risk Participants were randomised to groups using the 'randomiser' function embedded in Survey Sampling International.
Allocation concealment (selection bias)
Low risk Participants were asked to take a survey, but no specific details were given.
Blinding of the participants and personnel (performance bias)
Low risk It is reported that the intervention scenarios were all delivered online which suggests lack of blinding of the personnel may not have influenced the results. Participants who answered the screening questions correctly were not told about the aim of the study
Incomplete outcome data (attrition bias) All outcomes
Low risk The attrition rate in the study is low.
Selective reporting (reporting bias)
Low risk All relevant outcomes in the methods section were reported in the results section. The authors also mentioned the limitations of the study.
Other bias Low risk No other potential threats identified.
30
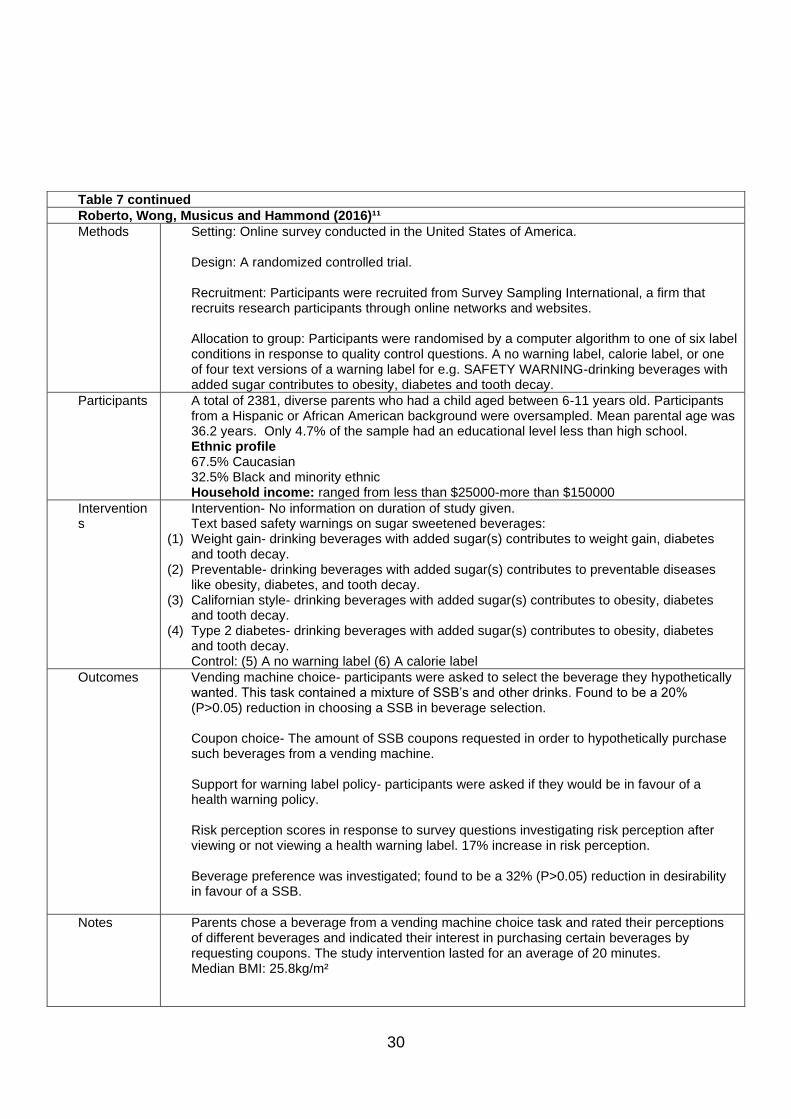
Table 7 continued
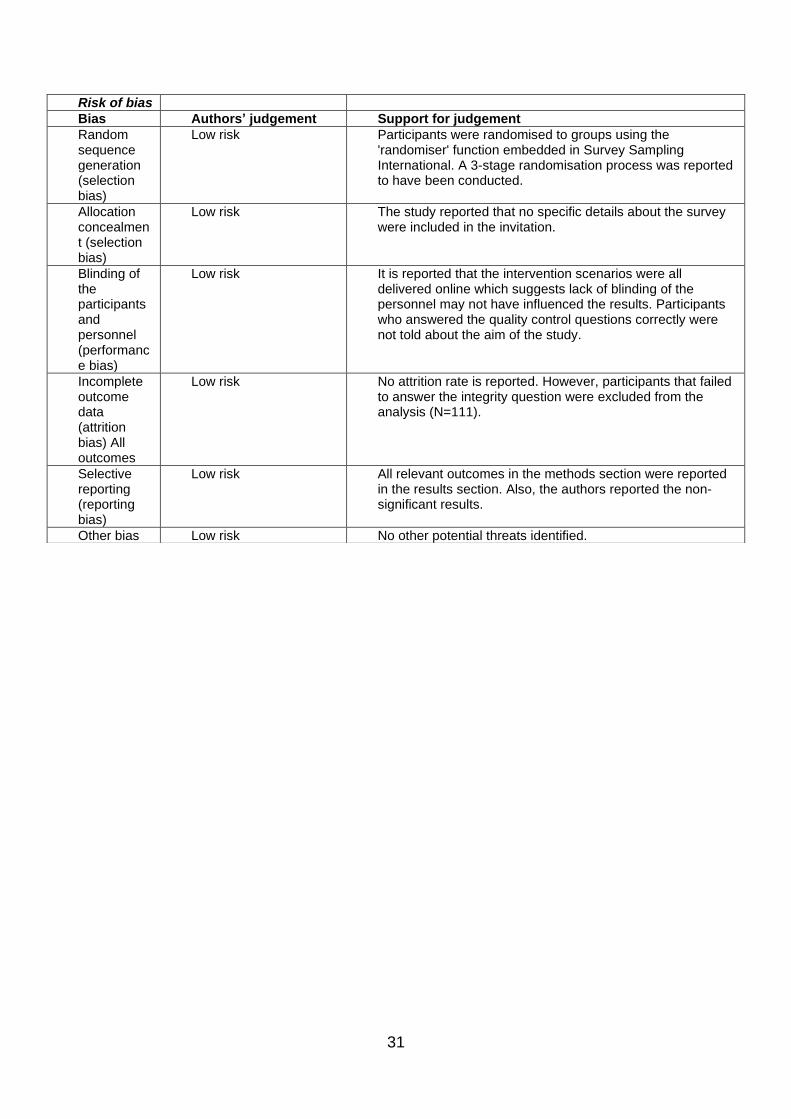
Roberto, Wong, Musicus and Hammond (2016)¹¹
Methods Setting: Online survey conducted in the United States of America. Design: A randomized controlled trial. Recruitment: Participants were recruited from Survey Sampling International, a firm that recruits research participants through online networks and websites. Allocation to group: Participants were randomised by a computer algorithm to one of six label conditions in response to quality control questions. A no warning label, calorie label, or one of four text versions of a warning label for e.g. SAFETY WARNING-drinking beverages with added sugar contributes to obesity, diabetes and tooth decay.
Participants A total of 2381, diverse parents who had a child aged between 6-11 years old. Participants from a Hispanic or African American background were oversampled. Mean parental age was 36.2 years. Only 4.7% of the sample had an educational level less than high school. Ethnic profile 67.5% Caucasian 32.5% Black and minority ethnic Household income: ranged from less than $25000-more than $150000
Interventions
Intervention- No information on duration of study given. Text based safety warnings on sugar sweetened beverages:
(1) Weight gain- drinking beverages with added sugar(s) contributes to weight gain, diabetes and tooth decay.
(2) Preventable- drinking beverages with added sugar(s) contributes to preventable diseases like obesity, diabetes, and tooth decay.
(3) Californian style- drinking beverages with added sugar(s) contributes to obesity, diabetes and tooth decay.
(4) Type 2 diabetes- drinking beverages with added sugar(s) contributes to obesity, diabetes and tooth decay. Control: (5) A no warning label (6) A calorie label
Outcomes Vending machine choice- participants were asked to select the beverage they hypothetically wanted. This task contained a mixture of SSB’s and other drinks. Found to be a 20% (P>0.05) reduction in choosing a SSB in beverage selection. Coupon choice- The amount of SSB coupons requested in order to hypothetically purchase such beverages from a vending machine. Support for warning label policy- participants were asked if they would be in favour of a health warning policy. Risk perception scores in response to survey questions investigating risk perception after viewing or not viewing a health warning label. 17% increase in risk perception. Beverage preference was investigated; found to be a 32% (P>0.05) reduction in desirability in favour of a SSB.
Notes Parents chose a beverage from a vending machine choice task and rated their perceptions of different beverages and indicated their interest in purchasing certain beverages by requesting coupons. The study intervention lasted for an average of 20 minutes. Median BMI: 25.8kg/m²
31
Risk of bias
Bias Authors’ judgement Support for judgement
Random sequence generation (selection bias)
Low risk Participants were randomised to groups using the 'randomiser' function embedded in Survey Sampling International. A 3-stage randomisation process was reported to have been conducted.
Allocation concealment (selection bias)
Low risk The study reported that no specific details about the survey were included in the invitation.
Blinding of the participants and personnel (performance bias)
Low risk It is reported that the intervention scenarios were all delivered online which suggests lack of blinding of the personnel may not have influenced the results. Participants who answered the quality control questions correctly were not told about the aim of the study.
Incomplete outcome data (attrition bias) All outcomes
Low risk No attrition rate is reported. However, participants that failed to answer the integrity question were excluded from the analysis (N=111).
Selective reporting (reporting bias)
Low risk All relevant outcomes in the methods section were reported in the results section. Also, the authors reported the non-significant results.
Other bias Low risk No other potential threats identified.
32
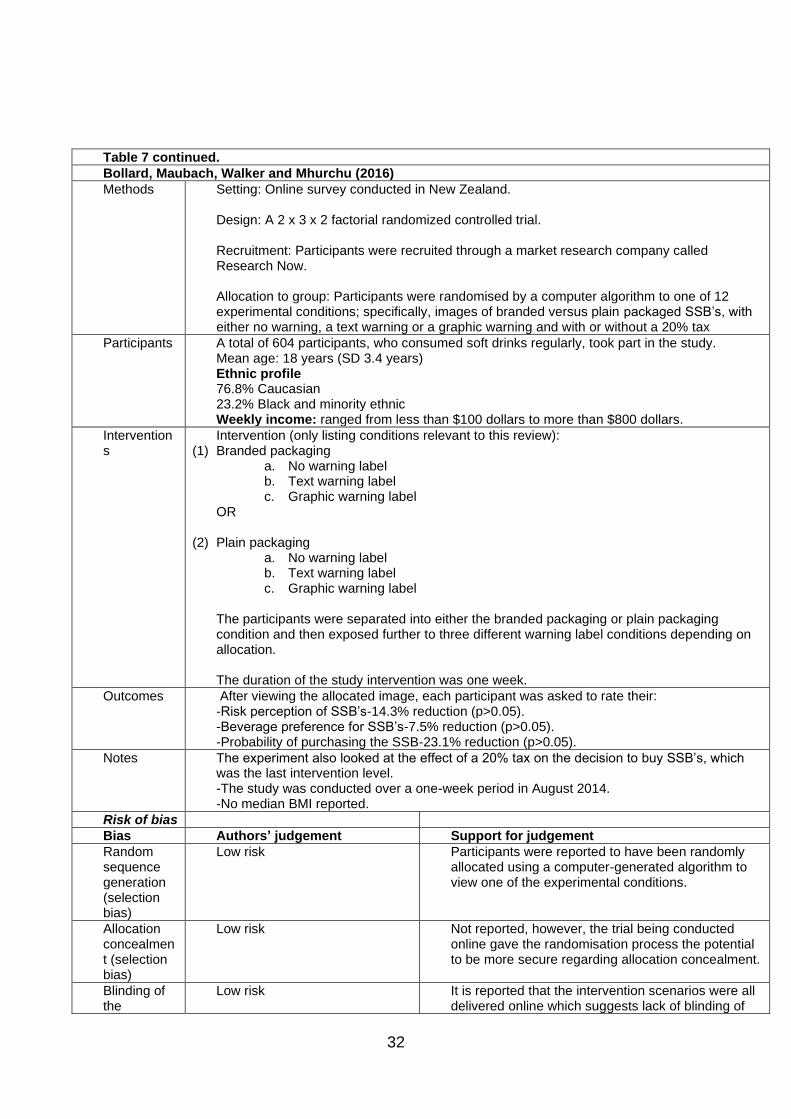
Table 7 continued.
Bollard, Maubach, Walker and Mhurchu (2016)
Methods Setting: Online survey conducted in New Zealand. Design: A 2 x 3 x 2 factorial randomized controlled trial. Recruitment: Participants were recruited through a market research company called Research Now. Allocation to group: Participants were randomised by a computer algorithm to one of 12 experimental conditions; specifically, images of branded versus plain packaged SSB’s, with either no warning, a text warning or a graphic warning and with or without a 20% tax
Participants A total of 604 participants, who consumed soft drinks regularly, took part in the study. Mean age: 18 years (SD 3.4 years) Ethnic profile 76.8% Caucasian 23.2% Black and minority ethnic Weekly income: ranged from less than $100 dollars to more than $800 dollars.
Interventions
Intervention (only listing conditions relevant to this review): (1) Branded packaging
a. No warning label b. Text warning label c. Graphic warning label
OR
(2) Plain packaging a. No warning label b. Text warning label c. Graphic warning label
The participants were separated into either the branded packaging or plain packaging condition and then exposed further to three different warning label conditions depending on allocation. The duration of the study intervention was one week.
Outcomes After viewing the allocated image, each participant was asked to rate their: -Risk perception of SSB’s-14.3% reduction (p>0.05). -Beverage preference for SSB’s-7.5% reduction (p>0.05). -Probability of purchasing the SSB-23.1% reduction (p>0.05).
Notes The experiment also looked at the effect of a 20% tax on the decision to buy SSB’s, which was the last intervention level. -The study was conducted over a one-week period in August 2014. -No median BMI reported.
Risk of bias
Bias Authors’ judgement Support for judgement
Random sequence generation (selection bias)
Low risk Participants were reported to have been randomly allocated using a computer-generated algorithm to view one of the experimental conditions.
Allocation concealment (selection bias)
Low risk Not reported, however, the trial being conducted online gave the randomisation process the potential to be more secure regarding allocation concealment.
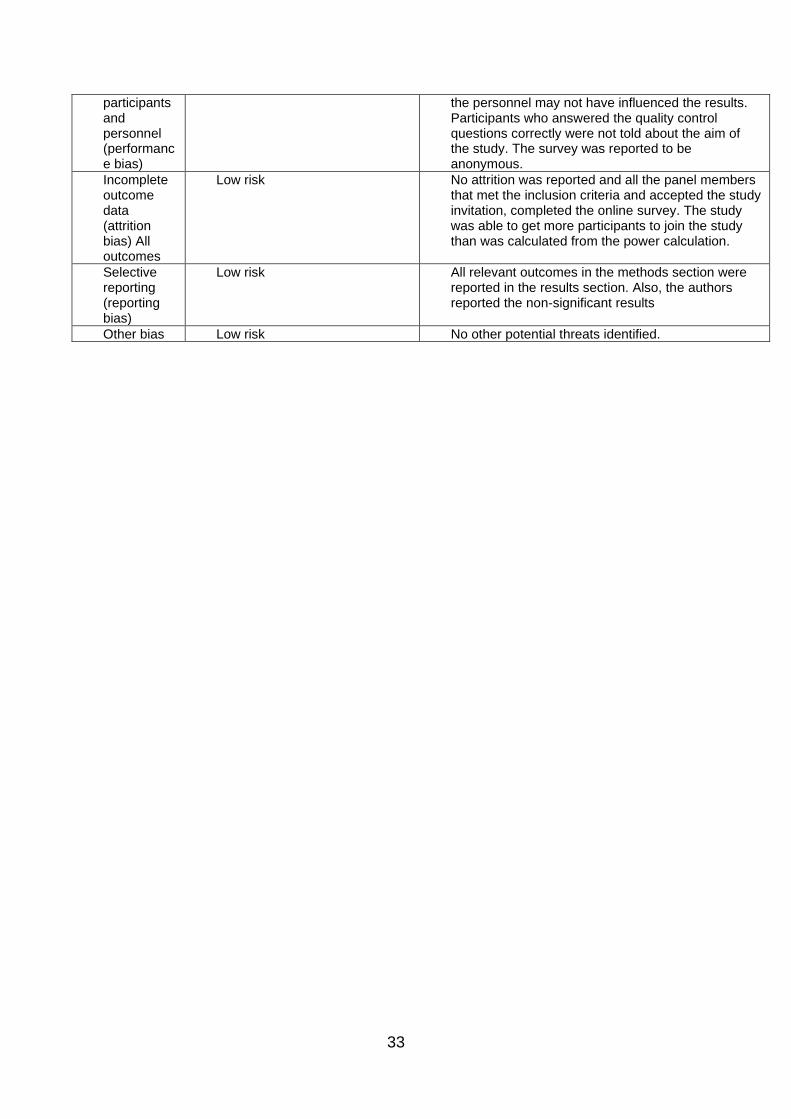
Blinding of the
Low risk It is reported that the intervention scenarios were all delivered online which suggests lack of blinding of
33
participants and personnel (performance bias)
the personnel may not have influenced the results. Participants who answered the quality control questions correctly were not told about the aim of the study. The survey was reported to be anonymous.
Incomplete outcome data (attrition bias) All outcomes
Low risk No attrition was reported and all the panel members that met the inclusion criteria and accepted the study invitation, completed the online survey. The study was able to get more participants to join the study than was calculated from the power calculation.
Selective reporting (reporting bias)
Low risk All relevant outcomes in the methods section were reported in the results section. Also, the authors reported the non-significant results
Other bias Low risk No other potential threats identified.
34
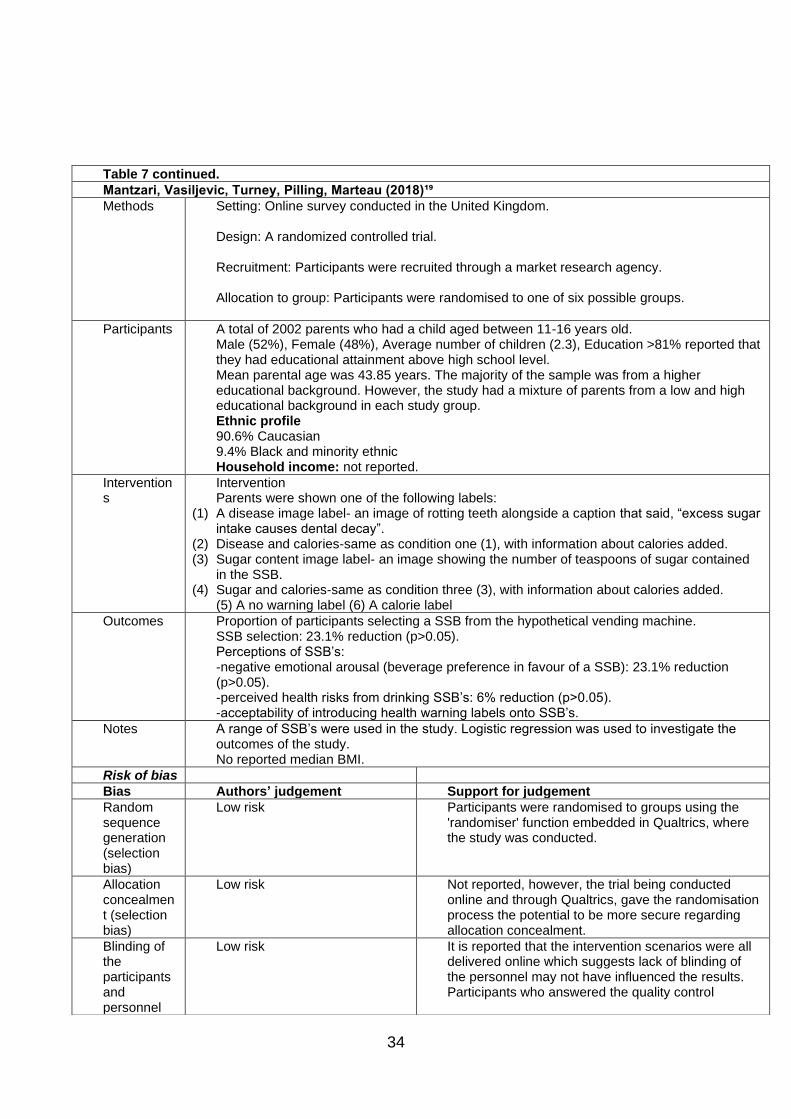
Table 7 continued.
Mantzari, Vasiljevic, Turney, Pilling, Marteau (2018)¹⁹
Methods Setting: Online survey conducted in the United Kingdom. Design: A randomized controlled trial. Recruitment: Participants were recruited through a market research agency. Allocation to group: Participants were randomised to one of six possible groups.
Participants A total of 2002 parents who had a child aged between 11-16 years old. Male (52%), Female (48%), Average number of children (2.3), Education >81% reported that they had educational attainment above high school level. Mean parental age was 43.85 years. The majority of the sample was from a higher educational background. However, the study had a mixture of parents from a low and high educational background in each study group. Ethnic profile 90.6% Caucasian 9.4% Black and minority ethnic Household income: not reported.
Interventions
Intervention Parents were shown one of the following labels:
(1) A disease image label- an image of rotting teeth alongside a caption that said, “excess sugar intake causes dental decay”.
(2) Disease and calories-same as condition one (1), with information about calories added. (3) Sugar content image label- an image showing the number of teaspoons of sugar contained
in the SSB. (4) Sugar and calories-same as condition three (3), with information about calories added.
(5) A no warning label (6) A calorie label
Outcomes Proportion of participants selecting a SSB from the hypothetical vending machine. SSB selection: 23.1% reduction (p>0.05). Perceptions of SSB’s: -negative emotional arousal (beverage preference in favour of a SSB): 23.1% reduction (p>0.05). -perceived health risks from drinking SSB’s: 6% reduction (p>0.05). -acceptability of introducing health warning labels onto SSB’s.
Notes A range of SSB’s were used in the study. Logistic regression was used to investigate the outcomes of the study. No reported median BMI.
Risk of bias
Bias Authors’ judgement Support for judgement
Random sequence generation (selection bias)
Low risk Participants were randomised to groups using the 'randomiser' function embedded in Qualtrics, where the study was conducted.
Allocation concealment (selection bias)
Low risk Not reported, however, the trial being conducted online and through Qualtrics, gave the randomisation process the potential to be more secure regarding allocation concealment.
Blinding of the participants and personnel
Low risk It is reported that the intervention scenarios were all delivered online which suggests lack of blinding of the personnel may not have influenced the results. Participants who answered the quality control
35
(performance bias)
questions correctly were not told about the aim of the study. The survey was reported to be anonymous.
Incomplete outcome data (attrition bias) All outcomes
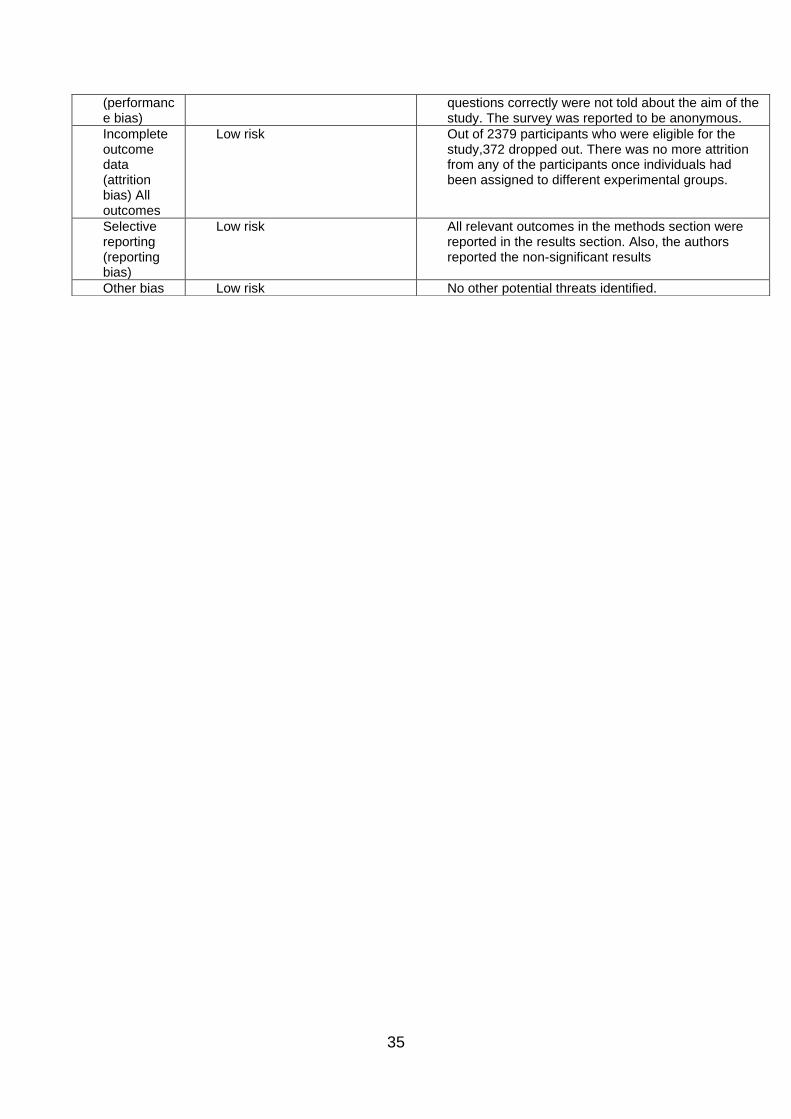
Low risk Out of 2379 participants who were eligible for the study,372 dropped out. There was no more attrition from any of the participants once individuals had been assigned to different experimental groups.
Selective reporting (reporting bias)
Low risk All relevant outcomes in the methods section were reported in the results section. Also, the authors reported the non-significant results
Other bias Low risk No other potential threats identified.
36
Table 7 continued.
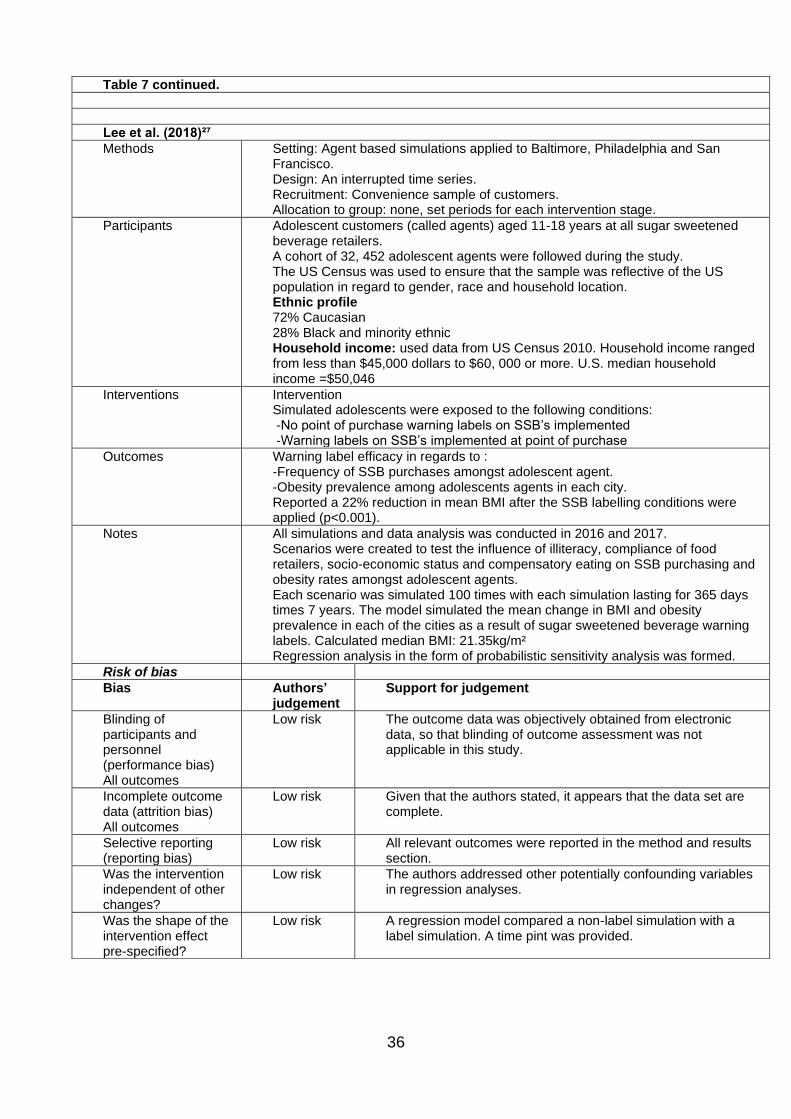
Lee et al. (2018)²⁷
Methods Setting: Agent based simulations applied to Baltimore, Philadelphia and San Francisco. Design: An interrupted time series. Recruitment: Convenience sample of customers. Allocation to group: none, set periods for each intervention stage.
Participants Adolescent customers (called agents) aged 11-18 years at all sugar sweetened beverage retailers. A cohort of 32, 452 adolescent agents were followed during the study. The US Census was used to ensure that the sample was reflective of the US population in regard to gender, race and household location. Ethnic profile 72% Caucasian 28% Black and minority ethnic Household income: used data from US Census 2010. Household income ranged from less than $45,000 dollars to $60, 000 or more. U.S. median household income =$50,046
Interventions Intervention Simulated adolescents were exposed to the following conditions: -No point of purchase warning labels on SSB’s implemented -Warning labels on SSB’s implemented at point of purchase
Outcomes Warning label efficacy in regards to : -Frequency of SSB purchases amongst adolescent agent. -Obesity prevalence among adolescents agents in each city. Reported a 22% reduction in mean BMI after the SSB labelling conditions were applied (p<0.001).
Notes All simulations and data analysis was conducted in 2016 and 2017. Scenarios were created to test the influence of illiteracy, compliance of food retailers, socio-economic status and compensatory eating on SSB purchasing and obesity rates amongst adolescent agents. Each scenario was simulated 100 times with each simulation lasting for 365 days times 7 years. The model simulated the mean change in BMI and obesity prevalence in each of the cities as a result of sugar sweetened beverage warning labels. Calculated median BMI: 21.35kg/m² Regression analysis in the form of probabilistic sensitivity analysis was formed.
Risk of bias
Bias Authors’ judgement
Support for judgement
Blinding of participants and personnel (performance bias) All outcomes
Low risk The outcome data was objectively obtained from electronic data, so that blinding of outcome assessment was not applicable in this study.
Incomplete outcome data (attrition bias) All outcomes
Low risk Given that the authors stated, it appears that the data set are complete.
Selective reporting (reporting bias)
Low risk All relevant outcomes were reported in the method and results section.
Was the intervention independent of other changes?
Low risk The authors addressed other potentially confounding variables in regression analyses.
Was the shape of the intervention effect pre-specified?
Low risk A regression model compared a non-label simulation with a label simulation. A time pint was provided.
37
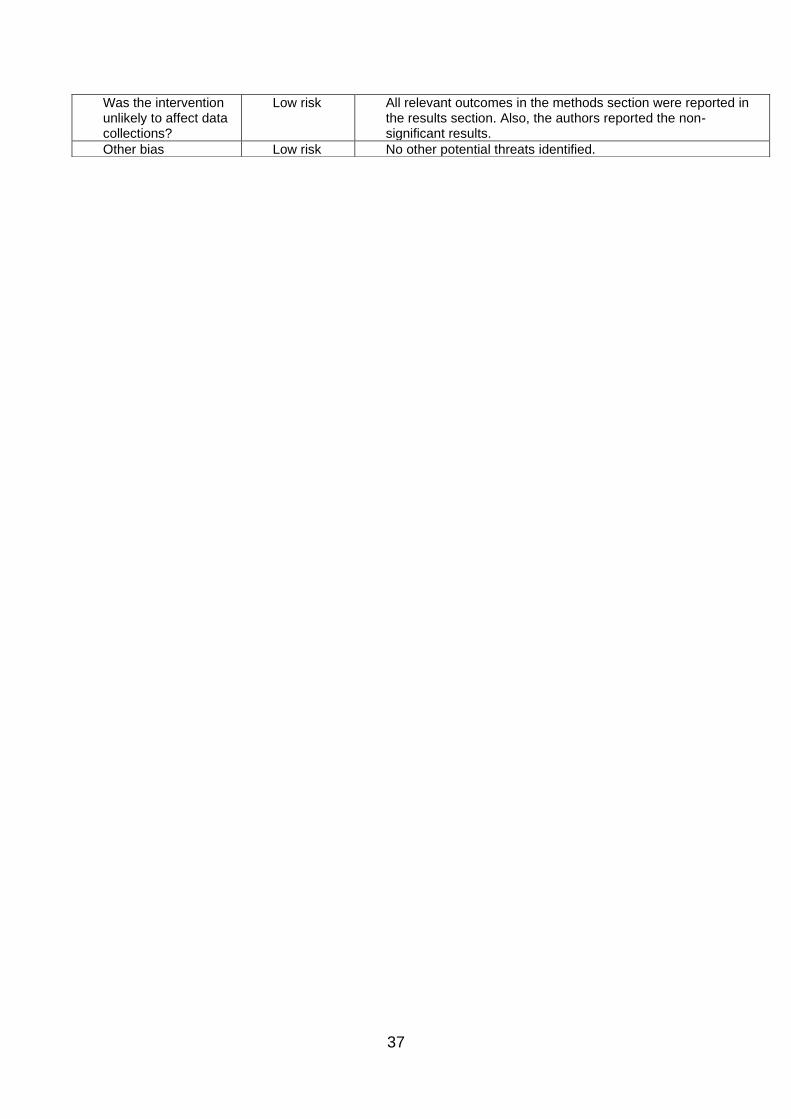
Was the intervention unlikely to affect data collections?
Low risk All relevant outcomes in the methods section were reported in the results section. Also, the authors reported the non-significant results.
Other bias Low risk No other potential threats identified.
38
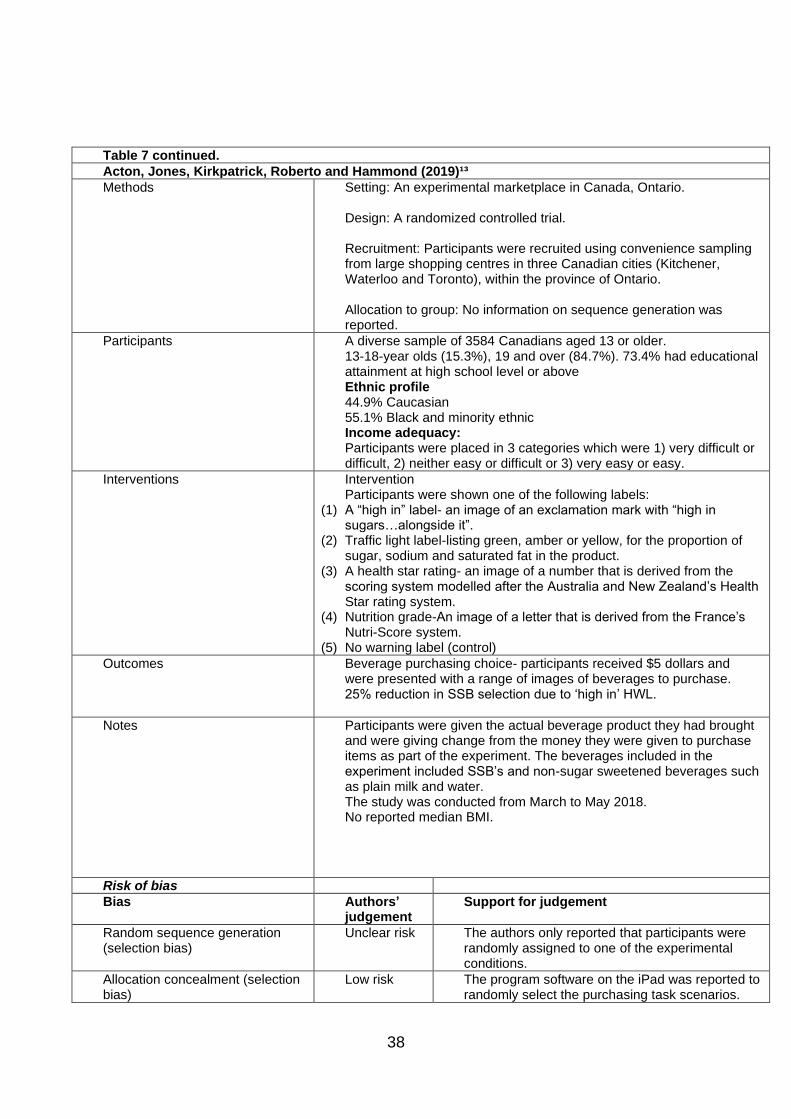
Table 7 continued.
Acton, Jones, Kirkpatrick, Roberto and Hammond (2019)¹³
Methods Setting: An experimental marketplace in Canada, Ontario. Design: A randomized controlled trial. Recruitment: Participants were recruited using convenience sampling from large shopping centres in three Canadian cities (Kitchener, Waterloo and Toronto), within the province of Ontario. Allocation to group: No information on sequence generation was reported.
Participants A diverse sample of 3584 Canadians aged 13 or older. 13-18-year olds (15.3%), 19 and over (84.7%). 73.4% had educational attainment at high school level or above Ethnic profile 44.9% Caucasian 55.1% Black and minority ethnic Income adequacy: Participants were placed in 3 categories which were 1) very difficult or difficult, 2) neither easy or difficult or 3) very easy or easy.
Interventions Intervention Participants were shown one of the following labels:
(1) A “high in” label- an image of an exclamation mark with “high in sugars…alongside it”.
(2) Traffic light label-listing green, amber or yellow, for the proportion of sugar, sodium and saturated fat in the product.
(3) A health star rating- an image of a number that is derived from the scoring system modelled after the Australia and New Zealand’s Health Star rating system.
(4) Nutrition grade-An image of a letter that is derived from the France’s Nutri-Score system.
(5) No warning label (control)
Outcomes Beverage purchasing choice- participants received $5 dollars and were presented with a range of images of beverages to purchase. 25% reduction in SSB selection due to ‘high in’ HWL.
Notes
Participants were given the actual beverage product they had brought and were giving change from the money they were given to purchase items as part of the experiment. The beverages included in the experiment included SSB’s and non-sugar sweetened beverages such as plain milk and water. The study was conducted from March to May 2018. No reported median BMI.
Risk of bias
Bias Authors’ judgement
Support for judgement
Random sequence generation (selection bias)
Unclear risk The authors only reported that participants were randomly assigned to one of the experimental conditions.
Allocation concealment (selection bias)
Low risk The program software on the iPad was reported to randomly select the purchasing task scenarios.
39
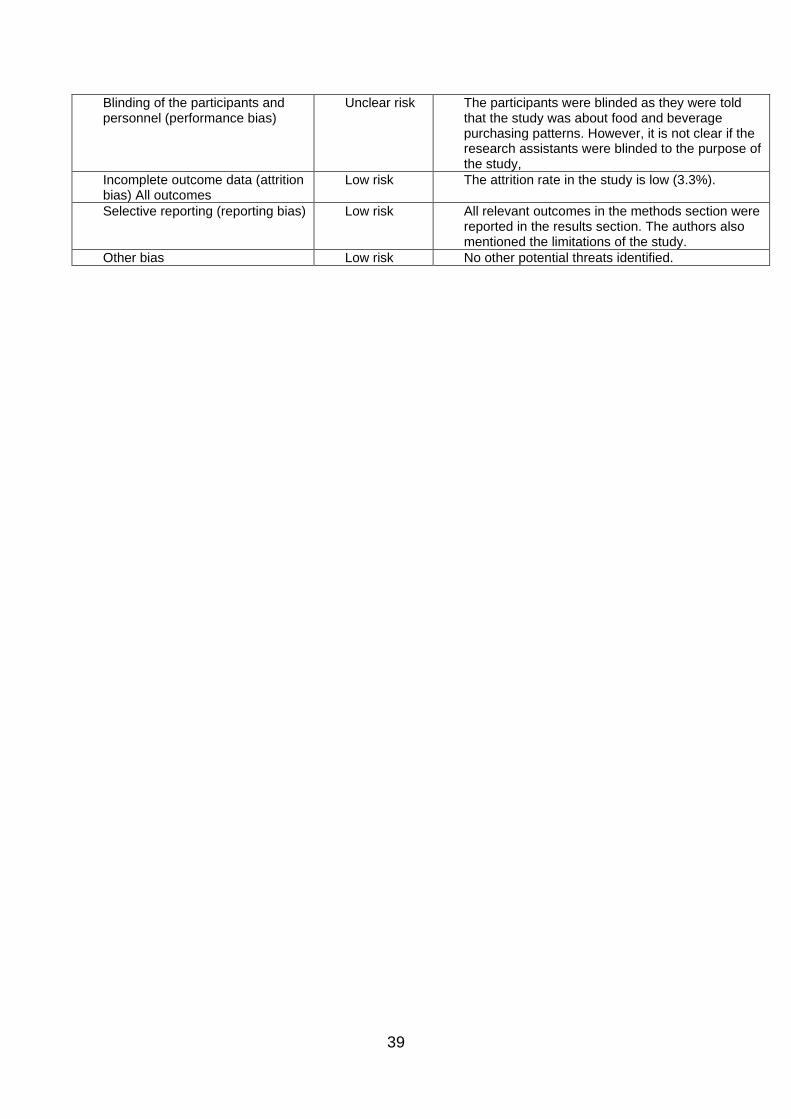
Blinding of the participants and personnel (performance bias)
Unclear risk The participants were blinded as they were told that the study was about food and beverage purchasing patterns. However, it is not clear if the research assistants were blinded to the purpose of the study,
Incomplete outcome data (attrition bias) All outcomes
Low risk The attrition rate in the study is low (3.3%).
Selective reporting (reporting bias) Low risk All relevant outcomes in the methods section were reported in the results section. The authors also mentioned the limitations of the study.
Other bias Low risk No other potential threats identified.
40
Table 1: PICO strategy outline
41
Table 2: Study characteristics
42
Table 3: Summary findings
43
Figure 1: Examples of health warning labels
44
Figure 2: Logic model
45
Figure 3: Flow diagram of the study selection process
46
Figure 4: Summary of risk bias