thru streets q - welcome to nyc.gov | city of new york · thru streets q an innovative approach to...
TRANSCRIPT
March 2004
New York CityMichael R. Bloomberg, Mayor
New York CityDepartment of TransportationIris Weinshall, Commissioner
qqq
THRU STREETS
qqqAn Innovative Approach toManaging Midtown Traffic

New York City Department of TransportationIris Weinshall, Commissioner
The preparation of this document has been financed in part through funds from the United States Department of Transportation under Title 23, USC. This document has been disseminated under the sponsorship of the Department of Transportation in the interest of information exchange. The content of this report reflects the views of its author who is responsible for the accuracy of the data presented herein. The contents do not necessarily reflect the views or policies of the Federal Transit Administration, the Federal Highway Administration, the State of New York, the New York Metropolitan Transportation Council or the City of New York. This report does not constitute a standard, specification or regulation.
THRU STREETSAn Innovative Approach toManaging Midtown Traffic
PT 2221915CDOT 01-03 , 02-03
City of New YorkMichael R. Bloomberg, Mayor

Table of Contents Introduction . . . . . . . . . . . . . . . . . . . . . . . . . . . . . . . . . . . . . . . . . . . . . . . . . . . . . . . . . . . . . 1 Summary of Program . . . . . . . . . . . . . . . . . . . . . . . . . . . . . . . . . . . . . . . . . . . . . . . . 1 Summary of Findings . . . . . . . . . . . . . . . . . . . . . . . . . . . . . . . . . . . . . . . . . . . . . . . . 3 Program Description . . . . . . . . . . . . . . . . . . . . . . . . . . . . . . . . . . . . . . . . . . . . . . . . . . . . . . 7 THRU Streets Designation . . . . . . . . . . . . . . . . . . . . . . . . . . . . . . . . . . . . . . . . . . . . . . . . 8 Program Elements . . . . . . . . . . . . . . . . . . . . . . . . . . . . . . . . . . . . . . . . . . . . . . . . . . . . . . . 10 Signs . . . . . . . . . . . . . . . . . . . . . . . . . . . . . . . . . . . . . . . . . . . . . . . . . . . . . . . . . . . . . 10 Markings . . . . . . . . . . . . . . . . . . . . . . . . . . . . . . . . . . . . . . . . . . . . . . . . . . . . . . . . . . 11 Signals . . . . . . . . . . . . . . . . . . . . . . . . . . . . . . . . . . . . . . . . . . . . . . . . . . . . . . . . . . . 12 Curbside Regulations . . . . . . . . . . . . . . . . . . . . . . . . . . . . . . . . . . . . . . . . . . . . . . . . 13 Enforcement . . . . . . . . . . . . . . . . . . . . . . . . . . . . . . . . . . . . . . . . . . . . . . . . . . . . . . . 13 Impact Assessment . . . . . . . . . . . . . . . . . . . . . . . . . . . . . . . . . . . . . . . . . . . . . . . . . . . . . . . 14 THRU Streets Travel Times . . . . . . . . . . . . . . . . . . . . . . . . . . . . . . . . . . . . . . . . . . . 15 Travel Speeds/Segment Analysis . . . . . . . . . . . . . . . . . . . . . . . . . . . . . . . . . . . . . . . 16 THRU Streets Vehicular Volumes . . . . . . . . . . . . . . . . . . . . . . . . . . . . . . . . . . . . . . 18 Accident Reduction . . . . . . . . . . . . . . . . . . . . . . . . . . . . . . . . . . . . . . . . . . . . . . . . . . 19 Non-THRU Streets Travel Times . . . . . . . . . . . . . . . . . . . . . . . . . . . . . . . . . . . . . . . 22 Non-THRU Streets Vehicular Volumes . . . . . . . . . . . . . . . . . . . . . . . . . . . . . . . . . . 23 Motorist Compliance/Turning Restrictions . . . . . . . . . . . . . . . . . . . . . . . . . . . . . . . . 24 Split Phasing . . . . . . . . . . . . . . . . . . . . . . . . . . . . . . . . . . . . . . . . . . . . . . . . . . . . . . . 25 Pedestrian Activity . . . . . . . . . . . . . . . . . . . . . . . . . . . . . . . . . . . . . . . . . . . . . . . . . . 25 Curb Clear . . . . . . . . . . . . . . . . . . . . . . . . . . . . . . . . . . . . . . . . . . . . . . . . . . . . . . . . . 26 Conclusions . . . . . . . . . . . . . . . . . . . . . . . . . . . . . . . . . . . . . . . . . . . . . . . . . . . . . . . . 26 List of Appendices Appendix I: Program Development Appendix II THRU Streets Travel Times Appendix III: THRU Streets Vehicle Volumes Appendix IV: Non-THRU Streets Travel Times and Vehicle Volumes

THRU STREETS – AN INNOVATIVE APPROACH TO MANAGING MIDTOWN TRAFFIC - 1 -
Introduction
Summary of Program
Vehicle travel on the crosstown streets of Midtown Manhattan has been historically slow
and unreliable. Average travel speeds were typically five miles per hour (mph) or less.
In Spring 2002, Midtown auto speeds averaged only 4.8 mph eastbound and 4.2 mph
westbound. Conditions were erratic with severe delays occurring seemingly at random.
In order to make crosstown travel more consistent and faster for buses, trucks and autos,
as well as improve conditions for pedestrians, Mayor Michael Bloomberg, with
participation by the Department of Transportation (DOT) and the Police Department
(NYPD), introduced the THRU Streets Program as a pilot project in the fall of 2002. In
doing so, the Administration has improved the viability of the nation's largest business
district -- and improved the quality of life for those New Yorkers and visitors who walk,
drive, shop and work in Midtown Manhattan.
The program has been recognized as making a substantial contribution to the field of
traffic engineering. In June 2003, the Intelligent Transportation Society of New York
awarded both DOT and NYPD its Outstanding ITS Project of the Year for the THRU
Streets program. In addition, the Rudin Center for Transportation Policy and
Management has announced that the program will be receiving its Annual Leadership
Transportation Award.
The program consists of the following elements:
• nine Midtown streets designated as THRU Streets – and vehicle turns restricted
off of these streets on weekdays between 10 am and 6 pm;
THRU STREETS – AN INNOVATIVE APPROACH TO MANAGING MIDTOWN TRAFFIC - 2 -
• traffic signal “split phasing” introduced at the beginnings and selected endpoints
of THRU Streets, and at selected locations on non-THRU Streets to improve
pedestrian safety;
• midtown traffic enforcement efforts focused on THRU Streets;
• commercial deliveries facilitated by providing new parking opportunities on both
curbsides of most non-THRU Streets.
In order to ensure the effectiveness of the program, DOT continued to monitor conditions
throughout 2003. Based upon this data, over a year later, the THRU Streets program
continues to be successfully managing traffic operations in Midtown Manhattan.

THRU STREETS – AN INNOVATIVE APPROACH TO MANAGING MIDTOWN TRAFFIC - 3 -
Summary of Findings
The THRU Streets program has had a beneficial effect on traffic conditions in Midtown
Manhattan. It has consistently improved travel time, increased vehicular capacity, and
enhanced pedestrian safety.
The transportation data collected in various periods throughout 2003 was aggregated to
provide a representative sampling for the year. It was then compared to pre-
implementation conditions in 2002. Following are the highlights of this comparison:
• Travel speeds on the THRU Streets have shown significant improvements. The
average travel speed for the THRU Streets has increased by 33% (to 5.3 mph
from 4.0 mph).
• The time required to travel along the THRU Streets fell to 6 minutes, 31 seconds
from 8 minutes, 40 seconds (a 25% improvement).
Average Travel Time (min:sec)9 THRU Streets 4 Eastbound: 36th, 46th, 50th, 54th(10 AM – 6 PM) 5 Westbound: 37th, 45th, 49th, 53rd, 60th
8:40
7:02
9:35
6:31
0:00
2:00
4:00
6:00
8:00
10:00
12:00 Week before Thanksgiving to
Tree Lighting Week
Height of Holiday Season
Before December 9-202002
Nov 18-Dec 62002
January-October 2003
January-October 2003
THRU STREETS – AN INNOVATIVE APPROACH TO MANAGING MIDTOWN TRAFFIC - 4 -
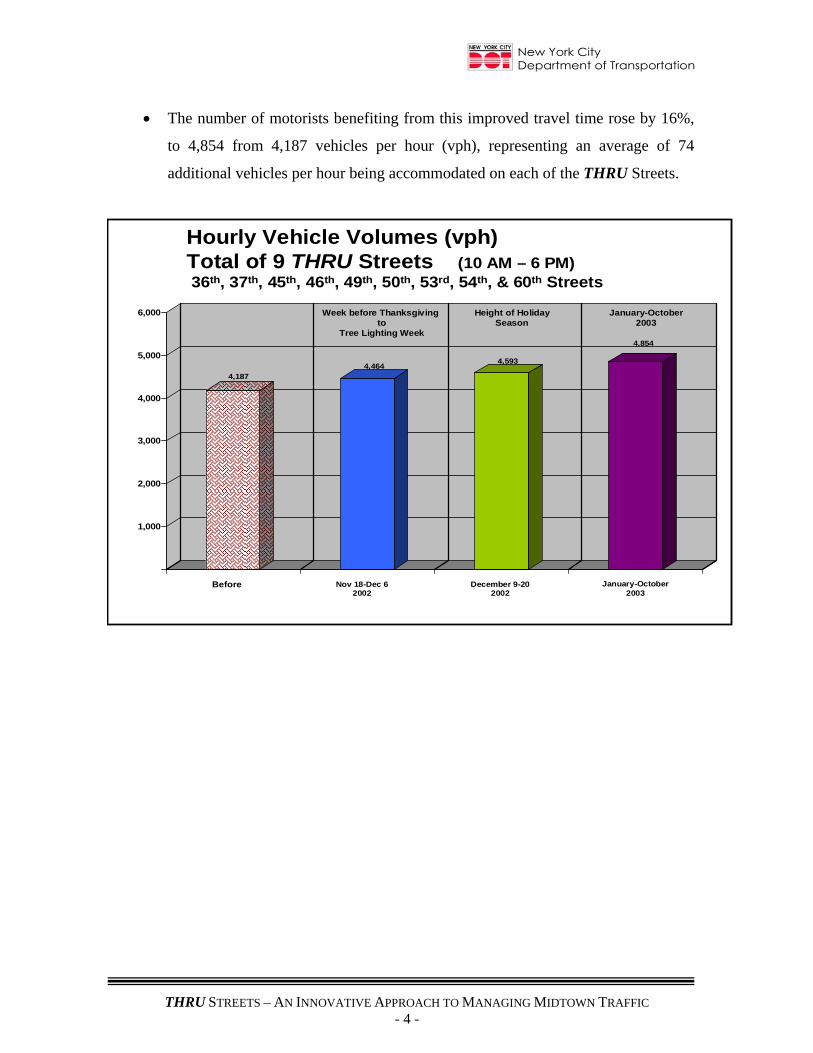
• The number of motorists benefiting from this improved travel time rose by 16%,
to 4,854 from 4,187 vehicles per hour (vph), representing an average of 74
additional vehicles per hour being accommodated on each of the THRU Streets.
Hourly Vehicle Volumes (vph)Total of 9 THRU Streets (10 AM – 6 PM)36th, 37th, 45th, 46th, 49th, 50th, 53rd, 54th, & 60th Streets
4,1874,464 4,593
4,854
1,000
2,000
3,000
4,000
5,000
6,000 Week before Thanksgivingto
Tree Lighting Week
Height of Holiday Season
Before December 9-202002
Nov 18-Dec 62002
January-October 2003
January-October2003

THRU STREETS – AN INNOVATIVE APPROACH TO MANAGING MIDTOWN TRAFFIC - 5 -
279
81
168
30
193
74
102
17
0
50
100
150
200
250
300
Before (1/1/01-8/31/01) After (1/1/03-8/31/03)
Total Pedestrian Non-Pedestrian Bikes
THRU StreetsTotal Accidents by Mode
• Accident data for the first eight months of 2003 was compared to pre-
implementation data for the same eight month period in 2001. Total accidents on
the THRU Streets decreased significantly by 31% (to 193 from 279), with
pedestrian accidents decreasing nearly 10% (to 74 from 81).
• Compliance with the posted turn restrictions was especially encouraging. During
the initial three weeks of the program (when NYPD intersection presence was at
its highest), compliance rates averaged 98%. During 2003, when the presence of
intersection coverage declined, compliance remained high, averaging 93%,
ranging from 91% to 95%.
• The introduction of split signal phasing at selected intersections has proven highly
valuable. An overwhelming number of pedestrians benefited from conflict free
crossings and most of the locations processed as many or more through and

THRU STREETS – AN INNOVATIVE APPROACH TO MANAGING MIDTOWN TRAFFIC - 6 -
turning vehicles as they had previously. This is especially significant since the
amount of time allocated for the turning movements was sharply curtailed.
• The effectiveness of the split phases is even more pronounced when compared to
pedestrian behavior at Midtown’s recessed crosswalk locations. On average, 52%
fewer illegal pedestrian crossings were recorded at intersections with split phasing
compared to those with recessed crosswalks.
• Curb clear time (the amount of time the curb is completely free of illegally parked
vehicles) improved slightly to 34% from 31%.
THRU STREETS – AN INNOVATIVE APPROACH TO MANAGING MIDTOWN TRAFFIC - 7 -
Program Description
The THRU Streets Program was implemented in two phases. The initial phase consisted
of a five-week period beginning October 15, 2002. Its purpose was to familiarize
motorists and pedestrians with all elements of the program, and for DOT to monitor
conditions and determine whether any changes were warranted. The second phase began
on November 18, 2002. By this point, a number of modifications to the program had
been introduced. Split phasing was eliminated at the ends of the THRU Streets; the
THRU Street designation was removed from 59th Street; and turns were allowed from
most of the THRU Streets onto Park Avenue. This coincided with the start of the
Holiday Season, which began the week before Thanksgiving, and continued until early
January. The Holiday Season typically brings significant shopping activity and tourism
to the City, especially to Midtown Manhattan. The schedule for the implementation of
the THRU Streets Program was developed so that the program would be in place prior to
the Holiday Season and evaluated during the acute traffic conditions of the season.

THRU STREETS – AN INNOVATIVE APPROACH TO MANAGING MIDTOWN TRAFFIC - 8 -
THRU Streets Designation
Five pairs of streets (ten streets between 34th and 60th Streets) were initially designated as
THRU Streets. These streets were 36th, 37th, 45th, 46th, 49th, 50th, 53rd, 54th, 59th and 60th
Streets, primarily between
Third and Sixth Avenues
(Figure 1). The limits were
established as Sixth Avenue to
the west and Third Avenue to
the east (except as noted
below) as this is the part of
Midtown that experiences the
most severe congestion. On
36th Street, and originally on
59th Street, the limits extended
east to Second Avenue to
better manage traffic
approaching the Queens-
Midtown Tunnel and the
Queensboro Bridge,
respectively. The western end
of the THRU Streets on 59th
and 60th Streets was Fifth
Avenue where they meet
Central Park.
These ten streets provide critical links to the transportation system in Midtown. Thirty-
Sixth and 37th Streets provide connections to the Queens-Midtown Tunnel; 45th and 46th
Streets are the first pair of streets north of 42nd Street where east-west travel is not
obstructed by Grand Central Terminal; 49th and 50th Streets serve the M50 and M27 bus
Figure 1. THRU Streets Study Area

THRU STREETS – AN INNOVATIVE APPROACH TO MANAGING MIDTOWN TRAFFIC - 9 -
routes and connect from the FDR Drive; 53rd and 54th Streets also connect from the FDR
Drive and serve an especially high pedestrian activity resulting from the subway stations
on 53rd Street at Fifth Avenue and Lexington Avenue (“E”, “V”, and “6” lines); 59th and
60th Streets connect to the Queensboro Bridge and support bus service (Q32).
Regulations were posted prohibiting turns off of the THRU Streets on weekdays between
the hours of 10 AM and 6 PM at 42 intersections (later reduced to 29 after the program
was modified when turns were permitted onto Park Avenue and 59th Street was removed
from the program). These turn restrictions created protected intersections where
pedestrians were able to cross the avenues without the conflicts created by turning
vehicles. Motorists, however, were able to access THRU Streets from any intersecting
avenue at any time. In addition, “split phasing” was introduced at 35 intersections
(generally at the beginning and end of each THRU Street and at selected non-THRU
Street locations). Split phasing provides pedestrians with a street crossing period exempt
from vehicle turning movements. Finally, DOT and NYPD focused their parking and
construction enforcement efforts on these streets to ensure that lanes would be kept clear
for crosstown traffic.
Strategies were also developed for the nine non-THRU Streets (43rd, 44th, 47th, 48th, 51st,
52nd, 55th, 56th and 58th) to facilitate curbside loading and unloading activity by
permitting commercial vehicle parking on both sides of a majority of the blocks and
improve pedestrian safety by introducing split phasing at most interior avenues.

THRU STREETS – AN INNOVATIVE APPROACH TO MANAGING MIDTOWN TRAFFIC - 10 -
Program Elements
Program implementation consisted of the following elements.
Signs
Signs were newly designed and manufactured to
clearly identify THRU Streets and inform
motorists of the program and associated
regulations. THRU Street signs were placed at
and in advance of THRU Street intersections to
help guide motorists to utilize appropriate streets
for their travel needs (Figures 2 and 3).
Advance promotional signs (Figure 4) were
installed at locations throughout Midtown and
elsewhere in the City to inform motorists of the
program. The THRU Street signs are
distinctive and large, and are designed to direct
and encourage motorists traveling crosstown to
utilize THRU Streets. Concise, clear phrasing
and vivid colors were utilized to convey an
image of quick movement on the THRU Streets.
Information also was provided on Variable Message Signs
(VMS) on City highways to inform motorists of the
program (Figure 5). Standard turn restriction signs were
installed at intersecting avenues and lane designation signs
at split phasing intersections.
Figures 2 and 3. Examples of THRU Street Signage
Figure 4. Advance Promotional Signs

THRU STREETS – AN INNOVATIVE APPROACH TO MANAGING MIDTOWN TRAFFIC - 11 -
Signs were developed for turn restrictions,
split phasing, curbside regulations and truck
routing. Supporting structures and mast arms
were installed to enable signs to be placed at
key intersections and other locations. In total,
778 signs were manufactured at a cost of
$145,588. Installation of the signs by
NYCDOT staff cost an additional $29,488.
Markings
Lane markings were installed at Split Phasing locations to designate appropriate turn
lanes and through lanes (Figure 6).
Markings were added on East 45th Street
to designate a fourth lane (two parking
and two moving lanes). Turn markings
were scarified (removed) from locations
on THRU Streets where turns previously
had been permitted or required, such as on
the 49th/50th Street Transitway (49thand
50th Streets at Third and Sixth Avenues).
On THRU Streets, 71,045 linear feet of
markings were installed, on Non-THRU
Streets, 35,741 linear feet of markings were installed for a program total of 106,786
linear feet and a total cost of $21,167.
Figure 6. Typical roadway markings at intersection with split phasing
Figure 5. VMS signs
THRU STREETS – AN INNOVATIVE APPROACH TO MANAGING MIDTOWN TRAFFIC - 12 -
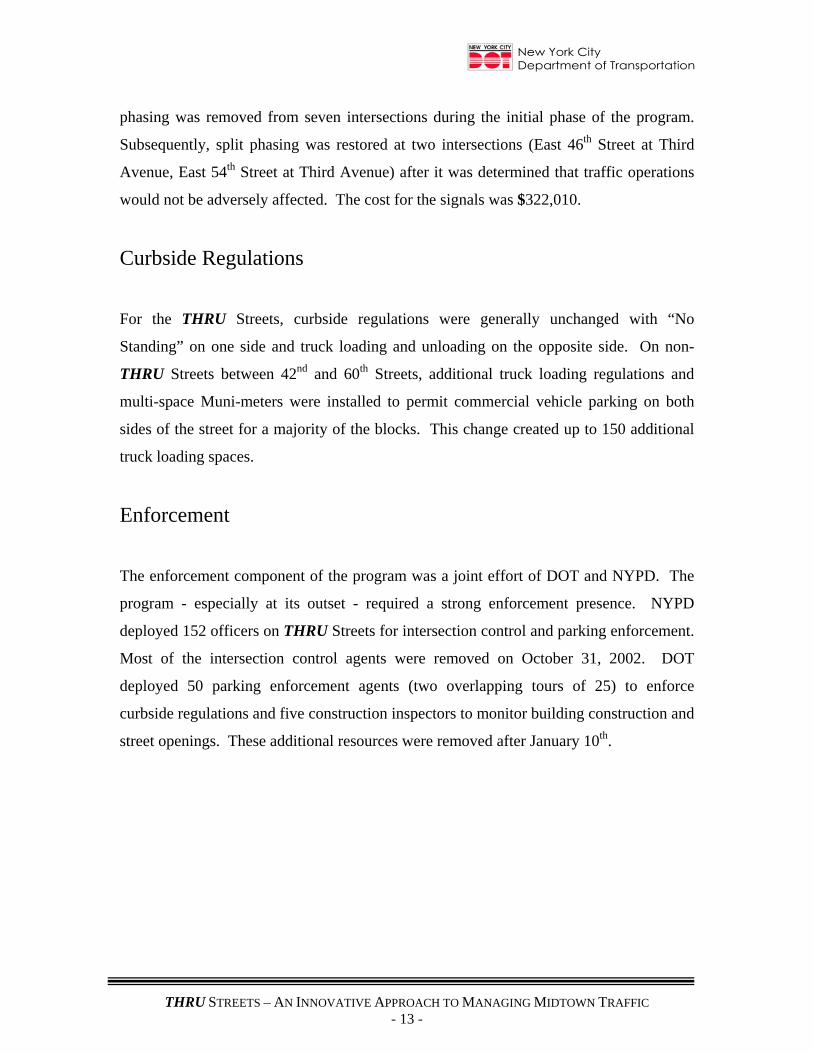
Figure 8. Split Phase Cycle. In the first image, traffic on the avenue moves and cross street traffic is stopped. In the second image, the avenue is stopped, and vehicles on the cross streets can travel straight and turning vehicles are stopped. Pedestrians can cross the avenue at both crosswalks. In the third image, both straight and turning movements are permitted from the cross street while pedestrians can continue to cross at the non-turning crosswalk only.
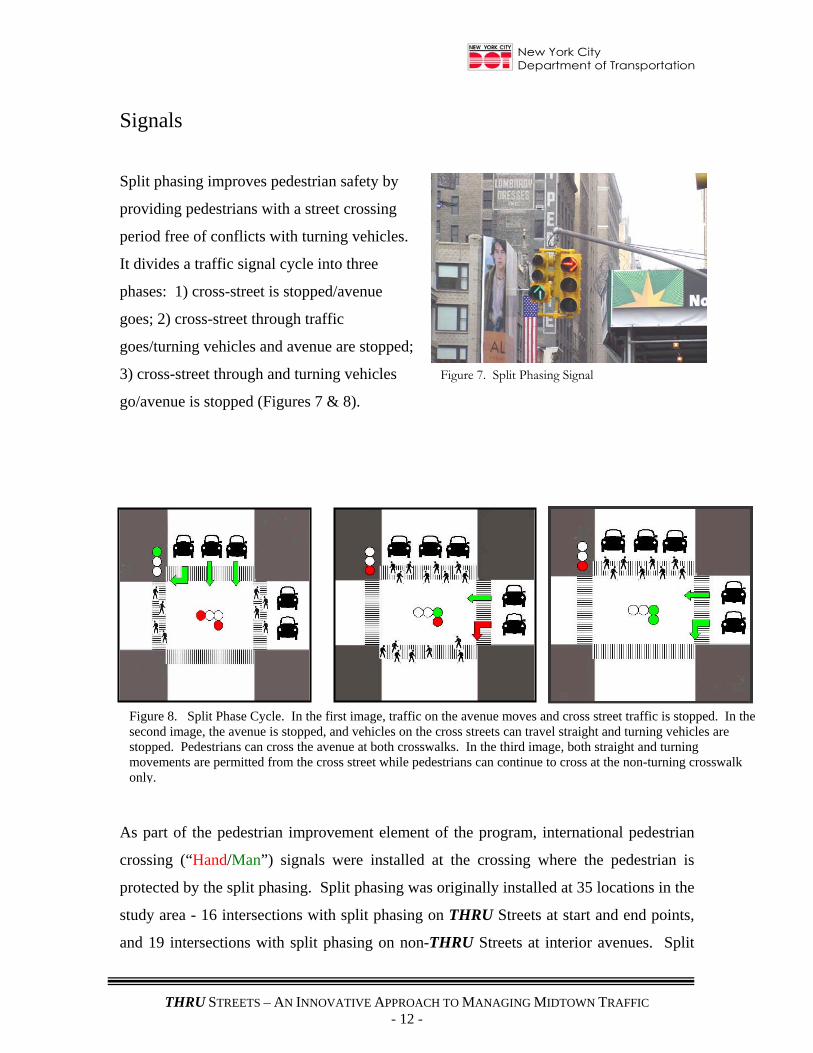
Signals
Split phasing improves pedestrian safety by
providing pedestrians with a street crossing
period free of conflicts with turning vehicles.
It divides a traffic signal cycle into three
phases: 1) cross-street is stopped/avenue
goes; 2) cross-street through traffic
goes/turning vehicles and avenue are stopped;
3) cross-street through and turning vehicles
go/avenue is stopped (Figures 7 & 8).
As part of the pedestrian improvement element of the program, international pedestrian
crossing (“Hand/Man”) signals were installed at the crossing where the pedestrian is
protected by the split phasing. Split phasing was originally installed at 35 locations in the
study area - 16 intersections with split phasing on THRU Streets at start and end points,
and 19 intersections with split phasing on non-THRU Streets at interior avenues. Split
Figure 7. Split Phasing Signal
THRU STREETS – AN INNOVATIVE APPROACH TO MANAGING MIDTOWN TRAFFIC - 13 -
phasing was removed from seven intersections during the initial phase of the program.
Subsequently, split phasing was restored at two intersections (East 46th Street at Third
Avenue, East 54th Street at Third Avenue) after it was determined that traffic operations
would not be adversely affected. The cost for the signals was $322,010.
Curbside Regulations
For the THRU Streets, curbside regulations were generally unchanged with “No
Standing” on one side and truck loading and unloading on the opposite side. On non-
THRU Streets between 42nd and 60th Streets, additional truck loading regulations and
multi-space Muni-meters were installed to permit commercial vehicle parking on both
sides of the street for a majority of the blocks. This change created up to 150 additional
truck loading spaces.
Enforcement
The enforcement component of the program was a joint effort of DOT and NYPD. The
program - especially at its outset - required a strong enforcement presence. NYPD
deployed 152 officers on THRU Streets for intersection control and parking enforcement.
Most of the intersection control agents were removed on October 31, 2002. DOT
deployed 50 parking enforcement agents (two overlapping tours of 25) to enforce
curbside regulations and five construction inspectors to monitor building construction and
street openings. These additional resources were removed after January 10th.
THRU STREETS – AN INNOVATIVE APPROACH TO MANAGING MIDTOWN TRAFFIC - 14 -
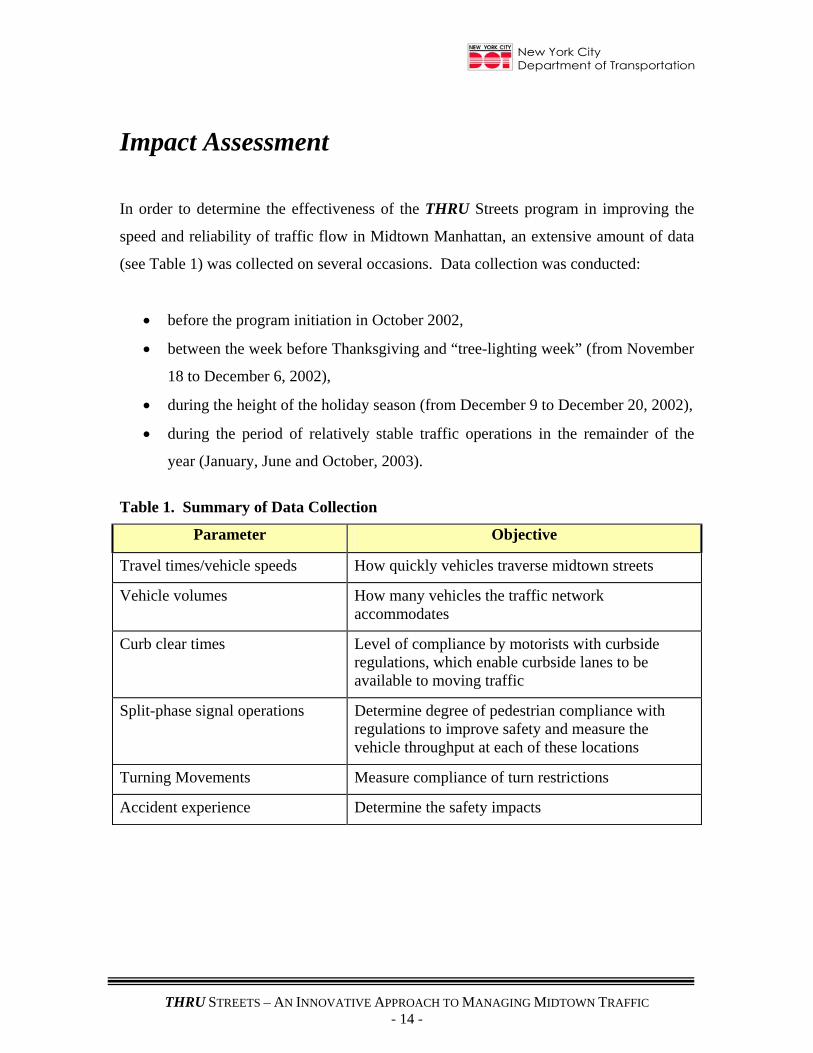
Impact Assessment
In order to determine the effectiveness of the THRU Streets program in improving the
speed and reliability of traffic flow in Midtown Manhattan, an extensive amount of data
(see Table 1) was collected on several occasions. Data collection was conducted:
• before the program initiation in October 2002,
• between the week before Thanksgiving and “tree-lighting week” (from November
18 to December 6, 2002),
• during the height of the holiday season (from December 9 to December 20, 2002),
• during the period of relatively stable traffic operations in the remainder of the
year (January, June and October, 2003).
Table 1. Summary of Data Collection
Parameter Objective
Travel times/vehicle speeds How quickly vehicles traverse midtown streets
Vehicle volumes How many vehicles the traffic network accommodates
Curb clear times Level of compliance by motorists with curbside regulations, which enable curbside lanes to be available to moving traffic
Split-phase signal operations Determine degree of pedestrian compliance with regulations to improve safety and measure the vehicle throughput at each of these locations
Turning Movements Measure compliance of turn restrictions
Accident experience Determine the safety impacts

THRU STREETS – AN INNOVATIVE APPROACH TO MANAGING MIDTOWN TRAFFIC - 15 -
Average Travel Time (min:sec)9 THRU Streets 4 Eastbound: 36th, 46th, 50th, 54th(10 AM – 6 PM) 5 Westbound: 37th, 45th, 49th, 53rd, 60th
8:40
7:02
9:35
6:31
0:00
2:00
4:00
6:00
8:00
10:00
12:00 Week before Thanksgiving to
Tree Lighting Week
Height of Holiday Season
Before December 9-202002
Nov 18-Dec 62002
January-October 2003
January-October 2003
Figure 9
THRU Streets - Travel Times
As shown in Figure 9, average travel times on the nine THRU Streets decreased by 25%,
to 6 minutes, 31 seconds from 8 minutes, 40 seconds. Improvement occurred for both
eastbound and westbound travel. Travel times decreased on the four eastbound THRU
Streets by nearly two minutes, to 6 minutes, 49 seconds from 8 minutes, 48 seconds. On
the five westbound THRU Streets travel times decreased by over two minutes to 6
minutes, 16 seconds from 8 minutes, 33 seconds.
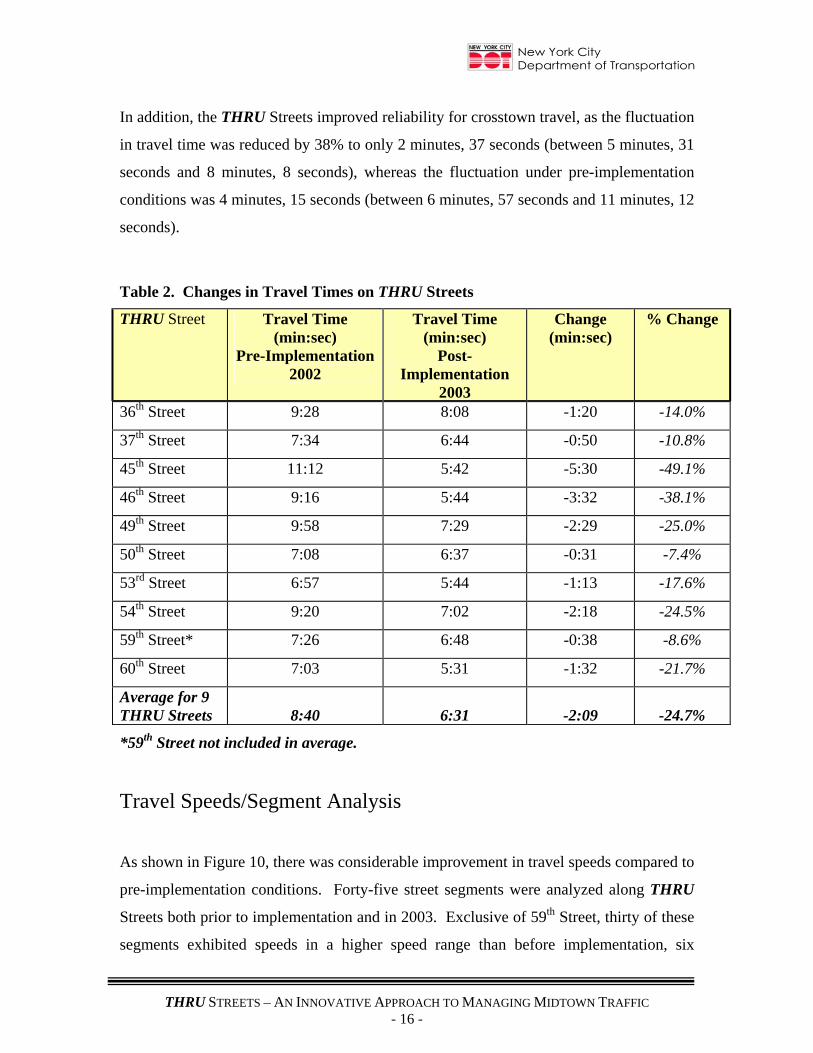
As shown in Table 2, all of the nine THRU Streets exhibited decreases in overall travel
time. The most dramatic decrease was on 45th Street where the travel time savings was
nearly 50% (to 5 minutes, 42 seconds from 11 minutes, 12 seconds). The smallest
improvement was on 50th Street where travel times decreased by 7%.
THRU STREETS – AN INNOVATIVE APPROACH TO MANAGING MIDTOWN TRAFFIC - 16 -
In addition, the THRU Streets improved reliability for crosstown travel, as the fluctuation
in travel time was reduced by 38% to only 2 minutes, 37 seconds (between 5 minutes, 31
seconds and 8 minutes, 8 seconds), whereas the fluctuation under pre-implementation
conditions was 4 minutes, 15 seconds (between 6 minutes, 57 seconds and 11 minutes, 12
seconds).
Table 2. Changes in Travel Times on THRU Streets
THRU Street Travel Time (min:sec)
Pre-Implementation2002
Travel Time (min:sec)
Post-Implementation
2003
Change (min:sec)
% Change
36th Street 9:28 8:08 -1:20 -14.0%
37th Street 7:34 6:44 -0:50 -10.8%
45th Street 11:12 5:42 -5:30 -49.1%
46th Street 9:16 5:44 -3:32 -38.1%
49th Street 9:58 7:29 -2:29 -25.0%
50th Street 7:08 6:37 -0:31 -7.4%
53rd Street 6:57 5:44 -1:13 -17.6%
54th Street 9:20 7:02 -2:18 -24.5%
59th Street* 7:26 6:48 -0:38 -8.6%
60th Street 7:03 5:31 -1:32 -21.7%
Average for 9 THRU Streets
8:40
6:31
-2:09
-24.7%
*59th Street not included in average.
Travel Speeds/Segment Analysis
As shown in Figure 10, there was considerable improvement in travel speeds compared to
pre-implementation conditions. Forty-five street segments were analyzed along THRU
Streets both prior to implementation and in 2003. Exclusive of 59th Street, thirty of these
segments exhibited speeds in a higher speed range than before implementation, six

THRU STREETS – AN INNOVATIVE APPROACH TO MANAGING MIDTOWN TRAFFIC - 17 -
Figure 10
showed speeds in a lower range, and the remaining nine exhibited speeds in the same
range as before implementation.
Table 3. Travel Speeds, by Street Segment
Speed Range
(mph)
Number of Segments
Pre-Implementation, 2002
Number of Segments
Post-Implementation, 2003 2.0 – 2.9 6 0
3.0 – 3.9 15 4
4.0 – 4.9 9 21
5.0 – 6.9 15 14
7.0 – 8.9 0 6

THRU STREETS – AN INNOVATIVE APPROACH TO MANAGING MIDTOWN TRAFFIC - 18 -
In 2003, 41 of 45 segments exhibited speeds above 4.0 mph, a significant improvement
compared to pre-implementation conditions, when only 24 of these 45 segments
exhibited speeds above 4.0 mph. Additionally, six segments displayed speeds above 7.0
mph whereas previously no segments operated above 7.0 mph. There were no segments
exhibiting speeds lower than 3.0 mph, whereas previously there were six such segments.
THRU Streets – Vehicle Volumes
As shown in Figure 11, total hourly vehicle volumes for the nine THRU Streets increased
by nearly 16% to
4,854 vph in 2003
from 4,187 vph prior
to program
implementation.
Volumes on both the
eastbound and
westbound THRU
Streets exhibited
similar percentage
increases (18% and
15%, respectively).
As shown in the Table 4, seven of the nine THRU streets exhibited volume increases.
The only exceptions were 49th Street (a 1% decrease) and 53rd Street (a 10% decrease).
The largest percentage increases were on 37th and 60th Streets, which exhibited increases
of approximately 33% each.
Hourly Vehicle Volumes (vph)Total of 9 THRU Streets (10 AM – 6 PM)36th, 37th, 45th, 46th, 49th, 50th, 53rd, 54th, & 60th Streets
4,1874,464 4,593
4,854
1,000
2,000
3,000
4,000
5,000
6,000 Week before Thanksgivingto
Tree Lighting Week
Height of Holiday Season
Before December 9-202002
Nov 18-Dec 62002
January-October 2003
January-October2003
Figure 11

THRU STREETS – AN INNOVATIVE APPROACH TO MANAGING MIDTOWN TRAFFIC - 19 -
Table 4. Changes in Vehicles per Hour (vph) on THRU Streets
THRU Street Pre-Implementation
2002 Volume (vph)
Post- Implementation
2003 Volume (vph)
Change % Change
36th Street 530 594 +64 +12.1%
37th Street 512 679 +167 +32.6%
45th Street 349 423 +74 +21.2%
46th Street 377 450 +73 +19.4%
49th Street 553 547 -6 -1.1%
50th Street 449 518 +69 +15.4%
53rd Street 501 449 -52 -10.4%
54th Street 373 473 +100 +26.8%
59th Street* 448 642 +194 +43.3%
60th Street 543 722 +179 +33.0%
Total for 9 THRU Streets*
4,187
4,854
+667
+15.9%
*59th Street not included in total.
The concomitant increases in vehicular volume and decreases in travel time demonstrate
the effectiveness of the THRU Streets program. The results indicate that delays and
congestion have been reduced, thereby enabling the street network to process more
vehicles and enabling vehicles to travel more reliably and efficiently.
Accident Reduction
In order to ensure a valid comparison of accident frequency under normal conditions
before and after the program’s implementation, data from January 1 to August 31, 2001
(prior to the events of 9/11/2001) is compared to data from January 1 to August 31, 2003.
As shown in Figure 12, total accidents on the THRU Streets decreased 31%, to 193 from
279, including a reduction of 9% in pedestrian accidents (to 74 from 81), a 39% reduction

THRU STREETS – AN INNOVATIVE APPROACH TO MANAGING MIDTOWN TRAFFIC - 20 -
279
81
168
30
193
74
102
17
0
50
100
150
200
250
300
Before (1/1/01-8/31/01) After (1/1/03-8/31/03)
Total Pedestrian Non-Pedestrian Bikes
THRU StreetsTotal Accidents by Mode
in non-pedestrian accidents (to 102 from 168), and a 43% reduction in accidents
involving bicyclists (to 17 from 30). The most dramatic improvement was on 54th Street,
where total accidents decreased 63% to 18 from 48, pedestrian accidents decreased 73%
to 4 from 15, non-pedestrian accidents decreased 52% to 13 from 27, and bicyclist
accidents decreased 83% to 1 from 6.
As shown in Figure 13, on the non-THRU Streets, total accidents decreased 43%, to 119
from 208. Pedestrian accidents decreased 8%, to 54 from 59. Non-pedestrian accidents
decreased 59%, to 52 from 127. Bicyclist accidents decreased 41%, to 13 from 22.
Figure 12

THRU STREETS – AN INNOVATIVE APPROACH TO MANAGING MIDTOWN TRAFFIC - 21 -
208
59
127
22
119
54 52
13
0
50
100
150
200
250
Before (1/1/01-8/31/01) After (1/1/03-8/31/03)
Total Pedestrian Non-Pedestrian Bikes
Non-THRU StreetsTotal Accidents by Mode
As shown in Figure 14, the split signal phase locations yielded the best overall reductions
in accidents involving pedestrians and bicyclists. Total accidents at these locations
decreased 38%, to 78 from 125. Pedestrian accidents decreased 29%, to 35 from 49.
Non-pedestrian accidents decreased 37%, to 38 from 60. Bicyclist accidents decreased
69%, to 5 from 16.
Figure 13

THRU STREETS – AN INNOVATIVE APPROACH TO MANAGING MIDTOWN TRAFFIC - 22 -
Non-THRU Streets - Travel Times
As shown in Figure 15, average travel times on the six non-THRU Streets (39th, 40th,
47th, 48th, 55th and 56th Streets) improved by 11% (to 7 minutes, 59 seconds from 8
minutes, 57 seconds) as compared to pre-implementation conditions. Both eastbound and
westbound streets exhibited decreases in travel times (8% and 13%, respectively). Four
of the six streets exhibited travel time improvements with 39th, 40th and 47th Streets
exhibiting travel time savings of between 17% and 26%. Travel time increased on 55th
and 56th Streets, by 5% and 2%, respectively. This overall improvement was obtained in
spite of the relaxation in parking regulations that now allows truck loading and unloading
to occur on both sides of the non-THRU Streets. Poor compliance with the No Standing
regulation that previously existed on one side of the non-THRU streets during the pre-
implementation period constrained travel times.
125
49
60
16
78
3538
5
0
20
40
60
80
100
120
140
Before (1/1/01-8/31/01) After (1/1/03-8/31/03)
Total Pedestrian Non-Pedestrian Bikes
Split Signal Phase LocationsTotal Accidents by Mode
Figure 14

THRU STREETS – AN INNOVATIVE APPROACH TO MANAGING MIDTOWN TRAFFIC - 23 -
Average Travel Time (min:sec)6 Non-THRU Streets 3 Eastbound: 40th, 48th, 56th
(10 AM – 6 PM) 3 Westbound: 39th, 47th, 55th
8:57 9:13
12:02
7:59
0:00
2:00
4:00
6:00
8:00
10:00
12:00
14:00 Week before Thanksgiving to
Tree Lighting Week
Height of Holiday Season
Before December 9-202002
Nov 18-Dec 62002
January-October 2003
January-October 2003
Non-THRU Streets – Vehicular Volumes
As shown in Figure 16, the vehicle volumes on the six non-THRU Streets increased
slightly as compared to the pre-implementation period. This could be attributable to the
general improvements to the efficiency of the Midtown street network as the THRU
Streets more clearly managed the specific purpose of individual streets.
Figure 15

THRU STREETS – AN INNOVATIVE APPROACH TO MANAGING MIDTOWN TRAFFIC - 24 -
Hourly Vehicle Volumes (vph)Total of 6 Non-THRU Streets(10 AM – 6 PM) 39th, 40th, 47th, 48th, 55th, & 56th Streets
2,345
2,181 2,198
2,408
500
1,000
1,500
2,000
2,500
3,000 Week before Thanksgivingto
Tree Lighting Week
Height of Holiday Season
Before December 9-202002
Nov 18-Dec 62002
January-October 2003
January-October2003
Motorist Compliance/Turning Restrictions
A primary component of the THRU Streets initiative is turn restrictions. These
restrictions were implemented to reduce conflicts and improve vehicular throughput.
Motorists’ compliance with these regulations is essential in order for the program to be
successful. In the first three weeks of the program there were high levels of enforcement,
and compliance with the prohibition of turns off the THRU Streets was extremely high
(averaging 98% while ranging from 95% to nearly 100%). During 2003, when the level
of enforcement was considerably lower, compliance remained high (averaging 93% and
ranging from 91% to 95%). Prior to the implementation of THRU Streets, an average of
20% of vehicles made turns onto the avenues from these crosstown streets. Under the
THRU Streets program, only 7% of the vehicles are making turns thereby allowing the
THRU Streets to process more vehicles and allowing the crosstown speeds to increase.
Figure 16

THRU STREETS – AN INNOVATIVE APPROACH TO MANAGING MIDTOWN TRAFFIC - 25 -
Split Phasing
Overall, the operation of the split phasing of the traffic signals on the THRU Streets, as
well as those on the non-THRU Streets was very good compared to the pre-
implementation period. More total vehicles, and more turning vehicles, were processed
with nearly non-existent queues. Approximately 6% more total vehicles and 18% more
turning vehicles were processed. Total queued vehicles decreased at each of the five
intersections surveyed with the average number of vehicles in the queues decreasing to
1.6 from 4.6, and the average number of vehicles in the turning queue decreasing to 0.5
from 1.0. In addition, there were fewer instances of illegally parked vehicles standing in
the turning lanes approaching the split signals.
Pedestrian Activity
Significant decreases in pedestrian-vehicle conflicts were found at the split signal
locations. At the eight intersections studied, pedestrian-vehicle conflicts were reduced an
average of 86% after the split phasing was installed. Pedestrian-vehicle conflicts (a
measure of the number of pedestrians crossing when turning motorists had a green
indication) averaged only 1.7 per signal cycle at the split phase locations, compared to the
12.2 conflicts per cycle which existed prior to implementation.
This is especially significant when the pedestrian crossings at the recessed crosswalk
locations are examined. At these locations, an average of 5.4 pedestrians per cycle
continued to go around the pedestrian barriers installed at the corners and cross at the
intersection (where the crosswalk had been removed) rather than walk to the relocated
crosswalk. Overall, the average number of illegal pedestrian crossings was 3.1 per cycle
at the split phase locations, 52% fewer than the 6.4 per cycle at the recessed crosswalk
locations.

THRU STREETS – AN INNOVATIVE APPROACH TO MANAGING MIDTOWN TRAFFIC - 26 -
THRU Streets ProgramCurb Clear Percentage
31 %
45 % 45 %
35 %
0 %
10 %
20 %
30 %
40 %
50 %
60 % Week before Thanksgivingto
Tree Lighting Week
Height of Holiday Season
Before December 9-202002
Nov 18-Dec 62002
January-October 2003
January-October2003
Curb Clear
Prior to implementation, 31% of all block faces on the nine THRU Streets were entirely
free of illegally parked or standing vehicles. During this time, 45th and 54th Streets had a
curb clear rate of zero. As shown in Figure 17, in 2003, curb clear rates improved
slightly (to 35% from 31%), with 37th Street showing the best curb clear rate of 76%.
Conclusions • The THRU Streets program has demonstrated sustained success throughout its
first year of operation. It has:
o reduced travel times,
o increased vehicular capacity,
o improved pedestrian safety.
Figure 17

THRU STREETS – AN INNOVATIVE APPROACH TO MANAGING MIDTOWN TRAFFIC - 27 -
• Appropriate adjustments were successfully made to the program, and any needed
additional adjustments will be made as specific issues arise.
• Based upon extensive monitoring and analysis during the past year, it is
recommended that this program be continued on a permanent basis.
• 59th Street, which was removed as a THRU Street due to a major construction
project, may be re-introduced into the program following completion of the
project.

Appendix I
Project Development

Appendix I Page 1 of 3
Appendix I Project Development
The THRU Streets concept was finalized in early Spring 2002. After consultation with NYPD,
the concept was expanded to include two streets south of 42nd Street – 36th and 37th Streets. In
April 2002, Mayor Michael Bloomberg endorsed the program. A DOT Working Group was
established immediately thereafter to coordinate completion of final design and implementation
of all program elements. The Working Group consisted of representatives from divisions within
the Traffic Bureau (Signals, Parking, Planning, and Signs and Markings) and the Offices of
Construction Mitigation and Coordination, the Manhattan Borough Commissioner and the Chief
of Staff. Resource needs were identified in May 2002 and the program’s design was completed
in July 2002. These program elements included an outreach and implementation schedule,
signage and markings plans, and split phase signal locations.
Street Management Philosophy
The one-way crosstown streets in Midtown have generally been managed using a similar
framework of traffic controls. Typically, the streets are three lanes wide, with one curb lane
dedicated to truck loading and the opposite curb lane reserved for traffic flow. Thus, during
weekdays, two travel lanes are provided. Some special measures for the crosstown streets that
had been instituted in the past include the 49th/50th Street Transitway and PM peak period turn
restrictions off of 59th Street to improve travel to the Queensboro Bridge.
The THRU Streets Program enhances the management of Midtown Manhattan streets. This
traffic management strategy is designed to stabilize the movement of east-west vehicular traffic
in Midtown Manhattan, improve reliability of bus service, enhance conditions for pedestrians at
crosswalks, and expand opportunities for curbside truck loading and unloading. Crosstown
streets are designated for specific functions – THRU Streets to facilitate the movement of
crosstown traffic, non-THRU Streets for localized traffic circulation and expanded goods
delivery.

Appendix I Page 2 of 3
Curbside Regulations
For the THRU Streets, curbside regulations were generally unchanged with “No Standing” on
one side and truck loading and unloading on the opposite side. On non-THRU Streets between
42nd and 60th Streets, additional truck loading regulations and Multi-space Muni-meters were
installed to permit commercial vehicle parking on both sides of the street for a majority of the
blocks. This change created up to 150 additional truck loading spaces.
Enforcement
The enforcement component of the program was a joint effort of DOT and NYPD. The program
- especially at its outset - required a strong enforcement presence. NYPD deployed 152 officers
on THRU Streets for intersection control and parking enforcement. Most of the intersection
control agents were removed on October 31, 2002. DOT deployed 50 parking enforcement
agents (two overlapping tours of 25) to enforce curbside regulations and five construction
inspectors to monitor building construction and street openings. These additional resources were
removed after January 10th.
Meetings with Stakeholders
As many businesses, citizens and community groups would be affected by the significant change
in traffic patterns, turn restrictions and curbside regulations, meetings were convened with
project stakeholders. The Manhattan Borough Commissioner’s Office served as the liaison
between the Department and these groups. Most of these meetings were held prior to
implementation of the program and follow-up meetings were held with concerned groups after
program implementation. These groups included:
US Postal Service General Contractors Association Parking Garage Operators Hotel Association of New York Taxi Industry Representatives Rockefeller Center Local Elected Officials Transportation Advocacy Groups Business Improvement Districts Messenger/Courier Association Sloan-Kettering Memorial Hospital Trucking Industry (UPS, FedEx, etc.) Community Boards 5, 6 and 8 Messenger/Courier Association
Appendix I Page 3 of 3
In addition, coordination meetings were held with government agencies including the New York
City Department of Sanitation, the New York City Department of Business Services, the
Mayor’s Community Assistance Unit, the Taxi and Limousine Commission, and MTA/New
York City Transit.
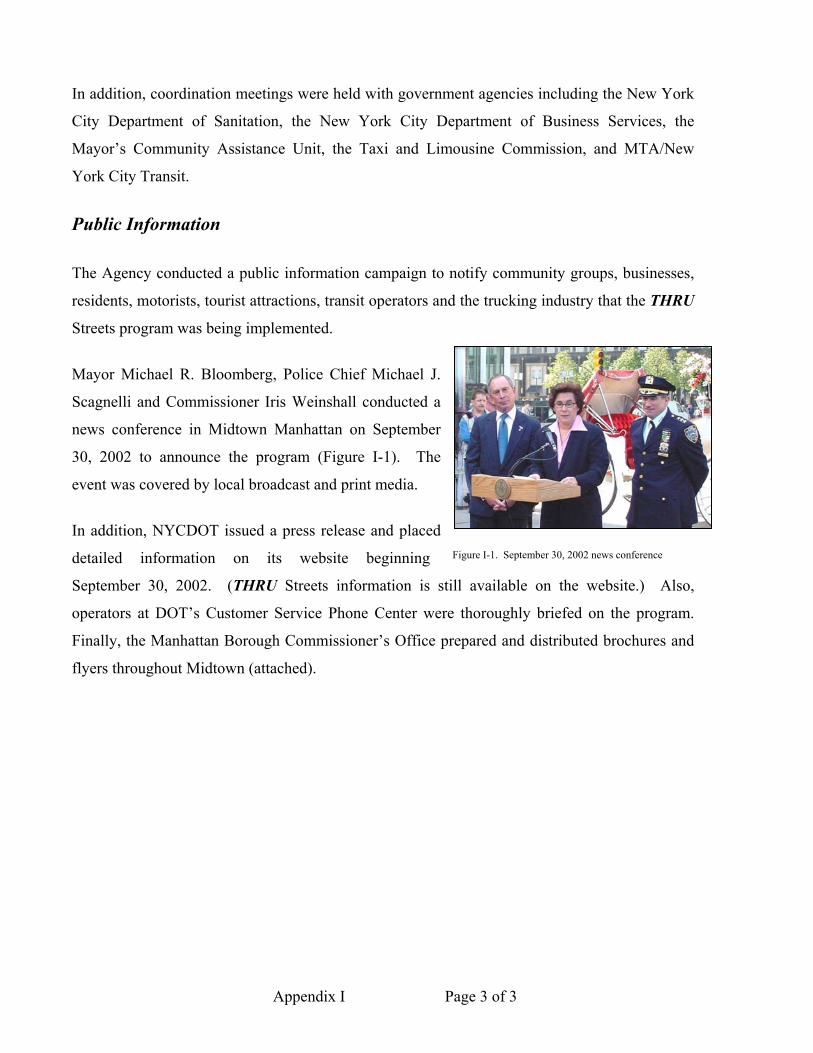
Public Information
The Agency conducted a public information campaign to notify community groups, businesses,
residents, motorists, tourist attractions, transit operators and the trucking industry that the THRU
Streets program was being implemented.
Mayor Michael R. Bloomberg, Police Chief Michael J.
Scagnelli and Commissioner Iris Weinshall conducted a
news conference in Midtown Manhattan on September
30, 2002 to announce the program (Figure I-1). The
event was covered by local broadcast and print media.
In addition, NYCDOT issued a press release and placed
detailed information on its website beginning
September 30, 2002. (THRU Streets information is still available on the website.) Also,
operators at DOT’s Customer Service Phone Center were thoroughly briefed on the program.
Finally, the Manhattan Borough Commissioner’s Office prepared and distributed brochures and
flyers throughout Midtown (attached).
Figure 10. September 30, 2002 news conference Figure 10. September 30, 2002 news conference Figure I-1. September 30, 2002 news conference

Midtown Thru Streets
InitiativeTurns now
prohibited between 3rd and 6th Avenue
off of the following streets:
• 36th and 37th Streets
• 45th and 46th Streets
• 49th and 50th Streets
• 53rd and 54th Streets
• 59th and 60th Streets
Weekdays 10AM - 6PM
New York CityDepartment of Transportation
New York CityTaxi and Limousine Commission
DOT NEW YORK CITY
For more information please visit DOT’s Website atwww.nyc.gov/calldot or dial 212/718 CALLDOT (225-5368)
or
Call the TLC’s customer service hotline 212-NYC-TAXI
or visit TLC’s Website atwww.nyc.gov/taxi

Thru Streets are part of a new City initiative to improve the flow oftraffic on congested midtown roads.
Turns will be prohibited off of these streets from 10AM to 6PM on weekdays only.
While some trips may be quicker, others may be extended inorder to reach your destination.
Midtown Thru Streets Program
On September 30, 2002, MayorBloomberg and representativesf r o m t h e D e p a r t m e n t o fTransportat ion and the Pol iceDepartment announced ThruStreets, a new traffic mitigation plan in Midtown that seeks to makecross-town travel more reliable forvehicles and improve street safetyfor pedestrians.
The plan designates five pairs ofstreets between 34th Street and60th Street as Thru Streets. Thesepairs of streets are 36th Street and37th Street, 45th Street and 46thStreet, 49th Street and 50th Street,53rd Street and 54th Street, 59thStreet and 60th Street.
Starting on October 15th, regu-lations will prohibit turns from ThruSt reets between 3rd and 6thAvenues on weekdays betweenthe hours of 10 am and 6 pm, with afew exceptions.
The no-turn regulations will providean incentive to drivers who seek areliable route across town.

Midtown Thru Streets InitiativeTurns now prohibited between
3rd and 6th Avenue off of the following streets:
• 36th and 37th Streets• 45th and 46th Streets• 49th and 50th Streets• 53rd and 54th Streets• 59th and 60th Streets
Thru Streets seek tomake cross-town travel more reliable for vehicles andimprove street safety for pedestrians.
Got a transportation problem/question/complaint? Dial 212 or 718 Visit DOT's Website at www.nyc.gov/calldot
TTY Deaf or Hearing-Impaired, Dial 212/442-9488CALL
DOT* 2 2 5 - 5 3 6 8
New York CityDepartment of Transportation
New York CityPolice Department
DOT NEW YORK CITY
Thru Streets are part of a new City pilot initiative to improve the flow of trafficon congested midtown roads.
No-turn regulations will provide an incentive to drivers who seek a reliableroute across town.
Turns will be prohibited off of these streets from 10AM to 6PM on weekdaysonly, starting October 15, 2002.

Appendix II
Manhattan THRU StreetsTravel Times

Average Travel Time (min:sec)36th Street (eastbound)(10 AM – 6 PM)
9:28
8:19
9:41
8:08
0:00
2:00
4:00
6:00
8:00
10:00
12:00 Week before Thanksgiving to
Tree Lighting Week
Height of Holiday Season
Before December 9-202002
Nov 18-Dec 62002
January-October 2003
January-October 2003

Average Travel Time (min:sec)37th Street (westbound)(10 AM – 6 PM)
7:34
6:20
8:44
6:44
0:00
2:00
4:00
6:00
8:00
10:00
12:00 Week before Thanksgiving to
Tree Lighting Week
Height of Holiday Season
Before December 9-202002
Nov 18-Dec 62002
January-October 2003
January-October 2003
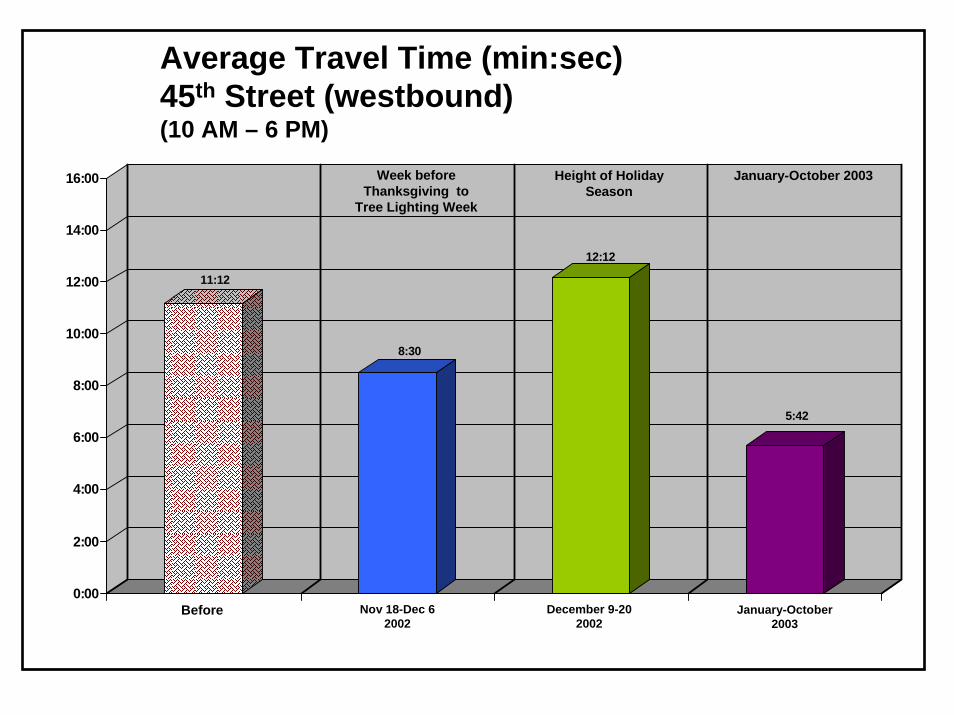
Average Travel Time (min:sec)45th Street (westbound)(10 AM – 6 PM)
11:12
8:30
12:12
5:42
0:00
2:00
4:00
6:00
8:00
10:00
12:00
14:00
16:00 Week before Thanksgiving to
Tree Lighting Week
Height of Holiday Season
Before December 9-202002
Nov 18-Dec 62002
January-October 2003
January-October 2003

Average Travel Time (min:sec)46th Street (eastbound)(10 AM – 6 PM)
9:16
5:436:34
5:44
0:00
2:00
4:00
6:00
8:00
10:00
12:00 Week before Thanksgiving to
Tree Lighting Week
Height of Holiday Season
Before December 9-202002
Nov 18-Dec 62002
January-October 2003
January-October 2003

Average Travel Time (min:sec)49th Street (westbound)(10 AM – 6 PM)
9:58
8:11
10:19
7:29
0:00
2:00
4:00
6:00
8:00
10:00
12:00
14:00 Week before Thanksgiving to
Tree Lighting Week
Height of Holiday Season
Before December 9-202002
Nov 18-Dec 62002
January-October 2003
January-October 2003
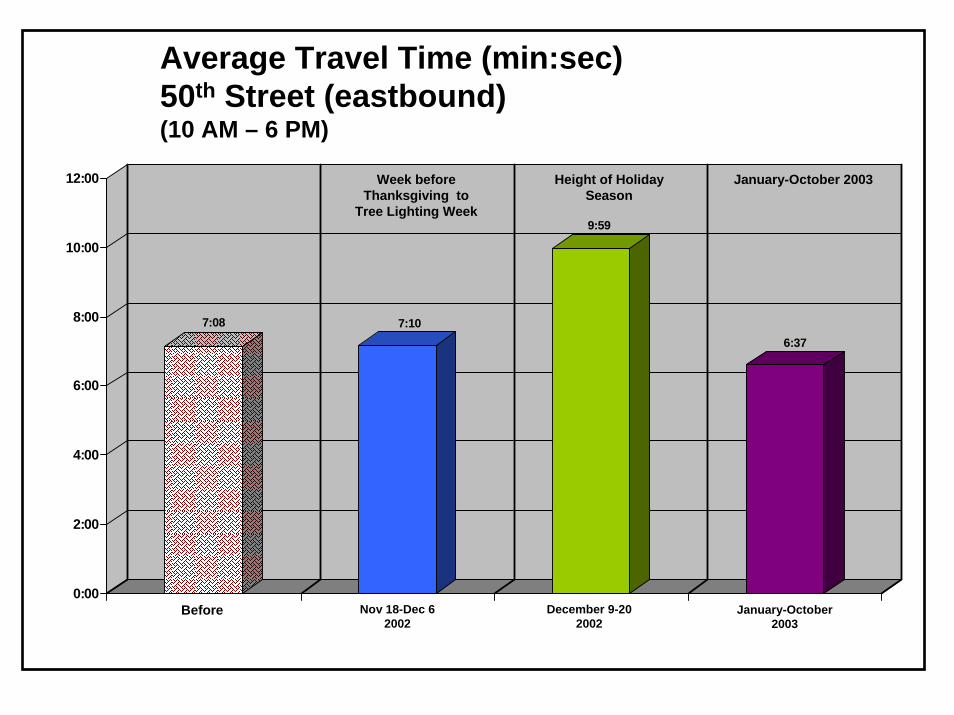
Average Travel Time (min:sec)50th Street (eastbound)(10 AM – 6 PM)
7:08 7:10
9:59
6:37
0:00
2:00
4:00
6:00
8:00
10:00
12:00 Week before Thanksgiving to
Tree Lighting Week
Height of Holiday Season
Before December 9-202002
Nov 18-Dec 62002
January-October 2003
January-October 2003
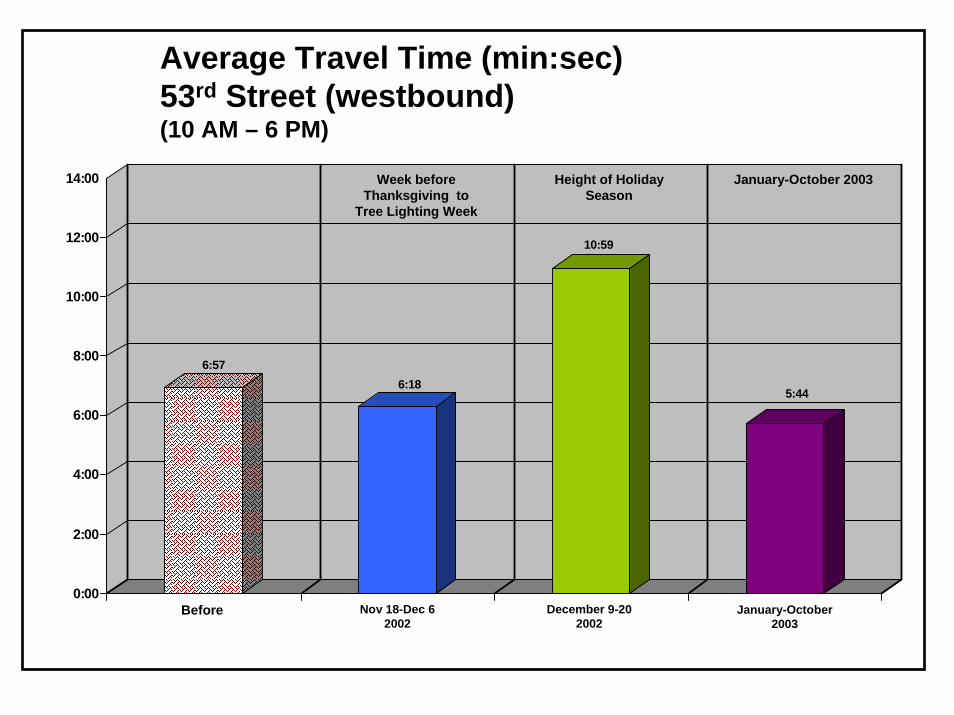
Average Travel Time (min:sec)53rd Street (westbound)(10 AM – 6 PM)
6:576:18
10:59
5:44
0:00
2:00
4:00
6:00
8:00
10:00
12:00
14:00 Week before Thanksgiving to
Tree Lighting Week
Height of Holiday Season
Before December 9-202002
Nov 18-Dec 62002
January-October 2003
January-October 2003
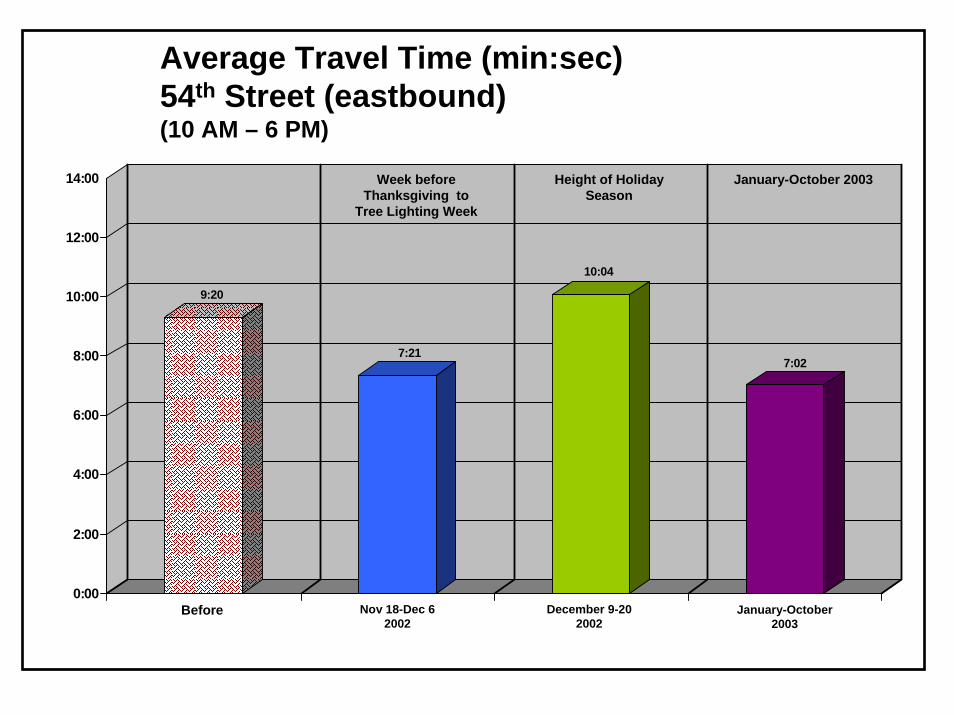
Average Travel Time (min:sec)54th Street (eastbound)(10 AM – 6 PM)
9:20
7:21
10:04
7:02
0:00
2:00
4:00
6:00
8:00
10:00
12:00
14:00 Week before Thanksgiving to
Tree Lighting Week
Height of Holiday Season
Before December 9-202002
Nov 18-Dec 62002
January-October 2003
January-October 2003

Average Travel Time (min:sec)59th Street (eastbound)(10 AM – 6 PM)
7:26 7:14 7:22
6:48
0:00
2:00
4:00
6:00
8:00
10:00 Week before Thanksgiving to
Tree Lighting Week
Height of Holiday Season
Before December 9-202002
Nov 18-Dec 62002
January-October 2003
January-October 2003
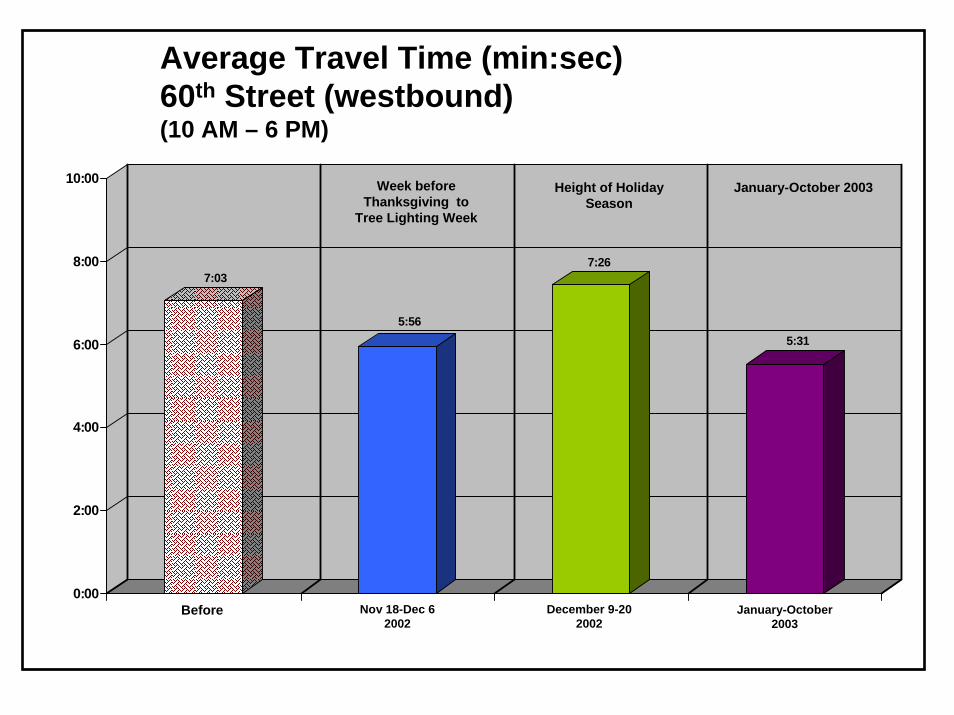
Average Travel Time (min:sec)60th Street (westbound)(10 AM – 6 PM)
7:03
5:56
7:26
5:31
0:00
2:00
4:00
6:00
8:00
10:00 Week before Thanksgiving to
Tree Lighting Week
Height of Holiday Season
Before December 9-202002
Nov 18-Dec 62002
January-October 2003
January-October 2003

Average Travel Time (min:sec)4 Eastbound THRU Streets(10 AM – 6 PM) 36th, 46th, 50th, & 54th Streets
8:48
6:59
9:05
6:49
0:00
2:00
4:00
6:00
8:00
10:00
12:00 Week before Thanksgiving to
Tree Lighting Week
Height of Holiday Season
Before December 9-202002
Nov 18-Dec 62002
January-October 2003
January-October 2003

Average Travel Time (min:sec)5 Westbound THRU Streets(10 AM – 6 PM) 37th, 45th, 49th, 53rd, & 60th Streets
8:33
7:04
9:59
6:16
0:00
2:00
4:00
6:00
8:00
10:00
12:00 Week before Thanksgiving to
Tree Lighting Week
Height of Holiday Season
Before December 9-202002
Nov 18-Dec 62002
January-October 2003
January-October 2003

Average Travel Time (min:sec)9 THRU Streets 4 Eastbound: 36th, 46th, 50th, 54th(10 AM – 6 PM) 5 Westbound: 37th, 45th, 49th, 53rd, 60th
8:40
7:02
9:35
6:31
0:00
2:00
4:00
6:00
8:00
10:00
12:00 Week before Thanksgiving to
Tree Lighting Week
Height of Holiday Season
Before December 9-202002
Nov 18-Dec 62002
January-October 2003
January-October 2003

Appendix III
Manhattan THRU StreetsVehicle Volumes

Average Hourly Vehicle Volumes (vph)36th Street (eastbound)(10 AM – 6 PM)
530561
611 594
100
200
300
400
500
600
700
800 Week before Thanksgivingto
Tree Lighting Week
Height of Holiday Season
Before December 9-202002
Nov 18-Dec 62002
January-October 2003
January-October2003

THRU StreetsTotal Accidents by Mode
279
81
168
30
193
74
102
17
0
50
100
150
200
250
300
Before (1/1/01-8/31/01) After (1/1/03-8/31/03)
Total Pedestrian Non-Pedestrian Bikes

Average Hourly Vehicle Volumes (vph)37th Street (westbound)(10 AM – 6 PM)
512
617643
679
100
200
300
400
500
600
700
800 Week before Thanksgivingto
Tree Lighting Week
Height of Holiday Season
Before December 9-202002
Nov 18-Dec 62002
January-October 2003
January-October2003

Average Hourly Vehicle Volumes (vph)45th Street (westbound)(10 AM – 6 PM)
349378
362
423
100
200
300
400
500
600 Week before Thanksgivingto
Tree Lighting Week
Height of Holiday Season
Before December 9-202002
Nov 18-Dec 62002
January-October 2003
January-October2003

Average Hourly Vehicle Volumes (vph)46th Street (eastbound)(10 AM – 6 PM)
377
416442 450
100
200
300
400
500
600 Week before Thanksgivingto
Tree Lighting Week
Height of Holiday Season
Before December 9-202002
Nov 18-Dec 62002
January-October 2003
January-October2003

Average Hourly Vehicle Volumes (vph)49th Street (westbound)(10 AM – 6 PM)
553 545
591
547
100
200
300
400
500
600
700
800 Week before Thanksgivingto
Tree Lighting Week
Height of Holiday Season
Before December 9-202002
Nov 18-Dec 62002
January-October 2003
January-October2003
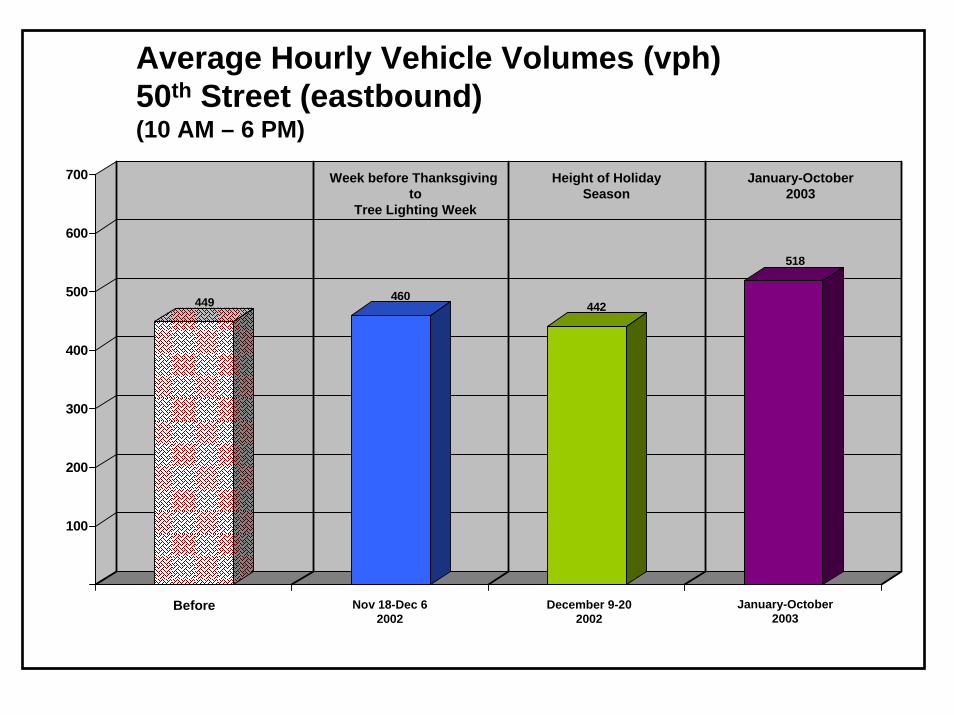
Average Hourly Vehicle Volumes (vph)50th Street (eastbound)(10 AM – 6 PM)
449 460442
518
100
200
300
400
500
600
700 Week before Thanksgivingto
Tree Lighting Week
Height of Holiday Season
Before December 9-202002
Nov 18-Dec 62002
January-October 2003
January-October2003
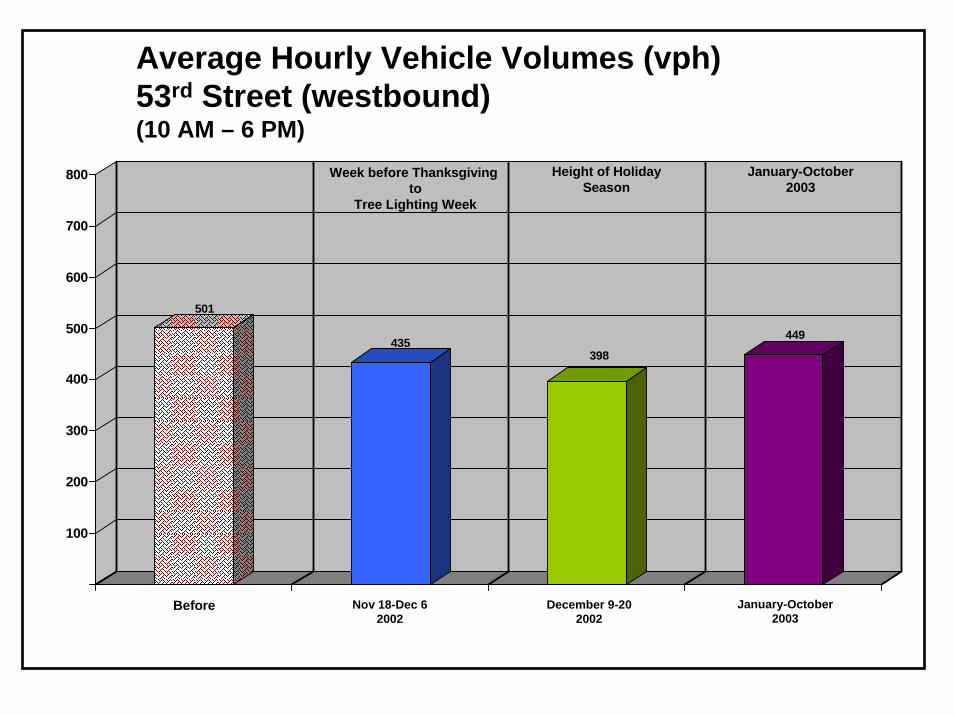
Average Hourly Vehicle Volumes (vph)53rd Street (westbound)(10 AM – 6 PM)
501
435398
449
100
200
300
400
500
600
700
800 Week before Thanksgivingto
Tree Lighting Week
Height of Holiday Season
Before December 9-202002
Nov 18-Dec 62002
January-October 2003
January-October2003

Average Hourly Vehicle Volumes (vph)54th Street (eastbound)(10 AM – 6 PM)
373404 403
473
100
200
300
400
500
600 Week before Thanksgivingto
Tree Lighting Week
Height of Holiday Season
Before December 9-202002
Nov 18-Dec 62002
January-October 2003
January-October2003

Average Hourly Vehicle Volumes (vph)59th Street (eastbound)(10 AM – 6 PM)
448
533 530
642
100
200
300
400
500
600
700
800 Week before Thanksgivingto
Tree Lighting Week
Height of Holiday Season
Before December 9-202002
Nov 18-Dec 62002
January-October 2003
January-October2003

Average Hourly Vehicle Volumes (vph)60th Street (westbound)(10 AM – 6 PM)
543
664
712 722
100
200
300
400
500
600
700
800
900Week before Thanksgiving
toTree Lighting Week
Height of Holiday Season
Before December 9-202002
Nov 18-Dec 62002
January-October 2003
January-October2003

Hourly Vehicle Volumes (vph)Average of 4 Eastbound THRU Streets(10 AM – 6 PM) 36th, 46th, 50th, & 54th Streets
433457
475509
100
200
300
400
500
600
700 Week before Thanksgivingto
Tree Lighting Week
Height of Holiday Season
Before December 9-202002
Nov 18-Dec 62002
January-October 2003
January-October2003

Hourly Vehicle Volumes (vph)Average of 5 Westbound THRU Streets(10 AM – 6 PM) 37th, 45th, 49th, 53rd, & 60th Streets
492528 539
564
100
200
300
400
500
600
700
800 Week before Thanksgivingto
Tree Lighting Week
Height of Holiday Season
Before December 9-202002
Nov 18-Dec 62002
January-October 2003
January-October2003

Hourly Vehicle Volumes (vph)Average of 9 THRU Streets (10 AM – 6 PM) 36th, 37th, 45th, 46th, 49th, 50th, 53rd, 54th, & 60th Streets
465
497 509539
100
200
300
400
500
600
700 Week before Thanksgivingto
Tree Lighting Week
Height of Holiday Season
Before December 9-202002
Nov 18-Dec 62002
January-October 2003
January-October2003
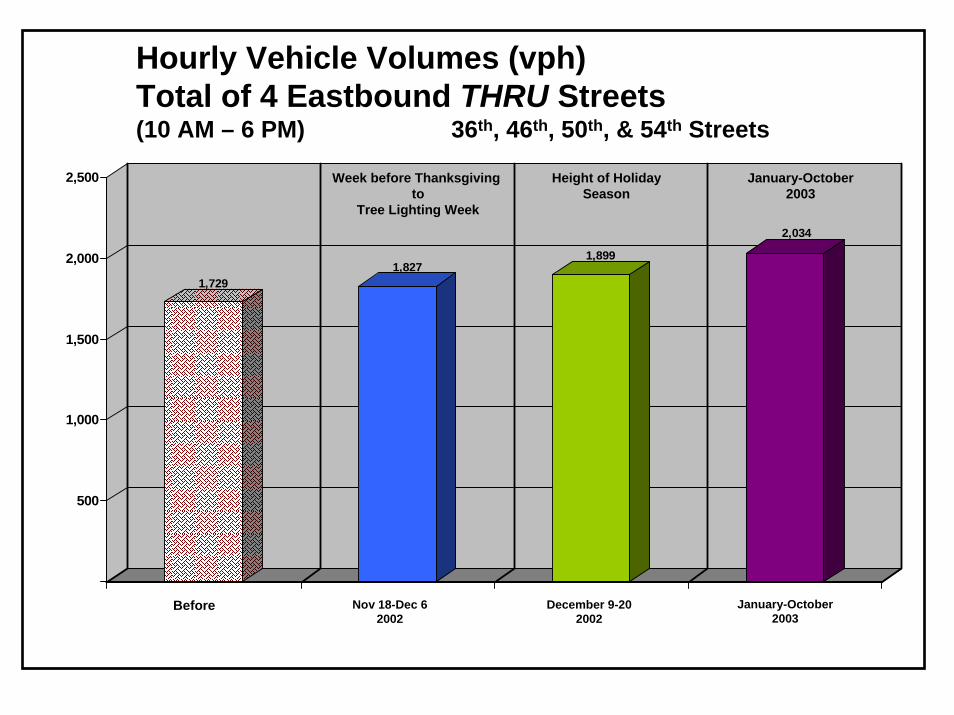
Hourly Vehicle Volumes (vph)Total of 4 Eastbound THRU Streets(10 AM – 6 PM) 36th, 46th, 50th, & 54th Streets
1,7291,827
1,899
2,034
500
1,000
1,500
2,000
2,500 Week before Thanksgivingto
Tree Lighting Week
Height of Holiday Season
Before December 9-202002
Nov 18-Dec 62002
January-October 2003
January-October2003

Hourly Vehicle Volumes (vph)Total of 5 Westbound THRU Streets(10 AM – 6 PM) 37th, 45th, 49th, 53rd, & 60th Streets
2,4582,638 2,695
2,820
500
1,000
1,500
2,000
2,500
3,000
3,500 Week before Thanksgivingto
Tree Lighting Week
Height of Holiday Season
Before December 9-202002
Nov 18-Dec 62002
January-October 2003
January-October2003

Hourly Vehicle Volumes (vph)Total of 9 THRU Streets (10 AM – 6 PM)36th, 37th, 45th, 46th, 49th, 50th, 53rd, 54th, & 60th Streets
4,1874,464 4,593
4,854
1,000
2,000
3,000
4,000
5,000
6,000 Week before Thanksgivingto
Tree Lighting Week
Height of Holiday Season
Before December 9-202002
Nov 18-Dec 62002
January-October 2003
January-October2003

Appendix IV
Manhattan non-THRU StreetsTravel Times
andVehicle Volumes
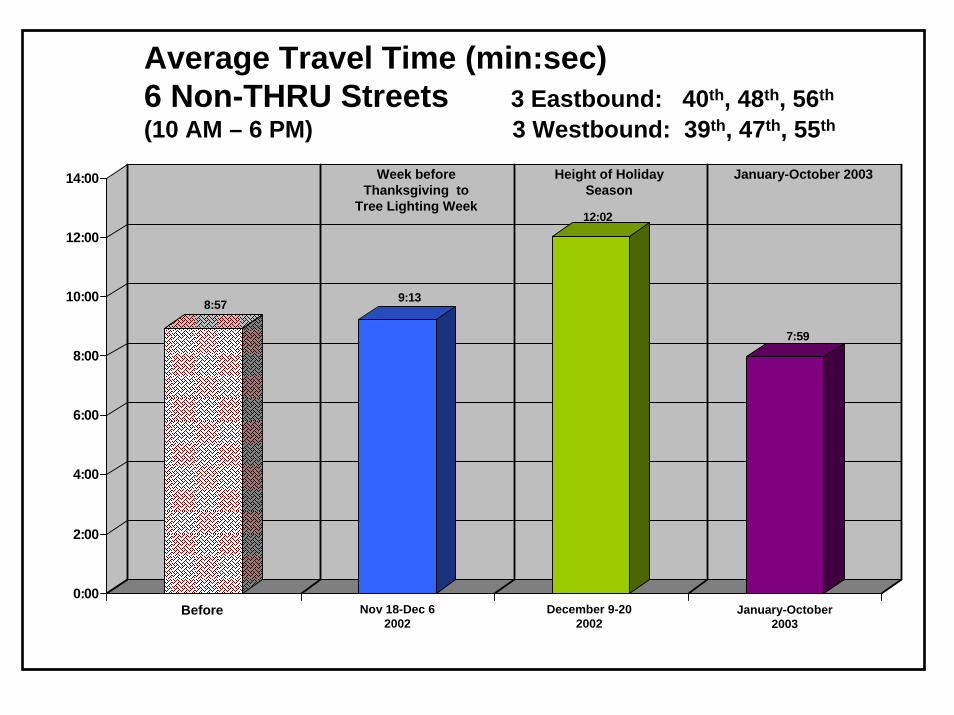
Average Travel Time (min:sec)6 Non-THRU Streets 3 Eastbound: 40th, 48th, 56th
(10 AM – 6 PM) 3 Westbound: 39th, 47th, 55th
8:57 9:13
12:02
7:59
0:00
2:00
4:00
6:00
8:00
10:00
12:00
14:00 Week before Thanksgiving to
Tree Lighting Week
Height of Holiday Season
Before December 9-202002
Nov 18-Dec 62002
January-October 2003
January-October 2003

Hourly Vehicle Volumes (vph)Total of 6 Non-THRU Streets(10 AM – 6 PM) 39th, 40th, 47th, 48th, 55th, & 56th Streets
2,345
2,181 2,198
2,408
500
1,000
1,500
2,000
2,500
3,000 Week before Thanksgivingto
Tree Lighting Week
Height of Holiday Season
Before December 9-202002
Nov 18-Dec 62002
January-October 2003
January-October2003