three-dimensional ultrasound imaging - semantic … ultrasound imaging ... benefited from major...
TRANSCRIPT
INSTITUTE OF PHYSICS PUBLISHING PHYSICS IN MEDICINE AND BIOLOGY
Phys. Med. Biol. 46 (2001) R67–R99 www.iop.org/Journals/pb PII: S0031-9155(01)12089-0
TOPICAL REVIEW
Three-dimensional ultrasound imaging
Aaron Fenster1, Donal B Downey and H Neale Cardinal
The John P Robarts Research Institute, London, Canadaand the Department of Diagnostic Radiology and Nuclear Medicine,The University of Western Ontario, London, Canada
E-mail: [email protected]
Received 6 November 2000
AbstractUltrasound is an inexpensive and widely used imaging modality for thediagnosis and staging of a number of diseases. In the past two decades, it hasbenefited from major advances in technology and has become an indispensableimaging modality, due to its flexibility and non-invasive character. In thelast decade, research investigators and commercial companies have furtheradvanced ultrasound imaging with the development of 3D ultrasound. Thisnew imaging approach is rapidly achieving widespread use with numerousapplications.
The major reason for the increase in the use of 3D ultrasound is related to thelimitations of 2D viewing of 3D anatomy, using conventional ultrasound. Thisoccurs because: (a) Conventional ultrasound images are 2D, yet the anatomyis 3D, hence the diagnostician must integrate multiple images in his mind.This practice is inefficient, and may lead to variability and incorrect diagnoses.(b) The 2D ultrasound image represents a thin plane at some arbitrary angle inthe body. It is difficult to localize the image plane and reproduce it at a latertime for follow-up studies.
In this review article we describe how 3D ultrasound imaging overcomesthese limitations. Specifically, we describe the developments of a numberof 3D ultrasound imaging systems using mechanical, free-hand and 2D arrayscanning techniques. Reconstruction and viewing methods of the 3D imagesare described with specific examples. Since 3D ultrasound is used to quantifythe volume of organs and pathology, the sources of errors in the reconstructiontechniques as well as formulae relating design specification to geometric errorsare provided. Finally, methods to measure organ volume from the 3D ultrasoundimages and sources of errors are described.
1 Address for correspondence: The J P Robarts Research Institute, Imaging Research Laboratories, 100 Perth Drive,London, Ontario, Canada N6A 5K8.
0031-9155/01/050067+33$30.00 © 2001 IOP Publishing Ltd Printed in the UK R67

R68 A Fenster et al
1. Introduction
For most of the last century, medical imaging has involved visualizing the interior structures ofthe human body with two-dimensional (2D) x-ray images. Although 2D x-ray imaging remainsan indispensable imaging modality, it has the disadvantage that almost all three-dimensional(3D) information about the interior of the human body is lost to the physician. In the early1970s, the introduction of computed tomography (CT) revolutionized diagnostic radiologyby providing, for the first time, true 3D anatomical information to the physician. At firstthis information was simply presented as a series of contiguous 2D image slices of the body.However, the advent of 3D images from CT, and later magnetic resonance imaging (MRI),provided a major impetus to the field of 3D visualization, which has lead to the development ofa wide variety of applications in diagnostic medicine (Fishman et al 1991, Robb and Barillot1989, Vannier et al 1984).
Although the origins of medical ultrasound imaging can be traced back half a century tothe pioneering work of Wild and Reid (1952), progress was slow for the first three decades,and, outside of research laboratories, medical ultrasound was largely limited to applications incardiology, obstetrics, and gynaecology. However, in the past two decades, medical ultrasoundhas benefited from major advances in technology and has become an indispensable imagingmodality, due to its flexibility and non-invasive character. Moreover, due to continuousimprovements in image quality, and the availability of blood flow information via the Dopplereffect, ultrasonography is progressively achieving a greater role in radiology and cardiology,and is finding new roles in image-guided surgery and therapy.
In the last decade, research investigators and commercial companies have further advancedultrasound imaging by combining these advances in ultrasound image quality with recentadvances in 3D image visualization, to develop 3D ultrasound imaging. This review articlediscusses this new imaging modality, which is rapidly achieving widespread application inmedical imaging.
2. Limitations of ultrasonography addressed by 3D imaging
In a conventional ultrasound examination, the ultrasound transducer is manipulated to obtaina series of 2D ultrasound images, which are mentally combined by the operator to form asubjective impression of the 3D anatomy and pathology. The success of the diagnostic orinterventional procedure is thus largely dependent on the skill and experience of the operatorin performing these tasks. This is a suboptimal approach, due to the following limitations:
• Mentally transforming multiple 2D images to form a 3D impression of the anatomy andpathology is not only time-consuming and inefficient, but is also more importantly, variableand subjective, which can lead to incorrect decisions in diagnosis, and in the planning anddelivery of therapy.
• Diagnostic (e.g. obstetric) and therapeutic (e.g. staging and planning) decisions oftenrequire accurate estimation of organ or tumour volume. Conventional 2D ultrasoundtechniques calculate volume from simple measurements of height, width and length intwo orthogonal views, by assuming an idealized (e.g. ellipsoidal) shape. This practice canpotentially lead to low accuracy, high variability and operator dependency.
• Conventional 2D ultrasound is suboptimal for monitoring therapeutic procedures, or forperforming quantitative prospective or follow-up studies, due to the difficulty in adjustingthe transducer position so that the 2D image plane is at the same anatomical site and inthe same orientation as in a previous examination.

Three-dimensional ultrasound imaging R69
• Because the location and orientation of conventional 2D ultrasound images are determinedby those of the transducer, some views are impossible to achieve because of restrictionsimposed by the patient’s anatomy or position.
In a 3D ultrasound examination, the 2D ultrasound images are combined by a computerto form an objective 3D image of the anatomy and pathology. This image can then be viewed,manipulated and measured in 3D by the physician on the same or another computer. Also,a 2D cross-sectional image can be generated in any orientation, without restriction, at anyanatomical site, which may easily be registered with a previous or subsequent 3D image.Thus, 3D ultrasound imaging promises to overcome the limitations of 2D ultrasound imagingdescribed above.
Moreover, unlike CT and MR imaging, in which 2D images are usually acquired at a slowrate as a stack of parallel slices, in a fixed orientation, ultrasound provides tomographic imagesat a high rate (15–60 s−1), and in arbitrary orientations. The high acquisition rate and arbitraryorientation of the images provide unique problems to overcome and opportunities to exploitin extending 2D ultrasound imaging to 3D and dynamic 3D (i.e. 4D) visualization.
Over the past two decades, many investigators have attempted to develop 3D ultrasoundimaging techniques (Brinkley et al 1982, Fenster and Downey 1996, Ghosh et al 1982,Greenleaf et al 1993, King et al 1993, Nelson and Pretorius 1992, Rankin et al 1993).However, progress has been slow due to the enormous computational requirements whichmust be met in order to acquire, reconstruct and view 3D information in near real time onlow-cost systems. Advances in low-cost computer technology and visualization techniques inthe past few years have made 3D ultrasound imaging viable. A number of laboratories haveled the way in demonstrating the feasibility of 3D ultrasound imaging and, more recently,commercial companies have begun to provide these options on their ultrasound equipment. Afew review articles and two books describing the development of 3D ultrasound imaging havebeen published in the past few years (Fenster and Downey 1996, Greenleaf et al 1993, Rankinet al 1993, Belohlavek et al 1993, Fenster 1998, Ofili and Nanda 1994, Nelson et al 1999,Nelson and Pretorius 1998, Baba and Jurkovic 1997, De Castro et al 1998). In this review wesummarize the various approaches that have been used in the development of 3D ultrasoundimaging systems, with particular emphasis on the quantitative aspects of geometric accuracy inviewing the anatomy in 3D and in measuring anatomical volumes with 3D ultrasound imaging.
3. 3D ultrasound scanning techniques
Most 3D ultrasound imaging systems make use of conventional 1D ultrasound transducers toacquire a series of 2D ultrasound images, and differ only in the method used to determine theposition and orientation of these 2D images within the 3D image volume being examined. Theproduction of 3D images without distortions requires that three factors be optimized:
• The scanning technique must be either rapid or gated, to avoid image artefacts due toinvoluntary, respiratory or cardiac motion.
• The locations and orientations of the acquired 2D images must be accurately known, toavoid geometric distortions in the 3D image that would lead to measurement errors.
• The scanning apparatus must be simple and convenient to use, so that the scan isnot complicated or awkward to perform and hence easily included in the examinationprocedure.
Over the past two decades, four different 3D ultrasound imaging approaches havebeen pursued: mechanical scanners, free-hand techniques with position sensing, free-hand

R70 A Fenster et al
Table 1. Summary of 3D scanning methods, acquisition methods of images used to produce the3D image, and the major disadvantages of the scanning methods.
Scanning method Image acquisition method Disadvantages
MechanicalLinear Acquired images are parallel to Bulky device
each other with equal spacingTilt Acquired images are fan-like with Resolution degrades with depth
equal angular spacingRotational Acquired images are propeller-like Motion of axis of rotation
with equal angular spacing results in artefacts
Free-HandAcoustic Measure time-of-flight of sound Line of sight required and sound
from spark gaps on transducer to velocity varies with humiditymicrophones above patient
Articulated arms Measure angulation between Scanning volume limited, flexingmovable arms of arms
Magnetic sensor Measure magnetic field generated Ferrous metals distort magneticby transmitter beside the patient fieldwith receiver on transducer
Image correlation Measure speckle decorrelation Special computer processorbetween adjacent images required, compound motion is
difficult to trackNo position sensing Distance or angle between images Cannot measure distance
is assumed
2D arrays 2D phased array transmits a System cost and signal/noisediverging pyramidal beam andreturned echoes are displayed inreal time as multiple planes
techniques without position sensing and 2D arrays. These approaches are summarized intable 1 and are discussed below.
3.1. Mechanical scanners
In this approach, the anatomy is scanned by using a motorized mechanical apparatus to translate,tilt or rotate a conventional transducer as it rapidly acquires a series of 2D ultrasound imagesspanning the volume of interest, which are recorded by a computer. Because the scanningprotocol is predefined and precisely controlled, the relative position and orientation of each2D image can be known accurately.
Using current computer technology, the acquired 2D images may either be stored in theiroriginal digital format in the ultrasound system’s computer memory, or the analogue videooutput from the ultrasound machine may be digitized and stored in an external computermemory. The reconstruction and viewing of the 3D image can then be carried out either inthe ultrasound machine’s computer or in an external computer, using the predefined geometricparameters that describe the orientation and position of each 2D image within the 3D imagevolume. Usually, the angular or spatial interval between successive 2D images is madeadjustable, so that it can be optimized to minimize the scanning time while still adequatelysampling the volume (Smith and Fenster 2000).
Various kinds of scanning apparatus have been developed to translate or rotate theconventional transducer in the required manner. These vary in size from small integrated 3D

Three-dimensional ultrasound imaging R71
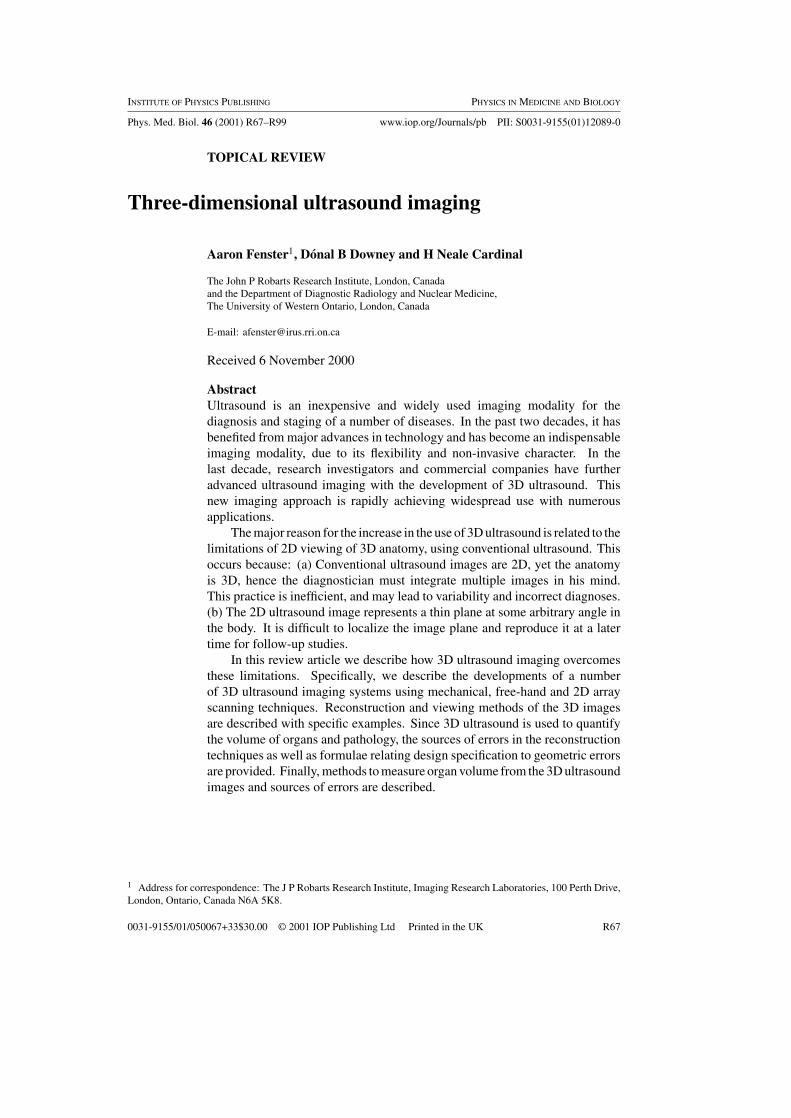
Figure 1. Schematic diagrams showing the four mechanical scanning approaches. (a) Linearscanning approach, in which a series of parallel 2D images are collected and used to reconstructthe 3D image. (b) Tilt scanning approach, in which a series of 2D images are collected as thetransducer is tilted and then reconstructed into a 3D image. (c) Tilt scanning approach used witha side-firing transrectal (TRUS) transducer to produce 3D images of the prostate. (d) Rotationalscanning approach used with a end-firing endocavity transducer in gynaecological and urologicalimaging.
probes that house the scanning mechanism within the transducer housing, to external fixturesthat mechanically hold the housing of a conventional ultrasound probe.
Although the integrated 3D probes are larger and heavier than conventional probes, theyare usually easy for the operator to use. However, they require the purchase of a specialultrasound machine that can interface with them. On the other hand, while external fixturesare generally bulkier than integrated probes they can be adapted to hold the transducer ofany conventional ultrasound machine, obviating the need to purchase a special-purpose 3Dultrasound machine. The image quality and imaging techniques offered by any conventionalultrasound machine can thus also be achieved in 3D. Three basic types of mechanical scannershave been developed, as shown schematically in figure 1: linear, tilt and rotational.
3.1.1. Linear 3D scanning. In this approach a motorized drive mechanism is used to linearlytranslate the transducer across the patient’s skin, while the 2D images are acquired at regularspatial intervals so that they are uniformly spaced and parallel (figure 1(a)). The ability tovary the translation speed and sampling interval is necessary in order to match the samplingrate to the frame rate of the ultrasound machine and to match the sampling interval to (half)the elevational resolution of the transducer (Smith and Fenster 2000).
The simple predefined geometry of the acquired 2D image planes allows for a fast 3Dimage reconstruction. Thus, using this approach a 3D image can be obtained immediately afterperforming the scan, and its resolution can be optimized. Because the 3D image is producedfrom the series of conventional 2D images, its resolution will not be isotropic. In the directionparallel to the acquired 2D image planes, it will equal that of the original 2D images, but in theperpendicular direction it will be equal to the elevational resolution of the transducer. Thus, the3D image resolution will generally be the worst in the 3D scanning direction, and for optimalresults a transducer with good elevational resolution should be used.
The linear scanning approach has been successfully implemented in many vascularimaging applications, using B-mode and colour Doppler images of the carotid arteries (Downey

R72 A Fenster et al
(a)
(b)
Figure 2. 3D ultrasound images of the carotid arteries of a patient with carotid atheroscleroticdisease. The 3D images were obtained using the mechanical linear scanning approach and havebeen oriented and ‘sliced’ to reveal the details of the plaque. (a) Transverse ‘slice’ revealing thecomplex plaque. (b) Longitudinal ‘slice’ revealing the extent of the plaque.
and Fenster 1995a, Fenster et al 1995, Guo and Fenster 1996, Dicot et al 1991, 1993, Pretoriusand Nelson 1992), tumour vascularization (Bamber et al 1992, Carson et al 1993, Downeyand Fenster 1995b, King et al 1991), test phantoms (Guo and Fenster 1996, Guo et al 1995,Dabrowski et al 2001) and power Doppler images (Downey and Fenster 1995a, b, Guo andFenster 1996). An example of a linearly scanned 3D ultrasound image made with an externalfixture is given in figure 2, which shows a 3D image of carotid arteries with plaques. Inaddition to radiological applications, the utility of linear scanning in echocardiology has alsobeen demonstrated, using pullback of a transesophageal (TE) probe whose imaging planeis horizontal (i.e. perpendicular to the probe axis) (Pandian et al 1992, Ross et al 1993,Wollschlager et al 1993).
Three-dimensional ultrasound imaging R73
3.1.2. Tilt 3D scanning. In this approach, a motorized drive mechanism is used to tilt aconventional transducer about an axis parallel to the transducer face while the 2D images areacquired at regular angular intervals, so that they form a fan of images radial to the axis asshown in figure 1(b). This type of motion is possible with an integrated 3D probe as well aswith an external fixture. In either case, the probe housing remains at a single location on thepatient’s skin. Because of the fan-like geometry of the acquired 2D images, a large regionof interest can be swept out with an angular separation (typically 0.5◦ to 1.0◦) that can beadjustably predefined to yield high quality images in a variety of applications (Fenster et al1995, Delabays et al 1995, Downey et al 1995a, b, Gilja et al 1994, Sohn et al 1992).
This approach lends itself to compact designs, both for integrated 3D probes and forexternal fixtures. Special 3D ultrasound systems with integrated 3D probes, well-suited forabdominal and obstetric imaging, have been successfully demonstrated by Kretztechnik (Zipf,Austria) and Aloka (Korea). This compactness allows for easy hand-held positioning andmanipulation. Also, with suitable a total scanning angle, angular interval and ultrasoundframe rate, the scanning time can be made short. For example, with a total scanning angleof 90◦, an angular interval of 1◦ and a 30 Hz acquisition rate, the scanning time is only3 s.
As with linear scanning, the simple predefined geometry of the 2D image planes allowsfor a fast 3D image reconstruction, which can therefore be performed immediately after thescan is complete. Also, the 3D image resolution will again not be isotropic. Typically, theresolution will degrade away from the axis of rotation, for two reasons. First, because ofthe fan-like geometry of the acquired 2D images, the linear distance between acquired imageplanes increases with distance from the axis, resulting in decreased spatial sampling and lowerspatial resolution. Second, because of beam spreading in the elevational (or scan) direction,as well as within the acquired image plane, the resolution will degrade with distance from thetransducer, which is located near the axis (Blake et al 2000).
In a variation of tilt scanning, an external fixture is used to rotate a cylindrical endocavityprobe, such as a transoesophageal (TE) or transrectal ultrasound (TRUS) probe, about its axisto perform the scan. The 2D images are acquired by a side-firing linear transducer array parallelto the probe axis, and they again form a fan of images radial to the axis, as shown in figure 1(c),which span a total scanning angle of about 80◦ to 110◦ (Tong et al 1996, 1998). This approachhas been successfully applied to prostate imaging (Downey and Fenster 1995a, b, Fenster et al1995, Tong et al 1996, Elliot et al 1996), as illustrated in figure 3, and to 3D ultrasound guidedcryosurgery (Downey et al 1995c, Chin et al 1998, 1999, Onik et al 1996), and it has beencommercialized by Life Imaging Systems Inc. (London, Canada). Also, an application of thisapproach to echocardiography has been demonstrated by TomTec Inc. (Munich, Germany)using a TE probe whose imaging plane is vertical (i.e. parallel to the probe axis) (Belohlaveket al 1993, Martin and Bashein 1989).
3.1.3. Rotational 3D scanning. In this approach, a motorized mechanism rotates thetransducer array about a fixed axis that perpendicularly bisects the transducer array throughan angle of at least 180◦, while the 2D images are acquired. Thus, in this scanning geometry,the acquired images sweep out a conical volume about the axis, in a propeller-like pattern, asshown in figure 1(d). This approach has also been implemented with both an integrated 3Dprobe and an external fixture (e.g. attached to an end-firing TRUS probe).
As with the other scanning approaches, the 3D image resolution will not be isotropic.Because the acquired 2D images all intersect along the axis, spatial sampling will be highestnear the axis and poorest away from it. Also, both axial and elevational resolution in theacquired 2D images will decrease with distance from the transducer. The combination of these

R74 A Fenster et al
(a)
(b)
Figure 3. 3D images of two prostates with cancer. Both images were obtained with the tilt scanningapproach using a side-firing transrectal transducer. The image has been ‘sliced’ to reveal a tumour(arrow pointing to dark lesion) and its relationship to the seminal vesicle and rectal wall. Image (b)is courtesy of Life Imaging Systems Inc.
effects will cause the 3D image resolution to vary in a complicated manner, being highest nearthe transducer and near the axis, and degrading with distance from either.
This technique is particularly sensitive to operator or patient motion. Because the acquired2D images all intersect along the rotational axis at the centre of the 3D image, any motion ofthe axis or the patient during the scan will cause the axial pixels to have different values indifferent 2D images. For example, images acquired 180◦ apart will then not be mirror imagesof each other. These inconsistencies will result in image artefacts or resolution loss on theaxis, depending on the method of reconstruction. Similarly, artefacts will occur if the axis ofrotation is not accurately known, or if it is not within the 2D image plane of the transducer.
This approach has successfully been used for transrectal imaging of the prostate and forendovaginal imaging, as illustrated in figure 4. For imaging the prostate, Downey and others

Three-dimensional ultrasound imaging R75
Figure 4. 3D image of a pregnant uterus with twins. The image has been ‘sliced’ to reveal thetwo gestational sacs. This 3D image was obtained using the rotational scanning approach using anend-firing endovaginal transducer.
acquired 200 images spanning 200◦ in 13 s (Downey and Fenster 1995b, Tong et al 1996, Elliotet al 1996). Also, rapid imaging of the heart with a multiplane transoesophageal transducerhas been demonstrated by other investigators (Ghosh et al 1982, McCann et al 1987, Roelandtet al 1994).
3.2. Free-hand scanning with position sensing
The mechanical scanning approaches described above offer short imaging times, high-quality3D images and fast reconstruction times. However, the bulkiness and weight of the scanningapparatus sometimes make it inconvenient to use, and large structures are difficult to scan. Toovercome this problem, free-hand scanning techniques that do not require a motorized fixturehave been developed by many investigators. In these approaches, a sensor is attached to thetransducer to measure its position and orientation. Thus, the transducer can be held by theoperator and be manipulated in the usual manner over the anatomy to be imaged. While thetransducer is being manipulated, the acquired 2D images are stored by a computer togetherwith their positions and orientations. This information is then used to reconstruct the 3Dimage. Since the relative locations of the acquired 2D images are not predefined, the operatormust ensure that the spatial sampling is appropriate and that the set of 2D images has nosignificant gaps. Several free-hand scanning approaches have been developed, making use offour different sensing approaches: articulated arms, acoustic sensing, magnetic field sensingand image-based sensing.
3.2.1. Articulated arm 3D scanning. Position and orientation sensing can be achievedby mounting the ultrasound transducer on a multiple-jointed mechanical arm system.

R76 A Fenster et al
Figure 5. Schematic diagram showing two free-hand scanningapproaches: (a) acoustic tracking, (b) magnetic field sensing. Thearrangement of the acquired 2D images has no regular geometry.For accurate 3D reconstruction, the position and orientation of eachplane must be known accurately.
Potentiometers located at the joints of the movable arms provide the information necessary tocalculate the relative position and orientation of the acquired 2D images. This arrangementallows the operator to manipulate the transducer while the computer records the 2D images andthe relative angles of all the arms. Using this information, the position and orientation of thetransducer is calculated for each acquired 2D image, allowing the 3D image to be reconstructed.To avoid 3D image distortions and inaccuracies, the arms must not flex. Improved performancecan be achieved by keeping each arm as short as possible and reducing the number of movablejoints. Thus, increased 3D image quality can be achieved by reducing the scanning flexibilityand the maximum size of the scanned volume (Geiser et al 1982).
3.2.2. Acoustic free-hand 3D scanning. In this approach, an array of three sound-emittingdevices, such as spark gaps, are mounted on the transducer, and an array of fixed microphonesare mounted above the patient, as illustrated in figure 5(a). The microphones continuouslyreceive sound pulses from the emitters while the transducer is being manipulated and the 2Dimages are being acquired. The position and orientation of the transducer for each acquired 2Dimage can then be determined from knowledge of the speed of sound in air, the measured times-of-flight from each emitter to each microphone and the fixed locations of the microphones.The microphones must be placed over the patient, to provide unobstructed lines of sight tothe emitters, and must be close enough that the sound pulses can be detected with a goodsignal-to-noise ratio (Brinkley et al 1982, 1984, King et al 1990, 1992, Levine et al 1989,Moritz et al 1983, Rivera et al 1994, Weiss et al 1983).
3.2.3. Free-hand 3D scanning with magnetic field sensors. The most popular free-handscanning approach makes use of a magnetic field sensor with six degrees of freedom. In thisapproach, a transmitter is used to produce a spatially varying magnetic field and a small receivercontaining three orthogonal coils senses the magnetic field strength, as illustrated in figure 5(b).By measuring the strength of three components of the local magnetic field, the position andorientation of the transducer can be calculated each time a 2D image is acquired. Typically, thetransmitter is placed beside the patient and the receiver is mounted on the hand-held transducer.
Magnetic field sensors are small and unobtrusive, allowing the transducer to be trackedwith less constraint than the previously described approaches. However, electromagnetic
Three-dimensional ultrasound imaging R77
(a)
(b)
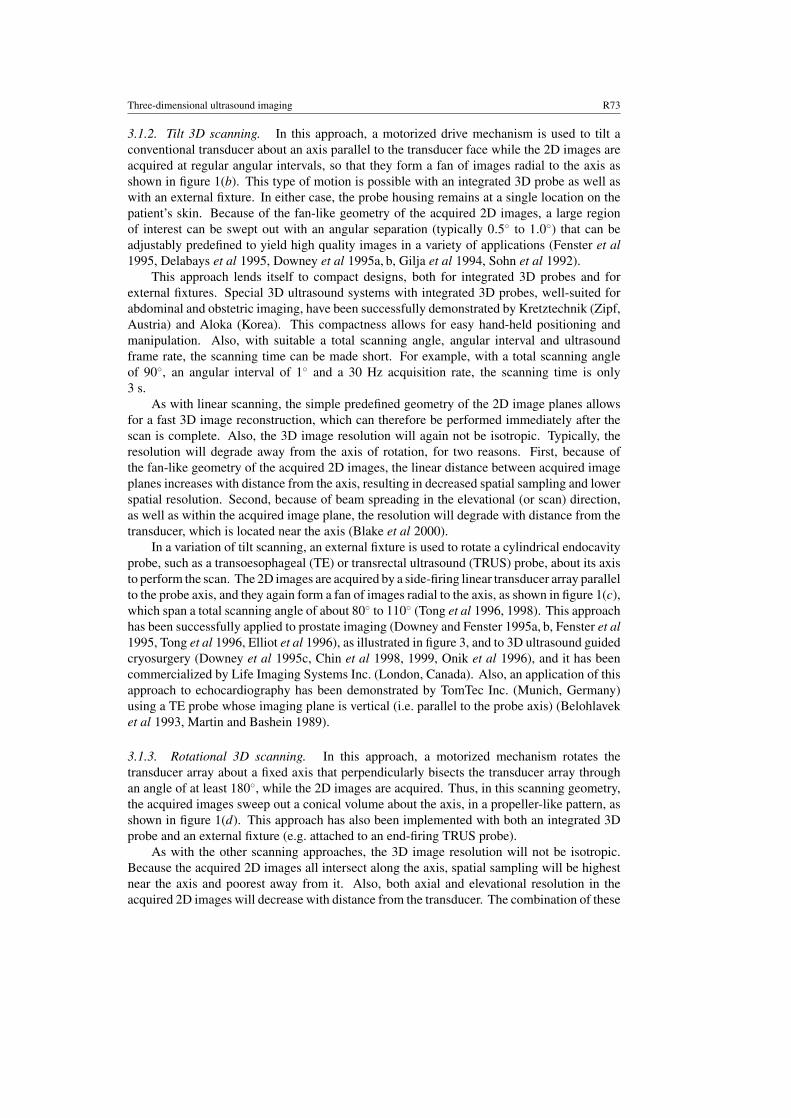
Figure 6. 3D B-mode image of the carotid arteries obtained with the free-hand scanning approachusing a magnetic position and orientation measurement (POM) device. (a) The 3D image has been‘sliced’ to reveal an atherosclerotic plaque at the entrance of the internal carotid artery. The plaqueis heterogeneous, with calcified regions casting a shadow on the common carotid artery. (b) Thesame image has been volume rendered to obtain a view of the vessel wall and the surface of theplaque.
interference from sources such as CRT monitors, ac power cables and electrical signals fromthe transducer itself can compromise the tracking accuracy. Geometric distortions in the final3D image can occur if ferrous or highly conductive metals are located nearby. In addition,errors in the determination of the location of the moving transducer will occur if the magneticfield sampling rate is low and the transducer is moved too quickly. This results in an image ‘lag’artefact, which can be avoided by using a sampling rate of about 100 Hz or higher. By ensuringthat the environment of the scanned volume is free of metals and electrical interference, andusing an adequate sampling rate, high-quality 3D images can be obtained, as illustrated infigure 6.

R78 A Fenster et al
Magnetic position and orientation measurement (POM) devices of sufficient quality for 3Dultrasound imaging are currently being produced by two companies: the Fastrack by Polhemus,and Flock-of-Birds by Ascension Technologies. These devices have been used successfully inmany diagnostic applications, including echocardiography, obstetrics, and vascular imaging(Fenster et al 1995, Nelson and Elvins 1993, Bonilla-Musoles et al 1995, Detmer et al 1994,Ganapathy and Kaufman 1992, Hodges et al 1994, Hughes et al 1996, Leotta et al 1997, Giljaet al 1997, Nelson and Pretorius 1995, Ohbucki et al 1992, Pretorius and Nelson 1994, Raabet al 1979, Riccabona et al 1995).
3.2.4. 3D tracking by speckle decorrelation. The free-hand scanning techniques describedabove require a POM device to record the position and orientation of each acquired image.An alternative technique, not requiring any device, uses the acquired images themselves toextract their relative positions. This can be accomplished using the well-known phenomenonof speckle decorrelation. When a source of coherent energy interacts with scatterers, thereflected spatial energy pattern will vary, due to interference, and appear as a speckle pattern.Ultrasound images are characterized by image speckle, which can be used to make velocityimages of moving blood (Friemel et al 1998). In this situation if the red blood cells remainstationary then two sequential signals scattered by these cells will be correlated and the specklepattern will be identical. However, if the blood cells move, the two sequential signals willbecome decorrelated, with the degree of decorrelation being proportional to the distance moved.
The same principle can be used to determine the spacing between two adjacent 2D images.If two images are acquired from the same location, then the speckle pattern will be the same,so that there will be no decorrelation. However, if one of the images is moved with respect tothe first, then the degree of decorrelation will be proportional to the distance moved, the exactrelationship depending on the beam width in the direction of the motion (Tuthill et al 1998).
Speckle decorrelation techniques for 3D ultrasound imaging are complicated by the factthat a pair of adjacent 2D images may not necessarily be parallel to each other. Thus, inorder to determine whether the transducer has been tilted or rotated, the acquired images aresubdivided into smaller regions, and similar regions in adjacent images are cross-correlated.In this manner, a pattern of decorrelation values is generated, which in turn generates a patternof distance vectors. These are then analysed to determine the relative position and orientationof the two 2D images.
3.3. Free-hand scanning without position sensing
An alternative 3D scanning approach, without any position sensing, involves manipulatingthe transducer over the patient while acquiring 2D images, and then reconstructing the 3Dimage by assuming a predefined scanning geometry. Because no geometrical information isrecorded during the transducer’s motion, the operator must be careful to move the transducer ata constant linear or angular velocity so that the acquired 2D images are obtained with a regularspacing. With uniform motion and knowledge of the approximate total distance or total anglescanned, very good 3D images may be reconstructed, as illustrated by figure 7 (Downey andFenster 1995a). However, because this approach offers no guarantee that the 3D images aregeometrically accurate, they should not be used for any measurements.
3.4. 2D Arrays for dynamic 3D ultrasound
The mechanical and free-hand scanning approaches for 3D ultrasound images described aboveall require the 2D ultrasound image produced by a conventional transducer, with a 1D array,

Three-dimensional ultrasound imaging R79
Figure 7. Maximum intensity projection (MIP) of a 3D power Doppler image of a kidney. Theimage was obtained with the free-hand scanning approach without any positioning sensing. Theimage has been ‘sliced’ to demonstrate that excellent 3D images of vascular structures can beobtained.
to be mechanically or manually swept across the anatomy. However, by using a transducerwith a 2D array, the transducer could remain stationary, and electronic scanning could be usedto sweep the broad ultrasound beam over the entire volume under examination. Althougha number of 2D array designs have been developed, the most advanced is the one at DukeUniversity, which was developed for real-time 3D echocardiography and has been used forclinical imaging (Shattuck et al 1984, Smith et al 1991, 1992, Snyder et al 1986, Turnbull andFoster 1991, von Ramm and Smith 1990, von Ramm et al 1991).
In this approach, a 2D phased array of transducer elements is used to transmit a broad beamof ultrasound diverging away from the array, sweeping out a volume shaped like a truncatedpyramid. The returned echoes detected by the 2D array are processed to display multipleplanes from this volume in real time. These planes can be manipulated interactively to allowthe user to explore the whole volume under investigation. Although this approach has beensuccessfully used in echocardiology, some problems must be overcome before its use canbecome widespread in radiology. These problems are related to high cost of the 2D transducerarrays, which results from the low yield of the manufacturing process, which requires manyelectronic leads to be properly connected to the numerous small elements in the array.
4. Reconstruction of 3D ultrasound images
Image reconstruction refers to the process of generating a 3D representation of the anatomy byfirst placing the acquired 2D images in their correct relative positions and orientations in the3D image volume, and then using their pixel values to determine the voxel values in the 3Dimage. Two distinct reconstruction methods have been used: feature-based and voxel-basedreconstruction.

R80 A Fenster et al
4.1. Feature-based reconstruction
In this method, desired features or surfaces of anatomical structures are first determinedand then reconstructed into a 3D image. For example, in echocardiographic or obstetricimaging, the ventricles or foetal structures may be outlined (either manually or automaticallyby computer) in the 2D images, and only the resulting boundary surfaces presented to the viewerin 3D. The surfaces of different structures may be assigned different colours and shaded, andsome structures may be eliminated to enhance the visibility of others. This approach hasbeen used extensively in 3D echocardiography to identify the surfaces of ventricles (Ofili andNanda 1994, Nadkarni et al 2000a, Coppini et al 1995, Wang et al 1994). Then, using ventriclesurfaces from 3D images obtained at different phases of the cardiac cycle, the complex motionof the heart can be viewed with a computer workstation, as a cine loop. A similar approach hasbeen also used to reconstruct 3D images of the vascular lumen from intravascular ultrasound(IVUS) images (Reid et al 1995).
Because this approach reduces the 3D image content to the surfaces of a few anatomicalstructures, the contrast of these structures can be optimized. Also, by using multiple (e.g.cardiac gated) images, their dynamic behaviour can be easily appreciated. In addition, italso enables the 3D image to be manipulated efficiently using inexpensive computer displayhardware (e.g. to produce ‘fly-through’ views). However, this approach also has majordisadvantages. Because it represents anatomical structures by simple boundary surfaces,important image information, such as subtle anatomical features and tissue texture, is lostat the initial stage of the reconstruction process. Moreover, the artificial contrast betweenstructures may misrepresent subtle features of the anatomy or pathology. Furthermore, theboundary identification step is tedious and time-consuming if done manually, and subject toerrors if done automatically by a computer segmentation algorithm.
4.2. Voxel-based reconstruction
The more popular approach to 3D ultrasound image reconstruction is based on using a setof acquired 2D images to build a voxel-based image, i.e. a regular Cartesian grid of volumeelements in three dimensions. Reconstruction is accomplished in two steps: first, the acquiredimages are embedded in the image volume, by placing each image pixel at its correct 3Dcoordinates (x, y, z), based on the 2D coordinates (x∗, y∗) of that pixel in its 2D image, andthe position and orientation of that image with respect to the 3D coordinate axes. Then, foreach 3D image point, the voxel value (colour or grey-scale image intensity) is calculated byinterpolation, as the weighted average of the pixel values of its nearest neighbours amongthe embedded 2D image pixels. For mechanically scanned images, the interpolation weightsmay be precomputed and placed in a look-up table, allowing the 3D image to be rapidlyreconstructed (Tong et al 1996).
This voxel-based reconstruction approach preserves all the information originally presentin the acquired 2D images. Thus, by taking suitable cross sections of the 3D image volume,the original 2D images can be recovered. Moreover, new views not found in the original setof images can be generated.
However, if the scanning process does not sample the object volume adequately, so thatthere are gaps between acquired 2D images which are greater than about half the elevationalresolution, then the interpolated voxel values will not depict the true anatomy in the gap. Inthis situation, spurious information is introduced, and the resolution of the reconstructed 3Dimage is degraded. To avoid this situation, the volume must be well sampled. This generateslarge data files which require efficient 3D viewing software. Typical image files can range
Three-dimensional ultrasound imaging R81
from 16 MB to 96 MB in size, depending on the application. For example, 96 MB imageshave been reported in 3D TRUS imaging of the prostate for cryosurgical guidance (Downeyet al 1995c, Chin et al 1996).
Moreover, because all the original image information is preserved, the 3D image can beprocessed repeatedly using a variety of rendering techniques. For example, the operator canscan through the data (review the complete 3D image) and then choose the technique whichdisplays the features of interest to best advantage. The operator may then apply segmentationand classification algorithms to segment boundaries, measure volumes or perform variousvolume-based rendering operations. Then, if the selected process does not achieve the desiredresults, the operator may return to the original 3D image and try a different procedure.
4.2.1. Freehand 3D scanning. Here it is assumed that the transducer housing is rigidlyattached to the ‘sensor’ of a position and orientation measurement (POM) device (such as amagnetic field sensor). This device determines the position and orientation of the ‘sensor’relative to a ‘source’ in a fixed remote location (such as a magnetic field generator). Supposenow that a 2D image pixel has coordinates (x∗, y∗) relative to the transducer, 3D coordinates(x ′, y ′, z′) relative to the ‘sensor’, 3D coordinates (x ′′, y ′′, z′′) relative to the ‘source’ and 3Dvoxel coordinates (x, y, z) in the reconstructed image volume. Suppose further that the x∗–y∗
plane would have to be sequentially rotated through the three angles (α, β, γ ) about three(given) axes and translated by the vector (X, Y,Z) in order to coincide with the x ′–y ′ plane;that the x ′–y ′ plane would similarly have to be rotated through (α′, β ′, γ ′) and translated by(X′, Y ′, Z′) in order to coincide with the x ′′–y ′′ plane; and, finally, that the x ′′–y ′′ plane wouldhave to be rotated through (α′′, β ′′, γ ′′) and translated by (X′′, Y ′′, Z′′) in order to coincidewith the x–y plane. Then the embedding transformation from 2D pixel coordinates (x∗, y∗)to 3D voxel coordinates (x, y, z) can be written as the product of three homogeneous lineartransformations, so that:
x
y
z
1
= T′′T′T
x∗
y∗
01
(1)
where, in terms of the 3D rotation matrix Rij = rij (α, β, γ )
T =
R11 R12 R13 X
R21 R22 R23 Y
R31 R32 R33 Z
0 0 0 1
(2)
with similar definitions for T′ in terms of R′ij = rij (α
′, β ′, γ ′) and T′′ in terms ofR′′ij = rij (α
′′, β ′′, γ ′′).Because T′′ is defined by the user and T′ is given by the output of the POM device, only
T needs to be determined in order to fully specify the embedding transformation. This is doneby calibrating the rotation angles (α, β, γ ) and the translation vector components (X, Y,Z).Methods for doing this are described by Detmer et al (1994) and Prager et al (1998).
Using commercially available magnetometer-based POM devices, Prager et al (1998)found a root-mean-square (rms) precision of 1.1–2.2 mm in each 3D coordinate, depending onthe calibration method, and a mean accuracy of better than 0.25 mm for each of the methodstested. These are similar to results obtained earlier by Detmer et al (1994) and Leotta et al(1997) for specific calibration methods. Also, the precision and accuracy of various in vitroand in vivo volume measurements has been reported by Hodges et al (1994) and Hughes et al(1996).

R82 A Fenster et al
4.2.2. Mechanical 3D scanning. Here, the transducer housing is rigidly mounted on amechanical device, often hand-held, which then uses a stepper motor to scan the object bytranslating, rotating or tilting the transducer according to a predetermined protocol, oftenunder microcomputer control. The embedding transformations for mechanical linear and tiltscanners are described in connection with the next section.
5. Effects of errors in the reconstruction
Except for systems using 2D arrays, 3D ultrasound images are reconstructed from multiple 2Dimages, using knowledge of their relative positions and orientations. Thus, any errors in theposition or orientation of the 2D images will cause geometric distortion in the reconstructed 3Dimage, resulting in errors in the measured lengths, areas and volumes of anatomical features inthese images. Although other sources of error such as tissue motion during the scan (possiblycaused by the scanning procedure itself) or image segmentation errors can also affect thesemeasurements, they overlie this fundamental geometric image distortion. In the literature,analyses of these geometric distortions have been performed for linear and tilt mechanicalscanners.
5.1. Linear 3D scanning
The analysis was performed by Cardinal et al (2000) for the general case of an ultrasoundtransducer oriented as shown in figure 8 and scanned parallel to the z-axis. Here, the transducerarray is initially oriented along the x-axis, and aimed in the y direction. After being tilted byan angle θ about the x-axis, and then swiveled by an angle φ about the y-axis, it is translatedin the z direction, in steps of size d , to acquire a series of parallel 2D images. Thus, for the 2Dimage acquired after n steps, the pixel at coordinates (x∗, y∗) has 3D Cartesian coordinates(x, y, z) given by the linear transformation[
x
y
z
]=
[ cosφ sin φ sin θ 00 cos θ 0
− sin φ cosφ sin θ d
] [x∗
y∗
n
]. (3)
Moreover, the embedded 2D image planes are all normal to the unit vector
U = (sin φ cos θ,− sin θ, cosφ cos θ) (4)
and have a normal spacing
D = d cosφ cos θ > 0 (5)
assuming (without loss of generality) that θ and φ are each less than π/2 (90◦) in magnitude.When φ = 0, the embedded 2D image planes are all parallel to the x-axis, and hence
the 3D image interpolation reduces to a 2D interpolation in the y–z plane, which is identicalfor each value of x. Thus, when φ = 0, the 3D image may be efficiently reconstructed bycomputing a single set of 2D interpolation coefficients and applying it to each x plane insuccession.
The error analysis assumes that the 3D image is reconstructed with the nominal parametervalues (d, θ, φ), but that the 3D object was scanned with the actual parameter values (d0, θ0, φ0).Because the embedding transformation is linear, straight lines are always imaged as straightlines. However, the errors �d = d − d0, �θ = θ − θ0 and �φ = φ − φ0 still cause relativeerrors �L/L, �A/A and �V/V in image length, area and volume. If the error vector E isnow defined as:
E =( −�φ
cosφ cos θ,�θ
cos θ,
�d
d cosφ cos θ
)(6)

Three-dimensional ultrasound imaging R83
Figure 8. Schematic diagram showing the scanning geometry for linear scanning with aconventional transducer. The transducer array is initially located on the object’s surface, alongthe x-axis, and aimed perpendicularly into the object, in the y direction. The transducer is thentilted by an angle θ about the x-axis and subsequently swiveled by an angle φ about the y-axis,before being translated across the object’s surface in the z direction (in steps of size d, not shown)to acquire a series of parallel 2D images.
then, assuming that |�d/d| � 1, |�θ | � 1 and |�φ| � 1, it is found that all three relativeerrors are well described by the linear approximations
�K
K= E · CK K = L,A, V (7)
where
CL = U − L × (U × L)
L2= (U · L)L
L2(8a)
which is the component of U parallel to the image line vector L
CA = U − (U · A)A
A2= A × (U × A)
A2(8b)
which is the component of U perpendicular to the image area vector A, and
CV = U . (8c)
Hence, because |CK | � |U | = 1, within these linear approximations∣∣∣∣�KK∣∣∣∣ � |CK ||E| � |E| K = L,A, V . (9)
For volume, the linear approximation is explicitly
�V
V= �d
d− tan θ�θ − tan φ�φ (10)
which is insensitive to �φ when φ = 0. Also, the exact ratio of image volume V to objectvolume V0 is given by the formula
V
V0= d cosφ cos θ
d0 cosφ0 cos θ0= D
D0(11)
because the determinant of the embedding linear transformation is D.
R84 A Fenster et al
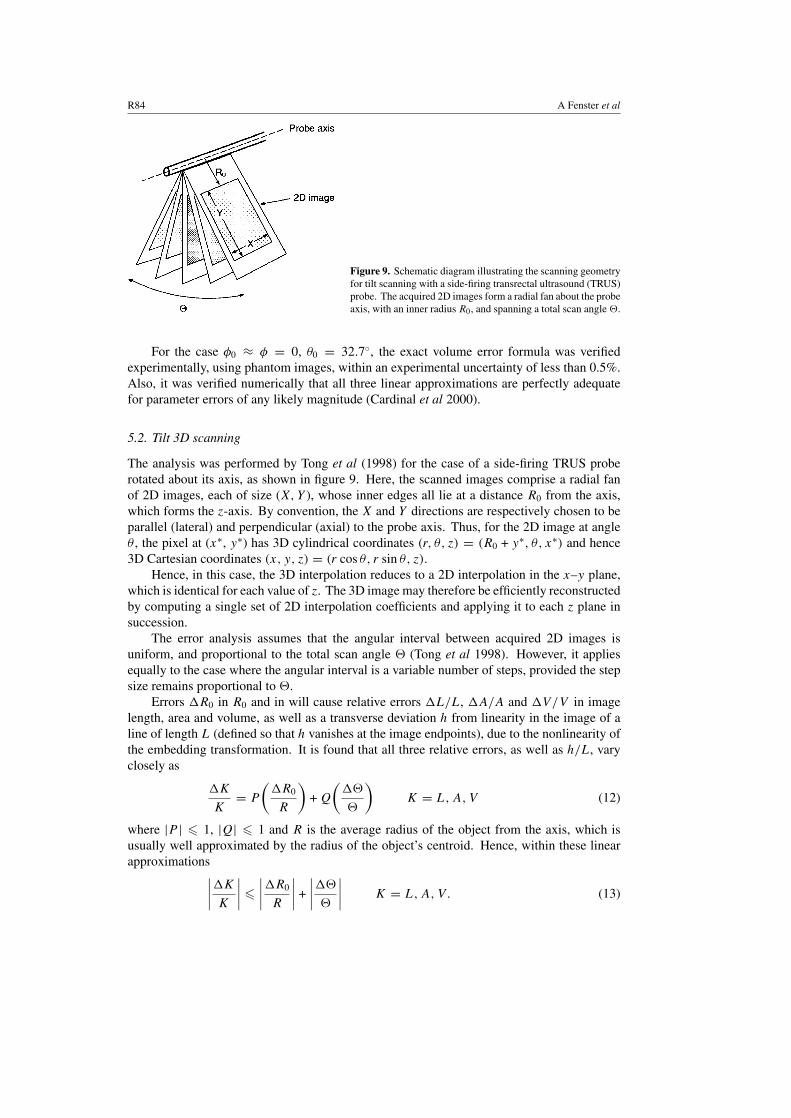
Figure 9. Schematic diagram illustrating the scanning geometryfor tilt scanning with a side-firing transrectal ultrasound (TRUS)probe. The acquired 2D images form a radial fan about the probeaxis, with an inner radius R0, and spanning a total scan angle �.
For the case φ0 ≈ φ = 0, θ0 = 32.7◦, the exact volume error formula was verifiedexperimentally, using phantom images, within an experimental uncertainty of less than 0.5%.Also, it was verified numerically that all three linear approximations are perfectly adequatefor parameter errors of any likely magnitude (Cardinal et al 2000).
5.2. Tilt 3D scanning
The analysis was performed by Tong et al (1998) for the case of a side-firing TRUS proberotated about its axis, as shown in figure 9. Here, the scanned images comprise a radial fanof 2D images, each of size (X, Y ), whose inner edges all lie at a distance R0 from the axis,which forms the z-axis. By convention, the X and Y directions are respectively chosen to beparallel (lateral) and perpendicular (axial) to the probe axis. Thus, for the 2D image at angleθ , the pixel at (x∗, y∗) has 3D cylindrical coordinates (r, θ, z) = (R0 + y∗, θ, x∗) and hence3D Cartesian coordinates (x, y, z) = (r cos θ, r sin θ, z).
Hence, in this case, the 3D interpolation reduces to a 2D interpolation in the x–y plane,which is identical for each value of z. The 3D image may therefore be efficiently reconstructedby computing a single set of 2D interpolation coefficients and applying it to each z plane insuccession.
The error analysis assumes that the angular interval between acquired 2D images isuniform, and proportional to the total scan angle � (Tong et al 1998). However, it appliesequally to the case where the angular interval is a variable number of steps, provided the stepsize remains proportional to �.
Errors �R0 in R0 and in will cause relative errors �L/L, �A/A and �V/V in imagelength, area and volume, as well as a transverse deviation h from linearity in the image of aline of length L (defined so that h vanishes at the image endpoints), due to the nonlinearity ofthe embedding transformation. It is found that all three relative errors, as well as h/L, varyclosely as
�K
K= P
(�R0
R
)+ Q
(��
�
)K = L,A, V (12)
where |P | � 1, |Q| � 1 and R is the average radius of the object from the axis, which isusually well approximated by the radius of the object’s centroid. Hence, within these linearapproximations∣∣∣∣�KK
∣∣∣∣ �∣∣∣∣�R0
R
∣∣∣∣ +
∣∣∣∣���∣∣∣∣ K = L,A, V . (13)

Three-dimensional ultrasound imaging R85
For line images, the coefficients P and Q for �L/L and h/L are simple functions of the line’sorientation and size, and the relative location of the point at which h is to be calculated. Forarea and volume, P = Q = 1, and the exact ratio of image size K to object size K0 is givenby the formula
K
K0=
(1 +
�R0
R
)(1 +
��
�
)K = A,V. (14)
Moreover, this formula applies to cross-sectional areas in any orientation.Tong et al (1998) also describe methods for using simple phantoms to calibrate R0 and �
accurately. Moreover, the linear length, area and volume formulae were verified numerically,using simulated images, and experimentally, using phantom images (and the calibrated valuesof R0 and �), within an experimental uncertainty of less than 0.5%.
6. 3D ultrasound image display
Over the past decade, many algorithms and software utilities have been developed to manipulate3D images interactively using a variety of visualization tools (Udupa 1999, Udupa et al 1991,Robb 1995). Although the quality of the 3D image depends critically on the method of imageacquisition and the fidelity of the 3D image reconstruction, the viewing technique used todisplay the 3D image often plays a dominant role in determining the information transmittedto the operator. There are many approaches for displaying 3D images, which differ in thedetails of the display implementation. Many of these techniques have been investigated foruse with 3D ultrasound images, and these can be divided into three broad classes: surfacerendering (SR), multiplanar reformatting (MPR) and volume rendering (VR).
6.1. Surface rendering (SR)
A common 3D display technique used in medical imaging is based on visualizing the surfacesof organs. Because the 3D image must first be reduced to a description of surfaces, imageclassification and segmentation steps precede the rendering. In the first step, each voxel (orvoxel group) in the 3D image must be either manually or automatically classified as to whichstructure it (or they) belongs (Bezdek et al 1993). Organ boundaries are then identified usingmanual contouring (Coppini et al 1995, Neveu et al 1994, Lobregt and Viergever 1995),or computer-based segmentation techniques (Gill et al 2000). Once the organs have beenclassified and segmented, the boundary surfaces are each represented by a mesh and thentexture mapped with a colour and texture which appropriately represents the correspondinganatomical structure.
Because early 3D ultrasound imaging techniques did not have the benefit of thehigh computational speed now available in inexpensive computers, only simple wire-framerendering techniques were used at first. These early approaches were used for displayingthe foetus (Brinkley et al 1984, Sohn et al 1989, Sohn and Rudofsky 1989, Brinkley et al1982), various abdominal structures (Sohn and Grotepass 1989, Sohn et al 1988, Sohn 1989),and the endocardial and epicardial surfaces of the heart (Moritz et al 1983, Coppini et al1995, Fine et al 1988, Nixon et al 1983, Martin et al 1990, Linker et al 1986, Sawada et al1983). More recent approaches use more complex surface representations, which are texture-mapped, shaded and illuminated, so that both the surface topography and its 3D geometryare more easily comprehended. These approaches typically allow user-controlled motion forviewing the anatomy from various perspectives. This approach has been used successfullyby many investigators in the rendering of 3D echocardiographic (Greenleaf et al 1993, Ofili

R86 A Fenster et al
and Nanda 1994, Ross et al 1993, Delabays et al 1995, Wang et al 1994, McCann et al 1998,Belohlavek et al 1994, Delabays et al 1995) and obstetric images (Nelson and Pretorius 1992,Lees 1992).
6.2. Multiplanar reformatting (MPR)
Rather than displaying only the surfaces of structures, as in the SR technique, the MPRtechnique provides the viewer with planar cross-sectional images extracted from the 3D image.Thus, this approach requires that either a voxel-based 3D image be first reconstructed, or thatan algorithm be used that can extract an arbitrarily oriented plane from the original set ofacquired 2D images (Robb 1995). Because the extracted plane will generally not coincidewith one of these original image planes, interpolation is required to provide an image similarin appearance to an acquired 2D image. Thus, the extracted image resembles a conventional2D ultrasound image, which is already familiar to the operator; the operator can then easilyposition and orient it to the optimal image plane for the examination. This technique is easy tolearn and is therefore preferred by radiologists. Two MPR techniques have been used to view3D ultrasound images: orthogonal planes and cube-view.
6.2.1. Orthogonal planes. In this approach, computer–user interface tools provide threeperpendicular planes which are displayed on the screen simultaneously, with graphical cuesindicating their relative orientations. The operator can then select any single or multiple planesand move them within the 3D image volume to provide a cross-sectional view at any desiredlocation or orientation, including oblique views (Nelson and Pretorius 1992, Zosmer et al1996, Gerscovich et al 1994, Kuo et al 1992, Kirbach and Whttingham 1994).
6.2.2. Cube-view. In this approach, illustrated by figures 2, 3, 4, 6(a) and 10(a), the 3D imageis presented as a polyhedron which represents the boundaries of the reconstructed volume. Eachface of the multifaceted polyhedron is rendered with the appropriate ultrasound image for thatplane, using a texture-mapping technique (Fenster et al 1995, Tong et al 1996, Robb 1995).With the computer–user interface tools provided, the operator can select any face, and moveit in or out, parallel to the original face or reorient it obliquely, at any angle to the originalface, while the appropriate ultrasound data are continuously texture-mapped in real time ontothe new face. In addition, the entire polyhedron may be arbitrarily rotated in any directionto obtain the desired orientation of the 3D image. In this way, the operator always has 3Dimage-based cues relating the plane being manipulated to the anatomy being viewed (Rankinet al 1993, Fenster et al 1995, Picot et al 1993, Blake et al 2000).
6.3. Volume rendering (VR)
The volume rendering technique presents a display of the entire 3D image after it has beenprojected onto a 2D plane, with the image projection typically being accomplished via ray-casting techniques (Tuy and Tuy 1984, Levoy 1990a, b). The 3D image voxels that intersecteach ray are weighted and summed to achieve the desired result in the rendered image.Although many VR algorithms have been developed, 3D ultrasound imaging currently makesuse of two main approaches: maximum (minimum) intensity projection and translucencyrendering.
6.3.1. Maximum (minimum) intensity projection (MIP). A common approach is to displayonly the maximum (minimum) voxel intensity along each ray. This approach is easy to

Three-dimensional ultrasound imaging R87
Figure 10. 3D image of a foetal face, displayed using (a) the multiplanar reformatting cube-viewapproach, and (b) the translucency rendering approach, done with ray-casting. In (a) the 3D imageis presented as a polyhedron with the appropriate 2D image texture-mapped onto each face. Thispolyhedron can then be arbitrarily ‘sliced’ and rotated to reveal the profile of the foetal face. In (b),the amniotic fluid has been rendered as transparent, and tissues have been rendered as translucentto opaque, as a function of their voxel intensity.
implement and fast to compute, allowing real-time manipulation of the MIP image oninexpensive computers. Excellent results are typically achieved when the image informationis sparse, such as it is in 3D power Doppler images (see figure 7) (Guo and Fenster 1996,Downey and Fenster 1995b).
6.3.2. Translucency rendering. This is the VR approach most commonly used in 3Dultrasound imaging. In this approach, the accumulated luminanceC for a given ray is calculatedby tracing the ray through the 3D image and adding the contribution from each voxel alongthe ray. Tracing the ray forwards, towards the projected image plane, the ray-tracing equationis
C ′ = C[1 − α(i)] + c(i)α(i) (15)
where C and C ′ are respectively the accumulated luminance not including and including thecontribution from the ith voxel, α(i) is the opacity (1 minus the transmittance) of the ith voxel,and c(i) is its luminance. The parameters α(i) and c(i) are generally functions of the ith voxelintensity, which are chosen to control the specific type of rendered image desired. Thus, ifα(i) = 0, the ith voxel is transparent, while if α(i) = 1, then it is opaque or luminescent,depending on the value of c(i).
However, the contribution of voxels far from the projected image plane is typicallynegligible, due to the high total opacity (low total transmittance) of the intervening voxels.Thus, it is often preferred to trace the ray backwards, away from the projected image plane.In this case, the ray-tracing equation becomes
C ′ = C + c(i)α(i)[1 − A(i)] (16)

R88 A Fenster et al
where C and C ′ are respectively the accumulated luminance not including and including thecontribution from the ith voxel (now numbered in reverse order), and A(i) is the accumulatedopacity at the ith voxel, given by
[1 − A(i)] =∏j<i
[1 − α(j)] (17)
so that [1 − A(i)] represents the total transmittance between the ith voxel and the projectedimage plane. In practice, the backwards ray-tracing equation is iterated until [1 −A(i)] is lessthan some predefined level, at which point C ′ is output as the display luminance.
Because VR preserves much of the information in the 3D image, and projects it onto a 2Dimage plane after nonlinear processing, the projected image is, at times, difficult to interpret.Thus, this approach is best suited for imaging simple anatomical structures, in which clutteris either absent or has been removed, and to which depth cues and shading have been added.Excellent results have been achieved in displaying foetal (Nelson and Pretorius 1992, 1995,Nelson and Elvins 1993, Pretorius and Nelson 1994, 1995, Nelson et al 1996) and vascularanatomy (Downey and Fenster 1995a, Fine et al 1991), as demonstrated by figure 10(b).
7. Measurement accuracy with 3D ultrasound
An important advantage of 3D ultrasound imaging is the ability to measure the length, areaor volume of organs or lesions in arbitrary orientations. While a qualitative visual assessmentis often valuable, quantitative data provide a more accurate basis for decision making andcomparisons against previous studies or reference data-bases (Elliott et al 1996, Rivera et al1994, Hodges et al 1994, Hughes et al 1996, Riccabona et al 1995, 1996a, Nadkarni et al2000a, Favre et al 1995, Gilja et al 1995, Sivan et al 1997).
In many applications, the goal is the measurement of the volume of the organ or lesion,rather than its diameter or perimeter. Since conventional ultrasound imaging provides only2D images, volume must be estimated from measurements of diameter in two or three user-selected planes and by assuming some idealized shape. This approach results in inaccuracy andvariability. Since 3D ultrasound images provide a complete view of the structure, they shouldprovide a basis for more accurate and precise estimates of volume, especially for complexstructures.
7.1. Distance measurement
With a 3D image, distance measurements need not be made in the plane of an acquired 2Dimage, but instead can be made in any orientation. Thus, for this measurement to be accurate,the reconstruction process must not distort the anatomical geometry. With proper calibrationand reconstruction, accurate distance measurements can be made.
Tong et al (1996) have evaluated the accuracy of distance measurements using a 3D wirephantom composed of four layers of surgical wires, with a separation of 10.00 mm betweenadjacent wires within each layer, and a separation of 10.00 mm between adjacent layers.The wire phantom, immersed in a 7% glycerol solution, was imaged with a 3D transrectalultrasound (3D TRUS) system, which uses the mechanical tilt-scanning approach describedby figure 1(c) and in more detail by figure 9. The results of this study showed that with propercalibration of the parameters R0 and �, which specify the scanning geometry, as shown infigure 9, this 3D ultrasound imaging system can provide distance measurements with an errorof less than about 1.0%.

Three-dimensional ultrasound imaging R89
7.2. Measurement of cross-sectional area using 3D ultrasound
Using the multiplanar reformatting (MPR) technique, the 3D image can be ‘sliced’ in anyorientation, to obtain the optimal cross section for the organ measurement. The desired areacan then be outlined either manually, using planimetric techniques (Tong et al 1996, Elliotet al 1996), or automatically, using segmentation algorithms (Gill et al 2000, Mao et al 2000,Ladak et al 2000). The area of the region is then found by counting the pixels in the outlinedregion and multiplying by the pixel area.
7.3. Volume measurement using 3D ultrasound
The availability of 3D images allows the measurement of organ volume using either manual oralgorithmic techniques. Automated and semiautomated segmentation algorithms are describedbelow in section 8, and are still under development in many laboratories. The alternativemanual technique (manual planimetry) makes use of MPR viewing to ‘slice’ the 3D imageinto a series of uniformly spaced parallel 2D images. In each 2D image, the cross-sectionalarea of the organ is manually outlined on the computer screen, and the areas are then summedand multiplied by the interslice distance to obtain an estimate of the organ volume (Elliot et al1996).
7.3.1. In vitro measurements of volume accuracy. Tong et al (1996) used a 3D TRUS system(described in figures 1(c) and 9) to evaluate the accuracy of volume measurements in vitro.Five balloons filled with various known volumes of 7% glycerol solution were imaged, andtheir volumes were measured using the manual planimetry method. A comparison of measuredto true volumes yielded an rms error of 0.9%.
7.3.2. Volume measurements of prostates in vitro. Rather than using idealized volume shapessuch as balloons, Elliot et al (1996) compared prostate volumes measured using manualplanimetry of 3D TRUS images with their true volumes. For this study, six prostates wereharvested from fresh cadavers, fixed and immersed in a 7% glycerol solution for imaging.The MPR technique was then used to ‘slice’ the reconstructed prostate images into 20 to 30transaxial slices 2–5 mm apart, depending on the prostate size. A comparison of measured totrue volumes yielded an rms error of 2.6%.
7.3.3. Volume measurements in vivo. A number of studies have been published demonstratingthat 3D ultrasound can be used to accurately measure volumes for a variety of organs (Nelsonet al 1999). Brunner et al (1995) showed an increased accuracy over 2D techniques in follicularvolume measurements. Chang et al (1997) showed accurate volume measurement results forfoetal heart volumes across a range of gestational ages. Riccabona et al (1996b) showedaccurate volume measurements by comparing voided urine volumes and measured bladdervolumes before voiding. Hughes et al (1996) measured a variety of organ volumes, and foundthat the errors ranged from 2% to 6%. Favre et al (1995) reported that in using 3D ultrasoundfor estimation of foetal weight by measuring foetal arm and thigh circumference, the meanerror was −1.4% for macrosomic foetuses.
7.3.4. Effect of interslice distance on planimetric volume measurements. Volumemeasurement by manual planimetry requires that the 3D image be ‘sliced’ into individualparallel slices, and the boundary of the anatomical structure be outlined in every slice. Thus,while a small interslice distance increases accuracy, it also increases the number of slices that

R90 A Fenster et al
must undergo the time-consuming and tedious process of manual planimetry. It is thereforeimportant to determine the maximum interslice distance that still provides an accurate volumeestimate. Although irregular or complex structures require the use of small interslice distances,using an interslice distance of less than the elevational resolution will not result in increasedaccuracy. Thus, the optimal interslice distance will depend on the elevational resolution of thetransducer and the complexity of the organ.
Elliot et al (1996) have reported on a study examining the effect of the interslice distanceon measurement of prostate volume. In this study, prostate volume was measured in a 3DTRUS image by usual manual planimetry with interslice distances from 1 mm to 15 mm. Theresults showed that the measured prostate volume was constant up to an interslice distance of8 mm, but underestimated for greater interslice distances. Other reports addressing this issuehave recommended interslice distances ranging from 2 mm to 5 mm for measuring prostatevolume using 2D ultrasound and manual planimetry (Terris and Stamey 1991).
7.3.5. Theoretical variability of planimetric volume measurements. Because volumemeasurements in 3D images are usually performed via manual planimetry, Nadkarni et al(2000b) have derived a simple formula for theoretically estimating the variance of a planimetricvolume measurement, and compared it with experimental variances of volume measurements.In their approach, the volume variance was estimated by summing the variances of individualmeasurements of the cross-sectional area of an object, multiplied by the interslice distance.For simplicity, it is assumed that n cross-sectional ‘slices’ are taken perpendicular to the axisof a cylindrically symmetric object of length a. Thus, each ‘slice’ is a circle, with a radius rk ,k = 1, . . . , n, and an interslice distance �x = a/n. Hence, each ‘slice’ is a circular disk ofvolume Vk = πr2
k�x, k = 1, . . . , n. Then the planimetric estimate of the object volume V isgiven by
V =∫ a
0πr2(x) dx ≈
n∑k=1
πr2k�x =
n∑k=1
Vk. (18)
Now, assuming that each radius rk has the same variance σ 2r , the variance σ 2
k in Vk is given by
σ 2k =
(∂Vk
∂rk
)2
σ 2r = (2πrk�x)
2σ 2r = (4π�x)Vkσ
2r , k = 1, . . . , n. (19)
Hence, because each slice is measured independently, the variance σ 2V in V is given by
σ 2V =
n∑k=1
σ 2k = (4π�x)
n∑k=1
Vkσ2r = 4πaV
nσ 2r . (20)
Therefore, the fractional variability of a planimetrically measured volume V can be estimatedas:
σV
V=
√4πaσ 2
r
nV. (21)
Thus, the fractional variability in volume measurement using the planimetric method canbe reduced by increasing the number n of independent 2D image ‘slices’ used to make themeasurement. In addition, the fractional variability is proportional to the standard deviationσr in the radial placement of the boundary contour in each ‘slice’, which depends, in part, onthe image resolution in the 2D image ‘slices’.
As an example, for an object of volumeV = 100 cm3 and length a = 5 cm, whose volumehas been planimetrically measured with n = 10 ‘slices’, a distance �x = a/n = 5 mm apart,with a boundary position uncertainty of σr = 1 mm, we estimate from the formula (21) thatthe fractional variability in the volume measurement will be 2.5%.

Three-dimensional ultrasound imaging R91
7.3.6. Intra- and interobserver variability of volume measurements. Volume measurementwith 2D ultrasound requires that the diameter of the organ be measured in at two least images,and that a particular shape must be assumed. For example, using measurements of the heightH ,widthW and lengthLof a prostate from two orthogonal views, and assuming an ellipsoid shape,the volume may be estimated from the formula V = (π/6)HWL (Terris and Stamey 1991).However, organs are not typically well-described by simple geometric shapes, and selection ofthe appropriate orthogonal views and chords to measure H , W and L is largely dependent onobserver preference, leading to high intra- and inter-observer variability in volumes estimatedby this 2D method. Because manual planimetry of 3D ultrasound images uses the entire organfor volume measurement, the intra- and interobserver variability in volumes estimated by this3D method should be lower.
To compare these two methods, Tong et al (1998) measured their intra- and interobservervariability. Eight observers (four experienced radiologists and four technicians or graduatestudents) measured 15 prostate volumes twice with each method. An analysis of variance(ANOVA) was then used to determine the intra- and interobserver standard errors ofmeasurement SEMintra and SEMinter of the prostate volume measurements made using eachmethod (Eliasziw et al 1994, Mitchell et al 1996).
The ANOVA results shown in table 2 demonstrate that the 3D method reduces SEMintra
by about a factor of three and SEMinter by about a factor of two (Tong et al 1998). Often SEMvalues are interpreted in terms of the minimum volume change �V detectable at the 95% levelof confidence, which is given by �V = 2.77 SEM. These values for �V are also given intable 1. For a single observer, they show that the minimum confidently detectable volumechange is 43% for the 2D method but only 14% for the 3D method.
Table 2. Results of the intra- and interobserver study comparing prostate volume measurementsusing 3D ultrasound and the conventional 2D method. �V is the minimum relative prostate volumechange that can be detected between successive prostate volume measurements at the 95% level ofconfidence (�V = 2.77 SEM).
SEM/volume (%) �V /volume (%)
3D 2D 3D 2D
Intraobserver 5.1 15.5 14 43Interobserver 11.4 21.9 32 61
Also, Chang et al (1997) have compared the reproducibility of the two methods for theassessment of foetal liver volume, and report that the intra- and interobserver reproducibilityare improved with the 3D method. Their volume measurements had an intraobserver standarddeviation of 8.46 cm3 for the 2D method and 2.15 cm3 for 3D method.
8. Segmentation of 3D ultrasound images
Because the use of manual planimetry for identifying organs and measuring their volumesis time-consuming and tedious, investigators are developing automated or semiautomatedsegmentation techniques. Segmentation is the process of partitioning a digital image intoseparate structures. In general, for a technique to be useful, it must be accurate, reproducibleand fast. However, because 3D ultrasound images suffer from artefacts such as shadowing,speckle and poor contrast, fully automated segmentation may result in unacceptable errors.Thus, semiautomated approaches may be better, since they allow image-specific initializationand editing of the results (Ladak et al 2000).

R92 A Fenster et al
Successful segmentation approaches in 3D ultrasound imaging have been based ondeformable models, which make use of geometric objects (1D contours, 2D surfaces or 3Dsolids) that deform to fit the desired image features (Lobregt et al 1995, Gill et al 2000, Ladaket al 2000, McInerney and Terzopoulos 1996). External forces are used to deform the model,while internal forces within the model provide the desired degree of stiffness, or resistanceto deformation. Gill et al (2000) have used this approach to segment the carotid arteries in3D B-mode images. Their approach comprises three major steps: (a) interactive placementof an initial balloon model inside the lumen; (b) automatic inflation of the model towards thearterial wall and (c) automatic localization of the arterial wall. The model shape is describedby a triangular mesh. The equation of motion for each vertex on the mesh is given by
mixi(t) + vi xi(t) + g(xi(t)) = f (xi(t)) (22)
where xi(t), xi (t) and xi (t) are respectively the vertex 3D position, velocity and acceleration attime t respectively, mi is its mass, vi is its damping coefficient, g(xi(t)) is the resultant surfacetension at the vertex and f (xi(t)) is a ‘driving’ force. Equilibrium is attained when both xi (t)and xi (t) become zero, which can take a very long time. However, by setting mi = 0 andvi = 1 for the system, the equation of motion reduces to
xi (t) = f (xi(t))− g(xi(t)). (23)
Equilibrium is then attained when xi (t) becomes zero, which can occur quickly, because thesystem does not possess inertia. To compute the equilibrium position of each vertex, and hencethe deformed shape of the model, the model is inflated by iteratively updating xi(t) via theformula
xi(t + �t) ≈ xi(t) + xi (t)�t (24)
until xi (t) is sufficiently small at all vertices. When the model inflation stops, the mesh providesan approximation of the vessel boundary. At this stage, the ‘driving’ force f (xi(t)) is replacedby an image-based force fedge(xi(t)), that locally modifies the mesh to conform to fine detailsin the 3D image. This force is defined in terms of the potential function P(xi(t)) defined by(Gill et al 2000):
P(xi(t)) = 1
|∇(Gσ ∗ I )| + ε(25)
where (Gσ ∗ I ) represents the convolution of a 3D Gaussian smoothing filter of characteristicwidth σ with the image intensity I (xi(t)), ∇ denotes the gradient operator and ε is a smallpositive constant to prevent division by zero. Minima of the potential function coincide withthe arterial wall. This potential function produces the force field that is used to deform themodel:
fedge(xi(t)) = −kedge∇P(xi(t)). (26)
The strength of the force is controlled by the coefficient kedge, the value of which must beoptimized to allow the mesh to conform to the vessel surface.
9. Trends and future developments
Advances in the past 5 years now allow real-time or fast 3D acquisition, real-timereconstruction, and 3D visualization with real-time image manipulation. The availabilityof clinically useful 3D ultrasound systems is allowing users to focus on demonstratingtheir clinical utility. Also, advanced visualization and measurement tools are allowingthe examination of complex anatomical structures and the accurate measurement of

Three-dimensional ultrasound imaging R93
(a)
(b)
Figure 11. 3D image of a prostate after a brachytherapy procedure. The radioactive seeds appearas bright structures. Panel (a) shows a transverse view from a 3D ultrasound image, and panel (b)shows the same view from a CT image.
complex volumes. These have been particularly important in obstetrics, cardiology and urology(Nelson et al 1999, Baba and Jurkovic 1997). Although 3D ultrasound has been shown to beuseful, progress still needs to be made for this technique to become a routine tool. The followingare current trends and needed developments in 3D ultrasonography.
9.1. The use of 3D ultrasound in brachytherapy
Current practice involves acquiring 2D ultrasound images of the prostate at 5 mm intervals.With these, the dose plan is made and then the radioactive seeds are implanted. The availabilityof 3D ultrasonography may allow the development of an intraoperative technique (Blake et al2000). Using 3D ultrasound, the image of the prostate could be obtained quickly and a doseplan made with a 3D image of the prostate. After implantation, the brachytherapy seeds

R94 A Fenster et al
could be accurately detected and their locations determined. Views of a patient’s prostate afterbrachytherapy seed implantation are shown in figure 11. Although the seeds are difficult todistinguish, image processing might improve their contrast, which would allow them to beautomatically segmented.
9.2. The need for improved free-hand scanning and 2D arrays
Although free-hand scanning techniques are already in use, they are still subject to potentialartefacts and inaccuracies. Further progress is needed for these techniques to become routinetools producing high-quality images under all circumstances. In addition, improvements in2D arrays are still required to produce 3D images whose quality is similar to those currentlybeing produced with conventional 1D arrays. Nevertheless, 2D arrays producing 3D imagesdirectly are already useful when real-time 3D imaging is required, as in echocardiography.
9.3. The need for improved visualization tools
Current 3D ultrasound imaging systems already make use of real-time visualization tools.However, these tools are generally difficult to use, and require complicated user interfaces. For3D ultrasound imaging to become widely accepted, intuitive tools are required to manipulate the3D image so that the user may view any section of the anatomy in relation to any other sections.In addition, intuitive real-time tools are needed to produce volume-rendered images. Currently,the production of volume-rendered images requires multiple parameters to be manipulated.Techniques are needed that provide immediate optimal rendering, based on both image dataand reference data for the organ being viewed, without significant user intervention.
9.4. Conclusions
Clinical experience with 3D ultrasound has already demonstrated the clear advantages it offersboth for the diagnosis of disease and in providing image guidance for minimally invasivetherapy. Technical advances will improve 3D imaging even further, making it a routine tool.Although advances are required in both 3D visualization software and hardware, the potentialfor innovation is clearly present. Based on the pace of development over the past 5 years, manymajor advances can be anticipated over the next 5 years, leading to improvements in existingapplications and to the development of new applications in a wide variety of medical disciplines.
References
Baba K and Jurkovic D 1997 Three-Dimensional Ultrasound in Obstetrics and Gynecology (New York: Parthenon)Bamber J C, Eckersley R J, Hubregtse P, Bush N L, Bell D S and Crawford D C 1992 Data processing for 3-D
ultrasound visualization of tumour anatomy and blood flow Proc. SPIE 1808 651–63Belohlavek M, Foley D A, Gerber T C, Greenleaf J F and Seward J B 1994 Three-dimensional reconstruction of color
Doppler jets in the human heart J. Am. Soc. Echocardiogr. 7 553–60Belohlavek M, Foley D A, Gerber T C, Kinter T M, Greenleaf J F and Seward J B 1993 Three- and four-dimensional
cardiovascular ultrasound imaging: a new era for echocardiography Mayo Clin. Proc. 68 221–40Bezdek J C, Hall L O and Clarke L P 1993 Review of MR image segmentation techniques using pattern recognition
Med. Phys. 20 1033–48Blake C, Elliot T, Slomka P, Downey D and Fenster A 2000 Variability and accuracy of measurements of prostate
brachytherapy seed position in vitro using three dimensional ultrasound: an intra- and inter-observer studyMed. Phys. 27 2788–95
Bonilla-Musoles F, Raga F, Osborne N G and Blanes J 1995 Use of three-dimensional ultrasonography for the studyof normal and pathologic morphology of the human embryo and fetus: preliminary report J. Ultrasound Med.14 757–65

Three-dimensional ultrasound imaging R95
Brinkley J F, McCallum W D, Muramatsu S K and Liu D Y 1982 Fetal weight estimation from ultrasonic three-dimensional head and trunk reconstructions: evaluation in vitro Am. J. Obstet. Gynecol. 144 715–21
——1984 Fetal weight estimation from lengths and volumes found by three-dimensional ultrasonic measurementsJ. Ultrasound Med. 3 163–8
Brinkley J F, Muramatsu S K, McCallum W D and Popp R L 1982 In vitro evaluation of an ultrasonic three-dimensionalimaging and volume system Ultrason Imaging 4 126–39
Brunner M, Obruca A, Bauer P and Feichtinger W 1995 Clinical application of volume estimation based on three-dimensional ultrasonography Ultrasound Obstet. Gynecol. 6 358–61
Cardinal H N, Gill J and Fenster A 2000 Analysis of geometrical distortion and statistical variance in length, area,and volume in a linearly scanned 3D ultrasound image IEEE Trans. Med. Imaging 19 632–51
Carson P L, Li X, Pallister J, Moskalik A, Rubin J M and Fowlkes J B 1993 Approximate quantification of detectedfractional blood volume and perfusion from 3-D color flow and Doppler power signal imaging Ultrasonics Symp.Proc. (Piscataway, NJ: IEEE) pp 1023–6
Chang F M, Hsu K F, Ko H C, Yao B L, Chang C H, Yu C H, Liang R I and Chen H Y 1997 Fetal heart volumeassessment by three-dimensional ultrasound Ultrasound Obstet. Gynecol. 9 42–8
Chin J L, Downey D B, Mulligan M and Fenster A 1998 Three-dimensional transrectal ultrasound guided cryoablationfor localized prostate cancer in nonsurgical candidates: a feasibility study and report of early results J. Urol.159 910–14
Chin J L, Downey D B, Onik G and Fenster A 1996 Three-dimensional prostate ultrasound and its application tocryosurgery Tech. Urol. 2 187–93
Chin J L, Downey D B, Tong S, Mclean C A, Elliot T, Fourtier M and Fenster A 1999 Three dimensional transrectalultrasound imaging of the prostate: clinical validation Can. J. Urol. 6 720–6
Coppini G, Poli R and Valli G 1995 Recovery of the 3-D shape of the left ventricle from echocardiographic imagesIEEE Trans. Med. Imaging 14 301–17
Dabrowski W, Dumore-Buyze J, Cardinal H N and Fenster A 2001 A real vessel phantom for flow imaging: 3DDoppler ultrasound of steady flow Ultrasound Med. Biol. at press
De Castro S, Yao J and Pandian N G 1998 Three-dimensional echocardiography: clinical relevance and applicationAm. J. Cardiol. 81 96G–102G
Delabays A, Pandian N G, Cao Q L, Sugeng L, Marx G, Ludomirski A and Schwartz S L 1995 Transthoracic real-time three-dimensional echocardiography using a fan-like scanning approach for data acquisition: methods,strengths, problems, and initial clinical experience Echocardiography 12 49–59
Delabays A, Sugeng L, Pandian N G, Hsu T L, Ho S J, Chen C H, Marx G, Schwartz S L and Cao Q L 1995 Dynamicthree-dimensional echocardiographic assessment of intracardiac blood flow jets Am. J. Cardiol. 76 1053–8
Detmer P R, Bashein G, Hodges T, Beach K W, Filer E P, Burns D H and Strandness D E Jr 1994 3D ultrasonic imagefeature localization based on magnetic scanhead tracking: in vitro calibration and validation Ultrasound Med.Biol. 20 923–36
Downey D B, Chin J L and Fenster A 1995c Three-dimensional US-guided cryosurgery Radiology 197(P) 539Downey D B and Fenster A 1995a Vascular imaging with a three-dimensional power Doppler system Am. J. Roentgenol.
165 665–8——1995b Three-dimensional power Doppler detection of prostatic cancer Am. J. Roentgenol. 165 741Downey D B, Nicolle D A and Fenster A 1995a Three-dimensional orbital ultrasonography Can. J. Ophthalmol. 30
395–8——1995b Three-dimensional ultrasound of the eye Administrative Radiol. J. 14 46–50Eliasziw M, Young S L, Woodbury M G and Fryday-Field K 1994 Statistical methodology for the concurrent
assessment of interrater and intrarater reliability: using goniometric measurements as an example Phys. Ther. 74777–88
Elliot T L, Downey D B, Tong S, McLean C A and Fenster A 1996 Accuracy of prostate volume measurements in vitrousing three-dimensional ultrasound Acad. Radiol. 3 401–6
Favre R, Bader A M and Nisand G 1995 Prospective study on fetal weight estimation using limb circumferencesobtained by three-dimensional ultrasound Ultrasound Obstet. Gynecol. 6 140–4
Fenster A 1998 3-D sonography—technical aspects Echoenhancers and Transcranial Color Duplex Sonographyed U Bogdahn, G Becker and F Schlachetzki (Berlin: Blackwell Science) pp 121–40
Fenster A and Downey D B 1996 3-D ultrasound imaging: A review IEEE Eng. Med. Biol. 15 41–51Fenster A, Tong S, Sherebrin S, Downey D B and Rankin R N 1995 Three-dimensional ultrasound imaging Proc.
SPIE 2432 176–84Fine D, Perring S, Herbetko J, Hacking C N, Fleming J S and Dewbury K C 1991 Three-dimensional (3D) ultrasound
imaging of the gallbladder and dilated biliary tree: reconstruction from real-time B-scans Br. J. Radiol. 641056–7

R96 A Fenster et al
Fine D G, Sapoznikov D, Mosseri M and Gotsman M S 1988 Three-dimensional echocardiographic reconstruction:qualitative and quantitative evaluation of ventricular function Comput Methods Programs Biomed. 26 33–43
Fishman E K, Magid D, Ney D R, Chaney E L, Pizer S M, Rosenman J G, Levin D N, Vannier M W, Kuhlman J Eand Robertson D D 1991 Three-dimensional imaging Radiology 181 321–37
Friemel B H, Bohs L N, Nightingale K R and Trahey G E 1998 Speckle decorrelation due to two-dimensional flowgradients IEEE Trans. Ultrason. Ferroelectr. Frequency Control 45 317–27
Ganapathy U and Kaufman A 1992 3D acquisition and visualization of ultrasound data Proc. SPIE 1808 535–45Geiser E A, Christie L G Jr, Conetta D A, Conti C R and Gossman G S 1982 A mechanical arm for spatial registration
of two-dimensional echocardiographic sections Cathet. Cardiovasc. Diagn. 8 89–101Gerscovich E O, Greenspan A, Cronan M S, Karol L A and McGahan J P 1994 Three-dimensional sonographic
evaluation of developmental dysplasia of the hip: preliminary findings Radiology 190 407–10.Ghosh A, Nanda N C and Maurer G 1982 Three-dimensional reconstruction of echo-cardiographic images using the
rotation method Ultrasound Med. Biol. 8 655–61Gilja O H, Detmer P R, Jong J M, Leotta D F, Li X N, Beach K W, Martin R and Strandness D E Jr 1997 Intragastric
distribution and gastric emptying assessed by three-dimensional ultrasonography Gastroenterology 113 38–49Gilja O H, Smievoll A I, Thune N, Matre K, Hausken T, Odegaard S and Berstad A 1995 In vivo comparison of
3D ultrasonography and magnetic resonance imaging in volume estimation of human kidneys Ultrasound Med.Biol. 21 25–32
Gilja O H, Thune N, Matre K, Hausken T, Odegaard S and Berstad A 1994 In vitro evaluation of three-dimensionalultrasonography in volume estimation of abdominal organs Ultrasound Med. Biol. 20 157–65
Gill J, Ladak H, Steinman D and Fenster A 2000 Accuracy and variability assessment of semi-automatic techniquefor segmentation of the carotid arteries from 3D ultrasound images Med. Phys. 27 1333–42
Greenleaf J F, Belohlavek M, Gerber T C, Foley D A and Seward J B 1993 Multidimensional visualization inechocardiography: an introduction Mayo Clin. Proc. 68 213–20
Guo Z and Fenster A 1996 Three-dimensional power Doppler imaging: a phantom study to quantify vessel stenosisUltrasound Med. Biol. 22 1059–69
Guo Z, Moreau M, Rickey D W, Picot P A and Fenster A 1995 Quantitative investigation of in vitro flow usingthree-dimensional colour Doppler ultrasound Ultrasound Med. Biol. 21 807–16
Hodges T C, Detmer P R, Burns D H, Beach K W and Strandness D E Jr 1994 Ultrasonic three-dimensionalreconstruction: in vitro and in vivo volume and area measurement Ultrasound Med. Biol. 20 719–29
Hughes S W, D’Arcy T J, Maxwell D J, Chiu W, Milner A, Saunders J E and Sheppard R J 1996 Volume estimation frommultiplanar 2D ultrasound images using a remote electromagnetic position and orientation sensor UltrasoundMed. Biol. 22 561–72
King D L, Gopal A S, Sapin P M, Schroder K M and Demaria A N 1993 Three-dimensional echocardiography Am.J. Card. Imaging 7 209–20
King D L, Harrison MR, King D L Jr, Gopal A S, Kwan O L and DeMaria A N 1992 Ultrasound beam orientationduring standard two-dimensional imaging: assessment by three-dimensional echocardiography J. Am. Soc.Echocardiogr. 5 569–76
King D L, King D L Jr and Shao M Y 1990 Three-dimensional spatial registration and interactive display of positionand orientation of real-time ultrasound images J. Ultrasound Med. 9 525–32
——1991 Evaluation of in vitro measurement accuracy of a three-dimensional ultrasound scanner J. Ultrasound Med.10 77–82
Kirbach D and Whittingham T A 1994 3D ultrasound—the kretztechnik voluson approach Eur. J. Ultrasound 1 85–9Kuo H C, Chang F M, Wu C H, Yao B L and Liu C H 1992 The primary application of three-dimensional
ultrasonography in obstetrics Am. J. Obstet. Gynecol. 166 880–6Ladak H, Mao F, Wang Y, Downey D B, Steinman D and Fenster A 2000 Prostate boundary segmentation from 2D
ultrasound images Med. Phys. 27 1777–88Lees W A 1992 3-D ultrasound images optimize fetal review Diagn. Imaging 14 69–73Leotta D F, Detmer P R and Martin R W 1997 Performance of a miniature magnetic position sensor for three-
dimensional ultrasound imaging Ultrasound Med. Biol. 23 597–609Levine R A, Handschumacher M D, Sanfilippo A J, Hagege A A, Harrigan P, Marshall J E and Weyman A E 1989
Three-dimensional echocardiographic reconstruction of the mitral valve, with implications for the diagnosis ofmitral valve prolapse Circulation 80 589–98
Levoy M 1990a Volume rendering, a hybrid ray tracer for rendering polygon and volume data IEEE Comput. GraphicsAppl. 10 33–40
——1990b Efficient ray tracing of volume data ACM Trans. Graphics 9 245–61Linker D T, Moritz W E and Pearlman A S 1986 A new three-dimensional echocardiographic method of right
ventricular volume measurement: in vitro validation J. Am. Coll. Cardiol. 8 101–6

Three-dimensional ultrasound imaging R97
Lobregt S and Viergever M A 1995 A discrete dynamic contour model IEEE Trans. Med. Imaging 14 12–24Mao F, Gill J, Downey D B and Fenster A 2000 Segmentation of carotid artery in ultrasound images: method
development and evaluation technique Med. Phys. 27 1961–70Martin R W and Bashein G 1989 Measurement of stroke volume with three-dimensional transesophageal ultrasonic
scanning: comparison with thermodilution measurement Anesthesiology 70 470–6Martin R W, Bashein G, Detmer P R and Moritz W E 1990 Ventricular volume measurement from a multiplanar
transesophageal ultrasonic imaging system: an in vitro study IEEE Trans. Biomed. Eng. 3: 442–9McCann H A, Chandrasekaran K, Hoffman E A, Sinak L J, Kinter T M and Greenleaf J F 1987 A method for
three-dimensional ultrasonic imaging of the heart in vivo Dynamic Cardiovasc. Imaging 1 97–109McCann H A, Sharp J C, Kinter T M, McEwan C N, Barillot C and Greenleaf J F 1988 Multidimensional ultrasonic
imaging for cardiology Proc. IEEE 76 1063–73McInerney T and Terzopoulos D 1996 Deformable models in medical image analysis: a survey Med. Image Anal. 1
91–108Mitchell J R, Karlik S J, Lee D H, Eliasziw M, Rice G P and Fenster A 1996 The variability of manual and computer
assisted quantification of multiple sclerosis lesion volumes Med. Phys. 23 85–97Moritz W E, Pearlman A S, McCabe D H, Medema D K, Ainsworth M E and Boles M S 1983 An ultrasonic
technique for imaging the ventricle in three dimensions and calculating its volume IEEE Trans. Biomed. Eng. 30482–92
Nadkarni S K, Boughner D R, Drangova M and Fenster A 2000a Three-dimensional echocardiography: assessmentof inter- and intra-operator variability and accuracy in the measurement of left ventricular cavity volume andmyocardial mass Phys. Med. Biol. 45 1255–73
——2000b Three-dimensional echocardiography: Assessment of inter- and intra-operator variability and accuracy inthe measurement of left ventricular cavity volumes and myocardial masses Phys. Med. Biol. 45 1255–73
Nelson T R, Downey D B, Pretorius D H and Fenster A 1999 Three-Dimensional Ultrasound (Philadelphia, PA:Lippincott Williams & Wilkins)
Nelson T R and Elvins T T 1993 Visualization of 3D ultrasound data IEEE Comput. Graphics Appl. 13 50–7Nelson T R and Pretorius D H 1992 Three-dimensional ultrasound of fetal surface features Ultrasound Obstet. Gynecol.
2 166–74——1995 Visualization of the fetal thoracic skeleton with three-dimensional sonography: a preliminary report Am.
J. Roentgenol. 164 1485–8——1998 Three-dimensional ultrasound imaging Ultrasound Med. Biol. 24 1243–70Nelson T R, Pretorius D H, Sklansky M and Hagen-Ansert S 1996 Three-dimensional echocardiographic evaluation
of fetal heart anatomy and function: acquisition, analysis, and display J. Ultrasound Med. 15 1–9Neveu M, Faudot D and Derdouri B 1994 Recovery of 3D deformable models from echocardiographic images
Proc. SPIE 2299 367–76Nixon J V, Saffer S I, Lipscomb K and Blomqvist C G 1983 Three-dimensional echoventriculography Am. Heart. J.
106 435–43Ofili E O and Nanda N C 1994 Three-dimensional and four-dimensional echocardiography Ultrasound Med. Biol. 20
669–75Ohbuchi R, Chen D and Fuchs H 1992 Incremental volume reconstruction and rendering for 3D ultrasound imaging
Proc. SPIE 1808 312–23Onik G M, Downey D B and Fenster A 1996 Three-dimensional sonographically monitored cryosurgery in a prostate
phantom J. Ultrasound Med. 15 267–70Pandian N G, Nanda N C, Schwartz S L, Fan P, Cao Q L, Sanyal R, Hsu T L, Mumm B, Wollschlager H and
Weintraub A 1992 Three-dimensional and four-dimensional transesophageal echocardiographic imaging of theheart and aorta in humans using a computed tomographic imaging probe Echocardiography 9 677–87
Picot P A, Rickey D W, Mitchell R, Rankin R N and Fenster A 1991 Three-dimensional colour Doppler imaging ofthe carotid artery Proc. SPIE 1444 206–13
——1993 Three-dimensional colour Doppler imaging Ultrasound Med. Biol. 19 95–104Prager R W, Gee A and Berman L 1998 Stradx: real-time acquisition and visualization of freehand three-dimensional
ultrasound Med. Image Anal. 3 129–40Pretorius D H and Nelson T R 1994 Prenatal visualization of cranial sutures and fontanelles with three-dimensional
ultrasonography J. Ultrasound Med. 13 871–6——1995 Fetal face visualization using three-dimensional ultrasonography J. Ultrasound Med. 14 349–56Pretorius D H, Nelson T R and Jaffe J S 1992 3-dimensional sonographic analysis based on color flow Doppler and
gray scale image data: a preliminary report J. Ultrasound Med. 11 225–32Raab F H, Blood E B, Steiner T O and Jones H R 1979 Magnetic position and orientation tracking system IEEE Trans.
Aerospace Electron. Syst. 15 709–17

R98 A Fenster et al
Rankin R N, Fenster A, Downey D B, Munk P L, Levin M F and Vellet A D 1993 Three-dimensional sonographicreconstruction: techniques and diagnostic applications Am. J. Roentgenol. 161 695–702
Reid D B, Douglas M and Diethrich E B 1995 The clinical value of three-dimensional intravascular ultrasound imagingJ. Endovasc. Surg. 2 356–64
Riccabona M, Johnson D, Pretorius D H and Nelson T R 1996 Three dimensional ultrasound: display modalities inthe fetal spine and thorax Eur. J. Radiol. 22 141–5
Riccabona M, Nelson T R and Pretorius D H 1996 Three-dimensional ultrasound: accuracy of distance and volumemeasurements Ultrasound Obstet. Gynecol. 7 429–34
Riccabona M, Nelson T R, Pretorius D H and Davidson T E 1995 Distance and volume measurement using three-dimensional ultrasonography J. Ultrasound Med. 14 881–6
Rivera J M, Siu S C, Handschumacher M D, Lethor J P, Guerrero J L, Vlahakes G J, Mitchell J D, Weyman A E,King M E and Levine R A 1994 Three-dimensional reconstruction of ventricular septal defects: validationstudies and in vivo feasibility J. Am. Coll. Cardiol. 23 201–8
Robb R A 1995 Three-dimensional Biomedical Imaging: Principles and Practice (New York: VCH)Robb R A and Barillot C 1989 Interactive display and analysis of 3-D medical images IEEE Trans. Med. Imaging 8
217–26Roelandt J R, ten Cate F J, Vletter W B and Taams M A 1994 Ultrasonic dynamic three-dimensional visualization of
the heart with a multiplane transesophageal imaging transducer J. Am. Soc. Echocardiogr. 7 217–29Ross J J Jr, D’Adamo A J, Karalis D G and Chandrasekaran K 1993 Three-dimensional transesophageal echo imaging
of the descending thoracic aorta Am. J. Cardiol. 71 1000–2Sawada H, Fujii J, Kato K, Onoe M and Kuno Y 1983 Three dimensional reconstruction of the left ventricle from
multiple cross sectional echocardiograms. Value for measuring left ventricular volume Br. Heart J. 50 438–42Shattuck D P, Weinshenker M D, Smith S W and von Ramm O T 1984 Explososcan: a parallel processing technique
for high speed ultrasound imaging with linear phased arrays J. Acoust. Soc. Am. 75 1273–82Sivan E, Chan L, Uerpairojkit B, Chu G P and Reece E A 1997 Growth of the fetal forehead and normative dimensions
developed by three-dimensional ultrasonographic technology J. Ultrasound Med. 16 401–5Smith W L and Fenster A 2000 Optimum scan spacing for three-dimensional ultrasound by speckle statistics
Ultrasound Med. Biol. 26 551–62Smith S W, Pavy H G Jr and von Ramm O T 1991 High-speed ultrasound volumetric imaging system. Part I. Transducer
design and beam steering IEEE Trans. Ultrason. Ferroelectr. Frequency Control 38 100–8Smith S W, Trahey G E and von Ramm O T 1992 Two-dimensional arrays for medical ultrasound Ultrasonic Imaging
14 213–33Snyder J E, Kisslo J and von Ramm O 1986 Real-time orthogonal mode scanning of the heart. I. System design J. Am.
Coll. Cardiol. 7 1279–85Sohn C 1989 A new diagnostic technique: three-dimensional ultrasound imaging Ultrasonics International ’89 Conf.
Proc. 1148–53Sohn C and Grotepass J 1989 Representation tridimensionnelle par ultrason Radiologie J. CEPUR 9 249–53 (in
French)Sohn C, Grotepass J, Schneider W, Funk A, Sohn G, Jensch P, Fendel H, Ameling W and Jung H 1988 Initial studies
of 3-dimensional imaging using ultrasound Z. Geburtshilfe Perinatol. 192 241–8 (in German)Sohn C, Grotepass J and Swobodnik W 1989 Possibilities of 3-dimensional ultrasound imaging Ultraschall. Med. 10
307–13 (in German)Sohn C and Rudofsky G 1989 Die dreidimensionale ultraschalldiagnostik—ein neues verfahren fur die klinische
routine? Ultraschall. Klin. Prax. 4 219–24 (in German)Sohn C H, Stolz W, Kaufmann M and Bastert G 1992 Three-dimensional ultrasound imaging of benign and malignant
breast tumors—initial clinical experiences Geburts. Frauenheilkd. 52 520–5Terris M K and Stamey T A 1991 Determination of prostate volume by transrectal ultrasound J. Urol. 145 984–7Tong S, Cardinal H N, Downey D B and Fenster A 1998 Analysis of linear, area and volume distortion in 3D ultrasound
imaging Ultrasound Med. Biol. 24 355–73Tong S, Cardinal H N, McLoughlin R F, Downey D B and Fenster A 1998 Intra- and inter-observer variability
and reliability of prostate volume measurement via two-dimensional and three-dimensional ultrasound imagingUltrasound Med. Biol. 24 673–81
Tong S, Downey D B, Cardinal H N and Fenster A 1996 A three-dimensional ultrasound prostate imaging systemUltrasound Med. Biol. 22 735–46
Turnbull D H and Foster F S 1991 Beam steering with pulsed two-dimensional transducer arrays IEEE Trans. Ultrason.Ferroelectr. Frequency Control 38 320–33
Tuthill T A, Krucker J F, Fowlkes J B and Carson P L 1998 Automated three-dimensional US frame positioningcomputed from elevational speckle decorrelation Radiology 209 575–82

Three-dimensional ultrasound imaging R99
Tuy H K and Tuy L T 1984 Direct 2-D display of 3-D objects IEEE Comput. Graphics Appl. 4 29–33Udupa J K 1999 Three-dimensional visualization and analysis methodologies: a current perspective Radiographics
19 783–806Udupa J K, Hung H M and Chuang K S 1991 Surface and volume rendering in three-dimensional imaging: a
comparison J. Digital Imaging 4 159–68Vannier M W, Marsh J L and Warren J O 1984 Three dimensional CT reconstruction images for craniofacial surgical
planning and evaluation Radiology 150 179–84von Ramm O T and Smith S W 1990 Real time volumetric ultrasound imaging system Proc. SPIE 1231 15–22von Ramm O T, Smith S W and Pavy H G J 1991 High-speed ultrasound volumetric imaging system. Part II. Parallel
processing and image display IEEE Trans. Ultrason. Ferroelectr. Frequency Control 38 109–15Wang X F, Li Z A, Cheng T O, Deng Y B, Zheng L H, Hu G and Lu P 1994 Clinical application of three-dimensional
transesophageal echocardiography Am. Heart. J. 128 380–8Weiss J L, Eaton L W, Kallman C H and Maughan W L 1983 Accuracy of volume determination by two-dimensional
echocardiography: defining requirements under controlled conditions in the ejecting canine left ventricleCirculation 67 889–95
Wild J J and Reid J M 1952 Application of echo-ranging techniques to the determination of the structure of biologicaltissues Science 115 226–30
Wollschlager H, Zeiher A M, Geibel A, Kasper W and Just H 1993 Transesophageal echo computer tomography ofthe heart Cardiac Ultrasound ed J R T C Roelandt et al (London: Churchill Livingstone) pp 181–5
Zosmer N, Jurkovic D, Jauniaux E, Gruboeck K, Lees C and Campbell S 1996 Selection and identification of standardcardiac views from three-dimensional volume scans of the fetal thorax J. Ultrasound Med. 15 25–32