third quarter 2021 financial results
TRANSCRIPT

Making every drive better™
1
Third Quarter 2021
Financial ResultsNovember 2, 2021
Ray Scott, President and CEOJason Cardew, Senior Vice President and CFO

Lear Proprietary: The information contained herein is the property of Lear Corporation.
Forward-Looking Statements
This presentation contains forward-looking statements within the meaning of the Private Securities Litigation Reform Act of 1995, including
statements regarding anticipated financial results and liquidity. The words “will,” “may,” “designed to,” “outlook,” “believes,” “should,” “anticipates,”
“plans,” “expects,” “intends,” “estimates,” “forecasts” and similar expressions identify certain of these forward-looking statements. The Company
also may provide forward-looking statements in oral statements or other written materials released to the public. All statements contained or
incorporated in this presentation or in any other public statements that address operating performance, events or developments that the Company
expects or anticipates may occur in the future are forward-looking statements. Factors that could cause actual results to differ materially from these
forward-looking statements are discussed in the Company’s Annual Report on Form 10-K for the year ended December 31, 2020, its Quarterly
Report on Form 10 Q for the quarter ended April 3, 2021, and its other Securities and Exchange Commission filings. Future operating results will be
based on various factors, including the impact of the ongoing COVID-19 pandemic on the Company’s business and the global economy, supply chain
disruptions, actual industry production volumes, commodity prices, the impact of restructuring actions and the Company’s success in implementing
its operating strategy.
Information in this presentation relies on assumptions in the Company’s sales backlog. The Company’s sales backlog reflects anticipated net sales
from formally awarded new programs less lost and discontinued programs. The Company enters into contracts with its customers to provide
production parts generally at the beginning of a vehicle’s life cycle. Typically, these contracts do not provide for a specified quantity of production,
and many of these contracts may be terminated by the Company’s customers at any time. Therefore, these contracts do not represent firm orders.
Further, the calculation of the sales backlog does not reflect customer price reductions on existing or newly awarded programs. The sales backlog
may be impacted by various assumptions embedded in the calculation, including vehicle production levels on new programs, foreign exchange rates
and the timing of major program launches.
The forward-looking statements in this presentation are made as of the date hereof, and the Company does not assume any obligation to update,
amend or clarify them to reflect events, new information or circumstances occurring after the date hereof.
Non-GAAP Financial Information
This presentation also contains non-GAAP financial information. For additional information regarding the Company’s use of non-GAAP financial
information, as well as reconciliations of non-GAAP financial measures to the most directly comparable financial measures calculated and presented
in accordance with accounting principles generally accepted in the United States (“GAAP”), please see slides titled “Non-GAAP Financial Information”
at the end of this presentation.
Safe Harbor Statement
2

Lear Proprietary: The information contained herein is the property of Lear Corporation. 3
Agenda
BUSINESS UPDATERay Scott, President and CEO
FINANCIAL REVIEW Jason Cardew, Senior Vice President and CFO
CONCLUDING REMARKSRay Scott, President and CEO

Business Update
Ray Scott, President and CEO

Lear Proprietary: The information contained herein is the property of Lear Corporation.
SALES CORE OPERATING EARNINGS
ADJUSTED EARNINGS PER SHARE
ADJUSTED OPERATING MARGIN
Financial OverviewThird Quarter 2021
$4.3B $98M
$0.53 2.3%
Q3 2020 $4.9B Q3 2020 $327M
Q3 2020 $3.73 Q3 2020 6.7%
5Please see appendix for discussion of non-GAAP financial measures, as well as reconciliations of non-GAAP financial measuresto the most directly comparable financial measures calculated and presented in accordance with GAAP.
Lear Proprietary: The information contained herein is the property of Lear Corporation.
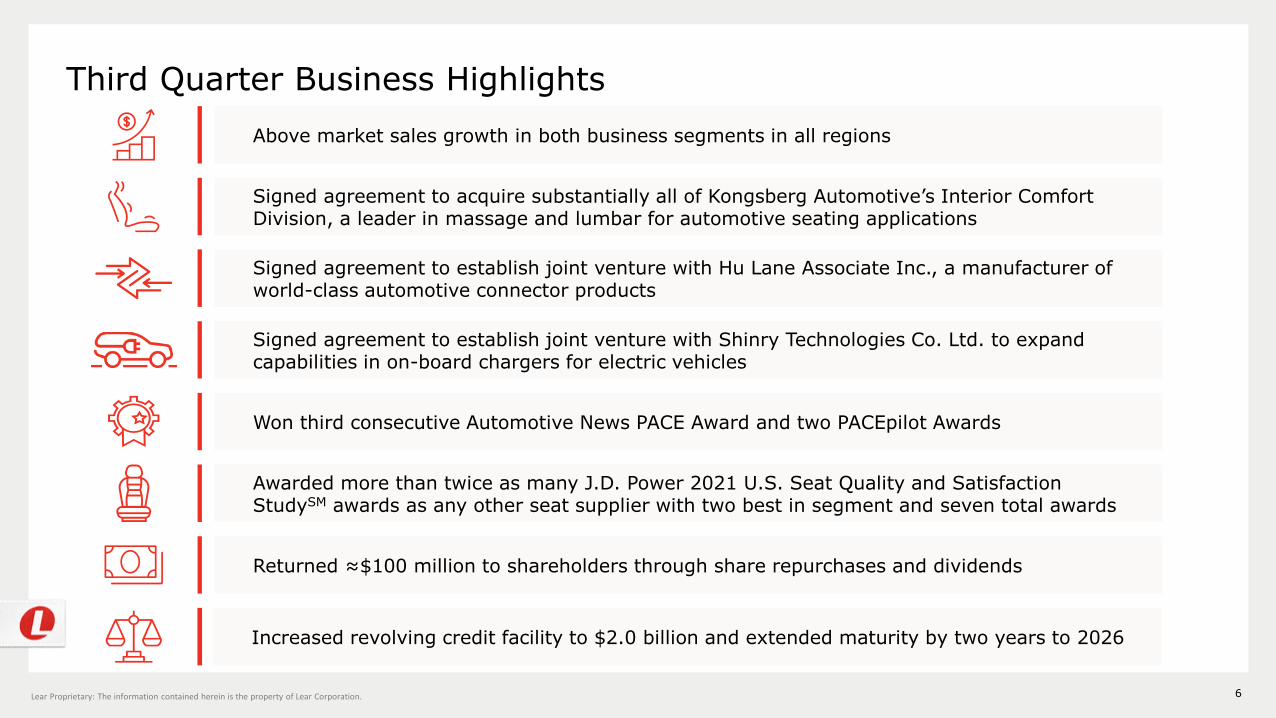
Third Quarter Business Highlights
Won third consecutive Automotive News PACE Award and two PACEpilot Awards
6
Returned ≈$100 million to shareholders through share repurchases and dividends
Signed agreement to acquire substantially all of Kongsberg Automotive’s Interior Comfort Division, a leader in massage and lumbar for automotive seating applications
Above market sales growth in both business segments in all regions
Increased revolving credit facility to $2.0 billion and extended maturity by two years to 2026
Awarded more than twice as many J.D. Power 2021 U.S. Seat Quality and Satisfaction StudySM awards as any other seat supplier with two best in segment and seven total awards
Signed agreement to establish joint venture with Shinry Technologies Co. Ltd. to expand capabilities in on-board chargers for electric vehicles
Signed agreement to establish joint venture with Hu Lane Associate Inc., a manufacturer of world-class automotive connector products

Lear Proprietary: The information contained herein is the property of Lear Corporation.
Seating Update
• Grew sales eight percentage points faster than the market
• Awarded key programs with General Motors, BMW, Stellantis, Nio and Great Wall in third quarter; pursuing additional opportunities in the fourth quarter
• Received additional development award for ConfigurE+ program launching in 2026
• Executing key launches – GM full-size pickup truck (Oshawa), Ford Maverick, Land Rover Range Rover and Renault Megane E-Tech
• Broke ground on new energy efficient JIT facility in Detroit to support GM Battery Electric Truck (BET) programs at Factory Zero
• Leadership in innovation recognized by the Automotive News with a PACEpilot award for INTU™ Thermal Comfort with Gentherm’sClimateSense™
• Most honored supplier in J.D. Power U.S. Seat Quality and Satisfaction StudySM
• Kongsberg acquisition will expand Lear’s capabilities in thermal comfort systems
7

Lear Proprietary: The information contained herein is the property of Lear Corporation. 8
Kongsberg Automotive Interior Comfort Division Overview
4 plants &
5 technical centers ≈3,800 employees
≈$300m
2021E Revenue(1)
Lumbar
Massage
Heat
Ventilation
Revenue by product
Europe
Americas
Asia
Revenue by region
• Market leadership position(2)
- #1 in Massage- #3 in Lumbar
• Scalable pneumatic comfort systems (2-way entry level lumbar to luxury massage)
• Patented shape memory alloy (SMA) technology enables superior performance, weight reduction and packaging flexibility
• Market leadership position(2)
- #2 in Heat Mats- #4 in Vent Systems
• ≈50 years experience in seat heating products
• Aerodynamic vent system design providesbest-in-class performance
(1) 2021E Revenue assumes an average Euro of $1.19 (2) Market share estimates based on 2021 July IHS Markit volume forecast
LUMBAR & MASSAGE PRODUCTS HEAT & VENTILATION PRODUCTS

Lear Proprietary: The information contained herein is the property of Lear Corporation.
• Will strengthen Lear’s leadership position in seating components and technology
• Consistent with Lear’s vertical integration strategy, which has provided a strong foundation of capabilities, competitiveness and financial performance
• Adding lumbar, massage and thermal luxury comfort products will enhance Lear’s seating component and subsystem capabilities
• Complementary to Lear’s suite of intuitive, intelligent seating system technologies providing personalized comfort and wellness features
• Provides opportunity to improve system performance and generate incremental priceable content
• Builds on Lear’s position as the leader in luxury seating
Kongsberg Acquisition Enhances Competitive Advantage in Seating
9
• Rising consumer expectations for personalized and intelligent luxury comfort are driving market growth
• 2021 Total Addressable Market (TAM) of ≈$2.5 to $3.0 billion
Note: Total Addressable Market based on July IHS Markit
TAM Expected To Grow Approximately Two Percentage Points Faster Than Industry Production Over The Next Five Years
MARKET OPPORTUNITY
STRATEGIC BENEFITS

Lear Proprietary: The information contained herein is the property of Lear Corporation.
Mass Market Midsize/Large SUV
Chevrolet Blazer
Lear is the Leader in Seat Quality
Source: J.D. Power 2021 U.S. Seat Quality and Satisfaction StudySM 10
1
Mass Market Midsize /Large SUV
Hyundai Palisade
Mass Market Midsize / Large Car
Dodge Charger
Mass Market Compact Car
Volkswagen Golf
Luxury SUV
BMW X4
Mass Market Truck / Van
GMC Sierra
2
3
Awarded more than twice as many J.D. Power U.S. Seat Quality and Satisfaction StudySM awards as any other seat supplier
Luxury Car
Porsche 718

Lear Proprietary: The information contained herein is the property of Lear Corporation.
• Grew sales nine percentage points faster than the market
• Over $1B of business awards year-to-date; >80% new programs to Lear
• Strong pipeline of quoting opportunities in wiring, connection systems and electronics
• Launching award-winning Battery Disconnect Unit on GMC Hummer EV and the first-to-market 5G Telematics Control Unit (TCU) on Audi vehicles
• Executing key launches – Mercedes SL Class, Volvo C40/XC40 and XC60, and Jaguar I-PACE
• Connection systems business on track to grow to ≈$600 million next year
- Hu Lane joint venture - strengthens Lear’s connection systems capabilities
- IMS partnership - co-developing higher speed ethernet connections which will be used for ADAS, autonomous driving and 4K camera systems and displays
- M&N Plastics acquisition - integration ahead of plan and providing additional insourcing opportunities
• Shinry joint venture expands capabilities in on-board chargers for EVs
E-Systems Update
11

Lear Proprietary: The information contained herein is the property of Lear Corporation.
E-Systems Awarded for Innovation
12
Battery Disconnect Unit
Leading advanceddesign solutions
5G V2X TelematicsControl Unit (TCU)
The future of 5G connected mobility… today

Financial Review
Jason Cardew, Senior Vice President and CFO

Lear Proprietary: The information contained herein is the property of Lear Corporation.
KEY CURRENCIES
Third Quarter 2021Global Vehicle Production and Currency
NORTH AMERICA EUROPE AND AFRICA CHINA
Q3 2020 6.0
Q3 2021 5.0
Q3 2020 4.4
Q3 2021 3.2
Q3 2020 4.0
Q3 2021 3.0
DOWN 19% YOY
Q3 2020 20.1
Q3 2021 16.2
GLOBAL
Euro $1.17 / €
Chinese RMB 6.92 / $
$1.18 / €
6.47 / $
Up 1%
Up 7%
2020 2021
Source: IHS Markit as of October 15, 2021
DOWN 25% YOY DOWN 28% YOY DOWN 16% YOY
INDUSTRY PRODUCTION(units in millions)
14

Lear Proprietary: The information contained herein is the property of Lear Corporation.
Third Quarter 2021
Year-over-year sales growth over market (GoM) excludes the impact of FX, commodities and acquisitions. The year-over-year change in production on a Lear sales-weighted basis is calculated using Lear’s prior year regional sales mix. IHS Markit production has been adjusted to match Lear’s fiscal calendar.
15
▪ Seating: Favorable backlog and platform mix
▪ E-Systems: Favorable platform mix
▪ Seating: Favorable platform mix
▪ E-Systems: Favorable backlog and unfavorable platform mix
NORTH AMERICA12%
EUROPE5%
CHINA4%
Global GoM
9%
Seating GoM
8%
E-Systems GoM
9%
▪ Seating: Favorable backlog and platform mix
▪ E-Systems: Favorable backlog and platform mix
Growth Over Market

Lear Proprietary: The information contained herein is the property of Lear Corporation.
Net Sales
Adjusted Earnings Per Share
Core Operating Earnings
Operating Margin %
Free Cash Flow
$4,900
$3.73
$474
$327
6.7%
$4,268
$0.53
$(157)
$98
2.3%
2020 2021
Lower volume, partially offset by backlog, commodity passthrough and foreign exchange
Lower volume and higher commodity costs, partially offset by operating performance, and backlog
Lower core earnings
Increased working capital, lower earnings, and increased capital expenditures
YEAR-OVER-YEAR DRIVERS
Key FinancialsThird Quarter
16Please see appendix for discussion of non-GAAP financial measures, as well as reconciliations of non-GAAP financial measuresto the most directly comparable financial measures calculated and presented in accordance with GAAP.
($ in millions, except per share amounts)

Lear Proprietary: The information contained herein is the property of Lear Corporation.
$3,692
$3,166$122 $44
$(692)
Q3 2020 Volume / Mix
/ Other
Backlog FX Q3 2021
Seating Sales and Margin DriversThird Quarter
7.8%
(150 bps)
4.5%10 bps
(290) bps100 bps
Q3 2020 Volume /
Mix
Backlog Commodities Net
Performance
Q3 2021
ADJUSTED EARNINGS AND MARGIN
Please see appendix for discussion of non-GAAP financial measures, as well as reconciliations of non-GAAP financial measuresto the most directly comparable financial measures calculated and presented in accordance with GAAP
$144
$262
($ in millions)
17
SALES
$286

Lear Proprietary: The information contained herein is the property of Lear Corporation.
$1,209
$1,102$75 $11 $54
$(247)
Q3 2020 Volume /
Mix / Other
Backlog FX Commodities Q3 2021
E-Systems Sales and Margin DriversThird Quarter
7.7%
2.1%(100) bps
70 bps
(470) bps
(100) bps
Q3 2020 Volume /
Mix
Backlog Commodities Premium
Costs
Net
Performance
Q3 2021
Please see appendix for discussion of non-GAAP financial measures, as well as reconciliations of non-GAAP financial measuresto the most directly comparable financial measures calculated and presented in accordance with GAAP
$93 $41
18
40 bps
ADJUSTED EARNINGS AND MARGINSALES
($ in millions)
$23
(1) Premium Costs include semiconductor and COVID-19 impacts
(1)

Lear Proprietary: The information contained herein is the property of Lear Corporation.
LIQUIDITY AND CAPITAL ALLOCATION
$206
$750
$375 $350
$625
2021 2022 2023 2024 2025 2026 2027 2028 2029 2030 2049
19
Strong Balance Sheet and Ample Liquidity to Invest for Growth
($ in millions)
Term Loan Available Revolver Bonds
$2,000
As of October 28, 2021
DEBT MATURITIES
• Increased revolving credit facility to $2.0 billion and extended maturity by two years to 2026
• $3.1 billion in total liquidity, including $2.0 billion of availability under revolving credit facility
• Long history of positive free cash flow generation
- Primary focus is investing in organic and inorganic profitable growth
- Actively targeting niche acquisitions to increase vertical integration capabilities in both businesses
- Returning excess cash to shareholders
• Returned ≈$100 million to shareholders in the third quarter through share repurchases and dividends
Total liquidity reflects cash balance as of quarter end and revolving credit facility availability of $2 billion as of October 28, 2021

Lear Proprietary: The information contained herein is the property of Lear Corporation.
2021 Outlook – Global Vehicle Production and Currency
NORTH AMERICA EUROPE AND AFRICA CHINA
FY 2020 21.9
FY 2021 21.8
FY 2020 16.9
FY 2021 16.5
FY 2020 13.0
FY 2021 13.0
FLAT
FY 2020 72.8
FY 2021 73.1
GLOBAL
Euro $1.14 / €
Chinese RMB 6.90 / $
$1.19 / €
6.46 / $
Up 4%
Up 6%
2020 2021
Source: IHS Markit as of October 15, 2021, and company estimates for outlook
FLAT DOWN 2% DOWN 1%
INDUSTRY PRODUCTION(units in millions)
KEY CURRENCIES
20
August Outlook Up 6% August Outlook Up 8% August Outlook Up 6% August Outlook Up 3%
vs Prior Year vs Prior Year vs Prior Year vs Prior Year

Lear Proprietary: The information contained herein is the property of Lear Corporation.
$20,100
$(1,040)
$19,000
$(60)
August
Outlook
(Mid-Point)
Volume FX November
Outlook
(Mid-Point)
August Outlook to November Outlook – at Mid-Point
$1,015
$800
$40
$(240) $(5) $(10)
August
Outlook
(Mid-Point)
Volume FX Commodity Net
Performance
November
Outlook
(Mid-Point)
ADJUSTED EARNINGS AND MARGIN
$262
($ in millions)
21
SALES
5.1%
4.2%
Certain of the forward-looking financial measures are provided on a non-GAAP basis. A reconciliation of forward-looking financial measures to the most directly comparable financial measures calculated and presented in accordance with GAAP is potentially misleading and not practical given the difficulty of projecting event driven transactional and other non-core operating items in any future period. The magnitude of these items, however, may be significant.

Lear Proprietary: The information contained herein is the property of Lear Corporation.
August Outlook $19,700 - $20,500 million
22
2021 Full Year Outlook
Certain of the forward-looking financial measures are provided on a non-GAAP basis. A reconciliation of forward-looking financial measures to the most directly comparable financial measures calculated and presented in accordance with GAAP is potentially misleading and not practical given the difficulty of projecting event driven transactional and other non-core operating items in any future period. The magnitude of these items, however, may be significant.
Note: 2021 Outlook assumes an average Euro of $1.19 and an average Chinese RMB of 6.46/$
Core Operating Earnings
$750 - $850 million
Adjusted EBITDA
$1,310 - $1,410 million
Net Sales
$18,800 - $19,200 million
Effective Tax Rate
Adjusted Net Income
Interest Expense
≈$90 million
≈21%
$420 - $500 million
Capital Spending
Free Cash Flow
Restructuring Costs
≈$100 million
≈$600 million
≈$175 million
August Outlook $920 - $1,110 million
August Outlook $565 - $715 millionAugust Outlook $1,480 - $1,670 million August Outlook $350 - $500 million
August Outlook ≈$625 million

Concluding Remarks
Ray Scott, President and CEO

Lear Proprietary: The information contained herein is the property of Lear Corporation.
MONITORING
24
2022 Operating Environment
• Strong consumer demand
• Low dealer inventory
• Strong backlog
• Net performance
• Electrification acceleration
• Financial flexibility
• Innovative products
POSITIVES CHALLENGES
• Elevated working capital
• China energy policy
• Global tax environment
• COVID-19
• Electrification incentives
• Limited visibility on production schedules
• Commodity & labor inflation
• Supply chain disruptions

Appendix

Lear Proprietary: The information contained herein is the property of Lear Corporation. 26
Non-GAAP Financial Information
In addition to the results reported in accordance with GAAP included throughout this presentation, the Company has provided information regarding “pretax income before equity(income) loss, interest, other expense, restructuring costs and other special items” (core operating earnings or adjusted segment earnings), “pretax income before equity (income)loss, interest, other expense, depreciation expense, amortization of intangible assets, restructuring costs and other special items” (adjusted EBITDA), “adjusted net incomeattributable to Lear” (adjusted net income), adjusted diluted net income per share available to Lear common stockholders (adjusted earnings per share), “tax expense excluding theimpact of restructuring costs and other special items” and “free cash flow” (each, a non-GAAP financial measure). Other expense includes, among other things, non-income relatedtaxes, foreign exchange gains and losses, gains and losses related to certain derivative instruments and hedging activities, losses on the extinguishment of debt, gains and losseson the disposal of fixed assets, gains and losses on the consolidation and deconsolidation of affiliates and the non-service cost components of net periodic benefit cost. Adjusted netincome and adjusted earnings per share represent net income (loss) attributable to Lear and diluted net income (loss) per share available to Lear common stockholders,respectively, adjusted for restructuring costs and other special items, including the tax effect thereon. Free cash flow represents net cash provided by (used in) operating activitiesless capital expenditures.
Management believes the non-GAAP financial measures used in this presentation are useful to both management and investors in their analysis of the Company’s financial positionand results of operations. In particular, management believes that core operating earnings, adjusted EBITDA, adjusted net income, adjusted earnings per share and tax expenseexcluding the impact of restructuring costs and other special items are useful measures in assessing the Company’s financial performance by excluding certain items that are notindicative of the Company's core operating performance or that may obscure trends useful in evaluating the Company’s continuing operating activities. Management also believesthat these measures provide improved comparability between fiscal periods. Management believes that free cash flow is useful to both management and investors in their analysisof the Company’s ability to service and repay its debt. Further, management uses these non-GAAP financial measures for planning and forecasting future periods.
Core operating earnings, adjusted EBITDA, adjusted net income, adjusted earnings per share, tax expense excluding the impact of restructuring costs and other special items andfree cash flow should not be considered in isolation or as a substitute for net income (loss) attributable to Lear, diluted net income (loss) per share available to Lear commonstockholders, cash provided by (used in) operating activities or other income statement or cash flow statement data prepared in accordance with GAAP or as a measure ofprofitability or liquidity. In addition, the calculation of free cash flow does not reflect cash used to service debt and, therefore, does not reflect funds available for investment orother discretionary uses. Also, these non-GAAP financial measures, as determined and presented by the Company, may not be comparable to related or similarly titled measuresreported by other companies.
Set forth on the following slides are reconciliations of these non-GAAP financial measures to the most directly comparable financial measures calculated and presented in accordancewith GAAP.

Lear Proprietary: The information contained herein is the property of Lear Corporation.
Non-GAAP Financial Information
27
Core Operating Earnings and Adjusted Margins Third Quarter
($ in millions) 2020 2021
Net sales $ 4,900.1 $ 4,268.2
Net income (loss) attributable to Lear $ 174.4 $ (26.5)
Interest expense 26.5 22.6
Other (Income) expense, net 17.1 11.1
Income taxes 44.6 20.9
Equity in net (income) loss of affiliates (6.5) 1.7
Net income attributable to noncontrolling interests 22.7 17.8
Restructuring costs and other special items -
Costs related to restructuring actions 40.1 48.5
Intangible asset impairment - -
Other 8.3 2.1
Core operating earnings $ 327.2 $ 98.2
Adjusted margins 6.7% 2.3%

Lear Proprietary: The information contained herein is the property of Lear Corporation.
Non-GAAP Financial Information
28
Adjusted Earnings Per Share Third Quarter (In millions, except per share amounts) 2020 2021
Net income (loss) attributable to Lear 174.4 (26.5)
Costs related to restructuring actions 50.3 48.5
Favorable indirect tax ruling in a foreign jurisdiction - 1.0
Other 5.1 2.6
Tax impact of special items and other net tax adjustments 1
(4.6) 6.4
Adjusted net income attributable to Lear 225.2$ 32.0$
Weighted average number of diluted shares outstanding 60.3 59.9
Diluted net income (loss) per share available to Lear common stockholders 2.89$ (0.44)$
Weighted average number of diluted shares outstanding 60.3 60.2
Adjusted earnings per share 3.73$ 0.53$
1 Reflects the tax effect of restructuring costs and other special items, as well as several discrete tax items. The
identification of these tax items is judgmental in nature, and their calculation is based on various assumptions and
estimates.

Lear Proprietary: The information contained herein is the property of Lear Corporation.
Non-GAAP Financial Information
29
Adjusted Segment Earnings and Margins Third Quarter
Seating E-Systems
($ in millions) 2020 2021 2020 2021
Net sales $ 3,691.6 $ 3,166.2 $ 1,208.5 $ 1,102.0
Segment earnings 250.7$ 126.7$ 86.0$ (7.5)$
Restructuring costs and other special items -
Costs related to restructuring actions 34.9 17.1 4.9 30.1
Other 0.7 0.2 2.2 0.4
Adjusted segment earnings 286.3$ 144.0$ 93.1$ 23.0$
Adjusted margins 7.8% 4.5% 7.7% 2.1%
Lear Proprietary: The information contained herein is the property of Lear Corporation.
Non-GAAP Financial Information
30
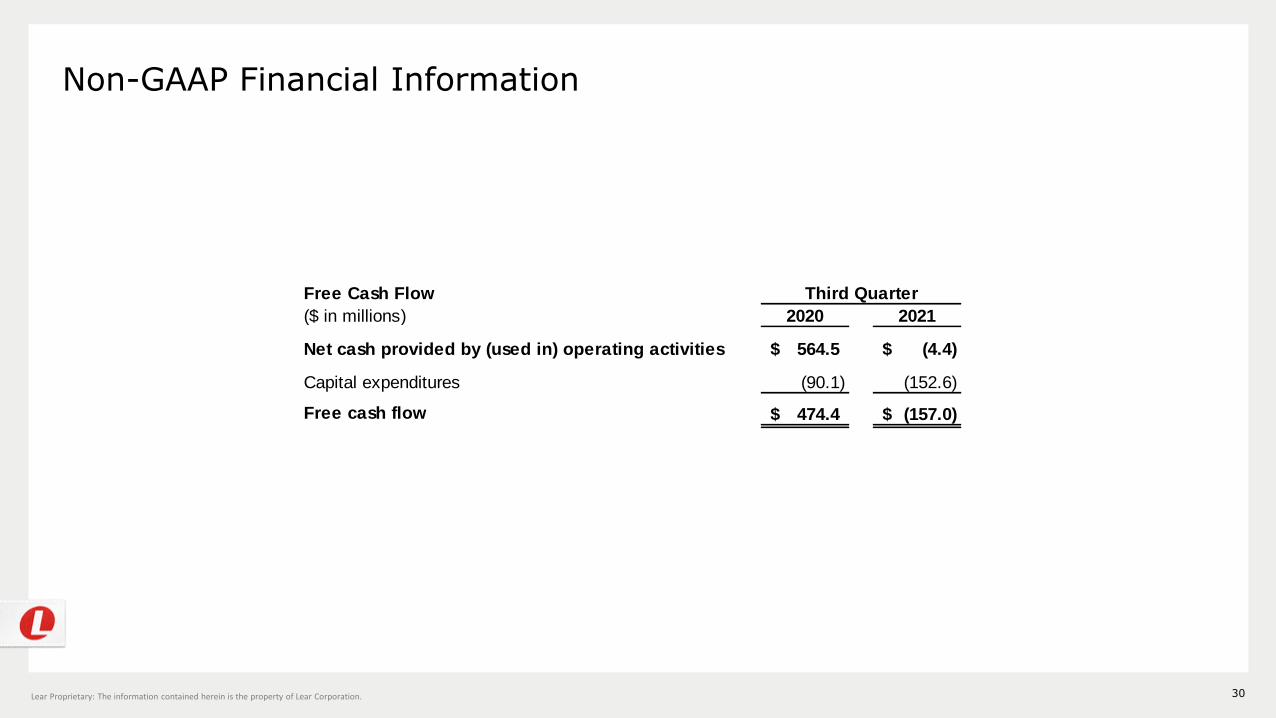
Free Cash Flow Third Quarter
($ in millions) 2020 2021
Net cash provided by (used in) operating activities 564.5$ (4.4)$
Capital expenditures (90.1) (152.6)
Free cash flow 474.4$ (157.0)$

Lear Proprietary: The information contained herein is the property of Lear Corporation.
(in millions, except per share amounts)
Restructuring Other
Reported Costs Special Items Adjusted
Pretax Income Before Equity Loss, Interest
and Other Expense 47.6$ 48.5$ 2.1$ 98.2$
Equity Loss 1.7 1.7
Pretax Income Before Interest and Other
Expense 45.9$ 96.5$
Interest Expense 22.6 22.6
Other Expense, Net 11.1 1.5 9.6
Income Before Taxes 12.2$ 64.3$
Income Taxes 20.9 (11.1) 17.5 14.5
Net Income (Loss) (8.7)$ 49.8$
Noncontrolling Interests 17.8 17.8
Net Income (Loss) Attributable to Lear (26.5)$ 32.0$
Diluted Earnings (Loss) per Share (0.44)$ 0.53$
Third Quarter 2021
Non-GAAP Financial Information
* Restructuring costs include $27.4 million in cost of sales and $21.1 million in SG&A. Other special items include $0.4 million in cost of sales and $1.7 million in SG&A.
31
* *