third quarter 2021 results
TRANSCRIPT
Third Quarter 2021 Results
October 2021
2
Cautionary Statement on Forward-Looking Statements & Non-GAAP Measures
This presentation contains “forward-looking statements” within the meaning of Section 27A of the Securities Act of 1933 and Section 21E of the
Securities Exchange Act of 1934. We intend all forward-looking statements to be covered by the safe harbor provisions of the Private Securities
Litigation Reform Act of 1995. Forward-looking statements generally can be identified by the fact that they do not relate strictly to historical or
current facts and by the use of forward-looking words such as “expect,” “expectation,” “believe,” “anticipate,” “may,” “could,” “intend,” “belief,”
“plan,” “estimate,” “target,” “predict,” “project,” “likely,” “will,” “continue,” “should,” “forecast,” “outlook” or similar terminology. These statements
are based on current estimates and assumptions made by us in light of our experience and perception of historical trends, current conditions
and expected future developments, as well as other factors that we believe are appropriate and reasonable under the circumstances, but there
can be no assurance that such estimates and assumptions will prove to be correct. Forward-looking statements include, without limitation,
statements regarding the future strategies, growth, business plans, investment, dividend and share repurchase plans, earnings, performance
and returns of Yum China, anticipated effects of population and macroeconomic trends, the expected impact of the COVID-19 pandemic, the
anticipated closing of the Hangzhou Catering investment, the anticipated effects of our innovation, digital and delivery capabilities and
investments on growth and beliefs regarding the long-term drivers of Yum China’s business. Forward-looking statements are not guarantees of
performance and are inherently subject to known and unknown risks and uncertainties that are difficult to predict and could cause our actual
results or events to differ materially from those indicated by those statements. We cannot assure you that any of our expectations, estimates or
assumptions will be achieved. The forward-looking statements included in this presentation are only made as of the date of this presentation,
and we disclaim any obligation to publicly update any forward-looking statement to reflect subsequent events or circumstances, except as
required by law. Numerous factors could cause our actual results or events to differ materially from those expressed or implied by forward-
looking statements, including, without limitation: whether we are able to achieve development goals at the times and in the amounts currently
anticipated, if at all, the success of our marketing campaigns and product innovation, our ability to maintain food safety and quality control
systems, the changes in public health conditions, including the COVID-19 pandemic and regional outbreaks caused by existing or new COVID-
19 variants, our ability to control costs and expenses, including tax costs, as well as changes in political, economic and regulatory conditions in
China. In addition, other risks and uncertainties not presently known to us or that we currently believe to be immaterial could affect the accuracy
of any such forward-looking statements. All forward-looking statements should be evaluated with the understanding of their inherent uncertainty.
You should consult our filings with the Securities and Exchange Commission (including the information set forth under the captions "Risk
Factors" and "Management’s Discussion and Analysis of Financial Condition and Results of Operations" in our Annual Report on Form 10-K and
subsequent Quarterly Reports on Form 10-Q) for additional detail about factors that could affect our financial and other results. This
presentation includes certain non-GAAP financial measures. Reconciliation of these non-GAAP financial measures to the most directly
comparable GAAP measures are included in this presentation where indicated. You are urged to consider carefully the comparable GAAP
measures and reconciliations.
3
Business Highlights
Appendix – Financial Results
Stores in Photos: KFC – Shanghai Pudong Xiaolujiazui; Pizza Hut – Nantong Phoenix Plaza
4
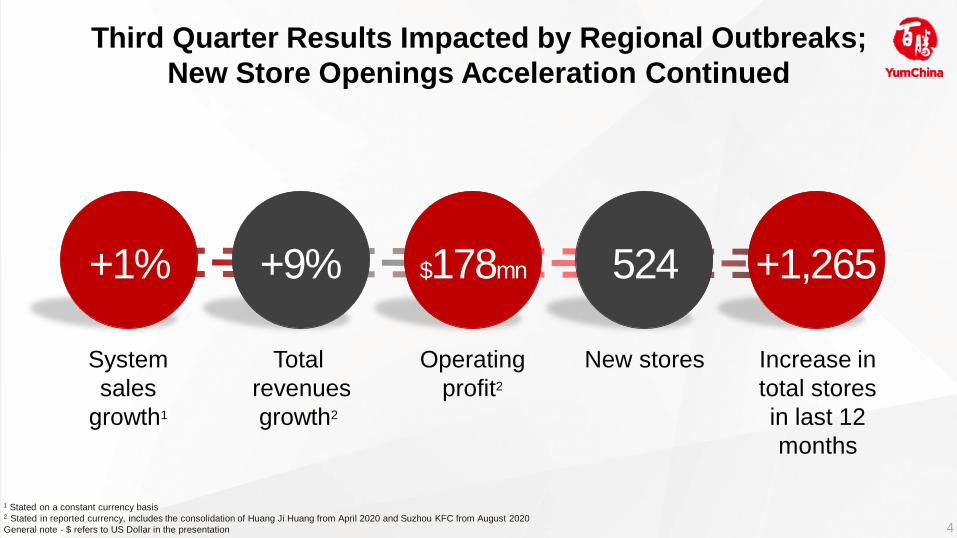
Third Quarter Results Impacted by Regional Outbreaks;
New Store Openings Acceleration Continued
New stores
524
Increase in
total stores
in last 12
months
+1,265
Total
revenues
growth2
+9%
System
sales
growth1
+1%
Operating
profit2
$178mn
1 Stated on a constant currency basis2 Stated in reported currency, includes the consolidation of Huang Ji Huang from April 2020 and Suzhou KFC from August 2020
General note - $ refers to US Dollar in the presentation
5
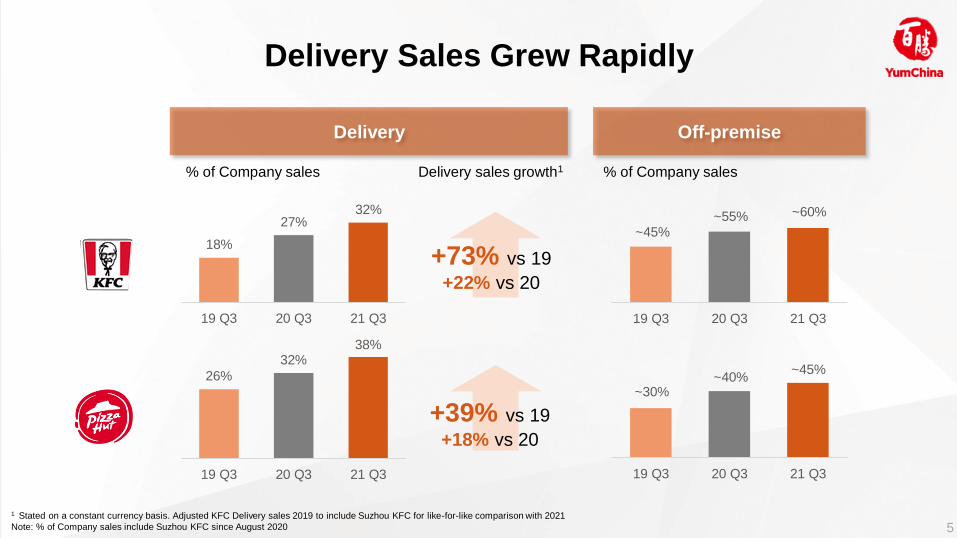
Delivery Sales Grew Rapidly
1 Stated on a constant currency basis. Adjusted KFC Delivery sales 2019 to include Suzhou KFC for like-for-like comparison with 2021
Note: % of Company sales include Suzhou KFC since August 2020
Delivery
26%
32%38%
19 Q3 20 Q3 21 Q3
Off-premise
% of Company sales
+73% vs 19
+22% vs 20
+39% vs 19
+18% vs 20
% of Company sales
18%
27%32%
19 Q3 20 Q3 21 Q3 19 Q3 20 Q3 21 Q3
~60%
19 Q3 20 Q3 21 Q3
~30%
Delivery sales growth1
~45%~55%
~40%~45%
6
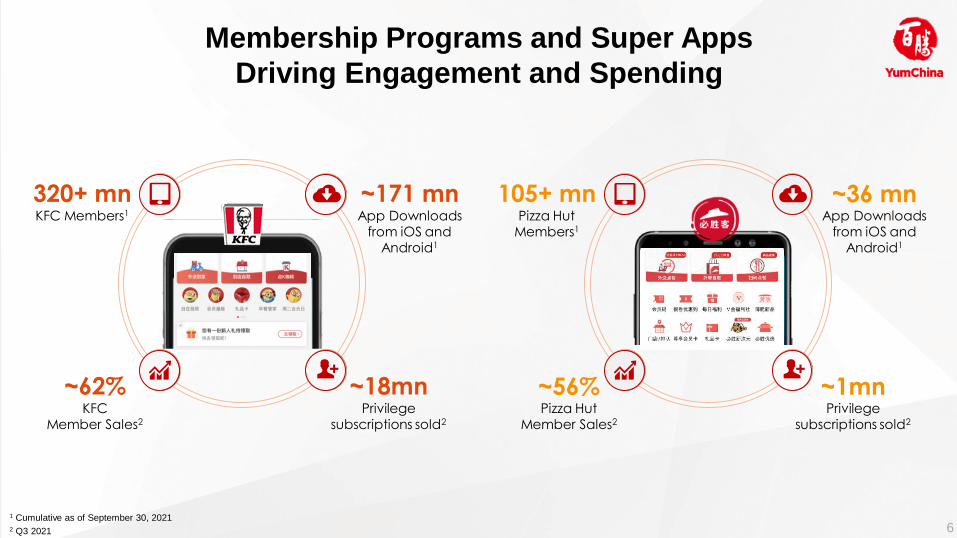
320+ mnKFC Members1
~171 mnApp Downloads
from iOS and Android1
~62%KFC
Member Sales2
~18mnPrivilege
subscriptions sold2
Membership Programs and Super Apps
Driving Engagement and Spending
1 Cumulative as of September 30, 2021 2 Q3 2021
105+ mnPizza Hut
Members1
~36 mnApp Downloads
from iOS and Android1
~56%Pizza Hut
Member Sales2
~1mnPrivilege
subscriptions sold2
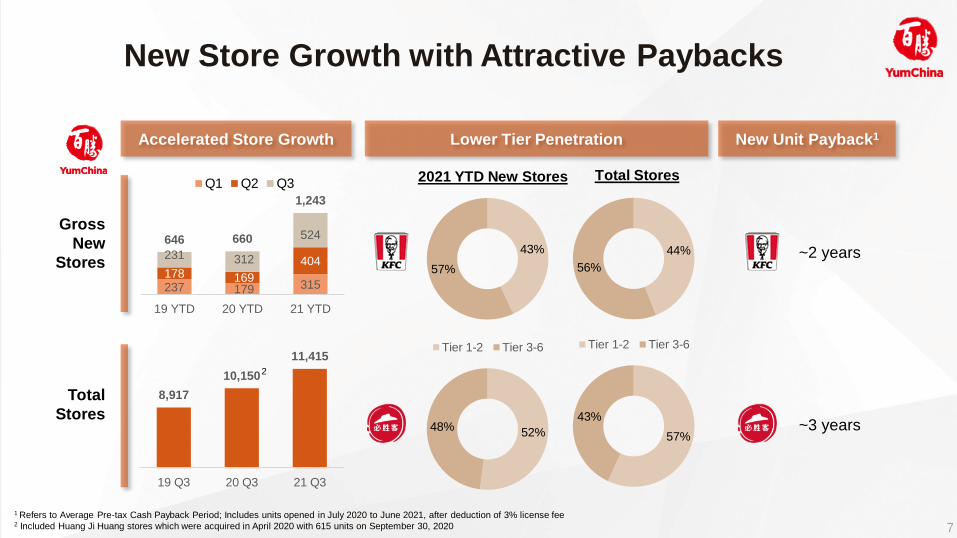
7
Gross
New
Stores
Total
Stores
New Store Growth with Attractive Paybacks
1 Refers to Average Pre-tax Cash Payback Period; Includes units opened in July 2020 to June 2021, after deduction of 3% license fee2 Included Huang Ji Huang stores which were acquired in April 2020 with 615 units on September 30, 2020
~2 years
~3 years
Lower Tier Penetration
43%
57%
New Unit Payback1
52%48%
Tier 1-2 Tier 3-6
2021 YTD New Stores
44%
56%
57%
43%
Tier 1-2 Tier 3-6
Total Stores
Accelerated Store Growth
237 179 315178 169
404231 312
524646 660
1,243
19 YTD 20 YTD 21 YTD
Q1 Q2 Q3
8,917
10,150
11,415
19 Q3 20 Q3 21 Q3
2
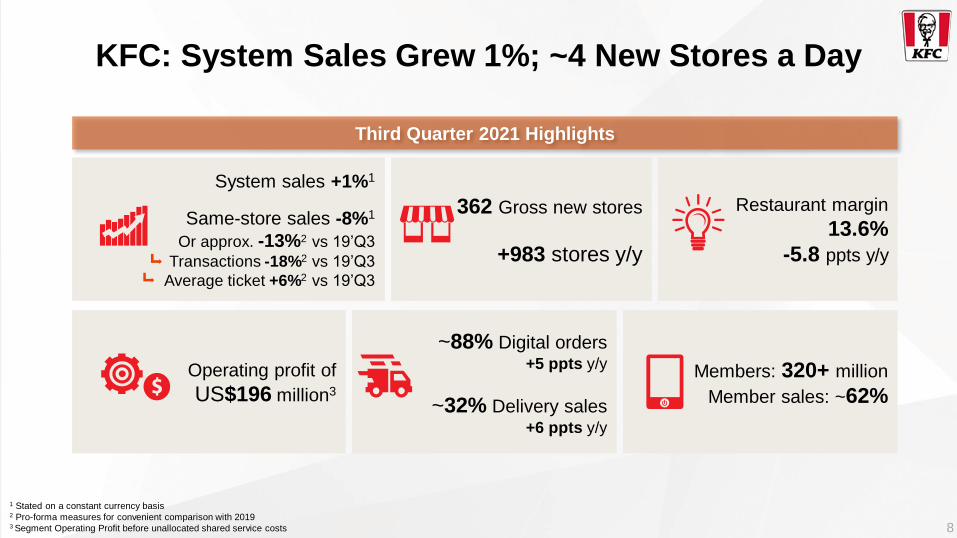
8
Operating profit of
US$196 million3
Members: 320+ million
Member sales: ~62%
~88% Digital orders+5 ppts y/y
~32% Delivery sales+6 ppts y/y
1 Stated on a constant currency basis2 Pro-forma measures for convenient comparison with 20193 Segment Operating Profit before unallocated shared service costs
KFC: System Sales Grew 1%; ~4 New Stores a Day
System sales +1%1
Same-store sales -8%1
Or approx. -13%2 vs 19’Q3
Transactions -18%2 vs 19’Q3
Average ticket +6%2 vs 19’Q3
Restaurant margin
13.6%
-5.8 ppts y/y
362 Gross new stores
+983 stores y/y
Third Quarter 2021 Highlights
9
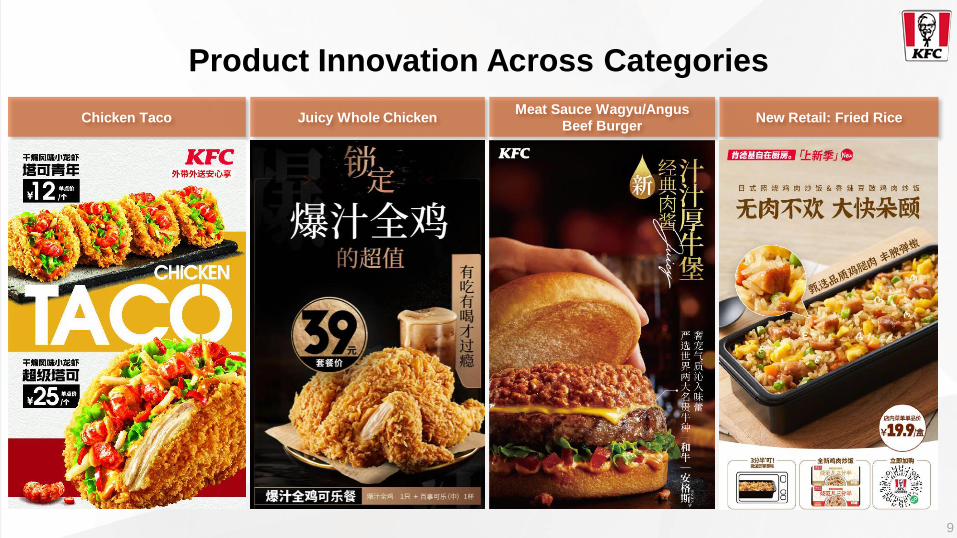
Product Innovation Across Categories
Chicken Taco Juicy Whole Chicken Meat Sauce Wagyu/Angus
Beef BurgerNew Retail: Fried Rice
10
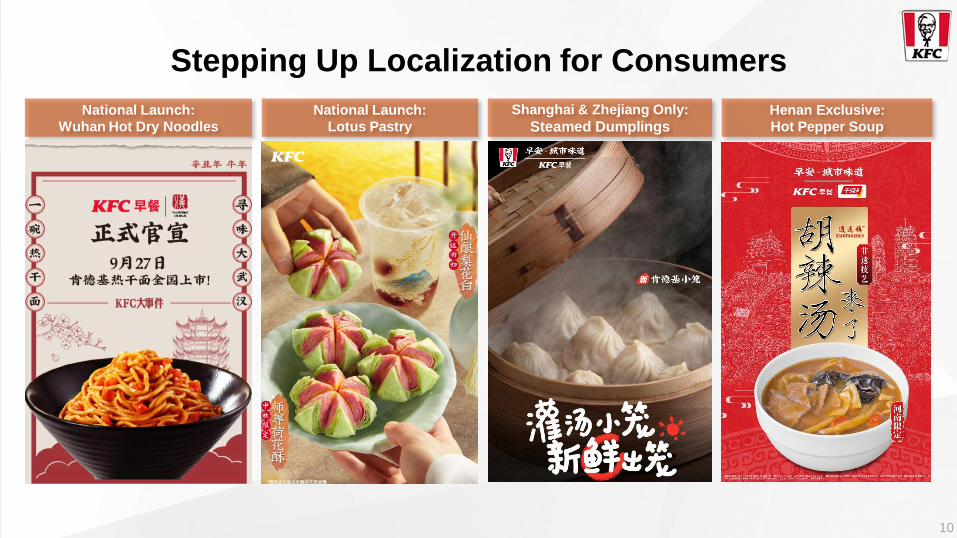
Stepping Up Localization for Consumers
National Launch:
Wuhan Hot Dry Noodles
Shanghai & Zhejiang Only:
Steamed DumplingsHenan Exclusive:
Hot Pepper Soup
National Launch:
Lotus Pastry
11
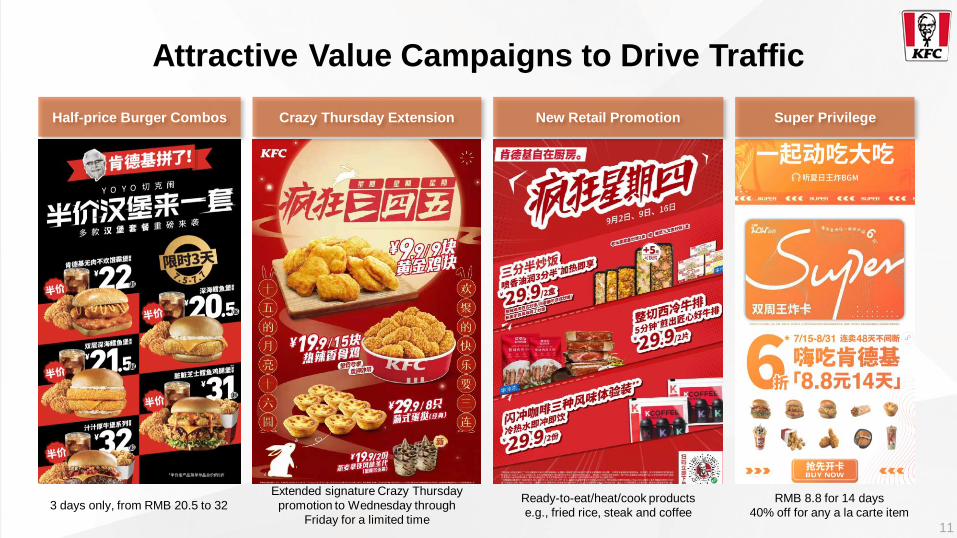
Attractive Value Campaigns to Drive Traffic
Half-price Burger Combos
RMB 8.8 for 14 days
40% off for any a la carte item
Crazy Thursday Extension New Retail Promotion Super Privilege
3 days only, from RMB 20.5 to 32
Extended signature Crazy Thursday
promotion to Wednesday through
Friday for a limited time
Ready-to-eat/heat/cook products
e.g., fried rice, steak and coffee
12
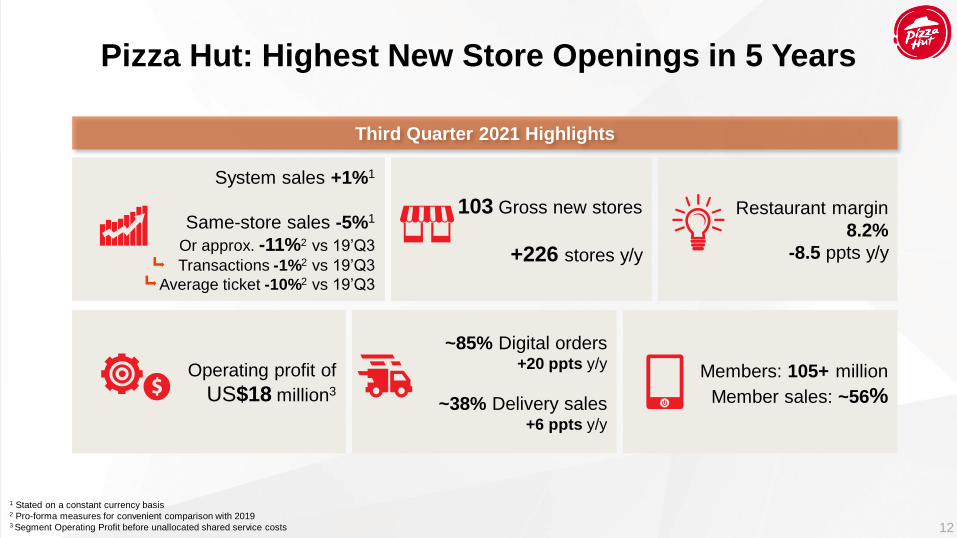
Pizza Hut: Highest New Store Openings in 5 Years
1 Stated on a constant currency basis2 Pro-forma measures for convenient comparison with 20193 Segment Operating Profit before unallocated shared service costs
Operating profit of
US$18 million3
Members: 105+ million
Member sales: ~56%
~85% Digital orders+20 ppts y/y
~38% Delivery sales+6 ppts y/y
System sales +1%1
Same-store sales -5%1
Or approx. -11%2 vs 19’Q3
Transactions -1%2 vs 19’Q3
Average ticket -10%2 vs 19’Q3
Restaurant margin
8.2%
-8.5 ppts y/y
103 Gross new stores
+226 stores y/y
Third Quarter 2021 Highlights
13
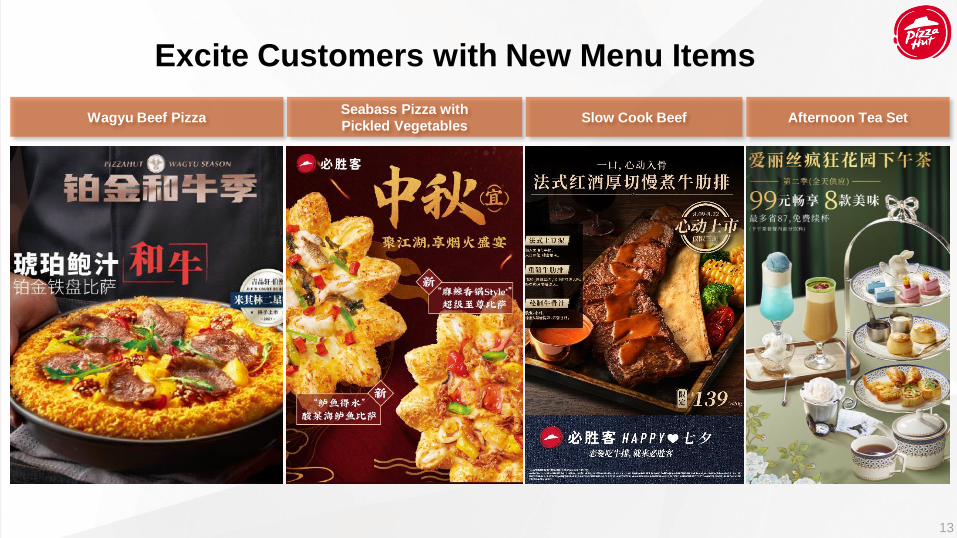
Excite Customers with New Menu Items
Wagyu Beef Pizza Slow Cook BeefSeabass Pizza with
Pickled VegetablesAfternoon Tea Set
14
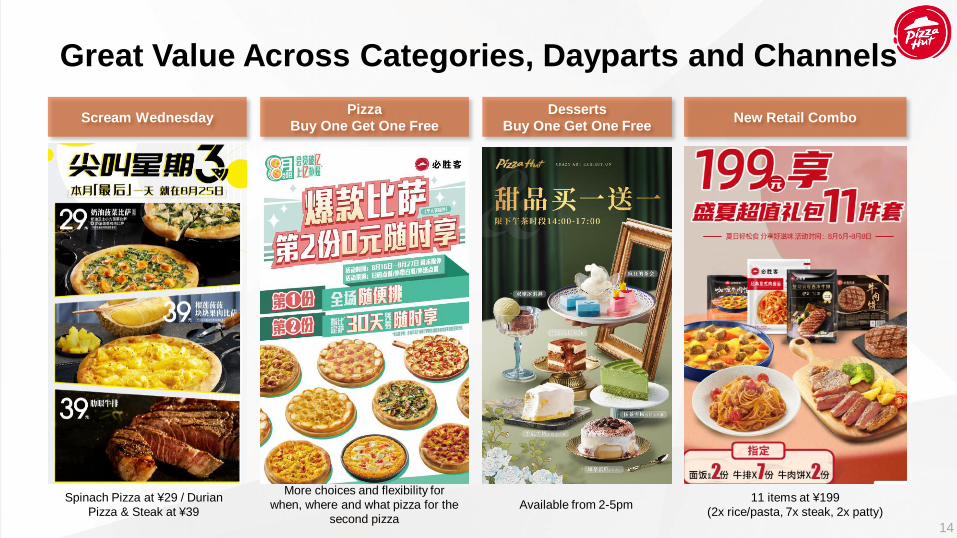
Great Value Across Categories, Dayparts and Channels
Scream WednesdayPizza
Buy One Get One FreeNew Retail Combo
Desserts
Buy One Get One Free
Spinach Pizza at ¥29 / Durian
Pizza & Steak at ¥39
More choices and flexibility for
when, where and what pizza for the
second pizza
Available from 2-5pm11 items at ¥199
(2x rice/pasta, 7x steak, 2x patty)
15
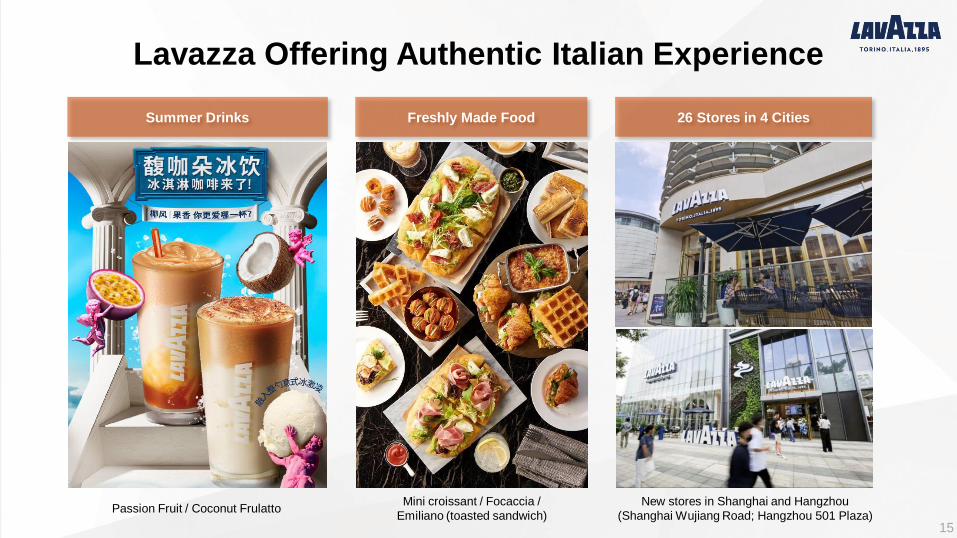
Lavazza Offering Authentic Italian Experience
New stores in Shanghai and Hangzhou
(Shanghai Wujiang Road; Hangzhou 501 Plaza)Passion Fruit / Coconut Frulatto
Summer Drinks 26 Stores in 4 Cities
Mini croissant / Focaccia /
Emiliano (toasted sandwich)
Freshly Made Food
16
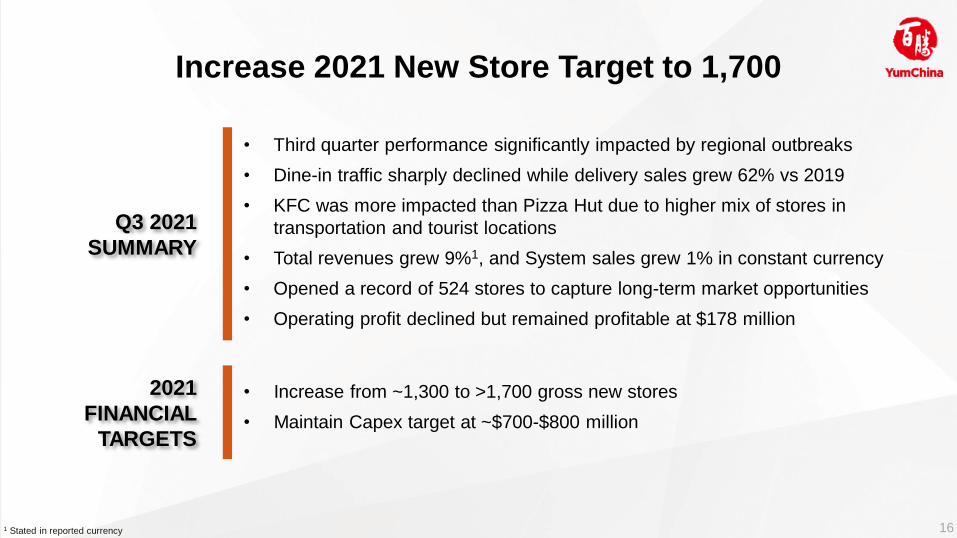
Increase 2021 New Store Target to 1,700
• Increase from ~1,300 to >1,700 gross new stores
• Maintain Capex target at ~$700-$800 million
• Third quarter performance significantly impacted by regional outbreaks
• Dine-in traffic sharply declined while delivery sales grew 62% vs 2019
• KFC was more impacted than Pizza Hut due to higher mix of stores in
transportation and tourist locations
• Total revenues grew 9%1, and System sales grew 1% in constant currency
• Opened a record of 524 stores to capture long-term market opportunities
• Operating profit declined but remained profitable at $178 million
2021
FINANCIAL
TARGETS
Q3 2021
SUMMARY
1 Stated in reported currency
17Stores in Photos: KFC – Shanghai Pudong Xiaolujiazui; Pizza Hut – Nantong Phoenix Plaza
Business Highlights
Appendix – Financial Results
18
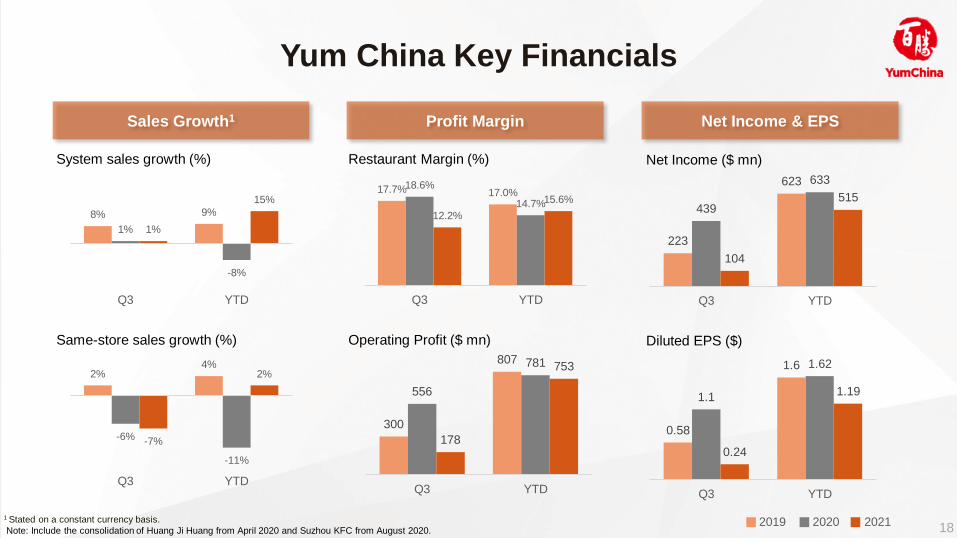
223
623
439
633
104
515
Q3 YTD
0.58
1.6
1.1
1.62
0.24
1.19
Q3 YTD
300
807
556
781
178
753
Q3 YTD
Profit MarginSales Growth1
System sales growth (%)
Same-store sales growth (%)
1 Stated on a constant currency basis.
Note: Include the consolidation of Huang Ji Huang from April 2020 and Suzhou KFC from August 2020.
Restaurant Margin (%)
Operating Profit ($ mn)
Net Income & EPS
Net Income ($ mn)
Diluted EPS ($)
2020 20212019
Yum China Key Financials
8% 9%
1%
-8%
1%
15%
Q3 YTD
2%4%
-6%
-11%
-7%
2%
Q3 YTD
17.7% 17.0%18.6%
14.7%12.2%
15.6%
Q3 YTD
19
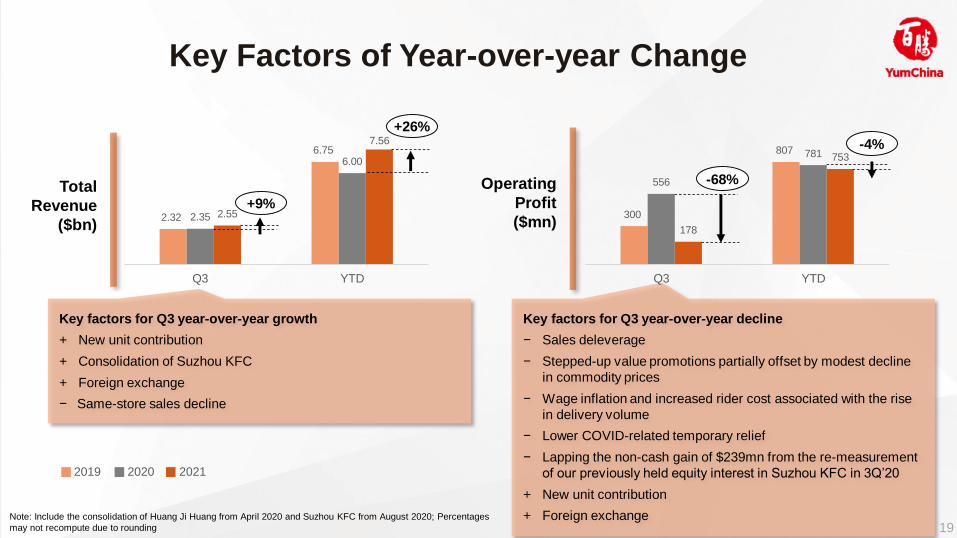
2.32
6.75
2.35
6.00
2.55
7.56
Q3 YTD
Key factors for Q3 year-over-year growth
+ New unit contribution
+ Consolidation of Suzhou KFC
+ Foreign exchange
− Same-store sales decline
Key Factors of Year-over-year Change
Operating
Profit
($mn)
Total
Revenue
($bn)
Note: Include the consolidation of Huang Ji Huang from April 2020 and Suzhou KFC from August 2020; Percentages
may not recompute due to rounding
Key factors for Q3 year-over-year decline
− Sales deleverage
− Stepped-up value promotions partially offset by modest decline
in commodity prices
− Wage inflation and increased rider cost associated with the rise
in delivery volume
− Lower COVID-related temporary relief
− Lapping the non-cash gain of $239mn from the re-measurement
of our previously held equity interest in Suzhou KFC in 3Q’20
+ New unit contribution
+ Foreign exchange
300
807
556
781
178
753
Q3 YTD
2020 20212019
+9%
+26%
-68%
-4%
20
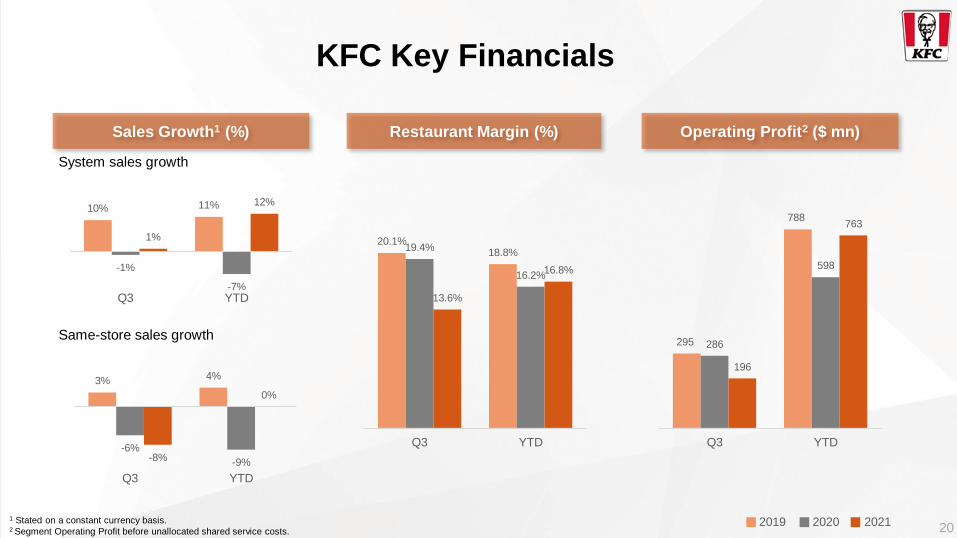
Restaurant Margin (%) Operating Profit2 ($ mn)Sales Growth1 (%)
System sales growth
Same-store sales growth
KFC Key Financials
1 Stated on a constant currency basis.2 Segment Operating Profit before unallocated shared service costs.
10% 11%
-1%
-7%
1%
12%
Q3 YTD
3% 4%
-6%
-9%-8%
0%
Q3 YTD
20.1%18.8%
19.4%
16.2%
13.6%
16.8%
Q3 YTD
295
788
286
598
196
763
Q3 YTD
2020 20212019
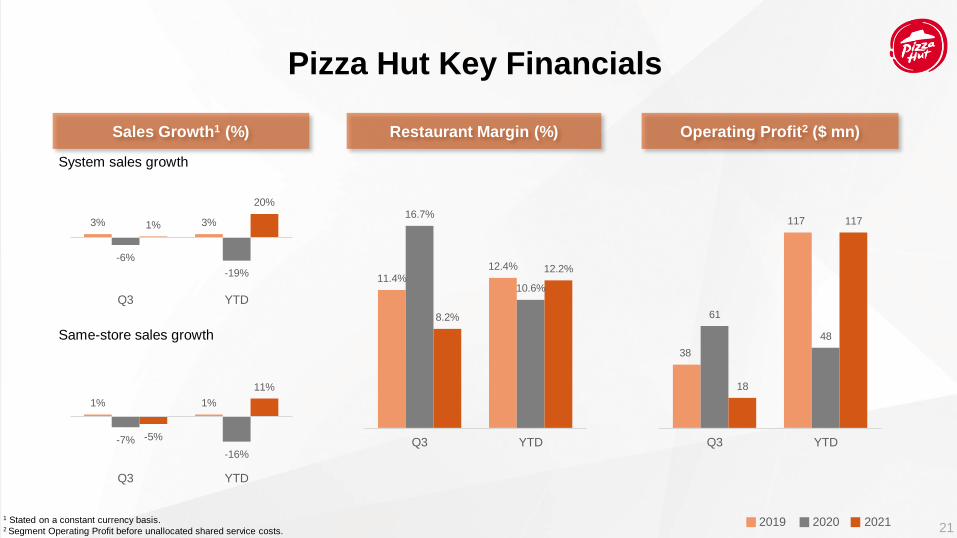
211 Stated on a constant currency basis.2 Segment Operating Profit before unallocated shared service costs.
Pizza Hut Key Financials
Restaurant Margin (%) Operating Profit2 ($ mn)Sales Growth1 (%)
System sales growth
Same-store sales growth
3% 3%
-6%
-19%
1%
20%
Q3 YTD
1% 1%
-7%
-16%
-5%
11%
Q3 YTD
11.4%12.4%
16.7%
10.6%
8.2%
12.2%
Q3 YTD
38
117
61
48
18
117
Q3 YTD
2020 20212019
22
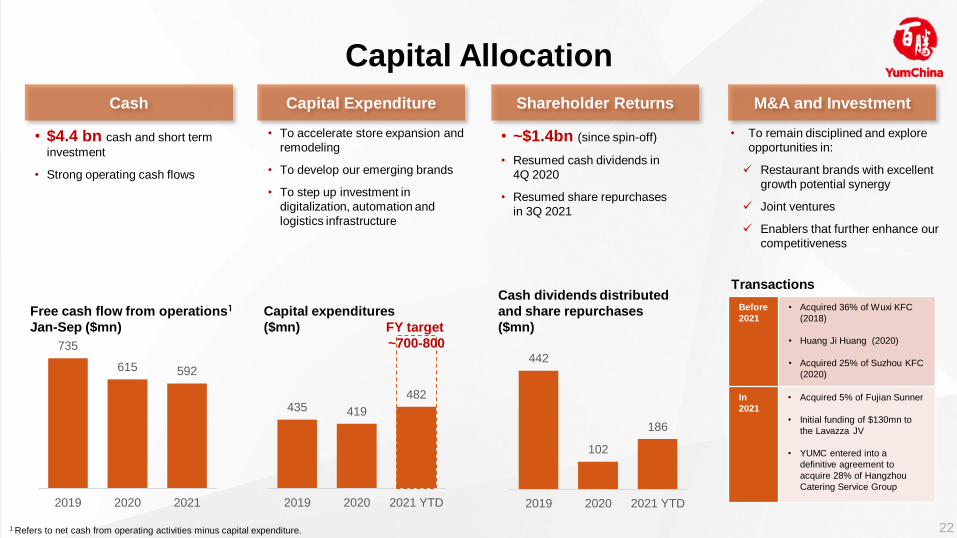
Capital Allocation
Transactions
• To accelerate store expansion and
remodeling
• To develop our emerging brands
• To step up investment in
digitalization, automation and
logistics infrastructure
Capital expenditures
($mn)
Cash dividends distributed
and share repurchases
($mn)
• ~$1.4bn (since spin-off)
• Resumed cash dividends in
4Q 2020
• Resumed share repurchases
in 3Q 2021
• $4.4 bn cash and short term
investment
• Strong operating cash flows
Free cash flow from operations1
Jan-Sep ($mn)
Cash Capital Expenditure M&A and InvestmentShareholder Returns
442
102
186
2019 2020 2021 YTD
735
615 592
2019 2020 2021
• To remain disciplined and explore
opportunities in:
Restaurant brands with excellent
growth potential synergy
Joint ventures
Enablers that further enhance our
competitiveness
Before
2021
• Acquired 36% of Wuxi KFC
(2018)
• Huang Ji Huang (2020)
• Acquired 25% of Suzhou KFC
(2020)
In
2021
• Acquired 5% of Fujian Sunner
• Initial funding of $130mn to
the Lavazza JV
• YUMC entered into a
definitive agreement to
acquire 28% of Hangzhou
Catering Service Group
435 419
482
2019 2020 2021 YTD
1 Refers to net cash from operating activities minus capital expenditure.
FY target
~700-800