thesis - milla mouhu
TRANSCRIPT
DIPLOMARBEIT
zum Thema
Evaluation of
Project Portfolio Management Software
for ABB Engineering Centers
ausgeführt zum Zwecke der Erlangung des Akademischen Grades eines Diplom‐Ingenieurs
unter der Leitung von
Ass. Prof. Dipl.‐Ing. Dr. techn. Peter Kuhlang
und Projektass. Dipl.‐Ing. Thomas Edtmayr
E330
Institut für Managementwissenschaften
eingereicht an der Technischen Universität Wien
Fakultät für Maschinenwesen und Betriebswissenschaften
von
Milla Mouhu
Matrikelnr.: 0426047
Gumpendorfer Str. 140/2B
1060 Wien
Wien, am 25. Mai 2011 Milla Mouhu
Die approbierte Originalversion dieser Diplom-/Masterarbeit ist an der Hauptbibliothek der Technischen Universität Wien aufgestellt (http://www.ub.tuwien.ac.at). The approved original version of this diploma or master thesis is available at the main library of the Vienna University of Technology (http://www.ub.tuwien.ac.at/englweb/).
i
Abstract The engineering company ABB has been facing an increasing number of late customer
project deliveries in the past years. The competition in the industry puts more and more
pressure on the company performance and the efficiency must be constantly improved.
There are several factors contributing to the project success and, especially in an
engineering‐to‐order company, the throughput or on time delivery cannot be increased
simply by making more investments. The scarce resources, such as experienced senior
engineers, are under a multi‐project work load that they no longer can manage.
To plan the resources more efficiently, an overview of all the running projects in an
engineering center must be obtained. There are several project portfolio management
software solutions on the market, which support a central planning and management of the
resources and claim to improve throughput up to 20%. The goal of my diploma thesis is to
evaluate this software and identify one or two that would be most suitable for the ABB
working processes.
As the most known software companies are mainly focused on IT project portfolios, the
number of strong candidates was quickly reduced. The critical chain method, represented by
the company Realization, has given good results in single project execution, but did not
convince to be effective in multi‐project resource planning outside manufacturing.
Therefore, my conclusion was to prefer companies, such as Planisware, who use the
traditional critical path method for project management.
ii
Kurzbeschreibung
Das Technologieunternehmen ABB verzeichnete in den vergangenen Jahren eine steigende
Anzahl der Verspätungen bei der Lieferung von Kundenprojekten. Der Wettbewerb in dieser
Branche erhöht zunehmend den Druck auf die Unternehmensleistung, wodurch die
Leistungsfähigkeit nachhaltig verbessert werden muss. Mehrere Faktoren tragen zum
Projekterfolg bei. Insbesondere bei „Engineering‐To‐Order“ Unternehmen, kann der
Durchsatz oder die Liefertreue nicht nur durch größere Investitionen sichergestellt werden.
Knappe Ressourcen, wie die Engineering Spezialisten müssen ein hohes Arbeitspensum
erfüllen, welches sich über mehrere Projekte erstreckt. Mit diesem zeitlichen Druck kommen
die Mitarbeiter nicht mehr zurecht, wodurch sich die Projekte verspäten.
Um die Ressourcenplanung effizienter zu gestalten, muss man sich einen Überblick über alle
laufenden Projekte in einer Ingenieurabteilung verschaffen. Auf dem Markt gibt es mehrere
Projektportfoliomanagement Softwarelösungen, die die zentrale Planung und das
Ressourcenmanagement unterstützen und behaupten somit den Durchsatz bis zu 20 % zu
erhöhen. Das Ziel meiner Diplomarbeit bestand darin, diese Software zu evaluieren und eine
geeignete Lösung für die Arbeitsprozesse bei ABB zu bestimmen.
Da die meisten bekannten Softwareunternehmen ihren Schwerpunkt vorwiegend auf IT
Projektportfolios legen, verringerte sich die Anzahl der aussichtsreichen Kandidaten schnell.
Die „Critical Chain“ Projektmanagementmethode von der Firma Realization erzielte gute
Ergebnisse in der Einzelprojektabwicklung. Nicht effektiv erwies sich jedoch die Methode bei
der Multiprojekt‐Ressourcenplanung in anderen Arbeitsgebieten außerhalb der Produktion.
Folge dessen ist meine Empfehlung eine PPM Software, die im Gegensatz zu „Critical Chain“,
die traditionelle kritische Weg ‐Methode verwendet, auszuwählen. Beispiele hierfür sind
Planisware 5 und Primavera P6.
iii
Table of Contents
1. Introduction ..................................................................................................................... 1
2. Multi‐Project Management ............................................................................................. 4
2.1. General problem definition .............................................................................. 4
2.2. Critical Path ....................................................................................................... 7
2.3. Critical Chain and Theory of Constraints .......................................................... 9
3. ABB Group ..................................................................................................................... 12
3.1. Organization .................................................................................................... 16
3.2. HVDC Ludvika, Sweden ................................................................................... 20
3.3. Power Cables Karlskrona, Sweden .................................................................. 28
4. Software Vendors .......................................................................................................... 29
4.1. Planisware ....................................................................................................... 35
4.1.1. Multi‐Project Planning ............................................................................... 36
4.1.2. Interfaces ................................................................................................... 42
4.1.3. Controlling ................................................................................................. 43
4.1.4. Settings ...................................................................................................... 44
4.1.5. Miscellaneous ............................................................................................ 46
4.1.6. Customer Reference: Schaeffler Technologies / INA ................................ 47
4.2. Oracle/Primavera ............................................................................................ 51
4.2.1. Multi‐Project Planning ............................................................................... 52
4.2.2. Interfaces ................................................................................................... 54
4.2.3. Controlling ................................................................................................. 55
4.2.4. Settings ...................................................................................................... 57
4.2.5. Miscellaneous ............................................................................................ 59
4.2.6. Customer Reference: Alstom Group / Power ........................................... 59
4.3. JDA Software ................................................................................................... 61
4.3.1. Multi‐Project Management ....................................................................... 62
4.3.2. Interfaces ................................................................................................... 64
4.3.3. Controlling ................................................................................................. 64
4.3.4. Settings ...................................................................................................... 66
iv
4.3.5. Miscellaneous ............................................................................................ 68
4.3.6. Customer Reference: Krones ..................................................................... 68
4.4. HP .................................................................................................................... 72
4.4.1. Multi‐Project Planning ............................................................................... 73
4.4.2. Interfaces ................................................................................................... 74
4.4.3. Controlling ................................................................................................. 75
4.4.4. Settings ...................................................................................................... 77
4.4.5. Miscellaneous ............................................................................................ 79
4.4.6. Customer Reference: Exactitude Consulting for BHP Billiton ................... 80
4.5. Realization/Concerto ...................................................................................... 82
4.6. Results ............................................................................................................. 84
5. Implementation ............................................................................................................. 86
6. Conclusion ..................................................................................................................... 88
Appendix: HVDC Engineering process work flow ................................................................. 93
v
List of Figures Figure 1. Planisware critical path display ............................................................................ 7
Figure 2. HP EVM illustration ............................................................................................... 8
Figure 3. Five focusing steps of TOC .................................................................................. 10
Figure 4. Differences of buffers between critical chain and critical path method ........... 11
Figure 5. Timeline of the history of ABB Group ................................................................. 14
Figure 6. Current ABB product offering ............................................................................. 15
Figure 7. Transformer production in Vadodara, India ....................................................... 17
Figure 8. A robot assembles robots ................................................................................... 18
Figure 9. Division PS organigram ....................................................................................... 20
Figure 10. HVDC organization .............................................................................................. 22
Figure 11. ABB Market share in high voltage products in 2005 ......................................... 23
Figure 12. TOPS Management System in Ludvika ............................................................... 23
Figure 13. Forrester Research comparison of business oriented PPM vendors ................. 30
Figure 14. Gartner Magic Quadrant .................................................................................... 31
Figure 15. Reporting wizard with time lines of all running projects ................................... 36
Figure 16. Planisware multi‐project list view ...................................................................... 37
Figure 17. Program level resource estimation divided into all running projects ................ 37
Figure 18. Planisware Gantt ................................................................................................ 38
Figure 19. Planisware project simulations .......................................................................... 39
Figure 20. Planisware resource constraints ........................................................................ 40
Figure 21. Planisware resource distribution ........................................................................ 40
Figure 22. Planisware budget figures, KPI’s and Stage Gate display ................................... 41
Figure 23. Planisware resource leveling .............................................................................. 41
Figure 24. An example of the information exchange to SAP .............................................. 42
Figure 25. Planisware EVM, KPI’s and Stage‐Gate display .................................................. 43
Figure 26. Planisware overspending/delay display ............................................................. 44
Figure 27. Planisware dashboard ........................................................................................ 45
Figure 28. Planisware reporting wizard ............................................................................... 45
Figure 29. Project documentation ....................................................................................... 47
Figure 30. Industry customers of Planisware outside IT ..................................................... 49
Figure 31. Primavera project portfolio level Gantt ............................................................. 52
vi
Figure 32. Primavera capacity planning .............................................................................. 53
Figure 33. Primavera resource distribution between projects and planned offers ............ 54
Figure 34. Primavera/SAP information flow ........................................................................ 55
Figure 35. Primavera schedule checking ............................................................................. 56
Figure 36. Primavera labor costs by location ...................................................................... 57
Figure 37. Primavera executive dashboard ......................................................................... 58
Figure 38. Primavera reports by schedule time .................................................................. 58
Figure 39. JDA EPP: Program Schedule Overview in master plan ....................................... 62
Figure 40. JDA resource allocation plan .............................................................................. 63
Figure 41. JDA resource pool capacity display .................................................................... 63
Figure 42. JDA resources divided in hours per project ........................................................ 64
Figure 43. JDA EPP: Single project KPI’s with buffer consumption ..................................... 65
Figure 44. JDA critical path .................................................................................................. 65
Figure 45. JDA program buffer consumption in master plan .............................................. 66
Figure 46. JDA utilization report to resource manager ....................................................... 67
Figure 47. Experiences from the JDA implementation process .......................................... 70
Figure 48. HP resource allocation ........................................................................................ 73
Figure 49. HP long term resource planning ......................................................................... 74
Figure 50. HP CCPM ............................................................................................................. 75
Figure 51. HP buffer calculation .......................................................................................... 76
Figure 52. HP project buffer display .................................................................................... 76
Figure 53. HP dashboard ..................................................................................................... 77
Figure 54. HP overview report ............................................................................................. 78
Figure 55. HP full portfolio timeline .................................................................................... 79
Figure 56. Category based value analysis ............................................................................ 85
vii
Table of Tables Table 1. Planisware ratings .................................................................................................. 50
Table 2. Primavera ratings ................................................................................................... 60
Table 3. JDA ratings .............................................................................................................. 71
Table 4. HP ratings ............................................................................................................... 81
Table 5. Value analysis ......................................................................................................... 84
Table 6. Category based scorings ......................................................................................... 85
viii
Abbreviations ABPP Agile Business Process Platform
API Application Programming Interface
BU Business Unit
CCPM Critical Chain Project Management
CPM Critical Path Method
EPP Enterprise Project Planner
EPPM Enterprise Project Portfolio Management
ERP Enterprise Resource Planning
ETO Engineering To Order
EVM Earned Value Management
HR Human Resources
HVDC High Voltage Direct Current
IT Information Technology
KPI Key Performance Indicator
MPCC Multi‐Project Critical Chain
MSP Microsoft Project
NLS National Language Support
NPV Net Present Value
PMO Project Management Organization
R & D Research and Development
RoI Return on Investment
SaaS Software as a Service
SCM Supply Chain Management
SOAP Simple Object Access Protocol
TOC Theory of Constraints
WBS Work Breakdown Structure
XML Extensible Markup Language
1. Introduction
1
1. Introduction
The word ‘project’ has nowadays a strong position in our work life vocabulary. As defined by
Leach1, ‘project’ is “a temporary endeavor undertaken to create a unique product or
service”. He emphasizes the word “temporary” as defining the crucial difference to
production. We often work on projects of different sizes, internal or external, dedicating our
time and effort as an important resource to the given task. Additionally, someone needs to
manage these resources as well as costs and time to ensure a successful project delivery in
the end. This is called project management. Project management has continuously increased
its importance and is believed to be one the most important deciding factors over a success
of a project. Unfortunately, we often fail to deliver the project on time or on quality, due to
various problems.
The nature of a project, creating something unique, already tells us that there are challenges
to expect. We have tried to fight against project failure by planning projects better or more
precisely. Depending on the project type and business, this can sometimes solve only part of
the problem. No doubt, a well done plan is important, but no one should assume that the
execution phase would run according to an exact, predefined plan. In a study of The Goldratt
Institute, project management students named a few of the reasons hindering a project’s
success2:
• Unforeseeable bad weather
• Unforeseeable difficulties at vendors who supply equipment
• Longer‐than‐expected time in meeting government requirements
• Unrealistic schedule
• Unreliable (but cheaper) vendors or contractors
• Difficulties in matching operators available with project needs
• Unforeseen emergencies
1 Leach, 2005, Glossary. 2 Leach, 2005, page 10.
1. Introduction
2
This all becomes even more challenging when we combine multiple projects within one unit
and make them share the given resources. Scheduling the resources in an environment
where little works out as planned, can easily lead to “firefighting”, where you are just trying
to survive from one day to another.
In spring 2010 I received the opportunity to write my diploma thesis for the company called
ABB in Switzerland. In their headquarters in Zürich‐Oerlikon, the Department of Quality and
Operational Excellence had started a project to find a solution to help their engineering
centers around the world, in their struggle with delays caused by inefficient resource
planning. I was able to participate in this project and I have summarized our work and the
obtained conclusions, in this thesis.
ABB is a typical project management organization (PMO) with numerous customer projects
as well as resource and development (R & D) projects, running simultaneously in a matrix
organization. Managing a single project is already challenging as it is, but additionally, ABB
has to manage the complete resource allocation between multiple projects. Therefore, the
focus of this work was multi‐project management. Knowing that the market offers software
solutions that have helped companies facing similar problems, it was decided that my task
would be to look into this software market more closely and evaluate the functionalities that
they offer. If a suitable tool would be found, this could be recommended for engineering
centers throughout the organization.
For single project management there are several different software solutions available and
no one can imagine nowadays running a bigger project without the support of some
software. The most common functionalities include
• budget planning and cost controlling
• resource planning with individual calendars
• work breakdown structure (WBS) and network plan
• time lines for baselines vs. actual progress i.e. Gantt chart
• document storage
• reporting assistance
1. Introduction
3
There is no standard tool being used within ABB, some use MS Project, the majority
Primavera and in Norway a tool called Safran. As useful and as advanced as these tools are,
the traditional PM software is not capable in combining the information of two different
project plans, in order to analyze, for example, the resource availability.
The multi‐project software would have to offer the line managers the possibility to control
their scarce resources, in an up‐to‐date plan that reflects the true status of all different
projects running in their department. Currently there are several ways the individual
engineering centers are running their resource management. One of the most common
solutions is a self‐constructed excel‐sheet that, unfortunately, isn’t able to meet all their
needs. Already in the beginning, we defined some crucial functionality that the software
must provide, such as what‐if simulation on program level, or a closed‐loop interface to SAP
and to the project management tool being used. The first step was to find solutions that
offer these functionalities, preferably from a vendor that has experience with business
oriented projects instead of only IT projects. After selecting the most suitable vendors, we
would then have to verify the claims by talking to the reference companies that have been
using the tool to improve their performance.
As the ABB has been cooperating for years already with a company called “Realization”, in
improving their performance in single project management, it was important to investigate if
their solution would be suitable for multi‐project management as well. The crucial difference
to other vendors is that Realization uses critical chain method for their project planning and
execution. Hence, one of our goals was to find out if critical chain method can be used to
solve the problem of resource allocation between multiple projects as efficiently as it
seemed to work in single project management.
2. Multi‐Project Management
4
2. Multi‐Project Management
2.1. General problem definition
First we need to make clear what we mean by multi‐project management. How does it differ
from portfolio management?
The company Actano defines the project portfolio as “the sum of all projects in a company.
Projects are managed and assessed in terms of operative benefits and corporate strategic
alignment by the means of project portfolio management.” and “Whereas project
management focuses primarily on efficient project execution, project portfolio management
targets greater effectiveness in project controlling. This includes assessing projects on the
basis of their costs effectiveness and their benefits for achievement of the company’s
strategic goals.”3
This means that the ABB engineering centers theoretically manage, therefore, a portfolio, as
opposed to for example a program. Portfolio management has, however, the function of
also selecting the most suitable portfolio mix that corresponds to the company strategy and
makes the business most profitable. Within ABB this is not done, nor would it be possible,
and as the focus is only on management and execution of multiple projects, we prefer to
refer to multi‐project management. The software on the market is, however, called project
portfolio management as it is suited to the needs of the majority of the companies. I also
often interchange the management and planning concepts. There is, however, the difference
that management has a wider meaning including ‐not only planning, but also controlling.
The most difficult environment for multi‐project planning is an engineering‐to‐order (ETO)
company. These organizations have usually adopted a matrix organization structure. They
have a high degree of variability in their products and high dependency between different
projects. Long and intensive engineering process and several projects running parallel makes
the resource planning more challenging. This is because the time for completing a task is
3 Actano online glossary, www.actano.com
2. Multi‐Project Management
5
impossible to estimate precisely in the beginning, and numerous changes in the resource
planning arise during the execution phase.
In the paper “A hierarchical approach to multi‐project planning under uncertainty”4, Hans,
Herroelen, Leus and Wullink suggest solving this problem with a process management view,
where resources are seen as work stations visited by work packages that are given forward
after completion. The problem here is how to set the priorities between the work packages
when choosing the next one. In their paper, the authors refer to using intermediate
milestones for prioritization. In my opinion however, the problem is more complex and
needs a more sophisticated system for deciding which project should be given the scarce
resources. The time pressure is constant, and often no one has the control over the relative
importance of different project milestones.
For the resource planning they suggest the following: “In the early stages of the project,
when only rough information about the project content is available… the most important
output are the internal and external due dates, milestones and required capacity levels.” “In
later project stages more information gradually becomes available… These data are
combined with information generated by process planning and design and passed on as an
input for the operational planning phase.” I fully agree that this is in the right direction and
certainly this is also recognized by the planning divisions in ABB.
Currently there is, however, no software supporting such gradual integrated planning in use
within ABB. Some of the information is stored in SAP5; single project scheduling is done with
a project management (PM) tool such as MS Project or Primavera; Excel sheets are produced
to obtain an overview of total resource availability, but none of these tools are
communicating automatically with each other. For efficient multi‐project planning and
management, there must be a tool that can up/download information on a regular basis
from SAP and PM tool and combine this information in a useful way. One of the most
needed functionalities is to see how changes in one project affect the complete resource
planning and thereby other projects.
4 Hans, Herroelen, Leus, Wullink, 2007 5 ABB uses SAP as their ERP system, including HR functions.

2. Multi‐Project Management
6
There are various solutions to this problem in the market but before we get into the detailed
presentations, I would like to give an overview of the two main approaches in a single
project planning. Critical chain, including the theory of constraints, or the wider‐spread
critical path method, build the basic principles on which we can differentiate the project
planning software later.
2. Multi‐Project Management
7
2.2. Critical Path
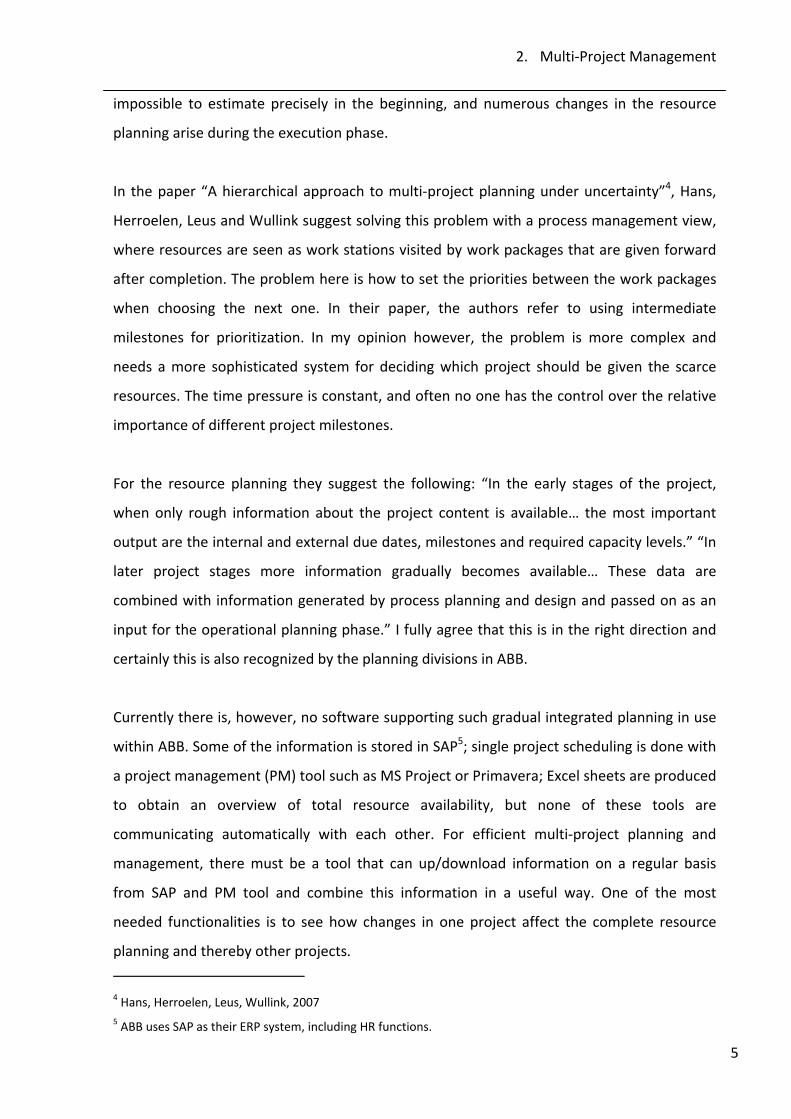
Critical path method (CPM) is the most widely used method in identifying the line of tasks
which directly influence the project duration; therefore, generally the critical path is defined
as the longest path through a project. A delay in a task along the critical path will, therefore,
theoretically delay the entire project. As on time delivery has become so important, most
project management software illustrate the critical path in Gantt chart and highlights the
critical tasks for the project manager to take extra care of. The method is very theoretical,
as it assumes deterministic task duration and doesn’t consider, for example, probabilities of
achieving them.
Figure 1. Planisware critical path display
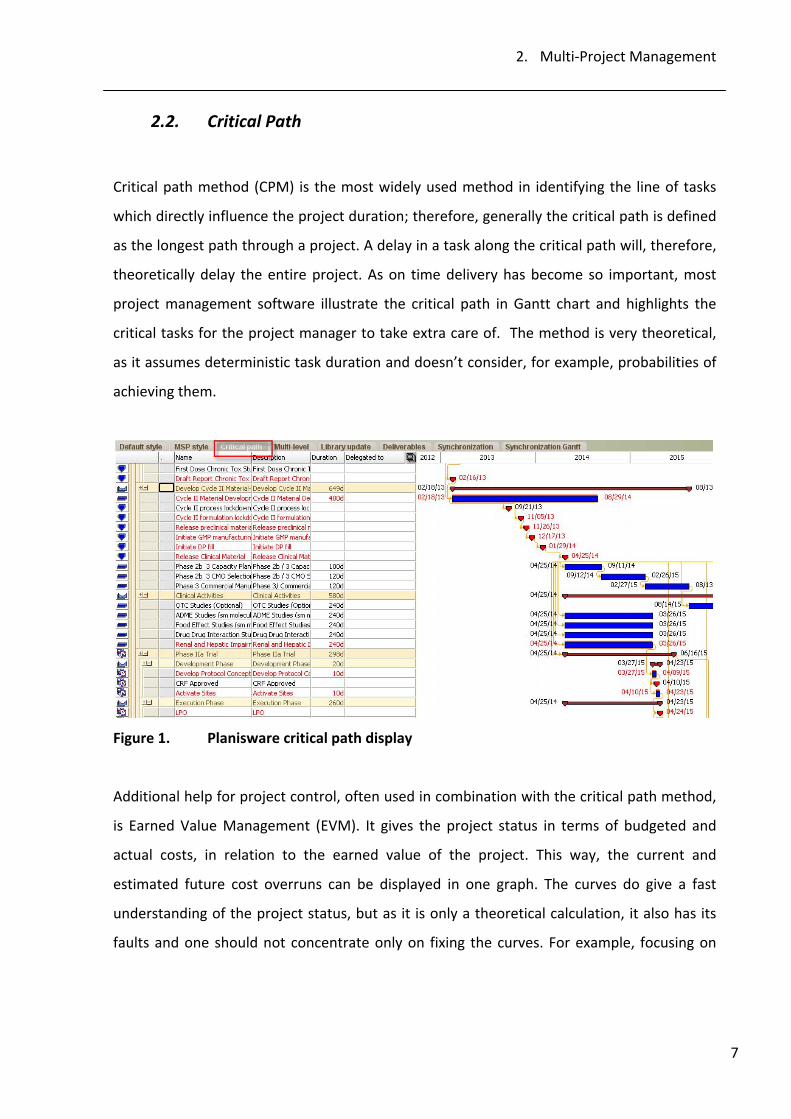
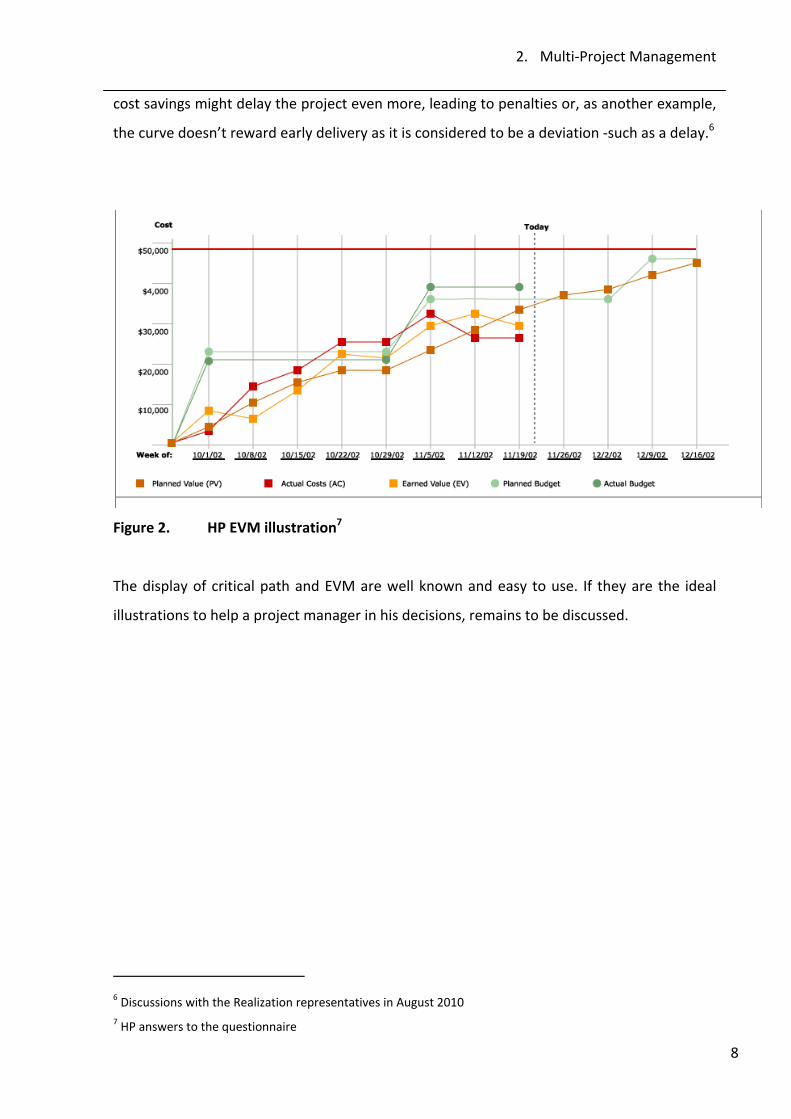
Additional help for project control, often used in combination with the critical path method,
is Earned Value Management (EVM). It gives the project status in terms of budgeted and
actual costs, in relation to the earned value of the project. This way, the current and
estimated future cost overruns can be displayed in one graph. The curves do give a fast
understanding of the project status, but as it is only a theoretical calculation, it also has its
faults and one should not concentrate only on fixing the curves. For example, focusing on
2. Multi‐Project Management
8
cost savings might delay the project even more, leading to penalties or, as another example,
the curve doesn’t reward early delivery as it is considered to be a deviation ‐such as a delay.6
Figure 2. HP EVM illustration7
The display of critical path and EVM are well known and easy to use. If they are the ideal
illustrations to help a project manager in his decisions, remains to be discussed.
6 Discussions with the Realization representatives in August 2010 7 HP answers to the questionnaire
2. Multi‐Project Management
9
2.3. Critical Chain and Theory of Constraints
Critical Chain Project Management (CCPM) concentrates on resources instead of tasks,
believing that resources need to be more flexible in changing between tasks, and that way,
resource load can be kept steady. The inventor of the method is a famous Israeli physicist
Eliyahu M. Goldratt, who introduced Theory of Constraints (TOC) in his book The Goal
(1948). He noticed how the projects were constantly failing due to various changes, and he
therefore focused on managing uncertainty better.
Theory of constraints says that all systems have a constraint that limits the output, the
bottleneck, so to say. This means that the throughput is defined by this constraint, and it is
important to identify this constraint and plan the production around it. As described by
Leach, “Systems are analogous to chains. Each system has a weakest link (constraint) that
ultimately limits the success of the entire system.”8. The theory sounds logical and is
certainly true for a simple production line; in an engineering environment however, this
becomes more complicated.
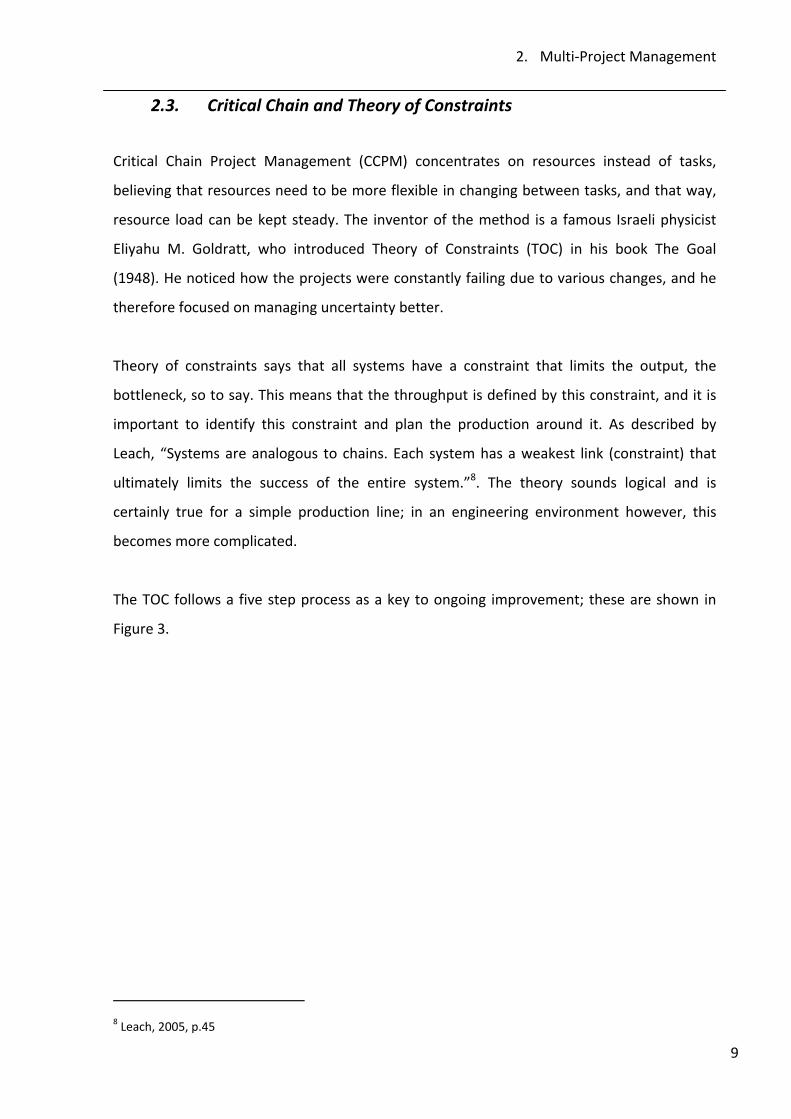
The TOC follows a five step process as a key to ongoing improvement; these are shown in
Figure 3.
8 Leach, 2005, p.45
2. Multi‐Project Management
10
Figure 3. Five focusing steps of TOC9
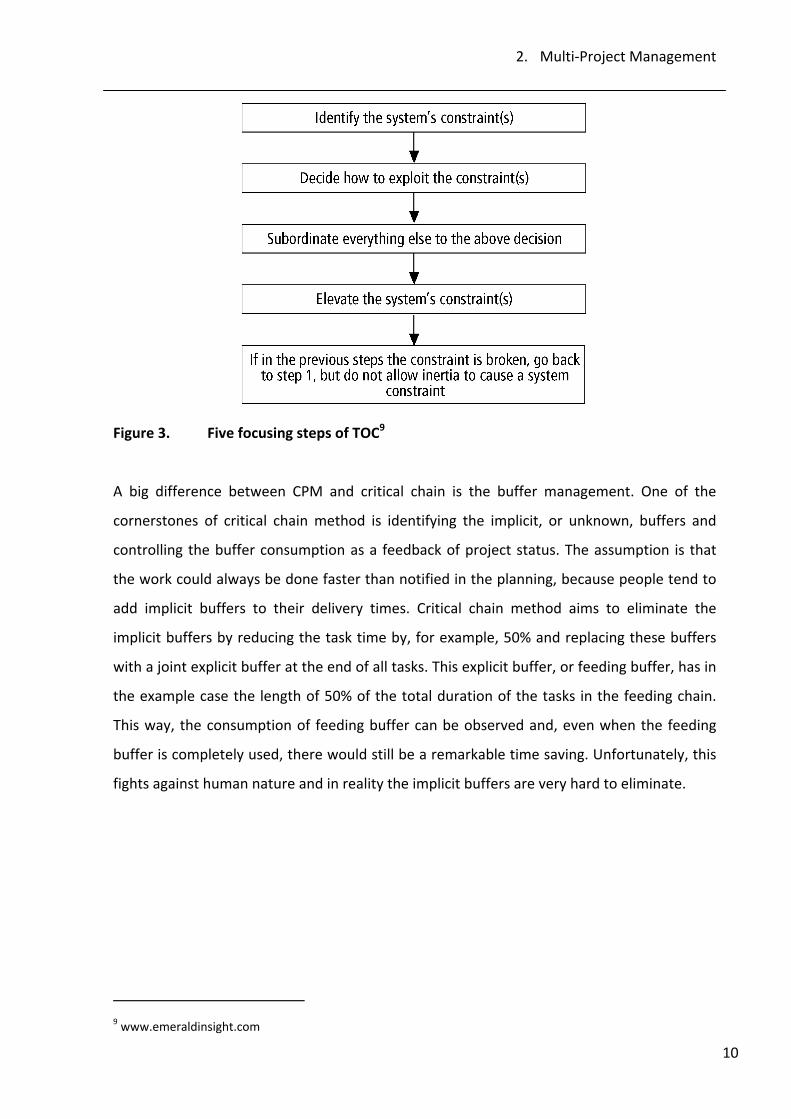
A big difference between CPM and critical chain is the buffer management. One of the
cornerstones of critical chain method is identifying the implicit, or unknown, buffers and
controlling the buffer consumption as a feedback of project status. The assumption is that
the work could always be done faster than notified in the planning, because people tend to
add implicit buffers to their delivery times. Critical chain method aims to eliminate the
implicit buffers by reducing the task time by, for example, 50% and replacing these buffers
with a joint explicit buffer at the end of all tasks. This explicit buffer, or feeding buffer, has in
the example case the length of 50% of the total duration of the tasks in the feeding chain.
This way, the consumption of feeding buffer can be observed and, even when the feeding
buffer is completely used, there would still be a remarkable time saving. Unfortunately, this
fights against human nature and in reality the implicit buffers are very hard to eliminate.
9 www.emeraldinsight.com
2. Multi‐Project Management
11
Figure 4. Differences of buffers between critical chain and critical path method10
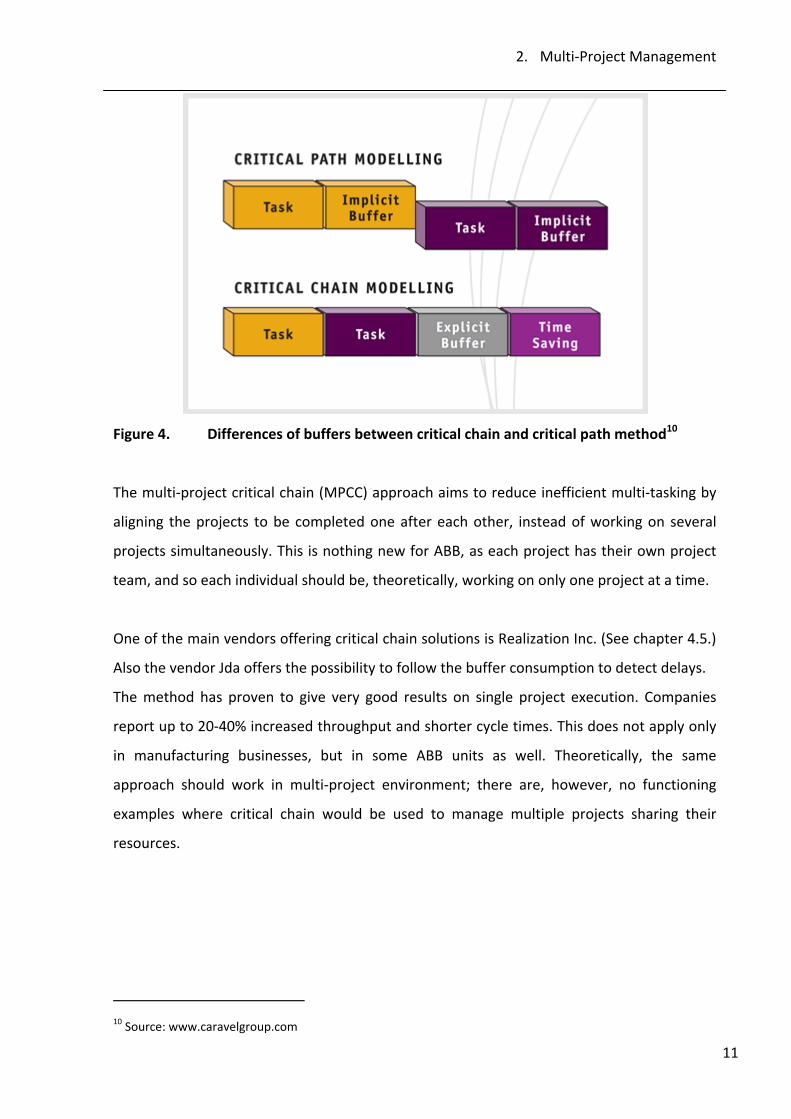
The multi‐project critical chain (MPCC) approach aims to reduce inefficient multi‐tasking by
aligning the projects to be completed one after each other, instead of working on several
projects simultaneously. This is nothing new for ABB, as each project has their own project
team, and so each individual should be, theoretically, working on only one project at a time.
One of the main vendors offering critical chain solutions is Realization Inc. (See chapter 4.5.)
Also the vendor Jda offers the possibility to follow the buffer consumption to detect delays.
The method has proven to give very good results on single project execution. Companies
report up to 20‐40% increased throughput and shorter cycle times. This does not apply only
in manufacturing businesses, but in some ABB units as well. Theoretically, the same
approach should work in multi‐project environment; there are, however, no functioning
examples where critical chain would be used to manage multiple projects sharing their
resources.
10 Source: www.caravelgroup.com
3. ABB Group
12
3. ABB Group
“Power and productivity for a better world” (ABB slogan)
ABB Group is one of the world leaders in power and automation technology. They are
specialized in improving power efficiency of industry customers and lowering environmental
impact of their solutions. With a total of 120 000 employees in over 100 countries, it is also
one of the largest engineering companies in the world, and has its headquarters located in
Zürich, Switzerland. The revenue of 2009 was 31.8 billion USD11, whereas the biggest
competitor is Siemens AG.
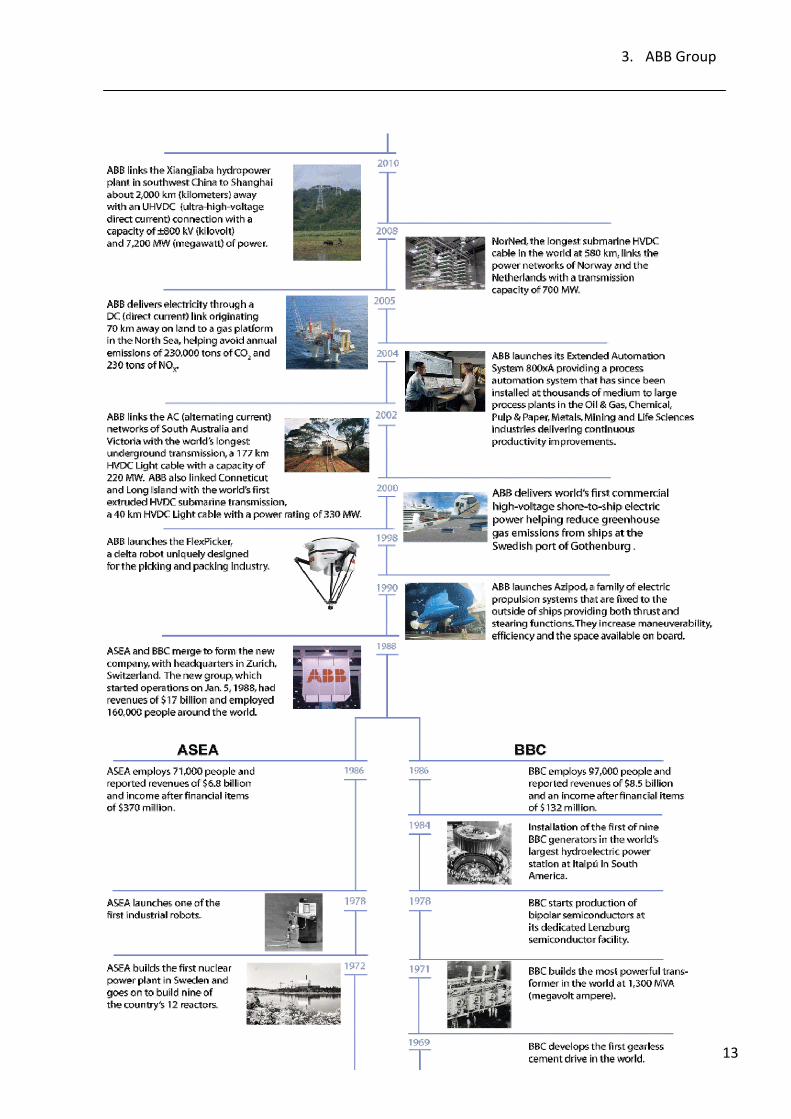
ABB was founded in 1988 as the two companies, Swedish ASEA (Allmänna Svenska Elektriska
Aktiebolaget) and Swiss BBC (Brown, Boveri & Cie), merged as a result of toughened market
competition. ASEA had been manufacturing electrical light and generators since it was
established in 1883 and had factories in several Swedish cities, whereas BBC, also a electrical
engineering company, was founded 1891 in Baden, Switzerland and later took over the
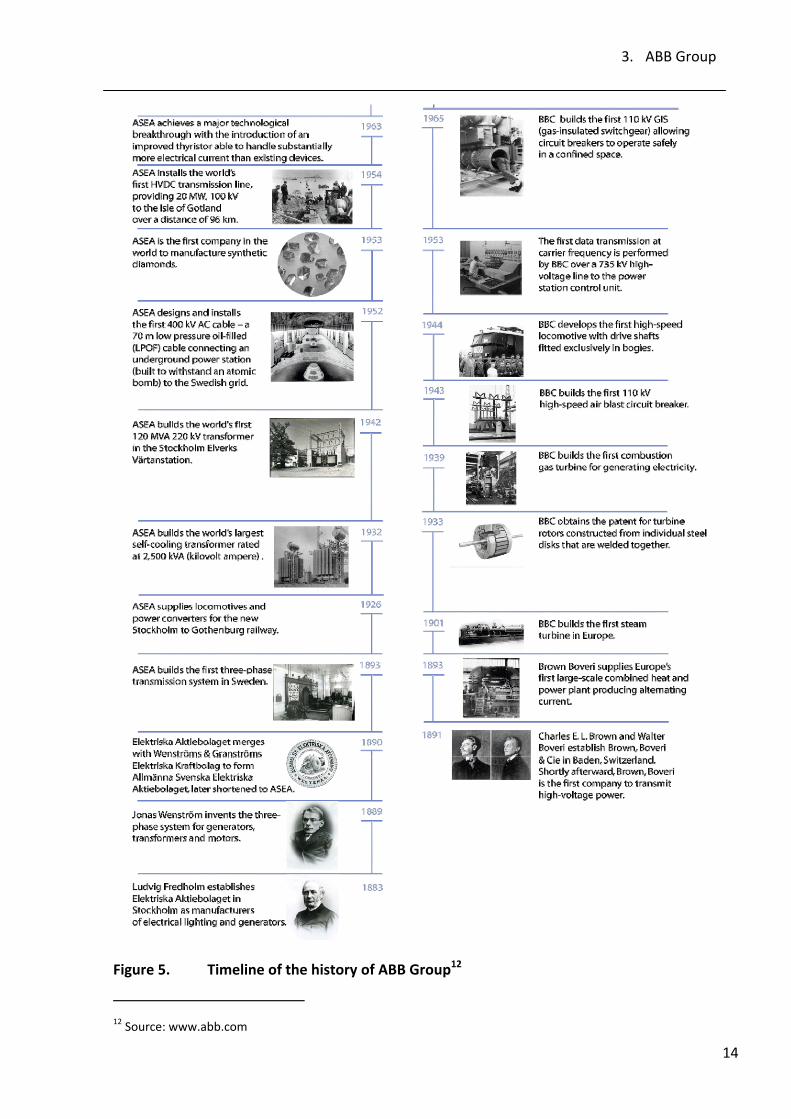
Maschinenfabrik Oerlikon in the surroundings of city Zürich. The Figure 5 shows the history
timeline of ABB, and in Figure 6 you may see the current offering selection.
11 ABB Homepage www.abb.com
3. ABB Group
13
3. ABB Group
14
Figure 5. Timeline of the history of ABB Group12
12 Source: www.abb.com
3. ABB Group
15
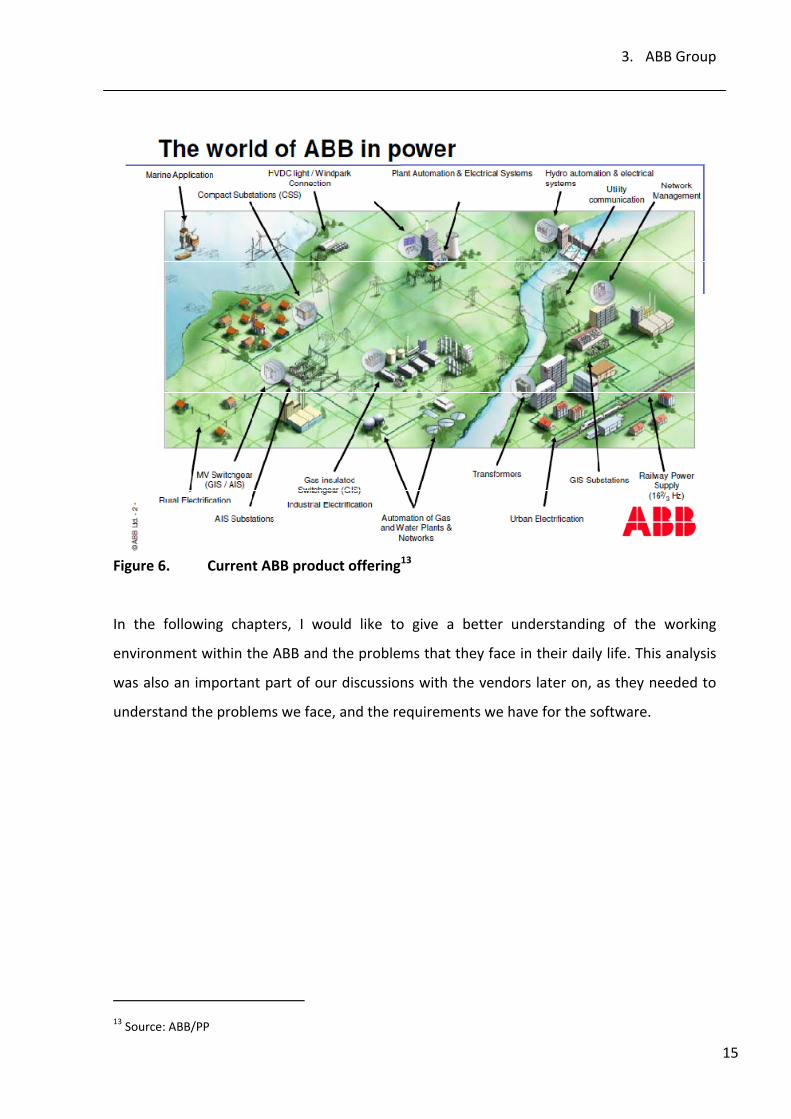
Figure 6. Current ABB product offering13
In the following chapters, I would like to give a better understanding of the working
environment within the ABB and the problems that they face in their daily life. This analysis
was also an important part of our discussions with the vendors later on, as they needed to
understand the problems we face, and the requirements we have for the software.
13 Source: ABB/PP
3. ABB Group
16
3.1. Organization
ABB is a global company of rather large dimensions so the organizational structure is
accordingly quite complicated. Due to the historical development and working culture, the
individual business units have maintained their independency in many aspects.
Group functions are mainly located in the headquarters in Switzerland. It includes
departments such as Human Resources (HR), Marketing, Legal Affairs, Global Footprint,
Finance and many smaller units like Internal Audits, Supply Chain Management (SCM) and
Quality and Operational Excellence, where I was based. Additionally to the divisions, there
are also global market departments, where each country or area has their own
management.
The five main divisions are divided into several smaller business units (BUs), where one BU
can have an estimated 1000 engineers working in 3‐7 of their engineering centers globally.
Here are the five divisions and their working areas presented14:
14 ABB Homepage www.abb.com
3. ABB Group
17
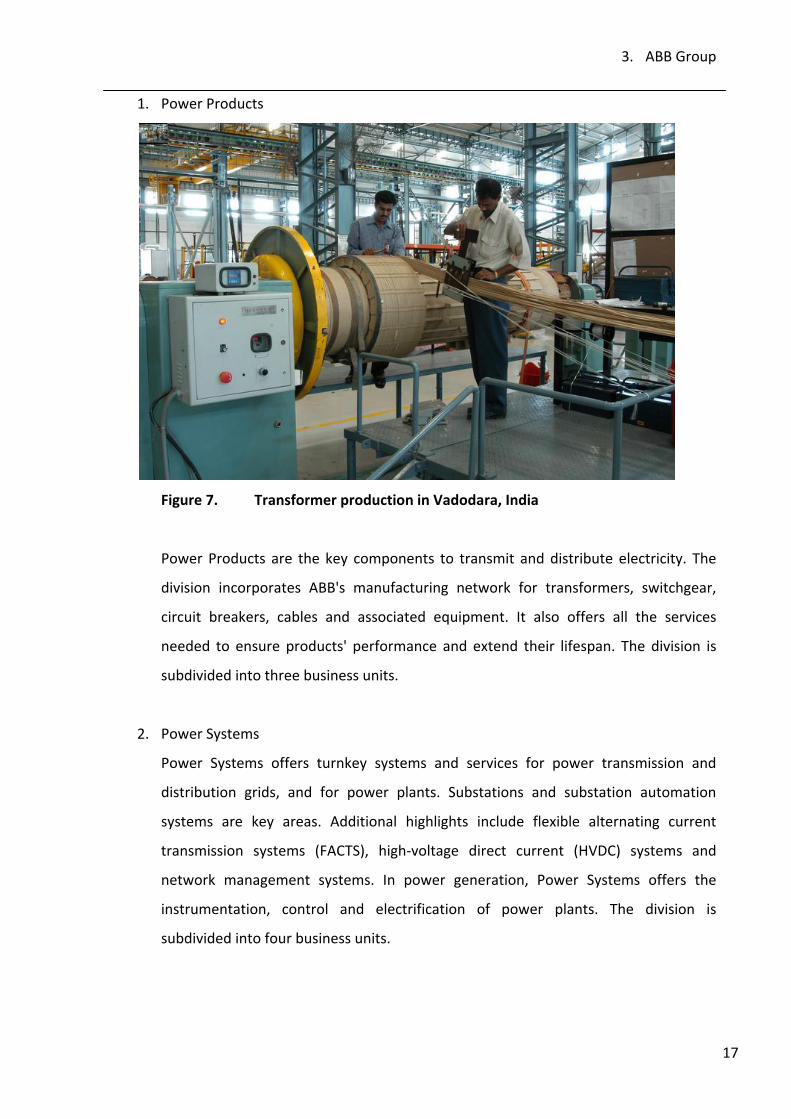
1. Power Products
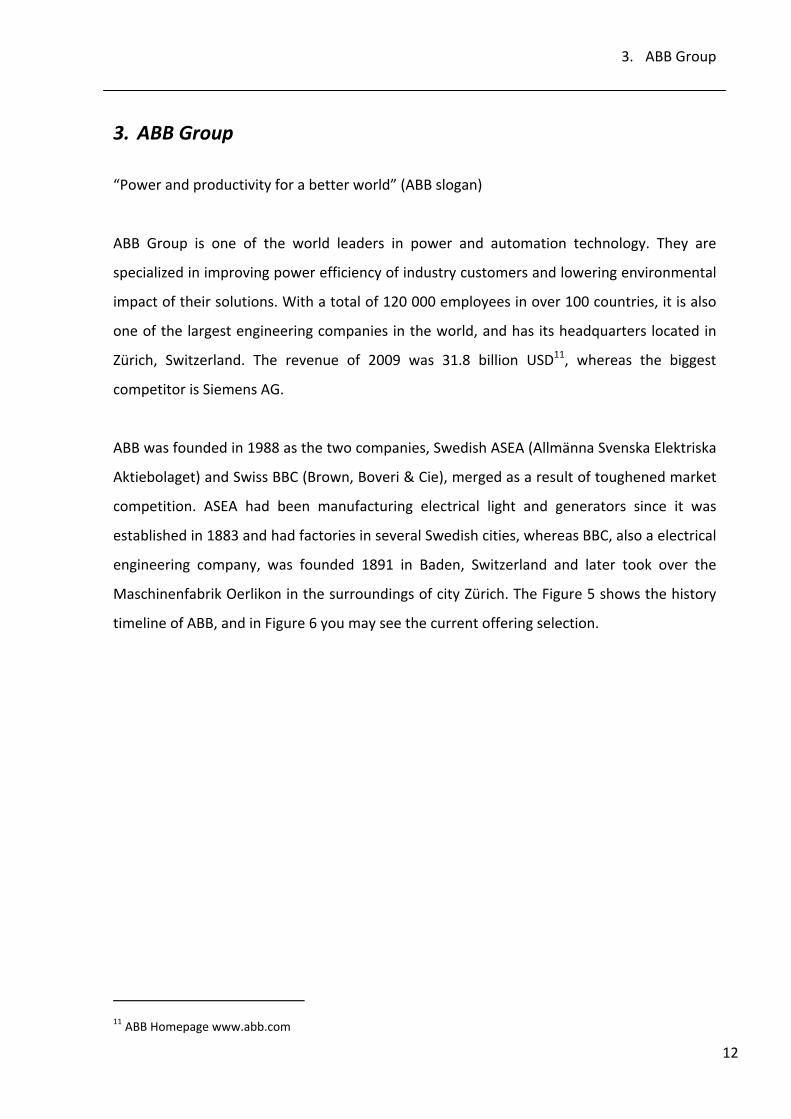
Figure 7. Transformer production in Vadodara, India
Power Products are the key components to transmit and distribute electricity. The
division incorporates ABB's manufacturing network for transformers, switchgear,
circuit breakers, cables and associated equipment. It also offers all the services
needed to ensure products' performance and extend their lifespan. The division is
subdivided into three business units.
2. Power Systems
Power Systems offers turnkey systems and services for power transmission and
distribution grids, and for power plants. Substations and substation automation
systems are key areas. Additional highlights include flexible alternating current
transmission systems (FACTS), high‐voltage direct current (HVDC) systems and
network management systems. In power generation, Power Systems offers the
instrumentation, control and electrification of power plants. The division is
subdivided into four business units.
3. ABB Group
18
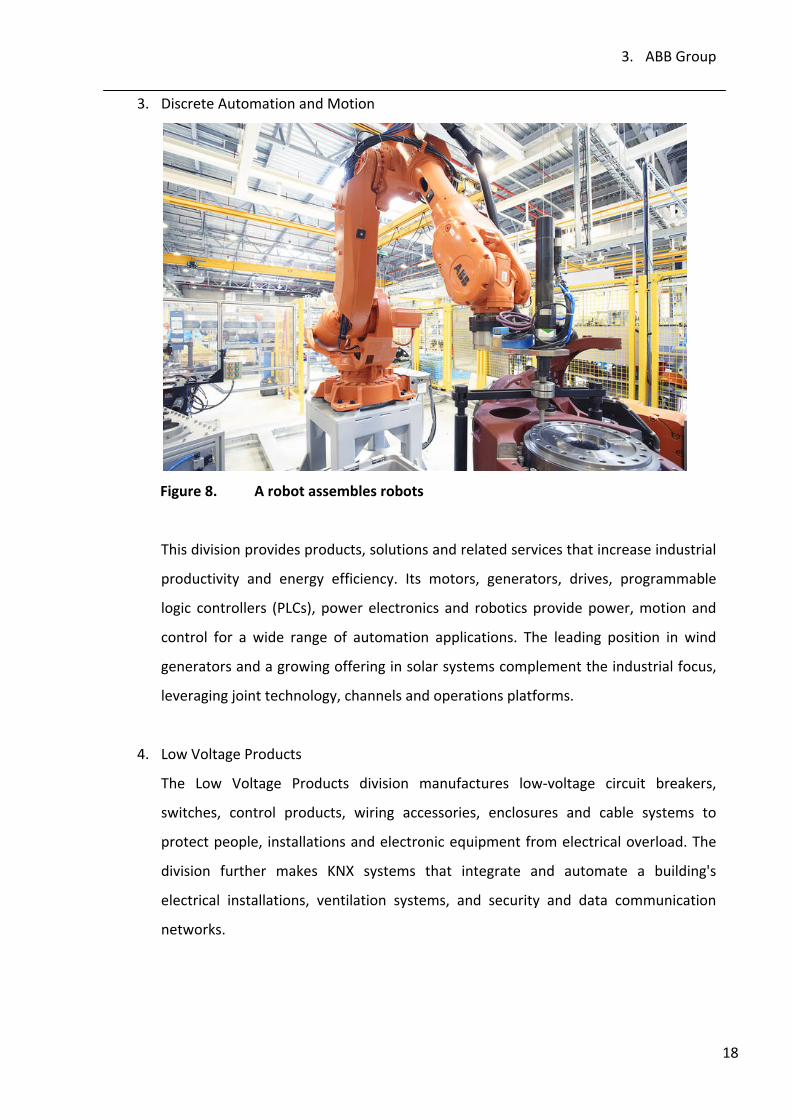
3. Discrete Automation and Motion
Figure 8. A robot assembles robots
This division provides products, solutions and related services that increase industrial
productivity and energy efficiency. Its motors, generators, drives, programmable
logic controllers (PLCs), power electronics and robotics provide power, motion and
control for a wide range of automation applications. The leading position in wind
generators and a growing offering in solar systems complement the industrial focus,
leveraging joint technology, channels and operations platforms.
4. Low Voltage Products
The Low Voltage Products division manufactures low‐voltage circuit breakers,
switches, control products, wiring accessories, enclosures and cable systems to
protect people, installations and electronic equipment from electrical overload. The
division further makes KNX systems that integrate and automate a building's
electrical installations, ventilation systems, and security and data communication
networks.
3. ABB Group
19
5. Process Automation
The main focus of this ABB business is to provide customers with products and
solutions for instrumentation, automation and optimization of industrial processes.
The industries served include oil and gas, power, chemicals and pharmaceuticals,
pulp and paper, metals and minerals, marine and turbo charging. Key customer
benefits include improved asset productivity and energy savings.
The large organization creates already some problems, for example in communication, and it
might be unjustified to compare different business units directly. It can be said however that
on a global basis the average on time delivery is only ca. 60%, which leaves a lot of room for
improvements. Some BU’s are doing better than others and have completely different
problems. Our wish is to have the multi‐project planning software implemented only in
those BU’s who could benefit from such a tool in the first place. This could apply to ca. 20
engineering units out of the total of ca. 50 BUs.
3. ABB Group
20
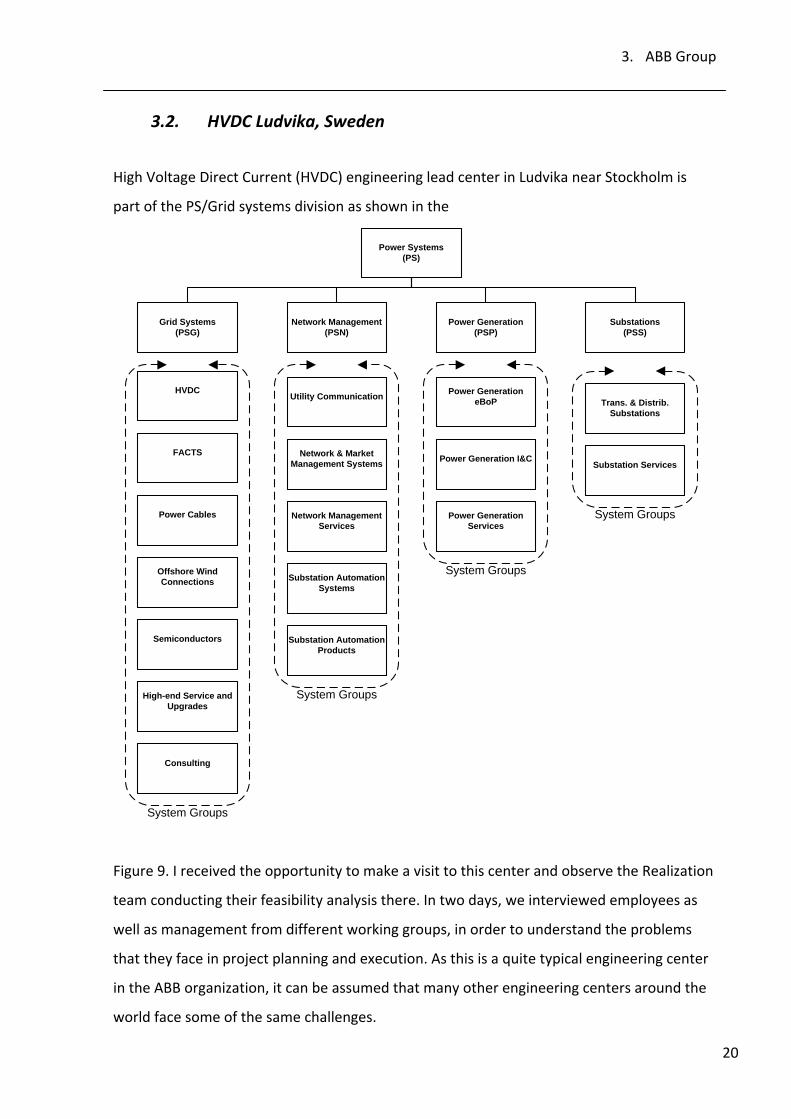
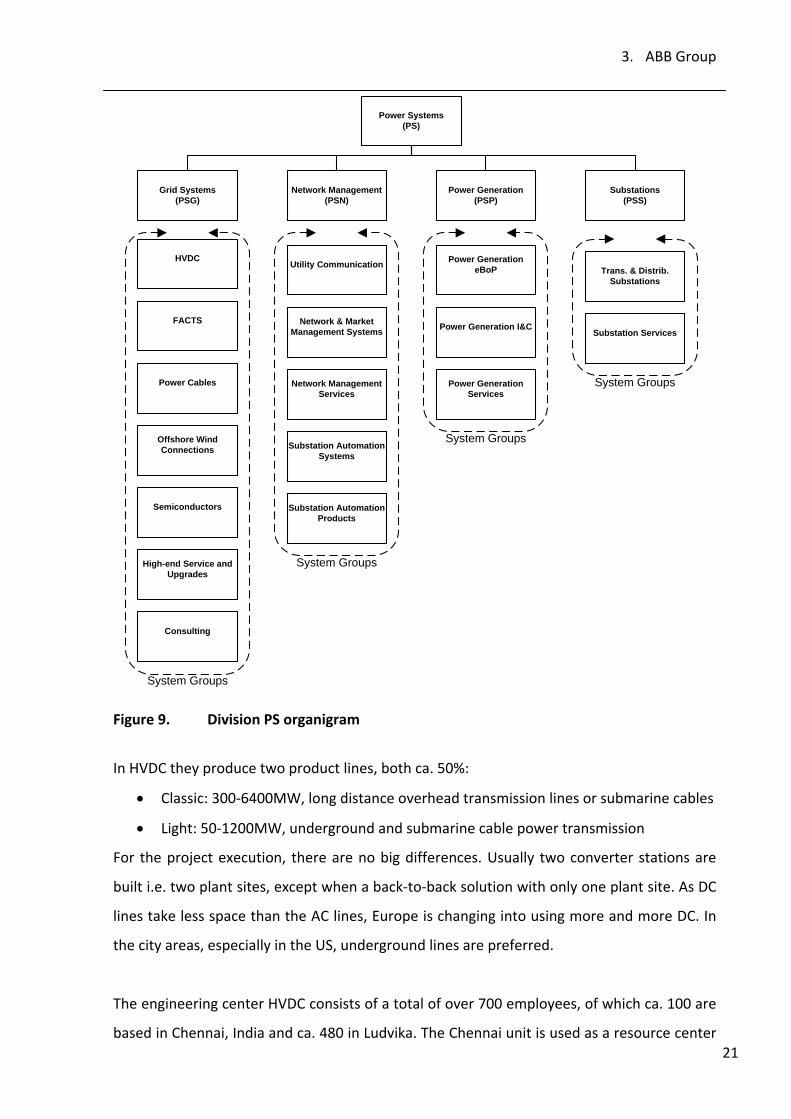
3.2. HVDC Ludvika, Sweden
High Voltage Direct Current (HVDC) engineering lead center in Ludvika near Stockholm is
part of the PS/Grid systems division as shown in the
Grid Systems(PSG)
Network Management(PSN)
Power Generation(PSP)
Substations(PSS)
FACTS
HVDC
Power Systems(PS)
Utility Communication
Network & Market Management Systems
Power Cables
Offshore Wind Connections
Substation Services
Trans. & Distrib.Substations
Network Management Services
Power Generation eBoP
Power Generation I&C
Substation Automation Products
Substation Automation Systems
Semiconductors
Power Generation Services
High-end Service and Upgrades
Consulting
System Groups
System Groups
System Groups
System Groups
Figure 9. I received the opportunity to make a visit to this center and observe the Realization
team conducting their feasibility analysis there. In two days, we interviewed employees as
well as management from different working groups, in order to understand the problems
that they face in project planning and execution. As this is a quite typical engineering center
in the ABB organization, it can be assumed that many other engineering centers around the
world face some of the same challenges.
3. ABB Group
21
Grid Systems(PSG)
Network Management(PSN)
Power Generation(PSP)
Substations(PSS)
FACTS
HVDC
Power Systems(PS)
Utility Communication
Network & Market Management Systems
Power Cables
Offshore Wind Connections
Substation Services
Trans. & Distrib.Substations
Network Management Services
Power Generation eBoP
Power Generation I&C
Substation Automation Products
Substation Automation Systems
Semiconductors
Power Generation Services
High-end Service and Upgrades
Consulting
System Groups
System Groups
System Groups
System Groups
Figure 9. Division PS organigram
In HVDC they produce two product lines, both ca. 50%:
• Classic: 300‐6400MW, long distance overhead transmission lines or submarine cables
• Light: 50‐1200MW, underground and submarine cable power transmission
For the project execution, there are no big differences. Usually two converter stations are
built i.e. two plant sites, except when a back‐to‐back solution with only one plant site. As DC
lines take less space than the AC lines, Europe is changing into using more and more DC. In
the city areas, especially in the US, underground lines are preferred.
The engineering center HVDC consists of a total of over 700 employees, of which ca. 100 are
based in Chennai, India and ca. 480 in Ludvika. The Chennai unit is used as a resource center
3. ABB Group
22
for completing tasks that are not connected to the work in Ludvika. In China they have
another independent unit, and additionally there are units in the countries where
construction is in progress. 100 new employees are trained in Ludvika and 30 in India this
year.
At the moment they are running 18 customer projects, 3 Research and Development (R&D)
projects and 2 upgrades. 24 tenders had been left by August 2010. Until now, they have not
paid any penalties, although the projects almost always finish late. This is because the
customer is partly to blame, for example, for not delivering the necessary information on
time. Other parties, like suppliers, are often also late, giving ABB more time to finish their
job. The delay from the ABB side is then no longer considered as serious, as the work “would
be late anyway”. As the workload is increasing and some projects are facing heavy problems,
it is to assume that penalties will be paid in the coming projects.
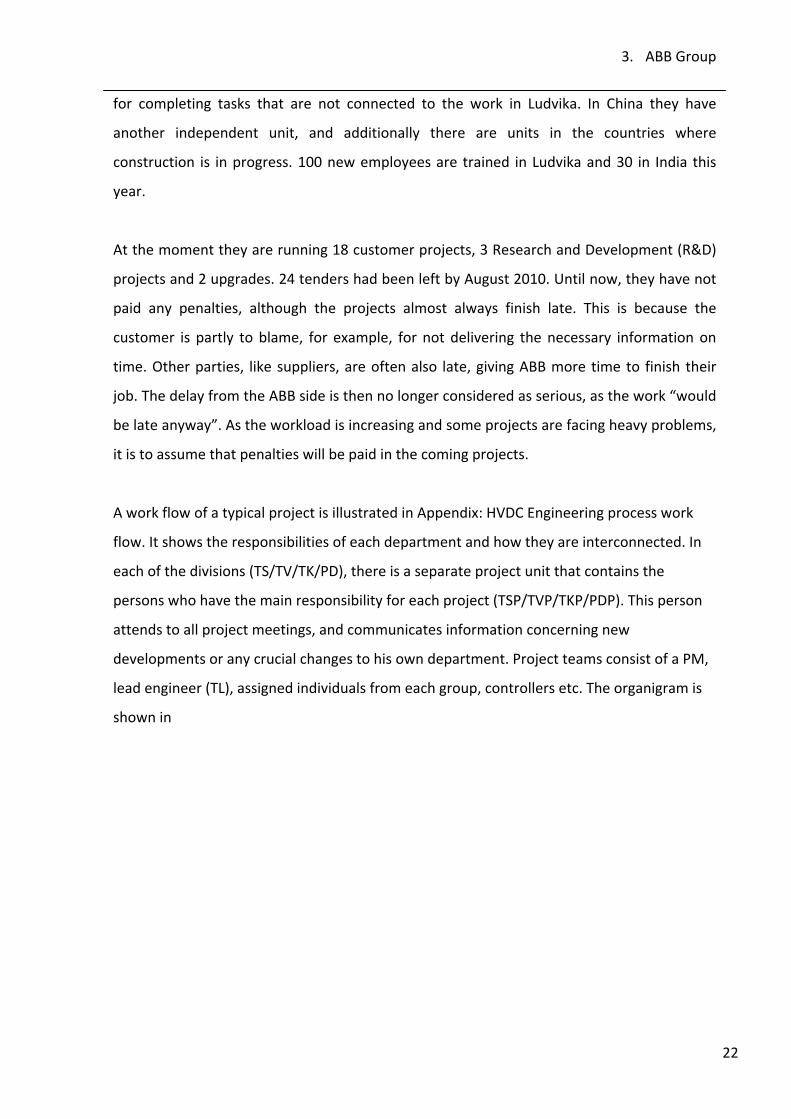
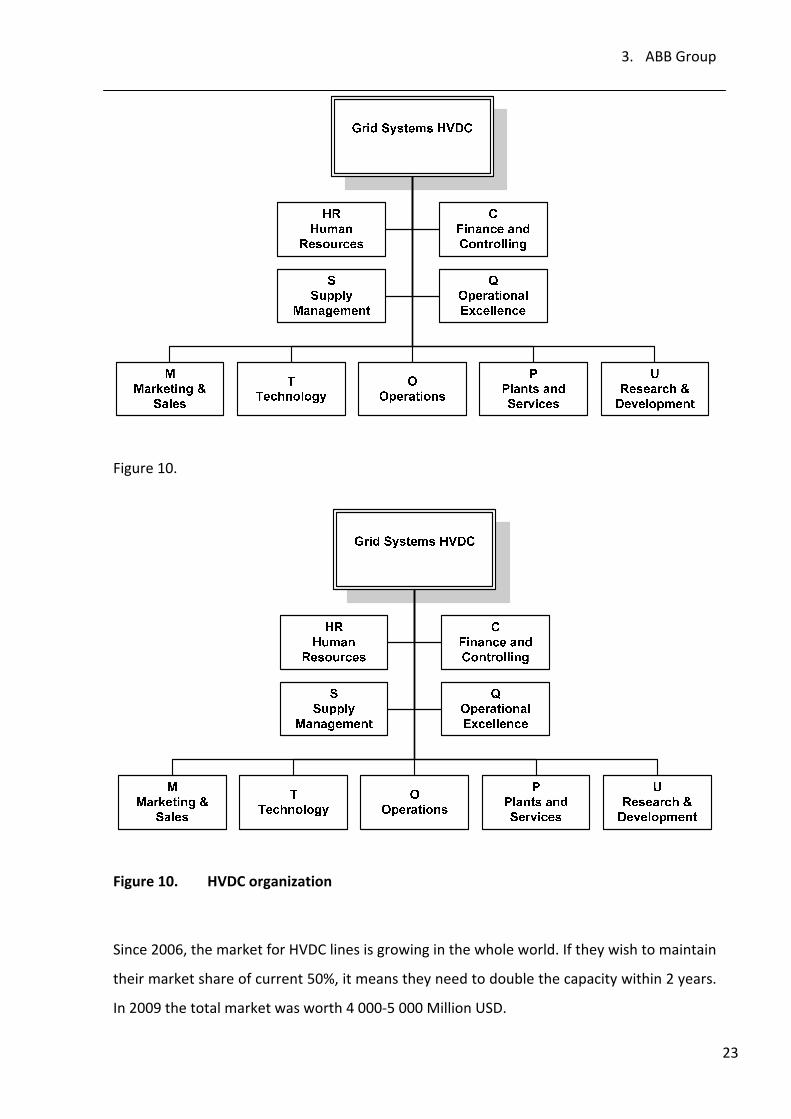
A work flow of a typical project is illustrated in Appendix: HVDC Engineering process work
flow. It shows the responsibilities of each department and how they are interconnected. In
each of the divisions (TS/TV/TK/PD), there is a separate project unit that contains the
persons who have the main responsibility for each project (TSP/TVP/TKP/PDP). This person
attends to all project meetings, and communicates information concerning new
developments or any crucial changes to his own department. Project teams consist of a PM,
lead engineer (TL), assigned individuals from each group, controllers etc. The organigram is
shown in
3. ABB Group
23
Figure 10.
Figure 10. HVDC organization
Since 2006, the market for HVDC lines is growing in the whole world. If they wish to maintain
their market share of current 50%, it means they need to double the capacity within 2 years.
In 2009 the total market was worth 4 000‐5 000 Million USD.
3. ABB Group
24
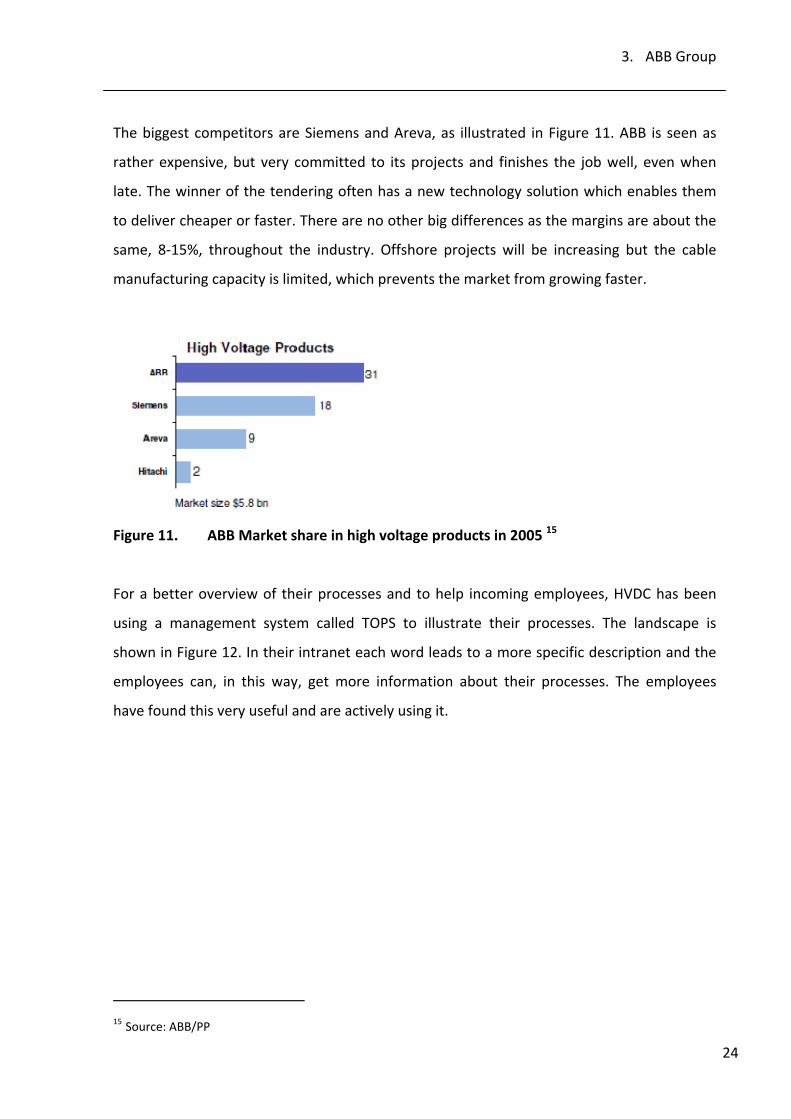
The biggest competitors are Siemens and Areva, as illustrated in Figure 11. ABB is seen as
rather expensive, but very committed to its projects and finishes the job well, even when
late. The winner of the tendering often has a new technology solution which enables them
to deliver cheaper or faster. There are no other big differences as the margins are about the
same, 8‐15%, throughout the industry. Offshore projects will be increasing but the cable
manufacturing capacity is limited, which prevents the market from growing faster.
Figure 11. ABB Market share in high voltage products in 2005 15
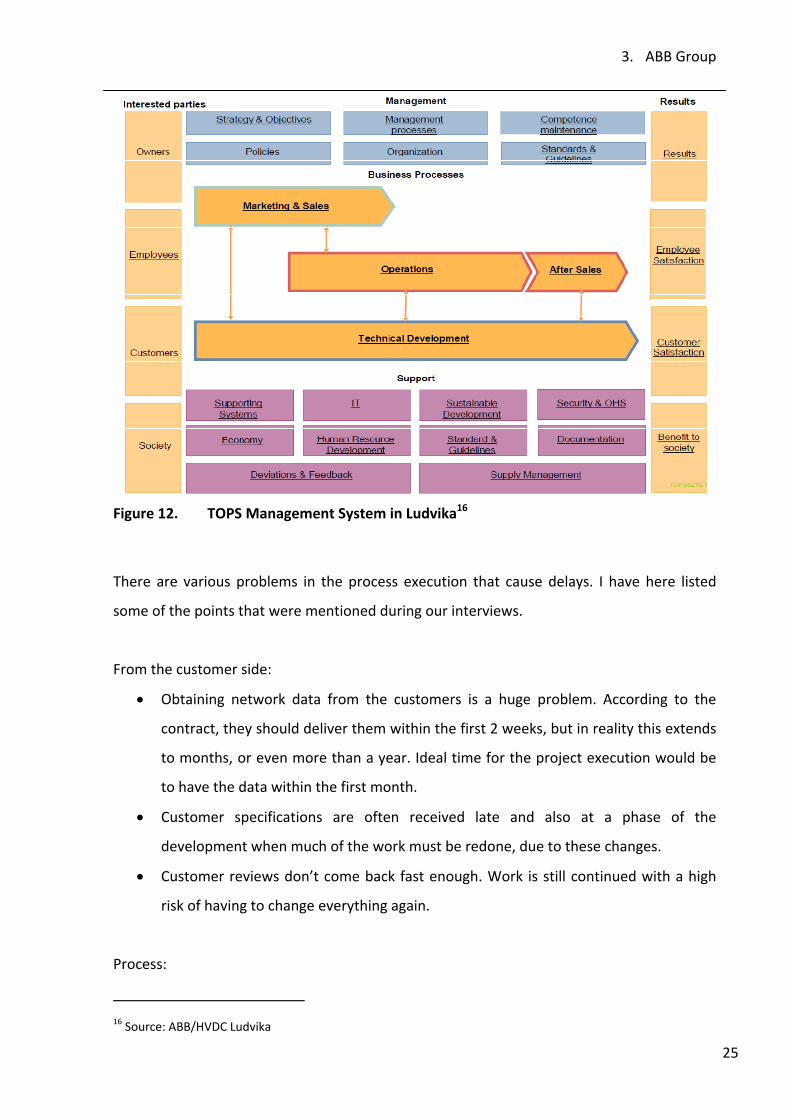
For a better overview of their processes and to help incoming employees, HVDC has been
using a management system called TOPS to illustrate their processes. The landscape is
shown in Figure 12. In their intranet each word leads to a more specific description and the
employees can, in this way, get more information about their processes. The employees
have found this very useful and are actively using it.
15 Source: ABB/PP
3. ABB Group
25
Figure 12. TOPS Management System in Ludvika16
There are various problems in the process execution that cause delays. I have here listed
some of the points that were mentioned during our interviews.
From the customer side:
• Obtaining network data from the customers is a huge problem. According to the
contract, they should deliver them within the first 2 weeks, but in reality this extends
to months, or even more than a year. Ideal time for the project execution would be
to have the data within the first month.
• Customer specifications are often received late and also at a phase of the
development when much of the work must be redone, due to these changes.
• Customer reviews don’t come back fast enough. Work is still continued with a high
risk of having to change everything again.
Process:
16 Source: ABB/HVDC Ludvika
3. ABB Group
26
• The work on new projects is started almost immediately, even when the required
information from the customer has not been received. Plenty of work is done based
on assumptions, which sometimes turn out to be wrong and rework must be done.
This often influences several units, which need to redo the design etc.
• Long delivery times of crucial parts, like transformer (12 Months) or bushings (12
Months), hence the orders are done in the very beginning, even with lack of
information. Note: Most suppliers are within ABB organization.
• Senior engineers (TK, TS, PD) cannot commit to their project, because they are
needed for many other tasks, such as tendering, to be present at the site, old work
from previous projects, meetings, administration etc.
• The material planning at the site is disorganized and required items, especially small
parts, cannot be found, causing a lot of delay. Storage places of the parts are not
planned, and the right items might be in the wrong place when needed. Drawings do
not comply with the delivered material.
• Due to the lack of information from the other departments, and originally from the
customer, the local construction company is chosen at a very late phase.
Others:
• Damage to the parts during transportation
• Weather conditions on the site: monsoon rains, heavy waves on the open sea during
the winter
• Work permits, visas. HR is not taking care of it, but the units have to do the
administration themselves, causing a lot of time lost for other duties
The current software in use are:
• PM tools: mainly Primavera, also some MS Project
• SAP ERP Version 6.0
• Excel based SVP for planning of sales and future resource capacities:
o gives information how many people from which department are needed, and
the line managers then assign the resources to each project
o Plans 8‐10 weeks ahead
3. ABB Group
27
o Updated in a meeting between the project managers, planning department
and line managers once a week, visible for everyone through a central
document library
Current development projects or plans
• They have now started to take notes on the time spent for rework and are marking
this in deviation orders
• Valve assembly will become more planned
• SVP will be developed more
• Extending the use of Primavera P6
• Training of 150 new engineers in 2011, general increase of capacity
• Looking for other suppliers outside ABB, because of on time delivery problems.
To summarize the situation, in some departments, adding more volume helps to do the work
faster. However, the bottlenecks are in departments where senior engineers need extensive
experience, and require 5‐10 years to be able to take on the responsibility alone. These
individuals are needed in so many phases of the execution, like tendering, supervising at the
site and work on already delivered projects, that they cannot commit their time to the actual
project that they are assigned to.
Due to very uncertain planning, problems arise in the execution phase. A “hockey stick”17
form of the resource consumption is witnessed in almost every project, and the employees
have to work long hours, under heavy stress, during the last phase before each milestone.
Most delays are a consequence of the insufficient data from the customer as the work is
started based on assumptions. An enormous amount of rework is done to correct this later
on. Also, customer specifications are received at very late stages, causing big changes. In the
end phase of the project i.e. at site, several site managers and senior engineers are required
to guarantee the successful delivery date and hence, are pulled away from their new
projects, causing them to delay.
17 A shape of a curve that is relatively flat and then rises rapidly representing, for example, the amount of effort
one puts out as deadline approaches.
3. ABB Group
28
Tendering is also disturbing the normal work enormously, as some tenders must be returned
within the shortest time. In China they might give a working time of only 2 weeks instead of
the reasonable 1‐2 months. To make a presentable tender, requires in that case, the most
experienced people and again, they cannot work for their current project. In the TSD for
example, ca. 40% of their time is spent in tendering. All these distractions result in less work
done for R&D projects, which are the most important part for guaranteeing competitive
solutions.
Possible solutions that could ease the situation:
• Longer time between signing a contract and beginning of work, not starting until
network data has been received.
• If the customer requires changes at a late phase, this should be an extra charge from
the customer.
• Portfolio management: Not to tender for all projects, but to start selecting more
carefully, which to do and if capacity is available. Prioritizing the projects based on
portfolio selection.
• Better communication systems; failsafe document sharing to ensure only the up‐to‐
date drawings are worked on, computer based schedule visible for everyone,
notification of changes
• Long term career planning for employees, to train them in the shortest time to
become “seniors”, delegating as much work as possible for the juniors
• Customers should be present during the testing phase, to learn how to do it. This way
they can solve their problems later on themselves. This has already proved to be
efficient.
• In the commissioning phase, two teams are needed at site to work in two shifts. Now
only one shift is working, because of lack of supervisors. 10 persons from TK and 6
from TS are needed.
• Software for better overview of the resource planning, replacing the Excel‐based SVP.

3. ABB Group
29
3. ABB Group
30
3.3. Power Cables Karlskrona, Sweden
Another possible location for a pilot project would be the high voltage cable factory in
Karlskrona in south Sweden. This engineering center is also part of the division PS/Grid
Systems as shown in Figure 9. They employ ca. 450 people in Karlskrona and additional 120
in their factory in the US. As one project last 1‐4 years, they have the capacity for running ca.
5 big and 5 small projects simultaneously. As they require mostly raw material like cupper
and other metals, most of the suppliers are outside ABB.
The market demand has been increasing tremendously during the last few years and due to
the lack of capacity, ABB has most likely even lost some of its market share. Main reasons for
the quick market growth are:
• EU is changing from national power grids to a Europe‐wide grid
• Oil and gas companies need electricity from the main land to be transferred offshore
• New (offshore) wind power
• Increasing amount of underground cables, as overhead line permits are no longer
granted
• Earlier, ABB was able to sell cables together with the HVDC stations, but now the
trend is to buy cables separately.
There are some clear business challenges being faced at the moment:
• Vessels are hard to get. Cables are huge and require special vessels which are often
not available.
• Cable must be individually designed, no two are the same
• Sufficient buffers must be planned to guarantee flexibility, resulting in other lost
business opportunities
• Due to recent investments, the introduction of new machinery has required extra
time. In general, they have doubled their capacity during the last 3 years.
• The winning chances of the bids are very uncertain, and therefore, the resource
estimations are very difficult to do without a tool capable of doing what‐if
simulations.
4. Software Vendors
31
4. Software Vendors
There are hundreds of project management tools on the market, all claiming to be the right
solution for your company. For single project management, there are two clear market
leaders for engineering companies: Microsoft Project and Primavera from Oracle. Primavera
has a long experience with the engineering business, and is preferred also in several ABB
units, as the tool itself is very powerful and is well suited for the type of projects that we
have.
When it comes to project portfolio management (PPM) tools, the typical leaders fail to show
sufficient functionalities, or they focus only in the IT branch. The PPM market is constantly
growing, and even the smallest companies try to create their own versions. Providing some
basic functionality appears to be no challenge for the programmers, but for the use of a
company such as ABB, there needs to be a lot more. The tool needs to be comprehensive
enough so that its use can be expanded later if wanted and the company behind it must be
able to give the needed support and development.
Currently all tools are web‐based and practically all companies offer additionally the
possibility to do the implementation as SaaS (software as a service) where the tool is hosted
from outside the company. Hence this variation requires less resources from the client
company, and the implementation runs more smoothly. According to several researchers
this gives also a better Return on Investment (RoI), already after five years18. Personally, I
believe this is also the future trend that will be adopted throughout the business, after some
time.
Forrester Research Ltd. is one company that does intensive research in the PPM market and
we were able to obtain their 4th quarter 2009 publication. As most of the vendors offer a
solution clearly for IT projects only, they have divided the vendors into business oriented and
IT oriented sectors.
18 Powersteering Webcast 2010; DeGennaro, Visitacion, 2009; Symons, 2009
4. Software Vendors
32
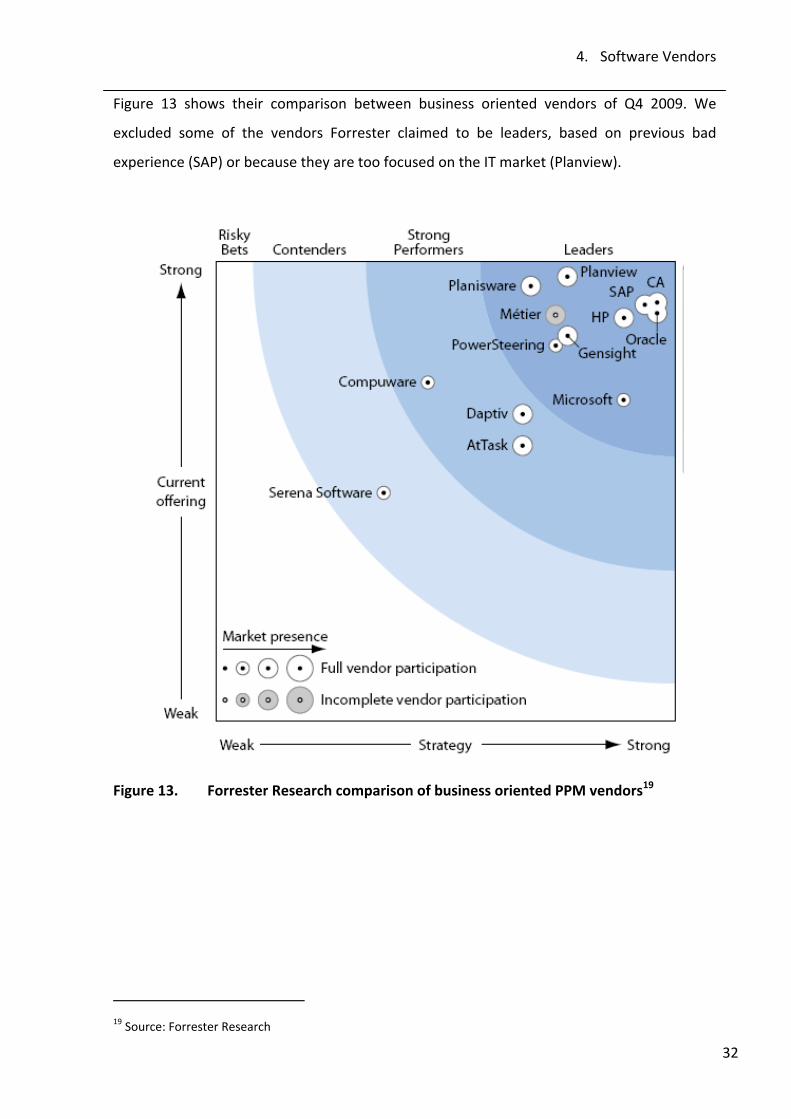
Figure 13 shows their comparison between business oriented vendors of Q4 2009. We
excluded some of the vendors Forrester claimed to be leaders, based on previous bad
experience (SAP) or because they are too focused on the IT market (Planview).
Figure 13. Forrester Research comparison of business oriented PPM vendors19
19 Source: Forrester Research
4. Software Vendors
33
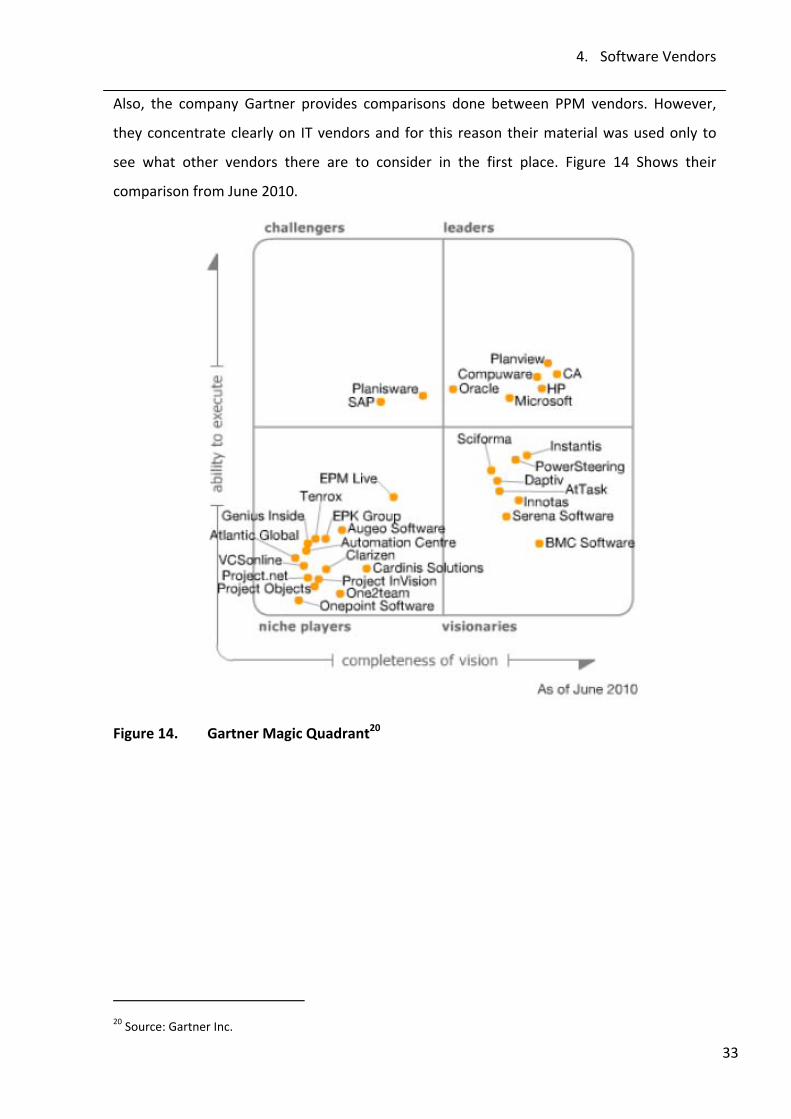
Also, the company Gartner provides comparisons done between PPM vendors. However,
they concentrate clearly on IT vendors and for this reason their material was used only to
see what other vendors there are to consider in the first place. Figure 14 Shows their
comparison from June 2010.
Figure 14. Gartner Magic Quadrant20
20 Source: Gartner Inc.
4. Software Vendors
34
In the following chapters, I will present the vendors that came into consideration. I am not
claiming them to be the Top 5 on the market, rather a mixture of interesting companies that
we wanted to explore more closely, such as promising Planisware and Jda. Also vendors that
would be obvious solutions, as they are already used within ABB, such as Realization, HP and
Primavera were considered. Additionally, I did some research on the following other
vendors, but they couldn’t convince me that they could provide ABB a proper solution:
• Actano
• CA
• Enrich Consulting
• GenSight
• IBM
• Instantis
• Métier
• Microsoft
• Planview
• PowerSteering
• ProChain
• Safran
• SAP
• Scheuring
• Semanticspace
• Sopheon
• TXT e Solution
We started by collecting different qualities and functionalities that we considered important
for us. However, in the course of the evaluations, I noticed, that the differences are not to be
found in single functionalities by asking “can you provide this?”, but more in the complete
solution as a whole. For example, one may display the same function as all the others, but
when you compare the graphs, there are great differences in the readability, accuracy, and
all‐in‐all quality of the displayed information.
In my hope of finding a numerical way of comparing these solutions, I listed the most
relevant functionalities and rated them on a scale from 1 (satisfactory) to 3 (ideal). I asked
the vendors to answer some questions concerning different functionalities, and used the
received answers, information on their homepage, other comparisons and the interviews
conducted with the reference companies to make this rating. The screenshots also give a
good impression of how the tool works, and verify most of the information. The results are
presented in chapter Results.
4. Software Vendors
35
The questionnaire included various questions, some of which I have listed here to give a
better idea of the nature of the questionnaire:
• Dashboard ‐ Clear, structured overview showing the information that is important for
the specific user
• Highlighting of constraints ‐ Are the constraints pointed out automatically? How
much effort is needed to find them?
• Resource capacity analysis ‐ Display of resource capacities and current load factors
• Resource load differentiation ‐ Is it possible to differentiate which part of the
planned resource load consists of an unconfirmed project i.e. offer?
• Forecasting of medium‐term work load ‐ To what extent can the resource load be
estimated? How early is it possible to reveal bottlenecks?
• Report customizing ‐ Is it possible to adjust the report manually?
• Problem task identification ‐ Is it possible to identify the tasks which repeatedly
violate constraints or cause extra buffer consumption?
• Material constraints ‐ Reporting of current and forecasted material constraints
• Interfaces: MS Project and Primavera ‐ A dynamic interface to Microsoft Project is a
must. Interface to Primavera is also necessary and any additional integration
possibilities to, for example Safran, are considered as an advantage.
• SAP ERP ‐ The software must be dynamically linked with SAP ERP system that we are
using.
• SAP ERP Human Capital Management ‐ Can human resources and their skill
categories be taken from SAP?
• Suppliers ‐ Is it possible to connect workflows with suppliers? Is it possible to see at a
glance to which different projects the same supplier is delivering?
• Early warning system ‐ How is the user notified when a task is threatening to cause
problems? Is there a visual alert on the dashboard or any other notification
possibilities?
• Adjustable criteria for the alerts ‐ Can the user manually set criteria which defines
the moment when a task is considered escalated and requires interference?
• Earned Value Management ‐ Is EVM reporting supported by the software?
• Buffer status or EVM analysis display ‐ How is the extent of the problem illustrated?
4. Software Vendors
36
• Optimizer ‐ Does the program include an optimizer which automatically suggests
corrective measures? How does it prioritize the projects or tasks? Can these
assumptions be manually changed?
• What‐if simulation ‐ Is it possible to try different scenarios and compare these with
the original version? Are the relevant parameters easily comparable?
• Differentiating project status ‐ Can a project be given different statuses such as offer
or scheduled? How are these displayed in master plan?
• Project definition ASAP/ALAP ‐ Can a project be defined to start as soon as possible
and others as late as possible?
• Project parameters ‐ Are project parameters manually adjustable?
• Planning templates ‐ Can different project planning templates be saved?
• Language selection ‐ Can the program be run in different languages? If yes, which
ones? Is National Language Support included?
• General flexibility ‐ To what extend can the layout or start page values be defined for
each user or user group? How flexible are the program settings?
• Web‐based
• Accessibility 24/7/365 ‐ How reliable is the solution? Back‐up of necessary data?
• Scalability ‐ To which extent can the performance be guaranteed?
• Implementation as a managed service ‐ Is there an implementation option where
the software is managed remotely?
• Support and training ‐ How is the user support and initial training provided?
• User groups ‐ Which different users or access levels exist? Is the information limited
only to those who it primarily concerns, or is it visible for other users as well?
• History logging ‐ Is there a possibility to track done changes, and to see who did this
and when?
4. Software Vendors
37
4.1. Planisware
Planisware 5 (formerly known as OPX2) is an
enterprise project portfolio management
(EPPM) software solution created for large and
mid‐size companies. The company Planisware
was incorporated in the USA 1999 with headquarters in San Francisco, California and they
have additional offices around the US and in Europe. With a steady annual growth of 30‐
50%, they have managed to win some big clients, especially in the business oriented sector.
In 2009 they had revenue of 24.2 MEUR21.
Central characteristics:
• Stage‐Gate Ready and SAP certification
• High flexibility and scalability
• Advanced program level what‐if simulations
• User friendly with clear visual tools
• One‐click up or down load to/from project management or MS office tools
• Easy to use reporting wizard
Quotes from Forrester Research and BARC22:
21 Planisware Homepage www.planisware.com 22 DeGennaro, Visitacion, 2009 and www.planisware.com
4. Software Vendors
38
4.1.1. Multi‐Project Planning
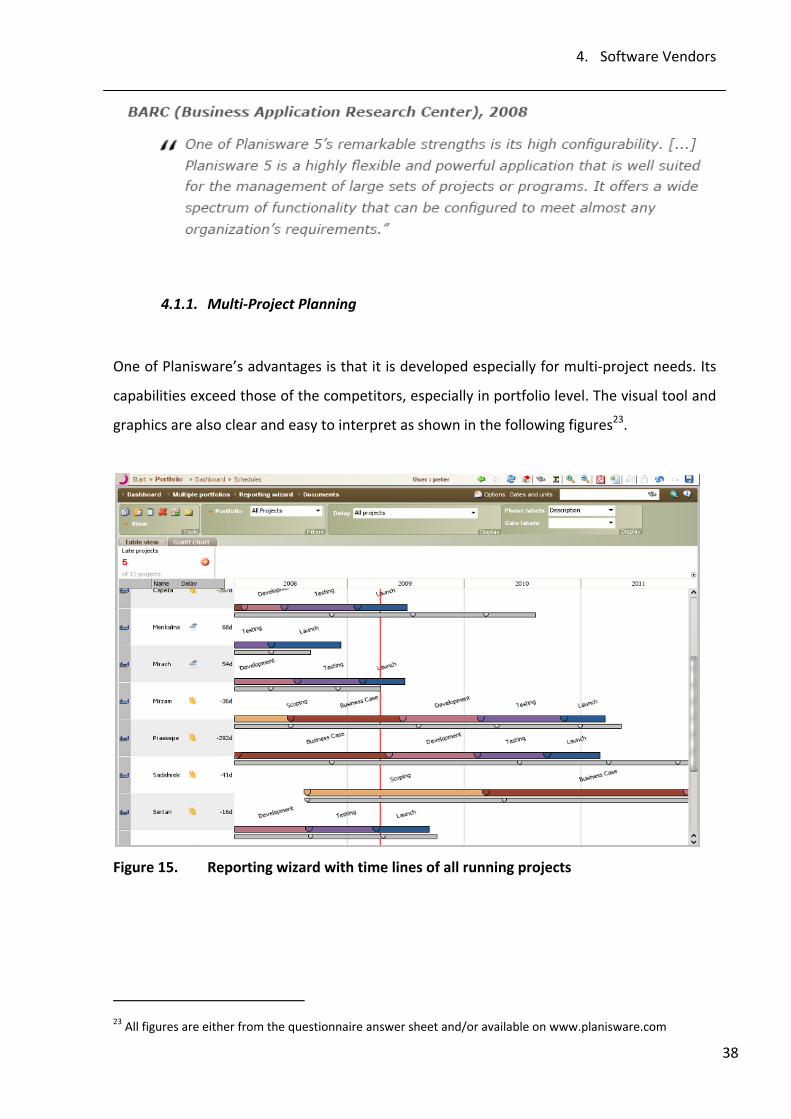
One of Planisware’s advantages is that it is developed especially for multi‐project needs. Its
capabilities exceed those of the competitors, especially in portfolio level. The visual tool and
graphics are also clear and easy to interpret as shown in the following figures23.
Figure 15. Reporting wizard with time lines of all running projects
23 All figures are either from the questionnaire answer sheet and/or available on www.planisware.com
4. Software Vendors
39
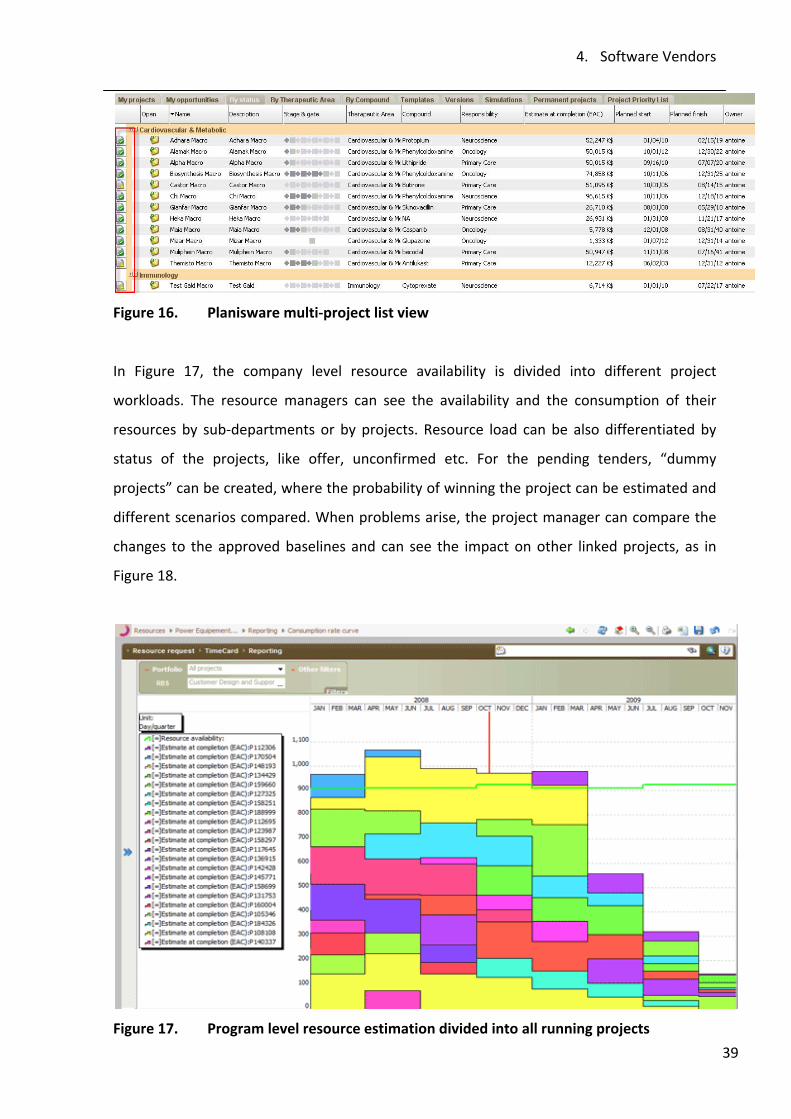
Figure 16. Planisware multi‐project list view
In Figure 17, the company level resource availability is divided into different project
workloads. The resource managers can see the availability and the consumption of their
resources by sub‐departments or by projects. Resource load can be also differentiated by
status of the projects, like offer, unconfirmed etc. For the pending tenders, “dummy
projects” can be created, where the probability of winning the project can be estimated and
different scenarios compared. When problems arise, the project manager can compare the
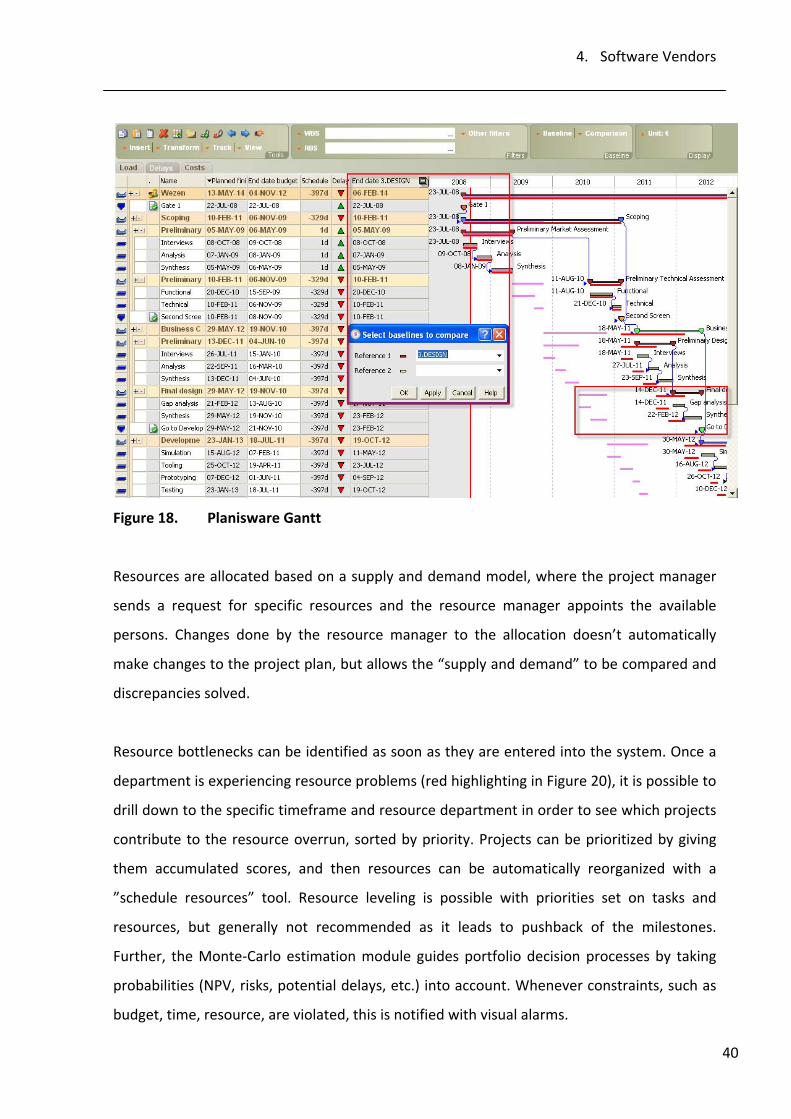
changes to the approved baselines and can see the impact on other linked projects, as in
Figure 18.
Figure 17. Program level resource estimation divided into all running projects
4. Software Vendors
40
Figure 18. Planisware Gantt
Resources are allocated based on a supply and demand model, where the project manager
sends a request for specific resources and the resource manager appoints the available
persons. Changes done by the resource manager to the allocation doesn’t automatically
make changes to the project plan, but allows the “supply and demand” to be compared and
discrepancies solved.
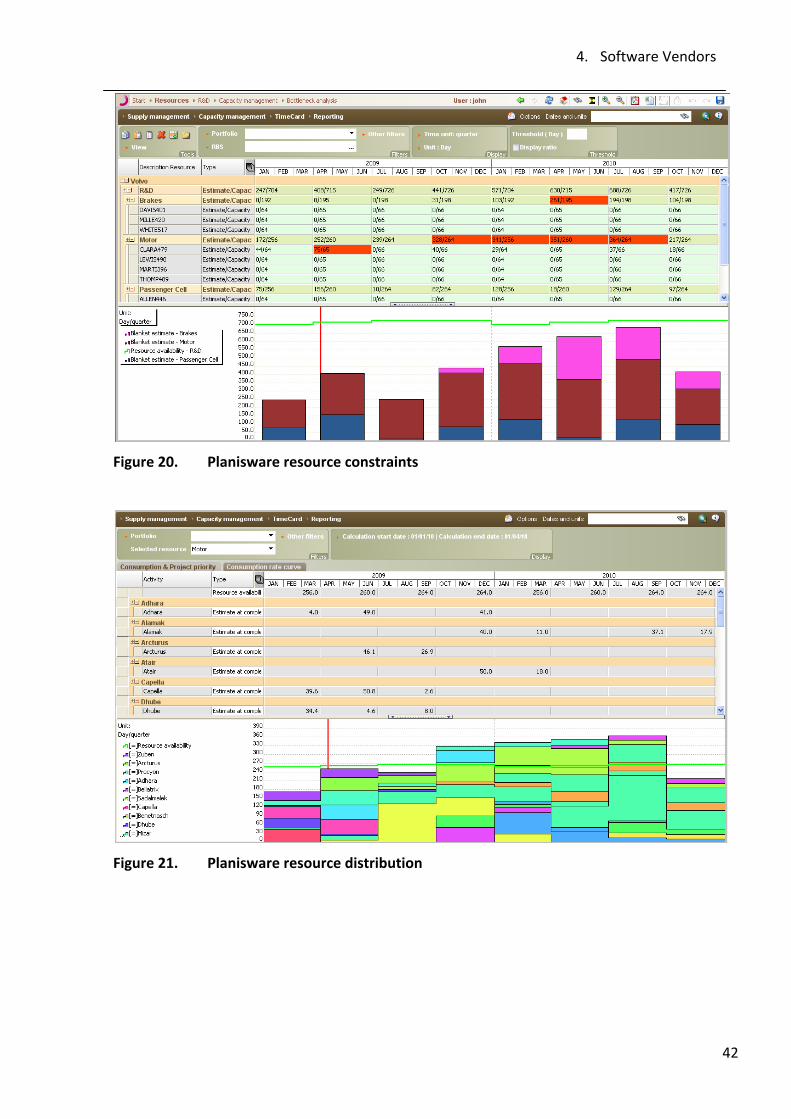
Resource bottlenecks can be identified as soon as they are entered into the system. Once a
department is experiencing resource problems (red highlighting in Figure 20), it is possible to
drill down to the specific timeframe and resource department in order to see which projects
contribute to the resource overrun, sorted by priority. Projects can be prioritized by giving
them accumulated scores, and then resources can be automatically reorganized with a
”schedule resources” tool. Resource leveling is possible with priorities set on tasks and
resources, but generally not recommended as it leads to pushback of the milestones.
Further, the Monte‐Carlo estimation module guides portfolio decision processes by taking
probabilities (NPV, risks, potential delays, etc.) into account. Whenever constraints, such as
budget, time, resource, are violated, this is notified with visual alarms.
4. Software Vendors
41
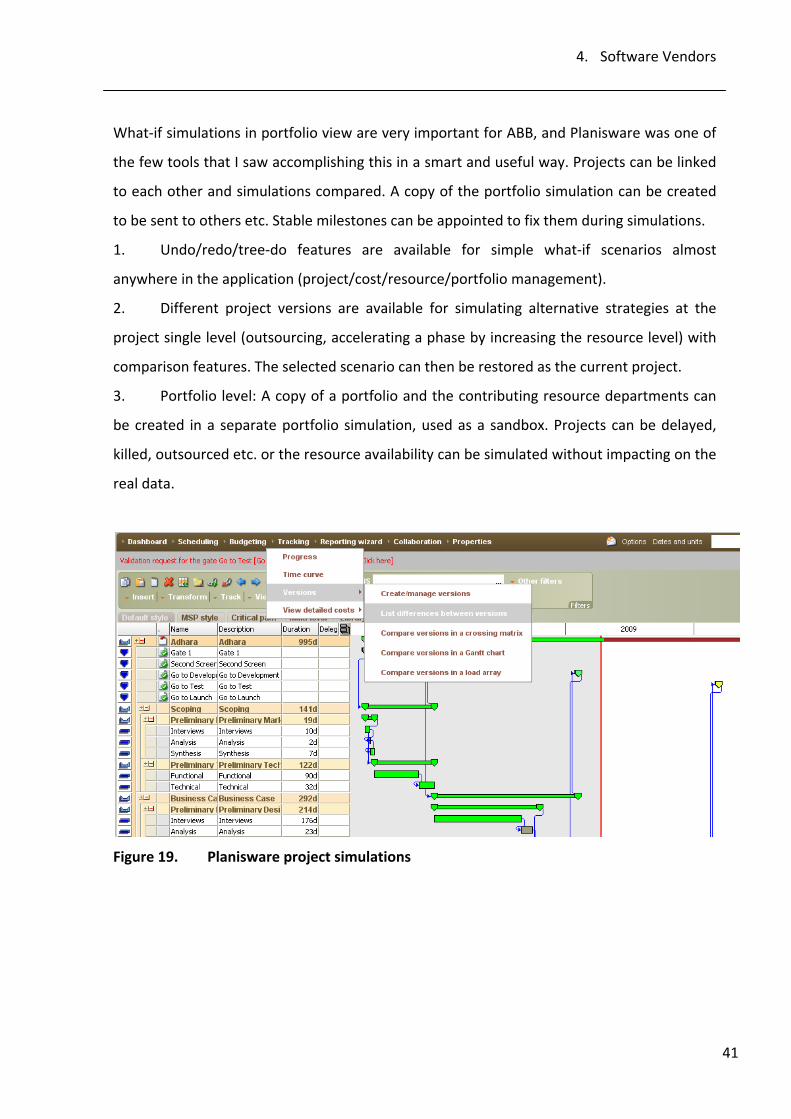
What‐if simulations in portfolio view are very important for ABB, and Planisware was one of
the few tools that I saw accomplishing this in a smart and useful way. Projects can be linked
to each other and simulations compared. A copy of the portfolio simulation can be created
to be sent to others etc. Stable milestones can be appointed to fix them during simulations.
1. Undo/redo/tree‐do features are available for simple what‐if scenarios almost
anywhere in the application (project/cost/resource/portfolio management).
2. Different project versions are available for simulating alternative strategies at the
project single level (outsourcing, accelerating a phase by increasing the resource level) with
comparison features. The selected scenario can then be restored as the current project.
3. Portfolio level: A copy of a portfolio and the contributing resource departments can
be created in a separate portfolio simulation, used as a sandbox. Projects can be delayed,
killed, outsourced etc. or the resource availability can be simulated without impacting on the
real data.
Figure 19. Planisware project simulations
4. Software Vendors
42
Figure 20. Planisware resource constraints
Figure 21. Planisware resource distribution
4. Software Vendors
43
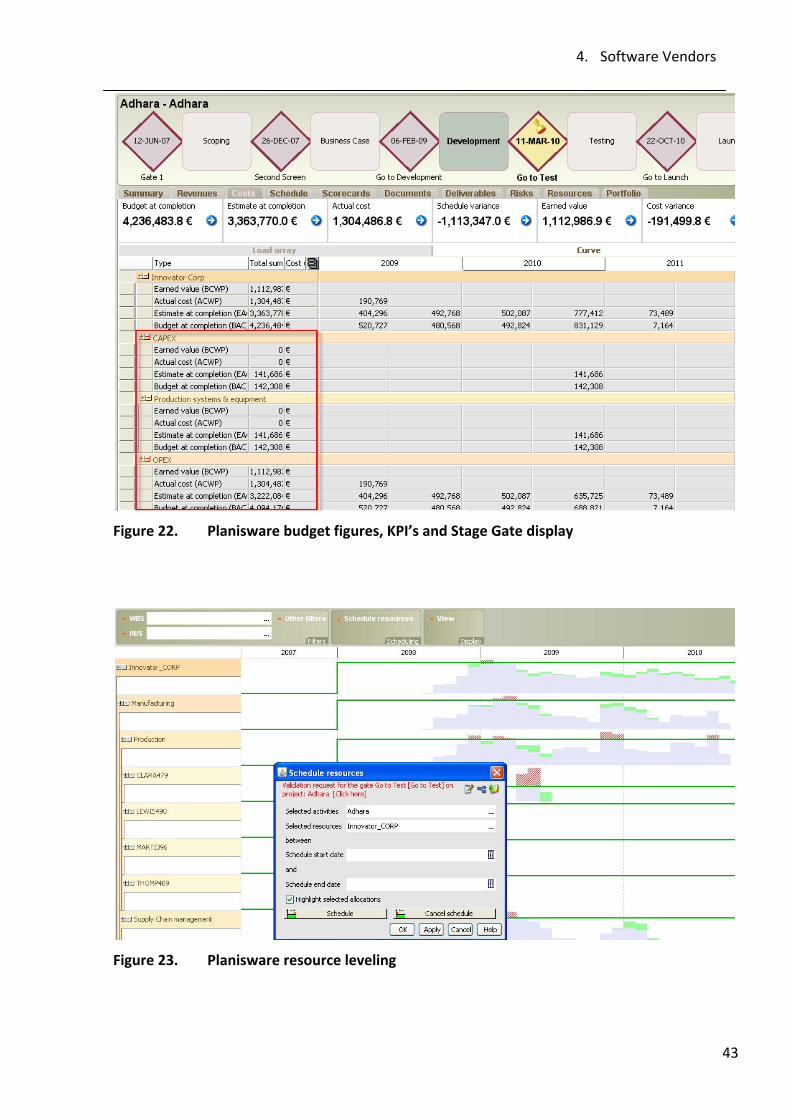
Figure 22. Planisware budget figures, KPI’s and Stage Gate display
Figure 23. Planisware resource leveling
4. Software Vendors
44
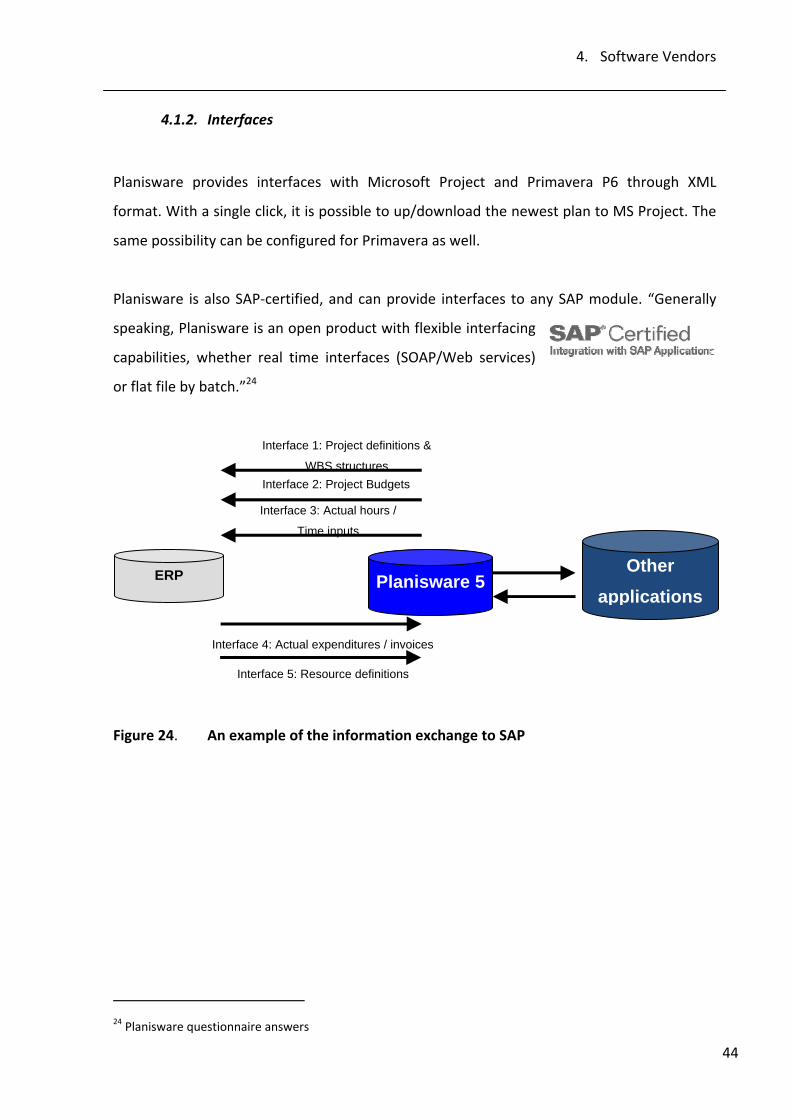
4.1.2. Interfaces
Planisware provides interfaces with Microsoft Project and Primavera P6 through XML
format. With a single click, it is possible to up/download the newest plan to MS Project. The
same possibility can be configured for Primavera as well.
Planisware is also SAP‐certified, and can provide interfaces to any SAP module. “Generally
speaking, Planisware is an open product with flexible interfacing
capabilities, whether real time interfaces (SOAP/Web services)
or flat file by batch.”24
Figure 24. An example of the information exchange to SAP
24 Planisware questionnaire answers
ERP Planisware 5
Interface 2: Project Budgets
Interface 3: Actual hours /
Time inputs
Interface 4: Actual expenditures / invoices
Interface 1: Project definitions &
WBS structures
Interface 5: Resource definitions
Other applications
4. Software Vendors
45
4.1.3. Controlling
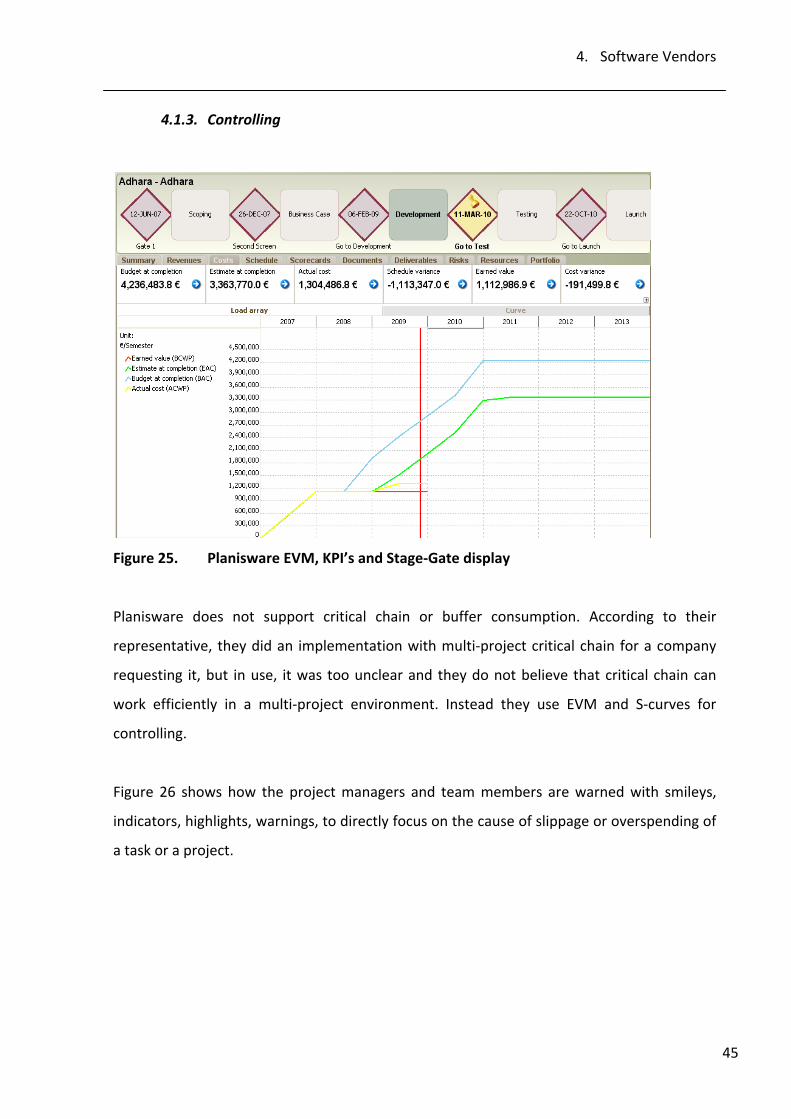
Figure 25. Planisware EVM, KPI’s and Stage‐Gate display
Planisware does not support critical chain or buffer consumption. According to their
representative, they did an implementation with multi‐project critical chain for a company
requesting it, but in use, it was too unclear and they do not believe that critical chain can
work efficiently in a multi‐project environment. Instead they use EVM and S‐curves for
controlling.
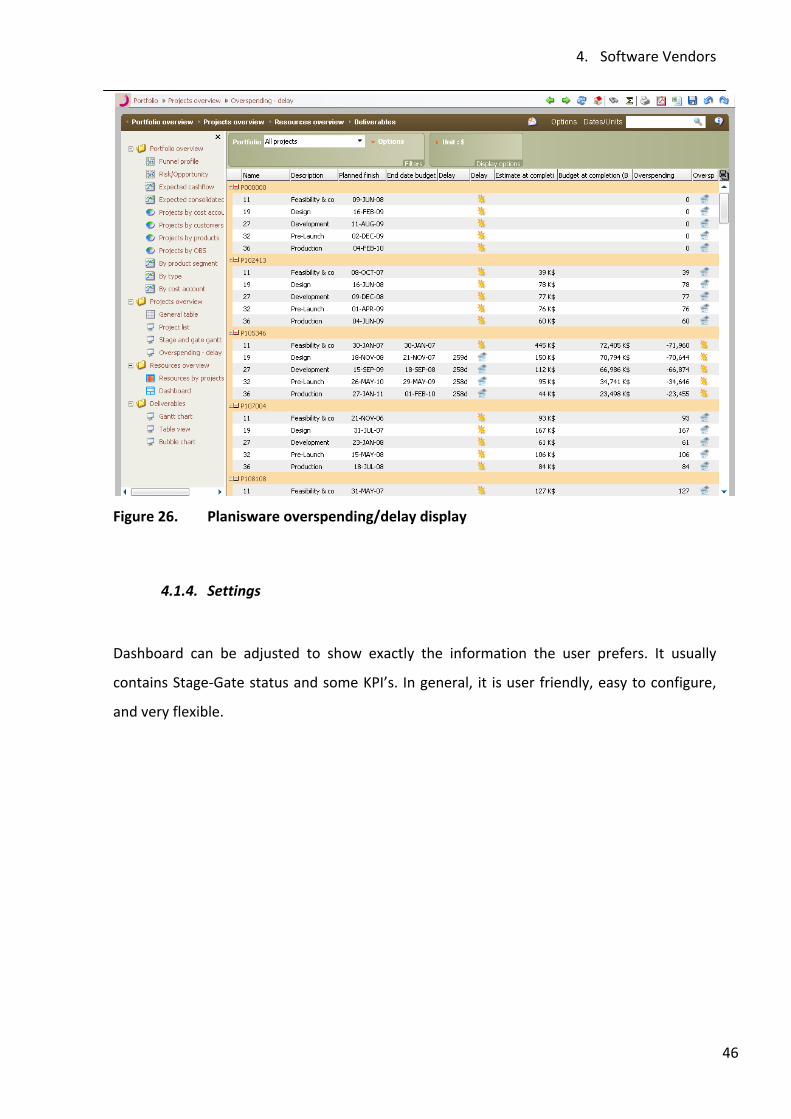
Figure 26 shows how the project managers and team members are warned with smileys,
indicators, highlights, warnings, to directly focus on the cause of slippage or overspending of
a task or a project.
4. Software Vendors
46
Figure 26. Planisware overspending/delay display
4.1.4. Settings
Dashboard can be adjusted to show exactly the information the user prefers. It usually
contains Stage‐Gate status and some KPI’s. In general, it is user friendly, easy to configure,
and very flexible.
4. Software Vendors
47
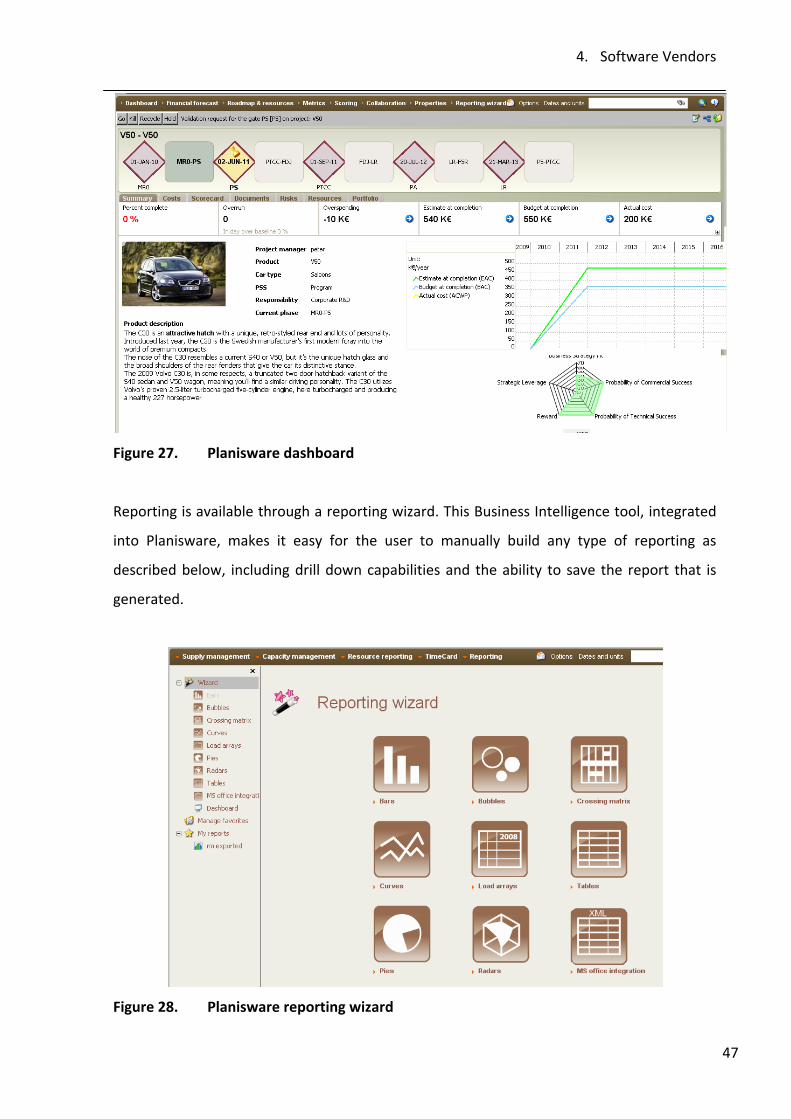
Figure 27. Planisware dashboard
Reporting is available through a reporting wizard. This Business Intelligence tool, integrated
into Planisware, makes it easy for the user to manually build any type of reporting as
described below, including drill down capabilities and the ability to save the report that is
generated.
Figure 28. Planisware reporting wizard
4. Software Vendors
48
4.1.5. Miscellaneous
Information provided by the vendor:
• Language selection: English, French, German, Italian, Dutch, Spanish, Korean,
Japanese. National Language Support is not included.
• General flexibility: The tool is very flexible and configurable. Report layout, colors,
data model, additional fields, formulas, workflows, graphics (Gantt/pie, radar, bar,
matrix charts…) as well as default values/program settings that can be changed
individually.
• Accessibility: The application server need to restart every night in order to let the
batches (time tracking integration if relevant for instance) to be run.
• Scalability: Planisware have customers running the system with more than 1 million
activities. Some customers have more than 10 000 people connecting to the system.
There is no software limitation in the number of clusters to be extended except the
hardware limitation of the server. For big systems (more than 3000 users), JMeter
testing is recommended to validate the specific configuration in terms of
performance.
• Planisware has had over 250 installations totaling 200,000+ users
• Planisware technology is designed to serve a population of users of 100 to
10,000+ users
• User groups: Built‐in. Specific rights can be tuned at the
portfolio/project/activity/risk/document/object level. Standard read‐write/read‐
only/no read access is provided.
4. Software Vendors
49
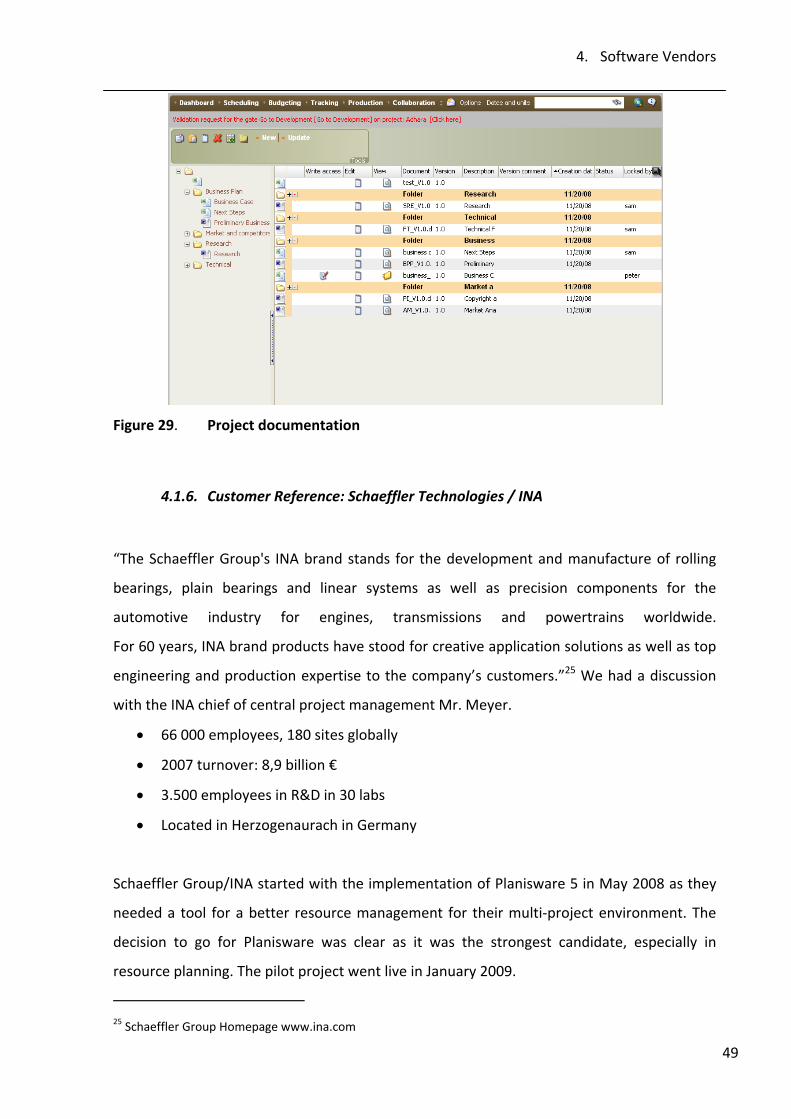
Figure 29. Project documentation
4.1.6. Customer Reference: Schaeffler Technologies / INA
“The Schaeffler Group's INA brand stands for the development and manufacture of rolling
bearings, plain bearings and linear systems as well as precision components for the
automotive industry for engines, transmissions and powertrains worldwide.
For 60 years, INA brand products have stood for creative application solutions as well as top
engineering and production expertise to the company’s customers.”25 We had a discussion
with the INA chief of central project management Mr. Meyer.
• 66 000 employees, 180 sites globally
• 2007 turnover: 8,9 billion €
• 3.500 employees in R&D in 30 labs
• Located in Herzogenaurach in Germany
Schaeffler Group/INA started with the implementation of Planisware 5 in May 2008 as they
needed a tool for a better resource management for their multi‐project environment. The
decision to go for Planisware was clear as it was the strongest candidate, especially in
resource planning. The pilot project went live in January 2009.
25 Schaeffler Group Homepage www.ina.com
4. Software Vendors
50
Before, the implementation project managers were using mainly MS project or Excel sheets,
and, as the Planisware includes the same capabilities, the goal is to have all project planning
done only in Planisware. This means that all new project data had to be gradually inserted
into Planisware, which proved to be quite an organizational challenge. They have an average
project duration of 1,5 years. The change has also caused a lot of problems in the project
management part, as the users needed to adjust to the new working culture. People seemed
to have very different opinions on how they should work in the environment, and this
needed to be clarified and standardized.
As they try to eliminate other project management tools, they have no need for the
import/export function between Planisware and MS Project/Primavera. To SAP, they have
an interface which delivers the budgeted and actual costs. The data is transferred always
once at the end of the month. Most of the planning is done in Planisware, and only the
essential parts somewhere else.
At the moment, ca. 80% of the business units and their department managers in Germany
are using Planisware; the aim being to have it first completely implemented throughout
Germany, and later to other global business units as well. The number of users is currently
1500‐2000, of which 30‐50% are project managers. The financial benefits of the tool cannot
be calculated at this point, as it will take some more time before the tool is working in all
business units and can be efficiently used for planning also in that level.
Implementation was aiming at
• optimizing quality of operational project management processes
• creating an accurate and integrated dataset for portfolio management
• achieving a significant simplification of management processes
• defining reports to optimize portfolio management and resource allocation
• ameliorating the quality of data to control portfolio and capacity
• guaranteeing auditing acceptability
• integrating the solution into SAP
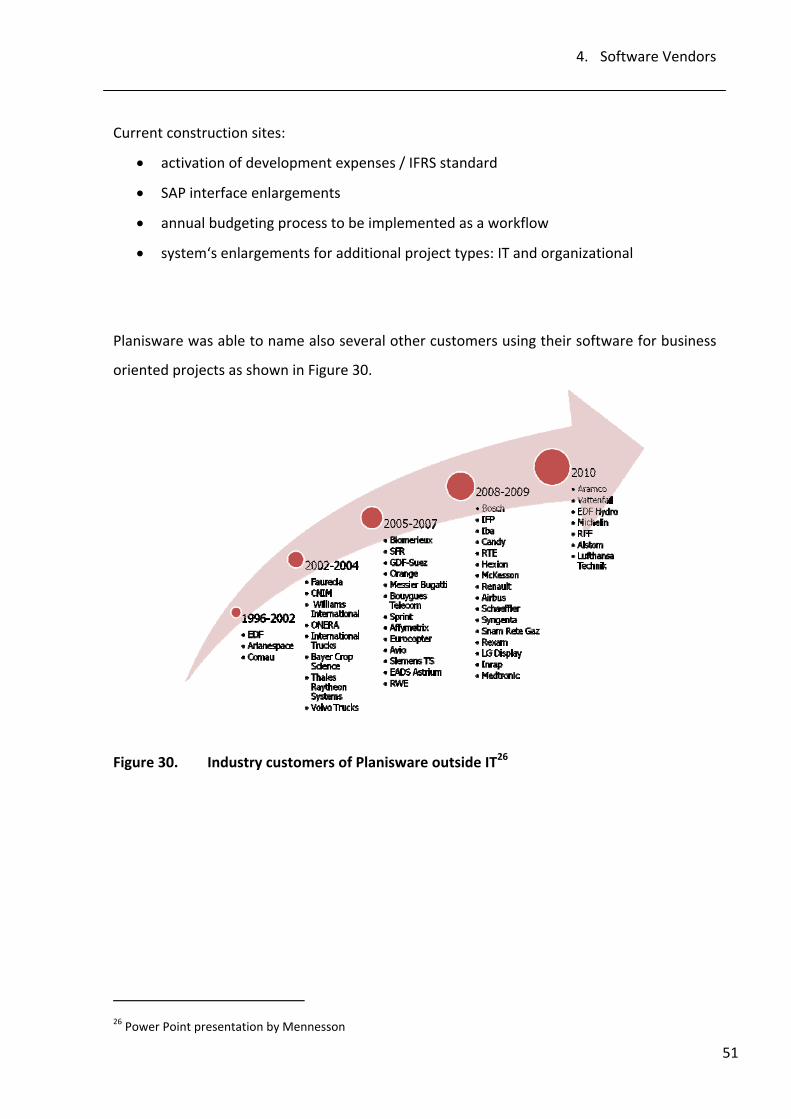
4. Software Vendors
51
Current construction sites:
• activation of development expenses / IFRS standard
• SAP interface enlargements
• annual budgeting process to be implemented as a workflow
• system‘s enlargements for additional project types: IT and organizational
Planisware was able to name also several other customers using their software for business
oriented projects as shown in Figure 30.
Figure 30. Industry customers of Planisware outside IT26
26 Power Point presentation by Mennesson
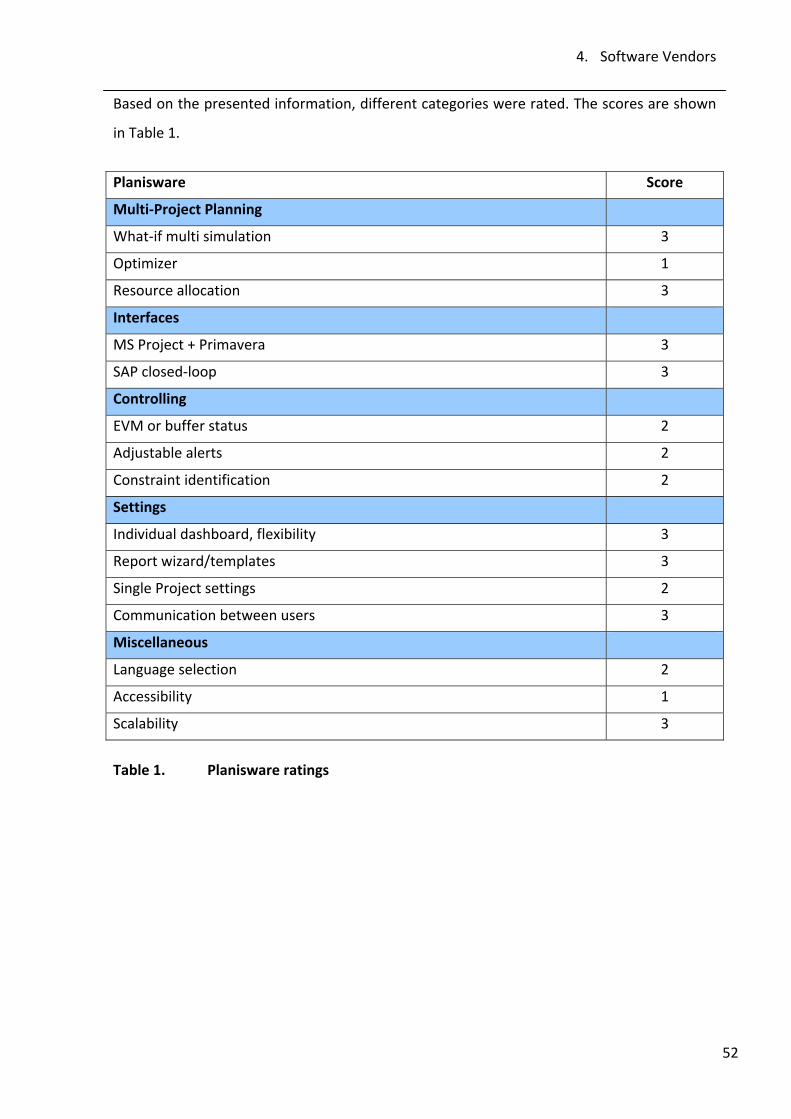
4. Software Vendors
52
Based on the presented information, different categories were rated. The scores are shown
in Table 1.
Planisware Score
Multi‐Project Planning
What‐if multi simulation 3
Optimizer 1
Resource allocation 3
Interfaces
MS Project + Primavera 3
SAP closed‐loop 3
Controlling
EVM or buffer status 2
Adjustable alerts 2
Constraint identification 2
Settings
Individual dashboard, flexibility 3
Report wizard/templates 3
Single Project settings 2
Communication between users 3
Miscellaneous
Language selection 2
Accessibility 1
Scalability 3
Table 1. Planisware ratings
4. Software Vendors
53
4.2. Oracle/Primavera
Oracle is a software giant best known for their
database management systems. It was founded
in 1977 and has, with over 100 000 employees,
its headquarters in Redwood Shores, California. “The company is the world’s leading supplier
of information management software and the world’s second largest independent software
company”27. In October 2008 they acquired the application Primavera Software Inc. which
was the leading provider of project portfolio management solutions for project‐intensive
industries.
Primavera is well known also within ABB and is one of the best project management tools
used, since it is clearly designed for comprehensive and complex projects that are typical for
ABB. In November 2010 they released a new version, Primavera P6 v. 8 Enterprise Project
Portfolio Management (EPPM) that shows a lot of improvements. The changes seem to be
exactly what we were hoping for, but as there are no user experiences or live demos
available, most of the information, partially also the rating, is based on the older versions.
Central characteristics:
• Comprehensive tool from a company with a long experience in project management
• Provides all standard functionalities, but not much more
• Program level views and multiple possibilities in reporting
• Fails in providing a true dynamic interface to SAP
• Robust, always available and highly scalable
27 Oracle Homepage www.oracle.com
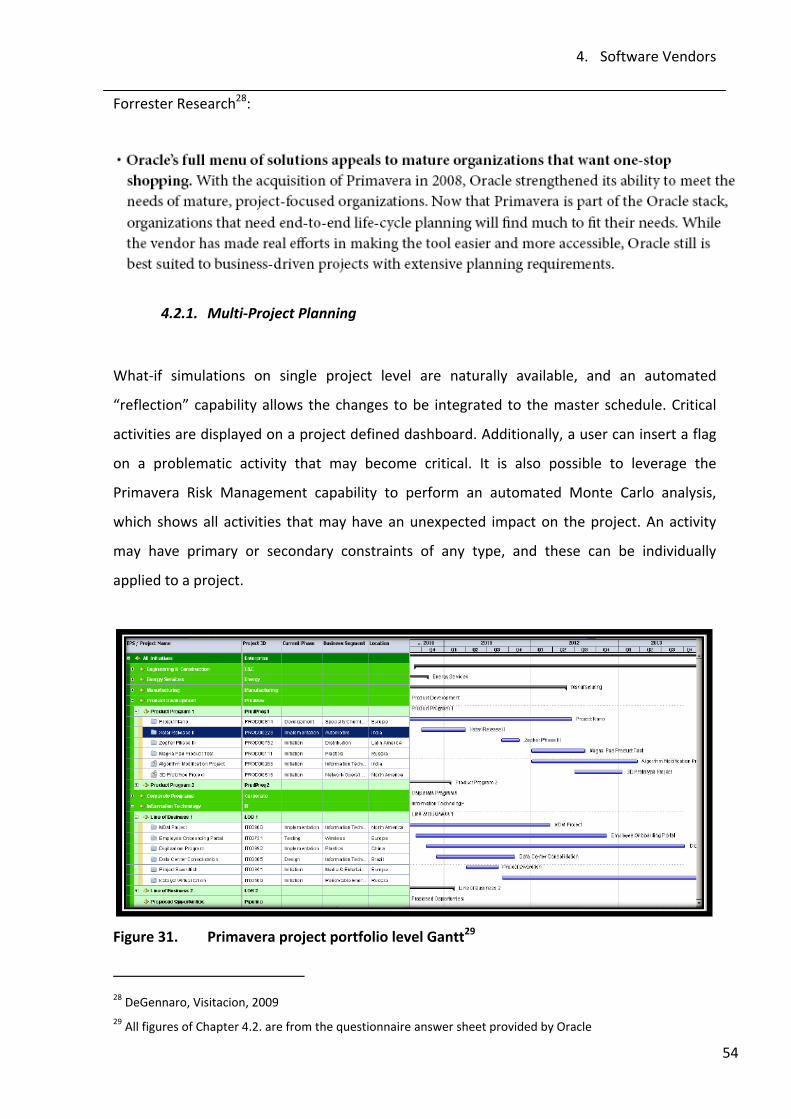
4. Software Vendors
54
Forrester Research28:
4.2.1. Multi‐Project Planning
What‐if simulations on single project level are naturally available, and an automated
“reflection” capability allows the changes to be integrated to the master schedule. Critical
activities are displayed on a project defined dashboard. Additionally, a user can insert a flag
on a problematic activity that may become critical. It is also possible to leverage the
Primavera Risk Management capability to perform an automated Monte Carlo analysis,
which shows all activities that may have an unexpected impact on the project. An activity
may have primary or secondary constraints of any type, and these can be individually
applied to a project.
Figure 31. Primavera project portfolio level Gantt29
28 DeGennaro, Visitacion, 2009 29 All figures of Chapter 4.2. are from the questionnaire answer sheet provided by Oracle
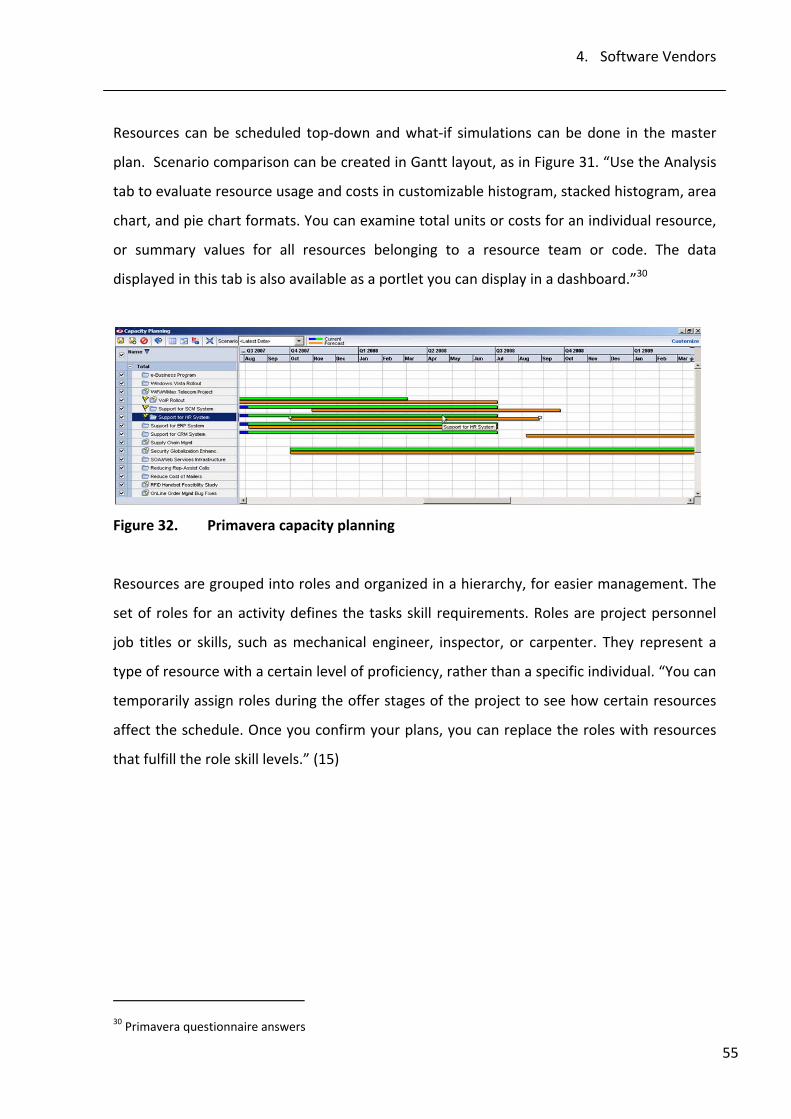
4. Software Vendors
55
Resources can be scheduled top‐down and what‐if simulations can be done in the master
plan. Scenario comparison can be created in Gantt layout, as in Figure 31. “Use the Analysis
tab to evaluate resource usage and costs in customizable histogram, stacked histogram, area
chart, and pie chart formats. You can examine total units or costs for an individual resource,
or summary values for all resources belonging to a resource team or code. The data
displayed in this tab is also available as a portlet you can display in a dashboard.”30
Figure 32. Primavera capacity planning
Resources are grouped into roles and organized in a hierarchy, for easier management. The
set of roles for an activity defines the tasks skill requirements. Roles are project personnel
job titles or skills, such as mechanical engineer, inspector, or carpenter. They represent a
type of resource with a certain level of proficiency, rather than a specific individual. “You can
temporarily assign roles during the offer stages of the project to see how certain resources
affect the schedule. Once you confirm your plans, you can replace the roles with resources
that fulfill the role skill levels.” (15)
30 Primavera questionnaire answers
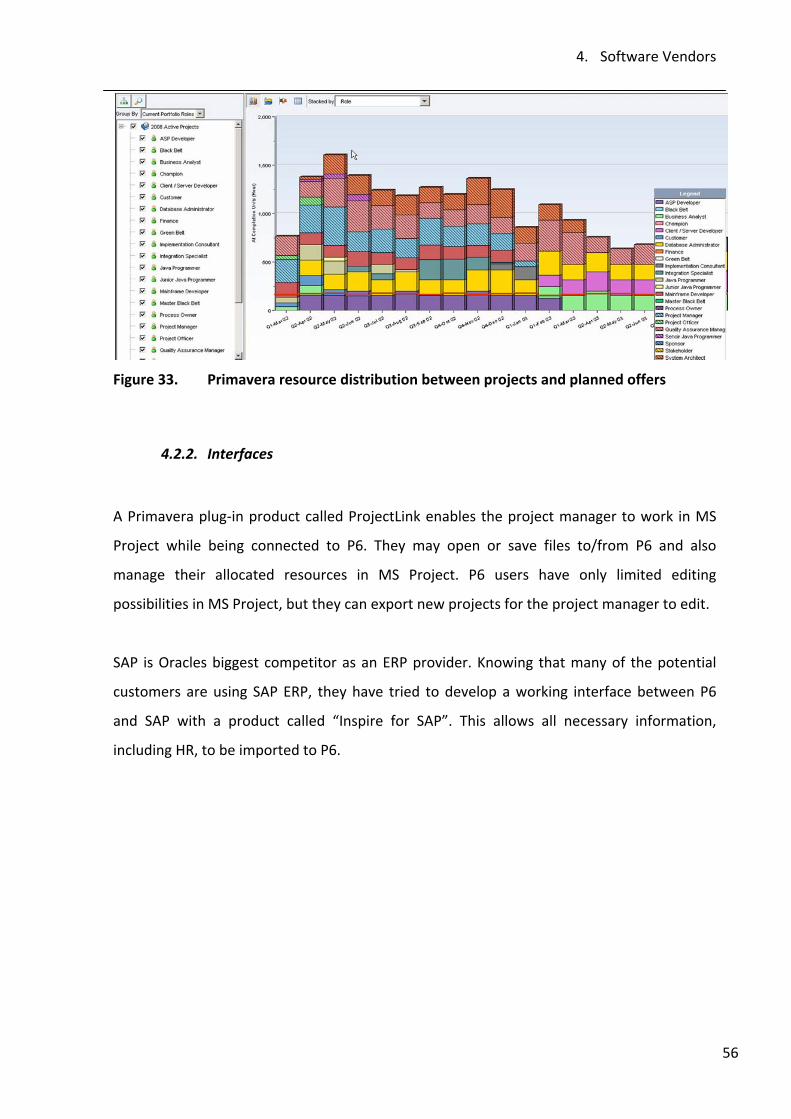
4. Software Vendors
56
Figure 33. Primavera resource distribution between projects and planned offers
4.2.2. Interfaces
A Primavera plug‐in product called ProjectLink enables the project manager to work in MS
Project while being connected to P6. They may open or save files to/from P6 and also
manage their allocated resources in MS Project. P6 users have only limited editing
possibilities in MS Project, but they can export new projects for the project manager to edit.
SAP is Oracles biggest competitor as an ERP provider. Knowing that many of the potential
customers are using SAP ERP, they have tried to develop a working interface between P6
and SAP with a product called “Inspire for SAP”. This allows all necessary information,
including HR, to be imported to P6.

4. Software Vendors
57
Figure 34. Primavera/SAP information flow
4.2.3. Controlling
EVM curves and metrics are displayed on the dashboard (provided out of the box). The
metrics can also be rolled up to the project level and drilled down on to discover the root
cause. Schedule overrun is illustrated with traffic light warning signals (Figure 35: green,
amber, red).
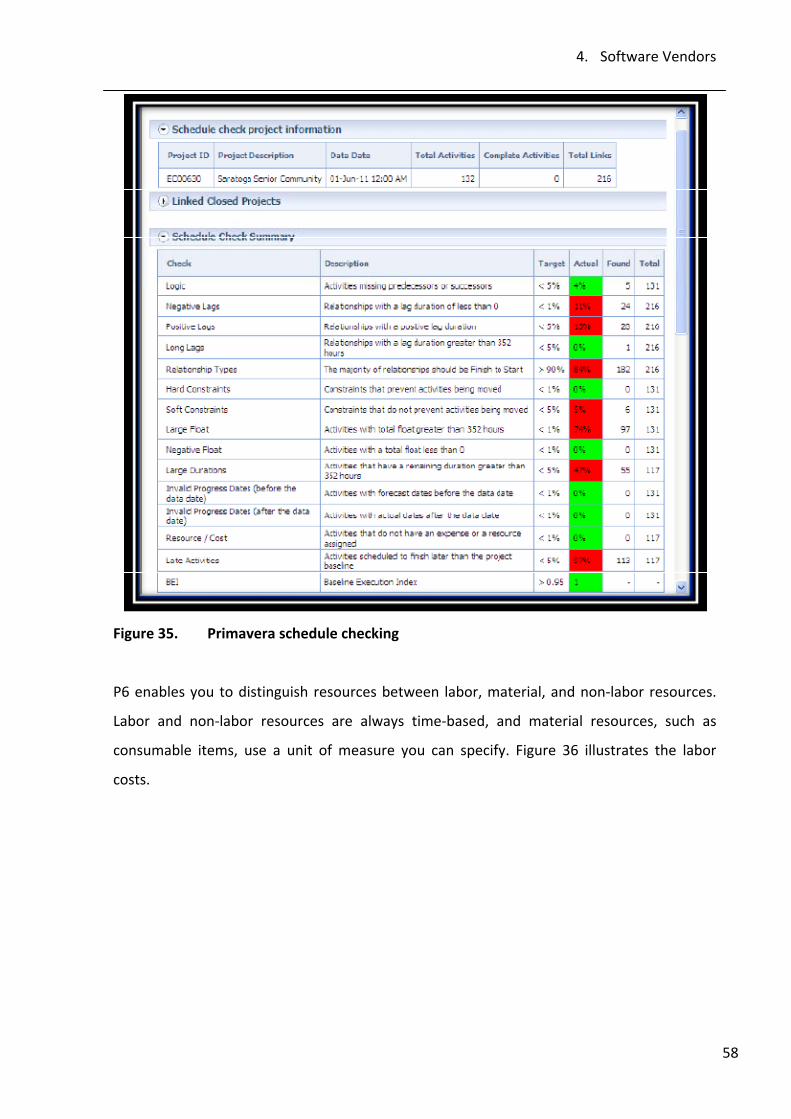
4. Software Vendors
58
Figure 35. Primavera schedule checking
P6 enables you to distinguish resources between labor, material, and non‐labor resources.
Labor and non‐labor resources are always time‐based, and material resources, such as
consumable items, use a unit of measure you can specify. Figure 36 illustrates the labor
costs.
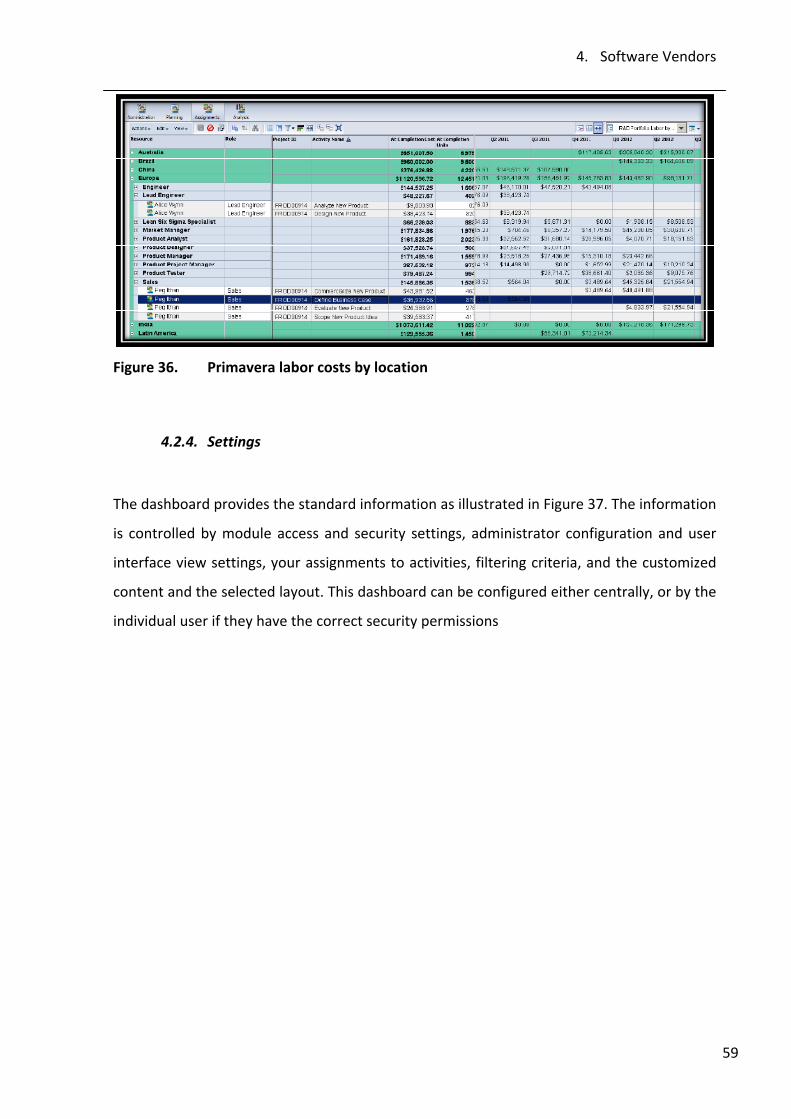
4. Software Vendors
59
Figure 36. Primavera labor costs by location
4.2.4. Settings
The dashboard provides the standard information as illustrated in Figure 37. The information
is controlled by module access and security settings, administrator configuration and user
interface view settings, your assignments to activities, filtering criteria, and the customized
content and the selected layout. This dashboard can be configured either centrally, or by the
individual user if they have the correct security permissions
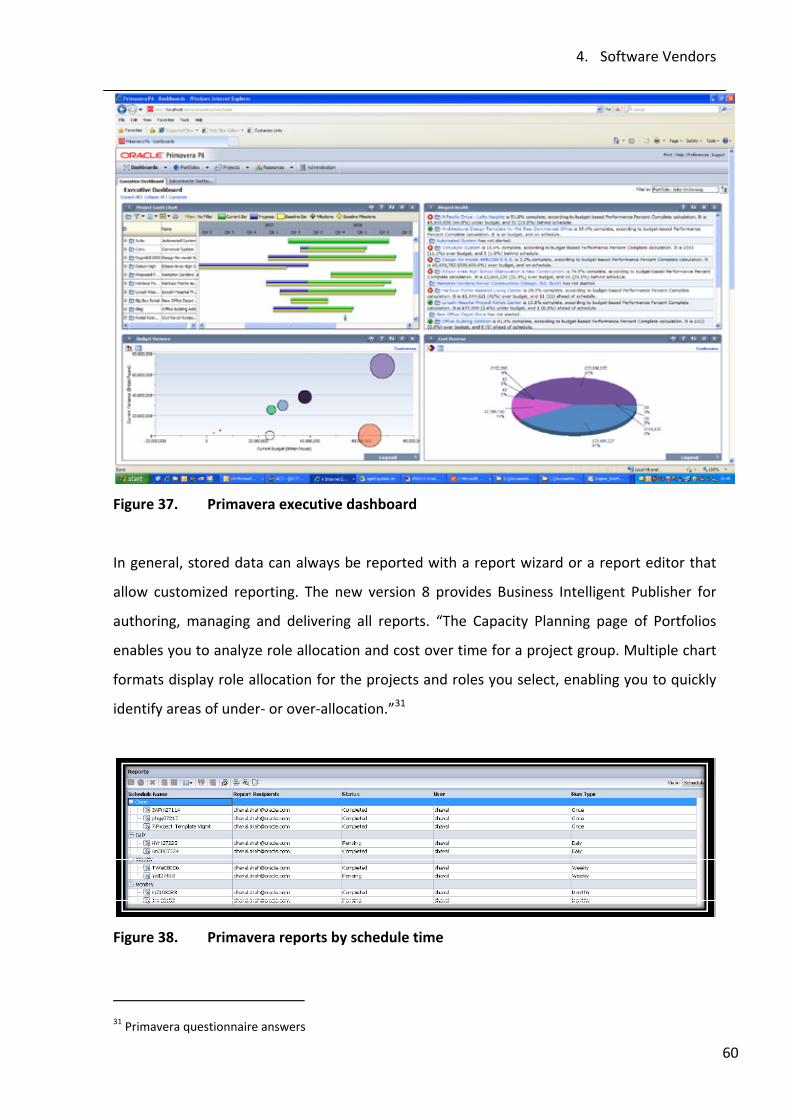
4. Software Vendors
60
Figure 37. Primavera executive dashboard
In general, stored data can always be reported with a report wizard or a report editor that
allow customized reporting. The new version 8 provides Business Intelligent Publisher for
authoring, managing and delivering all reports. “The Capacity Planning page of Portfolios
enables you to analyze role allocation and cost over time for a project group. Multiple chart
formats display role allocation for the projects and roles you select, enabling you to quickly
identify areas of under‐ or over‐allocation.”31
Figure 38. Primavera reports by schedule time
31 Primavera questionnaire answers
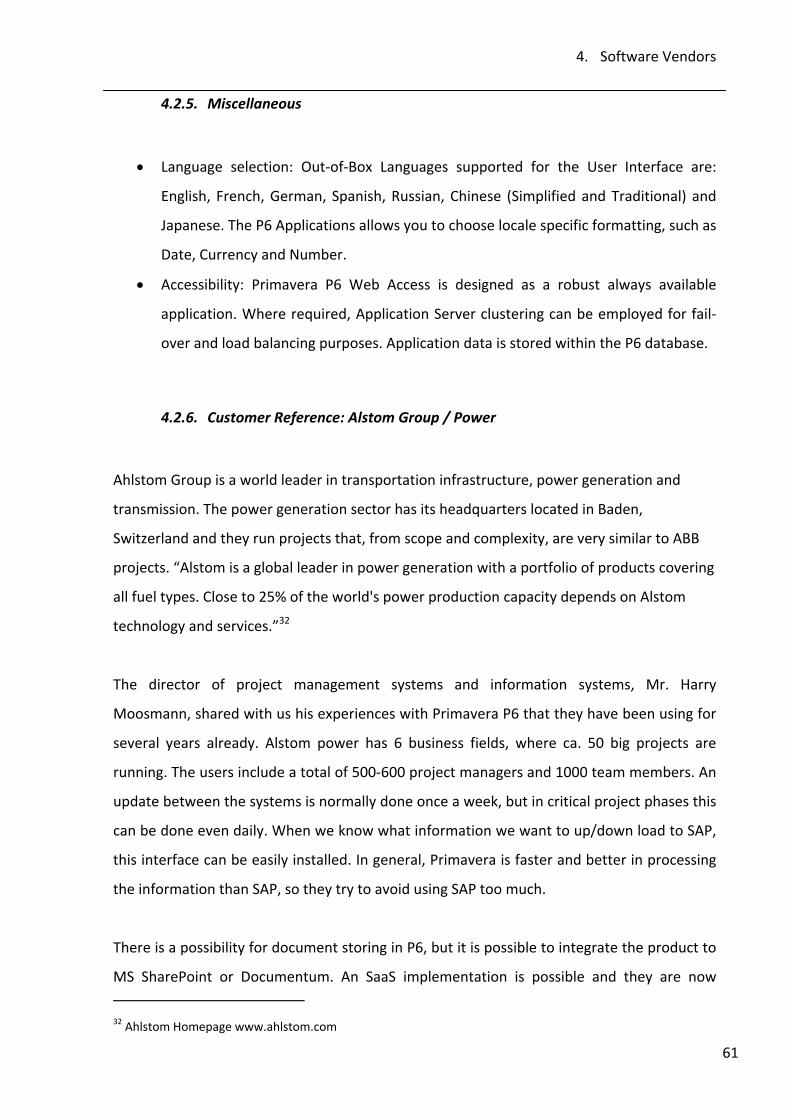
4. Software Vendors
61
4.2.5. Miscellaneous
• Language selection: Out‐of‐Box Languages supported for the User Interface are:
English, French, German, Spanish, Russian, Chinese (Simplified and Traditional) and
Japanese. The P6 Applications allows you to choose locale specific formatting, such as
Date, Currency and Number.
• Accessibility: Primavera P6 Web Access is designed as a robust always available
application. Where required, Application Server clustering can be employed for fail‐
over and load balancing purposes. Application data is stored within the P6 database.
4.2.6. Customer Reference: Alstom Group / Power
Ahlstom Group is a world leader in transportation infrastructure, power generation and
transmission. The power generation sector has its headquarters located in Baden,
Switzerland and they run projects that, from scope and complexity, are very similar to ABB
projects. “Alstom is a global leader in power generation with a portfolio of products covering
all fuel types. Close to 25% of the world's power production capacity depends on Alstom
technology and services.”32
The director of project management systems and information systems, Mr. Harry
Moosmann, shared with us his experiences with Primavera P6 that they have been using for
several years already. Alstom power has 6 business fields, where ca. 50 big projects are
running. The users include a total of 500‐600 project managers and 1000 team members. An
update between the systems is normally done once a week, but in critical project phases this
can be done even daily. When we know what information we want to up/down load to SAP,
this interface can be easily installed. In general, Primavera is faster and better in processing
the information than SAP, so they try to avoid using SAP too much.
There is a possibility for document storing in P6, but it is possible to integrate the product to
MS SharePoint or Documentum. An SaaS implementation is possible and they are now 32 Ahlstom Homepage www.ahlstom.com
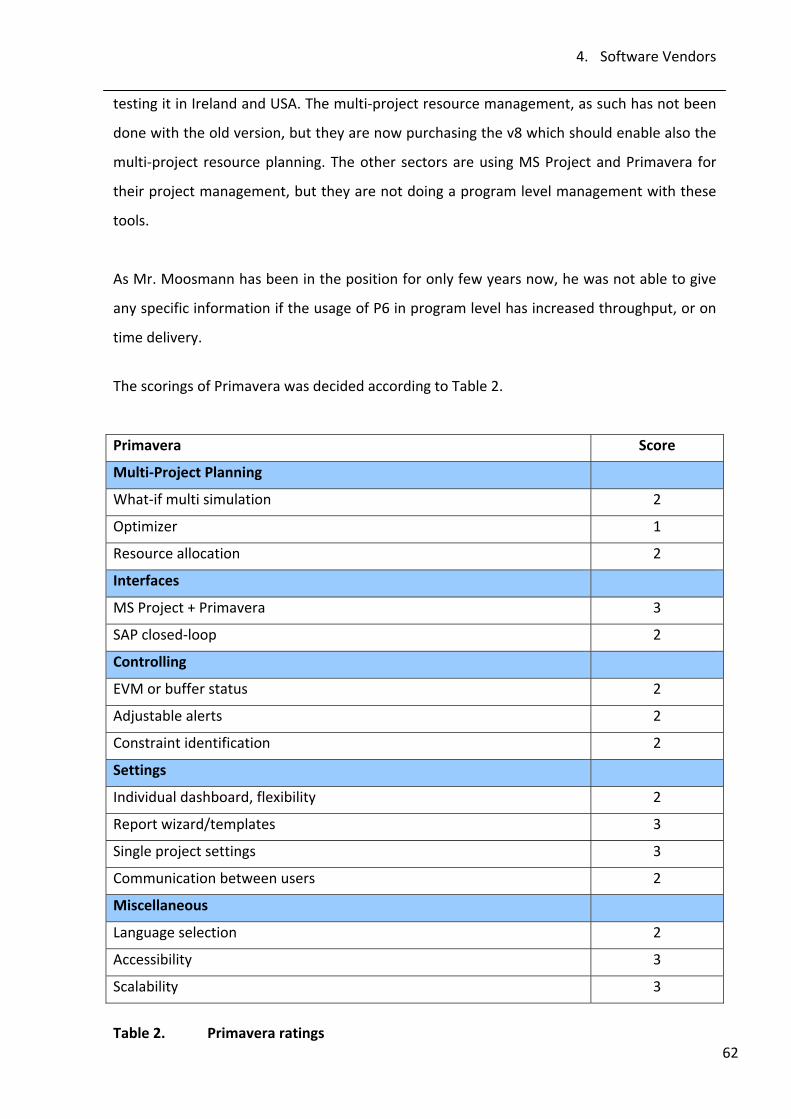
4. Software Vendors
62
testing it in Ireland and USA. The multi‐project resource management, as such has not been
done with the old version, but they are now purchasing the v8 which should enable also the
multi‐project resource planning. The other sectors are using MS Project and Primavera for
their project management, but they are not doing a program level management with these
tools.
As Mr. Moosmann has been in the position for only few years now, he was not able to give
any specific information if the usage of P6 in program level has increased throughput, or on
time delivery.
The scorings of Primavera was decided according to Table 2.
Primavera Score
Multi‐Project Planning
What‐if multi simulation 2
Optimizer 1
Resource allocation 2
Interfaces
MS Project + Primavera 3
SAP closed‐loop 2
Controlling
EVM or buffer status 2
Adjustable alerts 2
Constraint identification 2
Settings
Individual dashboard, flexibility 2
Report wizard/templates 3
Single project settings 3
Communication between users 2
Miscellaneous
Language selection 2
Accessibility 3
Scalability 3
Table 2. Primavera ratings
4. Software Vendors
63
4.3. JDA Software
Jda is a supply chain software company that you do
not find in any of the PPM comparisons. It was
founded in Alberta, Canada in 1978. They later
acquired brands like Manugistics (2006) and i2
Technologies (2010), making it a leading supply chain
company33.
Jda solution Enterprise Project Planner (EPP) differs greatly from the other more traditional
project management tools. The former i2 created a multi‐project planning and scheduling
tool especially for ETO companies. It suggests a plan automatically, using a patented
optimizer that works based on soft and hard constraints and CCPM. The manual work of
planning and decision making is then done by master planners, who need to be additionally
trained for this new job title. The tool relies on buffer elimination, so it exploits the critical
chain method principles. It also depends heavily on SAP, and the information exchange
between the two is an important part of the tool.
Central characteristics:
• Optimizer with soft and hard violations, hard violations are never violated
• Buffer status calculation, based on multi‐project critical chain. Shows also EVM.
• Master planners have the control and the decision making power
• Closed‐loop integration with SAP
• The plan is always feasible
• Homogeneous resource pools where individuals cannot be selected
33 JDA Homepage www.jda.com
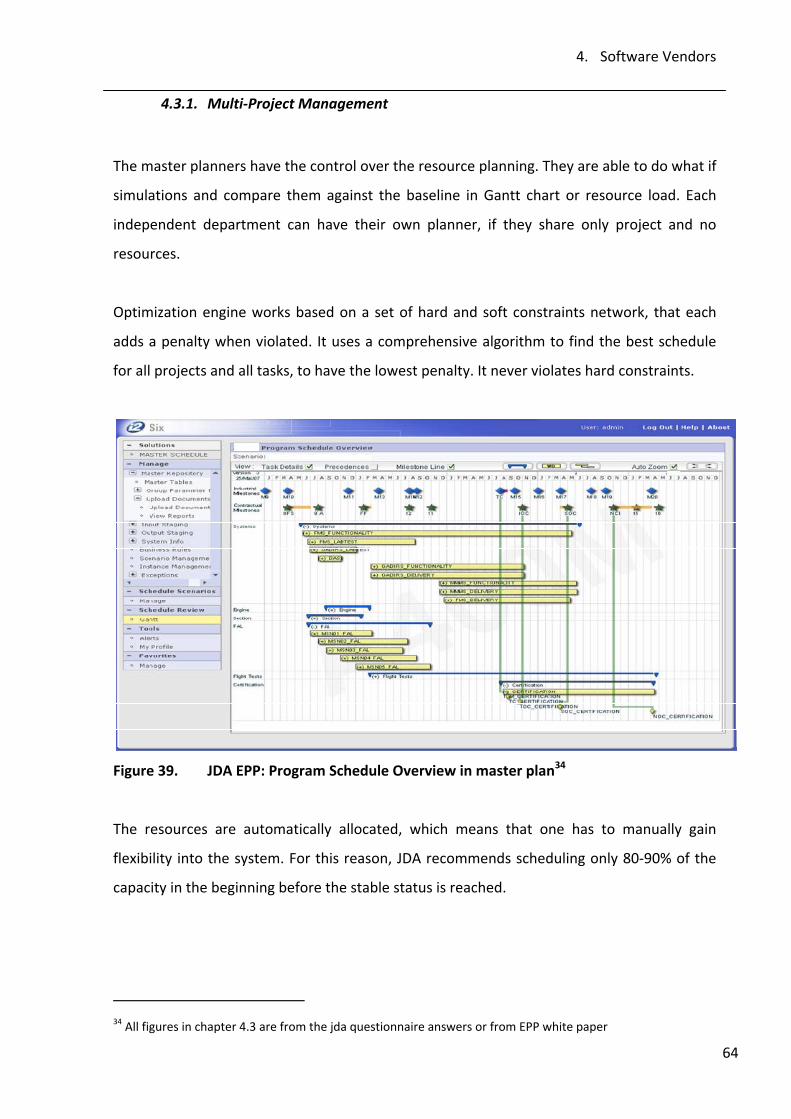
4. Software Vendors
64
4.3.1. Multi‐Project Management
The master planners have the control over the resource planning. They are able to do what if
simulations and compare them against the baseline in Gantt chart or resource load. Each
independent department can have their own planner, if they share only project and no
resources.
Optimization engine works based on a set of hard and soft constraints network, that each
adds a penalty when violated. It uses a comprehensive algorithm to find the best schedule
for all projects and all tasks, to have the lowest penalty. It never violates hard constraints.
Figure 39. JDA EPP: Program Schedule Overview in master plan34
The resources are automatically allocated, which means that one has to manually gain
flexibility into the system. For this reason, JDA recommends scheduling only 80‐90% of the
capacity in the beginning before the stable status is reached.
34 All figures in chapter 4.3 are from the jda questionnaire answers or from EPP white paper
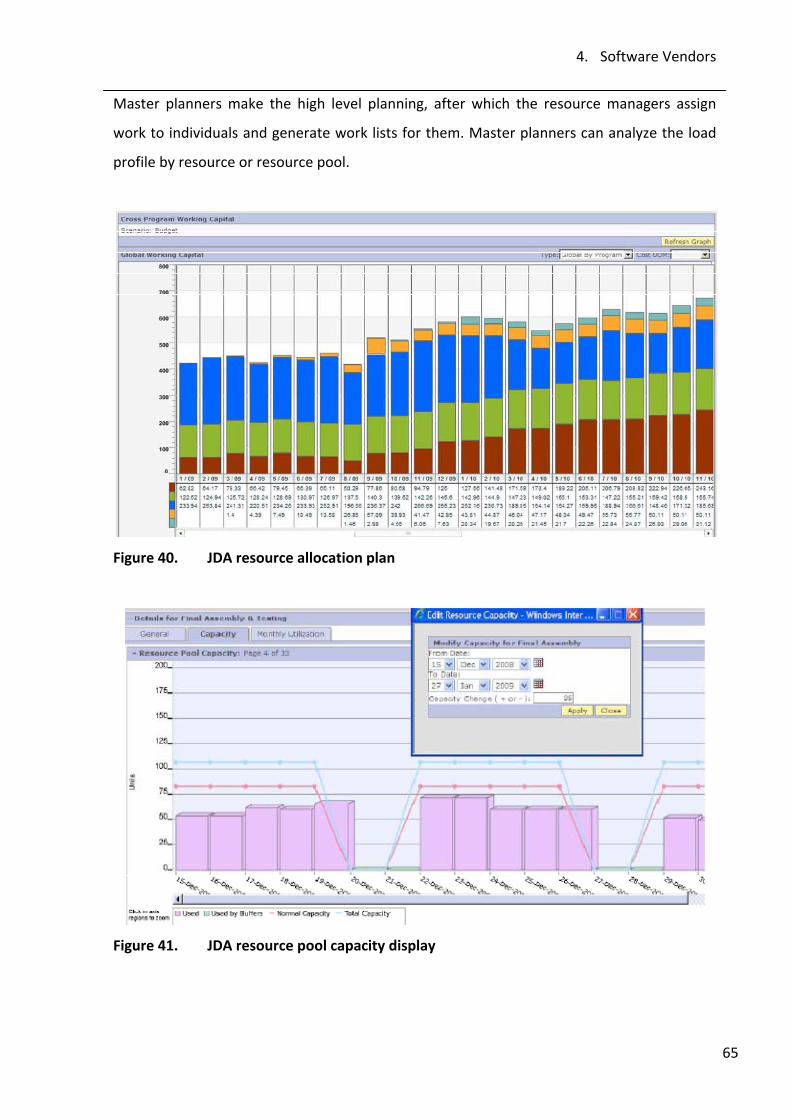
4. Software Vendors
65
Master planners make the high level planning, after which the resource managers assign
work to individuals and generate work lists for them. Master planners can analyze the load
profile by resource or resource pool.
Figure 40. JDA resource allocation plan
Figure 41. JDA resource pool capacity display
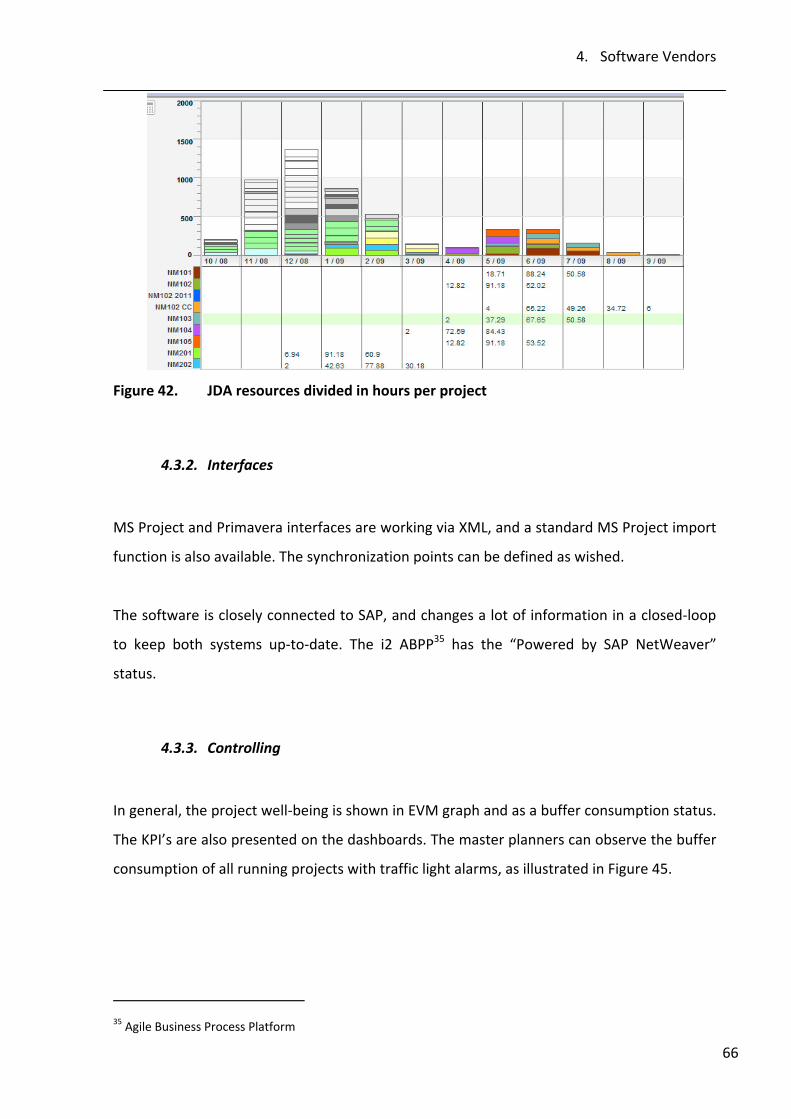
4. Software Vendors
66
Figure 42. JDA resources divided in hours per project
4.3.2. Interfaces
MS Project and Primavera interfaces are working via XML, and a standard MS Project import
function is also available. The synchronization points can be defined as wished.
The software is closely connected to SAP, and changes a lot of information in a closed‐loop
to keep both systems up‐to‐date. The i2 ABPP35 has the “Powered by SAP NetWeaver”
status.
4.3.3. Controlling
In general, the project well‐being is shown in EVM graph and as a buffer consumption status.
The KPI’s are also presented on the dashboards. The master planners can observe the buffer
consumption of all running projects with traffic light alarms, as illustrated in Figure 45.
35 Agile Business Process Platform
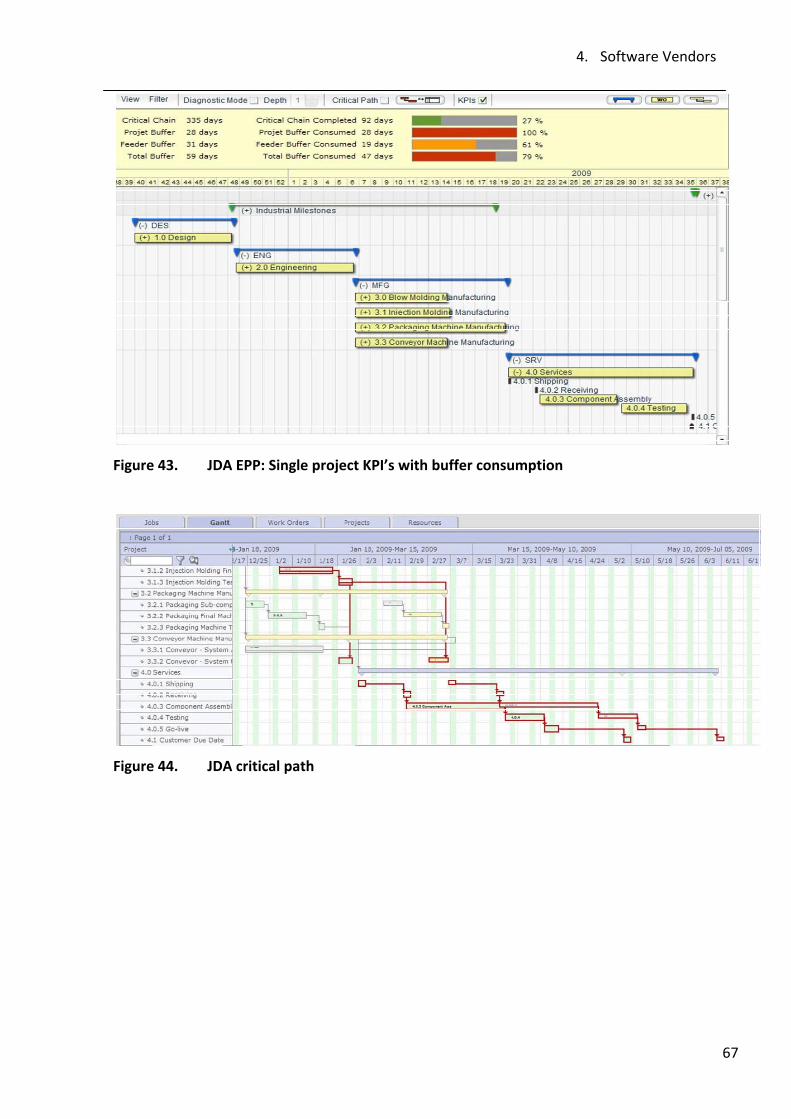
4. Software Vendors
67
Figure 43. JDA EPP: Single project KPI’s with buffer consumption
Figure 44. JDA critical path
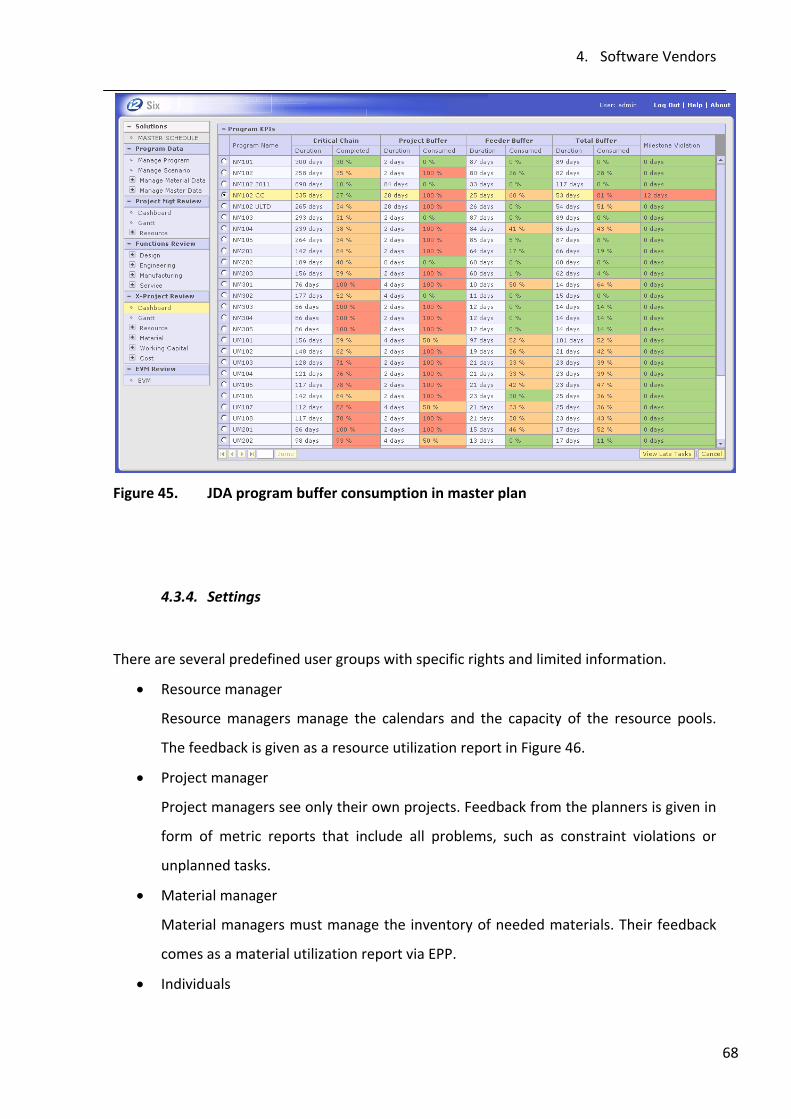
4. Software Vendors
68
Figure 45. JDA program buffer consumption in master plan
4.3.4. Settings
There are several predefined user groups with specific rights and limited information.
• Resource manager
Resource managers manage the calendars and the capacity of the resource pools.
The feedback is given as a resource utilization report in Figure 46.
• Project manager
Project managers see only their own projects. Feedback from the planners is given in
form of metric reports that include all problems, such as constraint violations or
unplanned tasks.
• Material manager
Material managers must manage the inventory of needed materials. Their feedback
comes as a material utilization report via EPP.
• Individuals
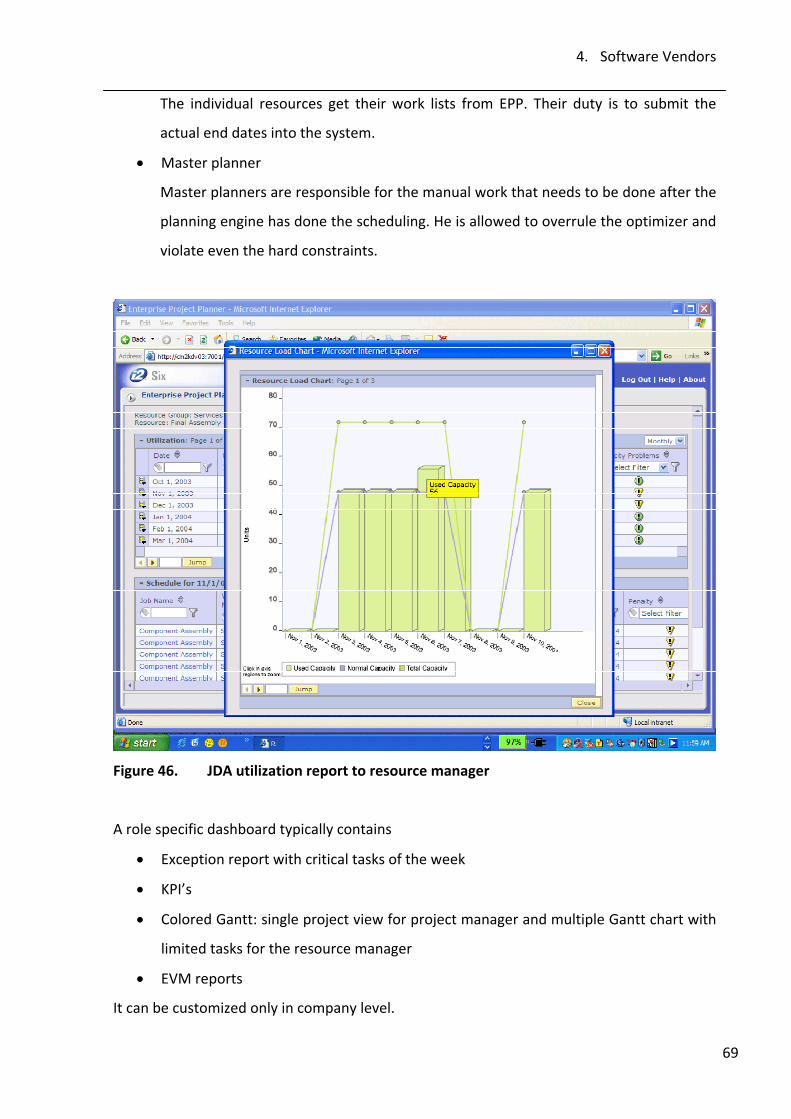
4. Software Vendors
69
The individual resources get their work lists from EPP. Their duty is to submit the
actual end dates into the system.
• Master planner
Master planners are responsible for the manual work that needs to be done after the
planning engine has done the scheduling. He is allowed to overrule the optimizer and
violate even the hard constraints.
Figure 46. JDA utilization report to resource manager
A role specific dashboard typically contains
• Exception report with critical tasks of the week
• KPI’s
• Colored Gantt: single project view for project manager and multiple Gantt chart with
limited tasks for the resource manager
• EVM reports
It can be customized only in company level.
4. Software Vendors
70
E‐mail notifications can be installed to inform the project and resource managers about the
changes done by the master planners. Reporting is done via standard exports to Excel.
4.3.5. Miscellaneous
• The tool is available in English and in German
• Scalability: see the reference in chapter 4.3.6.
4.3.6. Customer Reference: Krones
The Krones Group, headquartered in Neutraubling, Germany, plans, develops, and
manufactures machines and complete lines, for the fields of process technology, bottling,
canning and packaging and intralogistics. It was founded in 1951 and has five production
plants in Germany. Worldwide, they have 10 300 employees worldwide, ca. 8000 of them in
Germany and the consolidated sales were in 2009 1 865 million €36.
The company produces all the machinery needed in the bottling process, e.g. labeling and
filling machines, PET‐bottle shaping, for customers such as Coca Cola. The machines are
designed and manufactured within the production plants and then installed at the customer
site. Delivery time is 3‐5 months plus installation 3‐6 months. All customer orders, regardless
of size, are recorded as projects and around 4000 such projects are running in the system.
Approximately 10 big and 13 small new projects are started daily. They are currently in the
process of adding the internal projects into the planning tool.
Krones implemented the JDA solution (at the time i2) factory planner and enterprise project
planner (EPP) back in 2004. They use it more or less as an add‐on to the SAP system, so that
both systems are always up‐to‐date and share a lot of information. Each work order in SAP
has its own network plan and the configuration is done in SAP. Bids are not fed into the
36 Kaltenbrunner, 2009
4. Software Vendors
71
system until the order is accepted, because they want to maintain the flexibility concerning
due dates and capacity.
The employees are divided into homogenous resource pools, e.g. 6‐8 persons, who have the
exact same qualification and are therefore interchangeable. This way the project manager
cannot decide which individual he gets to work in his project. Only 85‐95% of the resources
are entered to the system to maintain flexibility in case of sickness, administrative work etc.
EPP allows utilization up to 300% (red, hard constraint), whereas exceeding 100% is marked
yellow (soft constraint). The focus is on the horizon of 1‐2 months, as in an emergency they
can employ new people within this timeframe.
4 user roles that are in use: project and resource managers, master planners and individuals.
• They currently require 15 master planners: 1 for each machine group
• Ca. 400 resource managers
• Ca. 200 project managers
• 2000‐3000 staff licenses: The individual sees a 3 week “frozen work horizon” and the
EPP doesn’t make any changes to this period. The employees insert the job start and
finish date or the estimated end date in case of delays. Due dates must be met, but
otherwise they are allowed to work quite independently (Management by
exceptions)
Master planning is done for four German factories, centrally from the headquarters. All 120
000 job plans are rescheduled every night and the updates appear to the users on the next
morning. No what‐if simulations are used, because each of the 15 planners has his own
machine group; with only one planning engine, this would be possible. Priorities are given
only based on the milestones, with no active prioritization. The business area mangers and
master planners meet once a week. The planners have the duty to point out the bottlenecks,
and the department must solve these problems independently. The users receive a training
of only one hour for using the tool, whereas the master planners who work daily with the
tool, need several months to learn it completely.
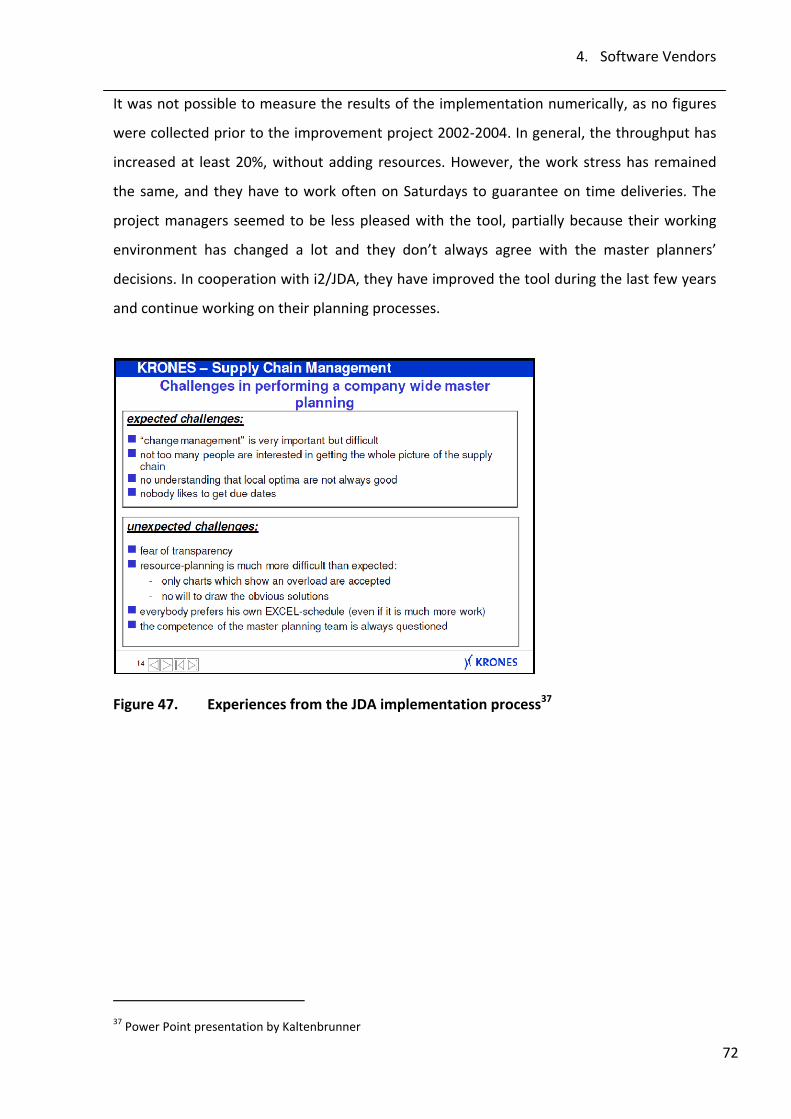
4. Software Vendors
72
It was not possible to measure the results of the implementation numerically, as no figures
were collected prior to the improvement project 2002‐2004. In general, the throughput has
increased at least 20%, without adding resources. However, the work stress has remained
the same, and they have to work often on Saturdays to guarantee on time deliveries. The
project managers seemed to be less pleased with the tool, partially because their working
environment has changed a lot and they don’t always agree with the master planners’
decisions. In cooperation with i2/JDA, they have improved the tool during the last few years
and continue working on their planning processes.
Figure 47. Experiences from the JDA implementation process37
37 Power Point presentation by Kaltenbrunner
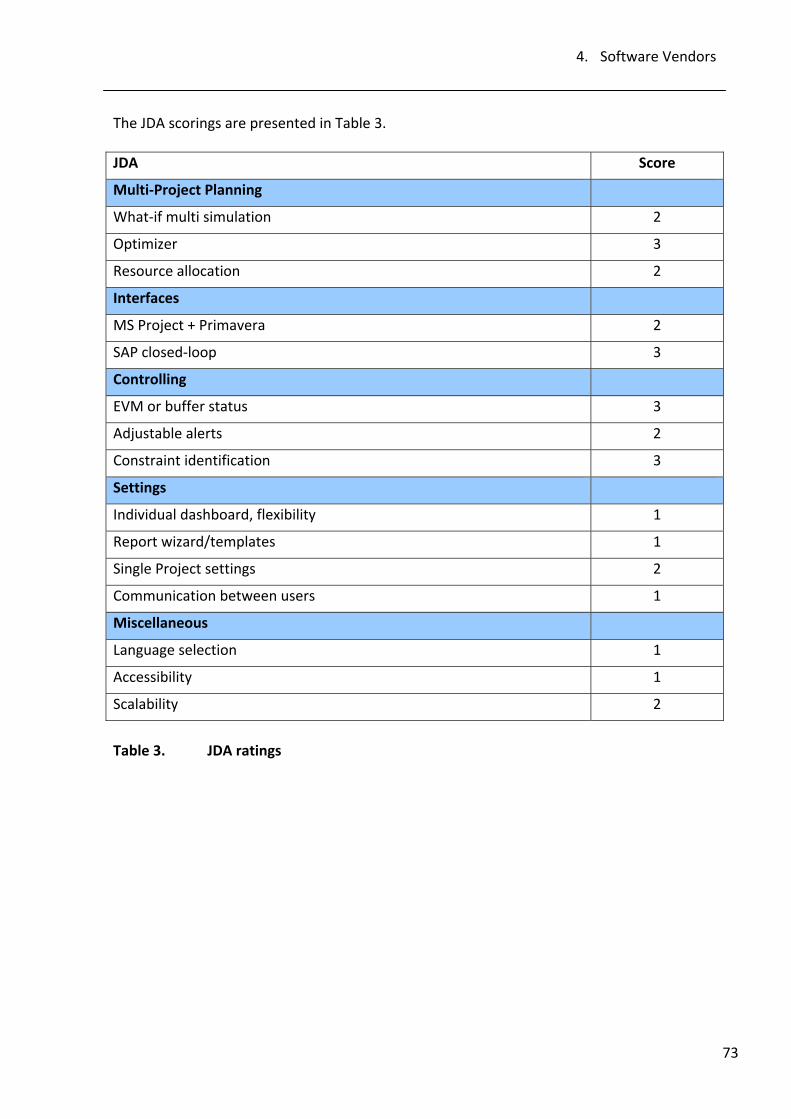
4. Software Vendors
73
The JDA scorings are presented in Table 3. JDA Score
Multi‐Project Planning
What‐if multi simulation 2
Optimizer 3
Resource allocation 2
Interfaces
MS Project + Primavera 2
SAP closed‐loop 3
Controlling
EVM or buffer status 3
Adjustable alerts 2
Constraint identification 3
Settings
Individual dashboard, flexibility 1
Report wizard/templates 1
Single Project settings 2
Communication between users 1
Miscellaneous
Language selection 1
Accessibility 1
Scalability 2
Table 3. JDA ratings
4. Software Vendors
74
4.4. HP
Hewlett‐Packard is the world’s largest IT company with a
revenue of 126 billion USD (2010). It was founded in 1939
and has now approximately 304 000 employees worldwide
and the headquarter is in Palo Alto, California38. They offer a
wide selection of products and services in almost all areas of technology. ABB has been
cooperating with the company for years, and recently HP was chosen to also do the project
management in ABB’s IT branch. Their product Project and Portfolio Management (PPM)
appears to be designed only for IT oriented projects, with a strong emphasis in portfolio
management. According to their representatives, IT projects don’t differ that much from
customer engineering projects, and there I disagree. Probably due to the lack of experience
with such customers, the tool has not been further developed for multi‐project execution
and, despite of the good first impression, it does not compare to the other presented
products.
Central characteristics:
• Uses Critical Path Method but allows also buffer management
• The tool provides most standard functionalities, but cannot do program level
simulations or plan optimization
• Interface to Primavera must be through MS Project
• Uses resource pools, resource demand in project staffing profiles
• Comparison of the simulated portfolio key figures, but no linking of different projects
possible
• No SAP certification
• Many of our wishes require additional configuration
Quote from Forrester Research39:
38 HP Homepage www.hp.com 39 DeGennaro, Visitacion, 2009
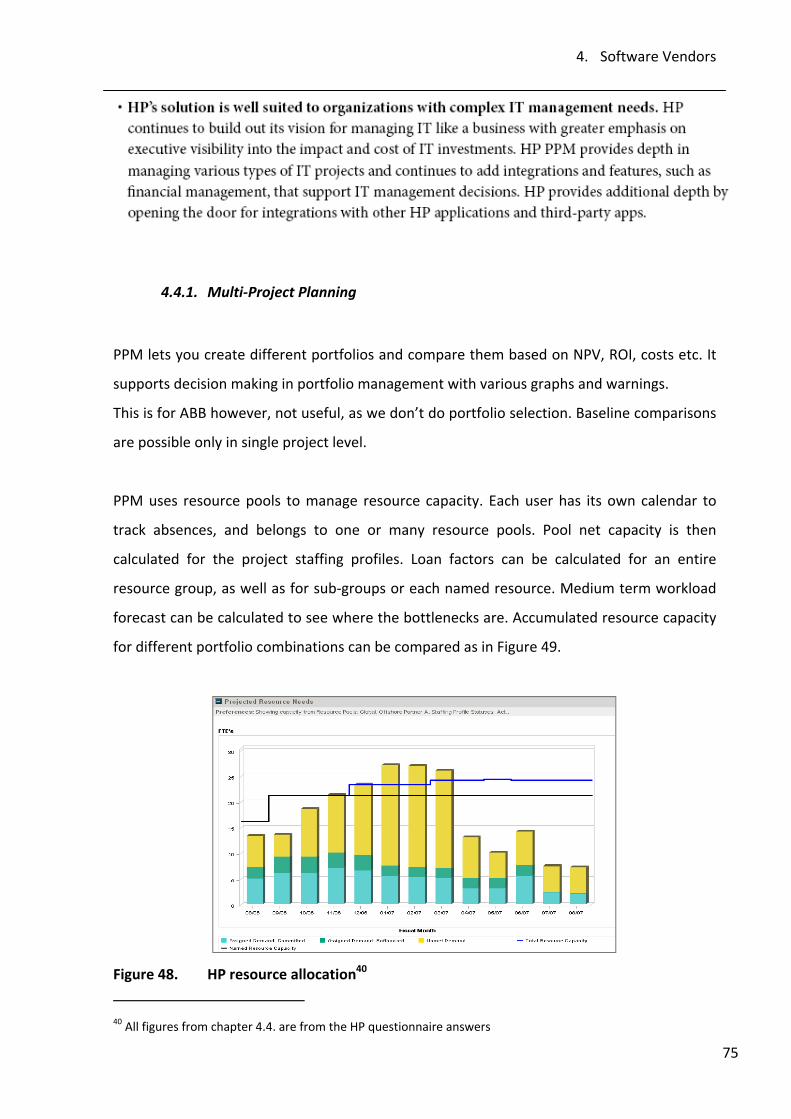
4. Software Vendors
75
4.4.1. Multi‐Project Planning
PPM lets you create different portfolios and compare them based on NPV, ROI, costs etc. It
supports decision making in portfolio management with various graphs and warnings.
This is for ABB however, not useful, as we don’t do portfolio selection. Baseline comparisons
are possible only in single project level.
PPM uses resource pools to manage resource capacity. Each user has its own calendar to
track absences, and belongs to one or many resource pools. Pool net capacity is then
calculated for the project staffing profiles. Loan factors can be calculated for an entire
resource group, as well as for sub‐groups or each named resource. Medium term workload
forecast can be calculated to see where the bottlenecks are. Accumulated resource capacity
for different portfolio combinations can be compared as in Figure 49.
Figure 48. HP resource allocation40
40 All figures from chapter 4.4. are from the HP questionnaire answers
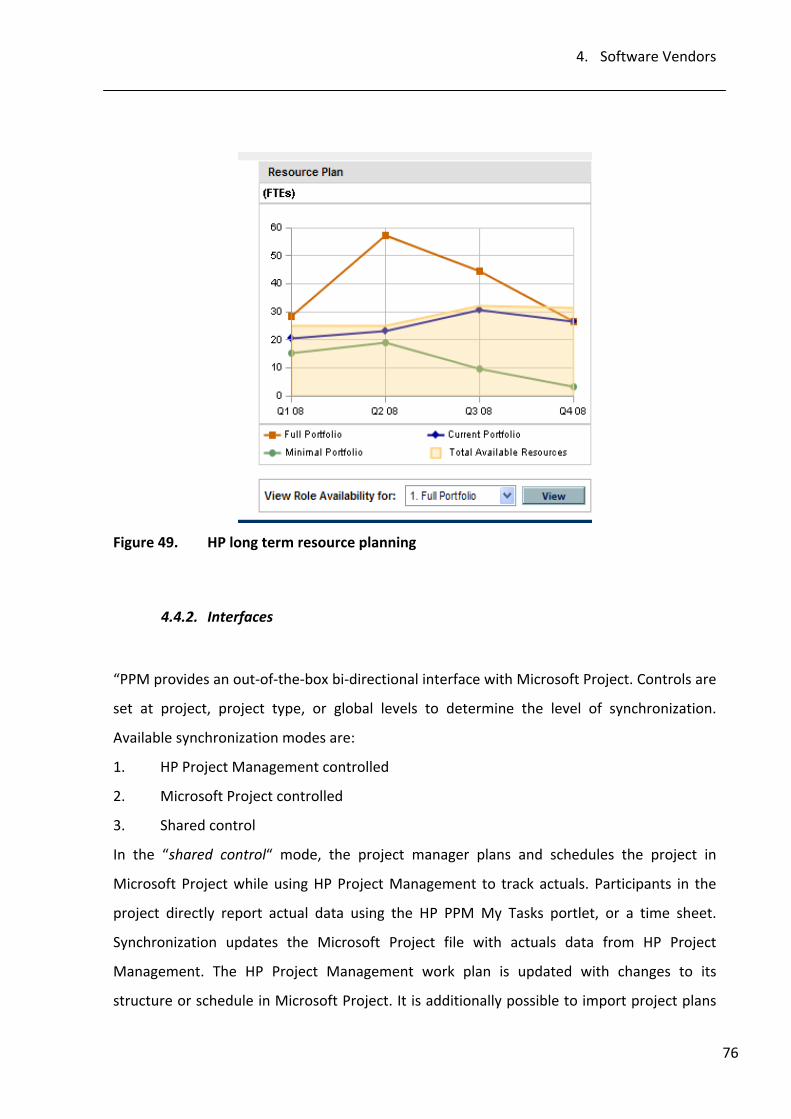
4. Software Vendors
76
Figure 49. HP long term resource planning
4.4.2. Interfaces
“PPM provides an out‐of‐the‐box bi‐directional interface with Microsoft Project. Controls are
set at project, project type, or global levels to determine the level of synchronization.
Available synchronization modes are:
1. HP Project Management controlled
2. Microsoft Project controlled
3. Shared control
In the “shared control“ mode, the project manager plans and schedules the project in
Microsoft Project while using HP Project Management to track actuals. Participants in the
project directly report actual data using the HP PPM My Tasks portlet, or a time sheet.
Synchronization updates the Microsoft Project file with actuals data from HP Project
Management. The HP Project Management work plan is updated with changes to its
structure or schedule in Microsoft Project. It is additionally possible to import project plans
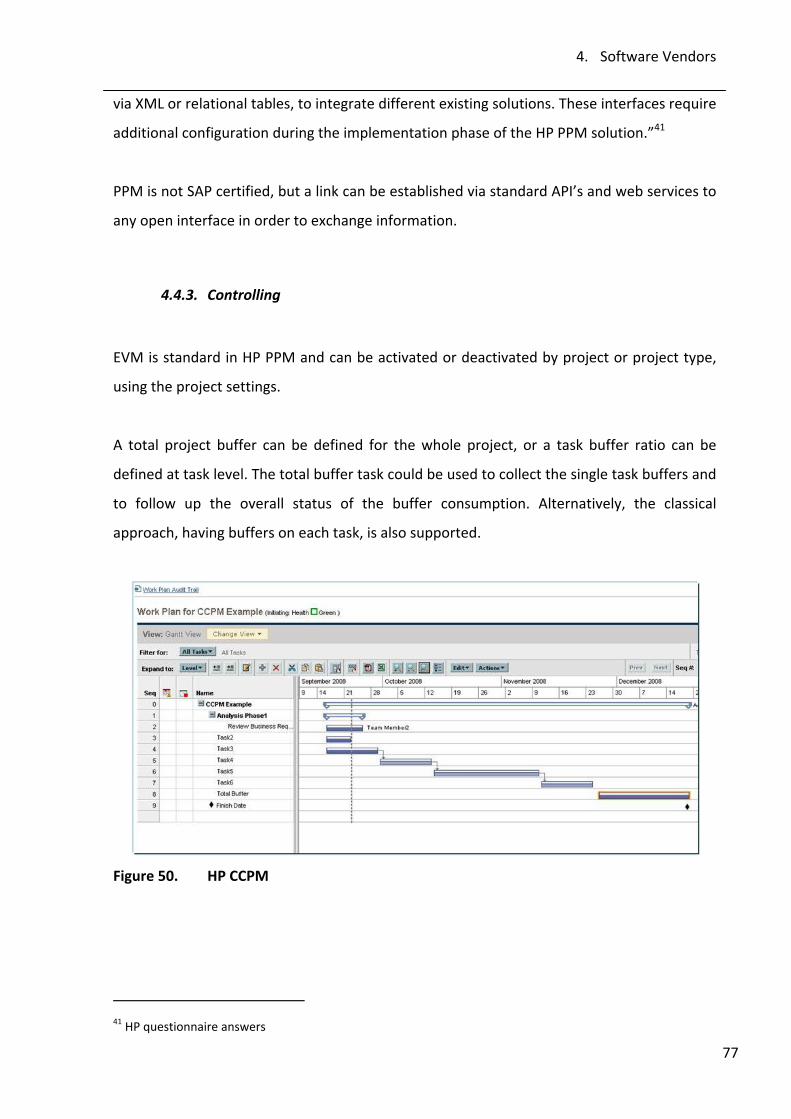
4. Software Vendors
77
via XML or relational tables, to integrate different existing solutions. These interfaces require
additional configuration during the implementation phase of the HP PPM solution.”41
PPM is not SAP certified, but a link can be established via standard API’s and web services to
any open interface in order to exchange information.
4.4.3. Controlling
EVM is standard in HP PPM and can be activated or deactivated by project or project type,
using the project settings.
A total project buffer can be defined for the whole project, or a task buffer ratio can be
defined at task level. The total buffer task could be used to collect the single task buffers and
to follow up the overall status of the buffer consumption. Alternatively, the classical
approach, having buffers on each task, is also supported.
Figure 50. HP CCPM
41 HP questionnaire answers
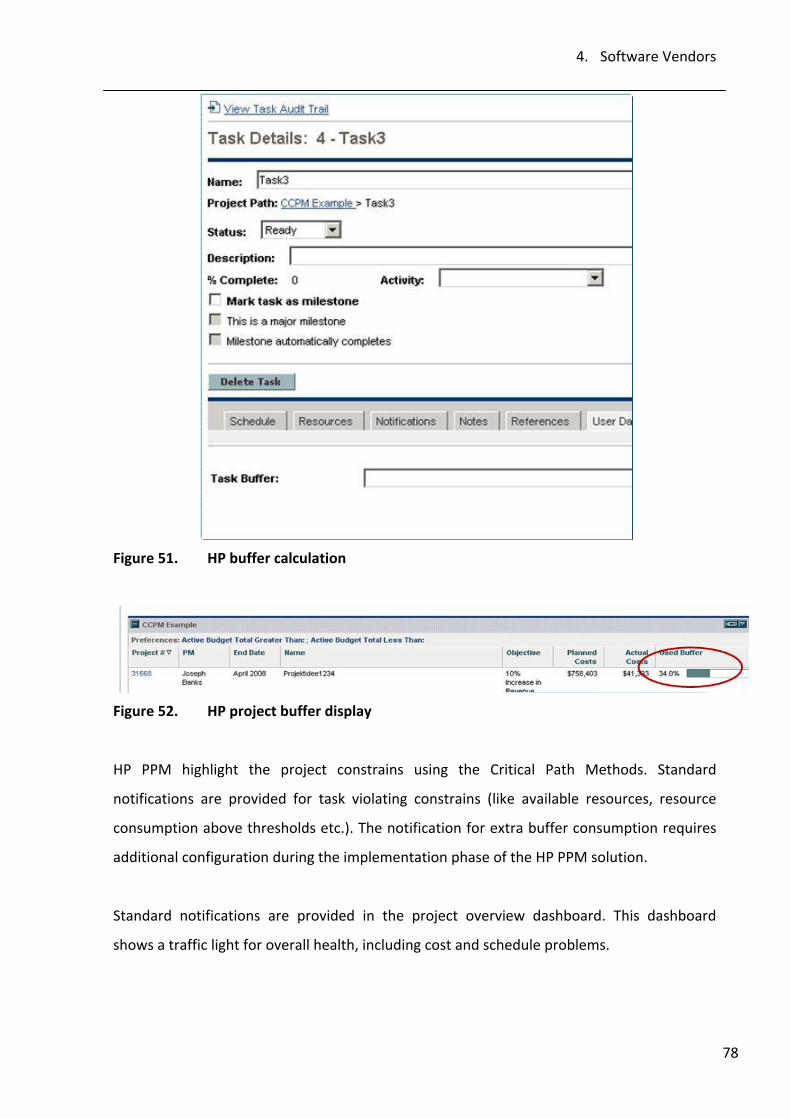
4. Software Vendors
78
Figure 51. HP buffer calculation
Figure 52. HP project buffer display
HP PPM highlight the project constrains using the Critical Path Methods. Standard
notifications are provided for task violating constrains (like available resources, resource
consumption above thresholds etc.). The notification for extra buffer consumption requires
additional configuration during the implementation phase of the HP PPM solution.
Standard notifications are provided in the project overview dashboard. This dashboard
shows a traffic light for overall health, including cost and schedule problems.
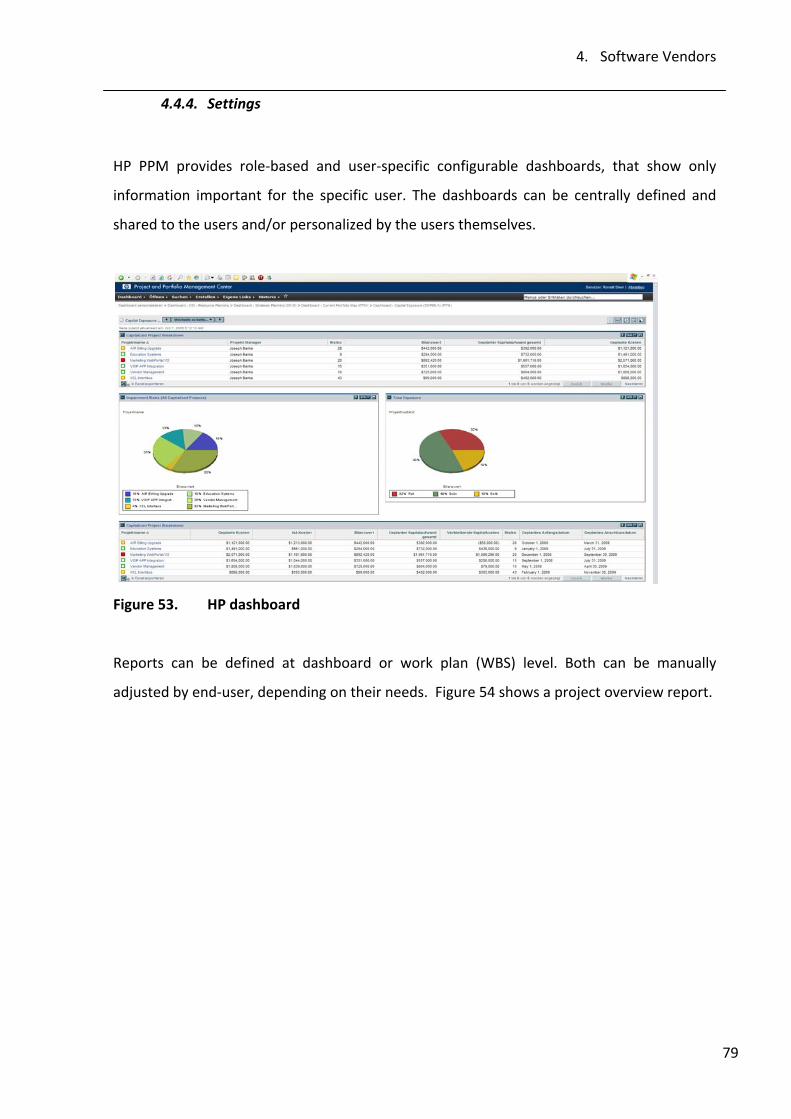
4. Software Vendors
79
4.4.4. Settings
HP PPM provides role‐based and user‐specific configurable dashboards, that show only
information important for the specific user. The dashboards can be centrally defined and
shared to the users and/or personalized by the users themselves.
Figure 53. HP dashboard
Reports can be defined at dashboard or work plan (WBS) level. Both can be manually
adjusted by end‐user, depending on their needs. Figure 54 shows a project overview report.
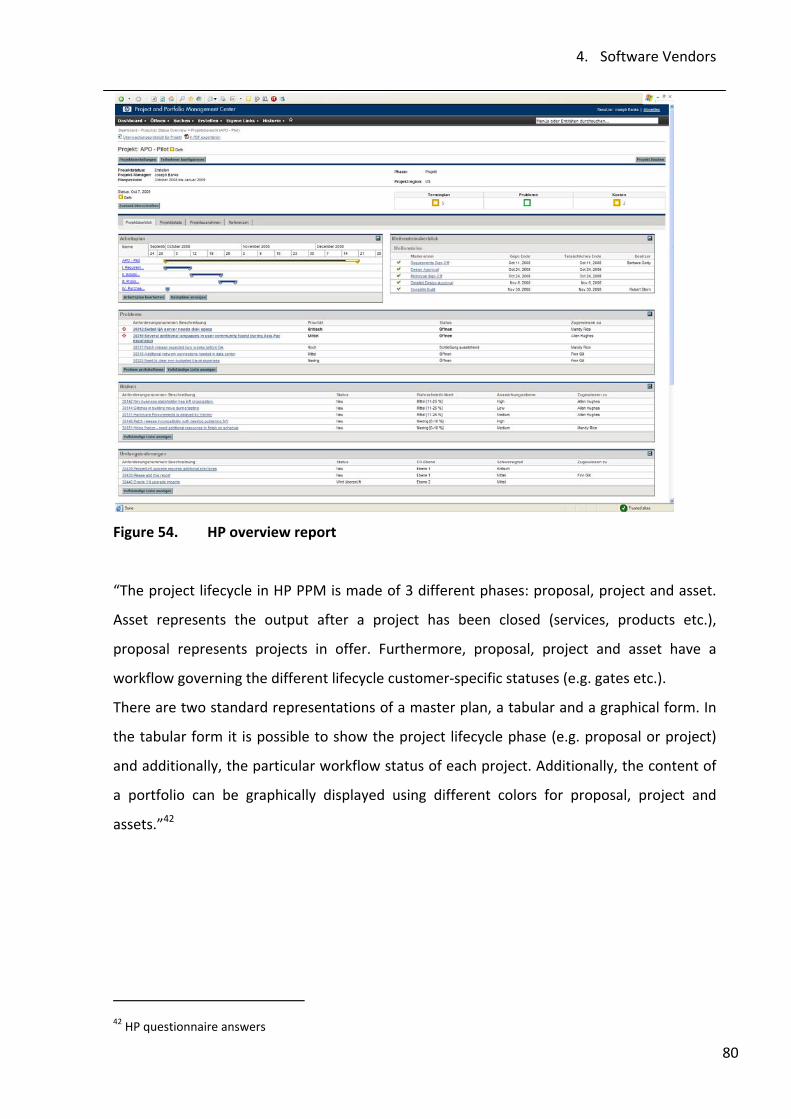
4. Software Vendors
80
Figure 54. HP overview report
“The project lifecycle in HP PPM is made of 3 different phases: proposal, project and asset.
Asset represents the output after a project has been closed (services, products etc.),
proposal represents projects in offer. Furthermore, proposal, project and asset have a
workflow governing the different lifecycle customer‐specific statuses (e.g. gates etc.).
There are two standard representations of a master plan, a tabular and a graphical form. In
the tabular form it is possible to show the project lifecycle phase (e.g. proposal or project)
and additionally, the particular workflow status of each project. Additionally, the content of
a portfolio can be graphically displayed using different colors for proposal, project and
assets.”42
42 HP questionnaire answers
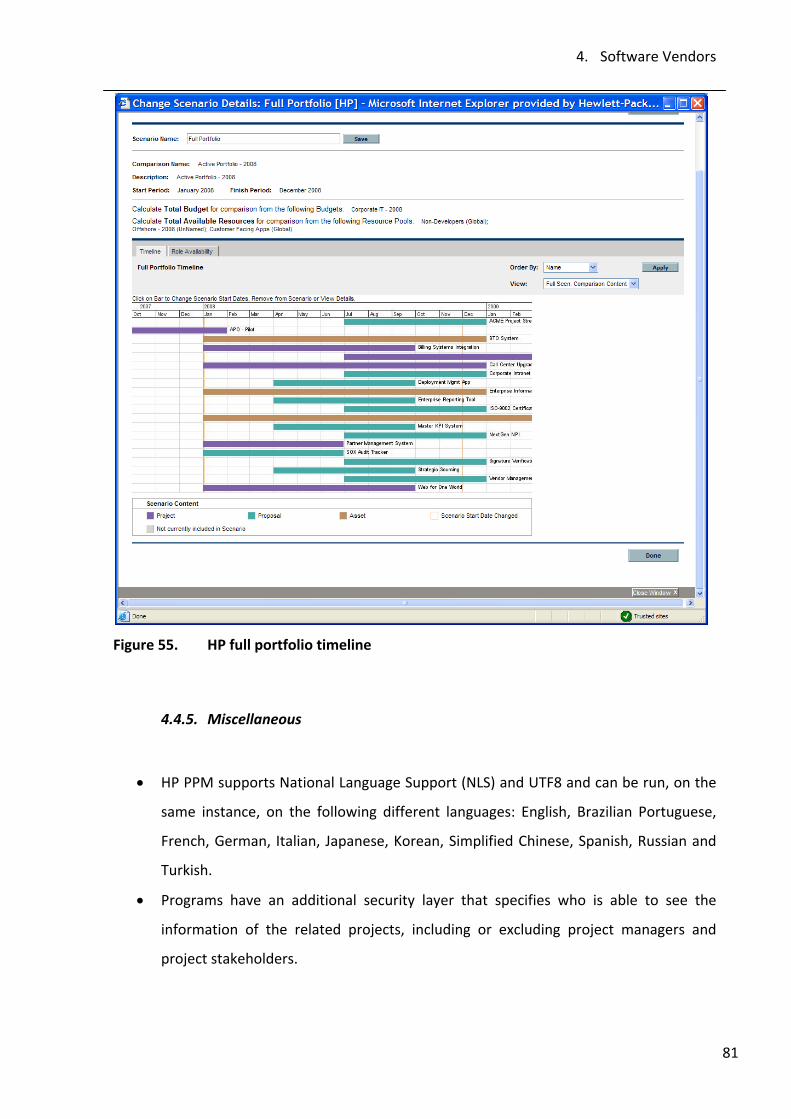
4. Software Vendors
81
Figure 55. HP full portfolio timeline
4.4.5. Miscellaneous
• HP PPM supports National Language Support (NLS) and UTF8 and can be run, on the
same instance, on the following different languages: English, Brazilian Portuguese,
French, German, Italian, Japanese, Korean, Simplified Chinese, Spanish, Russian and
Turkish.
• Programs have an additional security layer that specifies who is able to see the
information of the related projects, including or excluding project managers and
project stakeholders.
4. Software Vendors
82
• High availability is achieved by leveraging horizontal scaling of the application
environment to provide failover capabilities, and by implementing technologies such
as clustering at the database level.
• The HP PPM application server tier has been designed to be highly scalable, and the
software has been optimized for performance and stability.
• Standard user groups are project manager, summary task owners, program manager,
project staff, project stakeholders, workflow participants, user group with access to
financial data (project funding, baseline costs, forecast costs, actual).
• HP PPM tracks all changes into logs to provide strong audit capabilities. Log
information can be displayed also directly to end users, or displayed in audit reports.
4.4.6. Customer Reference: Exactitude Consulting for BHP Billiton
BHP Billiton is a British‐Australian mining and oil and gas company that has mining sites all
over the world. Their mining division in South‐Africa wanted to implement a PPM tool to
improve their project delivery, and turned to an independent consultant from Exactitude
Consulting. He shared his experiences with us about how BHP is using HP PPM.
BHP launched the project of implementing PPM with a kick‐off in June 2008. The software
went live in July 2009 and it took a year, until July 2010, for the implementation to become
stable. The aim was to obtain a central planning tool for a global view. In ABB, this would not
be the case as the implementations would be done in several smaller business units.
The tool was used for managing capital and business improvement projects i.e. internal
projects. As a part of the project, they abolished all other PM tools like MSP and Excel
sheets, in order to have all the information only in the HP PPM. The implementation was
successful and a further upgrade is planned for 2011.
ABB has, however, different needs and it was important to find out if the tool provides to
BHP the support that ABB is looking for. There is no automatic interface to SAP and the
information update in BHP is done manually once a week. There is an interface to MS
Project, but in order to connect PPM to Primavera they must use MSP as a link between the
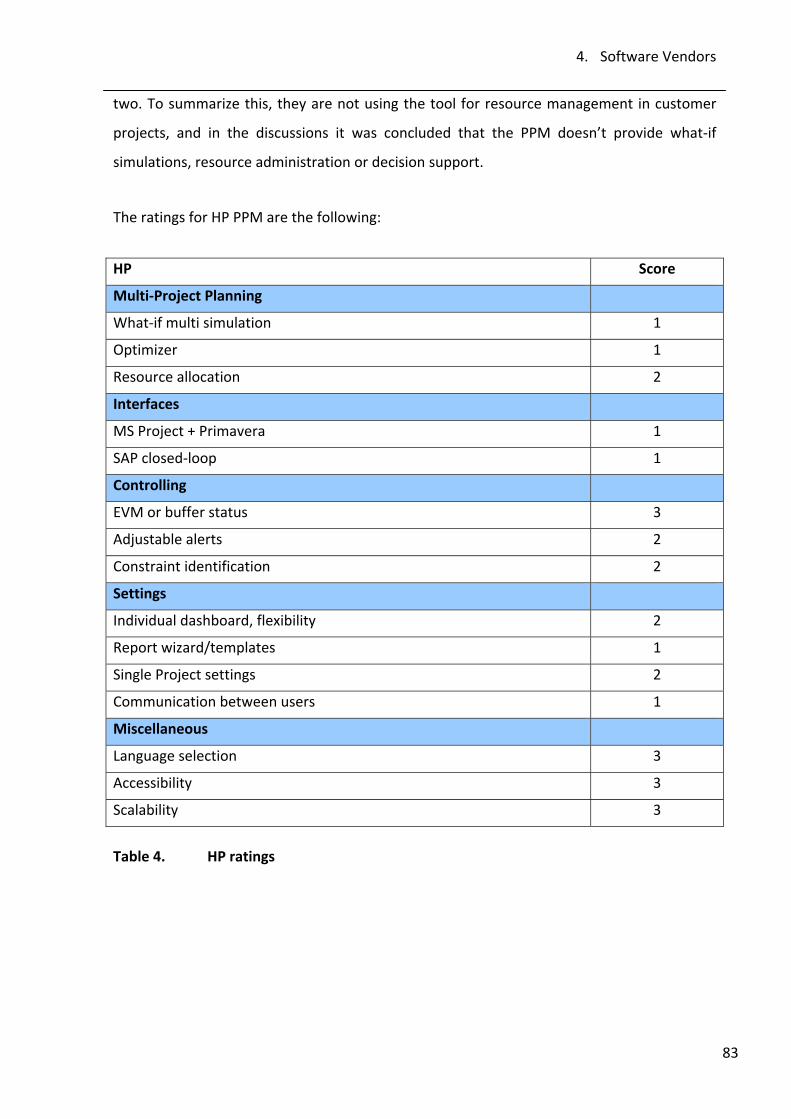
4. Software Vendors
83
two. To summarize this, they are not using the tool for resource management in customer
projects, and in the discussions it was concluded that the PPM doesn’t provide what‐if
simulations, resource administration or decision support.
The ratings for HP PPM are the following:
Table 4. HP ratings
HP Score
Multi‐Project Planning
What‐if multi simulation 1
Optimizer 1
Resource allocation 2
Interfaces
MS Project + Primavera 1
SAP closed‐loop 1
Controlling
EVM or buffer status 3
Adjustable alerts 2
Constraint identification 2
Settings
Individual dashboard, flexibility 2
Report wizard/templates 1
Single Project settings 2
Communication between users 1
Miscellaneous
Language selection 3
Accessibility 3
Scalability 3
4. Software Vendors
84
4.5. Realization/Concerto
Realization offers a complete solution for project
management and execution, where their
Concerto software is only part of the product. The
software cannot therefore be purchased
separately, nor is any information about it made
available.
• Based on critical chain method and theory of constraints
• Aims to reduce cycle time and thereby improve on time delivery
• Offers a full on‐site support until results are obtained
• No information about the software functionalities is available, the company provides
only a description of their methods and obtained results
• Used for project management in some ABB BUs
Realization uses the critical chain method to shorten the project cycle times. The focus is in
changing the way the organization works. The implementation process requires full
commitment and resources from the client. As a reward, they promise life cycle reductions
and increased throughput, around 20%. They reveal very little about the software that they
use: this is only supporting their task in teaching a new method of working, which relies on
prioritizing on the task level and synchronization of the tasks more efficiently. What we were
able to find out, is that Concerto has MSP embedded but ERP limits to materials
management module in SAP. Only success stories without specific information about the
tool, are used as advertising material.
They present three rules for implementing their method43:
Rule 1: Limit the number of projects in execution, even if it means keeping some resources
idle. Concentrating resources on fewer projects at a time not only allows them to be
executed faster, but also reveals overall capacity to undertake more projects.
43 Realization Homepage www.realization.com
4. Software Vendors
85
Rule 2: In execution, allow individual tasks to be late against the plans. That way, people
won’t have to hide safeties inside their estimates, and tasks will get executed faster, because
work won’t have to expand just to fill the time available (Parkinson’s Law)44.
Rule 3: Provide uniform task priorities across all departments and levels of management.
When everyone knows what to do and when, and is working on the same priorities, projects
get done much faster.
As a result of the feasibility analysis in Ludvika, Realization responded that: “Engineering is
not a bottleneck at this time” and “is not likely to become a bottleneck in the next year or
so”. “The best time to implement Critical Chain is when organizations can least afford to
undertake a major change. In lean times there is not incentive for operations managers to
set aggressive goals or to make the changes. On the other hand, Critical Chain can be
implemented and results achieved quickly (within 6‐8 weeks) when there is a real need.”45
They believe, therefore, that it doesn’t make sense to start a project there at the moment.
I believe the senior engineers in certain departments are a bottleneck, not all engineers as
such. This is a crucial difference to manufacturing companies, where individuals are
replaceable, and it seems that Realization is more familiar with manufacturing business,
where the critical chain works at its best.
44 Parkinson’s Law, taken from a 1955 essay in The Economist by Cyril Parkinson says that, “Work expands so as
to fill the time available for its completion”. 45 E‐Mail from Sanjeev Gupta, Realization CEO
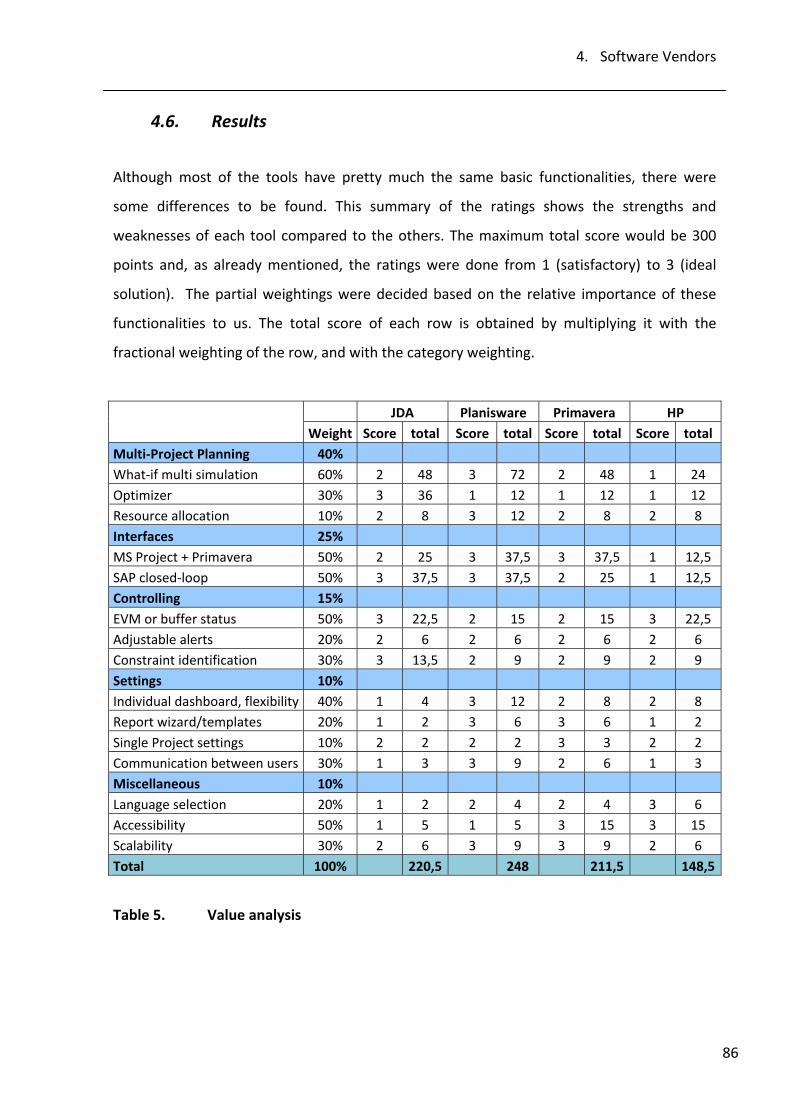
4. Software Vendors
86
4.6. Results
Although most of the tools have pretty much the same basic functionalities, there were
some differences to be found. This summary of the ratings shows the strengths and
weaknesses of each tool compared to the others. The maximum total score would be 300
points and, as already mentioned, the ratings were done from 1 (satisfactory) to 3 (ideal
solution). The partial weightings were decided based on the relative importance of these
functionalities to us. The total score of each row is obtained by multiplying it with the
fractional weighting of the row, and with the category weighting.
JDA Planisware Primavera HP Weight Score total Score total Score total Score total
Multi‐Project Planning 40% What‐if multi simulation 60% 2 48 3 72 2 48 1 24 Optimizer 30% 3 36 1 12 1 12 1 12 Resource allocation 10% 2 8 3 12 2 8 2 8 Interfaces 25% MS Project + Primavera 50% 2 25 3 37,5 3 37,5 1 12,5 SAP closed‐loop 50% 3 37,5 3 37,5 2 25 1 12,5 Controlling 15% EVM or buffer status 50% 3 22,5 2 15 2 15 3 22,5 Adjustable alerts 20% 2 6 2 6 2 6 2 6 Constraint identification 30% 3 13,5 2 9 2 9 2 9 Settings 10% Individual dashboard, flexibility 40% 1 4 3 12 2 8 2 8 Report wizard/templates 20% 1 2 3 6 3 6 1 2 Single Project settings 10% 2 2 2 2 3 3 2 2 Communication between users 30% 1 3 3 9 2 6 1 3 Miscellaneous 10% Language selection 20% 1 2 2 4 2 4 3 6 Accessibility 50% 1 5 1 5 3 15 3 15 Scalability 30% 2 6 3 9 3 9 2 6 Total 100% 220,5 248 211,5 148,5
Table 5. Value analysis
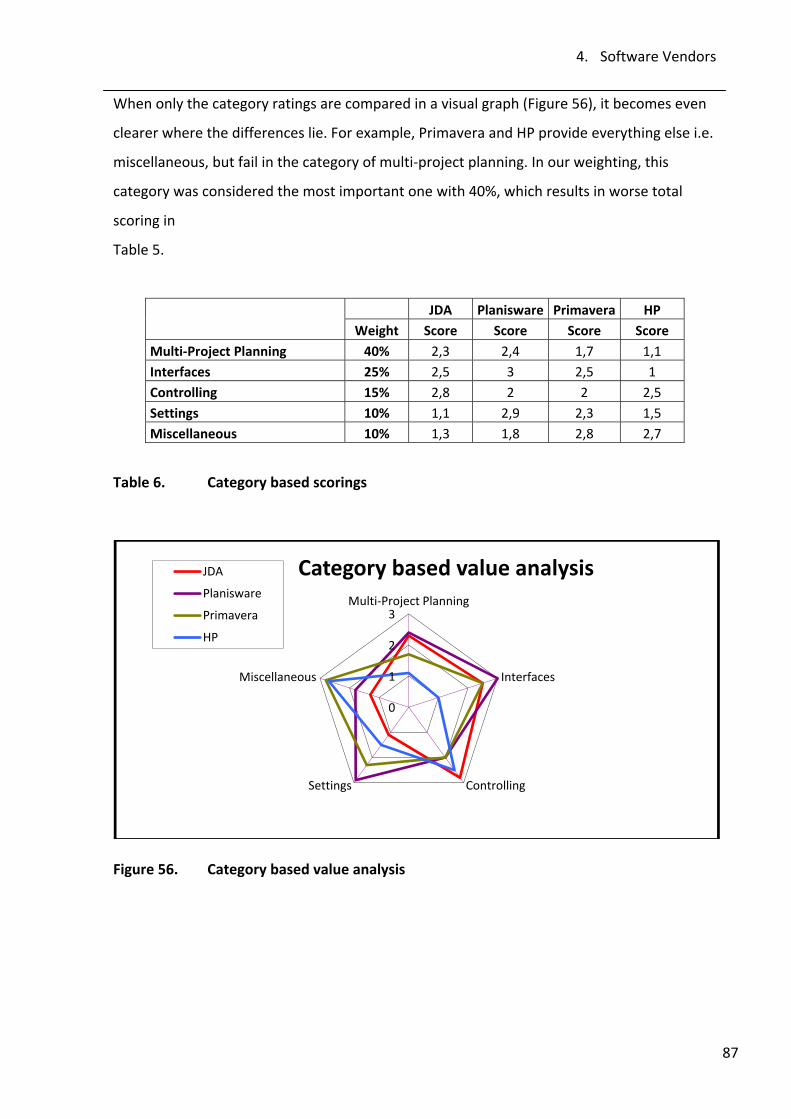
4. Software Vendors
87
When only the category ratings are compared in a visual graph (Figure 56), it becomes even
clearer where the differences lie. For example, Primavera and HP provide everything else i.e.
miscellaneous, but fail in the category of multi‐project planning. In our weighting, this
category was considered the most important one with 40%, which results in worse total
scoring in
Table 5.
JDA Planisware Primavera HP
Weight Score Score Score Score Multi‐Project Planning 40% 2,3 2,4 1,7 1,1 Interfaces 25% 2,5 3 2,5 1 Controlling 15% 2,8 2 2 2,5 Settings 10% 1,1 2,9 2,3 1,5 Miscellaneous 10% 1,3 1,8 2,8 2,7
Table 6. Category based scorings
Figure 56. Category based value analysis
0
1
2
3Multi‐Project Planning
Interfaces
ControllingSettings
Miscellaneous
Category based value analysisJDA
Planisware
Primavera
HP
5. Implementation
88
5. Implementation
Of course it is important to choose the best software, but it plays only a small role in
whether the implementation will be a success or not. The technical implementation of most
of the tools can be done relatively fast, in the case of a SaaS, even within weeks. The JDA
solution however, requires much longer; ca. 9 months for technical implementation, and
two years before people learn to use it efficiently.
Before starting the implementation project, I would recommend the following issues to be
carefully considered:
• Problem analysis: What is the actual problem? How should the tool help you to solve
this? To which problems does the tool provide support?
• User commitment: Does everyone agree that there is a problem? Do they want to
commit to solving it? Are they convinced that the chosen solution will bring an
improvement?
• Who will be the assigned project owner? He must be fully engaged to the process.
There are some crucial points which contribute to the success of the implementation:
• Quality of input data: If the users are not committed to keep the information up‐to‐
date, the software is useless. Therefore, the interfaces to the SAP or PM tool must be
automated, or very easy to execute. No data should be required to be entered
doubled, to ensure consistency.
• Letting go of the old systems: There must be a sufficient confidence that the new tool
replaces all the functions of the old system, and that the old tool can be deleted. The
necessity of the change must be justified and communicated.
• Gradual introduction of new functionalities. Install only the core modules addressing
the problem, gradually expanding later. The user should never see the tool as too
complicated or difficult to learn.

5. Implementation
89
• Common understanding of the company methods of working.
• Communication and change management. Implementation fails within a few months
if the system is not used.
• Keep in touch with the vendor for reassessments, updates, joint development of the
tool for new functionalities etc.
6. Conclusion
90
6. Conclusion
There are plenty of studies and software comparisons that will help a company in their task
of finding a suitable project management tool. There is, however, no single solution that
would suit for all, and therefore it is important to distinguish the needs of the organization.
What works for IT or pharmaceutical companies will most likely not work in an engineering
environment. The vendor should be aware of these differences, and provide a tool that will
adjust to the working habits of the company and not the other way around.
All vendors provide a 100% web‐based tool and the possibility to do a SaaS implementation.
The software is generally open, so that interfaces to any other tools can be established. The
question is, how well such interfaces work and how much work is required before the
installation is finally completed. Therefore, I prefer software that has the solution already
built in and working in a reference company.
The tools rely mainly on common project management methods which are not always ideal.
Resource leveling, for example, is often possible but leads to push‐out of the deadlines and
doesn’t make much sense for a better on time delivery. Even though EVM has also its
downsides, it is the best known method to give at least some indication of the project
development.
Even though the functionalities of our four software solutions are quite similar, there are
some differences. Jda gives the power of planning to the recruited master planners, whereas
Planisware tries to encourage the communication between project and resource managers
via demand/supply model. Most of the tools prefer resource pools, where the users are
classified according to their roles or skills. Planisware and Primavera are the only ones of the
four where a resource can be a single individual. In many companies, it is not necessary to
select individuals, but in ABB, where the line manager has worked for years, or even
decades, with the same people, he knows who the best man to appoint for which job is. I
believe this knowledge should not be neglected by standardizing the skill levels.
6. Conclusion
91
The HP PPM tool is good when it comes to IT projects, but they lack the experience in
business‐oriented customer project environment. The tool is, therefore, not developed for
our needs and doesn’t provide the support that the engineering centers require.
At first, Primavera wasn’t able to convince us in resource scheduling for multiple projects.
However, the new version 8 seems to have all the necessary improvements to cover the
missing parts and is still an interesting candidate to look into. We hope to hear about the
experiences of reference companies after they have been using the new version for their
resource planning.
JDA and Planisware convinced us that they can provide the functionalities and support
needed in ABB. This was also confirmed by discussions with their customers, as well as by
other user experiences found online. The two solutions have very different approaches,
which will hopefully let each business unit find their own favorite.
In general, the amount of functionalities in each of the software is far more than ABB would
ever be using. The installation should not include all of them, but only the ones that are
needed in daily work. Additional nice‐to‐have properties make the tool far too complicated
in the beginning. It is, therefore, important to focus on which tool can provide the at‐the‐
moment most crucial functions for improving project delivery in an easy‐to‐learn, simple and
logical background.
The critical chain method from Realization has proven to give results in single project
execution, when the pressure is great enough to reveal the implicit buffers. It is intended for
manufacturing businesses, where the critical chain approach also works very well with
multiple projects. Manufacturing, however, cannot be compared to engineering tasks. An
experiment from Planisware showed that due to the uncertainties in the input and the
irreplaceability of the engineers, MPCC cannot be applied effectively in an engineering
environment.
Our discussions with the reference companies have shown that it is very difficult to measure
the numerical success of the implementation. When project duration is several years, and
6. Conclusion
92
the transfer is done gradually starting with the new projects, the implementation isn’t
theoretically completed until years later. All other process improvements projects, increased
efficiency or economical fluctuations, therefore also contribute to the company results.
The businesses are in a constant pressure of modernizing their working processes and to
catch up with the development. Hence, it is my conclusion that a project portfolio
management tool is vital for ABB engineering centers, and for any other ETO company
struggling with resource planning in a multi‐project environment. With the right software
and a successful implementation, the investment will provide a definite return.
93
References
Books
Goldratt, Eliyahu: The Goal: A Process of Ongoing Improvement, North River Press, Great
Barrington, MA, USA, 1948, ISBN 0‐88427‐061‐0.
Leach, Lawrence: Critical Chain Project Management,2nd Edition, Artec House Inc. ,
Norwood, MA, USA, 2005. ISBN 1‐58053‐903‐3.
Articles, Papers, Webcasts
Bialas, Mayer: Schaltzentrale, Software für das Multiprojektmanagement, an article in
magazine C’t; Vol. 15, 2007, p. 114‐123.
Brown, Timothy: Multi‐project critical chain and buffer management for capital and
innovation projects, Unilever, South‐Africa, A paper from the Critical Chain Symposium 2002.
DeGennaro, Tim; Visitacion, Margo: The Forrester Wave™: Project Portfolio Management,
Q4 2009, a vendor comparison from Forrester Research Inc., 2009.
Hans, E.W.; Herroelen, W.; Leus, R.; Wullink, G.: A hierarchical approach to multi‐project
planning under uncertainty, an article in magazine Omega (International Journal of
Management Science); Vol. 35, 2007, p. 563‐577.
Meyer, Mey Mark: Stand und Trend for Software Unterstützung für Project‐Management
Aufgaben, Universität Bremen, a publication from GPM Gesellschaft für
Projectmanagement, 2005.
N.N.: Planisware, Inc. Continues Company Growth and Success in 2009, announcement in
magazine Business Wire, 30 Mar 2010.
Powersteering: From promise to Payoff – Achieving Breakthrough Results with PPM Tools,
Webcast by Powersteering and Forrester Research, 2010. Available in
http://info.powersteeringsoftware.com/from‐promise‐to‐payoff‐ppm‐
tools.html?description=webcast‐achieving‐breakthrough‐results‐with‐ppm‐tools.
Stang, Daniel B.: Magic Quadrant for IT Project and Portfolio Management, a comparative
study from Gartner Inc. , 2010.
Symons, Craig. The ROI of Project Portfolio Management Tools, a publication of Forrester
Research, Inc., 2009.
94
Internet pages
ABB: http://www.abb.com/cawp/abbzh252/56ba6a7efa6f571fc1256aed0032124f.aspx, ABB
Homepage / About us / History, Cited: 23 Jan 2011.
Actano: http://www.actano.com/20911_EN‐What%B4s_new‐Glossary.htm#P, Actano
Project Management and Project Management Software Homepage, Cited: 31 Jan 2011.
Ahlstom: http://www.alstom.com/power/about/, Ahlstom Homepage, Cited: 16 Feb 2011.
BARC: http://www.barc.de/, Business Application Research Center.
Caravel: http://www.caravelgroup.com/Caravel/Our‐Approach/Critical‐chain‐vs‐critical‐
path.asp, Caravel Group Pty Limited, Cited: 11 Feb 2010.
HP: http://www8.hp.com/us/en/hp‐information/about‐hp/index.html, HP Homepage, Cited:
26 Jan 2011.
JDA Software: http://www.jda.com/company/company‐index/, JDA Software Group
Homepage, Cited: 6 Feb 2011.
Oracle: http://www.oracle.com/corporate/story.html, Oracle Corporation Homepage /
History, Cited: 5 Feb 2011.
Planisware: http://www.planisware.com/main.php?docid=14&plw=db9294cfd3f9eb96
dafa10adfda88c08, Planisware Inc. Homepage / About us , Cited: 15 Feb 2011.
Realization: www.realization.com/criticalchain.html, Realization Inc.,Cited: 2 Nov 2010.
Schaeffler Group: http://www.ina.com/content.ina.de/en/index.jsp, Schaeffler Group
Homepage, Cited: 21 Oct 2010.
Private Documents
Kaltenbrunner, Hans‐Georg: Integrated planning at Krones July 2009: Challenges in
performing a company wide master planning role at Krones AG, Power Point presentation,
JDA Software, 2009.
Mennesson, Pierre‐Maudez: Planisware for ABB Quality and Supply Chain OPEX, Power
Point presentation, Planisware, 1.9.2010.
N.N.: ABB products, systems, services in power: An overview, Power Point presentation from
ABB Power Products division.
N.N.: Enterprice Project Planner by i2 White Paper, JDA Software.
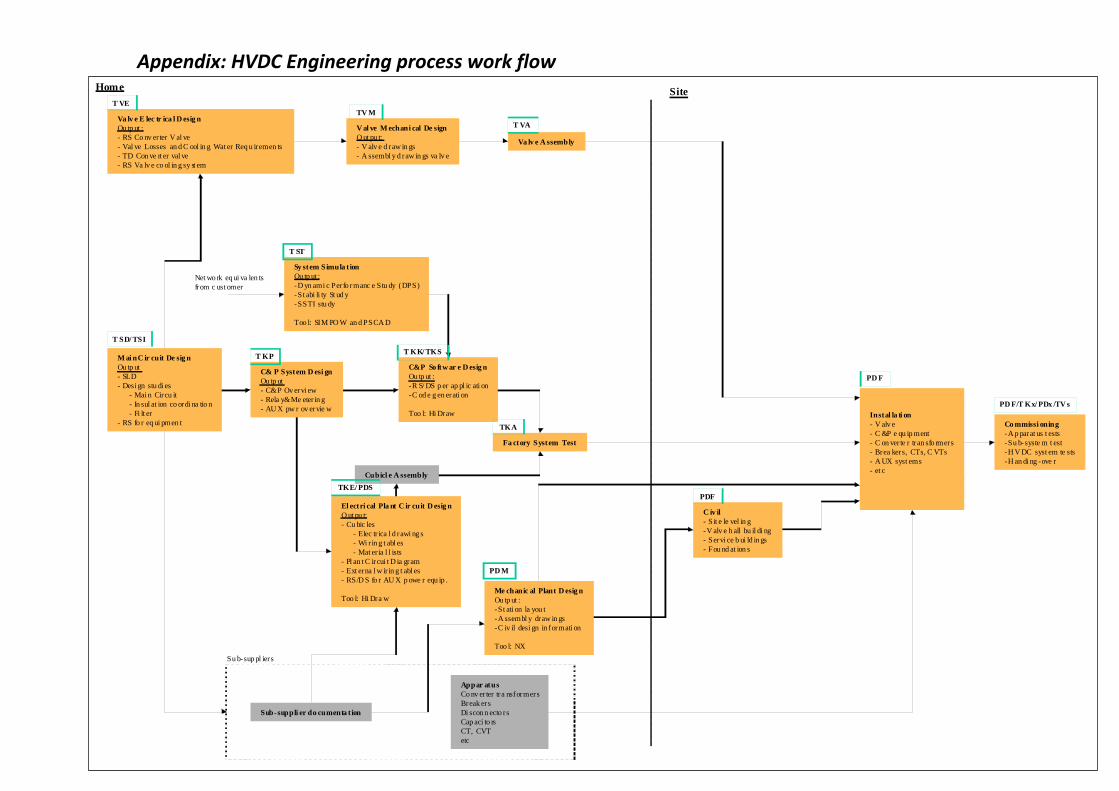
C&P So ftw ar e D esig nOu tp ut :-R S/ DS p er ap pl ic ati on-C od e g en erati on
Too l: Hi Draw
Me chanic al Plant D esig nOu tp ut :-St ati on la you t-A ssembl y draw in gs-C iv il desi gn in formati on
Too l: NX
El ectri cal Pla nt C ir cuit D esig nO ut pu t:- Cu bic les
- Elec tr ica l d rawi ng s- Wi rin g t abl es- Mat er ia l l ists
- Pl an t C ircui t D ia gram- Ext erna l w ir in g t abl es - RS/D S fo r AU X p owe r equ ip .
Too l: Hi Dra w
M ai n C ir cuit De sig nOu tp ut- SLD- Desi gn stu di es
- Mai n Circu it- In sul at ion co ordi na tio n- Fi lt er
- RS fo r eq ui pmen t
C& P System D esi gnOu tp ut- C&P Ov ervi ew- Rela y&Me eter in g- AU X pw r ov ervie w
Sy stem Simula t ionOu tp ut :-D yn ami c Perfo rmanc e Stu dy (DPS)-St abi li ty St ud y-SSTI stu dy
Too l: SIM PO W an d PSCA D
Net wo rk eq ui va len tsfrom c ust omer
Su b-sup pl iers
Sub-suppli er do cumenta t ion
Appar atusCo nv erter tra nsformersBreak ersDi scon n ecto rsCap aci to rsCT, CVTetc
Fa ctory System Test
Cubicl e A ssembly
Va lv e A ssembly
Va lv e E lec tr ica l D esig nOu tp ut :- RS Co nv erter V al ve- Val ve Losses an d C ool in g Wat er Req u iremen ts - TD Con ve rt er val ve- RS Va lv e co ol in g sy st em
V al ve M echani cal De signO ut pu t:- V alv e d raw in gs- A ssembl y d raw in gs va lv e
C iv il- Sit e le vel in g -V alv e h all bu il di ng- Servi ce b ui ld in gs- Fou nd at ion s
Instal la ti on- V alv e - C &P e qu ip ment- C on verte r tran sfo rmers- Brea kers, CTs, C VTs- A UX syst ems- et c
SiteHome
Co mmissi oning-A p parat us t ests-Su b-syste m t est-H V DC syst em te sts-H an di ng -ove r
T VETV M
T VA
TKA
T SD/ TSI
T KP T KK/ TKS
T ST
TKE/ PDSPDF
PD M
PD F
PD F/T Kx/ PDx /TV s
Appendix: HVDC Engineering process work flow