theory of sampling - flworkshop.com · 2011 food safety modernization act ... processing...
TRANSCRIPT
Theory of Sampling
Guide to Quality Sample Processing
Jo Marie Cook NACRW 2015

2011 Food Safety Modernization Act
• Integrated Food Safety System ▫ Section 202(a)(6): Standards for Sampling and Testing
• Partnership for Food Protection Uniformity in sample collection and “laboratory preparation” is essential…

Harmonized policies and procedures for sample collection, shipment, analysis, storage and retention of food and feed materials ▫ Achieve Data Equivalency
▫ Estimate Overall Error

Goal of Sampling Make a decision about a unit of material based on
analytical data derived from a small mass extracted from the DECISION UNIT
Lab Sampling : Size Reduction to obtain test sample
Question: What is the smallest test sample size?

Theory – Pierre Gy • Compositional Heterogeneity Leads to Fundamental Error • Distributional Heterogeneity Leads to Grouping and Segregation Error
• Sample Correctness and Tools

Compositional Heterogeneity
• Fundamental Error • Collect sufficient mass to represent all the
particles of varying composition ▫ d = Diameter of largest particle ▫ m = Mass of sample collected ▫ C = constant unique to material and analyte
s2(FE) = Cd3 / m
Collect the appropriate mass or reduce the particle size!

Fundamental Error Constant
C = cBfg c = constitution factor: concentration of analyte in critical
particles and density of critical particles B = liberation factor: extent critical particles are liberated f = shape factor: cube = 1, sphere = 0.524, wafer = 0.1 g = size range: uniform = 1, large distribution = 0.25

Distributional Heterogeneity • Grouping and Segregation Error • Assure equal likelihood for all increments
of the lot to be selected • Collect a sufficient number of random
increments
Mix and/or collect many increments!

Sample Correctness • Does your sample contain all of the particles of interest
in your decision unit?
• Eliminate bias generating errors

Theory of Sampling and Measurement Uncertainty
• TOS focuses on the Sampling Process • TOS minimizes all sampling contributions to MU • If the sampling error effects not reduced the MU
estimates are compromised Esbensen and Wagner, Analytical Scientist, 2014
• Eurachem/CITAC Guide: “Measurement Uncertainty Arising from Sampling”, 2007
• DS-3077, “Representative Sampling – Horizontal Standard”, 2013

Survey of Current Lab Practices
• Mix, chop, blend all subs to make a composite
• Vertical cutter/mixer >>
• Cryoprep?
Not homogenous!


Repeat analyses from processed samples
Method Analytical Sample (g)
% Absolute Difference +/- std. dev.
Number
FL Method 50 g 18% +/- 15% 149 QuEChERS 15g 18% +/- 16% 234
QuEChERS 26 Commodities 42 Pesticides

234 F & V - QuEChERS, 15g
0 10 20 30 40 50 60 70 80 90
100
0.01 0.10 1.00 10.00 100.00
Mean Concentration (ppm)
% Absolute Difference vs Concentration
% Diff

% Difference by Pesticide Analyte % n
Acephate 19 6
Captan 25 7
Carbendazim 10 10
Chlorothalonil 22 15
Cypermethrin 34 12
Dinotefuran 20 9
Endosulfan Sulfate 17 17
Iprodione 27 6
Methamidophos 11 6
Prochloraz 16 6
Thophanate Me 13 12

% Difference by Commodity Commodity % n Green beans 0.17 18
Cabbage 0.22 6
Cilantro 0.19 12
Cucumbers 0.18 12
Culantro 0.14 8
Ginger 0.24 7
Malanga 0.19 11
Mint 0.24 6
Papaya 0.15 8
Snap Peas 0.28 6
Peppers, hot 0.29 11
Summer Squash 0.12 13
Strawberry 0.15 13
Thyme 0.24 8

Processing Repeatability – PDP Peaches
• 9 samples of the same commodity with similar detections
• Peaches frequently always have detections • Peaches can be problematic during the
homogenization process and is a commodity that is not peeled
• Original batch extracted- 2/11/15 • Re-extracted - 3/12/15

Temperature of Peaches after Homogenization
Analyst ⁰C after homogenization
John Doe 16.6 Jane Doe 15.9 Bob Doe 17.2
Note: Peaches are stored at ~ 4 ⁰C prior to processing
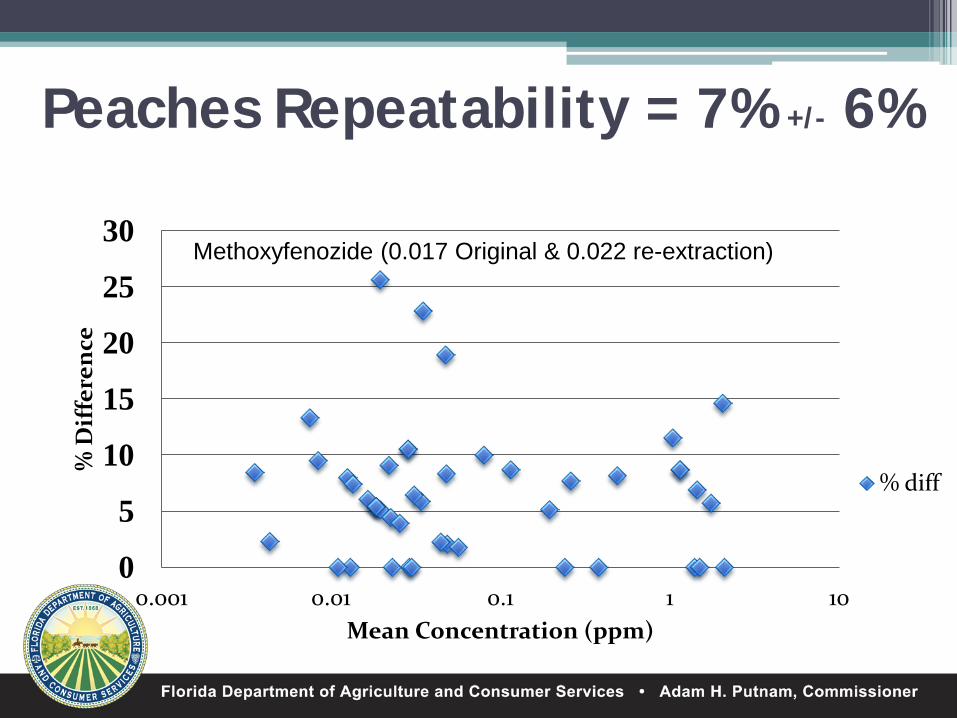
Peaches Repeatability = 7% +/- 6%
0
5
10
15
20
25
30
0.001 0.01 0.1 1 10
% D
iffe
renc
e
Mean Concentration (ppm)
% diff
Methoxyfenozide (0.017 Original & 0.022 re-extraction)

PDP Peaches Repeatability Analyte % diff n
ACETAMIPRID 10 6 BUPROFEZIN 0 2 CHLORANTRANILIPROLE 23 2 CYHALOTHRIN TOTAL 13 2 CYPRODINIL 0 2 FLUDIOXONIL 7 6 IMAZALIL 2 2 IPRODIONE 4 10 METHOXYFENOZIDE 10 4 PROPICONAZOLE 0 3 PYRIMETHANIL 8 6 SPIRODICLOFEN 8 6 TEBUCONAZOLE 5 8

TOS Sample Processing Quality Criteria • Definition: Size reduction to obtain test sample • Goal: Represent the Decision Unit • Small fundamental, grouping & segregation errors: Appropriate mass Appropriate # of Increments • Sample Correctness: Every particle has the same probability of selection Appropriate tools, procedures • Unbiased • QC to Assess Representativeness = replicates
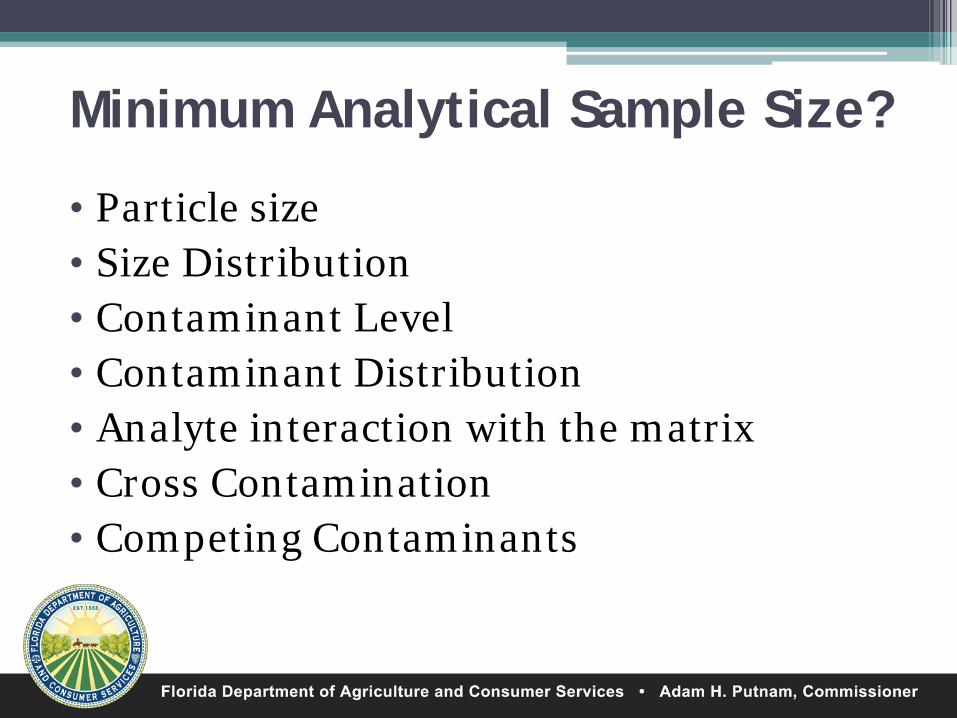
Minimum Analytical Sample Size?
• Particle size • Size Distribution • Contaminant Level • Contaminant Distribution • Analyte interaction with the matrix • Cross Contamination • Competing Contaminants

Minimum Analytical Sample Size?
M = 10 * λ*d3 E2
M = Mass of sample in grams λ = Density in g/cm3
d3 = diameter of largest particles in cm
E = Tolerable error (0.15 = 15%)
Caution! This assumes a constant of 10.
Your constant may be very different.
“Guidelines for Preparing Laboratory Samples”, AAFCO.org

Cryogenic Blending Minimum Analytical Sample Size?
M = 10 * λ*d3
E2
M = 0.0055 g (Only an Estimate!) λ = 0.8 d3 = 0.0000156 (250 µm)
E = 0.0225 (0.15 = 15%)

Room Temperature vs Freeze & Blend
Do we need Cryogenic Milling for Oranges?
▫ Smaller particle size, mm -> 45 – 250 um (Advantage) ▫ Samples are kept Frozen (Advantage for heat sensitive compounds) ▫Very time consuming (Disadvantage) ▫ Is it fit for purpose?
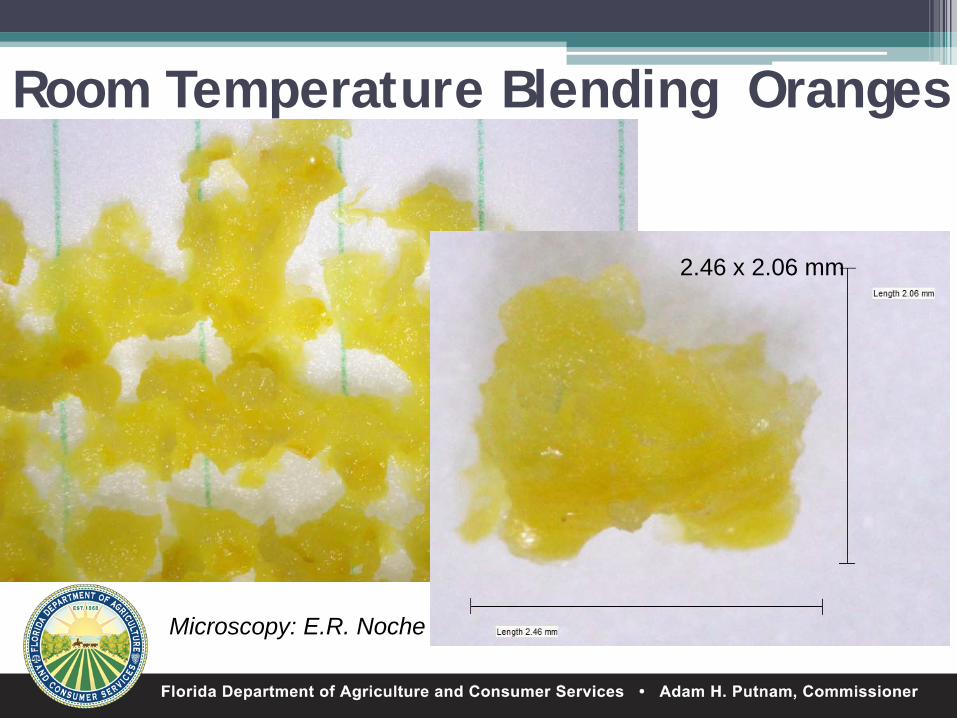
Room Temperature Blending Oranges
2.46 x 2.06 mm
Microscopy: E.R. Noche
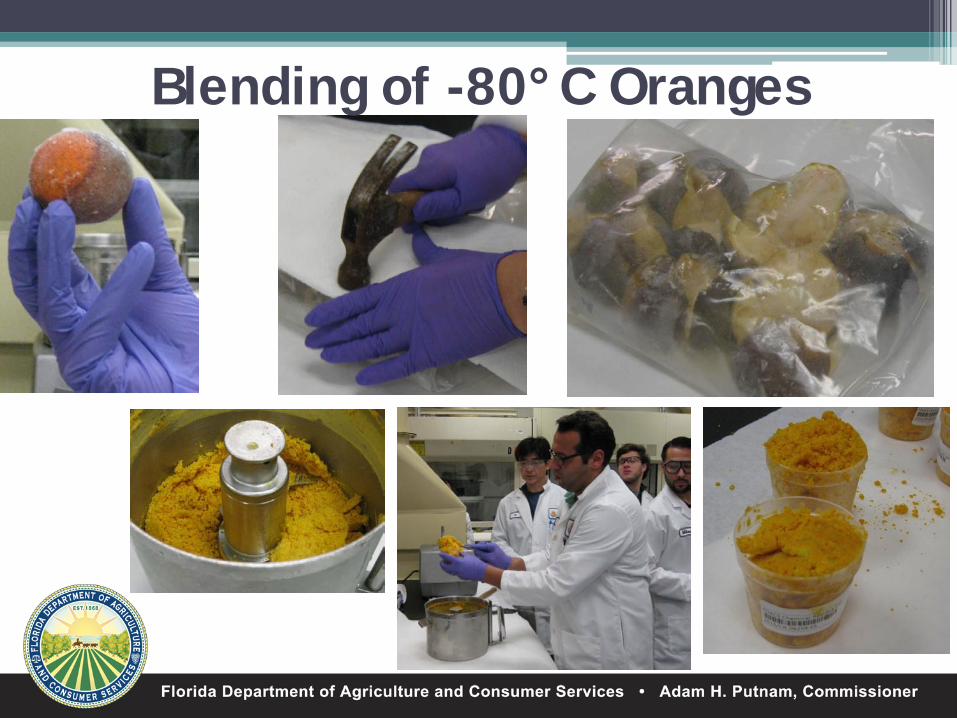
Blending of -80°C Oranges


Still a few large
chunks
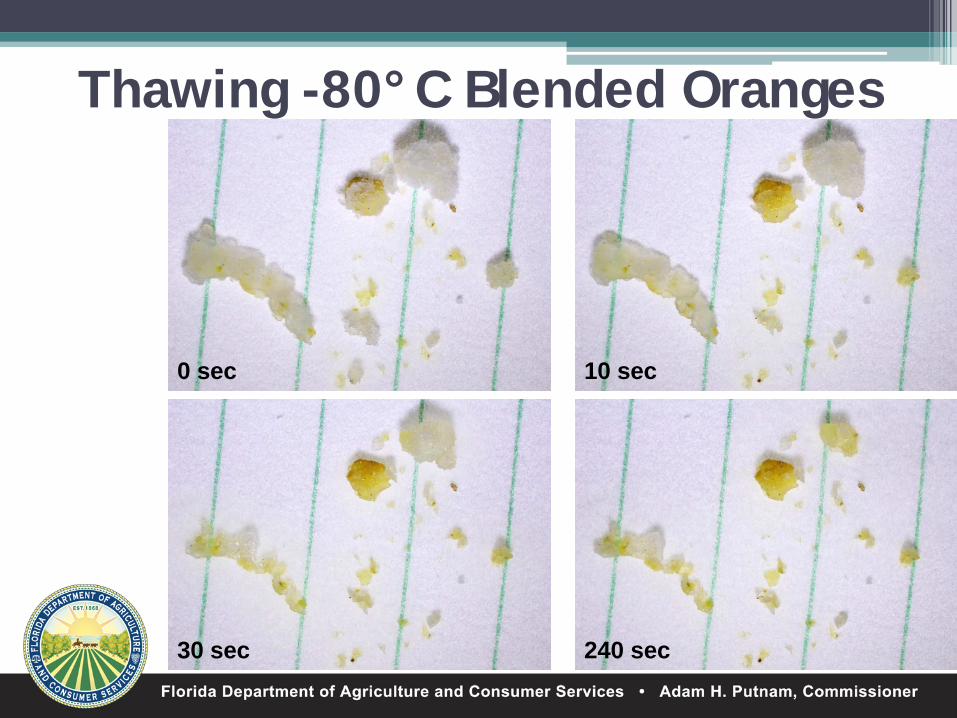
Thawing -80°C Blended Oranges
0 sec 10 sec
30 sec 240 sec
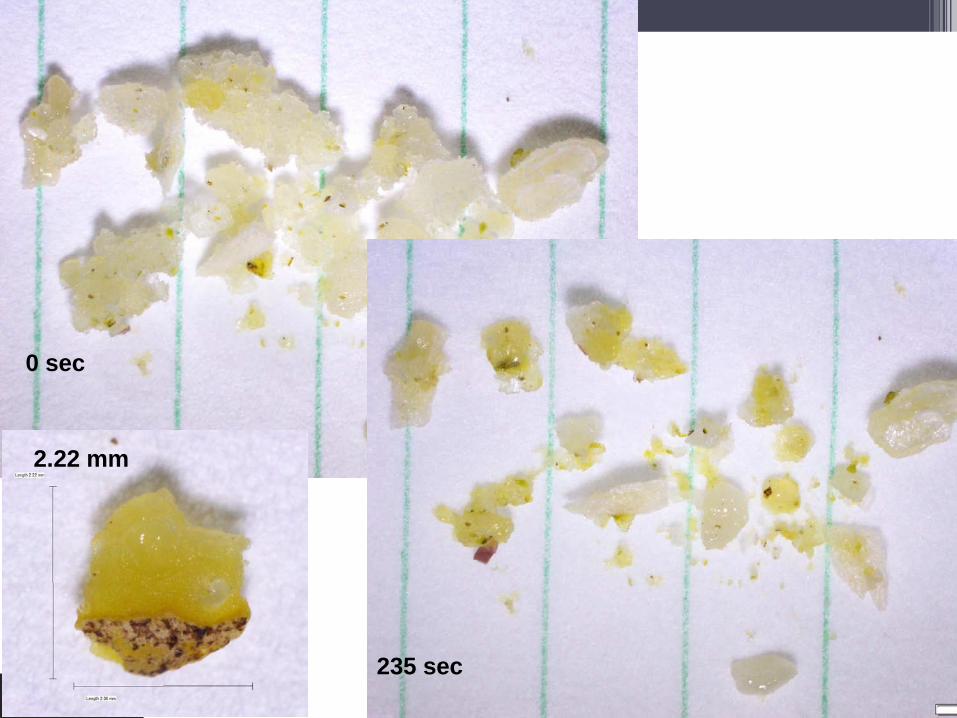
0 sec
235 sec
2.22 mm

Thawing -80°C Blended Grapefruit
0 sec
527 sec
230 sec

-80°C Blended Valencia 0.94 x 1.51 mm
1.36 mm
4.85 mm
85 sec.

Repeat Analyses (ppb) - Orange Date 1/29 4/24 4/24 4/24 Subs S1 S3 S3 S3
Frozen cup 1
Frozen cup 3
Frozen cup 3
Frozen cup 3
Penillic Acid (ppb)
504
261
302
308
Penilloic Acid (ppb)
594
425
504
595
*S2 was used for qualitative confirmation of original result

Repeat Analyses (ppb) - Grapefruit Date 3/17 4/24 4/24 4/24 Subs S1 S2 S3 S4
original Frozen cup 2 Frozen cup 3 Resample/blend
Penillic Acid (ppb)
6.8 4.6 5.3 21
Penilloic Acid (ppb)
14 12 14 28

March/April 2015, Open Access
Special Issue – 13 Papers on Theory of Sampling http://aoac.publisher.ingentaconnect.com/content/aoac/jaoac
TOS Forum http://www.impublications.com/tos-forum

Theory of Sampling
Guide to Quality Sample Processing
Questions?