the world is turning japanese: opportunities for japan … · the world is turning japanese:...
TRANSCRIPT

The World is turning Japanese:
Opportunities for Japan in Asia and Europe
Fujitsu Research Institute
Dr. Martin [email protected]
2012.02.28

1
Exports drive Growth in Japan – but not in 2012?
1Source: © FRI 2012. Data from Cabinet Office, CEIC.
Japan - Contribution to GDP Growth
% GDP
Exports
Households
Copyright 2012 FUJITSU RESEARCH INSTITUTE
GDP Growth
� In 2012 Japan will have to rely on government spending
+/-0% Invest. +/-0%
>1% Exports ?%
<2% Growth <1.5%
Government
-0.3% Govern.+0.8%
2012
>0.5% Househ. ?%
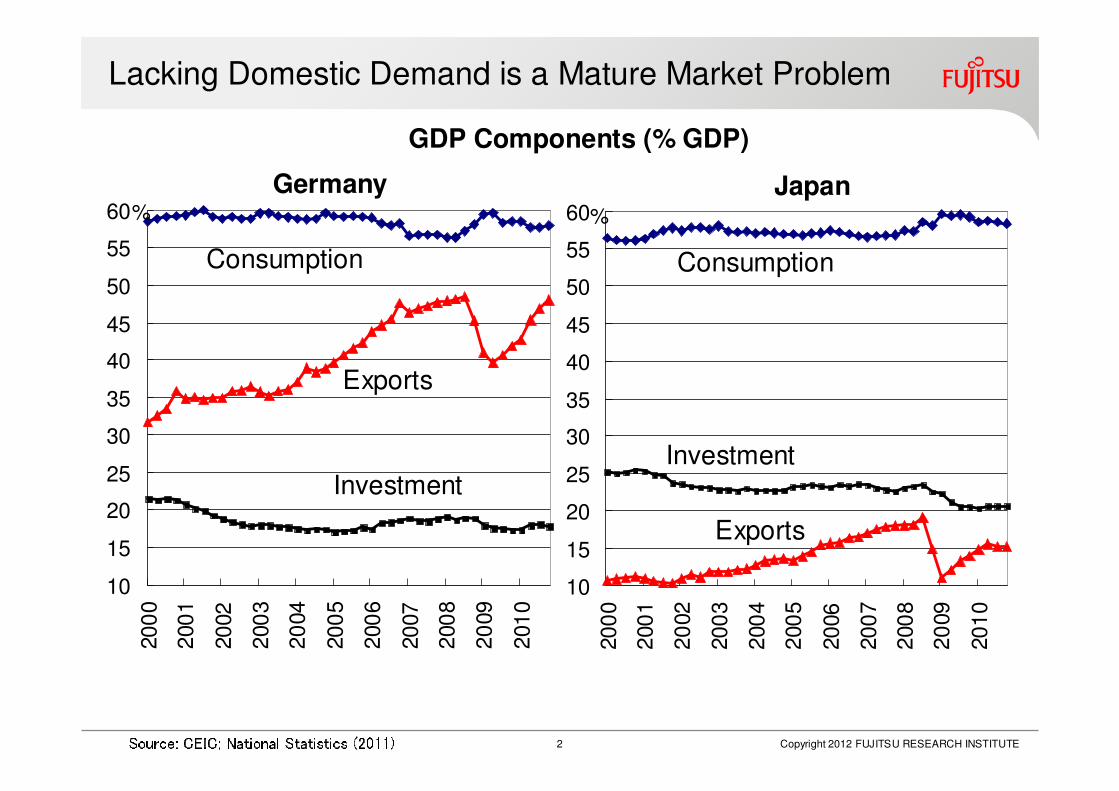
Lacking Domestic Demand is a Mature Market Problem
Source: CEIC; National Statistics (2011)GDP Components (% GDP)
10
15
20
25
30
35
40
45
50
55
60
200
0
200
1
2002
200
3
20
04
200
5
200
6
2007
200
8
20
09
201
0
10
15
20
25
30
35
40
45
50
55
60
200
0
200
1
20
02
200
3
200
4
200
5
2006
200
7
200
8
20
09
201
0
Germany Japan
Consumption
Exports
Investment
Consumption
Exports
Investment
% %
Copyright 2012 FUJITSU RESEARCH INSTITUTE2

0.51.52.53.54.55.56.57.5
1989 1990 1991 1992 1993 1994 1995 1996 1997 1998 1999 2000 2001 2002 2003 2004 2005 2006 2007 2008 2009 2010 2011 2012 2013 2014… and Low Growth is an even bigger Problem
Note: 10-year moving averages roughly correspond with long-run potential output growth. Pre-Crisis data are from IMF-WEO 2008.04, post-crisis data from IMF-WEO 2009.09. Source: © FRI 2009. Data from IMF WEO. Real (Potential) GDP Growth Forecast 2009Real (Potential) GDP Growth Forecast 2009Real (Potential) GDP Growth Forecast 2009Real (Potential) GDP Growth Forecast 2009----2014201420142014
Copyright 2010 FUJITSU RESEARCH INSTITUTE3
JapanJapanJapanJapanEurozoneEurozoneEurozoneEurozoneEU27EU27EU27EU27 USUSUSUSEmerging & Emerging & Emerging & Emerging & Developing Developing Developing Developing MarketsMarketsMarketsMarketsWorldWorldWorldWorldGDPGDPGDPGDPShareShareShareShare2014201420142014 Advanced Economies, 48.8CEE3.7CIS,4.8MEA, 7.6Asia 5.3China, 15.4India, 5.7Latin A. 8.5Copyright 2012 FUJITSU RESEARCH INSTITUTE3Source: © FRI 2009. Data: IMF (2009).
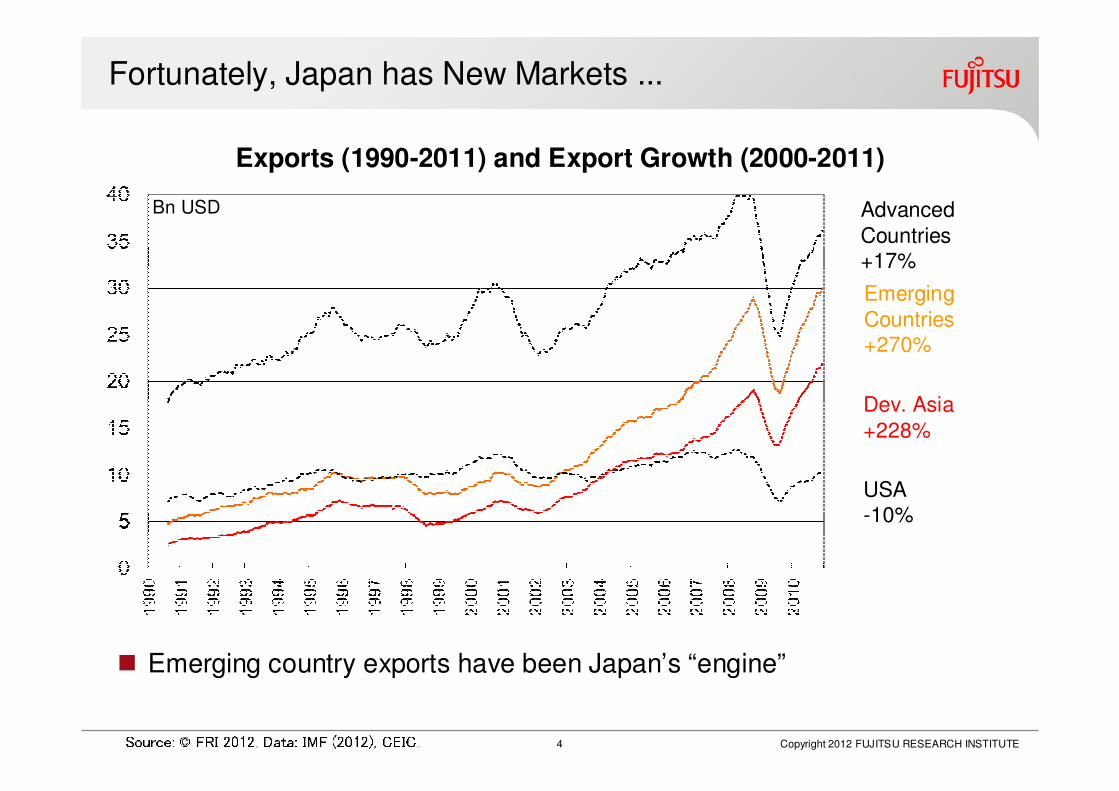
Fortunately, Japan has New Markets ...
Exports (1990-2011) and Export Growth (2000-2011)
Advanced
Countries+17%
USA-10%
Dev. Asia
+228%
Copyright 2012 FUJITSU RESEARCH INSTITUTE4
Bn USD
Emerging
Countries+270%
� Emerging country exports have been Japan’s “engine”Source: © FRI 2012. Data: IMF (2012), CEIC.
All Rights Reserved, Copyright Fujitsu Research Institute 20105
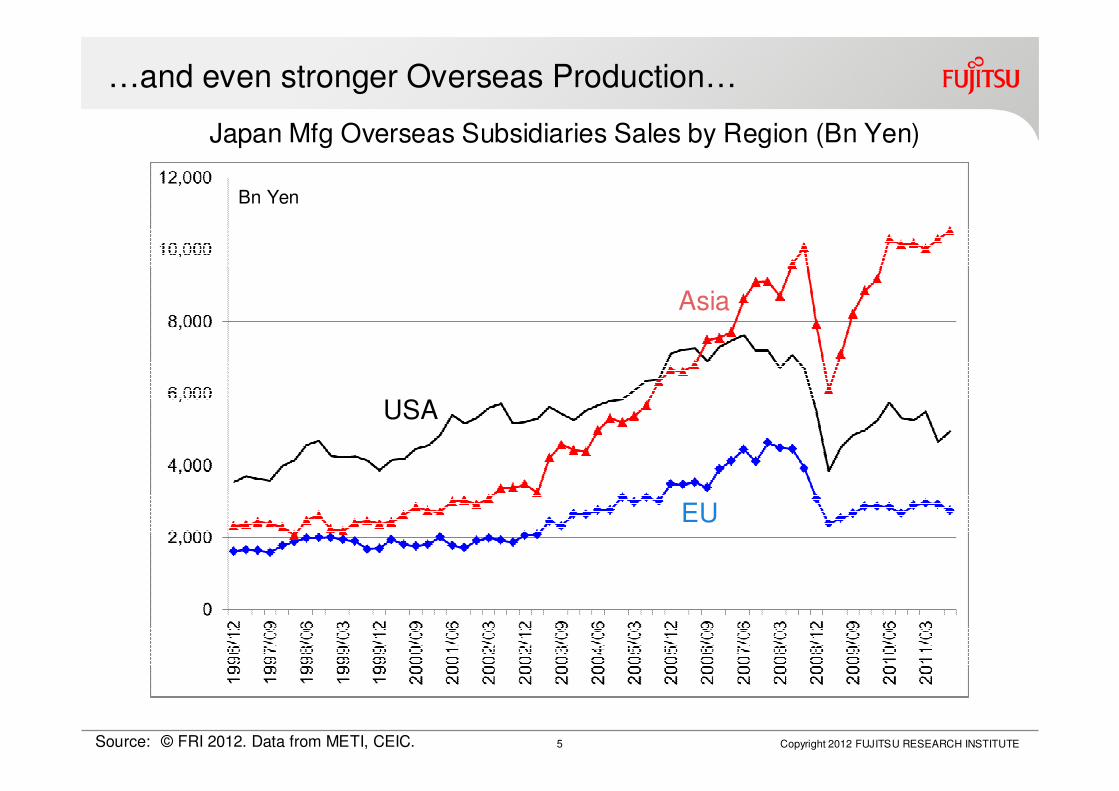
…and even stronger Overseas Production…
Source: © FRI 2012. Data from METI, CEIC.
Japan Mfg Overseas Subsidiaries Sales by Region (Bn Yen)
Bn Yen
Copyright 2012 FUJITSU RESEARCH INSTITUTE5
USA
Asia
EU

All Rights Reserved, Copyright Fujitsu Research Institute 20106
…which is necessary to keep Asia growing
Source: © FRI 2012. Data from METI, CEIC.
Japan Mfg Overseas Subsidiaries Sales by Sector (Bn Yen)
Bn Yen (right scale) Bn Yen
Copyright 2012 FUJITSU RESEARCH INSTITUTE6
Cars Machines
Other Mfg
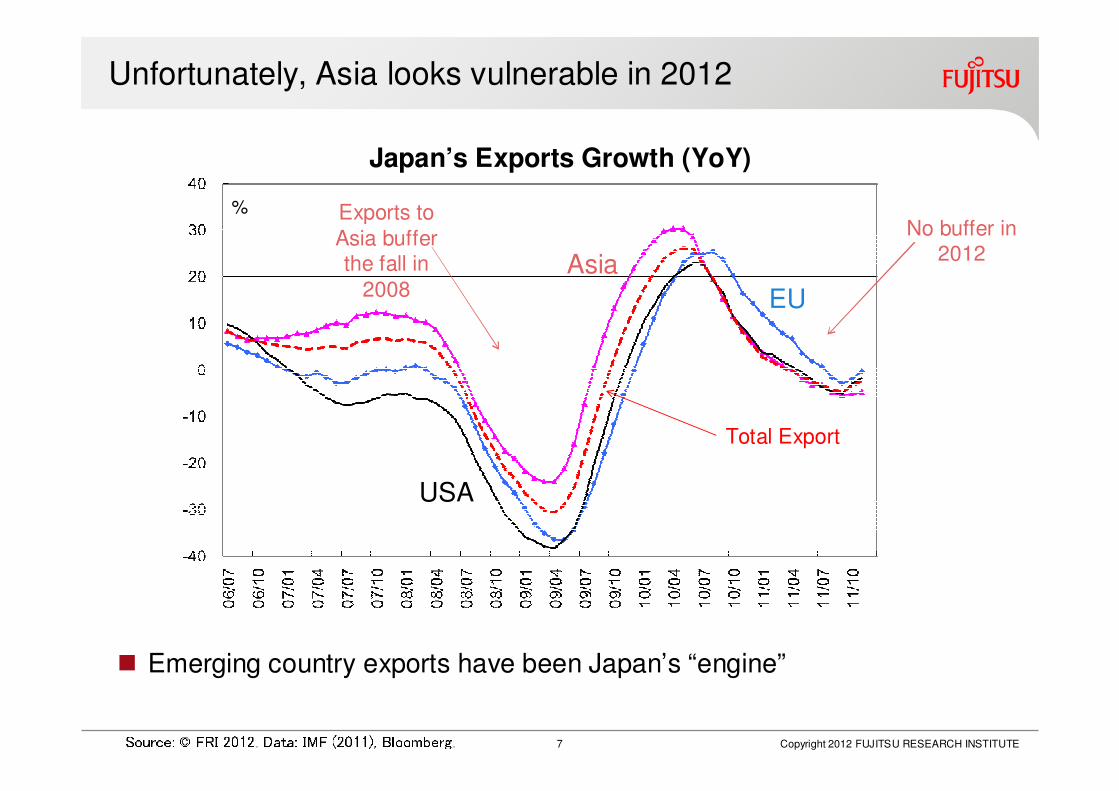
Unfortunately, Asia looks vulnerable in 2012
Japan’s Exports Growth (YoY)
Exports to
Asia buffer the fall in
2008
USA
Total Export
Copyright 2012 FUJITSU RESEARCH INSTITUTE7
%
Asia
� Emerging country exports have been Japan’s “engine”Source: © FRI 2012. Data: IMF (2011), Bloomberg.EU
No buffer in 2012

…with Japan‘s Machines and Parts being less affected?
Korea’s Trade Balance (2008; Bn USD)
Copyright 2012 FUJITSU RESEARCH INSTITUTE8
� Much of Asia’s exports are linked to “processing trade” for final production
� Korea, not Japan, has becoming the “exporting center” in Asia
� Japan, producing sophisticated parts, captures most value added of final products
� When “final markets” in the US and the EU went down, Japan was hit the worst
� When “processing markets” in Asia are slowing, Japan should be less affectedSource: © FRI 2012. Data: IMF (2012), CEIC.Export Import Balance 2011.08
China 91.39 76.93 14.46 4.05
EU 58.37 39.98 18.39 0.10
US 46.38 38.36 8.02 -0.06
Japan 28.25 60.96 -32.71 -2.56Importing from Japan to Export to Asia

Global Trade Shifts continue: “New Silk Road”
Source: © FRI 2010. Map: Wikipedia. � New Silk RoadNew Silk RoadNew Silk RoadNew Silk Road
� Africa Export to Asia +20% YoY from 2000 (China +50% YoY)Africa Export to Asia +20% YoY from 2000 (China +50% YoY)Africa Export to Asia +20% YoY from 2000 (China +50% YoY)Africa Export to Asia +20% YoY from 2000 (China +50% YoY)� New Trade Centers: Singapore, Dubai, Istanbul, Hong KongNew Trade Centers: Singapore, Dubai, Istanbul, Hong KongNew Trade Centers: Singapore, Dubai, Istanbul, Hong KongNew Trade Centers: Singapore, Dubai, Istanbul, Hong Kong
Copyright 2010 FUJITSU RESEARCH INSTITUTE9 Copyright 2012 FUJITSU RESEARCH INSTITUTE9
Copyright 2012 FUJITSU RESEARCH INSTITUTE10
Asia ex China & HK
China & HK
Europe
USA
Africa
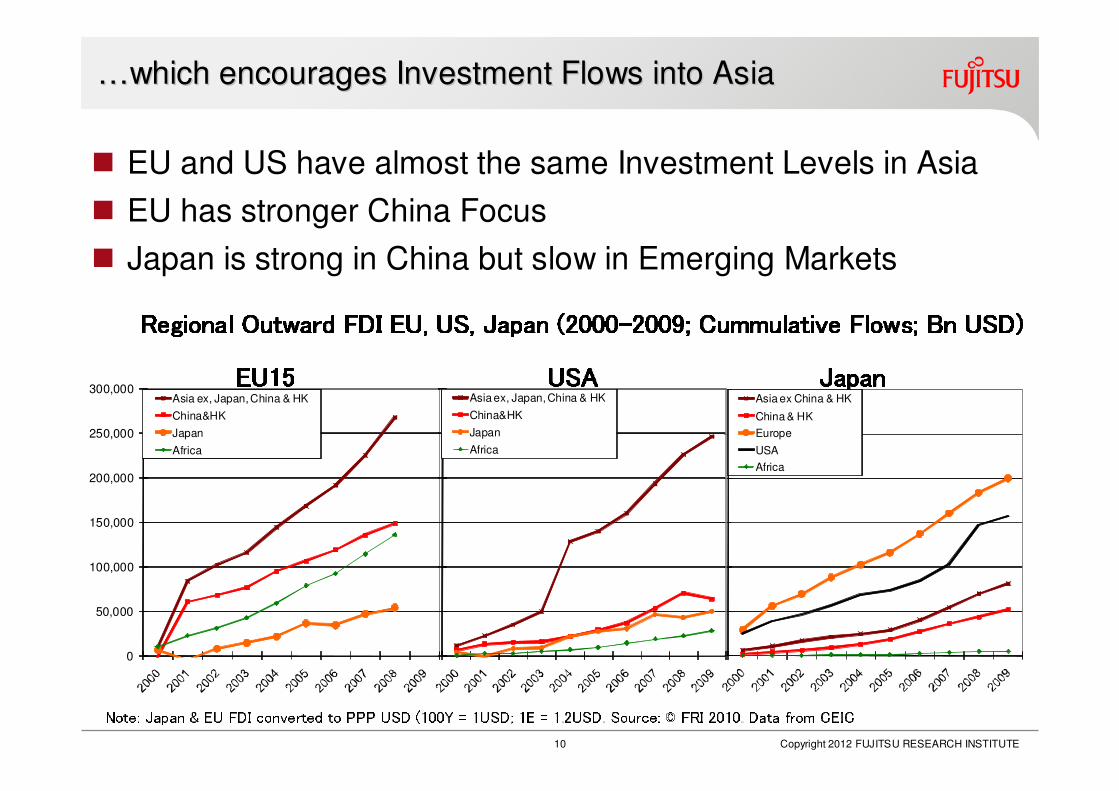
� EU and US have almost the same Investment Levels in Asia
� EU has stronger China Focus
� Japan is strong in China but slow in Emerging Markets
…which encourages Investment Flows into Asia …which encourages Investment Flows into Asia
0
50,000
100,000
150,000
200,000
250,000
300,000Asia ex, Japan, China & HK
China&HK
Japan
Africa
Asia ex, Japan, China & HK
China&HK
Japan
Africa
Regional Outward FDI EU, US, Japan (2000Regional Outward FDI EU, US, Japan (2000Regional Outward FDI EU, US, Japan (2000Regional Outward FDI EU, US, Japan (2000----2009; Cummulative Flows; Bn USD)2009; Cummulative Flows; Bn USD)2009; Cummulative Flows; Bn USD)2009; Cummulative Flows; Bn USD)Note: Japan & EU FDI converted to PPP USD (100Y = 1USD; 1E = 1.2USD. Source: © FRI 2010. Data from CEIC
EU15EU15EU15EU15 USAUSAUSAUSA JapanJapanJapanJapan

11
…the Main Wave of Overseas Investment is just coming
11
Crossborder M&A (Number of Deals)
Korea(right scale)
Source: © FRI 2012. Data from Bloomberg. Copyright 2012 FUJITSU RESEARCH INSTITUTE
Japan
(right scale)
Germany(right scale)
USA
Deal Numbers
Note: US Cross-border
Deals exclude North America.

12
Japan’s Investment remains Balanced
12
Crossborder M&A (Number of Deals)
Korea
Note: US Cross-border Deals exclude North America. Source: © FRI 2011. Data from Bloomberg. Copyright 2012 FUJITSU RESEARCH INSTITUTE
Japan
Germany
USA

Copyright 2012 FUJITSU RESEARCH INSTITUTE13
Opening Up
� Japan’s manufacturers increasingly shift production, R&D, and management closer to their overseas markets, especially in Asia
� The focus on overseas investment and subsidiaries requires more cooperation with foreign partners
� Foreign companies in Japan gain strong advantages in dealing with their Japanese partners – at home and abroad

Copyright 2012 FUJITSU RESEARCH INSTITUTE14
Why has Japan been Stuck for so long?
� From “over-investment” to restructuring
� Ageing and Adjustment

15The Roots of Japan‘s „Lost Decades“
� Japan’s underperformance after 1991 has been well-researched� Ageing: Low demand, slow structural change, decreasing innovation� Structural Change: Price level adjustment (deflation), shift from manufacturing to services, insufficient labor markets and corporate turn over (entry/exit) � Governance: Low profitability, low globalization, over-regulated services, local monopolies, ineffectual policy processes
� Put together, a model of a stable equilibrium on a down-trend emerges. Are we willing to believe this?� Maybe: Most structural explanations of Japan’s malaise are convincing� Maybe: Policy recommendations to fix the problem have gone nowhere: money has been printed, public debt has sky-rocketed, and structural reforms have been unwanted � BUTBUTBUTBUT most economists continue to think that a market economy eventually heals itself and finds a path to sustainable growth
� A fresh look at the “engine of growth” supports optimism� Investment is the driving force of growth, in Japan 65% of growth come from capital investment� But “net investment” has been falling over two decades because companies needed to adjust their high capital stocks to a mature, ageing society� Today, adjustment might have run its course, and recovering net investment might put some sparkle back into Japan’s dormant economy Copyright 2012 FUJITSU RESEARCH INSTITUTE15

Copyright 2012 FUJITSU RESEARCH INSTITUTE
Japan’s “Over-Investment” has been a Driver and a Brake
Source: © FRI 2011. Data: EU-KLEMS (2011), CEIC 2011.Gross Investment Rates (% GDP)
� High investment rates beyond 30% pushed growth until the 1970s� Deleveraging after 1990 to 20% resulted in depression and deflationNote: Ratio of Gross Fixed Capital Formation over GDP. The dotted line is the centered 3-year moving average of the GDP growth rate..
16
USA
Japan
Germany
Japan GDP Growth(right scale)

Companies had to restructure
Overseas, M&A
New entry
Venture
ProfitProfit
SalesSales
Sales stagnates, Sales stagnates, Sales stagnates, Sales stagnates, but profit is but profit is but profit is but profit is generated by cost generated by cost generated by cost generated by cost cuttingcuttingcuttingcutting Sales and profit are Sales and profit are Sales and profit are Sales and profit are both increasingboth increasingboth increasingboth increasingSales and profit Sales and profit Sales and profit Sales and profit both decline; forced both decline; forced both decline; forced both decline; forced to leaveto leaveto leaveto leave Sales increase, but Sales increase, but Sales increase, but Sales increase, but profits do not followprofits do not followprofits do not followprofits do not followMost Japanese
companies are here
Copyright 2012 FUJITSU RESEARCH INSTITUTE17

…while the Population has been Ageing
5050505055555555606060606565656570707070757575751950195019501950 1955195519551955 1960196019601960 1965196519651965 1970197019701970 1975197519751975 1980198019801980 1985198519851985 1990199019901990 1995199519951995 2000200020002000 2005200520052005 2010201020102010 2015201520152015 2020202020202020 2025202520252025 2030203020302030 2035203520352035 2040204020402040 2045204520452045 2050205020502050ChinaChinaChinaChina IndiaIndiaIndiaIndia JapanJapanJapanJapan KoreaKoreaKoreaKoreaSource: © FRI 2010; Data from UN.
9.9%9.9%9.9%9.9% 4.3%4.3%4.3%4.3% 1.2%1.2%1.2%1.2%6.9%6.9%6.9%6.9% 4.1%4.1%4.1%4.1%
GDPGDPGDPGDP Growth Rate Growth Rate Growth Rate Growth Rate ((((JapanJapanJapanJapan)))) GDPGDPGDPGDP Growth Rate Growth Rate Growth Rate Growth Rate (Korea)(Korea)(Korea)(Korea)Copyright 2010 FUJITSU RESEARCH INSTITUTE18
% Working Age% Working Age% Working Age% Working AgeCopyright 2012 FUJITSU RESEARCH INSTITUTE18

Copyright 2012 FUJITSU RESEARCH INSTITUTE
“Net” Investment has been falling due to Capital Depreciation
Source: © FRI 2011. Data: KLEMS (2011)Real Fixed Investment (%GDP)
19
� The two “industrial” economies Japan and Germany are well-known for their high levels of investment (of about 25% GDP)� But the historically accumulated capital stock also led to high capital consumption (costs), which dragged the economies through depreciation� “Net” real investment, which is an indicator for quality adjusted “new”investment, has been falling from the 90s� “Maintenance” of an ageing capital stock dominated “future” investment
GermanyJapanUSA
Note: Investment as Real Gross Fixed Capital Formation (RGFCF). Deflated by 1995 asset prices.Capital Cons. Gross InvestmentCapital Cons.Net Investment Capital Cons.Gross Investment Gross InvestmentNet Investment Net Investment

Copyright 2012 FUJITSU RESEARCH INSTITUTE
Investment Cycle: Where are we now?
Source: © FRI 2011. Data: KLEMS (2011), CEIC 2011.Real Net-Investment (% GDP)
Japan
Germany
USANote: Investment data are estimates for real net fixed capital formation. Forecasts from 2007 (J: 2006), based on GDP Statistics.“Level Correction”
in Japan, Germany
“IT Bubble”
“Undershooting”in Japan
20
Strong Depreciation Pressure in Japan
- Capital investment
deceleration from “high growth”
- Bubbles
- “Bottom Out” at 6%?
ICT Boom in US
& Germany

21Why has Japan’s Net-Investment been Falling so steeply?
� During structural change, depreciation can over-shoot lastingly� Depreciation of the capital stock can last up to 30 years (for buildings, which constitute 50% of Japan’s capital stock)� New (gross) investment is used to “maintain” and restructure the existing capital stock; i.e. “writing off” a venture requires downsizing investment� New (net) investment into ventures becomes a function of what is left after downsizing and maintenance requirements
� In ageing economies, slowing demand and deflation become an additional drag� Restructuring of the capital stock (cost cutting) becomes the engine of growth� Price dumping, to keep the existing capital stock employed, reduces incentives for investment in “new” ventures� Deflation becomes as much a consequence as a cause of (net) disinvestmentCopyright 2012 FUJITSU RESEARCH INSTITUTE21

JapanUSA
Copyright 2012 FUJITSU RESEARCH INSTITUTE
Capital Efficiency has already recovered…
Source: © FRI 2011. Data: KLEMS (2011)Investment Rate (I/Y) vs. Capital Efficiency (DY/DK) (%)
22
� Economic growth is determined by the rate of investment and the efficiency of capital DY = I/Y * DY/DK� While investment rates are bottoming out, capital efficiency has already recovered on strong cost-cutting
� Increasing investment on basis of high capital efficiency would provide a major boost to growth Note: DY/DK is the ratio of yearly growth of value added (production) over capital input growth; I/Y is the ratio of yearly change in capital stock (investment) over value added; DY is the yearly change of value added. All ratios in percent..I/Y
DY
DY/DK (right scale)
I/Y
DY
DY/DK (right scale)

…with even higher Potential in the huge Service Sector
Source © FRI 2011. Data From Corporate Financial Statement Statistics.4040404060606060808080801001001001001201201201201401401401401961196119611961196319631963196319651965196519651967196719671967196919691969196919711971197119711973197319731973197519751975197519771977197719771979197919791979198119811981198119831983198319831985198519851985198719871987198719891989198919891991199119911991199319931993199319951995199519951997199719971997199919991999199920012001200120012003200320032003200520052005200520072007200720072009200920092009
All IndustryAll IndustryAll IndustryAll Industry MfgMfgMfgMfg Non-MfgNon-MfgNon-MfgNon-MfgCapital Efficiency = Value Added / Fixed Assets
Copyright 2012 FUJITSU RESEARCH INSTITUTE23

All Rights Reserved, Copyright Fujitsu Research Institute 201024
Services are now Profitable
Source: © FRI 2012. Data from BOJ Tankan Survey.
74 75 76 77 78 79 80 81 82 83 84 85 86 87 88 89 90 91 92 93 94 95 96 97 98 99 00 01 02 03 04 05 06 07 08 09 10
-1.0
0.0
1.0
2.0
3.0
4.0
5.0
6.0
7.0
(%)
FY (Forec
Mfg Large Companies
Non-Mfg Large CompaniesNon-Mfg Linear Trend
Recession
Mfg Linear Trend
?
!
Profit Rates (%; Profit/Sales)
Copyright 2012 FUJITSU RESEARCH INSTITUTE24
� Service profits have increased, producing opportunities inbusiness services, health care, retail, …

Copyright 2012 FUJITSU RESEARCH INSTITUTE25
ROEProfit
Margin ROAEarning Margin ROI Firms
Automobiles & Components 23 6 8 14 13 5
Capital Goods 17 10 10 20 14 10
Commercial & Professional Services 26 8 13 14 18 5
Consumer Durables & Apparel 23 12 13 16 16 4
Consumer Services 21 7 10 19 14 7
Energy 31 12 12 21 23 2
Food & Staples Retailing 16 6 7 16 14 4
Health Care Equipment & Services 18 16 13 29 16 3
Household & Personal Products 25 13 19 26 23 2
Materials 17 9 9 20 12 7
Media 15 4 11 15 18 1
Pharmaceuticals, Biotechnology & Life Sciences 14 13 9 25 12 8
Real Estate 25 8 8 11 13 3
Retailing 25 10 10 18 15 10
Semiconductors & Semiconductor Equipment 19 13 11 20 14 3
Software & Services 22 14 14 28 19 17
Technology Hardware & Equipment 16 10 9 125 13 9
Telecommunication Services 35 7 4 31 9 1
Average 20 11 11 30 15 101
Services already dominate the Topix Profitability Ranking
Source: © FRI 2012. Data from Bloomberg.
Note: Topix Top 100, ranked by weighted profit indicators.
Topix Top 100 – Profit Ranking by Sector

Copyright 2012 FUJITSU RESEARCH INSTITUTE26
What happens in Europe?
� Europe’s Crisis is a major Opportunity

-5.00 -3.00 -1.00 1.00 3.00 5.00 7.00 9.00
All Industry
Manufacturing
Chemical
Electrical
Transport Equip.
Wholesale & Retail
Transp., Comm.
Finance
Government
Education
Health
Hours Worked
Labor Quality
ICT Capital Service
Non-ICT Capital Service
TFP
13.3
Japan grows on Restructuring Investment
Source: © FRI 2011, Data from EU KLEMS Database. Japan Productivity Contribution to Value Added Growth
(2003-2006; % Average)
27 Copyright 2012 FUJITSU RESEARCH INSTITUTE27
Non-ICT Investment
Labor Input
Labor QualityICT Investment
Non-ICT InvestmentTFP (Innovation)
� Non-ICT Investment
Japanese “Old Industry” grows by investing in production processes

-5.00 -3.00 -1.00 1.00 3.00 5.00 7.00 9.00
All Industry
Manufacturing
Chemical
Electrical
Transport Equip.
Wholesale & Retail
Transp., Comm.
Finance
Government
Education
Health
Hours Worked
Labor Quality
ICT Capital Service
Non-ICT Capital Service
TFP
9.2
Europe grows on Restructuring Innovation
Source: © FRI 2011, Data from EU KLEMS Database.
Germany Productivity Contribution to Value Added Growth(2003-2006; % Average)
28 All Rights Reserved, Copyright Fujitsu Research Institute 2010Copyright 2012 FUJITSU RESEARCH INSTITUTE28
TFP (Innovation)
Labor Input
Labor QualityICT Investment
Non-ICT InvestmentTFP (Innovation)
� Total Factory Productivity (TFP Innovation)
German “Old Industry” increases productivity by trading & value added services

-20% 0% 20% 40% 60% 80% 100%
China (95-00)
China (00-04)
China (04-08)
Korea (95-00)
Korea (00-04)
Korea (04-08)
Copyright 2012 FUJITSU RESEARCH INSTITUTE29
Everybody competes with Asia, which Invests & Innovates
Source: © FRI 2012. Data: CEICProductivity Contribution to GDP Growth
TFP Innovation
GDP GrowthContribution
Non-ICT Capital
ICT
Labor Quality
Work Hours
� China’s economy shifts from being “input-driven” to innovation
� Contribution of labor to GDP is already falling
� As in Korea earlier, sky-high investment rates of around 40% should start falling soon
China (20-24)?
China (15-19)?
China (10-14)?
+8.3% GDP
+9.0% GDP
+10.4% GDP
GDP+4.8%
GDP+4.5%
GDP+5.0%

-10
-5
0
5
10
15
20
25
30
2002 2003 2004 2005 2006 2007 2008 2009 2010 2011
Optics
Vehicles
Machinery
Copyright 2012 FUJITSU RESEARCH INSTITUTE30
China Competition Heating Up in Machinery, Vehicles
Source: © FRI 2012. Data: CEIC
China’s Trade Balance (Ex-Im) by Major Product Group
Machinery
Vehicles
Optics
Bn USD

31
EU Markets are Key to Global Investment
� EU after the Crises: What has Changed?
� Euro not at Risk, but loses Stability Bonus
� Strong Switch to Restrictive Policy
� Growth Centers in the South & East Slow-down
� Eastern Europe Recovery on EU-wide Rationalization
� End of EU Integration?
� Speeding up Fiscal and Political Integration
� More Euro-wide Market Integration (Regulation, Enforcement)
� Slow-down of EU Enlargement (but Turkey EPA, Mediterranean Club)
� More FTA/EPAs (ASEAN, Korea, India, Russia, China ...)
� Continued Strong Market Integration
Copyright 2010 FUJITSU RESEARCH INSTITUTECopyright 2012 FUJITSU RESEARCH INSTITUTE31

80100120140160180200220 1982 1983 1984 1985 1986 1987 1988 1989 1990 1991 1992 1993 1994 1995 1996 1997 1998 1999 2000 2001 2002 2003 2004 2005 2006 2007 2008 2009 2010 0.10.30.50.70.91.11.31.5EU Problems are Internal, not External: Euro Stability
Source: © FRI 2010. Data: CEIC, Bloomberg. Note: Purchasing Power Parities (PPP) based on relative Producer Prices for the period from 1982-2007. Euro Effective Rate 120=1999.Q1.Yen/Euro Rate (left scale)Euro Effective Rate (left scale)USD/EURO PPP (right scale)32
Yen/Euro, Euro Effective Rates and PPPYen/Euro PPP (left scale)
Copyright 2010 FUJITSU RESEARCH INSTITUTE
CrisesCrisesCrisesCrisesCopyright 2012 FUJITSU RESEARCH INSTITUTE32

-20
-15
-10
-5
0
5
Germany Ireland Italy Japan Spain US Portugal Greece
Severe Internal Structural Imbalances...
33
Current Account, Government Lending, and Output Gaps (% GDP AverCurrent Account, Government Lending, and Output Gaps (% GDP AverCurrent Account, Government Lending, and Output Gaps (% GDP AverCurrent Account, Government Lending, and Output Gaps (% GDP Average; 1997age; 1997age; 1997age; 1997----2011)2011)2011)2011)Source: © FRI 2010. Data from IMF – WEO Database.Government
Deficit
Current Account
Deficit
Output
Gap
Current Account
SurplusLong-term Risk of Debt CrisisGermany
IrelandJapan
Italy Spain Portugal Greece
Copyright 2010 FUJITSU RESEARCH INSTITUTE
%GDPUS
Copyright 2012 FUJITSU RESEARCH INSTITUTE33

34
…provide Opportunities for Outsiders
� Service Clusters� Skills, Personnel, R&D� Profits� Service Export, FDI
� Manufacturing Clusters� Mfg Exports� Productivity Growth� R&D, Government Support� Business Service Demand
� Catch-up Growth� Shift to Manufacturing� Technology DemandSource: Eurostat (2009): Narrowing spread in regional Gross Domestic Product.
Copyright 2010 FUJITSU RESEARCH INSTITUTECopyright 2012 FUJITSU RESEARCH INSTITUTE34

35
EU Potentials: Structural Reforms show in Employment
55
60
65
70
75
80
Denmark
Japan
Germany
United States
EU (27 countries)
Poland
Spain
ItalySource: © FRI 2010. Data from EuroStat (2010). Employment Rates (% of Work Population)
Target
Copyright 2012 FUJITSU RESEARCH INSTITUTE35

36
Corporate EU-Strategy: “Growth” vs. “Value”Low Market Growth� Low Growth of Single Markets� High Regional Imbalances� Slow Deregulation� Limited Political Integration High Market Value
� Strong Integration Gains� Cross-border Trade & Investment� Low Japanese Market Share� Globalization & Regulation Leader“Growth” Investment vs. “Value” Investment
�Corporate Strategy in a “Value” Market� EU-wide Distribution� Sourcing in Low Cost Markets� R&D in EU regional Manufacturing Centers� Customer & Shared Services in EU regional Service Centers� Regional Headquarter in Switzerland?
Copyright 2010 FUJITSU RESEARCH INSTITUTESource: © FRI 2012. Copyright 2012 FUJITSU RESEARCH INSTITUTE36

0%
10%
20%
30%
40%
50%
60%
70%
80%
90%
100%
Japan in UK Japan in Germany Japan in Poland
Customer Contact Centre
Recycling
Shared Services Centre
Extraction
ICT
Techn. Support Centre
Education & Training
Maintenance & Servicing
R&D
Business Services
Design, Development
Retail
Headquarters
Logistics, Distribution
Sales, Marketing
Manufacturing
37
Japan’s Corporations in Europe follow “Value” Strategies
Source: © FRI 2010. Data: FT FDI Database. Japan FDI Activities in UK, Germany and Poland (Case Numbers 2003-2009)Sales,Sales,Sales,Sales,HQ,HQ,HQ,HQ,R&DR&DR&DR&DServicesServicesServicesServices Mfg,Mfg,Mfg,Mfg,SalesSalesSalesSalesLogisticsLogisticsLogisticsLogistics
Copyright 2010 FUJITSU RESEARCH INSTITUTECopyright 2012 FUJITSU RESEARCH INSTITUTE37

And don’t forget Turkey…
Source: © FRI 2010. Invest in Turkey (2010) – Foreign Trade; TurkStat (2009); EUC (2009) – Bilateral Trade with Turkey.; EUEUEUEU---->Turkey Trade by >Turkey Trade by >Turkey Trade by >Turkey Trade by Product Group (Mn Euro)Product Group (Mn Euro)Product Group (Mn Euro)Product Group (Mn Euro) 0
5,000
10,000
15,000
20,000
25,000
30,000
0
10,000
20,000
30,000
40,000
50,000
60,000
70,000
2002 3 4 5 6 7 8
EU27 (left scale)
Asia (left scale)
Other Europe
Other Africa
NE/ME
North Africa
Export byExport byExport byExport byRegionRegionRegionRegion(Mn USD)(Mn USD)(Mn USD)(Mn USD)Regional Export DiversificationRegional Export DiversificationRegional Export DiversificationRegional Export DiversificationCopyright 2010 FUJITSU RESEARCH INSTITUTE38 Copyright 2012 FUJITSU RESEARCH INSTITUTE38

0.51.52.53.54.55.56.57.5
1989 1990 1991 1992 1993 1994 1995 1996 1997 1998 1999 2000 2001 2002 2003 2004 2005 2006 2007 2008 2009 2010 2011 2012 2013 2014... Africa & the Middle East
Note: 10-year moving averages roughly correspond with long-run potential output growth. Pre-Crisis data are from IMF-WEO 2008.04, post-crisis data from IMF-WEO 2009.09. Source: © FRI 2009. Data from IMF WEO. Real (Potential) GDP Growth Forecast 2009Real (Potential) GDP Growth Forecast 2009Real (Potential) GDP Growth Forecast 2009Real (Potential) GDP Growth Forecast 2009----2014201420142014
Copyright 2010 FUJITSU RESEARCH INSTITUTE39
Latin America etc.Latin America etc.Latin America etc.Latin America etc.AfricaAfricaAfricaAfricaMiddle EastMiddle EastMiddle EastMiddle East ASEAN5ASEAN5ASEAN5ASEAN5 Emerging & Emerging & Emerging & Emerging & Developing Developing Developing Developing MarketsMarketsMarketsMarketsCopyright 2012 FUJITSU RESEARCH INSTITUTE39

40
EU after the Crisis
� Huge, but difficult market with low macro-growth
� Top-Down Governance Model has reached its limits
� Strong cross-border, integration, rationalization growth
� Advantages for Foreign Corporations through Integration
� Strong potential for “Value Investment” with cross-border strategies
Copyright 2010 FUJITSU RESEARCH INSTITUTECopyright 2012 FUJITSU RESEARCH INSTITUTE40

Copyright 2012 FUJITSU RESEARCH INSTITUTE41
Bottom Line
� Japan’s manufacturer are part of the Asian growth story, which might get a hit in 2012, but continues to depend on Japan’s machines and parts
� Business in Japan, not least in services, remains profitable
� Foreign companies in Japan gain strong advantages in dealing with their Japanese partners – at home and abroad
� Policy is supportive in 2012, but remains to be a drag thereafter
� Japanese companies will have to target the huge EMEA market
� Companies need “value” strategies for cross-border growth as much as “growth” strategies for emerging markets

Copyright 2010 FUJITSU RESEARCH INSTITUTE42