japan - december 2020 regional japanese
TRANSCRIPT

Regional Japanese Offi ce Markets
SPOTLIGHT
Savills Research
Japan - December 2020
2savills.co.jp/research
Regional Japanese Offi ce Markets
Fundamentals remain strong despite the gathering of clouds
GRAPH 2: Median Commuting Time and Places to Work
0%
10%
20%
30%
40%
50%
60%
70%
80%
90%
100%
23 Wards Osaka City Nagoya City Sendai City Fukuoka City Sapporo CityCITIES TO WORK
Live in the same prefecture Live in a different prefecture
Source Ministry of Internal Aff airs and Communications, Savills Research & Consultancy* Median commuting time is based on the Housing and Land Survey in 2018, and statistics on places to work
are based on the National Census in 2015. ** The data for workplaces excludes samples with unknown workplaces.
INVESTMENT-GRADE OFFICES1
As the global pandemic persists, the fundamentals of investment-grade offi ces have been gradually softening. For instance, whilst rental growth has slowed, there have also been cases of extended free rent periods and building owners lowering target rents. Vacancy has gradually increased, though performances diff er depending on offi ce location and quality.
As for rents, growth was strongest in Fukuoka in 2H/2020 at 3.8% year-on year (YoY), followed by Nagoya at 2.7% YoY. Although Osaka is the laggard, it still achieved 2.0% growth YoY.
Whilst demand overall is unlikely to experience strong growth until the economy gains a solid foothold, supply continues to be limited in most submarkets, leading to tight vacancy rates.
Even so, tenants that can leverage the impact of COVID-19, such as beauty clinics, appear to be leasing up more space, which was previously unavailable. Landlords have also become more fl exible, and are now willing to accept such businesses as tenants under these testing times.
Another possible demand driver concerns shared offi ce operators, who have in recent years been trying to snatch up space in new regional offi ce buildings. To be sure, demand for shared offi ce space does not appear as strong in regional cities compared to Tokyo, as those in the former tend to live and work in the same prefecture, or even in the same city, resulting in shorter median commuting times (Graph 2). Demand for satellite offi ces is comparatively weaker as a result. Indeed, the impact of COVID-19 on workplace footfall has been milder in regional cities as well (Graph 3). That said, some shared offi ce operators have been active in regional cities and may see any vacancy loosening as an opportunity to increase space in prime offi ce buildings that were hard to get due to extremely tight vacancy rates, perhaps except in Fukuoka.
ALL-GRADE OFFICES2
The all-grade market continued to soften as the pandemic persisted. Although rents maintained growth on a YoY basis, it has
1 In each of Osaka, Nagoya, and Fukuoka, Savills monitors about 50 “investment-grade” offi ce buildings typically with a GFA of 15,000+ sq m (4,500 tsubo) and a building age of <25 years.2 “All-grade” refers to offi ces typically over 1,000 sq m GFA, depending on the market. Data is sourced from Miki Shoji.
GRAPH 3: Workplace Traffi c, February 2020 to November 2020
-70
-60
-50
-40
-30
-20
-10
0
10
% C
HA
NG
E V
S T
HE
BA
SE
LIN
E D
AY
Tokyo Osaka Aichi Fukuoka Miyagi Hokkaido
Source Google LLC, Savills Research & Consultancy* Google LLC "Google COVID-19 Community Mobility Reports".
https://www.google.com/covid19/mobility/ Accessed: late Nov 2020** The baseline is the median value for the period between Jan 3, 2020 and Feb 6, 2020.
*** We have used a rolling seven-day average to smooth out weekly usage.
Median commuting time in the same prefecture (mins)
41 33 27 25 25 18
GRAPH 1: Investment-grade Offi ce Performance, 2H/2020
0.2% 0.2%
0.1%0.1%
0.7%0.6%
1.2%
0.9%
0.0%
0.2%
0.4%
0.6%
0.8%
1.0%
1.2%
1.4%
1.6%
0
5,000
10,000
15,000
20,000
25,000
30,000
35,000
40,000
45,000
50,000
Tokyo Osaka Nagoya Fukuoka
VA
CA
NC
Y
JPY
/ T
SU
BO
/ M
ON
TH
2019 Rent 2020 Rent 2019 Vacancy 2020 Vacancy
Source Savills Research & Consultancy*Tokyo data represents Grade A offi ce performance in the C5W.
Rent YoY
2.8% 2.0% 2.7% 3.8%
3
Regional Japanese Offi ce Markets
Whilst market fundamentals are still sound, the impact of COVID-19 is being felt. Accordingly, vacancy rates have loosened and rental growth momentum is losing steam. If the downturn is prolonged and large potential vacancy materialises next year as new supply comes online, the direction of the markets may change abruptly.
become somewhat stagnant in Osaka, Nagoya, and Sendai. Vacancy rates, meanwhile, are edging up across the studied markets, with Sendai recording the highest vacancy.
Despite the above, fundamentals appear sound. Vacancy rates remain close to historical lows and some increases are in mild correction territory rather than an outright downturn (Graph 5).
If this recession continues over a prolonged period, however, regional cities, which have fewer head offi ces, appear more vulnerable, with branch offi ces usually fi rst on the chopping block. Indeed, analysis of historical
GRAPH 4: All-grade Offi ce Performance, Q3/2020*
1.6%2.0%
2.2% 2.0%
4.1%
2.4%
3.4%
3.0%3.1% 3.2%
5.2%
2.3%
0%
1%
2%
3%
4%
5%
6%
7%
8%
0
5,000
10,000
15,000
20,000
25,000
30,000
35,000
40,000
Tokyo Osaka Nagoya Fukuoka Sendai Sapporo
VA
CA
NC
Y
JPY
/ T
SU
BO
/ M
ON
TH
2019 Rent 2020 Rent 2019 Vacancy 2020 Vacancy
Source Miki Shoji, Savills Research & Consultancy*Market data as of Sep 2019 and Sep 2020.
data demonstrates that cities with fewer head offi ces relative to offi ce NRAs tend to have higher average vacancy rates in the long term (Graph 6). Furthermore, regions that house companies with a customer base that has a higher exposure to the shrinking population will likely be negatively aff ected (Map 1).
REGIONAL INVESTMENTAccording to the bi-annual investor survey conducted by the Japan Real Estate Institute (JREI) in October 2020, cap rates in all the regional submarkets tightened by 0.1% over the year. Although the same survey shows that expectations for rental growth have somewhat decreased among investors, abundant liquidity continues to fl ow into the Japanese real estate market.
Expected cap rates for all the regional submarkets are already 0.2% to 0.5% below their pre fi nancial crisis levels, though they maintain a risk premium over Tokyo (Marunouchi). Save Osaka and Fukuoka, spreads for Nagoya, Sapporo, and Sendai are not as tight as those observed in 2007, refl ecting investors’ somewhat cautious views on these regional submarkets.
Investment volumes continue to show a declining trend as investors take a wait-and-see stance. Between Q1/2020 and Q3/2020, overall investment volumes declined by 28% compared to the same period in 2019, whilst the offi ce sector saw a decline of 32%. The pandemic has clearly slowed investment activity as investors were unable to conduct due diligence processes effi ciently.
That said, supported by the increasing levels of dry powder, acquisition interest remains strong. As such, some major transactions took place in 2020, especially in Osaka. For instance, Gaw Capital acquired the Toyobo Building from PGIM Real Estate
GRAPH 5: Historical Offi ce Vacancy by City, January 2002 to September 2020
0
5
10
15
20
25
Tokyo C5W Osaka Nagoya Fukuoka Sapporo Sendai
VA
CA
NC
Y R
AT
E (
%)
Min-max range Average Sep 20
Source Miki Shoji, Savills Research & Consultancy
Rent YoY
4.0% 2.3% 2.9% 6.1% 1.9% 3.8%

4savills.co.jp/research
Regional Japanese Offi ce Markets
GRAPH 6: Vacancy Rate vs HQ Workers per a Thousand Tsubo of NRA
Osaka City
Nagoya City
Fukuoka City Sapporo City
Sendai City
Tokyo C5W
4.0%
5.0%
6.0%
7.0%
8.0%
9.0%
10.0%
11.0%
12.0%
100 150 200 250 300 350
AV
ER
AG
E V
AC
AN
CY
(20
02-
SE
P 2
020
)
HQ WORKERS PER A THOUSAND TSUBO OF NRA
Source Ministry of Internal Aff airs and Communications, Miki Shoji, Savills Research & Consultancy*Vacancy rates and NRAs are the averages of the periods between Jan 2002 and Sep 2020.
**The fi gures for HQ workers are based on the Economic Census of 2016.
MAP 1: Head Offi ces in Regional Prefectures and their Branch Offi ces
Source Ministry of Internal Aff airs and Communications, Savills Research & Consultancy*The data is based on the Economic Census of 2016.
in September 2020 for JPY27 billion. This transaction follows others reported earlier in 2020, including Gaw Capital once more, who purchased the Matsushita IMP Building in April for a reported price of JPY39 billion, as well as M&G Real Estate’s purchase of Midosuji Front Tower for JPY33 billion. There are multiple rumours of ongoing transactions in regional cities and this strong trend appears to have legs.
REGIONAL MACRO AND DEMOGRAPHICSJapan has been managing the COVID-19 pandemic relatively well, and the economy has been gradually recovering. After Japan’s GDP contracted by an estimated 29% YoY in Q2/2020, its preliminary fi gure of Q3/2020 shows a reversal of 23% YoY, stronger than widely anticipated.
That being said, economic activity is still falling short of pre-pandemic levels and the recovery will certainly be a protracted process. The Bank of Japan’s Regional Economic Assessment in October 2020 echoed this cautious sentiment by indicating that though the outlook for the Japanese economy has improved, the situation remains severe.
Unsurprisingly, the employment environment continues to be weak across Japan as uncertainty hangs over the global economy. While job-to-applicant ratios remain well above the devastating levels experienced after the fi nancial crisis, they are close to 1.0x in all the major cities we cover. Subsequently, offi ce demand will likely continue to lack drive as companies refrain from securing extra space in expectation of future hiring, as seen prior to the pandemic.
OUTLOOKWhilst society has adjusted to life alongside COVID-19, and the economic conditions have improved, the regional offi ce markets continue to experience a slow deterioration. Although it has not yet fully appeared in the numbers, interviews with market participants indicate that building owners are more willing to negotiate on rents by slightly reducing target rents and off ering free rents. If increases in vacancy materialise next year in response to a jump in supply, rents in regional cities may feel further downward pressure.
That said, an element of this weakening may be explained by the occurrence of a natural correction from years of robust growth, rather than an outright downturn
GRAPH 7: Expected Cap Rates for Grade A Offi ces, 2004 to 2H/2020
1.0%
2.0%
3.0%
4.0%
5.0%
6.0%
7.0%
8.0%
9.0%
1H 2H 1H 2H 1H 2H 1H 2H 1H 2H 1H 2H 1H 2H 1H 2H 1H 2H 1H 2H 1H 2H 1H 2H 1H 2H 1H 2H 1H 2H 1H 2H 1H 2H
04 05 06 07 08 09 10 11 12 13 14 15 16 17 18 19 20
EX
PE
CT
ED
CA
P R
AT
E
Osaka Nagoya Fukuoka Sapporo Sendai Marunouchi
Source Japan Real Estate Institute, Savills Research & Consultancy
Other
OtherOther
Tohoku
Miyagi
Osaka
Kansai
Hokkaido
Other Fukuoka
Kyushu
OtherAichi
Chubu
Branch offi ce location
# of HQs (thousands)
12.4
26.85.4
19.9
12.8

5
Regional Japanese Offi ce Markets
GRAPH 8: Investment Volumes by Area for All Asset Types, 2007 to Q3/2020
0%
10%
20%
30%
40%
50%
60%
70%
80%
90%
100%
PR
OP
OR
TIO
N O
F IN
VE
ST
ME
NT
(%
)
Osaka Nagoya Sapporo Fukuoka Sendai Tokyo Yokohama Other
Source RCA, Savills Research & Consultancy*Transactions where specifi c locations have not been identifi ed are classifi ed as other.
in demand. In fact, some winners from the pandemic may even see an opportunity to expand space in existing investment-grade offi ce buildings, that were previously not available to them.
One market worth mentioning here is Fukuoka. Around six months ago, we expected that a new historical high of offi ce rents might be diffi cult to reach. Now, however, it appears that this has been achieved, albeit with the support from some free rent agreements. Also, overall pre-leasing activity for large supply in 2021 appears to go well. Fukuoka’s market fundamentals may turn out to be stronger than we thought.
Overall, regional markets have thus far benefi ted from supply being stubbornly limited, resulting in solid rental levels. However, as vacancy rates inch up, landlords are likely to become more fl exible, and consider off ering some incentives.
Additionally, there is an increasing amount of potential vacancy, where tenants have decided to move out shortly, but vacancy is not accounted for because the space is still occupied. If demand remains weak, and these tenants move out before new lessees sign up for the space, the currently potential vacancy could materialise next year, negatively aff ecting the market fundamentals. Depending on pre-leasing activity for supply due in 2021 and 2022, as well as secondary vacancy, next year may be a turning point for the regional offi ce markets.
GRAPH 9: Job-to-applicant Ratios, Selected Prefectures, 2000 to September 2020
0.0x
0.5x
1.0x
1.5x
2.0x
2.5x
Tokyo Osaka Aichi (Nagoya)
Fukuoka Miyagi (Sendai) Hokkaido (Sapporo)
Source Ministry of Health, Labour, and Welfare, Savills Research & Consultancy
TABLE 1: BOJ Regional Economic Assessment, October 2020
Source Bank of Japan, Savills Research & Consultancy
REGION TRENDCHANGE VS
JULY 2020
Hokkaido (Sapporo)
“The economy has started to pick up with economic activity resuming gradually, although it has remained in a
severe situation due to the impact of COVID-19”
Tohoku (Sendai)
“The economy has shown signs of a pick-up, although it has been in a severe situation."
Kanto (Tokyo)
“The economy has started to pick up with economic activity resuming gradually, although it has remained in a severe
situation due to the impact of COVID-19 at home and abroad"
Tokai (Nagoya)
"The economy has been picking up, even during the continued severe situation.”
Kinki (Osaka)
“The economy has shown signs of a pick-up recently, although it has remained in a severe situation due to the impact of
COVID-19."
Kyushu (Fukuoka)
“The economy has shown signs of a pick-up, although it has remained in a severe situation due to the impact of COVID-19."
6savills.co.jp/research
Regional Japanese Offi ce Markets
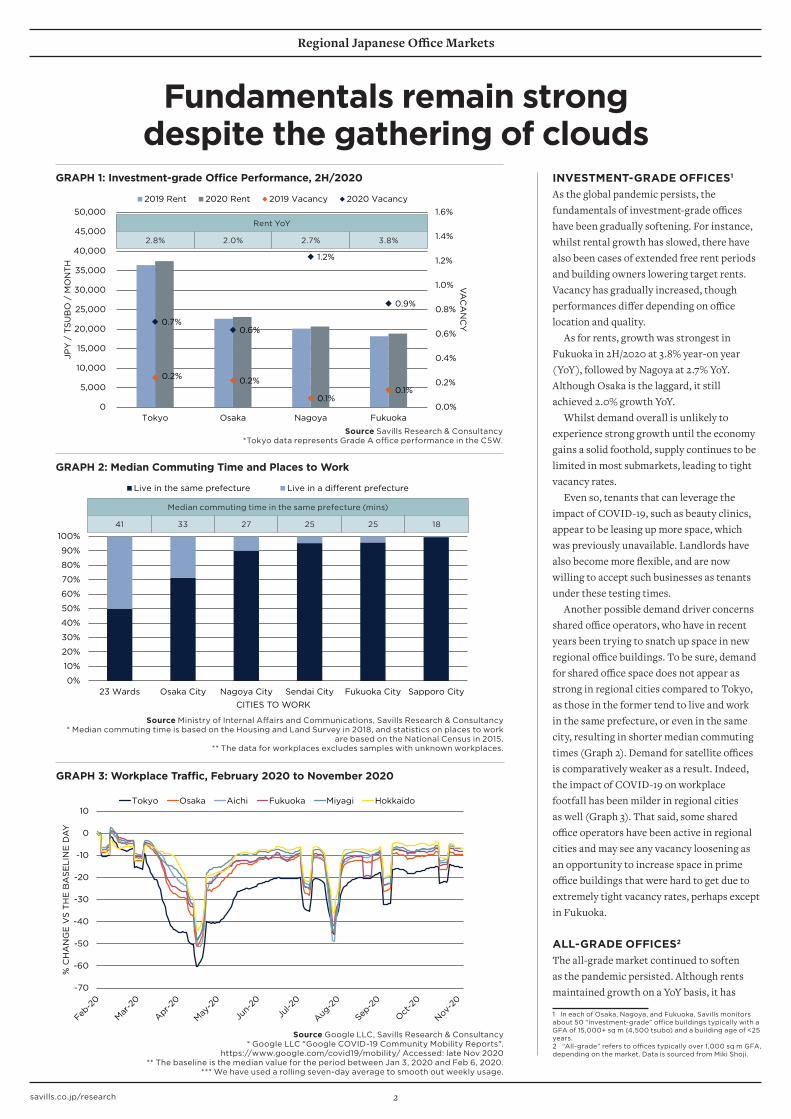
GRAPH 10: New NRA Offi ce Supply In Osaka City, 2006 to 2022
0
10,000
20,000
30,000
40,000
50,000
60,000
70,000
TS
UB
O
Source Sanko Estate, Building Group, Savills Research & Consultancy
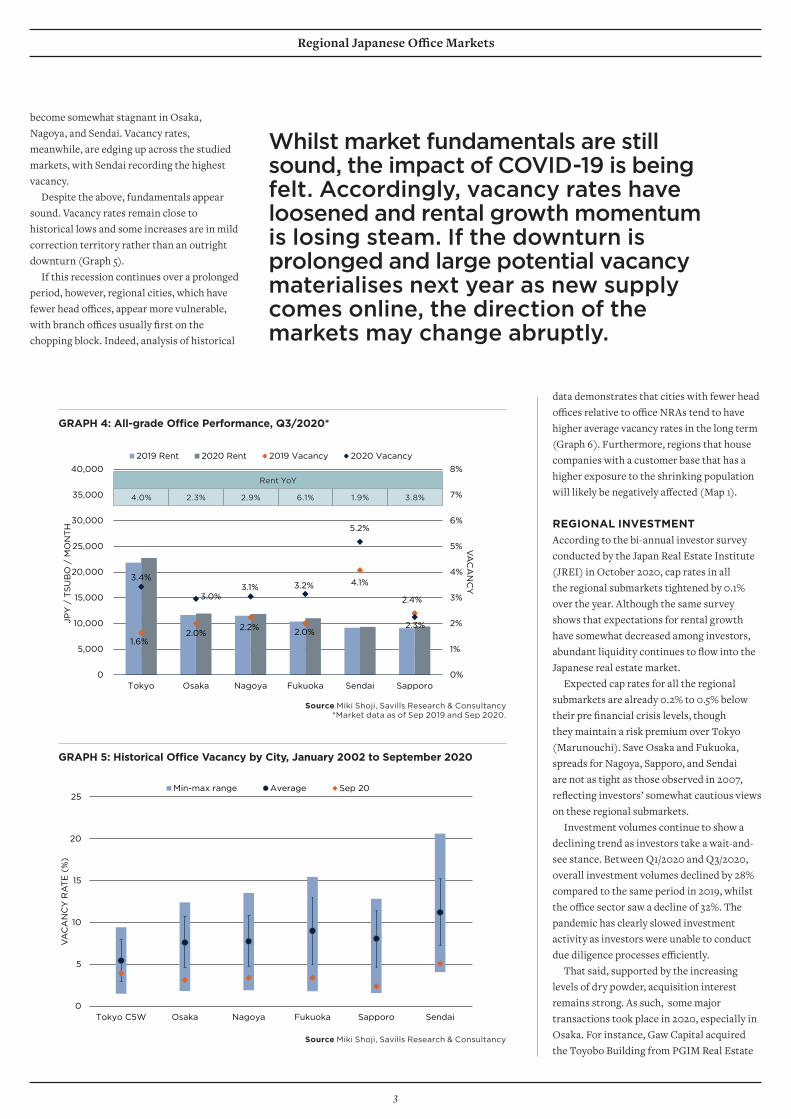
GRAPH 11: Vacancy Rate In Osaka City By Area, 2011 to Q3/2020
0.0%
5.0%
10.0%
15.0%
20.0%
25.0%
2011 2012 2013 2014 2015 2016 2017 2018 2019 2020
VA
CA
NC
Y
Average Umeda Minami-Mori Yodoyabashi-Honmachi Semba Shinsaibashi-Namba Shin-Osaka
Source Miki Shoji, Savills Research & Consultancy
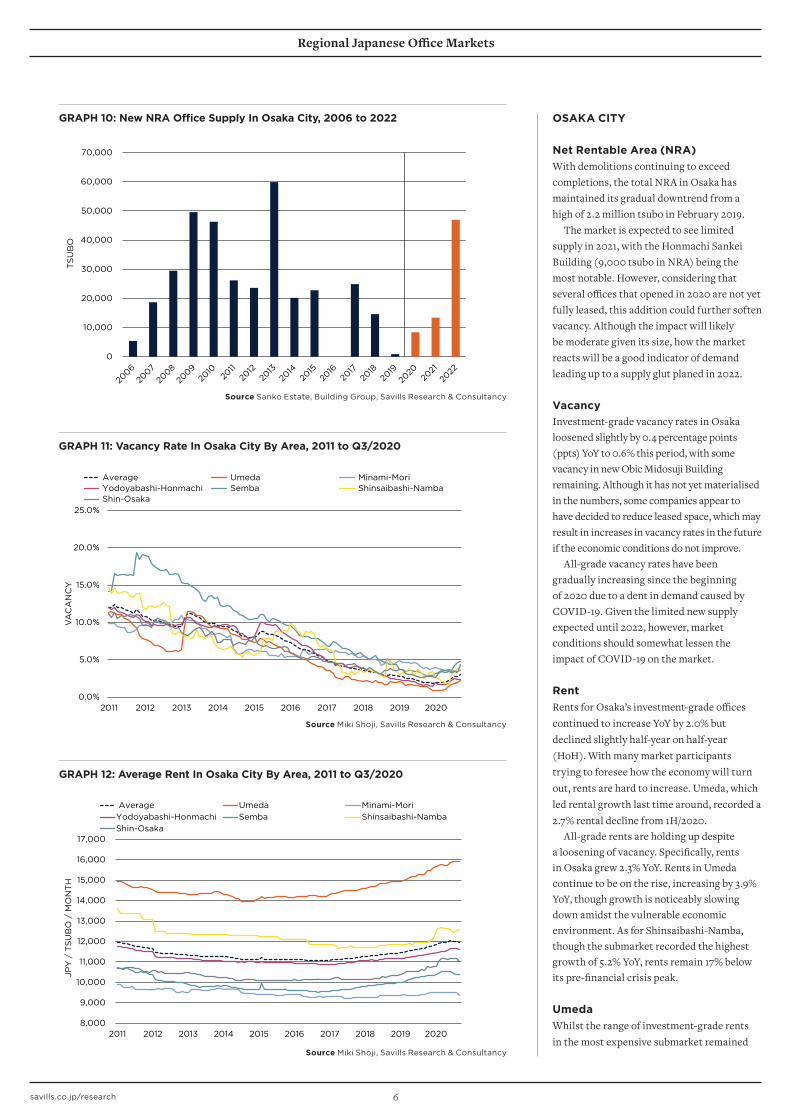
GRAPH 12: Average Rent In Osaka City By Area, 2011 to Q3/2020
8,000
9,000
10,000
11,000
12,000
13,000
14,000
15,000
16,000
17,000
2011 2012 2013 2014 2015 2016 2017 2018 2019 2020
JPY
/ T
SU
BO
/ M
ON
TH
Average Umeda Minami-MoriYodoyabashi-Honmachi Semba Shinsaibashi-NambaShin-Osaka
Source Miki Shoji, Savills Research & Consultancy
OSAKA CITY
Net Rentable Area (NRA)With demolitions continuing to exceed completions, the total NRA in Osaka has maintained its gradual downtrend from a high of 2.2 million tsubo in February 2019.
The market is expected to see limited supply in 2021, with the Honmachi Sankei Building (9,000 tsubo in NRA) being the most notable. However, considering that several offi ces that opened in 2020 are not yet fully leased, this addition could further soften vacancy. Although the impact will likely be moderate given its size, how the market reacts will be a good indicator of demand leading up to a supply glut planed in 2022.
Vacancy Investment-grade vacancy rates in Osaka loosened slightly by 0.4 percentage points (ppts) YoY to 0.6% this period, with some vacancy in new Obic Midosuji Building remaining. Although it has not yet materialised in the numbers, some companies appear to have decided to reduce leased space, which may result in increases in vacancy rates in the future if the economic conditions do not improve.
All-grade vacancy rates have been gradually increasing since the beginning of 2020 due to a dent in demand caused by COVID-19. Given the limited new supply expected until 2022, however, market conditions should somewhat lessen the impact of COVID-19 on the market.
RentRents for Osaka’s investment-grade offi ces continued to increase YoY by 2.0% but declined slightly half-year on half-year (HoH). With many market participants trying to foresee how the economy will turn out, rents are hard to increase. Umeda, which led rental growth last time around, recorded a 2.7% rental decline from 1H/2020.
All-grade rents are holding up despite a loosening of vacancy. Specifi cally, rents in Osaka grew 2.3% YoY. Rents in Umeda continue to be on the rise, increasing by 3.9% YoY, though growth is noticeably slowing down amidst the vulnerable economic environment. As for Shinsaibashi-Namba, though the submarket recorded the highest growth of 5.2% YoY, rents remain 17% below its pre-fi nancial crisis peak.
UmedaWhilst the range of investment-grade rents in the most expensive submarket remained

2H/2020 HOH YOY
Rent 23,100 -0.2% 2.0%
Vacancy 0.6% +0.1ppts +0.4ppts
Top Rent 35,000+ 0 0
TOKYO OSAKA
Real GDP (JPY trillion) (FY2017) 105.4 39.0
Real GDP (YoY%) 0.8 2.9
% of Japan (FY2017) 19% 7%
Population (million) 14.0 8.8
Job to applicant ratio 1.2 1.1
7
Regional Japanese Offi ce Markets
TABLE 2: Osaka Prefecture Key Macro Indicators*
Source Cabinet Offi ce, Osaka Prefectural Government, Savills Research & Consultancy
TABLE 3: Osaka Investment-grade Offi ces
Source Savills Research & Consultancy
unchanged at JPY20,000 to JPY35,000 per tsubo, there are signs that a correction is in progress as average rents declined by 2.7% HoH. Specifi cally, discounts were noticeable among offi ces that were charging over JPY30,000 per tsubo. That being said, demand in this area was still sound, and the vacancy remained airtight at 0.1%. In some cases, tenants moved to smaller but more expensive offi ces, which helped the investment-grade segment.
Yodoyabashi-HonmachiWhilst this submarket saw strong rental growth of 4.7% YoY in 1H/2020, the momentum did not carry over into 2H/2020. Investment-grade rents were unchanged, though vacancy rates did remain anchored at 0.0%.
If the aforementioned Honmachi Sankei Building struggles with its pre-leasing, however, this submarket will see some uptick in vacancy.
Shin-OsakaShin-Osaka still has the highest levels of vacancy in the region at 1.3% – up by 0.4ppts
from 1H/2020. Understandably, new supply, such as S-Building Shin-Osaka (completed in August 2020), has softened the market.
In 2H/2020, investment-grade rents in this submarket ranged between JPY15,000 and JPY25,000. Average rents rose by around 0.6% over the half-year to JPY21,600 per tsubo, though it remained unchanged YoY.
This submarket will welcome multiple waves of new supply from 2020 to 2022, including a PMO building, the offi ce project by West Japan Railway, and the tentatively named Shin-Osaka Dai-Go Doi Building, which could result in a further loosening in vacancy. Indeed, this year’s supply enters a market already facing vacancies, though partly due to the pandemic.
OutlookThe underlying fundamentals in the Osaka market remain fi rm as illustrated by airtight vacancy and rental growth. That said, there are signs of rent corrections in some submarkets as the economic conditions remain bleak. Osaka’s real test is the fi rst wave of supply in 2022. If the economic recovery in 2021 is not suffi ciently strong,
new supply will likely cause vacancy to rise and negatively aff ect rents.
Shared offi ce operators may want to further expand. Although the need for these facilities in Osaka is not as much as Tokyo, there is still a need. Since the market was previously too tight, there should be some pent-up demand. Additionally, some companies may choose to move their operations to shared offi ce space with the economic conditions remaining uncertain.
Overall, Osaka’s market fundamentals still appear sound. Some submarkets, however, may see further rental decreases as vacancy rises.

8savills.co.jp/research
Regional Japanese Offi ce Markets
GRAPH 13: New NRA Offi ce Supply In Nagoya City, 2006 to 2022
0
5,000
10,000
15,000
20,000
25,000
30,000
35,000
40,000
45,000
50,000
TS
UB
O
Source Sanko Estate, Biz Life Agent, Savills Research & Consultancy
GRAPH 14: Vacancy Rate In Nagoya City By Area, 2011 to Q3/2020
0.0%
5.0%
10.0%
15.0%
20.0%
2011 2012 2013 2014 2015 2016 2017 2018 2019 2020
Vac
ancy
Average Meieki Fushimi Sakae Marunouchi
Source Miki Shoji, Savills Research & Consultancy
GRAPH 15: Average Rent In Nagoya City By Area, 2011 to Q3/2020
8,000
9,000
10,000
11,000
12,000
13,000
14,000
15,000
16,000
2011 2012 2013 2014 2015 2016 2017 2018 2019 2020
JPY
/ T
SU
BO
/ M
ON
TH
Average Meieki Fushimi Sakae Marunouchi
Source Miki Shoji, Savills Research & Consultancy
NAGOYA CITY
NRAOffi ce supply added this year in Nagoya has been well below long-term averages. In fact, the NRA has actually declined to below 1 million tsubo as of September 2020, which is the lowest level in fi ve years.
In 2021, the largest single project announced thus far is the tentatively named Noritake Forest Project, located north of the Meieki submarket. The multi-purpose complex is expected to add approximately 6,800 tsubo of NRA to the market. Although the project is gaining interest thanks to its unique concept of offi ce space in a shopping mall, it appears to be struggling to secure tenants probably due to its distance from Nagoya as well as target rents.
Beyond 2021, the next signifi cant jump is slated for 2023. Here, the redevelopment of the Chunichi Building, located in the Sakae submarket, is poised to add over 10,000 tsubo of NRA to the market.
Meanwhile, Meitetsu’s redevelopment project around Nagoya station is now on hold. What’s more, the delay in the Chuo Shinkansen (the Maglev line) development, amid some disagreements, could add another layer of uncertainly for the redevelopment project.
VacancyThe damage wrought by the global pandemic has unsurprisingly continued into 2H/2020. Despite the clear economic hardship, however, the investment-grade offi ce market in Nagoya remains tight. To wit, vacancy rates over the year have gone from non-existent to around 1.2%. Global Gate West Tower is again the main culprit, with rates creeping higher once more.
The global pandemic is clearly having an impact on the all-grade market too. Here, the vacancy rate has breached the 3.0% mark for the fi rst time since mid-2018.
RentMuch like vacancy rates, the impact of COVID-19 has started to weigh on both investment-grade and all-grade rents. To be sure, rents in the former did experience an uptick to approximately JPY20,700 per tsubo. The momentum seems to be fi zzling out, however, with the rate of growth noticeably slowing to 2.7% YoY in 2H/2020 – the lowest on record.
The story was very similar for all-grade rents, with a matching growth rate to boot

9
Regional Japanese Offi ce Markets
2H/2020 HOH YOY
Rent 20,700 -0.1% 2.7%
Vacancy 1.2% +0.5ppts +1.2ppts
Top Rent 35,000+ -2,000 -1,000
TOKYO AICHI
Real GDP (JPY trillion) (FY2017) 105.4 38.6
Real GDP (YoY%) 0.8 2.9
% of Japan (FY2017) 19% 7%
Population (million) 14.0 7.5
Job to applicant ratio 1.2 1.0
TABLE 4: Aichi Prefecture Key Macro Indicators*
Source Cabinet Offi ce, Aichi Prefectural Government, Savills Research & Consultancy
TABLE 5: Nagoya Investment-grade Offi ces
Source Savills Research & Consultancy
in 2H/2020. Like last time, Sakae is the laggard, with growth now grinding to a halt. Elsewhere, despite the material softening of vacancy rates, Meieki continues to demonstrate the benefi ts of location and quality. Here, rental growth remained a solid 4.9% YoY, further widening its premium compared to its peers.
MeiekiMeieki remains the most expensive submarket in the Nagoya region thanks to its convenience and quality. Yet, perhaps as a result, it was also the only submarket to see rents unmoved over the year at around JPY28,300 per tsubo. The submarket’s premium over the next in line, Fushimi, whilst still over 50%, has contracted by 5.0ppts as a result.
With the overall momentum weakened by the impact of COVID-19, the towers around the station have witnessed rents slightly soften to JPY35,000 per tsubo in 2H/2020.
Meanwhile, partly as a result of some new pockets of availability in the recently completed Daiya Meitetsu building, the vacancy rate in this submarket has moved from close to zero to 0.5% over the year.
Fushimi and MarunouchiDespite the ongoing uncertainty, tenant relocations within the Fushimi and Marunouchi submarkets were limited in 2H/2020. As such, market tightness has prevailed and vacancy rates are 0.1% and 0.9%, respectively. In fact, thanks to some leasing activity in Fushimi K Square, Fushimi was the only submarket to have experienced a contraction this period (0.3ppts YoY).
The tight supply notwithstanding, the range of rents in the two submarkets has stayed the same compared to the previous period – between JPY16,000 and JPY24,000. Having said that, over the year, Marunouchi saw the higher level of growth of the two, with rents rising by over 7%.
OutlookIt would be fair to say that the Nagoya offi ce market peaked in late-2019. Fast forwarding to late-2020, and under the spectre of a global pandemic, the region now fi nds itself in an adjustment phase, and its prospects remain unclear. Even so, what is evident is that supply is still tight, helped by only a handful of small-scale cancellations. Meanwhile, though rents have slightly softened, it is yet to
be at a level of concern.What is somewhat troubling, however,
is the level of pre-leasing activity in some upcoming projects, though this has understandably been impeded by the pandemic. Of course, whilst this is not yet a widespread issue, if signs of an economic recovery are not forthcoming, market sentiment could take another turn for the worse, especially if new large supply comes to the market with large availability still present.
On the other hand, redevelopment across the city is enhancing property value in certain areas. For instance, Mitsui Fudosan opened RAYARD Hisaya-oodori Park in September. The project involves retail shops within a park that stretches one kilometre north to south and appears to be contributing to price increases of nearby condominiums. Additionally, the Noritake project attracted great interest, and the neighbouring condominium, The Parkhouse Nagoya, was priced very highly by Nagoya standards.

10savills.co.jp/research
Regional Japanese Offi ce Markets
GRAPH 16: New NRA Offi ce Supply In Fukuoka City, 2006 to 2022
0
5,000
10,000
15,000
20,000
25,000
30,000
TS
UB
O
Source Sanko Estate, Building Group, Savills Research & Consultancy
GRAPH 17: Vacancy Rate In Fukuoka City By Area, 2011 to Q3/2020
0.0%
5.0%
10.0%
15.0%
20.0%
2011 2012 2013 2014 2015 2016 2017 2018 2019 2020
VA
CA
NC
Y
Average Akasaka Tenjin Yakuin Gion Hakata Sta. West Hakata Sta. Southeast
Source Miki Shoji, Savills Research & Consultancy
GRAPH 18: Average Rent In Fukuoka City By Area, 2011 to Q3/2020
8,000
8,500
9,000
9,500
10,000
10,500
11,000
11,500
12,000
12,500
13,000
2011 2012 2013 2014 2015 2016 2017 2018 2019 2020
JPY
/ T
SU
BO
/ M
ON
TH
Average Akasaka TenjinYakuin Gion Hakata Sta. WestHakata Sta. Southeast
Source Miki Shoji, Savills Research & Consultancy
FUKUOKA CITY
NRADespite 2020 welcoming an above-average level of supply in Fukuoka, offi ce NRA is actually at its lowest level in over a decade. Nonetheless, the reaction to this new supply has been positive.
Perhaps even more encouragingly, despite the signifi cant levels of offi ce supply expected in 2021, the market has coped surprisingly well, with pre-leasing activity sound thus far. For instance, target rents at the Tenjin Business Centre (set for completion in September) appear on course to hit a record high of JPY30,000 per tsubo. This is certainly a promising start to what will be a historic year.
Over the longer term, projects such as Tenjin Big Bang and Hakata Connects are expected to add substantial levels of supply come 2028. As we have previously alluded to, Fukuoka’s offi ce stock is relatively old, and as such, these projects in unison should provide the market with a much-needed makeover.
VacancyFor the fi rst time in four years, the investment-grade vacancy rate in Fukuoka is closer to 1% than it is to 0%. In fact, the 0.7ppt rise over the year is the highest on record, as a COVID-induced softening of underlying fundamentals has emerged in this once-buoyant region.
Indeed, amid the multiple waves of infections, small and medium sized offi ces were unsurprisingly the fi rst to be impacted. More recently, however, this has seemingly spread to larger offi ces, with tenants starting to return surplus space and subsequently downsizing to cut costs.
Tenjin has by far the highest vacancy rate in 2H/2020, taking the title from Gion. The latter actually saw its rate decline back to less than 1.0% in 2H/2020 as some supply was absorbed at the Hakata Mitsui Building.
In isolation, the Fukuoka all-grade market appears fairly tight with the vacancy rate at 3.2%. Beneath the surface, however, some fragility has emerged, as evidenced by a material expansion of 1.1ppts YoY.
RentIn 2H/2020, Fukuoka was the only region to have experienced investment-grade offi ce rental growth during the half-year, whilst it also led annually. Over the latter, growth came in at over 3.0%, pushing rents to around JPY18,800 per tsubo.

11
Regional Japanese Offi ce Markets
2H/2020 HOH YOY
Rent 18,800 0.6% 3.8%
Vacancy 0.9% +0.5ppts +0.7ppts
Top Rent 25,000+ 0 0
TOKYO FUKUOKA
Real GDP (JPY trillion) (FY2017) 105.4 19.0
Real GDP (YoY%) 0.8 2.3
% of Japan (FY2017) 19% 3%
Population (million) 14.0 5.1
Job to applicant ratio 1.2 1.0
TABLE 6: Fukuoka Prefecture Key Macro Indicators*
Source Cabinet Offi ce, Fukuoka Prefectural Government, Savills Research & Consultancy
TABLE 7: Fukuoka Investment-grade Offi ces
Source Savills Research & Consultancy
Perhaps driven by the much-improved fundamentals in Gion, rents in the submarket saw an impressive uplift of over 9.0% YoY.
All-grade rents in Fukuoka increased to JPY11,018 per tsubo in Q3/2020 – the highest level on record. Like its regional peers, however, growth has noticeably slowed. That said, Fukuoka is in an envious position with a rate of change of over 5% YoY, comfortably ahead of the next closest region, namely Sapporo with less than 4% YoY growth.
Station FrontHaving fi nally reached the JPY20,000 mark last period, the Hakata submarket did not rest on its laurels. Rents have continued to rise in 2H/2020, and now stand at JPY20,300 per tsubo. What’s more, the spread compared to the most expensive submarket, Tenjin, has narrowed to 2%.
All that said, rental growth has slowed. So much so that the submarket has once more marked the least change in the region. Perhaps as a consequence, the range in investment-grade rents has remained fi rmly between JPY17,000 and JPY25,000. Vacancy rates, meanwhile, remain airtight in this submarket at 0.3%.
TenjinTo be sure, this submarket enjoys region-leading rents of JPY20,700 per tsubo. Yet, this fi gure has actually contracted over the half-year, as Tenjin’s aff ordability is tested under the current situation.
Vacancy rates were unfortunately also the highest in the region, with pockets of vacancy at the Fukuoka Hakata Centre Building being the main culprit of this phenomenon.
OutlookThe Fukuoka offi ce market appears to
have weathered the uncertainty fairly well this year. Indeed, it remains extremely tight despite a slight uptick in new supply, and there have not been many incidences of large-scale cancellations. Yet, this may not be enough to calm the nerves heading into the largest phase of redevelopments in over a decade. With offi ce supply undoubtedly surging, the question remains whether the demand is there to match.
Even so, as we head into the new year, concerns over the historical level of supply appear to have started to recede. Positive signs such as the Tenjin Business Centre capturing a record level of rents, even under
these testing times, certainly give some hope for the imminent future.
Looking ahead, secondary vacancy as a result of the infl ux of supply in 2021 and 2022 may materialise from late next year. Specifi cally, under a scenario where the economic recovery is drawn out, leasing activity may turn out to be more challenging than initially hoped. If this actually occurred, some landlords may become more open to rent reductions in order to fi ll the vacated fl oor space, subsequently altering the direction of the market. Still, with more than half year remaining as a buff er, the market should have some time to adjust accordingly.

12savills.co.jp/research
Regional Japanese Offi ce Markets
GRAPH 19: Vacancy Rate In Sendai City By Area, 2011 to Q3/2020
0.0%
5.0%
10.0%
15.0%
20.0%
25.0%
30.0%
2011 2012 2013 2014 2015 2016 2017 2018 2019 2020
VA
CA
NC
Y
Average Station Front 1-bancho City Hall Station East Outer Area
Source Miki Shoji, Savills Research & Consultancy
GRAPH 20: Average Rent In Sendai City By Area, 2011 to Q3/2020
6,000
7,000
8,000
9,000
10,000
11,000
12,000
2011 2012 2013 2014 2015 2016 2017 2018 2019 2020
JPY
/ T
SU
BO
/ M
ON
TH
Average Station Front 1-banchoCity Hall Station East Outer Area
Source Miki Shoji, Savills Research & Consultancy
TOKYO MIYAGI
Real GDP (JPY trillion) (FY2017) 105.4 9.2
Real GDP (YoY%) 0.8 0.5
% of Japan (FY2017) 19% 2%
Population (million) 14.0 2.3
Job to applicant ratio 1.2 1.2
TABLE 8: Miyagi Prefecture Key Macro Indicators
Source Cabinet Offi ce, Miyagi Prefectural Government, Savills Research & Consultancy
SENDAI CITY
Supply and DemandAfter a long pause, Sendai welcomed several new offi ce buildings in 2020. While NRA has only grown by 0.5% since the beginning of 2020, these new offi ces, along with planned redevelopment projects, will refresh the ageing building stock in the Sendai market.
In the near term, new supply in 2021 will include the Sendai Station East Gate Building (8,000 tsubo of GFA) and the Milene T Sendai Building (3,000 tsubo of GFA). WeWork plans to lease two fl oors in the former with 485 desks. This follows another premium coworking space, SPACES Sendai by Regus, which opened in May.
IT companies, as well as call centres continue to support offi ce demand in Sendai. In September, KDDI Evolva opened its fourth business process outsourcing and contact centre in the new Sendai Miyagino Building, for example. In November, GMO Internet opened its local offi ce in the Taiju Seimei Sendai Honcho Building, and Rakuten Mobile opened a call centre in the MetLife Sendai Eki-mae Building with a plan of hiring 250 staff . Earlier this year, Rakuten Card also added a new contact centre in the new Sendai Kakyoin Terrace.
VacancyWhile expansion demand exists among some companies, vacancy has been rising since June 2019, even before the COVID-19 outbreak. A few buildings were vacated as some Tokyo-based companies decided to reduce their satellite offi ce space. Additionally, a move to a newly-built company-owned building and secondary vacancy caused by new supply also contributed to this trend.
The Station Front submarket saw signs of recovery in October after vacancy rose from 2.5% in June 2019 to 6.0% in September 2020 – the highest level since June 2017. Although it is too early to say if this is the beginning of a tightening in vacancy, several IT companies are taking up space in this submarket, as mentioned earlier. Vacancy in Station Front may fl uctuate for a while as performance varies depending on offi ce location and quality.
Station East’s vacancy tightened below 3% for the fi rst time since Miki Shoji started tracking data in 1992. A large space was reportedly leased up in this submarket which contributed to the falling vacancy rate in September. While this is
an encouraging sign prior to the opening of the JR Sendai East Gate Building in January 2021, the submarket’s vacancy rate has historically jumped when supply is added. Given the current fragile economic conditions, new supply may increase vacancy again.
RentDespite a loosening of vacancy, average rents have been generally increasing in Sendai. Whilst new offi ces completed this year contributed to growth, existing space has also successfully increased rents.
However, growth is sporadic among submarkets, as is the case in recent years. The Station Front submarket remains the most expensive at nearly JPY11,000 per tsubo – over 9% higher than second placed Station East. With rental growth of 3.4% and 3.2% YoY, respectively, these two submarkets contributed to the bulk of the region’s performance over the year. At the other end, rents in the Outer Area are the cheapest and remain unchanged over the year at around JPY7,030 per tsubo – a 35% discount to Station Front rents.
OutlookAlthough Sendai demonstrated its
resilience by reducing vacancy from over 20% to less than 5% over the past decade, the market might be running out of gas. Vacancy began to rise from 2019 and this trend has been accelerated by COVID-19.
Additionally, the potential demographic headwinds continue to hang over the region, with Miyagi forecasted to see an estimated 8% decline in the population between 2015 and 2025 – the most out of the major regions. Overall Tohoku’s declining and ageing population does not bode well for regional offi ce demand in Sendai. That said, Sendai has several high-level educational institutions, such as Tohoku University, that attract a young competent crowd, leading to one of highest ratios of the 20-39 years old demographic.
Furthermore, relatively new, quality offi ce space has been capturing expansion demand from IT fi rms, which is contributing to increases in the average rent. The competitive advantage of newer buildings is clear, considering about 40% of offi ces in the central area were built based on the old seismic code before 1981, according to the City of Sendai. Overall, rental dispersions among submarkets are likely to widen.

13savills.co.jp/research
Regional Japanese Offi ce Markets
GRAPH 21: Vacancy Rate In Sapporo City By Area, 2011 to Q3/2020
0.0%
5.0%
10.0%
15.0%
20.0%
2011 2012 2013 2014 2015 2016 2017 2018 2019 2020
VA
CA
NC
Y
Average Station Front Station East-West Park South Outer South Station North
Source Miki Shoji, Savills Research & Consultancy
GRAPH 22: Average Rent In Sapporo City By Area, 2011 to Q3/2020
6,000
7,000
8,000
9,000
10,000
11,000
12,000
13,000
2011 2012 2013 2014 2015 2016 2017 2018 2019 2020
JPY
/ T
SU
BO
/ M
ON
TH
Average Station Front Station East-WestPark South Outer South Station North
Source Miki Shoji, Savills Research & Consultancy
TOKYO HOKKAIDO
Real GDP (JPY trillion) (FY2017) 105.4 18.6
Real GDP (YoY%) 0.8 1.3
% of Japan (FY2017) 19% 3%
Population (million) 14.0 5.2
Job to applicant ratio 1.2 1.0
TABLE 9: Hokkaido Prefecture Key Macro Indicators*
ource Cabinet Offi ce, Hokkaido Prefectural Government, Savills Research & Consultancy
SAPPORO CITY
Supply and DemandSupply in Sapporo remains limited despite its ageing offi ce stock. The newest offi ce completed in 2020 is the Daido-Seimei Sapporo Building – a mixed-use facility with over 7,000 tsubo of GFA. While rents were substantially higher than the market average, the offi ce was still able to capture demand from local shared offi ce providers, as well as a call centres.
Indeed, the latter remains a primary driver of offi ce demand, particularly for new offi ce space, in Sapporo. In the 14F Daido-Seimei Sapporo Building, Bellsystem24, the second largest call centre operator in revenue, snatched up three fl oors in its fi fth location in the city. This follows the new call centre added by Trans Cosmos, the largest call centre operator in revenue, in Sapporo Sosei Square, which was completed in 2018.
While call centres are in a precarious situation given the reported outbreaks of infection clusters at these locations, demand appears to be increasing on the back of operators’ improving performance. In the long term, however, demand for call centres could weaken if fl exible working practices and the use of AI reduces the need of offi ce space.
VacancyWhile the average all-grade vacancy rate for Sapporo has been slowly rising since March, concurrent with the onset of COVID-19, it remains tight at 2.3% as supply is limited.
Although Station Front, the primary submarket in Sapporo, had been experiencing a loosening of vacancy from March, it began to tighten again from August. Station North

14
Regional Japanese Offi ce Markets
For more information about this report, please contact us
Christian ManciniCEO, Asia Pacifi c(Ex. Greater China)+81 3 6777 [email protected]
Savills Japan
Savills plc: Savills plc is a global real estate services provider listed on the London Stock Exchange. We have an international network of more than 600 offi ces and associates throughout the Americas, the UK, continental Europe, Asia Pacifi c, Africa and the Middle East, off ering a broad range of specialist advisory, management and transactional services to clients all over the world. This report is for general informative purposes only. It may not be published, reproduced or quoted in part or in whole, nor may it be used as a basis for any contract, prospectus, agreement or other document without prior consent. While every eff ort has been made to ensure its accuracy, Savills accepts no liability whatsoever for any direct or consequential loss arising from its use. The content is strictly copyright and reproduction of the whole or part of it in any form is prohibited without written permission from Savills Research.
Tetsuya KanekoDirector, Head of Research & Consultancy, Japan+81 3 6777 [email protected]
Savills ResearchSimon SmithSenior DirectorAsia Pacifi c+852 2842 [email protected]
remains the tightest submarket at 1.3%, refl ecting sound demand, especially for large-scale offi ces in the area. However, vacancy could rise in 2021 as Keihan Real Estate plans to complete two offi ce buildings with a combined GFA of about 6,700 tsubo, equivalent to 7% of total GFA of the submarket.
RentAlthough vacancy has been creeping up, all-grade rents in Sapporo continued to expand by 3.8% YoY, and now lie at around JPY9,400 per tsubo – comfortably above pre-fi nancial crisis highs. Whilst openings of new offi ces with higher rents contributed to growth, rents for existing space improved as well.
Rents in the Station Front submarket remain the highest in this region at around JPY12,400 per tsubo, and rental growth over the year was sound 6.3% YoY, largely helped by the Daido-Seimei Sapporo Building.
Rental growth is also noticeable in secondary submarkets with lower rent levels. Specifi cally, all-grade rents in Park South and Outer South increased 3.7% YoY and 2.9% YoY, respectively, indicative of sound demand across the Sapporo market.
OutlookAlthough there were signs of a softening earlier this year, the Sapporo market has been holding up well amid the COVID-19 outbreak. Vacancy remains tight and rents have continued to rise, refl ecting sound demand. Indeed, the quick absorption of new space added in recent years demonstrates the need for quality offi ce stock. Redevelopment projects are underway by Sapporo Station and the Sousei River East area, which could revitalise the city.
That said, Sapporo faces an uphill battle as demand from call centres, which was a primary driver, may not persist in the long term. Although the city hopes to energise the local IT industry, once called “Sapporo Valley”, IT fi rms in Sapporo are mainly small contractors, which are likely to suff er in a prolonged recession.
Going forward, the recovery of inbound tourism may be one of key factors for the city’s revitalisation. Since redevelopment projects by Sapporo Station plan to feature upscale hotels, as well as offi ces, the rebound of tourists is deemed necessary for successful launches of these projects.