the world internet project international · pdf filethe world internet project international...
TRANSCRIPT


THE WORLD INTERNET PROJECT International Report ̶ Sixth Edition Jeffrey I. Cole, Ph.D. Director, USC Annenberg School Center for the Digital Future Founder and Organizer, World Internet Project
Michael Suman, Ph.D., Research Director Phoebe Schramm, Associate Director Liuning Zhou, Ph.D., Research Associate Interns: Negin Aminian, Hany Chang, Zoe Covello, Ryan Eason, Grace Marie Laffoon‐Alejanre, Eunice Lee, Zejun Li, Cheechee Lin, Guadalupe Madrigal, Mariam Manukyan, Lauren Uba, Tingxue Yu Written by Monica Dunahee and Harlan Lebo

World Internet Project International Report ̶ Sixth Edition | i
WORLD INTERNET PROJECT – International Report Sixth Edition Copyright © 2016 University of Southern California
COPIES You are welcome to download additional copies of The World Internet Project International Report for research or individual use. However, this report is protected by copyright and intellectual property laws, and cannot be distributed in any way.
By acquiring this publication you agree to the following terms: this copy of the sixth edition of the World Internet Project International Report is for your exclusive use. Any abuse of this agreement or any distribution will result in liability for its illegal use.
To download the full text and graphs in this report, go to www.digitalcenter.org.
ATTRIBUTION Excerpted material from this report can be cited in media coverage and institutional publications. Text excerpts should be attributed to The World Internet Project. Graphs should be attributed in a source line to:
The World Internet Project International Report (sixth edition) USC Annenberg School Center for the Digital Future
REPRINTING Reprinting this report in any form other than brief excerpts requires permission from the USC Annenberg School Center for the Digital Future at the address below.
QUESTIONS [email protected] Center for the Digital Future USC Annenberg School for Communication and Journalism 11444 W. Olympic Blvd., Suite 120, Los Angeles, CA 90064 (310) 235‐4444 www.digitalcenter.org / www.worldinternetproject.net

World Internet Project International Report ̶ Sixth Edition | ii
PARTICIPANTS IN THE SIXTH EDITION OF THE WORLD INTERNET PROJECT
AUSTRALIA ARC Center of Excellence for Creative Industries and Innovation (CCi) www.cci.edu.au/projects/digital‐futures Institute of Social Research, Swinburne University of Technology
CHILE Pontificia Universidad Catolica de Chile, School of Communications (UC) www.wipchile.cl Sociology and Engineering/Santiago Chamber of Commerce (CCS)
CHINA China Internet Network Information Center www.cnnic.cn
ITALY SDA Bocconi, Bocconi University www.sdabocconi.it/home/it
NEW ZEALAND Institute of Culture, Discourse and Communication (ICDC) www.wipnz.aut.ac.nz AUT University
POLAND Gazeta.pl Research and Analyses Unit http://badania.gazeta.pl
QATAR Northwestern University in Qatar (NU‐Q) http://www.qatar.northwestern.edu
SPAIN Internet Interdisciplinary Institute (IN3) www.uoc.edu/in3/pic/eng/communication.html Open University of Catalonia (UOC)
SWEDEN .SE (The Internet Infrastructure Foundation) www.iis.se|www.wwi.se World Internet Institute
SWITZERLAND Media Change & Innovation Division www.mediachange.ch IPMZ – Institute of Mass Communication and Media Research University of Zurich, Switzerland
UNITED ARAB American University of Sharjah www.aus.edu EMIRATES Department of Mass Communication
UNITED KINGDOM Oxford Internet Institute (OII) www.oii.ox.ac.uk/microsites/oxis/

World Internet Project International Report ̶ Sixth Edition | iii
UNITED STATES Center for the Digital Future www.digitalcenter.org (Organizer) USC Annenberg School for Communication and Journalism
URUGUAY Universidad Catolica del Uruguay www.ucu.edu.uy
For the complete list of international partners in the World Internet Project, see page 129.

World Internet Project International Report ̶ Sixth Edition | iv
CONTENTS
Introduction: World Internet Project ..................................................................................................................... 1
International Status Reports ................................................................................................................................. 3 Australia ...................................................................................................................................................................... 4
Chile ............................................................................................................................................................................ 6
China ........................................................................................................................................................................... 8
Middle East ................................................................................................................................................................. 9
New Zealand ............................................................................................................................................................. 10
Poland ....................................................................................................................................................................... 11
Spain ......................................................................................................................................................................... 12
Sweden ..................................................................................................................................................................... 14
Switzerland ............................................................................................................................................................... 16
United Arab Emirates ............................................................................................................................................... 18
United Kingdom ........................................................................................................................................................ 19
United States ............................................................................................................................................................ 21
Uruguay ..................................................................................................................................................................... 22

World Internet Project International Report ̶ Sixth Edition | v
Findings .............................................................................................................................................................. 24
1 | Internet use and non‐use ................................................................................................................... 24 1.1 | Internet penetration in the World Internet Project countries .......................................................................... 25
Overall Internet use ............................................................................................................................................ 25
Internet use among men and women ................................................................................................................ 26
Internet use and education levels ...................................................................................................................... 27
Internet use by age ............................................................................................................................................. 28
Internet use and income level ............................................................................................................................ 29
1.2 | Internet use: at home, work, school, and other locations ................................................................................ 30
Internet use at home .......................................................................................................................................... 30
Internet use at work ........................................................................................................................................... 31
Internet use at school ......................................................................................................................................... 32
Internet use at other locations ........................................................................................................................... 33
Internet use on the move ................................................................................................................................... 34
1.3 | Devices: Internet access and use ..................................................................................................................... 35
Internet access and choice of device .................................................................................................................. 35
Internet access through wireless handheld devices .......................................................................................... 36
Internet access by wireless handheld devices: hours per week ........................................................................ 37
1.4 | Internet connections at home ......................................................................................................................... 38
Connection type at home ................................................................................................................................... 39
1.5 | Years online .................................................................................................................................................... 40
1.6 | Internet non‐users: reasons for not going online ............................................................................................. 41

World Internet Project International Report ̶ Sixth Edition | vi
2 | The Internet and social connections .................................................................................................. 42 2.1 | Internet use: social, political, professional, and religious contact .................................................................... 43
Online contact with people who share users’ hobbies and recreational activities ........................................... 43
Online contact with people who share users’ political views ............................................................................ 44
Online contact with people who share users’ profession .................................................................................. 45
Online contact with people who share religious beliefs .................................................................................... 48
2.2 | Internet use: contact and socializing with family and friends .......................................................................... 47
Internet use: effect on contact with families ..................................................................................................... 47
Internet use: effect on contact with friends ....................................................................................................... 48
At a glance: Internet use and effects on contact with users’ families and friends ............................................ 49
2.3 | Socializing with family and friends: users vs. non‐users ................................................................................... 50
Time spent socializing with face‐to‐face with family ......................................................................................... 50
Time spent socializing with friends outside of school or outside of office hours .............................................. 51
3 | Politics and the Internet .................................................................................................................... 52 3.1 | The Internet and the political process ............................................................................................................. 53
Does the Internet give users more political power ............................................................................................ 53
Does the Internet give users more say about what the government does ....................................................... 54
Does the Internet help people better understand politics ................................................................................ 55
Does the Internet encourage public officials to care more about what people think ....................................... 56
3.2 | Freedom of expression online and offline ....................................................................................................... 57
Comfort expressing views about politics ............................................................................................................ 57
Feeling safe expressing views about politics while online ................................................................................. 58
Criticizing the government on the Internet ........................................................................................................ 59
Expressing extreme ideas on the Internet .......................................................................................................... 60
Government regulating the Internet .................................................................................................................. 61

World Internet Project International Report ̶ Sixth Edition | vii
4 | Media use, reliability, and importance ............................................................................................... 62 4.1 | Use of traditional media: users vs. non‐users .................................................................................................. 63
Watching television offline, listening to radio offline, reading newspapers offline .......................................... 63
Listening to radio offline ..................................................................................................................................... 64
Reading newspapers offline ............................................................................................................................... 64
4.2 | Media reliability: information on the Internet ................................................................................................. 65
Users’ trust of information on the Internet........................................................................................................ 65
Reliability of information on the Internet: users vs. non‐users ......................................................................... 66
4.3 | Media importance: media as information sources (users and non‐users) ........................................................ 67
4.4 | The Internet: Important for information, but reliable? .................................................................................... 68
4.5 | Media importance: media as entertainment sources ...................................................................................... 69
4.6 | Multi‐tasking while online ............................................................................................................................... 71
5 | Online security and personal privacy ................................................................................................. 72 5.1 | Concerns about security of credit card information when buying online ......................................................... 73
5.2 | Online privacy ................................................................................................................................................. 74
5.3 | At a glance: government and corporations checking online activities .............................................................. 75
5.4 | Concerns about government checking online activities ................................................................................... 76
5.5 | Concerns about corporations checking online activities .................................................................................. 77
5.6 | Victims of invasion of privacy .......................................................................................................................... 78
5.7 | Negative online experiences ............................................................................................................................ 79
6 | Keeping connected through the Internet ........................................................................................... 80 6.1 | Internet as a communication tool ................................................................................................................... 81
Email ................................................................................................................................................................... 81
Instant Messaging ............................................................................................................................................... 82
Web‐based phone calls ....................................................................................................................................... 82
Overview of Internet use for communication: weekly, daily and several times a day ...................................... 83

World Internet Project International Report ̶ Sixth Edition | viii
6.2 | Social media: user generated content ............................................................................................................. 84
Work on blogs ..................................................................................................................................................... 84
Update personal status ....................................................................................................................................... 85
Post content ........................................................................................................................................................ 85
Post photos or pictures ....................................................................................................................................... 86
6.3 | Social media – content posted by others ......................................................................................................... 87
Visit social networking sites ................................................................................................................................ 87
Post messages or comments on social networking sites ................................................................................... 88
Participate in chat rooms .................................................................................................................................... 89
Post messages or comments on discussion boards ........................................................................................... 90
Read blogs ........................................................................................................................................................... 91
Comment on other people’s postings ................................................................................................................ 91
Going viral ........................................................................................................................................................... 92
6.4 | At‐a‐glance: being social on the Internet ........................................................................................................ 93
At‐a‐glance: user‐generated content ................................................................................................................. 93
At‐a‐glance: content posted by others ............................................................................................................... 94
7 | Research, Education and Jobs ............................................................................................................ 95 7.1 | Research ......................................................................................................................................................... 96
Surfing the Web .................................................................................................................................................. 96
Look for News ..................................................................................................................................................... 97
Fact checking ...................................................................................................................................................... 98
Definitions ........................................................................................................................................................... 99
Research for school .......................................................................................................................................... 100
7.2 | Jobs and Education ....................................................................................................................................... 101 Distance learning .............................................................................................................................................. 101
Job searching .................................................................................................................................................... 102

World Internet Project International Report ̶ Sixth Edition | ix
7.3 | At‐a‐glance: research, education and job searching on the Internet .............................................................. 103 Research ........................................................................................................................................................... 103
Distance Learning and Job Searching ............................................................................................................... 104
8 | Buying, selling and financial management ....................................................................................... 105 8.1 | Buying and selling ......................................................................................................................................... 106
Get information about a product ..................................................................................................................... 106
Compare prices of products or services ........................................................................................................... 107
Buy things online .............................................................................................................................................. 107
Make travel bookings or reservations .............................................................................................................. 108
Sell things online ............................................................................................................................................... 109
8.2 | Financial management ................................................................................................................................. 110
Pay Bills ............................................................................................................................................................. 110
Use your bank’s online services ........................................................................................................................ 111
Investing ............................................................................................................................................................ 112
8.3 | At‐a‐glance: online buying and financial tools .............................................................................................. 113
Buying, selling, and making travel reservations online .................................................................................... 113
Financial management ..................................................................................................................................... 114
9 | Online entertainment and personal interest .................................................................................... 115 9.1 | Entertainment .............................................................................................................................................. 116
Download or watch videos ............................................................................................................................... 116
Download or listen to music ............................................................................................................................. 117
Online radio ...................................................................................................................................................... 118
Online games .................................................................................................................................................... 119
Online gambling ................................................................................................................................................ 120

World Internet Project International Report ̶ Sixth Edition | x
9.2 | Personal interest .......................................................................................................................................... 121 Looking for jokes or humorous content ........................................................................................................... 121
Health information ........................................................................................................................................... 122
Visiting religious or spiritual websites .............................................................................................................. 123
Travel information ............................................................................................................................................ 124
Sexual content .................................................................................................................................................. 125
9.3 | At a glance: entertainment and personal interest ......................................................................................... 126 Entertainment ................................................................................................................................................... 126
Personal Interest ............................................................................................................................................... 127
Appendix .......................................................................................................................................................... 128
1 | The World Internet Project: international partners .......................................................................... 129
2 | Research methods ........................................................................................................................... 132

World Internet Project International Report ̶ Sixth Edition | 1
WORLD INTERNET PROJECT International Report Sixth Edition
Welcome to the findings of the World Internet Project.
This report represents the sixth published results of the World Internet Project, collaboratively produced by the Center for the Digital Future in the USC Annenberg School for Communication and Journalism in the USA and partner countries worldwide. This work on the impact of the Internet has evolved during 13 years of exploration and reveals an international picture of change brought about by online technology.
The Internet has transformed entertainment, communication, information‐gathering, and education across the globe. However, the scope of change varies widely from country to country – a prime reason for a comparative international study.
We originally created this project in 1999 because the Internet represents the most important technological development of our generation; the effects of the Internet may surpass those of television and could someday rival those of the printing press. By beginning our study of the Internet early in its evolution, we have built a broad base of knowledge and analyzed the effects of the Internet as it evolves, and not as postscripts after it has matured.
To achieve our objectives, the 39 countries that are partners in the World Internet Project conduct surveys of individuals in thousands of households, compiling the responses of Internet users and non‐users age 18 and older. We explore how online technology affects the lives of those who use the Internet, and how the views and behavior of users differ from those of people who are not online.
The World Internet Project partners are expanding their explorations of Internet use as technology evolves. As new types of access become available – such as the growth of broadband almost a decade ago, wireless access today, or when other methods now unknown come tomorrow – the project will track them.

World Internet Project International Report ̶ Sixth Edition | 2 The World Internet Project: why an ongoing study of the Internet?
The research by the global network of partners in the World Internet Project differs from most other studies of online technology in three principal ways:
1. The World Internet Project looks at the social impact of the Internet Most Internet studies gather data about who is online, how long they are online, and what they do online. The World Internet Project also compiles this information, but then examines the implications of the use of online technology, and links this use to a broad range of values, behavior, attitudes, and perceptions.
2. The project focuses on Internet non‐users as well as users The World Internet Project follows how the behavior and views of Internet users differ from those of non‐users.
3. The World Internet Project engages government and private industry decision‐makers who can create policy based on our finding Our work involves public and private organizations that use our results. Many WIP partners work closely with corporations – some of which are direct competitors – and foundations, all of whom are engaged with us in an ongoing dialogue about the issues we explore in our studies.
The World Internet Project: key areas
As you will see in these pages, the World Internet Project includes findings that compare the actions and views of Internet users and non‐users. The report is organized into nine general subject areas:
Internet users and non‐users The Internet and social connections Politics and the Internet Media use, reliability, and importance Online security and personal privacy Keeping connected through the Internet Research, education, and jobs Buying, selling, and financial management Online entertainment and personal interest
We hope these findings from the World Internet Project will enlighten you about the many ways in which online technology is transforming our world.
Jeffrey I. Cole, Ph.D. Director, USC Annenberg School Center for the Digital Future Founder and Organizer, World Internet Project

World Internet Project International Report ̶ Sixth Edition | 3
WORLD INTERNET PROJECT International Partners
Status Reports
World Internet Project International Report ̶ Sixth Edition | 4
The Internet in Australia ARC Center of Excellence for Creative Industries and Innovation (CCi) Institute of Social Research, Swinburne University of Technology www.cci.edu.au/projects/digital‐futures
Geography and history have shaped the Internet in Australia. Household take‐up has so far been a story in three parts: very rapid diffusion of dial up access through the 1990s, followed by a period of relatively slow broadband adoption in the early and mid‐2000s, and then again a period of faster adoption since then. In 2013, 91 percent of Australian homes had an Internet connection, the vast majority through broadband. The current position is clearly the result of a distinctive communications landscape, characterized by infrastructure and competition issues, which have taken many years to resolve at the policy level. Australia has a small population concentrated in a few major cities, dispersed across a very large area. Supporting communication services for
Australians living outside the major cities has long been a critical problem for the government. At the same time, the policy decisions that have led to a comparatively low subscription television take‐up have also influenced broadband adoption. The Australian government has scaled back its ambitious fiber‐to‐the‐home national broadband network, and will now employ a mixture of technologies including: fiber ‐to‐the‐node, utilizing the existing copper phone network for the “last mile”; fiber‐to‐the ‐building architecture; existing hybrid fiber coaxial networks; other privately operated fiber broadband infrastructure; and the fiber‐to‐the‐home network that had been already rolled out under the previous plan. The new network has a public equity capital limit of $29.5 billion. The network will provide minimum speeds of at least 25 Mbps to all premises and at least 50 Mbps to the 90 percent of fixed line households by 2020. According to our research, two‐thirds of Australians support the government’s National Broadband Network plan, with support slightly stronger among younger people and Internet users.
The Australian government has also been active in reviewing policy related to the Internet over the last few years. The Liberal and National Party government, elected in late 2013, immediately conducted a number of major reviews and inquiries related to the National Broadband Network that culminated in a major overhaul of the project. The previous government also had conducted a number of policy reviews. The Convergence Review analyzed the implications of the new media landscape for questions of ownership and control of media companies, and for the production and distribution of Australian content. The Independent Media Inquiry considered the need for a new regulatory body that would oversee both online and offline news media and also investigated the impact that the Internet was having on the financial viability of print and online journalism. There have also been reviews of the system of censorship and classification, a wide‐ranging inquiry into copyright in the digital era, and review and development of a cloud computing strategy.
We have now reached a point where there is almost universal broadband access in Australia’s more affluent homes, but a large proportion of low‐income households are still without broadband access. More than three in ten households in the lowest income group do not have home broadband. Households on lower incomes are not any more likely to be dissatisfied with the speed or reliability of their home connection, but they do appear to derive less benefit from their Internet access. For example, they are less likely to access government services or information online and more likely to see the Internet as a frustrating technology.

World Internet Project International Report ̶ Sixth Edition | 5
The Australian government is committed to a Digital First strategy that, among other things, will make all priority government transactions completely digital (end‐to‐end) by 2017. The government is also considering an even more ambitious digital‐by‐default approach. This is in combination with the government’s commitment to widespread broadband delivery. The implementation of the various plans promises to make the next few years a period of dynamism and innovation in Australian’s use and experience of the Internet. The challenge for the government will be ensuring that the benefits from the National Broadband Network are spread as widely as possible.
World Internet Project International Report ̶ Sixth Edition | 6
The Internet in Chile Pontificia Universidad Catolica de Chile, School of Communications (UC) Sociology and Engineering/Santiago Chamber of Commerce (CCS) www.wipchile.cl As in previous World Internet Project reports, Chile remains one of the most technologically advanced countries in South America, occupying a middle position between the world’s most advanced economies and the rest of the developing world. According to The World Economic Forum’s Global Information Technology Report 2014, Chile ranks 35th among 148 countries in terms of the “Networked Readiness Index.” On a scale from 1 to 7, Chile’s score was the highest in Latin America with 4.6 points. In terms of overall welfare, the country ranked 41st within the UNDP’s “Very High Human Development” group of the 49 top countries worldwide, with a GDP per capita of $20,804 at purchasing power parity (PPP).
Nationally, more than half of the population uses the Internet. Approximately 40 percent of Chileans live in the capital, Santiago, and according to the latest WIP Chile survey released in 2014, 51.4 percent of these residents use the Internet. From this population, 74.6 percent of users access the Internet primarily through PCs and notebooks. On the other hand, 17.8 percent of users primarily access the Internet though smartphones. In addition, mobile technologies play an increasingly relevant role as a secondary means of access to cyberspace: for example, 55.5 percent of web users rely on smartphones as their number two preferred method of access.
The rapid growth of the mobile Internet is evident in Chile: 36.5 percent of the sample declared having a smartphone, while 55.1 percent said that they had a conventional phone. In early 2015, the number of mobile phones matched the 17 million Chileans. As in previous WIP Chile surveys, the most widespread usage of mobile is talk: 70 percent of the sample declares it as their highest priority. Yet other usages are growing fast: texting (including use of WhatsApp and similar programs), social media, and email are used by 59.3 percent, 53.2 percent and 51.0 percent of users, respectively.
As in the past, youngsters and wealthier people are more likely to be online, to use the Internet more intensively, and to access the Internet by different means. In the latest survey, 70.8 percent of those of the highest income level (ABC1C2) were users and 86.6 percent of them used the Internet daily. In terms of age, 93.1 percent of those between 18 and 29 were users, and 84.0 percent of them used the web every day. In contrast, 35.2 percent of the poorer (C/D) income levels and 13.9 percent of those older than 60 used the Internet, while 60.3 percent and 67.0 percent of those groups who are online used it on a daily basis.
Concerning access to different technologies, 72.7 percent of those in the highest income level (ABC1C2) and 76.2 percent of those aged 18 to 29 years connected to the web through a smartphone, while the percentage of those who did the same through a tablet was 19.9 percent and 11.3 percent, respectively. In contrast, 51.6 percent of the poorest (D/E) bracket and 29.5 percent of those older than 60 years went online via a smartphone. The figure for tablet‐based access was 14.3 percent and 11.3 percent, respectively.
For the 48.6 percent of the sample not accessing the Internet directly, reliance on a relative or friend for downloading online information helps bridge the shrinking access gap. Yet this practice is also skewed socio‐economically, as well as by age: while 53.2 percent of non‐users are proxy users on average, 61.7 percent of the wealthiest and 80.1 percent of the youngest non‐users belong to this category. In contrast, 48.3 percent of the poorest and 8.3 percent of those older than 60 are proxy users.

World Internet Project International Report ̶ Sixth Edition | 7
Until recently, Chile has had a distinct set of public policies oriented towards promoting universal access to ICT. In 1992, the Ministry of Education started the Plan Enlaces to ensure Internet access for public schools where most children are educated. This has been widely recognized as an important contributor to bridging the access gap among schoolchildren, as well as promoting digital literacy.
The first version of a public‐private Digital Agenda, coordinated by the Department of Economic Development, was implemented between 2004 and 2006, targeting citizens and businesses. It was followed by a new version from 2007 to 2012. The purpose was to “contribute to social and economic development through the usage of ICT by means of enhancing education quality, transparency, productivity, and competitiveness, as well as ensuring a better government, allowing enhanced citizen participation and commitment.”
But in 2010 the center‐left coalition that governed the country uninterruptedly since the end of general Pinochet’s dictatorship in 1990 lost the presidential elections. The succeeding right‐wing presidency of Sebastian Piñera, a businessman who once opposed Pinochet and promised to make Chile a fully developed country, set in place a Digital Strategy for the period 2010‐2014. Yet this ambitious plan turned into nothing as the funds needed to make it work failed to materialize. No clear explanation was offered. After the center‐left alliance regained power in 2014 with ex‐president Michelle Bachelet, a less technocratic and glamorous “Unit of Modernization and Digital Government” (http://www.modernizacion.gob.cl/) was established from the ministry in charge of the executive’s relations with the legislature (instead of from that in charge of economic development). Thus the “developmental” and productivity‐enhancing policies promoting the Internet of the conservative government were re‐oriented toward fostering transparency and e‐government instead. The alliance with the private sector and academia was also dropped.

World Internet Project International Report ̶ Sixth Edition | 8
The Internet in China China Internet Network Information Center www.cnnic.cn Internet Mobility and access on mobile phones As smart phones have gained popularity among members of the Chinese population, engineers and software developers have been striving to keep mobile networks up to pace to satisfy people’s needs for faster and more advanced Internet access on their mobile devices. A few years ago, using mobile phones to navigate, look up information, and stream videos would have seemed almost impossible due to pricey and slow 3G services. However nowadays, 3G has not only prevailed, but also often been replaced by much faster and more affordable 4G and LTE networks. People can easily access their e‐mail accounts, check movie times, book tickets, and do everything on their phones. Many websites have also developed their own mobile versions to make it more convenient for mobile phone access, along with a significant surge in the number of phone apps available for almost every purpose one can think of. As Internet mobility and quality have increased, the Internet has become an inseparable part of people’s lives. However, it is also important to realize the variability among different age groups and socioeconomic status. Young people and those in middle and upper class tend to have a greater demand for quality Internet access on their mobile phones. Those in lower class, especially those in rural areas, have less demand for the Internet on their phones and are less likely to be able afford Internet overall. Use of the Internet for social and entertainment purposes As the world becomes increasingly globalized, the function of the Internet has become much more than just keeping in touch with people from across the globe. The uses of Internet have been largely diversified as social media (weibo, renren), online news, entertainment news, movies, television shows, and even phone apps started taking up the majority of people’s Internet surfing. The surge of Internet use in China has largely increased the number of digital media campaigns, small budget television show releases, and online media subscriptions. Certain phone chat apps such as Wechat started replacing text messaging, e‐mailing, and phone calls altogether due to their incredibly comprehensive functions. Online shopping has also largely increased over the last five to six years due to the convenience of international shipping. With “Taobao” and “Jingdong”as China’s Amazons and “Sohu TV”, “LeTV,” as China’s Netflixes and HULUs, people can easily shop, stream videos, and rent movies online. Compared to a few years ago, the Internet has gained the trust of a lot more Chinese people and a credible means for shopping. While a large proportion of the Chinese people spend much of their leisure time on the Internet, it is also important to realize that a large group of people, especially those who are less well off and don’t consider the Internet as a means of relaxation still have very limited access to the internet. They also have much smaller demand for the Internet due to the nature of their blue collar jobs and lower education levels. Those in an older generation also have a significantly smaller demand for and knowledge about the Internet.

World Internet Project International Report ̶ Sixth Edition | 9
Media use in the Middle East: an eight‐nation survey Northwestern University in Qatar www.qatar.northwestern.edu
Middle‐East region report
This study provided a broad view of how people in the Middle East use media and how they feel about its effect on their lives and societies. Special emphasis was given to Internet use, reflected in the WIP common questions. We interviewed approximately 1,250 people in each of eight countries ‐ Bahrain, Egypt, Jordan, Lebanon, Qatar, Saudi Arabia, Tunisia and United Arab Emirates – nearly 90 percent of them face‐to‐face. The representation of nations from across this diverse area, while incomplete, allows for some consideration of media use in the region as a whole and also highlights significant differences and some surprising similarities between national and regional groups. Greater detail, including an interactive display of the findings, is available at www.menamediasurvey.northwestern.edu. Below are key findings from the 2013 survey.
Internet use is ubiquitous in the Gulf, even rivaling television in those states, but lags far behind in Egypt and Jordan.
The most important source of information about news and current events is still television, but the Internet is assuming a larger role.
o Young adults in all countries except Egypt rate the Internet as highly as television as a news source, and in some countries even more highly than television.
o People in the well‐wired Gulf consider the Internet to be nearly as reliable as television as a source for information, while those in less‐connected countries outside the Gulf still rate television as the most reliable source.
o Interpersonal sources are also cited as important sources of news, alongside television and the Internet.
Television is the most important source for entertainment generally in the Arab countries in the study. However, the Internet eclipses television for entertainment in Qatar and among younger respondents generally.
While most respondents feel people should be able to state their opinions online no matter what those opinions may be, they also express caution about using the Internet to speak frankly about political affairs or public issues. Adding to this apparent paradox is the fact that many – including younger adults – say that they would like to see more regulation of the Internet.
A strong majority of respondents express optimism about the Internet as a source of general information and learning – including about politics and public affairs – while just under half believe this ability translates into having more “say” about government policies, or in exercising more political influence.

World Internet Project International Report ̶ Sixth Edition | 10
The Internet in New Zealand Institute of Culture, Discourse and Communication (ICDC), AUT University www.wipnz.aut.ac.nz
The year 2013 marks the fourth World Internet Project survey in New Zealand to be completed in a seven year period. While Internet usage rates have always been at the higher end of the usage spectrum when compared with other countries, it is interesting to review the various trends that have been occurring during this time. We have seen dial‐up connections move towards obscurity and ever‐faster Internet connections lead to increases in video calling and downloaded/streamed entertainment content. We have witnessed the birth of a new era of mobile Internet access, the rise of social media such as Facebook, Twitter, and Instagram, and an increase in the number of people buying and selling online. The tremendous growth in the use of digital mobile devices such as smartphones and tablets (jumping from 36 percent of Internet users in 2011 to almost 70 percent in 2013) has created an “anytime, anywhere” scenario for users, demonstrating just how integral these technologies have become for daily life.
In 2013 our focus shifted from looking at how many people are using the technology, to who is using it and for what. There are many examples of diversity in Internet use. Women tend to engage in more online social and relational activities while men tend to be more highly engaged in online entertainment activities. Although younger people rate the Internet highly as a form of entertainment, people aged 30 to 65 years tend to focus on it more as an important information source.
Political developments have, and will continue, to affect changes in Internet use. The New Zealand government has sought to find ways of connecting more of the population and making faster Internet speeds available. In 2013 it continued its initiative to roll out fibre‐to‐the‐home connection (ultrafast broadband, e.g., UFB) in all main towns and cities with a population over 10,000. Its objective is to connect 75 percent of New Zealanders with fibre by the end of 2019. At the same time the government’s rural broadband initiative aims to connect 86 percent of rural homes and businesses (outside UFB areas) with broadband at peak speeds of at least 5Mbps by 2016 through fixed wireless and improved copper services.
Another government priority has been to improve the quality of the government’s digital service offerings to New Zealanders. It aims to have 70 percent of New Zealanders’ most common transactions with government (such as paying taxes or obtaining a passport) completed in a digital environment by 2017.
New Zealand has not been immune to concerns about cyber security and Internet safety and in 2012 a review by the Law Commission recommended a range of policy changes to protect the security of Internet users’ personal information. In November 2013, the Telecommunications (Interception Capability and Security) Bill, which was a topic of much public debate, was narrowly passed. It requires telecommunication network operators to allow the Government Communications Security Bureau (GCSN) to intercept customer communications for the purpose of national security.
With 2014 marking the twenty‐fifth anniversary of the first time a New Zealand computer was connected to the Internet, the country looks back on a period of exponential growth in the development of this technology. For a country of just four and a half million people, geographically isolated in the South Pacific Ocean, the Internet has made an enormous impact on its global connectedness. However, although there are now more Internet connections than there are homes in New Zealand, and while 73 percent of respondents in our 2013 survey rated the Internet as important or very important in their everyday life, digital divides have not disappeared. Access, connectivity, ability, cost, and just keeping pace with the many new devices have created new divides among various social groupings, which need to be tracked, understood, and addressed.

World Internet Project International Report ̶ Sixth Edition | 11
The Internet in Poland Gazeta.pl Research and Analyses Unit http://badania.gazeta.pl
According to Eurostat, the OECD, and others, Internet access in Poland is among the most expensive in Europe. This is largely caused by the lack of competitiveness. However, new operators like Dialog and GTS Energis are establishing their own provider lines and offering more attractive and cheaper service.
While 62 percent of Poles aged 15 and above used the Internet in 2013, the penetration rate for 15‐24 year olds was 94 percent and for those over age 60 just 17 percent. Internet users were online for an average of 2 hours and 14 minutes per day in Poland. Internet users in Poland had been using the Internet for 7.5 years on average. Twenty‐eight percent of Internet users connected to the web with their mobile phone/smartphone, while 6 percent did so with a tablet. Over one‐third of Poles (35 percent) had never used the Internet, while 31 percent of the overall population didn’t have any computer in the household. While for 41 percent of the whole population the Internet was an important source of information, for those under age 30 the figure was just over 60 percent. For the population as a whole more people believed that television (59 percent) and radio (44 percent) were important sources of information than the Internet. For 38 percent of the total population the Internet was an important source of entertainment, while for those under 30 the figure was again more than 60 percent. And again, compared to the Internet, overall more people believed that television (58 percent) and other people (72 percent) were important sources of entertainment.
Poland has been experiencing a major change to their Internet infrastructure. Poland has been constructing fiber optic technology for broadband access and moving away from copper wires, which do not allow for connections faster than 10‐20Mbps. By modernizing their network technology, small cities and rural areas will have better access to Internet and the overall number of Polish users will increase. The responsibility for the construction of this new broadband infrastructure in Poland is falling to local governments and private Internet providers, with the relationship between the two not without its problems.
In 2013, around 99 percent of students were regular users of the Internet, the highest group in all of Poland. They are followed by the self‐employed (85 percent), residents of big cities, and persons with tertiary education. These regular users are mostly located in the big metropolitan cities. Specifically, the Voivodship Pomorskie had the highest penetration of regular Internet users and households with computers and access to the Internet. Those households that do not have access to the Internet typically cite no need for it.
Internet retailing in Poland has experienced considerable growth. Online consumers are attracted to the convenience of being able to shop any hour of the day or week, competitive prices, and home deliveries. The biggest groups that shops online are busy urban residents and mothers, neither of whom have a lot of time to go and shop in person. Internet shopping will continue to grow as there are more Poles who feel comfortable making payments online, as well as a rising number of e‐stores which bring more variety. Poland is the growth leader in the Central European region for e‐commerce, with an average increase of 24 percent from 2012‐2014.

World Internet Project International Report ̶ Sixth Edition | 12
The Internet in Spain Internet Interdisciplinary Institute (IN3) Open University of Catalonia (UOC) www.uoc.edu/in3/pic/eng/communication.html The use of the Internet in Spain continues to grow and penetration has reached 84 percent of the population. Of teenagers between the ages of 16 and 18, 100 percent say they are connected to the Internet. A close link is observed between educational attainment and the use of Internet. Whereas only 4 percent of the respondents who have studied or are studying at university do not use the Internet, 47 percent of those who have only completed primary education say they are not online. Mobile use of the Internet is increasing, although the home continues to be the primary place of access. The mobile phone is the device most used by young people age 16 to 24 to access the Internet. Among the non‐users participating in the study, lack of usefulness continues to be the main reason given for not connecting. However, lack of knowledge or interest concerning the technology has increased considerably as a reason for not going online.
In general terms, the Internet is not seen as a tool that creates problems, with the most frequent negative experience related to computer viruses. Only 1.5 percent of respondents say they have suffered from online harassment or intimidation during the last year, and no young person between 16 and 18 years of age reported this type of problem. Eighty‐nine percent of users say they have never suffered a violation of their privacy, with the most affected population being the youngest users. But 54 percent and 47 percent respectively of respondents overall express concern about how companies or the government could be violating their privacy. In response to this concern, 74 percent of users say that they exercise protection, with the youngest users being most active in this regard. Only 39 percent of users feel safe to express their political opinions on the Internet, a decline from 2011. In regard to the government regulation of the Internet, 41 percent of respondents are opposed to any form of regulation, while 36 percent believe that some content should be more regulated.
In general, users positively value the possibilities offered by the Internet for connecting and relating with more people. They value the Internet as a source of information and entertainment, as a way to find training and up‐to‐date content, and as a means for acquiring and developing new skills. Nevertheless, as a space of sociability, most users display reserve, not wishing to share their emotional states online. And in the field of learning, in spite of recognizing the advantages of the Internet, most users have not participated in online university courses or studies. In the sphere of entertainment, a notable increase was recorded in the use of online video games. Nevertheless, many respondents believe that video games have negative effects on the players' conduct, behavior, and emotional states. Likewise, little confidence was expressed in the possibilities of digital gaming as a learning tool, in spite of the fact that respondents showed great interest in games that permit creative and collaborative activities. These somewhat contradictory results indicate a need for reflection and debate.

World Internet Project International Report ̶ Sixth Edition | 13
Using an analysis previously applied in the UK by Dutton and Blank (2013), we can identify five Internet cultures that characterize different attitudes and perceptions towards the Internet in the Spanish setting. Ordered from lesser to greater presence, they are cyber‐moderates (who display a moderate attitude towards the possibilities and risks associated with the use of the Internet), techno‐instrumentals (users who emphasize the instrumental efficiency of the Internet and give little importance to its problems, complications, or disturbances), digital consumers (who are concerned about the risks, but give special value to the possibilities of entertainment and instrumental efficiency), the socially connected (who emphasize the possibilities of the Internet in terms of social facilitation and are aware of the problems and complications), and, finally, e‐mersives (enthusiastic about all the options offered by Internet for leisure and for matters related to personal or occupational/professional life). Although socio‐demographic characteristics are not the determining factors in the formation of these cultures, certain trends exist, notably, the large presence of young people in the e‐mersive culture, of people over 64 years among the digital consumers, and a greater number of university graduates among the socially connected.
References Dutton, W. H., and Blank, G. with the assistance of Groselj, D. (2013), Cultures of the Internet: The Internet in Britain: Oxford Internet Survey 2013 Report. Oxford Internet Institute, University of Oxford.

World Internet Project International Report ̶ Sixth Edition | 14
The Internet in Sweden .SE (The Internet Infrastructure Foundation) World Internet Institute www.iis.se or www.wwi.se Eighteen years after diffusion started in 1995, the Internet today has an assured place in the majority of Swedes’ everyday lives, next to the daily newspaper, magazines, radio, books, and television. Use has stabilized and become part of daily routine. The Internet continues to spread, but the expansion is decreasing every year. Eighty‐six percent of the population is now using the Internet at home.
In recent years, the mobile Internet has made inroads. The Internet has moved from the desktop computer to smartphones and tablets. After the primary diffusion phase and the subsequent broadband phase, we are now in the mobile phase. How does this change the Internet’s availability and usage patterns? Moreover, when new technologies are spreading, new digital divides arise. What do they look like and can they be bridged? Smartphones and tablets also make the Internet available everywhere. Does this mean that they will outweigh the importance the traditional computer?
More and more have smartphones. Two out of every three people use a mobile phone to connect to the Internet. There has been an increase from 22 to 65 percent in just three years.
Young people drive development further. Young people are the main driver in the growth of smartphones. This is most noticeable for those between the ages of 12 and 15 among whom 78 percent use a smartphone daily. Just two years ago, this figure was only at five percent.
Only the latest mobile phone suits the young. Young people have the latest models of smartphone, which they have typically purchased in the last 12 months, while older people generally use older models. In general, the younger one is the newer the model.
Young women are taking the lead online. Four years ago young women were the most active on social networks and blogs. Today, smartphones have reinforced this dominance even further. It appears that girls between the ages of 12 to 15 feel more involved in the information society than boys.
The spread of the tablet has taken off. In the past two years the spread of tablets has gained momentum. Every third Swede (31 percent) has access to such a platform. It is primarily the current generation of young parents and their children that have the largest interest in tablets.
Nearly half of two‐year olds use the Internet. Almost half (45 percent) of two‐year olds today use the Internet, and among preschool children 25 to 30 percent use the Internet daily. Four years ago these percentages were much lower. Virtually all children up to seven years of age who use the Internet daily also use a tablet.
Many people find new friends on the Internet. Many people have made new friends through the Internet. One‐third of all people who use the Internet have found new friends there. The vast majority have since met some of these friends offline as well. On average people have five new friends they have met face‐to‐face in this manner.

World Internet Project International Report ̶ Sixth Edition | 15
Facebook keeps a firm grip. Virtually all people who visit social networking sites visit Facebook. Two out of every three Internet users (66 percent), which represents more than half of the population, visits Facebook at some time. The most active are men between the ages of 16 and 25, among whom 76 percent visit Facebook daily. Among seniors less than 10 percent do the same.
Younger and younger children are on social networks. Social networking sites are frequented by younger and younger children. Already at eight years of age 18 percent say they visit social networking sites. The percentage increases to 30 percent for nine year olds and 81 percent of those aged twelve. Almost two out of three (65 percent) girls make daily visits.
A third of young people's Internet time is spent on social networks. One third of the time young people aged 12‐15 spend of the Internet at home or other locations outside of the school is spent on social networking sites. For those aged 26 to 55 the amount drops to one‐fifth.
The mobile Internet has not replaced the computer. The mobile Internet has not replaced the computer. Virtually everyone with a smartphone also has a computer, and almost everyone with a tablet has both a PC and a mobile phone. Even those who use a smartphone several times a day, or surf daily on a tablet, use their computer to access the Internet at least as much.
Forty percent of Internet time is spent consuming content from traditional media. A large amount of time on the Internet is spent on newspapers, television, and radio. On average, about 40 percent of the time spent on the Internet for those between the ages of 25 to 65 is spent on content from traditional media.
The Internet has not replaced old media. Media use by Swedes is still dominated by traditional media in its traditional form, decades after the introduction of the Internet. At the same time web versions of these traditional media are also used diligently, but it is very rare that the traditional form has been completely abandoned.
The rise of mobile has created new digital divides. Digital divides disappear and new ones arise. Now it is the young and young parents who are driving change, while older users are more cautious. Income and education also play a role as the proportion of smartphones is significantly higher among those with a higher income and education, and this is doubly so when it comes to tablets.
Personal activity on the Internet creates a sense of ownership. Those who are active on the Internet feel the most involved in the new information society. They are predominantly young and well educated with a good income, and have an interest in trying new technical things. They tend to be quite active on YouTube and social networking sites. Most of these people visit Twitter several times a day and visit different forums on which they post and comment on what others have written.

World Internet Project International Report ̶ Sixth Edition | 16
The Internet in Switzerland University of Zurich Institute of Mass Communication and Media Research (IPMZ), Media Change & Innovation Division www.mediachange.ch Eighty‐five out of every 100 people in Switzerland have access to the Internet. Internet usage is on the rise, with even 70 percent of senior citizens going online. However, concerns related to Internet use are still substantial, for example in regard to companies monitoring data. In general, young people are less worried and women are more concerned about protecting their privacy.
The number of people using mobile devices to access the Internet on the go has risen at a rapid rate in the past two years, with around 39 percent of the population and almost half of Internet users using mobile Internet. The technological driver behind this doubling in mobile Internet usage in the last two years is the smartphone. Despite this high penetration level, when asked if they felt involved in the information society, four out of ten people in Switzerland responded with “not at all or just marginally involved.”
Income and education relevant for access
Regarding access to the Internet, there is a digital divide in Switzerland that coincides with income (especially significant in the case of mobile use), education, and employment status. Differences based on age and gender have become less significant. A notable 70 percent of 60 to 74‐year olds in Switzerland are now using the Internet, and overall about the same number of women as men are online. One million people in Switzerland (aged 14 years or over) do not use the web, giving as their main reasons a lack of interest or not seeing any use for it.
Reliability, security, and privacy concerns
Trust in and concerns about using the Internet have remained more or less unchanged in Switzerland in recent years. Three‐quarters of the population consider at least half of the content on the Internet to be reliable. Content from SRG (Swiss Radio and Television public broadcaster) and the government are deemed particularly trustworthy, while that of online social networks and blogs is viewed as the least reliable. Around 40 percent of users would be “very or extremely concerned” about using their credit cards or bank cards on the Internet; five percent have in fact been victims of credit card fraud online.
As far as monitoring data is concerned, companies are still considerably more distrusted (40 percent) than the government (26 percent). In general, young Swiss people are much less concerned than their older counterparts. The same applies to men in comparison with women. Eight out of ten Internet users are very concerned about protecting their privacy, with 45 to 59‐year olds demanding regulatory restrictions on the collection of data by companies more frequently than their younger counterparts. Every second user believes that we have to accept that there is no longer any privacy on the Internet.

World Internet Project International Report ̶ Sixth Edition | 17
Information more important than entertainment
The Internet has further expanded its role as a media‐based multi‐purpose infrastructure for information and entertainment, and for doing business and socializing in Switzerland. It is more common to use the Internet for information purposes, with product and travel information as well as news websites topping the list, than for entertainment, where video and music portals are the most commonly used sources. Online social networks have become much more popular. Almost six out of ten users visit online social networks, with two‐thirds using them on a daily basis. Private online social networks are three times more popular than professional ones. E‐commerce usage has stagnated at a relatively high level, with 78 percent searching for product information, 67 percent making purchases, and 63 percent comparing prices online.
Women less confident than men about their Internet skills
Young people are more active users of interactive applications, user‐created content, and entertainment, while older people tend to use the Internet more for electronic purchases and online banking. While there is no longer any gender difference in terms of access to the Internet, differences still exists in relation to the intensity of use, how much information and entertainment is accessed, and how highly users rate their Internet skills and feel that they are part of the information society – all of these are less pronounced for female than for male users.
The Internet is gaining in significance compared with traditional media
Since 2011, the Internet has become a more relevant source of information and entertainment compared with other media. For users, it is the top source of information, ranking equally with newspapers. For young Internet users (14 to 29 years old), the Internet has overtaken the other media in the realm of information. However, television and radio continue to play the dominant role for entertainment, with even younger users spending more time with television than the Internet.
Digital politics with considerable reservations
Widespread skepticism in Switzerland concerning digital participation in the political processes has continued. Only a tiny minority of four to seven percent are strongly convinced that the Internet impacts positively on the quality of democracy. As a result, the Internet is not used much for taking part in political discussions. Even amongst Internet users, 71 percent discuss political topics offline only. Furthermore, only half of all respondents consider it proper to criticize the government freely on the Internet, with one third decidedly against this activity.

World Internet Project International Report ̶ Sixth Edition | 18
The Internet in the United Arab Emirates Oxford Internet Institute (OII) www.oii.ox.ac.uk/microsites/oxis/ The United Arab Emirates is an oil‐rich, high‐income economy country that is leading the most technologically advanced countries in the Arab region, Qatar, Bahrain, Saudi Arabia, and Oman, all part of the Cooperation Council of the Arab states of the Gulf (GCC). The UAE has a population of about 10 million, 80 percent of which are expatriates. The largest group of non‐nationals are south Asians (60 percent of non‐nationals), followed by other Asians (20 percent) and western expatriates (10 percent). The UAE counts seven emirates Abu Dhabi, Dubai, Sharjah, Um Quaim, Al Ain, Fujairah, and Ajman. A highly urbanized country, 80 percent of the UAE population lives in cities of Abu Dhabi, Dubai, and Sharjah; the rest of the population is scattered throughout the rest of the four Emirates. The UAE counts the most literate population (90 percent are literate) in the region with women outnumbering men in attending universities (60 percent women vs. 40 percent men). More than eight out of 10 people have access to the Internet. The fixed broadband penetration is 13 percent while the wireless broadband penetration grew from 45 percent in 2012 to 90 percent in 2013. In addition to doubling its Internet bandwidth in 2013, the UAE boasts the highest amount of international Internet bandwidth per Internet user in the region with around 52,000 bits/s per user. In 2013, the percentage of Internet subscription using the fiber technology has also increased by 24 percent. By the end of 2013, the UAE counted more than 16 million active mobile subscribers, compared to the 2.08 million fixed telephone subscribers. The smartphone ownership rate is 77 percent, the highest in the region and among the highest in the world. Users prefer touchscreen smartphones devices (58 percent vs. 20 percent that are non‐touch screen). Mobile phone usage is among the most affordable in the world as the UAE is ranked 6th in the world for affordability of mobile usage. In 2013, the UAE has improved its digital divide. The coverage with 3G mobile network in rural areas of the UAE reached 100 percent and the are plans to increase the spectrum (ex. In 2015, 700 mega‐Hertz spectrum space will be moved from TV Broadcast to the Internet, which will facilitate the high‐speed Internet). The UAE is putting a strong emphasis on the E‐Government and Smart‐City initiatives. Dubai smart city promises a ‘different life’ for its residents with 1000 initiatives to be operational in the next five years in different sectors such as smart education, smart economy, and smart environment. In 2013, the penetration of social networks among Internet users is 87 percent. Almost all users (99 percent) and 63 percent of the population are connected to Facebook; only half of the users are connected to Twitter (43 percent). The UAE witnesses a large gender gap in terms of Facebook usage as only three out of 10 female users are connected to Facebook. This profile can be read as optimistic for the telecommunications usage in the UAE, however and at the same time, the UAE is exposed to the most serious cyber threats in the region and the world. The UAE has highly regulated Internet usage with the publication of the new Cyber Crimes Law 2012 (Federal Law No.5 of 2012 combatting Information technology crimes) that provides provisions related to state security, IT security, and political stability among others.

World Internet Project International Report ̶ Sixth Edition | 19
The Internet in the United Kingdom Oxford Internet Institute (OII) www.oii.ox.ac.uk/microsites/oxis/ In Britain, the Internet continues to diffuse gradually, reaching 78 percent of households and individuals 14 and over in Britain in 2013, an increase from 58 percent in 2003. However, this diffusion of the Internet in Britain offers a limited perspective on the Internet as innovation. The Internet is being reinvented year‐by‐year, if not week‐by‐week, as users and providers tag items, create applications, blog, set up and maintain websites, and search for information as a part of their everyday life and work. The dramatic changes that have occurred in the Internet as of 2013 involved the transformation of its infrastructure, including:
The move to broadband by nearly all (99 percent) Internet households.
The increasing use of wireless and mobile devices, quadrupling since 2007, to enable more flexible and mobile Internet access.
There have been notable trends in the uptake of a number of other uses since 2005, including:
There has been drop in reliance on search engines to look for information. In 2013, 41 percent report mainly using search engines to find information, compared to 64 percent in 2009. We believe that this is a result of the rise of social networking sites.
We have seen an increased centrality of the Internet as a first and often major source of information about a widening variety of matters, from local events to health and medical information.
The dramatic growth in social networking has leveled off. In 2013, 70 percent of all Internet users report having up‐dated or created a social networking profile in the last year, up from 69 percent in 2011.
There has been a continued increase in the proportion of users employing the Internet to obtain services, from online shopping and banking to government services.
We have also seen a continuing increase in the creation and production of content by users, linked to the increasing facility of new, Web 2.0 platforms to support user‐generated content.
Users now consider the Internet a more reliable source of information than television, radio, or newspapers. Users also consider it to be more important than television or newspapers for information, but not as significant as a source of entertainment compared to spending time with other people or watching television.
There is a trend in media habits in which the Internet is playing a more central role in such activities as obtaining the news, being entertained, and learning, which is related to perceived declines in viewing television and reading books.

World Internet Project International Report ̶ Sixth Edition | 20
In 2013, for the first time the continuing divide between Internet users and non‐users was based mostly on choice. People who choose not to use the Internet, even if it is available, now make up the bulk of nonusers. This is a striking contrast to previous years when some were excluded on the basis of social or economic barriers to access. Britons with lower incomes, lower socioeconomic status, less schooling, or disabilities continue to be more likely to be non‐users, but the majority of those not online now say they have no interest in the Internet.

World Internet Project International Report ̶ Sixth Edition | 21
The Internet in the United States Center for the Digital Future USC Annenberg School for Communication and Journalism www.digitalcenter.org
As of 2013 over 80 percent of Americans used the Internet. Certain groups continued to be disproportionately represented among non‐users, although these divides have been lessening for some time. Those with more education and income were more likely to use the Internet. Those older, in households making less than $25,000, or not in the labor force were less likely to be connected. Blacks and Latinos also were disproportionately among the non‐user set, although smartphones appeared to be leveling the Internet use disparities traditionally present for racial and ethnic minorities. There were also varying degrees of connectivity by state. The most highly connected states (including Washington, D.C. in the mix), both in and outside of the home from various devices, included Colorado, the District of Columbia, Maryland, Minnesota, Washington, New Jersey, and Connecticut. At the opposite end of the spectrum were Mississippi, New Mexico, South Carolina, West Virginia, Tennessee, Arkansas, and Texas.
As of 2013 the U.S. ranked 9th globally in terms of average Internet connection speed, behind South Korea, Japan, Hong Kong, Switzerland, the Netherlands, Latvia, the Czech Republic, and Sweden. Compared with other tech‐savvy nations, U.S. Internet service is relatively slow and overpriced. Internet access in the United States is for the most part provided by the private sector and is available in a variety of forms, using a variety of technologies, at a wide range of speeds and costs. But as the country suffers from a severe lack of competition in the broadband business, the service is generally relatively expensive and many people have little or no choice on who provides their Internet access.
Arguably the most important Internet‐related issue in the United States in 2013 was the battle over net neutrality. Up to this point there had been neutrality to the extent that telecommunications companies rarely offered different rates to Internet consumers (dial‐up or broadband) based on content or service type. But there had been no clear legal restrictions against such practices.
There had been several failed attempts by Congress to pass network neutrality bills. Each sought to prohibit Internet service providers from using various variable pricing models, i.e., tiered service, based upon amount and speed of data consumption. But then on February 26, 2015, the FCC's instituted new “Open Internet” rules which were designated “to protect free expression and innovation on the Internet and promote investment in the nation's broadband networks.” The new rules apply to both fixed and mobile broadband service. The rules stipulate that broadband providers cannot block access to any legal content, applications, or services. They cannot degrade or impair lawful Internet traffic on the basis of any particular content, applications, or services. Moreover, broadband providers cannot favor some lawful Internet traffic over others in exchange for any kind of consideration, i.e., there can be no fast versus slow lanes. These rules also ban Internet service providers from prioritizing the content and services of anybody or organization affiliated with them.

World Internet Project International Report ̶ Sixth Edition | 22
The Internet in Uruguay Universidad Católica del Uruguay Communications Department, Human Sciences Faculty http://www.ucu.edu.uy/comunicacion With a population close to 3.3 million people, almost 95 percent in urban localities and 40 percent residing in its capital city Montevideo (National Census 2011), Uruguay is one of the smallest but most socioeconomic and technologically advanced countries in Latin America.
Having developed the first welfare state in the region in the beginning of the 20th century, several multilateral and international organizations position Uruguay at the top of their socioeconomic and democracy indices among Latin American nations: third in the 2014 Human Development Index (HDI) of the United Nations Development Program, first in the region according to the 2013 Democracy Index of The Economist Intelligence Unit, and the least corrupt country, together with Chile, according to the 2014 Corruption perceptions Index of Transparency International, to name a few.
In the beginning of the 21st century, Uruguay pushed its liberal and equity‐oriented policies into the digital sphere. In the Internet arena Uruguay presents itself as a particularly interesting case study due to the recent implementation of digital inclusion policies that universalized and democratized access to ICT. The last two governments implemented country‐level digital programs, such as the Plan Ceibal 1‐to‐1 initiative, national e‐government plans, and a massive scale fiber optic connection to the Home Deployment and National Adult Digital Literacy programs. These policy results reflect the country’s leadership role (along with that of Chile, Costa Rica, and Argentina) in ICT within the region. Here Uruguay ranks first in the ICT Development Index (IDI) of the International Telecommunications Union (ITU), standing out because of the country’s Internet infrastructure, mobile cellular penetration, affordability of fixed broadband connections (the second cheapest in the region, and the most affordable for low income households), mobile broadband penetration, and Internet access in public schools (almost 100 percent).
Without any doubt the most remarkable digital characteristic of the country relates to its Plan Ceibal program. Since 2006 and in partnership with the One Laptop per Child (OLPC) initiative, Uruguay has developed the first and only fully national scale 1‐to‐1 program in the world. Far more than a laptop delivery initiative, the program not only provides personal computers or tablets to every student and teacher of the national public schools system (from elementary to high school), but also connects all public education centers to the Internet (more than 25 percent of them through optical fiber). Moreover, Plan Ceibal has universalized the usage of the Internet among the younger population (more than 91 percent of those from 6 to 15 years of age are users), and gave them free access to thousands of educational resources.
Moreover, Plan Ceibal has not only impacted children. It has also benefited the country as a whole. Not only did PC and Internet access in urban households rise 388 percent and 425 percent respectively from 2001 to 2013 (according to the national statistics office), the divide in access to a PC between the poorest and the richest was also significantly reduced. The ratio of PC access of the urban households of highest fifth of per capita income compared to the ones of the lowest fifth went from 5.7 in 2007 to just 1.09 in 2012.

World Internet Project International Report ̶ Sixth Edition | 23
According to the NSO, for those aged six and older individual Internet usage (having used the Internet at least once in the last month) rose from 32 percent in 2006 (the first year with a reliable measurement) to 58 percent in 2013. Uruguay’s 2013’s WIP survey (representing the first wave of Uruguayan data within the WIP) shows that 70 percent of Uruguayans 15 years of age and older have used the Internet.
Uruguay’s entry into the World Internet Project presents itself as the first global scale opportunity to produce detailed comparisons of the usage and effects of the Internet in Uruguay with those of a diverse array of other countries.

World Internet Project International Report ̶ Sixth Edition | 24
FINDINGS
1 Internet use and non‐use

World Internet Project International Report ̶ Sixth Edition | 25
1.1 Internet penetration in the World Internet Project countries
Overall Internet use
Sixteen of the nineteen countries reporting findings in the 2015 World Internet Project have a majority of respondents who were Internet users. China (44 percent) and Jordan (46 percent) were only slightly under 50 percent.
Eight countries reported an Internet penetration rate of more than 80 percent: New Zealand (92 percent), Australia (91 percent), Sweden (87 percent), Qatar (86 percent), Switzerland (85 percent), Spain (84 percent), Saudi Arabia (83 percent), and Bahrain (82 percent).
Internet use – all respondents
(Q3 M‐1)

World Internet Project International Report ̶ Sixth Edition | 26
Internet use among men and women
Gender disparity in Internet use continues in all of the WIP reporting countries, with higher percentages of men than women going online.
The gender gap is the largest in Jordan (17 percent more men than women use the Internet), followed by Egypt (13 percent more men than women go online) and Lebanon and Qatar (in both countries 11 percent more men than women use the Internet).
The country with the lowest difference is Poland (one percent difference between men and women), with Australia, China, New Zealand, Switzerland, Tunisia, United Kingdom, and Uruguay, recording gaps in Internet use between men and women of four percentage points or less.
Internet use by gender – all respondents
(Q3 M‐3)

World Internet Project International Report ̶ Sixth Edition | 27
Internet use and education levels
Internet use increases as education levels increase.
The Internet is used by more than half of respondents with a high school education in all of the WIP countries. Among respondents with a college degree or higher, the Internet penetration rate is more than 90 percent in all WIP countries except China (79 percent) and United Arab Emirates (89 percent).
Internet use and education levels – all respondents
(Q3 M‐4)

World Internet Project International Report ̶ Sixth Edition | 28
Internet use by age
All of the WIP countries reported that in general, Internet use decreases as age increases. Nevertheless, there is a wide range of Internet use reported among the oldest respondents in several countries.
All of the countries reported THAT at least 90 percent of respondents age 18‐24 go online, except Tunisia (86 percent), China (74 percent), Jordan (71 percent), and Egypt (34 percent). And all of the countries reported at least 90 percent of respondents age 25‐34 use the Internet except United Arab Emirates (82 percent), Tunisia (78 percent), Lebanon (76 percent), China (60 percent), Jordan (56 percent), and Egypt (25 percent).
Fourteen of the nineteen countries reported at least a majority of respondents ages 35‐44 go online and thirteen of those also reported a majority of respondents ages 45‐54 go online.
Eight of the countries reported more than 50 percent of users age 55‐64 go online: Sweden (93 percent), Australia (91 percent), New Zealand (90 percent), Switzerland (83 percent), Spain (79 percent), the United Kingdom (74 percent), Uruguay (56 percent), and Qatar (54 percent). And another six reported more than 30 percent of users age 55‐64.
Seven countries reported more than 25 percent of Internet users age 65 and over: New Zealand (74 percent), Australia (62 percent), Sweden (59 percent), Spain (57 percent), Switzerland (57 percent), the United Kingdom (39 percent), and Uruguay (28 percent).
Internet use by age – all respondents
(Q3 M‐2)

World Internet Project International Report ̶ Sixth Edition | 29
Internet use and income level
The WIP countries reported wide disparity in Internet use based on income; in nearly all of the countries, the gap is notable when comparing respondents in the upper 50 percent of household income to the lower 50 percent.
The largest differences in Internet use based on income were reported in Uruguay (35 percentage points), the United Kingdom (34 percentage points), and China (31 percentage points). The smallest gap in Internet use was in Qatar and Sweden (1 percentage point); in three countries (Italy, Qatar, and the United Arab Emirates), usage among the lower income group exceeded that of the upper income group.
Internet use and income – all respondents
(Q3 M‐5)

World Internet Project International Report ̶ Sixth Edition | 30
1.2 Internet use: at home, work, school, and other locations
Internet use at home
All five WIP countries reporting data on daily Internet use at home found that over 90 percent of respondents answered yes.
Daily Internet use at home – Internet users
(Q5b M‐1 and Q5 M‐1)
All of the WIP countries reported an average of at least ten hours per week of Internet use at home, with the exception of Switzerland.
Bahrain reported much higher average Internet use at home than the other WIP respondents (28 hours weekly), followed by China and Lebanon (21 hours weekly). Reporting the lowest weekly home Internet use were Switzerland (seven hours), the United Kingdom (10 hours), and Poland and Sweden (11 hours).
Weekly hours of Internet use at home – Internet users

World Internet Project International Report ̶ Sixth Edition | 31 Internet use at work
The WIP countries reported a wide range of percentages of employed Internet users who go online at work (outside the home), from 81 percent in the United States to 46 percent in Uruguay.
Daily Internet use at work – Internet users who are employed
(Q5b M‐2)
With the exception of Switzerland, the United Kingdom, and Poland, all of the WIP countries reported more than 10 hours of weekly Internet use on average at work (outside the home). China reported the highest number, followed by Qatar and Bahrain.
Weekly Internet use at work – Internet users who are employed
(Q5 M‐2)

World Internet Project International Report ̶ Sixth Edition | 32 Internet use at school
Compared to Internet use at work, percentages reported for daily Internet use at school show an even wider range of responses, from 80 percent in the United States to nine percent in Italy.
Daily Internet use at school – Internet users: students who are not employed
(Q5b M‐3)
Four of the WIP countries reported more than ten hours each week online at school. Poland reported the lowest average use at school (one hour per week).
Weekly Internet use at school – Internet users: students who are not employed
(Q5 M‐3)

World Internet Project International Report ̶ Sixth Edition | 33 Internet use at other locations
All WIP countries reporting on daily Internet use found more than 25 percent of users go online every day from a location other than work, home or school.
Daily Internet use at locations other than home, school or work – Internet users
(Q5b M‐4)
Average weekly Internet use at locations other than home, school, or work ranged from 24 hours in Bahrain to .2 hours in Switzerland.
Weekly Internet use at locations other than home, school or work – Internet users
(Q5 M‐4)

World Internet Project International Report ̶ Sixth Edition | 34
Internet use on the move
Nearly all WIP countries reporting on daily Internet use found more than 30 percent of users go online every day while on the move (such as in cars and buses, and on the street).
Daily Internet use on the move – Internet users
(Q5b M‐5)

World Internet Project International Report ̶ Sixth Edition | 35
1.3 Devices: Internet access and use
Internet access and choice of device
Computers remain the principal means of Internet access across all WIP countries. All countries reported at least 85 percent of users access the Internet through a computer. All countries except Uruguay report a majority of users accessing the Internet by phone. Tablets and e‐readers are used by less than half of Internet users with the exception of Australia (55 percent).
Devices used for Internet access – Internet users
(Q6b MD‐1 and Q6a MD‐1)
Among users who report using more than one device to access the Internet, computers are still the most common device used. However, three countries show phone usage within 25 percentage points of computers: Spain (19 percentage points), Italy (21 percentage points), and Australia (23 percentage points).
Primary device used for Internet access – Internet users who use more than one device to go online

World Internet Project International Report ̶ Sixth Edition | 36
Internet access through wireless handheld devices
Access to the Internet through wireless handheld devices is common in all of the WIP countries. Even in the country reporting the lowest use – Egypt ‐‐ nearly one‐third of all users use handheld devices for access.
In several countries, use of wireless handheld devices is approaching 100 percent, specifically: Bahrain (95 percent), Lebanon (92 percent), Qatar (90 percent), China (86 percent), and Saudi Arabia (84 percent).
Internet access through wireless handheld devices – Internet users
(Q6 M‐1)

World Internet Project International Report ̶ Sixth Edition | 37
Internet access by wireless handheld devices: hours per week
While the percentage of users who go online with a wireless handheld device is relatively high (see the previous finding), the average weekly time spent online is generally low.
Only China (19 hours weekly) and New Zealand (13 hours weekly) reported more than 10 hours a week of Internet access with handheld wireless devices, with Egypt, Jordan, and Saudi Arabia reporting the lowest level (0.2 hours weekly).
Users who access the Internet through wireless handheld devices, hours per week
(Q6 M‐2)

World Internet Project International Report ̶ Sixth Edition | 38
1.4 Internet connections at home
In 13 of the 19 reporting WIP countries, Internet access at home among users is near‐universal – 90 percent or more. Only Egypt reported less than 80 percent, but still a majority (52 percent).
Internet access at home – Internet users
(Q18 M‐1)

World Internet Project International Report ̶ Sixth Edition | 39
Connection types at home
Broadband continues to dominate as the primary method of Internet connection available at home in most of the WIP countries.
New Zealand and Sweden reported the highest level of broadband access (96 percent), while Bahrain (52 percent) and Tunisia (41 percent) have the lowest percentages of users with broadband at home.
In Tunisia, the most common Internet connection method is the phone modem (63 percent), and in Bahrain, the percentage with phone connection is only slightly less than broadband (49 percent). Measurable but much smaller percentages of users in most of the other countries continue to report having access to the Internet through a phone modem.
Internet at home connection types – Internet users (multiple types of access possible)
(Q18 M‐2)

World Internet Project International Report ̶ Sixth Edition | 40
1.5 Years online
Internet experience varies widely in the WIP countries. The most experienced users are found in Sweden (15 years on average), the United States (14 years), Australia and New Zealand (13 years), Switzerland (11 years), and Spain (10 years).
The least average online experience was reported in Egypt, Jordan, and Tunisia (4 years).
Number of years online – Internet users
(Q7 M‐1)

World Internet Project International Report ̶ Sixth Edition | 41
1.6 Internet non‐users: reasons for not going online
Internet non‐users reported a variety of reasons for not going online: no interest or not useful, lack of knowledge or confusion about going online, no computer or Internet connection, the expense, or lack of time.
As in the previous WIP studies, the main reasons for not going online varied from country to country.
The most common reason was the non‐users had no interest or found the Internet was not useful: the United Kingdom (81 percent), Sweden (58 percent), Saudi Arabia (55 percent), Australia (49 percent), Lebanon (42 percent), Switzerland (39 percent), Tunisia (39 percent), Spain (37 percent), New Zealand (33 percent), and United Arab Emirates (27 percent).
Six countries reported lack of knowledge or confusion about going online as the principal reason non‐users do not go online: Chile (47 percent), China (43 percent), Bahrain and Jordan (42 percent), Italy (40 percent), and Uruguay (37 percent)
Only Egypt (37 percent) and the United States (36 percent) reported no computer or no Internet connection as the principal reason. And only Qatar (43 percent) reported no time or too busy as the main reason non‐users stay offline.
As in the previous report, the cost of going online was not a significant factor for non‐use in any of the WIP countries; only Chile reported more than 10 percent of non‐users (11 percent) who said that a reason they were not online was it was too expensive.
Reasons for not going online – Internet non‐users
(Q4 MD‐1)

World Internet Project International Report ̶ Sixth Edition | 42
2 The Internet and social connections

World Internet Project International Report ̶ Sixth Edition | 43
2.1 Internet Use: social, political, professional, and religious contact
Internet use: contact with people who share users’ hobbies and recreational activities
Eight of the ten reporting countries reported that a majority of users believe that going online has somewhat or greatly increased their contact with people who share their hobbies or recreational activities: Bahrain (72 percent), Jordan (71 percent), Saudi Arabia (70 percent), United Arab Emirates (56 percent), China (54 percent), Egypt (53 percent), Qatar (51 percent), and Tunisia (50 percent).
The majority of users in the United States (56 percent) report that the Internet has no effect on their contact with people who share their hobbies or recreational activities.
Does going online affect your contact with people who share your hobbies or recreational interests? (Internet users)
(Q9A M‐1)

World Internet Project International Report ̶ Sixth Edition | 44
Internet use: effect on contact with people who share users’ political views
Unlike the previous study, a majority of users in most of the reporting countries said that going online has somewhat increased or significantly increased their contact with people who share their political views: Saudi Arabia (71 percent), the United Arab Emirates (58 percent), Jordan and Egypt (54 percent), Bahrain (51 percent), and Qatar (51 percent). In China and Tunisia (44 percent) and Lebanon (36 percent), the largest portion of users also report contacts are somewhat or greatly increased.
As in the previous question, the great majority of users in the United States (71 percent) report the Internet has had no effect on their contacts with people who share their political views.
In all of the reporting countries, no more than 20 percent of users report that Internet use has somewhat or greatly decreased contact with others who share their political views. In this regard, the highest percentage reported is by Tunisia (20 percent) and the lowest reported is by Egypt and the United States (seven percent).
Does going online affect your contact with people who share your political views? (Internet users)
(Q9B M‐1)

World Internet Project International Report ̶ Sixth Edition | 45
Internet use: effect on contact with people who share users’ profession
For many users, going online has a positive effect on their contact with others in their profession. In most of the WIP countries, a majority of users said that Internet use has increased contact with people who share their profession: United Arab Emirates (67 percent), Saudi Arabia (66 percent), China and Bahrain (61 percent), Jordan (58 percent), and Qatar (56 percent).
However, large percentages of users in several of the WIP countries said that the Internet has no effect on their contact with people in their profession: the United States (58 percent), Egypt (56 percent), New Zealand (53 percent), and Lebanon (52 percent).
Does going online affect your contact with people who share your profession? (employed or retired Internet users)
(Q9F M‐1)

World Internet Project International Report ̶ Sixth Edition | 46
Internet use: effect on contact with people who share users’ religious beliefs
A significant number of the WIP countries report a majority of users who feel Internet use has somewhat or greatly increased their contact with people who share their religious beliefs: Saudi Arabia (59 percent), United Arab Emirates (57 percent), Bahrain (54 percent), and Qatar (52 percent).
All countries reported a minority of users who feel the Internet has somewhat or greatly decreased their contact with people who share their religious beliefs. The largest proportion was reported by Tunisia (22 percent) and the smallest by Jordan (five percent).
Does going online affect your contact with people who share your religious beliefs? (Internet users)
(Q9C M‐1)

World Internet Project International Report ̶ Sixth Edition | 47
2.2 Internet use: contact and socializing with family and friends
Internet use: effect on contact with families
Using the Internet can have a positive effect on users’ contact with their family members. In all the WIP countries, higher percentages of users said their contact with family members has increased rather than decreased because of Internet use.
In several countries, 50 percent or more of users reported increased contact with family members: Bahrain (76 percent), United Arab Emirates (69 percent), Jordan (63 percent), Qatar (62 percent), Saudi Arabia (59 percent), and New Zealand (50 percent).
For all but one country, less than 20 percent of users reported that the Internet has decreased their contact with family members. The greatest proportion in this regard was reported by Lebanon (16 percent) and the smallest by Jordan (2.4 percent).
In Tunisia, nearly equal numbers of users feel the Internet has increased (36 percent) and decreased (35 percent) their contact with family members.
How does your use of the Internet affect your contact with members of your family? (Internet users)
(Q9D M‐1)

World Internet Project International Report ̶ Sixth Edition | 48
Internet use: effect on contact with friends
As with views about contact with family members, most Internet users said that going online brings them closer to their friends. In all of the WIP countries, more than 50 percent of users said going online has somewhat or greatly increased their contact with friends: Bahrain (80 percent), Saudi Arabia (77 percent), Jordan (74 percent), United Arab Emirates (68 percent), Qatar (67 percent), China (63 percent), Tunisia (61 percent), Lebanon (59 percent), New Zealand (58 percent), Egypt (53 percent), and the United States (51 percent).
As with many of the previous categories, only 20 percent or less of users in every country reported that Internet use has decreased their contact with friends, ranging from Tunisia (19 percent) to Jordan (2.4 percent).
How does your use of the Internet affect your contact with members of your family? (Internet users)
(Q9E M‐1)

World Internet Project International Report ̶ Sixth Edition | 49
At a glance: Internet use and effects on contact with users’ family and friends
Higher percentages of users in nearly all of the WIP countries said that their use of the Internet has increased their contact with friends, compared to their contact with family.
The one exception is the United Arab Emirates, which reported equal increases for friends and family.
Internet use: effects on contact with family and friends – Internet users
(Q9D‐E MD‐1)

World Internet Project International Report ̶ Sixth Edition | 50
2.3 Socializing with family and friends: users vs. non‐users
Time spent socializing face‐to‐face with family
In most of the reporting WIP countries non‐users reported spending more hours on average with family than users. The largest gap between non‐users and users was found in Qatar, where non‐users spent nine hours more per week on average than users socializing face‐to‐face with family. However, in the United States, users spent more hours than non‐users socializing face‐to‐face with family.
During a typical week, how many hours do you spend socializing with family? (all respondents)
(Q16 M‐1)

World Internet Project International Report ̶ Sixth Edition | 51
Time spent socializing with friends outside of school or office hours
Users and non‐users in most of the WIP countries generally reported spending about the same amount of time socializing with friends outside of school or the office.
In five of the six reporting WIP countries, users reported marginally more time, or the same amount of time, as non‐users socializing with friends. The largest difference was reported by Jordan (three hours).
Only in Saudi Arabia did non‐users report spending slightly more time with friends.
During a typical week, how many hours do you spend socializing with friends? (all respondents)
(Q15 M‐1)
World Internet Project International Report ̶ Sixth Edition | 52
3 Politics and the Internet

World Internet Project International Report ̶ Sixth Edition | 53
3.1 The Internet and the political process
The Internet plays an important role in the political process. But what kind of impact does digital technology have on the political process: does the Internet create political empowerment, help citizens participate in governance, build understanding of politics, and create greater engagement with public officials?
Does the Internet give users more political power?
Views vary across the WIP countries about the role of the Internet in giving users more political power.
Eleven of the 18 WIP countries reported higher numbers of users who feel the Internet gives users more political power. Several reported significant differences between those agreeing and those disagreeing: Saudi Arabia (56 percentage points), United Arab Emirates (49 percentage points), Qatar (46 percentage points), Egypt (38 percentage points), China (32 percentage points), Jordan (31 percentage points), and Spain (19 percentage points).
Seven WIP countries reported larger numbers of users who do not feel the Internet gives greater political power. Of these, Switzerland showed the greatest difference (41 percentage points), followed by Italy (14 percentage points), and Uruguay (12 percentage points). The rest of the WIP countries showed less than 10 percent difference between those agreeing and those disagreeing.
By using the Internet, people like you can have more political power – Internet users
(Q10A MD‐1)

World Internet Project International Report ̶ Sixth Edition | 54
Does the Internet give people more say about what the government does?
Ten of the WIP countries reported 40 percent or more of Internet users who said the Internet gives users more say in what the government does. Of these, several show a significant gap between those who agree and those who disagree on this issue: Uruguay (74 percentage points), Spain (63 percentage points), United Arab Emirates (51 percentage points), Saudi Arabia (49 percentage points), China (46 percentage points), Egypt (45 percentage points), Qatar (44 percentage points), and Jordan (34 percentage points).
Of the nine countries reporting a higher number of Internet users disagreeing, only two show a significant difference: Switzerland (51 percentage points) and Italy (26 percentage points).
By using the Internet, people like you will have more say in what the government does – Internet users
(Q10B MD‐1)

World Internet Project International Report ̶ Sixth Edition | 55
Does the Internet help people better understand politics?
In all but two WIP countries, significantly higher numbers of Internet users agree rather than disagree that the Internet helps people better understand politics. Eleven of these reported at least 30 percent more Internet users who agree or strongly agree: Saudi Arabia (69 percentage points), Jordan (66 percentage points), Egypt (58 percentage points), United Arab Emirates (57 percentage points), Qatar (53 percentage points), United States (51 percentage points), China (47 percentage points), Lebanon (40 percentage points), Australia (34 percentage points), Italy (32 percentage points), and Tunisia (30 percentage points).
Only two countries had higher numbers of users who disagree with the statement and both reported significantly higher numbers of those who disagree than those who agree: Switzerland (25 percentage points) and Chile (18 percentage points).
By using the Internet, people like you can better understand politics – Internet users
(Q10C MD‐1)

World Internet Project International Report ̶ Sixth Edition | 56
Does the Internet encourage public officials to care more about what people think?
Can digital technology be used to encourage public officials to care more about what people think? Responses to this statement across the WIP countries are significantly more mixed that for the preceding statements.
In nine countries, 40 percent or more of users say that the Internet encourages public officials to care more about people’s concerns. At the same time, nine countries reported 40 percent or more of users who disagree with that statement.
By using the Internet, public officials will care more about what people think – Internet users
(Q10D MD‐1)

World Internet Project International Report ̶ Sixth Edition | 57
3.2 Freedom of expression online and offline: users and non‐users
Comfort expressing views about politics in general
When asked if they would be comfortable saying whatever they think about politics, significant percentages of users and non‐users agree; users and non‐users reported in near‐equal percentages that they would be comfortable saying whatever they think about politics. In only three countries, the gap between users and non‐users responding agree or strongly agree exceeded 10 percent: Saudi Arabia (17 percent more users than non‐users); Jordan (11 percent more users than non‐users); and China (22 percent more non‐users than users).
In general, I feel comfortable saying whatever I think about politics – all respondents
(Q24A MD‐1)

World Internet Project International Report ̶ Sixth Edition | 58
Feeling safe expressing views about politics while online
Is it safe for users to say whatever they want about politics while online? Views on this issue are split among the WIP countries.
In 11 of the 17 countries, 40 percent or more of users agree that on the Internet, it is safe to say whatever they want about politics , while only four countries report 40 percent or more of users who disagree with this statement.
Forty 40 percent or more of non‐users in nine countries also agree with this statement.
At the other end of the spectrum, in four countries more than 40 percent of users do not feel it is safe to express their political views while online, while non‐users in six countries report the same view.
On the Internet, it is safe to say whatever you think about politics – all respondents
(Q24B MD‐1)

World Internet Project International Report ̶ Sixth Edition | 59
Criticizing the government on the Internet
A majority of users in most of the reporting countries, and nearly as large percentages of non‐users, agree that they should have the freedom to criticize their government while online.
The gap between users and non‐users, in terms of those agreeing compared to those disagreeing, was largest in the United States (20 percentage points more users than non‐users) and New Zealand (19 percentage points more users than non‐users). The next largest gap is in the opposite direction in China (18 percentage points more non‐users than users).
People should be free to criticize their government on the Internet – all respondents
(Q24C MD‐1)

World Internet Project International Report ̶ Sixth Edition | 60
Expressing ideas on the Internet, even if they are extreme
Nearly all of the WIP countries reported higher percentages of users than non‐users who agreed that it is acceptable for people to express their extreme ideas online.
Of these countries, the greatest difference was reported by Bahrain (24 percentage points) and Jordan (21 percentage points). For the three countries that reported higher numbers of agreement among non‐users, the discrepancy between users and non‐users was very small: China (six percentage points), Spain (five percentage points), and Switzerland (two percentage points).
It is OK for people to express their ideas on the Internet, even if they are extreme – all respondents
(Q24D MD‐1)

World Internet Project International Report ̶ Sixth Edition | 61
Government regulating the Internet
Should the government regulate the Internet more than it does now? Perhaps surprisingly, only seven WIP countries reported more than 40 percent of users who disagree with this concept. Among non‐users, 13 countries report that more than 40 percent of non‐users agree that the government should regulate the Internet more than it currently does.
The government should regulate the Internet more than it does now – all respondents
(Q24E MD‐1)

World Internet Project International Report ̶ Sixth Edition | 62
4 Media use, reliability, and importance
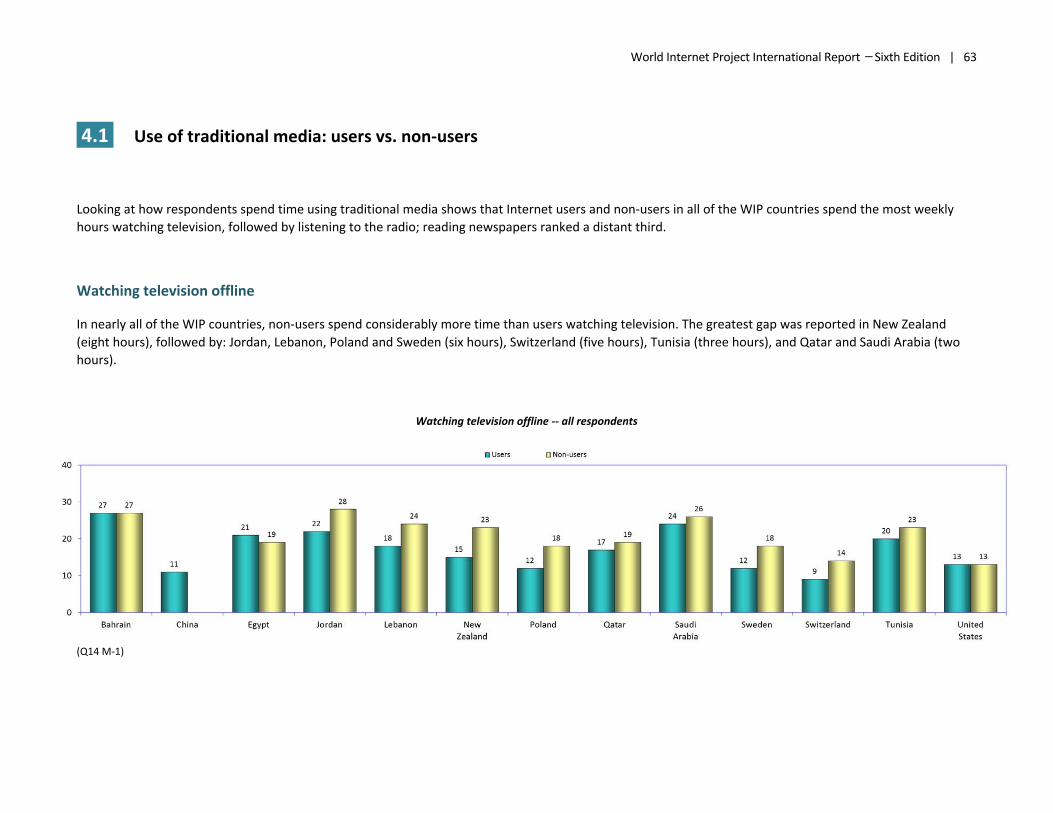
World Internet Project International Report ̶ Sixth Edition | 63
4.1 Use of traditional media: users vs. non‐users
Looking at how respondents spend time using traditional media shows that Internet users and non‐users in all of the WIP countries spend the most weekly hours watching television, followed by listening to the radio; reading newspapers ranked a distant third.
Watching television offline
In nearly all of the WIP countries, non‐users spend considerably more time than users watching television. The greatest gap was reported in New Zealand (eight hours), followed by: Jordan, Lebanon, Poland and Sweden (six hours), Switzerland (five hours), Tunisia (three hours), and Qatar and Saudi Arabia (two hours).
Watching television offline ‐‐ all respondents
(Q14 M‐1)

World Internet Project International Report ̶ Sixth Edition | 64 Listening to radio offline
As with television, non‐users in all WIP countries spend the same or more time per week listening to the radio offline.
The largest gap was reported by Sweden (seven hours), followed by: Switzerland (six hours), New Zealand (five hours), Tunisia (three hours), Poland and Saudi Arabia (two hours), and Jordan, Lebanon and the United States (one hour).
Listening to radio offline ‐‐ all respondents
(Q14 M‐2 and Q14 M‐3))
Reading newspapers offline
Users and non‐users reported similar amounts of time reading print newspapers, with a gap between them of an hour or less per week in all of the countries except Sweden (three hours per week more for non‐users than users) and New Zealand and Switzerland (two hours per week more for non‐users than users).
Reading newspaper offline ‐‐ All respondents

World Internet Project International Report ̶ Sixth Edition | 65
4.2 Media reliability: information on the Internet
Users’ trust of information on the Internet
Beliefs about the reliability of information on the Internet are quite varied among the WIP countries.
In eight of the countries, a substantial majority of users believe that all or most of the information on the Internet is reliable. The largest majority is Saudi Arabia (88 percent), followed by Jordan (87 percent), Bahrain (78 percent), Lebanon (69 percent), Egypt (68 percent), Uruguay (59 percent), and Qatar and the United Kingdom (57 percent).
Every country has a measurable but very small percentages of users who believe none of the information on the Internet is reliable. However, in several countries there is a majority view that all of the information is reliable.
How much of the information on the Internet overall is generally reliable? (Internet users)
(Q11 M‐1)

World Internet Project International Report ̶ Sixth Edition | 66
Reliability of information on the Internet: users vs. non‐users
In all WIP countries, a larger percentage of Internet users than non‐users believe most or all of the information on the Internet is reliable.
The greatest difference was reported by Saudi Arabia (51 percentage points), followed by: Tunisia (42 percentage points), Jordan (39 percentage points), the United Kingdom (36 percentage points), Bahrain (33 percentage points), Switzerland (30 percentage points), Lebanon (27 percentage points), New Zealand (23 percentage points), Qatar (21 percentage points), Egypt (14 percentage points), Italy (13 percentage points), Australia and Spain (12 percentage points), the United States (nine percentage points), and Uruguay (six percentage points).
Internet reliability – Internet users and non‐users responding most or all
(Q11 M‐5)

World Internet Project International Report ̶ Sixth Edition | 67
4.3 Media importance: media as information source (users and non‐users)
At least 60 percent of users in all WIP countries consider the Internet as an important or very important source of information and they rate it as the most important source in all but four countries. In three, television is ranked only marginally higher: Egypt and Lebanon (four percentage points), and Saudi Arabia (three percentage points). And in one, Switzerland, newspapers rank marginally higher than either the Internet or television.
Importance of media as information sources ‐‐ Internet users responding important and very important
(Q12A‐D MD‐1 and Q12 M‐1)
Among non‐users, television ranks above newspapers and radio as important media sources of information in all but two countries. In Spain and Uruguay, non‐users ranked radio as the most important information source. Newspapers did not rank as the most important source in any countries (although in Switzerland newspapers tied with television as the key source).
Importance of media as information sources ‐‐ Internet non‐users responding important and very important

World Internet Project International Report ̶ Sixth Edition | 68
4.4 The Internet: Important for information, but reliable?
Even though large majorities of users in all of the WIP countries consider the Internet to be an important source of information, significant percentages also have little faith in the reliable of the information they find online.
In all of the WIP countries, more than two‐thirds of users said the Internet is important or very important as a source of information; in 11 of the countries, those responses exceed 80 percent.
However, attitudes about the reliability of that information are critical: in six of the WIP countries, a majority of users believe that half or less of the information online is reliable. In China, for instance, the percentage of those who say the Internet is important or very important as a source of information (68 percent) is lower than the percentage who said that only half or less of the information online is reliable (81 percent).
Internet as information source – important and reliable? (Internet users)
(Q11x12 MD‐1)

World Internet Project International Report ̶ Sixth Edition | 69
4.5 Media importance: media as entertainment sources
The Internet ranks as the top entertainment source in ten of the WIP countries, and at least 50 percent of users in every country except Switzerland consider the Internet as important or very important as an entertainment source.
In six countries, television outranks the Internet as an important source of entertainment. The largest difference was reported in Switzerland (24 percentage points), followed by marginal differences in Saudi Arabia (six percentage points), Australia and the United States (four percentage points), Egypt (two percentage points), and Lebanon (one percentage point).
Importance of media as entertainment sources – Internet users responding important and very important
(Q13A‐D MD‐1)

World Internet Project International Report ̶ Sixth Edition | 70
Media importance: media as entertainment sources (continued)
Among non‐users, larger percentages in most countries consider television an important source of entertainment compared to newspapers and radio.
In all the WIP countries, at least 46 percent of non‐users consider radio an important or very important source of entertainment. In three countries, radio ranked higher than television as an important source of entertainment: Spain, United Arab Emirates, and Uruguay.
Importance of media as entertainment sources – Internet non‐users responding important and very important
(Q13A‐D MD‐2)

World Internet Project International Report ̶ Sixth Edition | 71
4.6 Multi‐tasking while online
Internet users in most of the reporting countries are active multi‐taskers.
More than a majority of users in ten of the eleven countries said they multi‐task, such as listening to music, watching television, or using the telephone, while online sometimes or most of the time: Saudi Arabia and Tunisia (79 percent), Bahrain (77 percent), United Arab Emirates (74 percent), Lebanon (71 percent), China (69 percent), Sweden (68 percent), Qatar (67 percent), Egypt (62 percent), and Jordan (55 percent).
Multi‐tasking while online – Internet users
(Q17 M‐1)

World Internet Project International Report ̶ Sixth Edition | 72
5 Online security and personal privacy
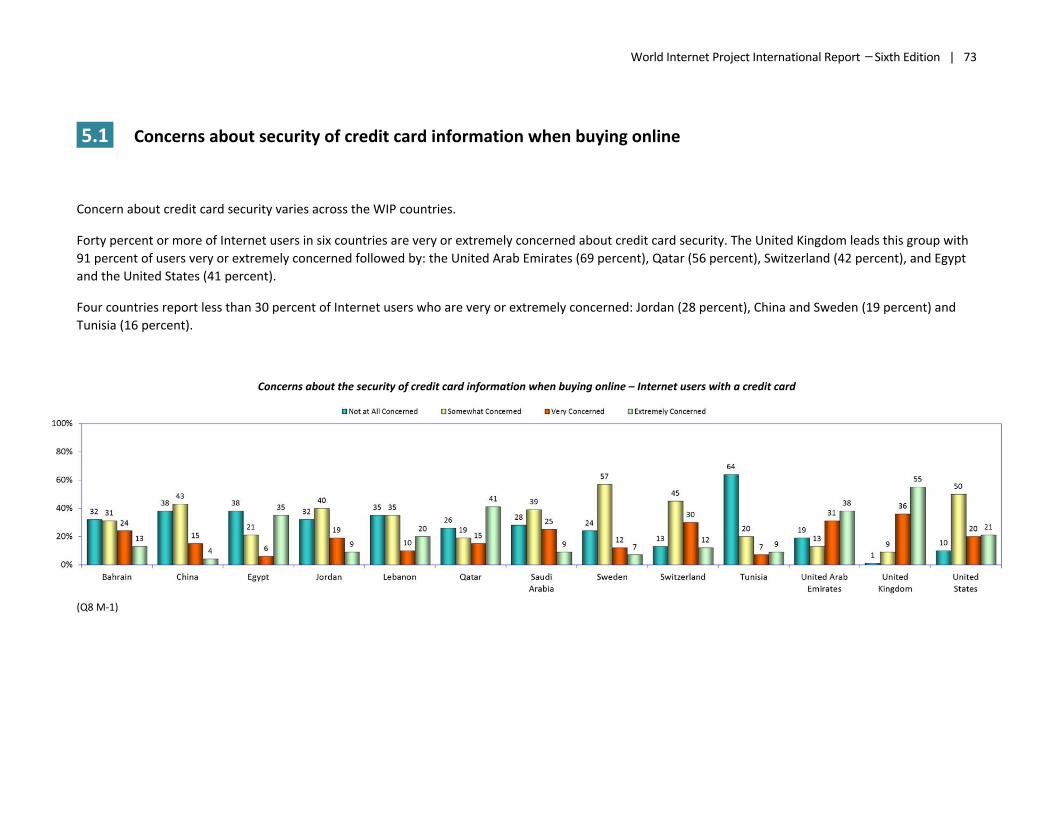
World Internet Project International Report ̶ Sixth Edition | 73
5.1 Concerns about security of credit card information when buying online
Concern about credit card security varies across the WIP countries.
Forty percent or more of Internet users in six countries are very or extremely concerned about credit card security. The United Kingdom leads this group with 91 percent of users very or extremely concerned followed by: the United Arab Emirates (69 percent), Qatar (56 percent), Switzerland (42 percent), and Egypt and the United States (41 percent).
Four countries report less than 30 percent of Internet users who are very or extremely concerned: Jordan (28 percent), China and Sweden (19 percent) and Tunisia (16 percent).
Concerns about the security of credit card information when buying online – Internet users with a credit card
(Q8 M‐1)

World Internet Project International Report ̶ Sixth Edition | 74
5.2 Online privacy
In almost every WIP country, Internet users are more concerned about corporations invading their privacy than they are about government violations. The greatest gap was reported by Australia (15 percentage points), followed by Uruguay (11 percentage points), Spain (10 percentage points), Italy (7 percentage points), and Chile (one percentage point).
In three of the six countries, Internet users express the greatest concern over other people violating their privacy: Uruguay, Italy, and Chile.
There are some paradoxical views expressed in the data. While a majority of users in all countries say they have nothing to hide, and equally high number report that they actively protect their privacy online.
Similarly, the reported figures in several countries for “I feel I can control my privacy online” and the logically opposing view “There is no privacy” are high and almost identical.
Attitudes toward online privacy – Internet users responding somewhat and strongly agree
(Q14b MD‐1)

World Internet Project International Report ̶ Sixth Edition | 75
5.3 At a glance: government and corporations checking online activities
In 11 of the 17 WIP countries, more users are concerned about corporations than governments monitoring their online activities. Switzerland has the greatest difference with 15 percentage points, followed by Australia and Uruguay (14 percentage points), New Zealand (nine percentage points), and Spain and the United States (six percentage points).
Comparison: government and corporate checks of user online behavior – Internet users (somewhat and very concerned)
(Q24F/G MD‐1)

World Internet Project International Report ̶ Sixth Edition | 76
5.4 Concerns about government checking online activities
More than 50 percent of Internet users in four of the WIP countries somewhat or strongly agreed that they were concerned with government checking what they do online: United Arab Emirates (60 percent), Saudi Arabia (55 percent), Chile (53 percent), and Uruguay (52 percent).
On the other hand, at least 50 percent of users in four countries somewhat or strongly disagreed that they were concerned about the government checking what they do online: Egypt and Switzerland (54 percent), Australia (52 percent), and Bahrain (50 percent).
Concerns about government checking of user behavior online – Internet users
(Q24F M‐1)

World Internet Project International Report ̶ Sixth Edition | 77
5.5 Concerns about corporations checking online activities
More than 50 percent of Internet users in six of the WIP countries somewhat or strongly agreed that they were concerned with corporations checking what they do online: Uruguay (65 percent), the United Arab Emirates (58 percent), Chile and the United States (54 percent), and Saudi Arabia and Spain (52 percent).
On the other hand, at least 50 percent of users in three countries somewhat or strongly disagreed that they were concerned about corporations checking what they do online: Egypt (57 percent), Bahrain (55 percent), and Lebanon (53 percent).
Concerns about corporations checking user behavior online – Internet users
(Q24G M‐1)

World Internet Project International Report ̶ Sixth Edition | 78
5.6 Victims of invasion of privacy
Small numbers of Internet users have had their privacy violated online. In all reporting countries, the majority of those who have had their privacy violated feel that the violation was a minor problem.
Victims of Invasion of Privacy – Internet users
(Q13b MD‐1)

World Internet Project International Report ̶ Sixth Edition | 79
5.7 Negative online experiences
At least 30 percent of users in all countries have received a virus on their computer or device.
Financial/consumer abuse (stolen credit card information, phishing for banking or personal details, misrepresentation of online products) is also a common experience across all countries. The highest incidents were reported by Australia (72 percent), the United States (62 percent), followed by Italy (28 percent), New Zealand (21 percent), Spain (19 percent), and Uruguay (13 percent).
Negative online experiences – Internet users
(Q8b MD‐1)

World Internet Project International Report ̶ Sixth Edition | 80
6 Keeping connected through the Internet

World Internet Project International Report ̶ Sixth Edition | 81
6.1 Internet as a communication tool
Even though communicating through social networks has become a popular online activity, using email continues to be a regular daily routine for large percentages of Internet users.
More than half of users in 15 of the 19 WIP countries check email daily or several times a day: New Zealand (89 percent), the United States (86 percent), Australia (85 percent), Switzerland (85 percent), Sweden (77 percent), Spain (75 percent), the United Kingdom (71 percent), Bahrain (67 percent), Italy (67 percent), Qatar (66 percent), Lebanon (65 percent), Poland (60 percent), Saudi Arabia (58 percent), Tunisia (56 percent), and Uruguay (55 percent).
Only four countries reported less than half of users sending emails every day: Chile (48 percent), China (26 percent), Egypt (25 percent), and Jordan (19 percent).
While email use is a frequent activity in most countries for nearly all users, in several countries a significant number of users never check email (this polarization could indicate that if email is used at all, it used regularly). The countries with the smallest group of users who only occasionally (monthly or less than monthly) check their emails are: Switzerland (one percent), New Zealand (two percent), Australia (three percent), Sweden (four percent), and the United States (five percent).
Internet users who use email
(Q19A M‐1)

World Internet Project International Report ̶ Sixth Edition | 82 Instant Messaging
Compared with sending and receiving email, instant messaging is used less frequently in the WIP countries.
Only seven countries reported that 50 percent or more of users access instant messaging every day, and only another five reported numbers of at least 40 percent: Lebanon (77 percent), Spain (75 percent), Bahrain (71 percent), China (66 percent), Tunisia (67 percent), Saudi Arabia (65 percent), Chile (50 percent), Qatar (49 percent), the United Arab Emirates (45 percent), the United Kingdom (41 percent), Jordan and Uruguay (40 percent).
Internet users who use instant messaging
(Q19B M‐1 and Q19E M‐1)
Web‐based phone calls
While all countries report some people going online daily to make or received web‐based calls, only countries in the Middle East reported more than 30 percent of daily users: Lebanon (59 percent), Bahrain (56 percent), Saudi Arabia (53 percent), Tunisia (50 percent), Qatar (37 percent), and the United Arab Emirates (35 percent).
Internet users who make or receive phone calls over the Internet

World Internet Project International Report ̶ Sixth Edition | 83
Overview of Internet use for communication: weekly, daily and several times a day
In all but three WIP countries, more than 70 percent of users check email at least weekly. Only Egypt (47 percent), Jordan (48 percent), and China (57 percent) recorded less than 70 percent. Nearly the same number of countries (14 of 20) report a majority of users send or receive instant messages at least weekly.
All countries report at least 15 percent of their users send or receive VOIP phone calls weekly and six countries report figures of over 50 percent: Saudi Arabia (81 percent), Lebanon (73 percent), Bahrain (71 percent), Tunisia (70 percent), United Arab Emirates (65 percent), and Qatar (60 percent).
Internet as a communication tool – Internet users weekly/daily/several times a day
(Q19ABE MD‐1 and MD‐2)
Internet as a communication tool – Internet users never

World Internet Project International Report ̶ Sixth Edition | 84
6.2 Social media: user generated content
Work on blogs
Seven countries report that 30 percent or more of users work on their own blog on at least a weekly basis: Saudi Arabia (72 percent), the United Arab Emirates (62 percent), Lebanon (53 percent), Bahrain (44 percent), Jordan and Qatar (36 percent), and China (30 percent).
Internet users who work on a personal blog
(Q19F M‐1)

World Internet Project International Report ̶ Sixth Edition | 85 Update personal status
In all but three countries, the majority of users update their personal status on social networking sites at least occasionally.
Nine of the countries report 40 percent or more of their users update their status at least weekly: the United Arab Emirates (65 percent), Bahrain and China (57 percent), Lebanon (55 percent), Qatar (50 percent), Jordan and Saudi Arabia (49 percent), Tunisia (48 percent), and the United Kingdom (40 percent).
Internet users who update their personal status
(Q19J M‐1 and Q16Fb M‐1)
Post content
Compared to those who update their personal status on social networking sites, smaller numbers of users post content (photos, music, writing, etc.) that they created. Nonetheless, at least 45 percent of users in all countries post their own content on the Internet.
Internet users who post their own personal content

World Internet Project International Report ̶ Sixth Edition | 86
Post photos or pictures
In all of the reporting countries, a majority of users post photos online. In eight countries, more than 40 percent of users post photos online at least weekly: Saudi Arabia (64 percent), the United Arab Emirates (63 percent), Bahrain (61 percent), Tunisia (58 percent), Lebanon (51 percent), Egypt (46 percent), Qatar (44 percent), and Jordan (42 percent).
Internet users who post photos or pictures
(Q19G M‐1)

World Internet Project International Report ̶ Sixth Edition | 87
6.3 Social media – content posted by others
Visit social networking sites
A majority in almost all countries visit social networking sites at least weekly. Again, as with email, there are few users who visit social networking sites only occasionally. Instead, most countries report that users either visit these sites frequently, or not at all.
Internet users who visit social networking sites*
(Q21Ib 18I MD‐1 and MD‐2) *the question asked in these countries included both social networking and video sharing websites

World Internet Project International Report ̶ Sixth Edition | 88
Post messages or comments on social networking sites
Posting messages on social networking sites is less common than visiting those sites. The largest gap was reported by Chile (33 percent), followed by Italy and the United States (19 percent), and Australia (16 percent).
Internet users who post messages/comments on social networking sites
(Q16E‐b M‐1)
Internet users who participate in these activities weekly, daily or several times a day
(Q16E‐b and Q18I‐b MD‐1)

World Internet Project International Report ̶ Sixth Edition | 89
Participate in chat rooms
Participation in chat rooms varies widely across WIP countries. The lowest participation is in the United Kingdom (29 percent) and the highest in Saudi Arabia (95 percent).
Across all countries, the numbers who occasionally (monthly or less than monthly) participate in chat rooms are low. The highest number was reported by Poland (20 percent), followed closely by the United Arab Emirates (16 percent), Bahrain, Jordan, and Qatar (15 percent), and Egypt and the United Kingdom (14 percent).
Internet users who participate in chat rooms
(Q19C M‐1)
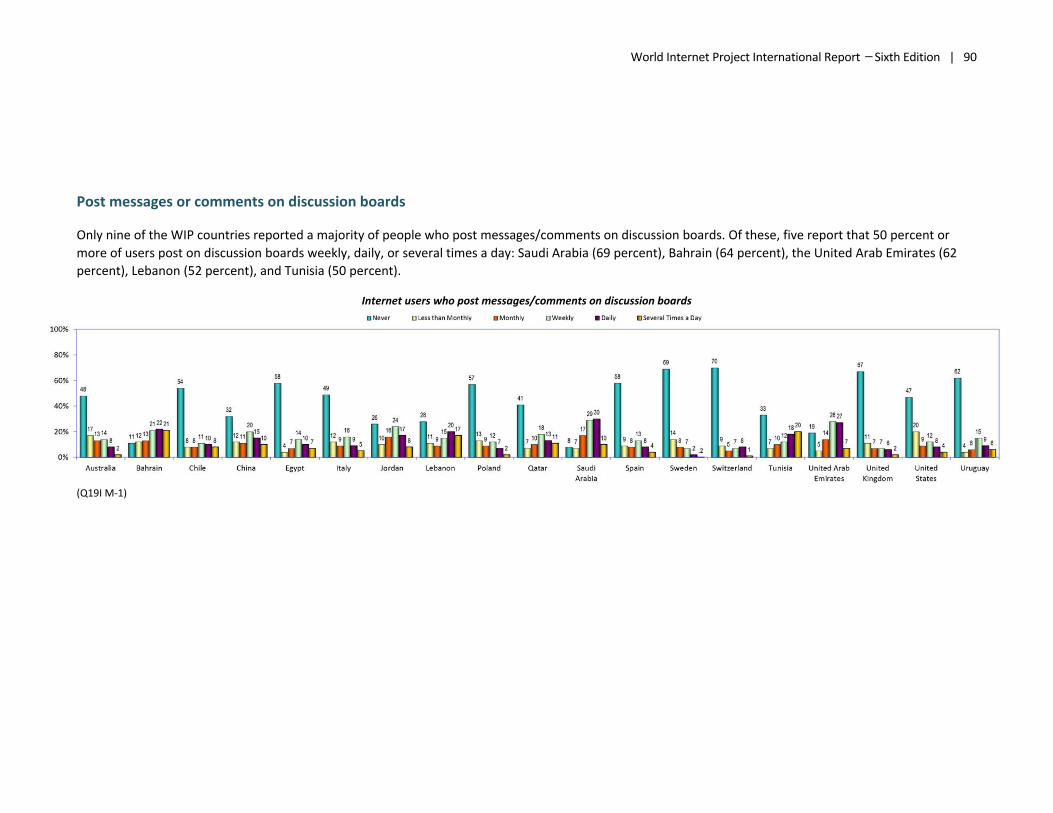
World Internet Project International Report ̶ Sixth Edition | 90
Post messages or comments on discussion boards
Only nine of the WIP countries reported a majority of people who post messages/comments on discussion boards. Of these, five report that 50 percent or more of users post on discussion boards weekly, daily, or several times a day: Saudi Arabia (69 percent), Bahrain (64 percent), the United Arab Emirates (62 percent), Lebanon (52 percent), and Tunisia (50 percent).
Internet users who post messages/comments on discussion boards
(Q19I M‐1)

World Internet Project International Report ̶ Sixth Edition | 91 Read blogs
Fourteen of twenty countries reported that a majority of users read blogs. Six countries report 50 percent or more of users go online weekly, daily, or several times a day: Uruguay (81 percent), Saudi Arabia (63 percent), the United Arab Emirates (60 percent), Tunisia (56 percent), Lebanon (53 percent) and Jordan (50 percent).
Internet users who read blogs
(Q20D M‐1 and Q19K M‐1)
Comment on other people’s postings
Nearly every country reported a majority of users post comments on other people’s postings. And six report that 30 percent or more users post these comments at least once a day: Bahrain (51 percent), Lebanon (43 percent), Jordan (41 percent), Tunisia (40 percent), Saudi Arabia (39 percent) and the United Arab Emirates (35 percent).
Internet users who comment on other people’s blogs, message boards, etc.

World Internet Project International Report ̶ Sixth Edition | 92
Going viral
A majority of users in all countries share links and content. In three countries, 20 percent or more of users reported doing this on at least a daily basis: Uruguay (22 percent), and Chile and Italy (20 percent).
Internet users who share/repost links or content generated by others
(Q16G‐b M‐1))

World Internet Project International Report ̶ Sixth Edition | 93
6.4 At‐a‐glance: being social on the Internet
At‐a‐glance: user‐generated content
Large numbers of users in most countries create and post their own content.
At least 40 percent of users in nine countries update their status at least weekly: the United Arab Emirates (65 percent), Bahrain and China (56 percent), Lebanon (55 percent), Qatar and Saudi Arabia (50 percent), Jordan (49 percent), Tunisia (48 percent), and the United Kingdom (40 percent).
At the same time, at least 40 percent of users in eight countries post their own photos on the web weekly or more often: Saudi Arabia (65 percent), the United Arab Emirates (64 percent), Bahrain (61 percent), Tunisia (57 percent), Lebanon (51 percent), Egypt (45 percent), Qatar (44 percent), and Jordan (41 percent).
Posting personal content – Internet users weekly, daily and several times a day
(Q19FGHJ MD‐1)

World Internet Project International Report ̶ Sixth Edition | 94
At‐a‐glance: content posted by others
Social networking sites garner the most regular participation of any category.
Only one country reported less than 40 percent of users who visit social networking sites at least weekly. Similarly, only two of 11 countries reported that less than 40 percent of users comment on other people’s blogs at least weekly. And three of 11 countries reported less than 40 percent participate in chat rooms at least weekly.
Being social on the Internet – Internet users
(Q18I/21I‐b 19C‐I‐K 20D MD‐1)

World Internet Project International Report ̶ Sixth Edition | 95
7 Research, Education, and Jobs

World Internet Project International Report ̶ Sixth Edition | 96
7.1 Research
Surfing the Web
In every country, a majority of users go online to surf the web at least weekly.
In 12 of 14 countries, more than 70 percent of users surf the web at least weekly. Only six countries reported more than 10 percent of users who never browse the web.
Internet users who surf or browse the Web
(21G M‐1 and MD‐1)

World Internet Project International Report ̶ Sixth Edition | 97
Look for News
Looking for news is one of the most common activities on the web. In half of the WIP countries, 50 percent or more of users look for news online daily or several times a day: China (66 percent), Bahrain (63 percent), Spain (59 percent), Tunisia (58 percent), Egypt (56 percent), Italy (55 percent), New Zealand (54 percent), the United States (54 percent), Uruguay (51 percent), and Saudi Arabia (51 percent).
And all but one country reported a majority of users who look for news at least weekly (Switzerland was only slightly under at 49 percent).
Internet users who look for news
(20A M‐1)

World Internet Project International Report ̶ Sixth Edition | 98
Fact checking
Thirteen of the 16 WIP countries report that a majority of users go online to check a fact at least weekly: Tunisia (80 percent), Egypt (74 percent), Jordan and Uruguay (66 percent), New Zealand (64 percent), Bahrain, Saudi Arabia and the United States (63 percent), Lebanon (60 percent), Australia (59 percent), Sweden (57 percent), Spain (54 percent), and China (53 percent).
Nine of these report that a quarter or more of their users check facts online at least daily: Tunisia (57 percent), Egypt (38 percent), Lebanon (36 percent), Bahrain (35 percent), Saudi Arabia and the United States (32 percent), Jordan (28 percent), and China and New Zealand (27 percent).
Internet users who find or check a fact online
(23B M‐1)

World Internet Project International Report ̶ Sixth Edition | 99
Definitions
In all of the WIP reporting countries, a majority of users go online to look for definitions of words.
All but two countries report that 40 percent or more of their users look up definitions online at least weekly: Tunisia (73 percent), Qatar (62 percent), Spain (61 percent), Egypt (60 percent), Saudi Arabia (59 percent), Bahrain and Lebanon (51 percent), United States (49 percent), New Zealand (47 percent), Australia (43 percent), Jordan (42 percent), Switzerland (40 percent), and Sweden (37 percent).
Three countries report that more than one quarter of their users look up definitions at least daily: Tunisia (55 percent), Qatar (35 percent), Egypt (31 percent), Lebanon (30 percent), and Bahrain (27 percent).
Internet users who look up definitions of words online
(23A M‐1)

World Internet Project International Report ̶ Sixth Edition | 100
Research for school
Most of the WIP countries report that at least a third of their student users go online at least weekly to conduct research for school: China (61 percent), United Arab Emirates (56 percent), Uruguay (51 percent), Spain (42 percent), Saudi Arabia (39 percent), Egypt (38 percent), Australia and Tunisia (36 percent), Lebanon (35 percent), Qatar (34 percent), and Bahrain (33 percent).
In three WIP countries, more than a quarter of student users go online once a day or more often for school research: China (31 percent), the United Arab Emirates (30 percent), and Uruguay (27 percent).
Internet users who go online for information for school‐related work (Internet users who are students and not employed)
(23C M‐1)

World Internet Project International Report ̶ Sixth Edition | 101
7.2 Jobs and Education
Distance learning
Most countries reported small percentages of Internet users who go online to participate in distance learning for job training or an academic degree.
However, several countries report more than 10 percent of users who go online at least monthly for distance learning: United Arab Emirates (65 percent), Saudi Arabia (37 percent), Bahrain (27 percent), Qatar (24 percent), Australia and New Zealand (18 percent), Spain (17 percent), China and the United States (16 percent), Jordan and the United Kingdom (13 percent), and Egypt and Lebanon (10 percent).
Eight WIP countries reported 10 percent or more of student users who go online for distance learning at least weekly: United Arab Emirates (52 percent), Saudi Arabia (25 percent), Australia, Bahrain, and Qatar (14 percent), New Zealand (11 percent), and Spain and the United States (10 percent).
Internet users who go online to participate in distance learning for job training or an academic degree
(Q23D M‐1))

World Internet Project International Report ̶ Sixth Edition | 102
Job searching
Online job searching is common in most of the WIP countries.
Seventeen of the 19 countries report that a quarter or more of their users go online to find jobs or work at least occasionally: the United Arab Emirates (78 percent), China (63 percent), New Zealand (62 percent), Bahrain (56 percent), the United States (55 percent), Saudi Arabia (53 percent), Australia (52 percent), the United Kingdom (50 percent), Poland (49 percent), Qatar (47 percent), Tunisia (42 percent), Chile (40 percent), Spain (38 percent), Jordan (37 percent), Italy (36 percent), Sweden (32 percent), Lebanon (30 percent), and Egypt (26 percent).
Internet users who go online to look for jobs or work
(Q20C M‐1)

World Internet Project International Report ̶ Sixth Edition | 103
7.3 At‐a‐glance: research, education and job searching on the Internet
Research
Users regularly go online to conduct various types of research.
A majority of users in all WIP countries go online at least weekly to browse the web. Similarly, a majority of users in all but one country (Switzerland 49 percent) go online for news at least once a week. Thirteen countries report that a majority of users go online to find/check a fact and six countries report that a majority of users go online to look up definitions of words at least weekly.
Research weekly, daily or several times a day – Internet users
(Q20A 23A‐C 21G MD‐1)

World Internet Project International Report ̶ Sixth Edition | 104
Distance Learning and Job Searching
All of the participating WIP countries report more than 20 percent of users go online to look for work or jobs.
Distance learning is less common as only ten WIP countries reported more than 20 percent of users who access distance learning.
Distance Learning or Job Searching less than monthly or more – Internet users
(Q20C 23D MD‐1)

World Internet Project International Report ̶ Sixth Edition | 105
8 Buying, selling, and financial management

World Internet Project International Report ̶ Sixth Edition | 106
8.1 Buying and selling
Get information about a product
More than 40 percent of users in all of the WIP reporting countries look for product information online at least monthly: Australia (86 percent), New Zealand (82 percent), the United States (79 percent), Saudi Arabia (77 percent), Spain (76 percent), Italy (70 percent), Uruguay (68 percent), China and Qatar (65 percent), Bahrain, Sweden, and Tunisia (62 percent), the United Arab Emirates and the United Kingdom (59 percent), Switzerland (57 percent), Egypt and Jordan (45 percent), Lebanon (44 percent), and Chile (41 percent).
Significant numbers of users also go online frequently to look for product information. Twelve of the 19 WIP countries report more than 40 percent of users go online for product information at least weekly: Australia (69 percent), Saudi Arabia and the United States (54 percent), New Zealand (53 percent), China (52 percent), Spain and Tunisia (49 percent), the United Arab Emirates and Uruguay (48 percent), Italy (45 percent), Bahrain and Qatar (43 percent).
Internet users who go online to look for product information
(Q22A M‐1)
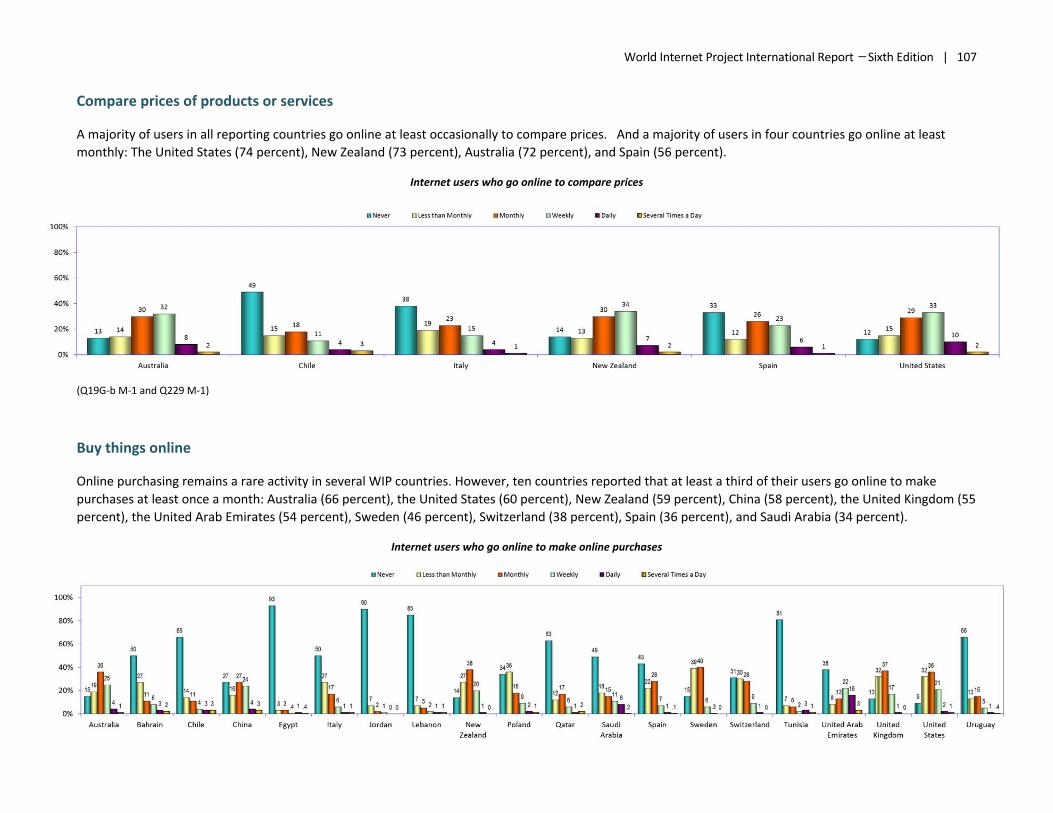
World Internet Project International Report ̶ Sixth Edition | 107 Compare prices of products or services
A majority of users in all reporting countries go online at least occasionally to compare prices. And a majority of users in four countries go online at least monthly: The United States (74 percent), New Zealand (73 percent), Australia (72 percent), and Spain (56 percent).
Internet users who go online to compare prices
(Q19G‐b M‐1 and Q229 M‐1)
Buy things online
Online purchasing remains a rare activity in several WIP countries. However, ten countries reported that at least a third of their users go online to make purchases at least once a month: Australia (66 percent), the United States (60 percent), New Zealand (59 percent), China (58 percent), the United Kingdom (55 percent), the United Arab Emirates (54 percent), Sweden (46 percent), Switzerland (38 percent), Spain (36 percent), and Saudi Arabia (34 percent).
Internet users who go online to make online purchases

World Internet Project International Report ̶ Sixth Edition | 108 Make travel bookings or reservations
Despite travel being typically an “occasional” event, a majority of users in most countries have used the Internet to make travel arrangements: New Zealand and the United Kingdom (81 percent), Australia (80 percent), Sweden (77 percent), the United States (72 percent), the United Arab Emirates (63 percent), Switzerland (60 percent), Italy and Saudi Arabia (59 percent), Bahrain and Spain (57 percent), and Qatar (56 percent).
Internet users who go online to make travel arrangements
(Q22C M‐1)

World Internet Project International Report ̶ Sixth Edition | 109
Sell things online
Three countries reported over one third of users sell things online and all countries reported measurable numbers: New Zealand (59 percent), the United States (39 percent), Australia (37 percent), Chile and Uruguay (19 percent), Spain (12 percent), and Italy (11 percent).
Internet users who go online to sell things
(Q19H‐b M‐1)

World Internet Project International Report ̶ Sixth Edition | 110
8.2 Financial management
Pay Bills
Eleven WIP countries reported a majority of users who pay bills online: Sweden (86 percent), New Zealand (82 percent), Australia (79 percent), the United States (75 percent), China (69 percent), Switzerland (65 percent), Poland and Saudi Arabia (62 percent), the United Arab Emirates (60 percent), the United Kingdom (59 percent), and Bahrain (56 percent).
Internet users who pay bills online
(Q22D M‐1)

World Internet Project International Report ̶ Sixth Edition | 111
Use of bank online services
Eleven countries report a majority of users who access their banks’ online services: Sweden (90 percent), New Zealand (87 percent), Australia (84 percent), the United States (81 percent), China (67 percent), Bahrain (65 percent), the United Kingdom (63 percent), Poland (62 percent), Saudi Arabia (60 percent), the United Arab Emirates (59 percent), and Spain (53 percent).
Internet users who use their bank’s online services
(Q22E M‐1)

World Internet Project International Report ̶ Sixth Edition | 112
Investing
Very small numbers of users in nearly all countries participate in online investing.
Only eight countries report more than 10 percent of users who invest online: the United Arab Emirates (54 percent), Saudi Arabia (37 percent), Bahrain (25 percent), the United States (24 percent), Australia (19 percent), New Zealand and Qatar (15 percent), and China (14 percent).
Internet users who invest online
(Q22F M‐1)

World Internet Project International Report ̶ Sixth Edition | 113
8.3 At‐a‐glance: online buying and financial tools
Comparison: buying, selling, and make travel reservations online
More than one‐third of users in twelve of the WIP countries look for product information online at least weekly: Australia (69 percent), Saudi Arabia and the United States (54 percent), New Zealand (53 percent), China (52 percent), Spain and Tunisia (49 percent), the United Arab Emirates and Uruguay (48 percent), Italy (45 percent), Bahrain (44 percent), and Qatar (42 percent).
Only three countries report similar figures for online price comparisons: the United States (44 percent), New Zealand (43 percent), and Australia (42 percent).
Buying and selling online – weekly, daily and several times a day
(Q19H‐b 19G‐b 22A‐C MD‐1)
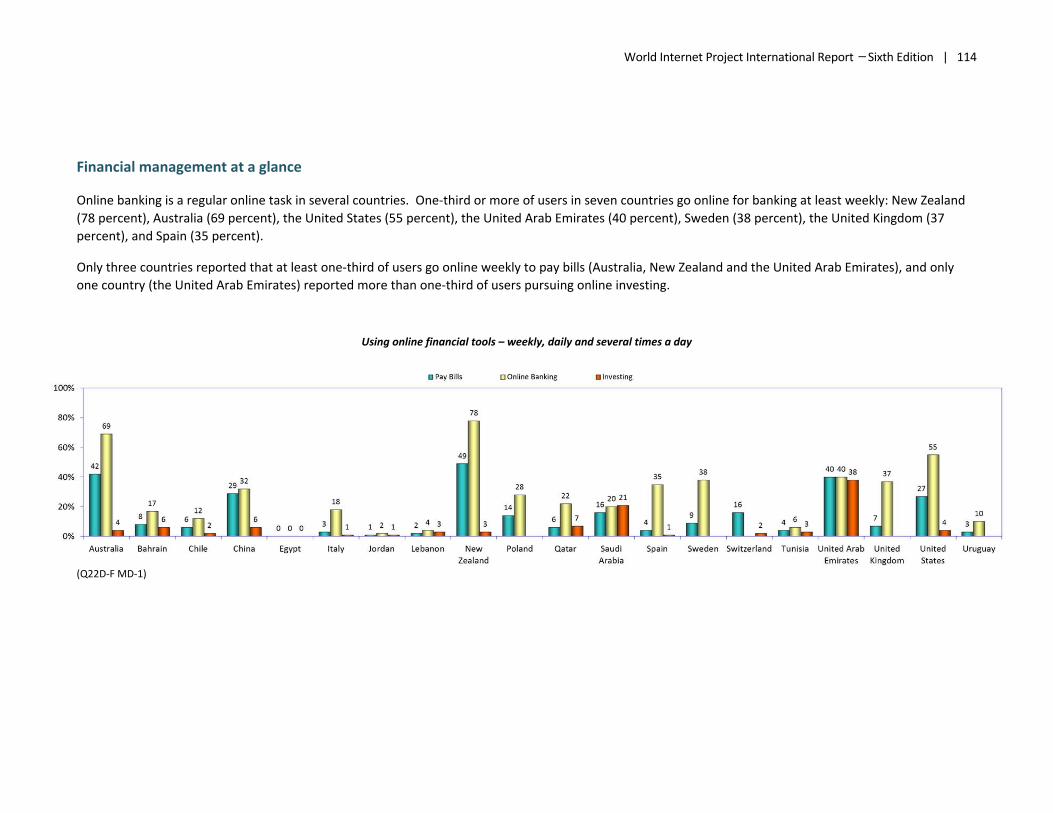
World Internet Project International Report ̶ Sixth Edition | 114
Financial management at a glance
Online banking is a regular online task in several countries. One‐third or more of users in seven countries go online for banking at least weekly: New Zealand (78 percent), Australia (69 percent), the United States (55 percent), the United Arab Emirates (40 percent), Sweden (38 percent), the United Kingdom (37 percent), and Spain (35 percent).
Only three countries reported that at least one‐third of users go online weekly to pay bills (Australia, New Zealand and the United Arab Emirates), and only one country (the United Arab Emirates) reported more than one‐third of users pursuing online investing.
Using online financial tools – weekly, daily and several times a day
(Q22D‐F MD‐1)

World Internet Project International Report ̶ Sixth Edition | 115
9 Online entertainment and personal interest

World Internet Project International Report ̶ Sixth Edition | 116
9.1 Entertainment
Download or watch videos
Only one WIP country (Sweden) reported that more than 50 percent of users never download or watch videos. Sweden and Switzerland are the only countries that reported more users occasionally going online for videos than regularly going online for this purpose. Saudi Arabia (92 percent) and China (89 percent) showed the greatest percentages of users accessing online videos.
In several countries, a much larger number of users access videos regularly. China recorded the largest difference between regular and occasional video downloading/viewing (67 percentage points), followed by: Tunisia (48 percentage points), the United Arab Emirates (47 percentage points), Saudi Arabia (44 percentage points), and Egypt (42 percentage points). In 14 of the 19 countries, users who go online for videos are most likely to do so on a weekly basis.
Internet users who go online to download or watch videos
(Q21C M‐1 and MD‐1)

World Internet Project International Report ̶ Sixth Edition | 117
Download or listen to music
Very large majorities of Internet users go online to download or listen to online music. Unlike video, all countries reported more than 50 percent of users accessing online music. Switzerland had the lowest number of users (51 percent) and was also the only country where occasional use was higher than regular use.
In 15 of the 18 countries, people who access online music were most likely to do so weekly (in three countries the numbers were the same for daily access).
Internet users who go online to download or listen to music
(Q21B M‐1)

World Internet Project International Report ̶ Sixth Edition | 118
Online radio
Only five countries reported that more than 50 percent of users listen to online radio stations: the United Arab Emirates (73 percent), Saudi Arabia (62 percent), Bahrain (60 percent), the United States (58 percent), and Tunisia (54 percent).
Among users who listen to online radio, the frequency is spread evenly between regular and occasional listeners. Only the United Arab Emirates (38 percentage points) and Chile and Tunisia (21 percentage points) reported a significant difference, with more frequent weekly or more listening.
Internet users who access the Internet for online radio
(Q21E M‐1 and MD‐1)

World Internet Project International Report ̶ Sixth Edition | 119
Online games
All but two WIP countries reported that at least 40 percent of users go online for games. Only Switzerland (29 percent) and Spain (35 percent) reported lower numbers of users accessing online games. And those who go online for games are far more likely to do so regularly.
The United Arab Emirates (45 percentage points) reported the largest gap of regular over occasional usage, followed by China (44 percentage points), Tunisia (43 percentage points), Egypt and Saudi Arabia (35 percentage points), and Bahrain, Italy and Jordan (30 percentage points).
Internet users who play online games
(Q21A M‐1 and MD‐1)

World Internet Project International Report ̶ Sixth Edition | 120
Online gambling
Internet users in the WIP countries rarely go online to bet, gamble, or enter sweepstakes.
In all of the WIP countries, 80 percent or more of users never go online to bet, and in none of the countries do more than nine percent of users go online to bet weekly or more.
The largest percentage of users who bet, gamble, or enter sweepstakes at all was reported in the United Kingdom (20 percent total).
Internet users who go online to get, gamble, or enter sweepstakes
(Q21F M‐1)

World Internet Project International Report ̶ Sixth Edition | 121
9.2 Personal interest
Looking for jokes or humorous content
Using the Internet to find jokes or humor is popular across nearly all the WIP countries. In all but four countries, a majority of users go online to find humorous content at least occasionally. The frequency of usage within those countries varies greatly. In over half of the WIP countries, more than 40 percent of users go online at least weekly to find humor. The highest number of frequent users was reported by Tunisia (68 percent). Nine of the 17 countries reported that at least 25 percent of their users go online occasionally to find humor.
Among those who go online for humor, most users go online weekly. In more than half of the countries, the highest numbers of people access humor weekly: Jordan (34 percent), Saudi Arabia (30 percent), China (28 percent), Egypt (27 percent), Bahrain (26 percent), Qatar and Spain (25 percent), Lebanon (19 percent), and Chile (12 percent). Six of the remaining countries report their highest access numbers in the less than monthly category: Poland (22 percent), New Zealand and the United States (21 percent), the United Kingdom (19 percent), Australia (17 percent), and Italy (15 percent).
Internet users who go online to search for jokes or humorous content
(Q20E M‐1 and MD‐1)

World Internet Project International Report ̶ Sixth Edition | 122 Health information
In all but two WIP countries, at least 70 percent of users go online for health information.
The frequency among the reporting countries varies significantly. In eight countries, at least 50 percent of users go online only occasionally for health information: Australia and Sweden (59 percent), Poland (58 percent), the United Kingdom and the United States (57 percent), New Zealand (56 percent), Italy (52 percent), and Switzerland (50 percent). In seven countries, at least 50 percent of users go online at least weekly for health information: the United Arab Emirates (60 percent), Qatar (57 percent), Egypt (55 percent), Bahrain (54 percent), Saudi Arabia (53 percent), Tunisia (51 percent) and Jordan (50 percent).
Internet users who search online for health information
(Q20F M‐1 and MD‐1)
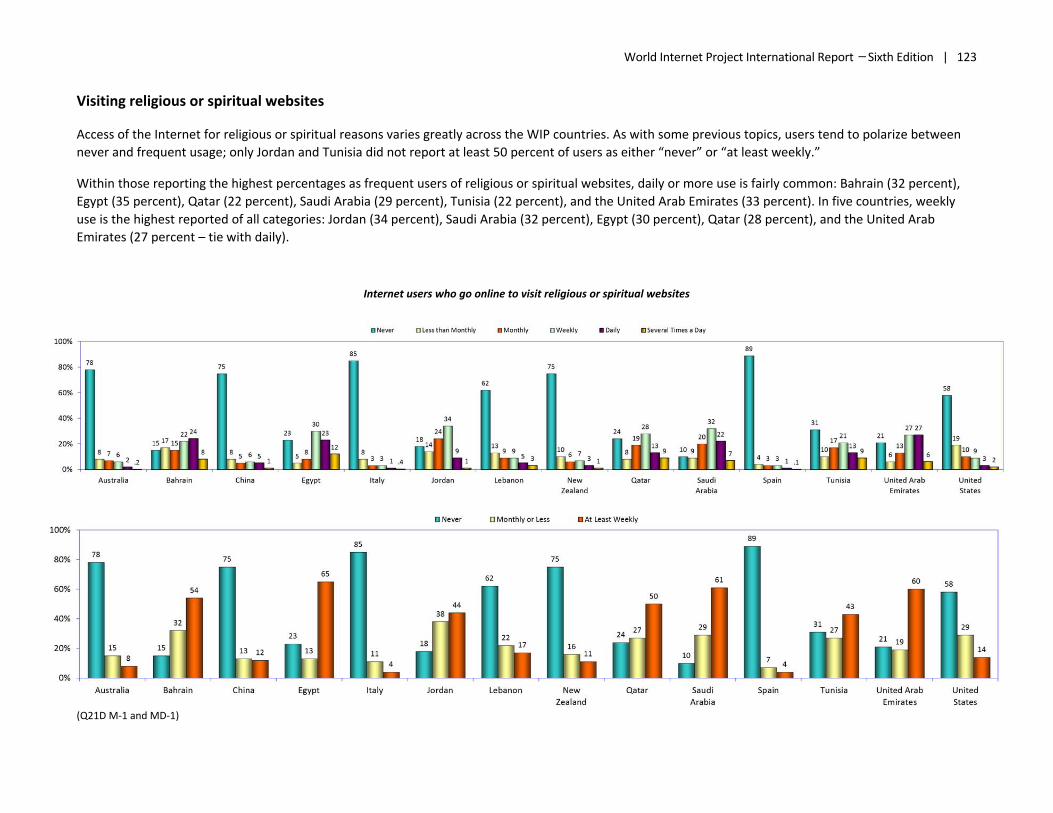
World Internet Project International Report ̶ Sixth Edition | 123 Visiting religious or spiritual websites
Access of the Internet for religious or spiritual reasons varies greatly across the WIP countries. As with some previous topics, users tend to polarize between never and frequent usage; only Jordan and Tunisia did not report at least 50 percent of users as either “never” or “at least weekly.”
Within those reporting the highest percentages as frequent users of religious or spiritual websites, daily or more use is fairly common: Bahrain (32 percent), Egypt (35 percent), Qatar (22 percent), Saudi Arabia (29 percent), Tunisia (22 percent), and the United Arab Emirates (33 percent). In five countries, weekly use is the highest reported of all categories: Jordan (34 percent), Saudi Arabia (32 percent), Egypt (30 percent), Qatar (28 percent), and the United Arab Emirates (27 percent – tie with daily).
Internet users who go online to visit religious or spiritual websites
(Q21D M‐1 and MD‐1)

World Internet Project International Report ̶ Sixth Edition | 124
Travel information
Perhaps because for most people travel is an infrequent event, a majority of users in nearly all WIP countries search for travel information only occasionally.
Only Egypt (74 percent), Jordan (60 percent), Lebanon and Chile (56 percent), and Tunisia (52 percent) report that a majority of their users never use the Internet for travel information. (For information on travel book or reservations, see page 108.)
Internet users who search online for travel information
(Q20B M‐1 and MD‐1)

World Internet Project International Report ̶ Sixth Edition | 125
Sexual content
A majority of users never go online for sexual content.
For those users who report going online for sexual content, most do it occasionally. In all but one country, most users who look at sites with sexual content do so less than monthly.
Internet users who search online for sexual content
(Q21H M‐1 and MD‐1)

World Internet Project International Report ̶ Sixth Edition | 126
9.3 At a glance
Entertainment
Downloading music and videos are the most common Internet entertainment activity. All but one of the countries report their highest number of frequent users in one or both of these categories. The remaining country (Bahrain) reported the highest number of users playing games.
Twelve countries reported the highest number of frequent users who download/listen to music: China (78 percent – tied with videos), Tunisia (75 percent), Saudi Arabia (69 percent), Jordan (57 percent), Egypt (54 percent), Lebanon (52 percent), Uruguay (51 percent), Qatar (50 percent), the United States (44 percent), Chile and Spain (43 percent), and Sweden (34 percent).
Five countries reported the highest number of frequent users who download/watch videos: China (78 percent – tied with music), the United Arab Emirates (64 percent), Australia (49 percent), Italy (47 percent), New Zealand (39 percent), and Switzerland (31 percent).
Entertainment at a glance – weekly, daily, several times a day
(Q21A‐C, E‐F MD‐1)

World Internet Project International Report ̶ Sixth Edition | 127
Personal interest at a glance
Analysis of access to websites for personal interest shows that many use these sites at least weekly. While use of these sites varies, frequent use of these sites is a common activity in the lives of many users.
Personal interest at a glance – weekly, daily, several times a day
(Q20B‐E‐F 21D‐H MD‐1)

World Internet Project International Report ̶ Sixth Edition | 128
APPENDIX

World Internet Project International Report ̶ Sixth Edition | 129
APPENDIX 1 | World Internet Project: International Contacts
UNITED STATES Center for the Digital Future www.digitalcenter.org (Organizer) USC Annenberg School for Communication and Journalism AFRICA (Botswana, Cameroon, Ethiopia, Ghana, Kenya, Mozambique, Namibia, Nigeria, Rwanda, South Africa, Tanzania, Uganda) Contact: Indrade Lanerolle, [email protected]
AUSTRALIA ARC Center of Excellence for Creative Industries and Innovation (CCi) www.cci.edu.au/projects/digital‐futures Institute of Social Research, Swinburne University of Technology BELGIUM University of Antwerp www.uantwerpen.be/en/rg/mios/mission‐and‐members Institute of Social Research, Swinburne University of Technology
CANADA Canadian Internet Project (CIP)/Recherche Internet Canada (RIC) www.ciponline.ca
CAPE VERDE Inove Research, Lda http://research.inove.cv/
CHILE Pontificia Universidad Catolica de Chile, School of Communications (UC) www.wipchile.cl Sociology and Engineering/Santiago Chamber of Commerce (CCS)
CHINA China Internet Network Information Center www.cnnic.cn
COLOMBIA Centro de Investigacion de las Telecomunicaciones (CINTEL) www.cintel.org.co
CYPRUS Cyprus University of Technology (CUT) http://www.cut.ac.cy/ Department of Communication and Internet Studies
CZECH REPUBLIC Masaryk University, Brno, Faculty of Social Sciences (FSS) www.fss.muni.cz/ivdmr
ECUADOR Universidad de los Hemisferios (University of the Hemispheres) www.uhemisferios.edu.ec
FRANCE Center for Political Research at Sciences‐Po (CEVIPOF) www.cevipof.com

World Internet Project International Report ̶ Sixth Edition | 130
GERMANY WIK Consult http://www.wik‐consult.com
HUNGARY Information Society and Network Research Center (ITHAKA) www.ithaka.hu
IRAN University of Alzahra www.alzahra.ac.ir
ISRAEL The Research Center for Internet Psychology (CIP) www.idc.ac.il/communications/cip/en Sammy Ofer School of Communications, The Interdisciplinary Center (IDC)
ITALY SDA Bocconi, Bocconi University www.sdabocconi.it/home/it
JAPAN Toyo University, World Internet Project Japan (JWIP) www.soc.toyo.ac.jp/~mikami/wip/en/index.html
MACAO University of Macau, ERS E‐Research (Lab) www.macaointernetproject.net Macao Internet Project (MIP)
MEXICO Tecnologico de Monterrey, Proyecto Internet www.wip.mx
MIDDLE EAST (Behrain, Egypt, Jordan, Lebanon, Qatar, Saudi Arabia, Tunisia, United Arab Emirates) www.wip.mx Contact: Robb Barton Wood, [email protected]
NEW ZEALAND Institute of Culture, Discourse and Communication (ICDC), AUT University of Technology www.wipnz.aut.ac.nz
POLAND Gazeta.pl Research and Analyses Unit http://badania.gazeta.pl
PORTUGAL Lisbon Internet and Networks International Research Programme (LINI) http://www.lini‐research.org
QATAR Northwestern University in Qatar (NU‐Q) http://www.qatar.northwestern.edu
RUSSIA Sholokhov Moscow State University for the Humanities http://mggu‐sh.ru/en
SINGAPORE Singapore Internet Research Centre (SiRC) www.ntu.edu.sg/sci/sirc Nanyang Technological University
SOUTH AFRICA The Media Observatory Wits Journalism www.journalism.co.za University of Witwatersrand, Johannesburg
SPAIN Internet Interdisciplinary Institute (IN3) www.uoc.edu/in3/pic/eng/communication.html Open University of Catalonia (UOC)

World Internet Project International Report ̶ Sixth Edition | 131
SWEDEN .SE (The Internet Infrastructure Foundation) www.iis.se orwww.wwi.se World Internet Institute
SWITZERLAND Media Change & Innovation Division www.mediachange.ch IPMZ – Institute of Mass Communication and Media Research University of Zurich, Switzerland
TAIWAN Taiwan e‐Governance Research Center http://www.teg.org.tw Department of Public Administration, National Chengchi University http://pa.nccu.edu.tw/
UNITED KINGDOM Oxford Internet Institute (OII) www.oii.ox.ac.uk/microsites/oxis/
URUGUAY Universidad Catolica del Uruguay www.ucu.edu.uy

World Internet Project International Report ̶ Sixth Edition | 132
APPENDIX 2 | Research Methods
Australia
The data for the World Internet Project Chile Survey 2014 (WIP Chile) was collected face‐to‐face using a multi‐stage random sample of 741 inhabitants aged 18 and above from the capital, Santiago, between August and September, 2013. Responding to the WIP questionnaire were 474 Internet users and 267 non‐users. The data were weighted by gender, age, and socio‐economic status according to universe parameters set by the Chilean government’s 2011 National Socio‐economic Survey (CASEN).
Chile
The data for the World Internet Project Chile Survey 2014 (WIP Chile) was collected face‐to‐face using a multi‐stage random sample of 741 inhabitants aged 18 and above from the capital, Santiago, between August and September, 2013. Responding to the WIP questionnaire were 474 Internet users and 267 non‐users. The data were weighted by gender, age, and socio‐economic status according to universe parameters set by the Chilean government’s 2011 National Socio‐economic Survey (CASEN).
China
Permanent residents of China ages 6 and above were surveyed from March 25 to April 2, 2013. There were 30,000 respondents in total, including 15,000 for fixed‐line telephones and the other 15,000 for mobile phones, covering 31 provinces, autonomous regions, and separate municipalities directly under the control of the central government. The computer‐assisted telephone interviewing (CATI) system was used for the survey. To ensure that the sample was representative, a stratified multi‐stage sampling procedure was adopted.
New Zealand
The 2013 World Internet Project survey in New Zealand had a representative sample of 2006 people, aged 16 and up, drawn from across New Zealand. A representative coverage of geographic areas and gender was ensured by through quotas based on census data. The survey was conducted between July and September, 2013. This sample was also weighted by age, gender, and ethnicity. Three additional simple random targeted booster samples using phone numbers within mesh blocks known to have a significant percentage (<30 percent) of Māori, Pasifika, and Asian people were also used. Some of the sample involved respondents re‐contacted from previous years, while other participants were new. While the surveys from previous years relied exclusively on telephone interviews, a new sampling design was implemented whereby online survey methods were also included to balance out the sample more effectively, especially including people without landlines (an increasingly large proportion of New Zealand households are mobile phone only).

World Internet Project International Report ̶ Sixth Edition | 133 Poland
The Polish data was collected from May 29 to June 24, 2013. Computer assisted face‐to‐face personal interviews were used with a sample of 2002 Poles aged 15 and above. Sample quotas were used for gender, age, and city size. The sample was representative of the Polish population (both Internet users and non‐users) aged fifteen and above.
Qatar and the Middle East
The Media Use in the Middle East survey was conducted by Harris Interactive Inc. on behalf of Northwestern University in Qatar. The survey was conducted among the general population 18 years and older in eight countries in the Middle East. Across the eight countries, a total of 10,027 respondents completed the survey. Fieldwork was conducted between December 26, 2012 and February 5, 2013 in seven of the eight participating countries and between March 26, 2013 and April 18, 2013 in Qatar.
Sample Size by Country Bahrain 1250 Egypt 1252 Jordan 1250 Saudi Arabia (KSA) 1252 Lebanon 1256 Qatar 1253 Tunisia 1250 United Arab Emirates (UAE) 1264 The survey was conducted face‐to‐face in seven of the eight participating countries and via telephone in Qatar. The survey was offered in Arabic, English, and/or French.
In Bahrain, Egypt, Jordan, KSA, Lebanon, UAE, and Tunisia a multi‐stage random probability face‐to‐face sample was implemented. In Qatar, a random telephone sample was implemented. Sampling plans were developed based on age, gender, and region. In Egypt, Qatar, KSA, and UAE, the sampling plan also took into account ethnicity – nationals, Arab expatriates, Asian expatriates, and Western expatriates. In Qatar, quotas were also set for landline versus mobile‐only respondents. Weighting was applied in Egypt, Qatar, KSA, and UAE to insure representativeness by ethnic group, region, age, and gender.
Greater detail, including an interactive display of the findings, is available at www.menamediasurvey.northwestern.edu.
Spain
From December 10 through December 15, 2013, 1,600 telephone interviews were conducted using a sample of the Spanish general population aged 16 and above. The sampling procedure followed a multi‐stage selection process according to the following scheme: (a) primary sampling units: municipalities,

World Internet Project International Report ̶ Sixth Edition | 134 randomly selected, (b) secondary sampling units: households, by random selection of phone numbers, and (c) final sampling units: individuals. We insured through the selection process that the sample was representative of the Spanish general population in regard to sex, age, and size of place of residence.
Sweden
The Swedish data was gathered from approximately 3000 respondents in February‐March 2013. Respondents were able to choose whether they wanted to be interviewed by phone, or if they wanted to answer the same questions via a web survey. In 2013, the annual survey had 641 people (21 percent) that answered online. The sample was drawn from a random selection of the population, ages 12 and up. The study uses a revolving panel design. The survey has three parts: an adult survey of the population over age 16 (2,821); a parent survey which includes additional questions for parents (with children between the ages of two and 13) about their children’s use of the Internet (501 parents interviewed about 802 children); a young people survey of those between the ages of 12 and 15 and their parents (209 young people with 209 parents).
Switzerland
Telephone interviews were conducted in German, French, and Italian in May and June of 2013. Data was collected from 1,114 respondents aged 14 and above. To correct for discrepancies between the target quotas and census data, the sample was weighted by age, gender, and language region.
United Arab Emirates
The 2013 Emirates Internet Project (EIP) survey was conducted between the months of May and June 2013. Interviews were conducted in English and Arabic. Data was collected by Computer Assisted Telephone Interviews run by IPSOS MediaCT Dubai. A representative sample of 1000 was selected. The respondents’ age was 16 years and older. The geographic breakdown was as follows: 34 percent of the respondents reside in Abu Dhabi, 32 percent Dubai, or 19 percent Sharjah, the main three of the seven UAE federations.
United Kingdom
The Oxford Internet survey data were collected through face‐to‐face interviews with a representative sample of the British population. It included people age 14 years of age and older living in England, Wales, and Scotland, but not Northern Ireland. Interviewers were in the field in February‐March 2013. Population proportions can be recovered by using a weighting variable to weight individual cases. The weights were based on age, gender, ACORN group (a standard British measure of social status), region, and number in household.
World Internet Project International Report ̶ Sixth Edition | 135
United States
Interviews were conducted in English and took place between September 18th and December 3rd, 2013.The data were collected from 1,043 respondents, aged 12 and above, through a combination of telephone and web surveys. For both the original sample drawn in 2000, and the replacement samples selected in subsequent years, a national Random Digit Dial (RDD) telephone sample was used. To correct for discrepancies between the sample data and Census data, the sample data was weighted by gender, age, income, education and ethnicity. Youth, African‐American, and Latino augments were also used to balance the RDD sample.
Uruguay
The Uruguayan survey was conducted in Spanish and took place between September and October 2013. Data was collected through computer assisted telephone interviews from a stratified random probability sample of Uruguayans aged 15 years old or older living in households with fixed telephone lines. The sample size was 2006. Sampling was developed according to 2011’s National Census data. Six stratums were used: both males and females aged 15 to 29 years old, 30‐59, and 60 and older. To correct for discrepancies between the sample and national statistics office data, both the 2011 Census and the 2013 Continuous Households Survey were used in the final weighting scheme.

Center for the Digital Future USC Annenberg School for Communication and Journalism
11444 West Olympic Boulevard, Suite 120 Los Angeles, California 90064
USA