the value of transportation electrification - charge vc · v product description epri’s electric...
TRANSCRIPT

2016 TECHNICAL REPORT
Electric Power Research Institute 3420 Hillview Avenue, Palo Alto, California 94304-1338 • PO Box 10412, Palo Alto, California 94303-0813 USA
800.313.3774 • 650.855.2121 • [email protected] • www.epri.com
The Value of Transportation Electrification Three Preliminary Case Studies of Impacts on Utility Stakeholders


EPRI Project Manager A. Rogers
3420 Hillview Avenue Palo Alto, CA 94304-1338 USA PO Box 10412 Palo Alto, CA 94303-0813 USA 800.313.3774 650.855.2121
[email protected] 3002007751
www.epri.com Final Report, May 2016
The Value of Transportation Electrification
Three Preliminary Case Studies of Impacts on Utility Stakeholders
DISCLAIMER OF WARRANTIES AND LIMITATION OF LIABILITIES
THIS DOCUMENT WAS PREPARED BY THE ORGANIZATION(S) NAMED BELOW AS AN ACCOUNT OF WORK SPONSORED OR COSPONSORED BY THE ELECTRIC POWER RESEARCH INSTITUTE, INC. (EPRI). NEITHER EPRI, ANY MEMBER OF EPRI, ANY COSPONSOR, THE ORGANIZATION(S) BELOW, NOR ANY PERSON ACTING ON BEHALF OF ANY OF THEM:
(A) MAKES ANY WARRANTY OR REPRESENTATION WHATSOEVER, EXPRESS OR IMPLIED, (I) WITH RESPECT TO THE USE OF ANY INFORMATION, APPARATUS, METHOD, PROCESS, OR SIMILAR ITEM DISCLOSED IN THIS DOCUMENT, INCLUDING MERCHANTABILITY AND FITNESS FOR A PARTICULAR PURPOSE, OR (II) THAT SUCH USE DOES NOT INFRINGE ON OR INTERFERE WITH PRIVATELY OWNED RIGHTS, INCLUDING ANY PARTY'S INTELLECTUAL PROPERTY, OR (III) THAT THIS DOCUMENT IS SUITABLE TO ANY PARTICULAR USER'S CIRCUMSTANCE; OR
(B) ASSUMES RESPONSIBILITY FOR ANY DAMAGES OR OTHER LIABILITY WHATSOEVER (INCLUDING ANY CONSEQUENTIAL DAMAGES, EVEN IF EPRI OR ANY EPRI REPRESENTATIVE HAS BEEN ADVISED OF THE POSSIBILITY OF SUCH DAMAGES) RESULTING FROM YOUR SELECTION OR USE OF THIS DOCUMENT OR ANY INFORMATION, APPARATUS, METHOD, PROCESS, OR SIMILAR ITEM DISCLOSED IN THIS DOCUMENT.
REFERENCE HEREIN TO ANY SPECIFIC COMMERCIAL PRODUCT, PROCESS, OR SERVICE BY ITS TRADE NAME, TRADEMARK, MANUFACTURER, OR OTHERWISE, DOES NOT NECESSARILY CONSTITUTE OR IMPLY ITS ENDORSEMENT, RECOMMENDATION, OR FAVORING BY EPRI.
THE ELECTRIC POWER RESEARCH INSTITUTE (EPRI) PREPARED THIS REPORT.
NOTE
For further information about EPRI, call the EPRI Customer Assistance Center at 800.313.3774 or e-mail [email protected].
Electric Power Research Institute, EPRI, and TOGETHER…SHAPING THE FUTURE OF ELECTRICITY are registered service marks of the Electric Power Research Institute, Inc.
Copyright © 2016 Electric Power Research Institute, Inc. All rights reserved.

This publication is a corporate document that should be cited in the
literature in the following manner:
The Value of Transportation Electrification: Three Preliminary
Case Studies of Impacts on Utility Stakeholders.
EPRI, Palo Alto, CA: 2016. 3002007751.
iii
Acknowledgments
The Electric Power Research Institute (EPRI) prepared this report.
Principal Investigators M. Alexander J. Dunckley R. Entriken
This report describes research sponsored by EPRI.
EPRI would like to acknowledge the support of the following organizations: Ameren Corporation, Arizona Public Service, Consolidated Edison, Duke Energy, Entergy, KCP&L, Southern Company, SRP, TVA, Xcel, and the Energy Foundation.
The project team would like to thank Eric Cutter and Hilary Staver of Energy & Environmental Economics for their modeling support and contributions.


v
Product Description
EPRI’s Electric Transportation Program is a collaboration of utilities, vendors, regulatory agencies, researchers, and laboratories. The goal is to better understand the costs and benefits of electric transportation and to transfer the technology to other locations and industries. EPRI used a Transportation Electrification model at three different utilities to examine the effects of investments in public plug-in electric vehicle (PEV) charging infrastructure on electric vehicle (EV) drivers and utility customers, using the Total Resource Cost (TRC) and Ratepayer Impact Measure (RIM) tests. This analysis simulated EV adoption and charging station use, determining in a simple way the cost for upgrades to the distribution, transmission, and generation infrastructure. This report will benefit any utility interested in the value of transportation electrification and the development of associated programs and infrastructure.
Background Transportation electrification represents perhaps the single most significant opportunity to address the utility need for growth and long-term sustainability for a number of reasons. First, transportation is the last significant sector of the economy to electrify. Next, compared to other alternative fuels, electricity is abundant and ubiquitous. In fact, the affordability of electricity provides unparalleled value at about $1 per gasoline gallon equivalent (gge) compared to gasoline at the pump. Finally, the transportation electrification infrastructure typically can be built economically because it leverages the existing electrical system and can be installed incrementally as needed.
Objectives To quantify the high-level value of transportation electrification
to utility companies.
To demonstrate utility value of PEV adoption through load growth, with minimal increase in operating cost, increased customer satisfaction, and support of carbon reduction goals.
Approach This study simulates PEV impacts on the electric power system. The Transportation Electrification model used for this study simulates investments in the charging infrastructure as well as transmission and distribution (T&D) and generation equipment needed to support

vi
charging. The model also simulates vehicle operation in terms of avoided gasoline use and the use of electrical energy over time. Investments in the PEV infrastructure are motivated by how the T&D and generation systems operate when providing power for the vehicles. Model cost-benefit outputs are examined in terms of two performance tests. The TRC test measures the net costs of a demand-side management program, including both participant and utility costs. The RIM test measures what happens to customer bills or rates due to changes in utility revenues and program operating costs.
Results Specifically targeted are a total of 22 scenarios encompassing a Sensitivity Analysis (Case 1), Critical Short-Term Benefits (Case 2), and Public Infrastructure (Case 3) at three utilities. Case Studies 1 and 2 always pass the RIM test, because they utilize an organic growth model for charging infrastructure, wherein new charging stations are installed as more vehicles are adopted. Case Study 3, in contrast, investigates a fixed expense with a cost between $21.6 million and $32.4 million and checks to see what level of vehicle adoption is sufficient to provide net positive RIM benefits.
These results showed that a rate-based public charging infrastructure can provide benefits for both EV drivers and utility customers. In terms of near-term electrification potential, the key success factor supporting new electricity use and infrastructure is projected net benefits of $6.3 million going to vehicle owners. Further comparison of the scenarios tested shows that the breakeven point for utility customers is an adoption rate of 20,000–36,000 EVs within the service territory by 2025, depending on the actual program cost. The key success factor is EV adoption.
Applications, Value, and Use For electric utilities, electric transportation can make more efficient use of energy, promote economic development, enhance load management, and improve customer relationships. Regardless of the objectives, working collaboratively, a utility can implement a program more rapidly and begin to reap the benefits immediately. In short, transportation electrification increases utility sales in a way that may significantly benefit utility customers in the long-term.
Keywords Transportation electrification Electric transportation Charging infrastructure Total Resource Cost (TRC) Ratepayer Impact Measure (RIM) Electric vehicle adoption

vii
Acronyms
AEO Annual Energy Outlook BEV Battery Electric Vehicle BRT Bus Rapid Transit CalETC California Electric Transportation Coalition CEEIM Cleveland EDV Economic Impact Model CMU Carnegie Mellon University DOE U.S. Department of Energy DR Demand Response E3 Energy and Environmental Economics EKB Electrification Knowledge Base EDV Electric Drive Vehicle EV Electric Vehicle GHG Greenhouse Gas HEV Hybrid Electric Vehicle KCP&L Kansas City Power and Light LDV Light-Duty Vehicle NOX Nitrogen Oxide compounds NPC Net Present Cost NPV Net Present Value NRDC Natural Resources Defense Council NREL National Renewable Energy Laboratory O&M Operations and Maintenance PEV Plug-In Electric Vehicle PHEV Plug-In Hybrid Electric Vehicle PM Particulate Matter RB Rate-Based REIM Regional Economic Impact Multiplier RIM Ratepayer Impact Measure (test) RPS Renewable Portfolio Standard SOX Sulfur Oxide Compounds SWEEP Southwest Energy Efficiency Project T&D Transmission and Distribution TOU Time-of-Use TRC Total Resource Cost (test) VOC Volatile Organic Compound


ix
Table of Contents
Product Description ................................................ V
Section 1: Introduction ........................................ 1-1 Overview .................................................................. 1-1 Project Direction – A Collaborative Model .................... 1-2 Electric Vehicle Adoption Scenarios ............................. 1-2
Case Study 1: Sensitivity Analysis Case Study Summary – Scenarios 1.0–1.10 ............................. 1-3 Case Study 2: Critical Short-Term Benefits Case Study Summary – Scenarios 2.0–2.3 ...................... 1-3 Case Study 3: Public Infrastructure Case Study Summary – Scenarios 3.0–3.6 ............................... 1-4 Effect on Customers ............................................... 1-4 Effect on Utility Sales ............................................. 1-5
Section 2: Methodology ...................................... 2-1 Approach .................................................................. 2-1 Cost Tests .................................................................. 2-2
Total Resource Cost Test ........................................ 2-2 Ratepayer Impact Measure Test .............................. 2-3
Section 3: Sensitivity Analysis ............................. 3-1 Base Scenario Inputs .................................................. 3-1 Scenario Variables ..................................................... 3-2
Vehicle Adoption .................................................. 3-2 Charging Behavior ............................................... 3-3 Gasoline Prices .................................................... 3-4
Scenarios .................................................................. 3-4 Results ...................................................................... 3-5
Scenario 1.0 – Base Scenario ................................ 3-6 Scenarios 1.1 and 1.2 – Vehicle Adoption .............. 3-9 Scenario 1.7 – More Home Charging ................... 3-14 Scenarios 1.3, 1.7, and 1.4 – More Home Charging Across Vehicle Adoption ....................... 3-16 Scenario 1.8 – More Public Charging ................... 3-21 Scenarios 1.5 and 1.6 – More Public Charging Across Vehicle Adoption...................................... 3-23

x
Scenarios 1.9 and 1.10 – Gasoline Prices ............ 3-28 Summary ................................................................. 3-30
Section 4: Critical Short-Term Benefits ................. 4-1 Base Scenario Inputs .................................................. 4-1 Scenario Variables ..................................................... 4-1
Gasoline Prices .................................................... 4-2 Federal Tax Credit ................................................ 4-2 Scenarios ............................................................. 4-2
Results ...................................................................... 4-3 Scenario 2.0 – Base Scenario ................................ 4-3 Scenario 2.1 – Federal Tax Credit .......................... 4-6 Scenario 2.2 – Higher Gasoline Prices .................... 4-7 Scenario 2.3 – Combined Benefits .......................... 4-9
Section 5: Public Infrastructure Study .................. 5-1 Scenario Variables ..................................................... 5-1
Vehicle Adoption .................................................. 5-2 Public Charging Deployment .................................. 5-2 Charging Behavior ............................................... 5-2
Scenarios .................................................................. 5-3 Results ...................................................................... 5-4
Scenario 3.0 – Base Scenario ................................ 5-4 Scenario 3.2 – Nominal Public Infrastructure Cost .... 5-6 Scenario 3.5 – High Public Infrastructure Cost ........ 5-10 Scenario 3.1 – Nominal Infrastructure Cost, Low Vehicle Adoption ................................................ 5-13 Scenario 3.3 – Nominal Infrastructure Cost, High Vehicle Adoption ................................................. 5-15 Scenario 3.4 – High Infrastructure Cost, Low Vehicle Adoption ........................................................... 5-18 Scenario 3.6 – High Infrastructure Cost, High Vehicle Adoption ................................................ 5-21
Discussion ............................................................... 5-24
Section 6: Conclusions ........................................ 6-1 Sensitivity Analysis Case Study Summary – Scenarios 1.0–1.10 .................................................................. 6-1
Effect of Charging Behavior ................................... 6-3 Critical Short-Term Benefits Summary – Scenarios 2.0–2.3 .................................................................... 6-5 Public Infrastructure Summary – Scenarios 3.0–3.6 ........ 6-6
Vehicle Adoption to Support Public Infrastructure ...... 6-7 Effect on Customers .................................................... 6-8 Effect on Utility Sales .................................................. 6-9

xi
Section 7: Annotated Bibliography ...................... 7-1 California Transportation Electrification Assessment: Phase 1: Final Report [1] ............................................ 7-1 California Transportation Electrification Assessment: Phase 2: Grid Impacts [2] ........................................... 7-1 Electrification Knowledge Base (EKB) v1.0 [3] ............... 7-1 Environmental and Societal Benefits of Electrifying Transportation: Plug-in Hybrid Vehicle Environmental Study Analysis Structure [4] ......................................... 7-2 Regional Economic Benefits from Electric Transportation: Case Study of the Cleveland, Ohio Metropolitan Statistical Area [5] ..................................................... 7-2 Plug-in Hybrid Electric Vehicles and Petroleum Displacement: A Regional Economic Impact Assessment [6] ............................................................................ 7-2 The Direct and Indirect Costs of Regulatory Compliance: A Value Proposition for Electric Transportation [7] ......... 7-3 Overcoming Barriers to Deployment of Plug-in Electric Vehicles [8] ............................................................... 7-3 Electric Vehicle Charging Station Pilot Evaluation Report [9] ............................................................................ 7-3 The Colorado Electric Vehicle Market Implementation Study [10] ................................................................. 7-4 Colorado Electric Vehicle & Infrastructure Readiness Plan [11] .......................................................................... 7-4 Field Testing Plug-in Hybrid Electric Vehicles with Charge Control Technology in the Xcel Energy Territory [12] .......................................................................... 7-5 Costs and Emissions Associated with Plug-in Hybrid Electric Vehicle Charging on the Xcel Energy Colorado Service Territory [13] .................................................. 7-5 Electrifying Vehicles: Insights from the Canadian Plug-in Electric Vehicle Study [14] .......................................... 7-6 Boulder Electric Vehicle Infrastructure and Adoption Assessment [16] ......................................................... 7-6 Considering a Regional Network of Bus Rapid Transit in the Denver Metro Area [17] ........................................ 7-6 Economic and Air Quality Benefits of Electric Vehicles in Nevada [18] ............................................................. 7-6 NV Energy: Leading the Way on Electric Vehicles [19] .. 7-7 Policies to Promote Electric Vehicles in the Southwest: A State Government Report Card (2014 edition) [20] ....... 7-7 Air Quality and Economic Benefits of Electric Vehicles in New Mexico [21] ...................................................... 7-7

xii
Air Quality and Economic Benefits of Electric Vehicles in Arizona [22] ............................................................. 7-7 Air Quality Benefits of Electric Vehicles in the Denver Metro and North Front Range Area [23] ....................... 7-8 Economic Benefits of Transit Systems: Colorado Case Studies [24] ............................................................... 7-8 The Potential for Electric Vehicles to Reduce Emissions and Improve Air Quality on the Wasatch Front [25] ....... 7-8 On-Road and Off-Road Electrotechnology Programs: Identifying Opportunities for Potential Revenue Growth [26] .......................................................................... 7-8 EV Roadmap Conference [27] ..................................... 7-9 Electric Vehicle Benefits and Costs in the United States [28] .......................................................................... 7-9 Electric Vehicle Adoption Potential in the United States [29] .......................................................................... 7-9 National Economic Value Assessment of Electric Transportation [30] .................................................... 7-9 Environmental Assessment of a Full Electric Transportation Portfolio: Executive Summary [31] .......... 7-9 Related EPRI Reports ................................................. 7-10
Section 8: References .......................................... 8-1
Appendix A: Data Template ............................. A-1 Base Year Data and Escalation Rates ........................... A-1
Analysis Details .................................................... A-1 Sales and RPS Assumptions .................................... A-1 Utility Financials ................................................... A-2 Time-of-Use Details ................................................ A-2 Utility Financials ................................................... A-3
Vehicle and Charger Data .......................................... A-4 Scenario Definition ............................................... A-4 Incentive Details (LDVs Only) .................................. A-4 Charger Configuration and Usage Fleet Charging Locations and Type ............................................... A-5
Electricity Capacity and Energy Costs ........................... A-6 Annual Capacity Prices ......................................... A-6 Hourly Energy Costs .............................................. A-7
Electricity Generation Portfolio Emission Profiles ............. A-7 CO2 Emissions (tons / kWh) .................................. A-7 SOx Emissions (tons / kWh) ................................... A-7 NOx Emissions (tons / kWh) .................................. A-7 VOC Emissions (tons / kWh) ................................. A-7 PM Emissions (tons / kWh) .................................... A-8

xiii
Distribution Feeders .................................................... A-8 System Parameters ................................................ A-8 Specified Feeder Type (Override) ........................... A-8 % Share of Total System Feeders ............................ A-9 Allocation of Vehicles to Feeders ............................ A-9 Rating (kW) ......................................................... A-9 Urban / Rural? (Optional) ..................................... A-9 % of Rating at Which Upgrade is Triggered ............ A-9 Upgrade Cost ($) .................................................. A-9 Upgrade Increment (kW) ....................................... A-9 Upgrade Type (Optional) ....................................... A-9 Customer Share by Sector...................................... A-9 Growth Rate (%/yr) .............................................. A-9 Peak Day Shape—kW Load ................................. A-10
Annual Data ............................................................ A-10 Fuel/Carbon Price Assumptions ............................ A-10 Energy / Fuel Price Adders .................................. A-10 Utility Projections ................................................ A-10


xv
List of Figures
Figure 1-1 Scenario 3.0 TRC test results (million 2016$) ...... 1-6
Figure 3-1 Vehicle adoption curves .................................... 3-3
Figure 3-2 Gasoline price curves (nominal $/gal) ............... 3-4
Figure 3-3 Scenario 1.0 TRC test results (million 2016$) ...... 3-6
Figure 3-4 Scenario 1.0 RIM test results (million 2016$) ...... 3-8
Figure 3-5 Scenarios 1.1 and 1.2 TRC test results (million 2016$) ..................................................................... 3-9
Figure 3-6 Scenarios 1.1, 1.0, and 1.2 net TRC benefit per vehicle (2016$/vehicle) ........................................... 3-11
Figure 3-7 Scenarios 1.1, 1.0, and 1.2 net TRC benefit (2016$/vehicle) ...................................................... 3-12
Figure 3-8 Scenarios 1.1 and 1.2 RIM test results (million 2016$) ................................................................... 3-13
Figure 3-9 Scenarios 1.3 and 1.4 TRC test results (million 2016$) ................................................................... 3-17
Figure 3-10 Scenarios 1.3, 1.7, and 1.4 net TRC benefit (2016$/vehicle) ...................................................... 3-19
Figure 3-11 Scenarios 1.3, 1.7, and 1.4 net TRC benefit (2016$/vehicle) ...................................................... 3-20
Figure 3-12 Scenarios 1.3 and 1.4 RIM test results (million 2016$) ................................................................... 3-20
Figure 3-13 Scenarios 1.5 and 1.6 TRC test results (million 2016$) ................................................................... 3-24
Figure 3-14 Scenarios 1.5, 1.8, and 1.6 net TRC benefit (2016$/vehicle) ...................................................... 3-26
Figure 3-15 Scenarios 1.5, 1.8, and 1.6 net TRC benefit (2016$/vehicle) ...................................................... 3-27

xvi
Figure 3-16 Scenarios 1.5 and 1.6 RIM test results (million 2016$) ................................................................... 3-27
Figure 3-17 Scenarios 1.9 and 1.10 TRC test results (million 2016$) ................................................................... 3-29
Figure 4-1 Scenario 2.0 TRC test results (million 2016$) ...... 4-4
Figure 4-2 Scenario 2.0 RIM test results (million 2016$) ...... 4-5
Figure 4-3 Scenario 2.1 TRC test results (million 2016$) ...... 4-6
Figure 4-4 Scenario 2.2 TRC test results (million 2016$) ...... 4-8
Figure 4-5 Scenario 2.3 TRC test results (million 2016$) .... 4-10
Figure 5-1 Scenario 3.0 TRC test results (million 2016$) ...... 5-5
Figure 5-2 Scenario 3.0 RIM test results (million 2016$) ...... 5-6
Figure 5-3 Scenario 3.2 TRC test results (million 2016$) ...... 5-7
Figure 5-4 Scenario 3.2 RIM test results (million 2016$) ...... 5-9
Figure 5-5 Scenario 3.5 TRC test results (million 2016$) .... 5-10
Figure 5-6 Scenario 3.5 RIM test results (million 2016$) .... 5-12
Figure 5-7 Scenario 3.1 TRC test results (million 2016$) .... 5-13
Figure 5-8 Scenario 3.1 RIM test results (million 2016$) .... 5-14
Figure 5-9 Scenario 3.3 TRC test results (million 2016$) .... 5-15
Figure 5-10 Scenario 3.3 RIM test results (million 2016$) .. 5-17
Figure 5-11 Scenario 3.4 TRC test results (million 2016$) .. 5-18
Figure 5-12 Scenario 3.4 RIM test results (million 2016$) .. 5-20
Figure 5-13 Scenario 3.6 TRC test results (million 2016$) .. 5-21
Figure 5-14 Scenario 3.6 RIM test results (million 2016$) .. 5-23
Figure 6-1 Scenario 3.0 TRC test results (million 2016$) ...... 6-9
xvii
List of Tables
Table 1-1 Sales impact on nomincal case study scenarios .... 1-5
Table 3-1 Sensitivity analysis case study: PEV adoption scenario values (number of vehicles) ............................. 3-3
Table 3-2 Sensitivity analysis case study: charging behavior scenario values (% time) .............................................. 3-3
Table 3-3 Sensitivity analysis case study: gasoline price scenarios values ($/gal) ............................................. 3-4
Table 3-4 Analysis case study scenarios ............................. 3-5
Table 3-5 Scenario 1.0 TRC test results (million 2016$) ....... 3-7
Table 3-6 Scenario 1.0 RIM test (million 2016$) ................. 3-8
Table 3-7 Scenarios 1.1, 1.0, and 1.2 TRC test results (million 2016$) ....................................................... 3-10
Table 3-8 Scenarios 1.1, 1.0, and 1.2 TRC benefits and costs (totals and per vehicle) ...................................... 3-11
Table 3-9 Scenarios 1.1, 1.0, and 1.2 RIM test results (million 2016$) ....................................................... 3-13
Table 3-10 Scenario 1.7 TRC test results (million 2016$) ... 3-15
Table 3-11 Scenario 1.7 RIM test results (million 2016$) ... 3-16
Table 3-12 Scenarios 1.3, 1.7, and 1.4 TRC test results (million 2016$) ....................................................... 3-18
Table 3-13 Scenarios 1.3, 1.7, and 1.4 TRC benefits and costs (totals and per vehicle) ...................................... 3-19
Table 3-14 Scenarios 1.3 and 1.4 RIM test results (million 2016$) ................................................................... 3-21
Table 3-15 Scenario 1.8 TRC test results (million 2016$) ... 3-22
Table 3-16 Scenarios 1.8 RIM test results (million 2016$) .. 3-23
Table 3-17 Scenarios 1.5, 1.8, and 1.6 TRC test results (million 2016$) ....................................................... 3-25

xviii
Table 3-18 Scenarios 1.5, 1.8, and 1.6 TRC benefits and
costs (totals and per vehicle) ...................................... 3-26
Table 3-19 Scenarios 1.5, 1.0, and 1.6 RIM test results (million 2016$) ....................................................... 3-28
Table 3-20 Scenarios 1.9 and 1.10 TRC test results (million 2016$) ................................................................... 3-29
Table 4-1 Critical short-term benefits case study: gasoline price scenario values .................................................. 4-2
Table 4-2 Critical short-term benefits case study: federal tax credit scenario values ................................................. 4-2
Table 4-3 Critical short-term benefits case study scenarios .... 4-3
Table 4-4 Scenario 2.0 TRC test results (million 2016$) ....... 4-4
Table 4-5 Scenario 2.0 RIM test results (million 2016$) ....... 4-5
Table 4-6 Scenario 2.1 TRC test results (million 2016$) ....... 4-7
Table 4-7 Scenario 2.2 TRC test results (million 2016$) ....... 4-9
Table 4-8 Scenario 2.3 TRC test results (million 2016$) ..... 4-11
Table 5-1 Public infrastructure case study: vehicle adoption scenario values .......................................................... 5-2
Table 5-2 Public infrastructure case study: public charging deployment scenario values ........................................ 5-2
Table 5-3 Public infrastructure case study: charging behavior scenario values ............................................ 5-3
Table 5-4 Scenario definitions ........................................... 5-3
Table 5-5 Scenario 3.0 TRC test results (million 2016$) ....... 5-5
Table 5-6 Scenario 3.0 RIM test results (million 2016$) ....... 5-6
Table 5-7 Scenario 3.2 TRC test results (million 2016$) ....... 5-8
Table 5-8 Scenario 3.2 Absolute RIM test results (million 2016$) ..................................................................... 5-9
Table 5-9 Scenario 3.5 TRC test results (million 2016$) ..... 5-11
Table 5-10 Scenario 3.5 RIM test results (million 2016$) ... 5-12
Table 5-11 Scenario 3.1 TRC test results (million 2016$) ... 5-14
Table 5-12 Scenario 3.1 RIM test results (million 2016$) ... 5-15
Table 5-13 Scenario 3.3 TRC test results (million 2016$) ... 5-16
Table 5-14 Scenario 3.3 RIM test results (million 2016$) ... 5-17

xix
Table 5-15 Scenario 3.4 TRC test results (million 2016$) ... 5-19
Table 5-16 Scenario 3.4 RIM test results (million 2016$) ... 5-20
Table 5-17 Scenario 3.6 TRC test results (million 2016$) ... 5-22
Table 5-18 Scenario 3.6 Absolute RIM test results (million 2016$) ................................................................... 5-23
Table 6-1 Scenarios 1.0–1.10 summary of net TRC and RIM benefits (million 2016$) .............................................. 6-2
Table 6-2 Scenarios 1.7, 1.0, and 1.8 summary of net TRC and RIM benefits (million 2016$) ................................. 6-3
Table 6-3 Scenarios 1.1, 1.0, and 1.2 summary of net TRC and RIM benefits (million 2016$) ................................. 6-3
Table 6-4 Scenarios 1.3, 1.7, and 1.4 summary of net TRC and RIM benefits (million 2016$) ................................. 6-4
Table 6-5 Scenarios 1.5, 1.8, and 1.6 summary of net TRC and RIM benefits (million 2016$) ................................. 6-4
Table 6-6 Scenarios 1.9, 1.0, and 1.10 summary of net TRC and RIM benefits (million 2016$) .......................... 6-5
Table 6-7 Scenarios 2.0–2.3 summary of net TRC and RIM benefits (million 2016$) .............................................. 6-6
Table 6-8 Scenarios 3.0–3.6 summary of net TRC and RIM benefits (million 2016$) .............................................. 6-7
Table 6-9 Sales impact on nomincal case study scenarios .... 6-8


1-1
Section 1: Introduction Many major auto manufacturers are selling light-duty plug-in electric vehicles (PEVs), with significant market penetration in key metro markets in Georgia, Oregon, Washington, California, and several Northeastern states. As the last significant sector of the economy to be electrified, transportation electrification represents perhaps the single biggest opportunity to address the utility need for growth and long-term sustainability. In addition, the transportation electrification infrastructure typically can be built economically because it leverages the existing electrical system and can be installed incrementally as needed. Finally, the affordability of electricity provides an unparalleled value at about $1 per gasoline gallon equivalent (gge) compared to gasoline at the pump.
This collaborative project involves a detailed multi-part study of the potential for transportation electrification to provide economic value to utilities. Insights from this project are expected to inform participants of the potential for utility transportation electrification programs to support both the light-duty and heavy-duty electric vehicle segments. Of particular interest in this initial step is to examine PEV adoption and the associated charging, wires, and generation infrastructure to obtain a preliminary indication of the potential degree of benefits and costs. The ultimate goal is to develop a framework for utilities to conduct deeper analysis on their own systems and thereby determine whether specific benefits to ratepayers outweigh broader infrastructure costs.
Overview
The utility industry is facing the transformative challenge of integrating a wave of customer technologies into the grid, including renewable generation, energy storage, and energy management controls. While these technologies may enable customers to reduce or shift their energy usage for economic benefit, their dependence on the electrical grid for reliability and transactive value remains. Given the uncertain capacity value of renewable generation such as rooftop solar, utility peak demand is likely to continue to escalate.
Additionally, utilities face the prospect of having to make major capital investments to meet demand growth, reduce power plant emissions, integrate renewables, and modernize and maintain the grid—all in an environment of reduced electricity usage, which is the primary basis for utility funding. In this regard, transportation electrification may represent an opportunity for utilities to reap value from the billions of ratepayer dollars being invested in grid infrastructure and modernization across the country.
1-2
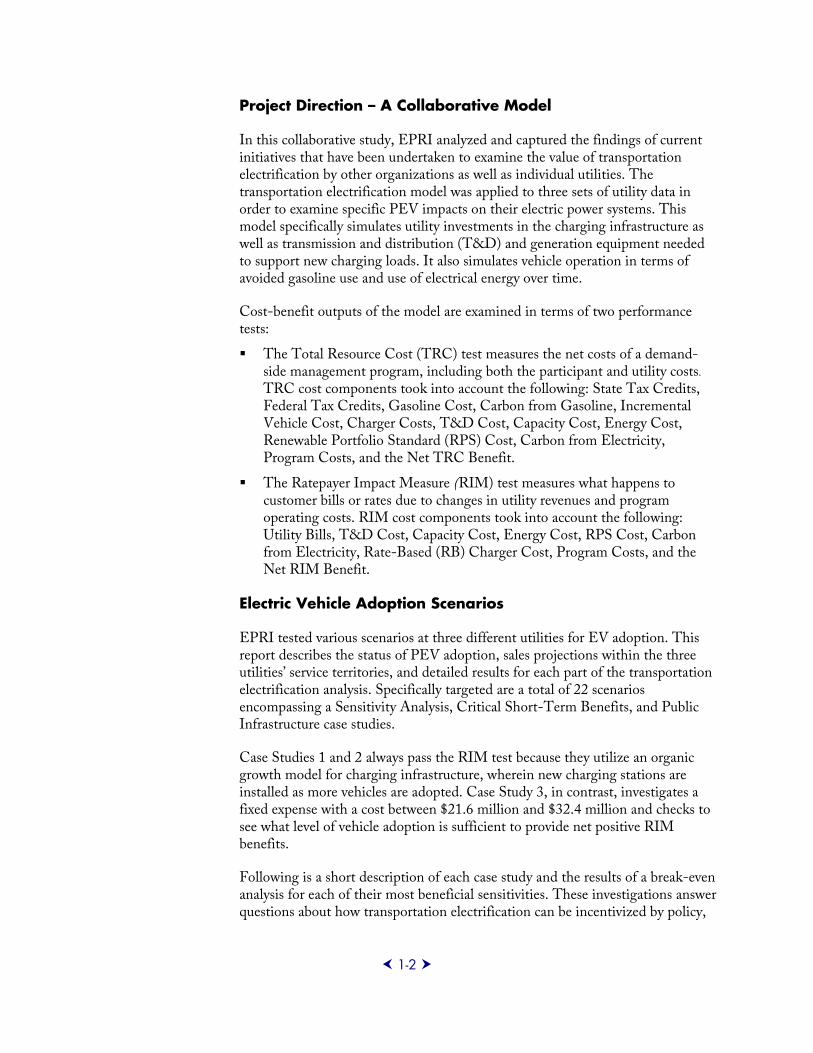
Project Direction – A Collaborative Model
In this collaborative study, EPRI analyzed and captured the findings of current initiatives that have been undertaken to examine the value of transportation electrification by other organizations as well as individual utilities. The transportation electrification model was applied to three sets of utility data in order to examine specific PEV impacts on their electric power systems. This model specifically simulates utility investments in the charging infrastructure as well as transmission and distribution (T&D) and generation equipment needed to support new charging loads. It also simulates vehicle operation in terms of avoided gasoline use and use of electrical energy over time.
Cost-benefit outputs of the model are examined in terms of two performance tests:
The Total Resource Cost (TRC) test measures the net costs of a demand-side management program, including both the participant and utility costs. TRC cost components took into account the following: State Tax Credits, Federal Tax Credits, Gasoline Cost, Carbon from Gasoline, Incremental Vehicle Cost, Charger Costs, T&D Cost, Capacity Cost, Energy Cost, Renewable Portfolio Standard (RPS) Cost, Carbon from Electricity, Program Costs, and the Net TRC Benefit.
The Ratepayer Impact Measure (RIM) test measures what happens to customer bills or rates due to changes in utility revenues and program operating costs. RIM cost components took into account the following: Utility Bills, T&D Cost, Capacity Cost, Energy Cost, RPS Cost, Carbon from Electricity, Rate-Based (RB) Charger Cost, Program Costs, and the Net RIM Benefit.
Electric Vehicle Adoption Scenarios
EPRI tested various scenarios at three different utilities for EV adoption. This report describes the status of PEV adoption, sales projections within the three utilities’ service territories, and detailed results for each part of the transportation electrification analysis. Specifically targeted are a total of 22 scenarios encompassing a Sensitivity Analysis, Critical Short-Term Benefits, and Public Infrastructure case studies.
Case Studies 1 and 2 always pass the RIM test because they utilize an organic growth model for charging infrastructure, wherein new charging stations are installed as more vehicles are adopted. Case Study 3, in contrast, investigates a fixed expense with a cost between $21.6 million and $32.4 million and checks to see what level of vehicle adoption is sufficient to provide net positive RIM benefits.
Following is a short description of each case study and the results of a break-even analysis for each of their most beneficial sensitivities. These investigations answer questions about how transportation electrification can be incentivized by policy,

1-3
such as the Federal Tax Incentive, choices between charging at home or at public stations, higher gasoline prices, and vehicle adoption.
Case Studies 1 and 2 investigate the break-even point for the TRC test, since all of their scenarios pass the RIM test. Case Study 3 investigates the breakeven point for the RIM test provided by vehicle adoption.
Case Study 1: Sensitivity Analysis Case Study Summary – Scenarios 1.0–1.10
These Sensitivity Analysis scenarios encompass the following: Base Scenario, Vehicle Adoption, More Home Charging, More Home Charging Across Vehicle Adoption, More Public Charging, More Public Charging Across Vehicle Adoption, and gasoline prices. Particularly positive is the fact that all scenarios passed the RIM test, with net RIM benefits greater than the total RIM costs. However, the relation between vehicle adoption and the net TRC benefit is complicated by exponential growth, net present cost (NPC) discounting, and the longevity of the Federal Tax Credits. The Base Scenario (1.0) was very close to the breakeven point. Home charging dramatically reduced the cost of the charging infrastructure and thus allowed the Base Scenario to pass the TRC. Gasoline played a key role in the breakeven scenario, with avoided Gasoline Costs having the highest impact on the Net TRC Benefit.
The marginal TRC benefit is $400,000 for each additional percentage portion of home charging, which places its breakeven point at close to 54% home charging, relative to Scenario 1.0.
The marginal TRC benefit is $89.8 million for each $1 increase in the gasoline prices, which places the breakeven gasoline price in 2025 close to $2.79/gal, relative to Scenario 1.0.
The Base Scenario 1.0 has conditions that are very close to supporting vehicle adoption economically.
Case Study 2: Critical Short-Term Benefits Case Study Summary – Scenarios 2.0–2.3
The Critical Short-Term Benefits scenarios encompass the following: Base Scenario, Federal Tax Credits, higher gasoline prices, and combined benefits. The Critical Short-Term Benefits case studies all passed the RIM. This is largely because when all of the investment in new vehicles and charging stations is taken into account, only 25% of the charger costs are included in the rate base. As a result, the increased revenue and capacity utilization from electric vehicle charging creates a significant marginal benefit to all ratepayers. Because the RIM test does not include the case study scenario variables—Federal Tax Credits and Gasoline cost—this high marginal ratepayer benefit remains constant across all scenarios.

1-4
The marginal TRC benefit from the changing Federal Tax Credit is 14,320 $/$, implying that the breakeven point for Federal Tax Credit is about $4,611, relative to Scenario 2.0.
The marginal TRC benefit from the changing 2025 gasoline price is $22.2 million per $1/gal, implying that the breakeven point for 2025 gasoline prices is about $4.42/gal, relative to Scenario 2.0.
Either the Federal Tax Credit of $4,611 or higher gasoline prices in 2025 of $4.42 are necessary to support equal amounts of home and public charging in this case study. The combined effect is additive so an increased tax credit would reduce the gasoline prices required to break even.
Case Study 3: Public Infrastructure Case Study Summary – Scenarios 3.0–3.6
These Public Infrastructure scenarios encompass the following: Base Scenario; Nominal Public Infrastructure, High Public Infrastructure; Nominal Infrastructure Cost, Low Vehicle Adoption; Nominal Infrastructure Cost, High Vehicle Adoption; High Infrastructure Cost, Low Vehicle Adoption; and High Infrastructure Cost, High Vehicle Adoption. Under Scenario 3 (involving nominal public charger deployment costs and adoption of 29,700 EVs by 2025), the TRC and RIM tests are both positive. The increase in net benefit to all customers is projected to be $6.3 million. Further comparison of the scenarios tested shows that the breakeven point for utility customers is an adoption rate of 20,000–36,000 EVs within the service territory by 2025, depending on the actual program cost. The key success factor is EV adoption.
The breakeven point for vehicle adoption for the $21.6 million public charger program plus the $2.0 million program cost is near 26,000 vehicles, relative to Scenario 3.0.
The breakeven point for vehicle adoption for the $32.4 million public charging station program plus the $2.0 million program cost is near 35,600 vehicles, relative to Scenario 3.0.
Thus, in this case study, a single electric vehicle provides between $831 and $910 in net benefits to support public infrastructure.
Effect on Customers
In this summary, we review the electricity energy sales for the nominal scenarios in each case study involving the installation of infrastructure and adoption of electric vehicles. These scenarios are:
Scenario 1.0 – Case Study 1: Base Scenario
Scenario 2.1 – Determines the impact of a $5,000 federal tax credit on the net benefits compared to Scenario 2.0
Scenario 3.2 – Introduction of public infrastructure with nominal cost and nominal sales

1-5
Table 1-1 lists the scenario variables, their values, and the net RIM benefit and Utility Sales for each of them.
Table 1-1 Sales impact on nomincal case study scenarios
Scenario Vehicle Adoption
Charging Behavior
Gasoline Price
Net RIM Benefit (Million 2016$)
Utility Sales
(Million 2016$)
1.0 Medium Equal Medium $54.2 $89.5
Gasoline Prices
Federal Tax
Credit
2.1 Medium AEO 2015 Reference $5,000 $33.8 $62.9
Public
Charging Deployment
Charging Behavior
3.2 Medium Nominal
Cost
Some public
charging $8.3 $52.8
Note that all three scenarios pass the RIM test and that utility sales are on the order of tens of millions of dollars. Scenarios 1.0 and 2.1 pass the RIM test with net benefits of more than half of utility sales, which means they are highly beneficial to all customers.
Effect on Utility Sales
Another perspective on utility sales is the increase in electric vehicle charging load each year. Figure 1-1 plots the three curves for these nominal scenarios.
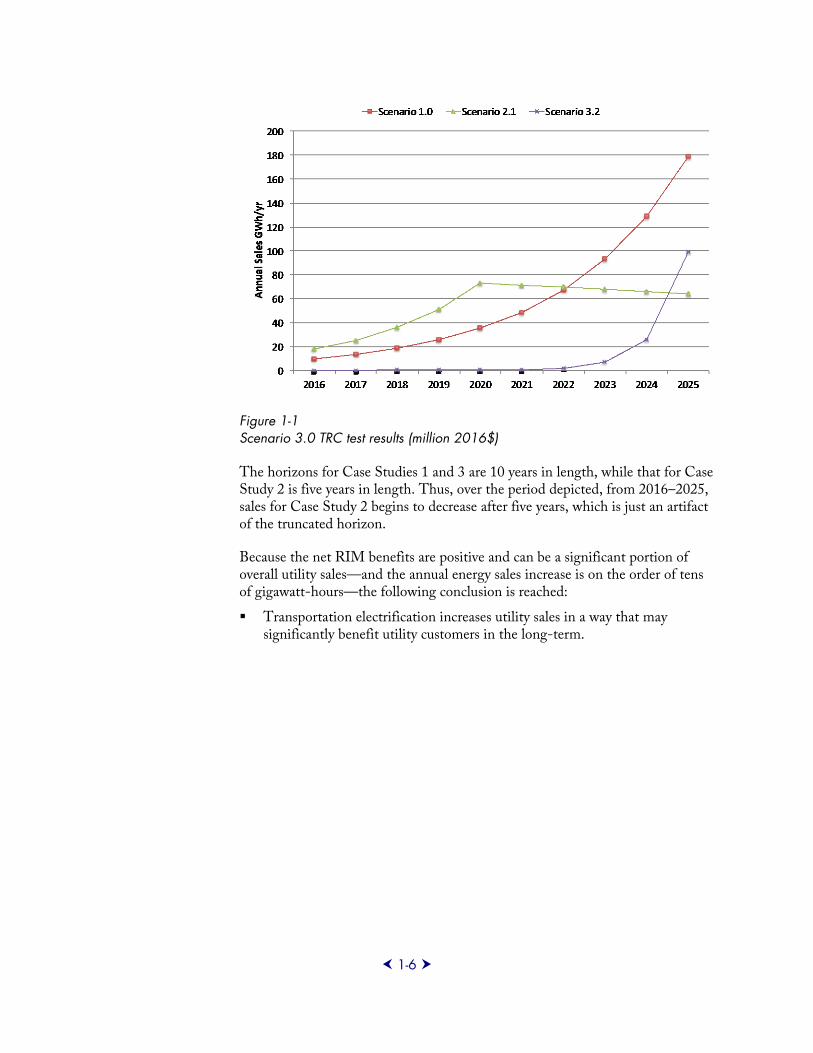
1-6
Figure 1-1 Scenario 3.0 TRC test results (million 2016$)
The horizons for Case Studies 1 and 3 are 10 years in length, while that for Case Study 2 is five years in length. Thus, over the period depicted, from 2016–2025, sales for Case Study 2 begins to decrease after five years, which is just an artifact of the truncated horizon.
Because the net RIM benefits are positive and can be a significant portion of overall utility sales—and the annual energy sales increase is on the order of tens of gigawatt-hours—the following conclusion is reached:
Transportation electrification increases utility sales in a way that may significantly benefit utility customers in the long-term.
2-1
Section 2: Methodology This section explains how the study was conducted and the high-level outputs from application of the transportation electrification model.
Approach
This project was supported and advised by 10 utilities, out of which three provided data and scenario definitions for conducting three case studies. Each utility took a different approach to developing its Base Scenario and alternative scenarios. The data inputs are applicable to the majority of utilities according to the investment and operating conditions existing in 2016, as follows:
Currently, there is a Federal Tax Credit for PEVs, and it is expected to remain in effect for about five more years.
The additional cost for a PEV over a standard vehicle with an internal combustion engine is assumed to be about $10,000 per vehicle in 2016 and is assumed to diminish to $1,000 by 2035.
Gasoline prices are low and expected to increase.
Electricity prices remain lower than gasoline on the basis of miles driven, due largely to significant efficiency of electricity use over gasoline use.
Most utilities now have low vehicle adoption compared to conventional vehicles, and adoption is expected to increase exponentially over the coming 10 years.
We define the short term for PEV adoption to be around five years, and the long term to be about 10 years.
Given the pace of change in the industry, forecasting beyond 10 years is very difficult.
Emissions due to electricity generation are down in most utility service territories, and they are expected to decrease further due to a combination of economic and policy factors.
As can be seen later in the results, the overall cost-benefit analysis of transportation electrification is dominated by these conditions. The essence of the analysis is to determine whether benefits from avoided gasoline costs can overcome the incremental vehicle cost and charger cost. This is not only the question before the vehicle owner but also involves the utility industry because of the broader potential costs and benefits to ratepayers.

2-2
Cost Tests
This study simulates PEV impacts on the electric power system. The quantitative values for vehicle adoption are taken as a user-specified input. Therefore, to determine how customer awareness, public infrastructure, and other external factors can affect vehicle adoption, users must have an alternative way of representing those effects.
This model simulates investments in the charging infrastructure as well as T&D and generation equipment needed to support charging. The model also simulates vehicle operation in terms of avoided gasoline use and the use of electrical energy over time. Investments in the PEV infrastructure are motivated by how the T&D and generation system operate when providing power for the vehicles.
Model cost-benefit outputs are examined in terms of two performance tests:
The Total Resource Cost (TRC) test measures the net costs of a demand-side management program, including both the participant and utility costs.
The Ratepayer Impact Measure (RIM) test measures what happens to customer bills or rates due to changes in utility revenues and program operating costs.
These tests provide two different views of the potential impacts of investments, costs, and benefits for PEVs and the charging infrastructure. Positive numerical results indicate that the net benefits of a given scenario are greater than the net costs. A positive result in the TRC indicates that the scenario provides overall societal benefits based on the direct costs and benefits of vehicle electrification. (In the formulation used below, social costs due to CO2 emissions are included, but many other external social costs are not included.) This positive result for the TRC test does not distinguish between the benefits or costs to different parties. A positive result in the RIM test indicates that a particular scenario provides incremental benefits to ratepayers. The tests and their associated components are defined below.
Total Resource Cost Test
The TRC test benefits are:
Carbon from Gasoline – Avoided cost of carbon emissions from avoided use of gasoline.
Gasoline Cost – Avoided cost of gasoline not consumed by the vehicles.
Federal Tax Credits – Monetary incentives issued by the federal government to decrease incremental vehicle cost.
State Tax Credits – Monetary incentives issued by a state government.
The TRC test costs are:
Program Cost – Cost of a utility program to increase PEV acceptance or facilitate the integration of PEVs with the grid

2-3
Carbon from Electricity – Added costs of carbon emissions from electricity generation for vehicle charging.
RPS Cost – the increased requirement to procure higher priced renewables to meet RPS target due to increased load.
Energy Cost – Added cost of electricity to charge vehicles.
Capacity Cost – Added cost of new generation capacity, due mostly to an increase in peak loads.
T&D Cost – Added cost of transmission and distribution equipment upgrades, due mostly to an increase in peak loads on the corresponding equipment.
Charger Costs – Cost to install home and public charging infrastructure.
Incremental Vehicle Cost – Added cost of a PEV over a conventional vehicle.
The Net TRC Benefits are a summary according to the following formula of the benefits components minus the cost components.
Net TRC Benefit = Gasoline Cost + Carbon from Gasoline + Federal Tax Credits + State Tax Credits – Program Cost – Carbon from Electricity – RPS Cost – Energy Cost – Capacity Cost – T&D Cost – Charger Costs – Incremental Vehicle Cost
The Carbon from Gasoline and Gasoline Cost are positive components in the equation above, as these costs are avoided by using electric vehicles. The other costs are all negative as they are additional costs due to PEVs and supporting infrastructure.
Ratepayer Impact Measure Test
The RIM test means that rates will go down if the change in revenues from the program is greater than the change in utility costs. Conversely, rates or bills will increase if revenue collected after a program implementation is less than the total costs incurred by the utility in implementing the program. This test indicates the direction and magnitude of the expected change in customer bills or rate levels.
The new RIM test benefits are:
Utility Bills—A measure of ratepayer benefit from electricity use
The RIM test costs are:
Program Cost – Cost of a utility program to increase PEV acceptance or facilitate the integration of PEVs with the grid
RB Charger Cost – Portion of Charger Cost applied to the rate base, typically for public charging infrastructure.
Carbon from Electricity – Added costs of carbon emissions from electricity generation for vehicle charging.

2-4
RPS Cost – the increased requirement to procure higher priced renewables to meet RPS target due to increased load.
Energy Cost – Added cost of electricity to charge vehicles.
Capacity Cost – Added cost of new generation capacity, due mostly to an increase in peak loads.
T&D Cost – Added cost of transmission and distribution equipment upgrades, due mostly to an increase in peak loads on the corresponding equipment.
The components for Energy Cost, Carbon from Electricity, and Program Cost are identical to those used in the TRC test.
Net RIM Benefits is a summary according to the following formula of the benefits components minus the cost components.
Net RIM Benefit = Utility Bills – Program Cost – RB Charger Cost – Carbon from Electricity – RPS Cost – Energy Cost – Capacity Cost – T&D Cost
Additional information is provided in the California Standard Practice Manual1.
The increase in Utility Bills is computed from the added rate base costs, which increase rates, and the added electrical energy purchases at the increased rates. If additional energy is purchased with no increase in the rate base, it means that the existing infrastructure is sufficient to provide that energy. This is especially true for off-peak energy. The RB Charger Cost is a user-determined fraction of the overall charger cost. Increasing this value will have the effect of increasing the costs for all ratepayers.
1 CPUC (2001). California Standard Practice Manual: Economic Analysis of Demand-Side Programs and Projects. California Public Utility Commission Report, October 2001.
http://www.cpuc.ca.gov/WorkArea/DownloadAsset.aspx?id=7741

3-1
Section 3: Sensitivity Analysis This chapter describes the Sensitivity Analysis case study. To evaluate the sensitivity of the TRC test and RIM test relative to different input variables, 11 different scenarios were compared. Each scenario was compared to the initial Base Scenario. Following is a description and discussion of the Base Scenario as well as the scenario variables.
Base Scenario Inputs
The Base Scenario inputs for this case study are intended to establish initial conditions found in 2016 and then extend expected business-as-usual conditions over a 10-year decision period, which means that the last year of vehicle deployment is 2025. Halting deployments at 2025 puts a finite bound on the scope of the analysis and means that all results apply to this limited period of decision making. In order to justify all benefits and costs of the vehicles and charging stations, their lifetimes are set to 10 years, after which they retire. The combination of the decision period and lifetimes means that the planning horizon extends from 2016–2035. More information about the impact of these inputs follows when describing the scenario variables.
This Base Scenario is meant to simulate what would happen if electric vehicle adoption continued without any major increases or decreases (details follow). In general, the utility infrastructure costs, which include new distribution, transmission, and generation capacity, are average values that are based on current costs.
Time-of-use (TOU) electricity rates are in effect, and they vary by winter and summer seasons. The effect of TOU rates is to avoid on-peak PEV charging. There is an accounting for CO2 emissions from electricity generation and gasoline, and there is no administrative program cost for public charging infrastructure.
The Federal Tax Credit is set to $7,500 per vehicle from 2016 through 2020. After that, the tax credit drops to zero, because it is assumed to expire in 2020.
As of 2016, the PEV fleet included about 2,700 vehicles, and the target population is about 51,000 vehicles by 2025. Only light-duty vehicles (LDVs) are included in the analysis, and existing vehicles and chargers are retired and replaced based on a linear schedule that produces extra ongoing costs. Home chargers are primarily Level 1 type, and public chargers are all Level 2 type.

3-2
Public charging is driven by the purchase of vehicles at a rate of one public charger for every five vehicles. The cost of charging infrastructure decreases by 5% per year. No charger costs are included in the rate base, which means that private investments cover all charger costs rather than socializing some portion through a ratepayer cost-recovery mechanism.
Electricity and capacity costs reflect average values for the industry in 2016. CO2 emissions from electricity are taken into account after 2022. Nineteen typical distribution feeders are included in the analysis and add a small cost in all of the scenarios, as will be noted later.
It is important to note that the Base Case and all scenarios in this case study include no contribution from administrative Program Costs, RPS Cost, or State Tax Credits.
Scenario Variables
Three variables—vehicle adoption, charging behavior, and gasoline prices—were altered in different combinations in order to gauge the sensitivity of the TRC and RIM to these changes.
Vehicle Adoption
The values for vehicle adoption are from a periodic EPRI analysis that projects the adoption of different types of PEVs2. Here, that forecast is used only for the last year of vehicle adoption. Intermediate values are assumed to rise exponentially to that level. Figure 3-1 depicts this exponential rise in vehicle adoption for the three scenario values, up to 2025. After 2025 (10 years), the existing vehicles retire at 1/10 per year, and the new adoptions retire at the rate they were adopted, until at the end of 2035 when there are no vehicles remaining in the study.
2 Plug-in Electric Vehicle Projections: Scenarios and Impacts. EPRI, Palo Alto, CA: 2015. 3002005949.

3-3
Figure 3-1 Vehicle adoption curves
The exact values for the start and end of the purchasing years are listed in Table 3-1. The third column includes the number of new vehicles added over the first 10 years, and the fourth column shows the annual growth rate needed to reach the 2025 adoption level starting at the 2016 level.
Table 3-1 Sensitivity analysis case study: PEV adoption scenario values (number of vehicles)
2016 2025 Additional Vehicles
Annual Growth Rate
Low 2,729 10,724 7,995 16.42%
Medium 2,729 50,913 48,184 38.42%
High 2,729 114,601 111,872 51.48%
Charging Behavior
The Base Scenario establishes values for charging behavior test emphasis on home and public charging. The values can be found in Table 3-2, where the Base Scenario value, Equal Charging, indicates that the same amount of charging, in percentage energy, is involved at both locations.
Table 3-2 Sensitivity analysis case study: charging behavior scenario values (% time)
Charging Behavior Value Home Charging Public Charging
More Home Charging 80% 20%
Equal Charging (Base Scenario) 50% 50%
More Public Charging 20% 80%
0
20,000
40,000
60,000
80,000
100,000
120,000
2016 2017
2018 2019
2020 2021
2022 2023
2024 2025
2026 2027
2028 2029
2030 2031
2032 2033
2034 2035
High
Medium
Low

3-4
The More Home Charging scenario value emphasizes home charging, with 80% of the energy coming from that location. The More Public Charging scenario value emphasizes public charging, with 80% of the energy coming from that location.
Gasoline Prices
All scenarios have the same starting gasoline price in 2016 of $2.03 per gallon. The scenarios differ after 2016, as there is a different gasoline price escalation rate applied to each scenario until 2025. After that the gasoline prices rise piecewise linearly in order to hit target values in 2025, 2030, and 2035, which are shown, by scenario, in Table 3-3 below.
Table 3-3 Sensitivity analysis case study: gasoline price scenarios values ($/gal)
Gasoline Price Value 2016 Esc. Rate 2025 2030 2035
Low Gas Price ($/gal) 2.03 1.90% 2.40 2.45 2.52
Medium Gas Price ($/gal) 2.03 3.50% 2.77 3.29 3.90
High Gas Price ($/gal) 2.03 9.42% 4.56 5.08 5.64
The gasoline prices tracks are shown in Figure 3-2.
Figure 3-2 Gasoline price curves (nominal $/gal)
Scenarios
Table 3-4 lists the scenarios according to different combinations of the scenario values described above. These combinations do not cover every possibility, but are instead chosen to exercise one scenario variable relative to fixed settings of the other two. These relative comparisons are then used to assess the impact of changing the variable under the set conditions of the other two scenarios.

3-5
Table 3-4 Analysis case study scenarios
Scenario Vehicle Adoption Charging Behavior Gasoline Price
1.0 Medium Equal Medium
1.1 Low Equal Medium
1.2 High Equal Medium
1.3 Low More home Medium
1.4 High More home Medium
1.5 Low More public Medium
1.6 High More public Medium
1.7 Medium More home Medium
1.8 Medium More public Medium
1.9 Medium Equal Low
1.10 Medium Equal High
The scenarios listed in Table 3-4 are compared in the following ways, not necessarily in this order.
Scenario 1.0 – Base Scenario
Scenarios 1.1 and 1.2 – Compare with Scenario 1.0 to assess the impact of vehicle adoption.
Scenarios 1.3 and 1.4 – Compare with Scenario 1.7 to assess the impact of vehicle adoption on more home charging.
Scenarios 1.5 and 1.6 – Compare with Scenario 1.8 to assess the impact of vehicle adoption on more public charging.
Scenario 1.7 – Compare with Scenario 1.0 to assess the impact of more home charging. This scenario also acts as a central point for comparing Scenarios 1.3 and 1.4 across changing vehicle adoption, when there is more home charging.
Scenario 1.8 – Compare with Scenario 1.0 to assess the impact of more public charging. This scenario also acts as a central point for comparing Scenarios 1.5 and 1.6 across changing vehicle adoption, when there is more public charging.
Scenarios 1.9 and 1.10 – Compare with Scenario 1.0 to assess sensitivity to changing gasoline prices.
Results
This section describes results for the Base Scenario and alternative scenarios, individually or in pairs, according to the above list. Again, it is crucial to understand that this case study includes no contributions from administrative

3-6
Program Costs, RPS Cost, or State Tax Credits; in addition, there are no RB Charger Costs.
To ensure ease of viewing results and avoid returning to Table 3-4 to view each scenario’s values—pertinent sections showing vehicle adoption, charging behavior, and the gasoline price—have been highlighted at the beginning of each scenario. Because these are portions of the larger Table 3-4, they have not been numbered separately.
Scenario 1.0 – Base Scenario
Scenario Vehicle Adoption
Charging Behavior
Gasoline Price
1.0 Medium Equal Medium
Figure 3-3 depicts the results of the TRC test for Scenario 1.0. The net TRC benefit is slightly negative, leading to a net cost of $1.6 million on total benefits of $252.6 million and total costs of $254.2 million. This means that this scenario is very close to the breakeven point for investment in vehicles and charging infrastructure. The values for this base case were chosen to find a scenario where electric transportation is at its breakeven point and provides a good baseline for comparison for the remaining scenarios.
Figure 3-3 Scenario 1.0 TRC test results (million 2016$)
The TRC tests benefits derive mainly from avoided Gasoline Cost ($195.0 million) and the Federal Tax Credit ($48.3 million). Therefore, the gasoline price as well as the presence or absence of the tax credit are both important variables affecting benefits.

3-7
The main TRC test costs are Incremental Vehicle Cost, Charger Costs, and Energy Cost (totaling $243.4 million). Therefore, the vehicle and charger costs as well as the electricity prices are important variables affecting costs.
Minor cost contributions come from Carbon from Electricity, electricity generation Capacity Cost, and T&D cost (totaling $10.8 million). Table 3-5 provides the detailed component values for the TRC test. The relatively minor contribution of Capacity Cost and T&D Cost to the overall costs is an indication that available system capacity was largely sufficient to handle the added load from the new PEVs and that the added PEV loads are not contributing significantly to local and system peak loads.
Table 3-5 Scenario 1.0 TRC test results (million 2016$)
Cost Component Scenario 1.0 Benefits
Scenario 1.0 Costs
State Tax Credits $0.0 $0.0
Federal Tax Credits $48.3 $0.0
Gasoline Cost $195.0 $0.0
Carbon from Gasoline $9.3 $0.0
Incremental Vehicle Cost $0.0 $160.0
Charger Costs $0.0 $58.8
T&D Cost $0.0 $1.3
Capacity Cost $0.0 $3.9
Energy Cost $0.0 $24.5
RPS Cost $0.0 $0.0
Carbon from Electricity $0.0 $5.6
Program Costs $0.0 $0.0
Net TRC Benefit* -$1.6 –
It should be noted that Scenario 1.0 includes Charger Costs of $58.8 million to accommodate home charging for the additional PEVs, rising from 2,700 in 2016 to 51,000 in 2025 along with replacements of the initial vehicles and charging stations.
The benefit from avoided Carbon from Gasoline ($9.3 million) is significantly larger than the Carbon from Electricity cost ($5.6 million). This means that this level of vehicle adoption has the effect of reducing carbon emissions by shifting away from gasoline toward the adoption of primary energy sources behind electricity production.
3-8
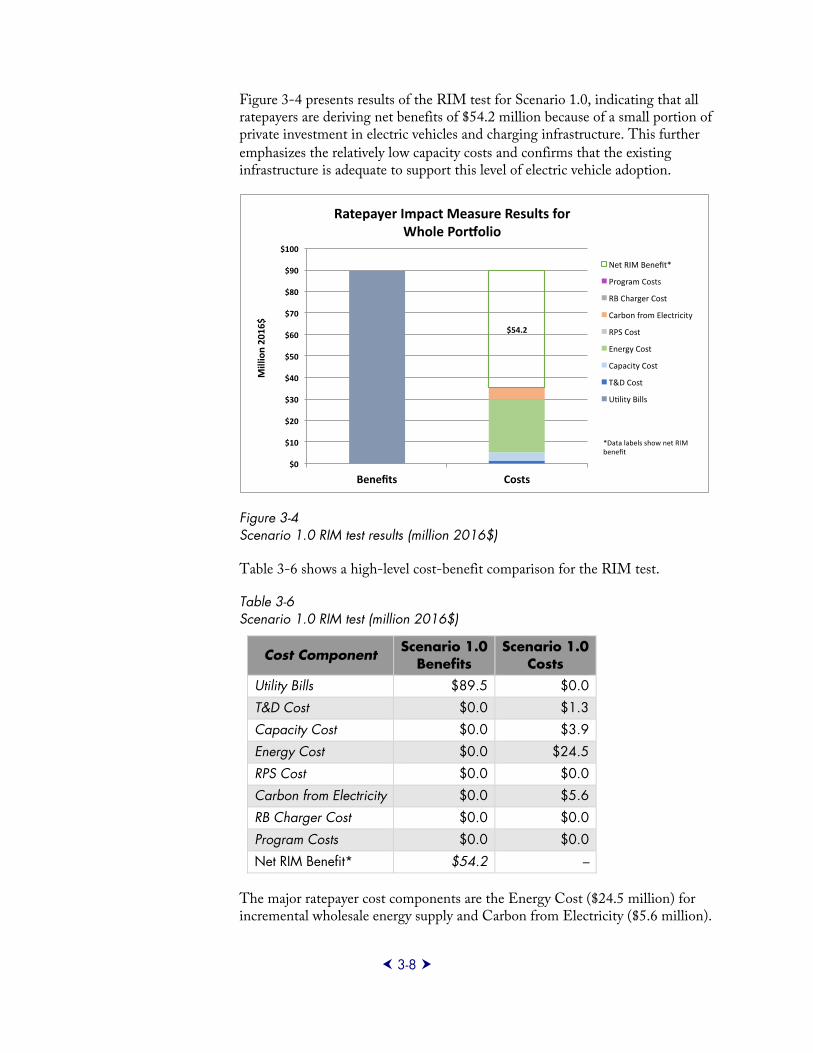
emphasizes the relatively low capacity costs and confirms that the existing infrastructure is adequate to support this level of electric vehicle adoption.
Figure 3-4 Scenario 1.0 RIM test results (million 2016$)
Table 3-6 shows a high-level cost-benefit comparison for the RIM test.
Table 3-6 Scenario 1.0 RIM test (million 2016$)
Cost Component Scenario 1.0Benefits
Scenario 1.0 Costs
Utility Bills $89.5 $0.0
T&D Cost $0.0 $1.3
Capacity Cost $0.0 $3.9
Energy Cost $0.0 $24.5
RPS Cost $0.0 $0.0
Carbon from Electricity $0.0 $5.6
RB Charger Cost $0.0 $0.0
Program Costs $0.0 $0.0
Net RIM Benefit* $54.2 –
The major ratepayer cost components are the Energy Cost ($24.5 million) for incremental wholesale energy supply and Carbon from Electricity ($5.6 million).
Figure 3-4 presents results of the RIM test for Scenario 1.0, indicating that all ratepayers are deriving net benefits of $54.2 million because of a small portion of private investment in electric vehicles and charging infrastructure. This further

3-9
Scenarios 1.1 and 1.2 – Vehicle Adoption
Scenario Vehicle
Adoption Charging Behavior
Gasoline Price
1.0 Medium Equal Medium
1.1 Low Equal Medium
1.2 High Equal Medium
Scenarios 1.1 and 1.2 investigate the effects of medium and high electric vehicle adoption, while keeping all the other variables the same. Figure 3-5 depicts TRC results for Scenario 1.1 (medium vehicle adoption) on the left and Scenario 1.2 (high vehicle adoption) on the right. The Net TRC Benefits is -$1.2 for Scenario 1.1 (at the bottom of the Costs column on the left chart) and -$1.6 for Scenario 1.2 (at the bottom of the Costs column on the right chart). Most notable is that the primary cost-benefit components remain, though in slightly different proportions.
Figure 3-5 Scenarios 1.1 and 1.2 TRC test results (million 2016$)
Avoided Gasoline Cost and the Federal Tax Credit dominate the benefits, and the major cost components are consistently the Incremental Vehicle Cost, Charger Costs, and Energy Cost.
An investigation of the detailed component values for the TRC test is essential in determining how the TRC components vary with vehicle adoption. Table 3-7 provides detailed TRC component values for Scenarios 1.1, 1.0, and 1.2 in increasing order of vehicle adoption—low, medium, and high.

3-10
Table 3-7 Scenarios 1.1, 1.0, and 1.2 TRC test results (million 2016$)
Cost Component
Scenario 1.1
Benefits
Scenario 1.1
Costs
Scenario 1.0
Benefits
Scenario 1.0
Costs
Scenario 1.2
Benefits
Scenario 1.2
Costs State Tax Credits $0.0 $0.0 $0.0 $0.0 $0.0 $0.0
Federal Tax Credits $20.9 $0.0 $48.3 $0.0 $71.7 $0.0
Gasoline Cost $48.6 $0.0 $195.0 $0.0 $421.7 $0.0
Carbon from Gasoline $1.9 $0.0 $9.3 $0.0 $21.2 $0.0
Incremental Vehicle Cost $0.0 $50.9 $0.0 $160.0 $0.0 $315.3
Charger Costs $0.0 $13.2 $0.0 $58.8 $0.0 $126.0
T&D Cost $0.0 $0.0 $0.0 $1.3 $0.0 $6.5
Capacity Cost $0.0 $1.0 $0.0 $3.9 $0.0 $8.3
Energy Cost $0.0 $6.4 $0.0 $24.5 $0.0 $52.4
RPS Cost $0.0 $0.0 $0.0 $0.0 $0.0 $0.0
Carbon from Electricity $0.0 $1.1 $0.0 $5.6 $0.0 $12.7
Program Costs $0.0 $0.0 $0.0 $0.0 $0.0 $0.0
Net TRC Benefit*
-$1.2 – -$1.6 – -$6.5 –
Because the main input varying over Scenarios 1.1, 1.0, and 1.2 is the level of vehicle adoption, we will now investigate the overall costs and benefits according to the different levels of adoption in order to determine how cost and benefit components change as the vehicle adoption increases.
The Net TRC Benefit is not proportional to the number of vehicles. Figure 3-6 shows the per-vehicle Net TRC Benefit. The vehicle count, in this case, is a complex weighting of active cost-benefit components per year, according to the adoption curves seen in Figure 3-1.

3-11
Figure 3-6 Scenarios 1.1, 1.0, and 1.2 net TRC benefit per vehicle (2016$/vehicle)
The relation between vehicle adoption and the Net TRC Benefit is complex, because there are many independent cost components changing in different ways over time. The cost-benefit breakdown by scenario in million 2016$ and the per-vehicle values are listed in Table 3-8. It is apparent that neither the per-vehicle benefits nor the costs are changing in proportion to the weighted number of vehicles, which is close to, but not equal to, the average of the curves shown in Figure 3-1.
The model uses an inner product of the annual vehicle population by vehicle type as well as the annual costs by vehicle type to calculate the total costs. The value of weighted vehicles reflects this, and it is close, but not equal, to the “average” number of vehicles. The 2025 target vehicle population is about half of the weighted vehicles’ value.
Table 3-8 Scenarios 1.1, 1.0, and 1.2 TRC benefits and costs (totals and per vehicle)
Scenario WeightedVehicles
TRC Benefit(million 2016$)
TRC Cost
(million 2016$)
TRC Benefit (2016$
/vehicle)
TRC Cost(2016$
/vehicle)
Net TRC Benefit
(2016$/vehicle)
1.1 4,917 71.4 72.6 8931 9081 -150
1.0 26,241 252.6 254.2 5242 5276 -33
1.2 58,673 514.6 521.2 4600 4659 -59
Because the values of the per-vehicle Net TRC Benefit vary widely, it is not clear whether there is a clear trend in how the TRC components change with vehicle adoption. Figure 3-7 shows the TRC components across these scenarios in order of increasing vehicle adoption. The benefit categories (Avoided Gasoline Cost,
-160
-140
-120
-100
-80
-60
-40
-20
0 10,000 20,000 30,000 40,000 50,000 60,000
Ne
t T
RC
Be
nefi
t (2
016$
/ve
hic
le)
Average # of Vehicles
Net TRC Benefit per Vehicle

3-12
Federal Tax Credits, and Avoided Carbon from Gasoline) have thicker lines than the cost categories.
Figure 3-7 Scenarios 1.1, 1.0, and 1.2 net TRC benefit (2016$/vehicle)
The important observations are as follows:
The plotted values are net present value (NPV) over the planning horizon, which gives significant extra weight to near-term effects when they are constant over time. At the same time, the NPV weights those factors that grow faster than the discount rate disproportionally more in the long term, such as vehicle adoption as well as the benefits and costs related to adoption.
The less-important categories are listed at the bottom of the chart, below the Energy Cost, and include Carbon from Gasoline, Carbon from Electricity, Capacity Cost, and T&D Cost.
All major per-vehicle costs and benefits reduce with increased vehicle adoption. These per-vehicle reductions are heavily discounted.
- Per-vehicle avoided Gasoline Cost reduces because discounting is stronger than increases in the gasoline price.
- Per-vehicle Incremental Vehicle Cost is assumed to reduce over time, plus the latter values are being discounted.
- The Federal Tax Credit goes to zero after 2020, when more than half of the vehicles are purchased.
- Per-vehicle Charger Costs are assumed to reduce over time, plus the latter values are being discounted.
- Per-vehicle Energy Cost reduces because discounting is stronger than the given electricity rate increases.

3-13
The major per-vehicle Federal Tax Credit decreases faster than Charger Costs but not as fast as Incremental Vehicle Cost.
The per-vehicle avoided Gasoline Cost is falling faster than Energy Cost, the latter of which is relatively small and constant.
Figure 3-8 shows a high-level cost-benefit comparison for the RIM.
Figure 3-8 Scenarios 1.1 and 1.2 RIM test results (million 2016$)
The RIM test for Scenario 1.1 indicates that all ratepayers are deriving net benefits of $14.2 million because of a small portion investing privately in electric vehicles and charging infrastructure. The RIM test for Scenario 1.2 is $112.6 million.
Table 3-9 presents detailed figures for the components of the RIM.
Table 3-9 Scenarios 1.1, 1.0, and 1.2 RIM test results (million 2016$)
Cost Component
Scenario 1.1
Benefits
Scenario 1.1
Costs
Scenario 1.0
Benefits
Scenario 1.0
Costs
Scenario 1.2
Benefits
Scenario 1.2
Costs Utility Bills $22.7 $0.0 $89.5 $0.0 $192.5 $0.0T&D Cost $0.0 $0.0 $0.0 $1.3 $0.0 $6.5Capacity Cost
$0.0 $1.0 $0.0 $3.9 $0.0 $8.3
Energy Cost $0.0 $6.4 $0.0 $24.5 $0.0 $52.4RPS Cost $0.0 $0.0 $0.0 $0.0 $0.0 $0.0Carbon from Electricity
$0.0 $1.1 $0.0 $5.6 $0.0 $12.7
RB Charger Cost
$0.0 $0.0 $0.0 $0.0 $0.0 $0.0
Program Costs $0.0 $0.0 $0.0 $0.0 $0.0 $0.0
Net RIM Benefit*
$14.2 – $54.2 – $112.6 –

3-14
The major cost components that subtract from the ratepayer benefits are Energy Cost, Carbon from Electricity, and Capacity Cost. All of these values have been seen to decrease on a per-vehicle basis as vehicle adoption increases.
Scenario 1.7 – More Home Charging
Scenario Vehicle
Adoption Charging Behavior
Gasoline Price
1.0 Medium Equal Medium
1.7 Medium More Home Medium
Scenario 1.7 differs from 1.0 by having More Home Charging. Its ratio of home/public charging is 80/20, compared to 50/50, and the net TRC benefit rises to $13.6 million, from -$1.6 million in Scenario 1.0. Table 3-10 presents the detailed TRC components for Scenario 1.7 and their differences from those in Scenario 1.0. The only differences occur in Charger Costs and T&D Costs. This is understandable because drivers are charging at home, where there is assumed to be an ever-available charging station, and are thus using less of the public charging infrastructure. The reduction in investment in public infrastructure is significant, at $15.2 million, because Scenario 1.7 passed the TRC, whereas Scenario 1.0 failed the TRC. Public charging changes the cost of electricity slightly but does not reduce home charging costs with the current assumptions and does not have a simulated impact on adoption, so in this analysis public charging primarily adds costs. The results imply that the breakeven amount of public infrastructure that can be supported without leading to a negative TRC is 47% public charging.

3-15
Table 3-10 Scenario 1.7 TRC test results (million 2016$)
Cost Component
Scenario 1.7
Benefits
Scenario 1.7
Costs
Scenario 1.7
– Scenario 1.0
Benefits
Scenario 1.7
– Scenario 1.0
Costs State Tax Credits $0.0 $0.0 $0.0 $0.0
Federal Tax Credits $48.3 $0.0 $0.0 $0.0
Gasoline Cost $195.0 $0.0 $0.0 $0.0
Carbon from Gasoline $9.3 $0.0 $0.0 $0.0
Incremental Vehicle Cost $0.0 $160.0 $0.0 $0.0
Charger Costs $0.0 $44.1 $0.0 -$14.7
T&D Cost $0.0 $0.9 $0.0 -$0.5
Capacity Cost $0.0 $3.9 $0.0 $0.0
Energy Cost $0.0 $24.5 $0.0 $0.0
RPS Cost $0.0 $0.0 $0.0 $0.0
Carbon from Electricity $0.0 $5.6 $0.0 $0.0
Program Costs $0.0 $0.0 $0.0 $0.0
Net TRC Benefit* $13.6 – $15.2 –
Table 3-11 presents detailed figures for the components of the RIM test for Scenario 1.7 and differences from Scenario 1.0. The change in T&D Costs in the TRC test results is readily apparent. Additionally, the Utility Bills have been reduced, which means that there is a $2.5 million decrease in ratepayer benefits.

3-16
Table 3-11 Scenario 1.7 RIM test results (million 2016$)
Cost Component
Scenario 1.7
Benefits
Scenario 1.7
Costs
Scenario 1.7
– Scenario 1.0
Benefits
Scenario 1.7
– Scenario 1.0
Costs Utility Bills $87.0 $0.0 -$2.5 $0.0
T&D Cost $0.0 $0.9 $0.0 -$0.5
Capacity Cost $0.0 $3.9 $0.0 $0.0
Energy Cost $0.0 $24.5 $0.0 $0.0
RPS Cost $0.0 $0.0 $0.0 $0.0
Carbon from Electricity $0.0 $5.6 $0.0 $0.0
RB Charger Cost $0.0 $0.0 $0.0 $0.0
Program Costs $0.0 $0.0 $0.0 $0.0
Net RIM Benefit* $52.1 – -$2.0 –
The Net RIM Benefit in Scenario 1.7 is $52.1 million, which is $2.0 million less than in Scenario 1.0. Despite this reduction, the Net RIM Benefit is still significantly greater than the overall RIM costs ($34.9 million) due to the introduction of PEVs.
Scenarios 1.3, 1.7, and 1.4 – More Home Charging Across Vehicle Adoption
Scenario Vehicle Adoption
Charging Behavior
Gasoline Price
1.0 Medium Equal Medium
1.3 Low More Home Medium
1.4 High More Home Medium
1.7 Medium More Home Medium
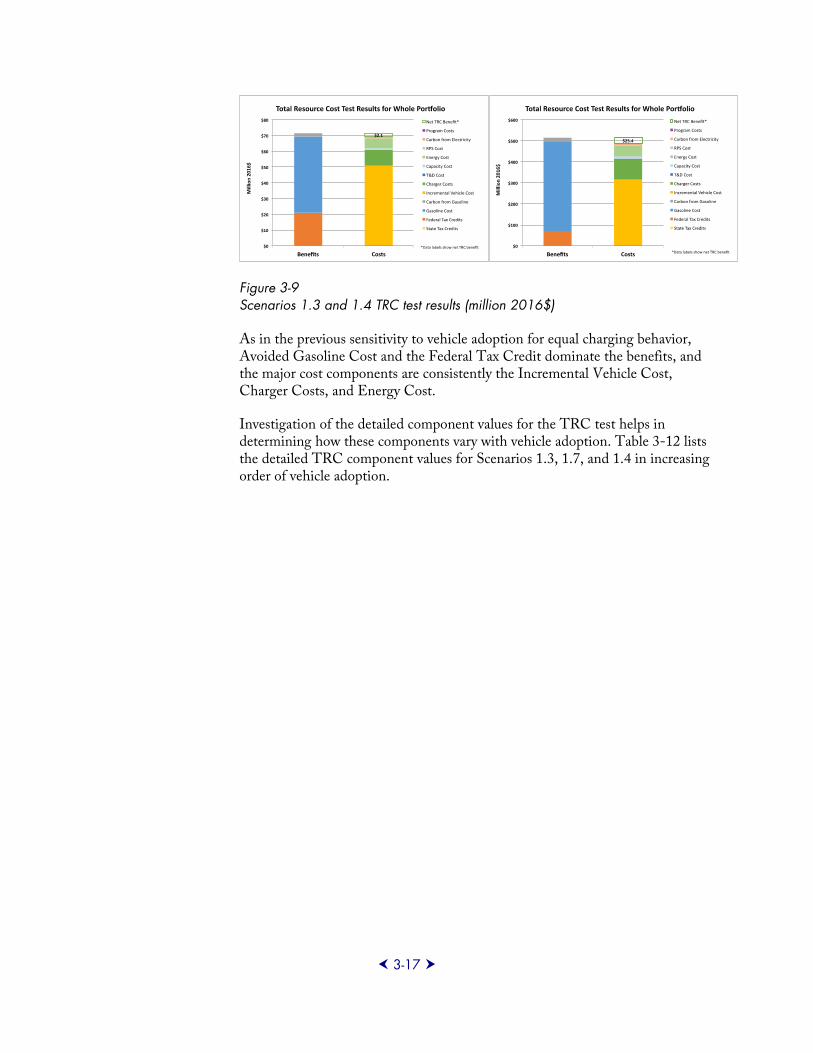
Scenarios 1.3 and 1.4 investigate Low and High Vehicle Adoption in the presence of More Home Charging. They are compared with Scenario 1.7, which also has More Home Charging and Medium Vehicle Adoption. Figure 3-9 shows the TRC test results for More Home Charging, while having Low Vehicle Adoption (Scenario 1.3) and High Vehicle Adoption (Scenario 1.4). The Net TRC Benefits are positive in both cases, with levels of $2.1 million and $25.4 million for Low and High Vehicle Adoption, respectively.
3-17
Figure 3-9 Scenarios 1.3 and 1.4 TRC test results (million 2016$)
As in the previous sensitivity to vehicle adoption for equal charging behavior, Avoided Gasoline Cost and the Federal Tax Credit dominate the benefits, and the major cost components are consistently the Incremental Vehicle Cost, Charger Costs, and Energy Cost.
Investigation of the detailed component values for the TRC test helps in determining how these components vary with vehicle adoption. Table 3-12 lists the detailed TRC component values for Scenarios 1.3, 1.7, and 1.4 in increasing order of vehicle adoption.

3-18
Table 3-12 Scenarios 1.3, 1.7, and 1.4 TRC test results (million 2016$)
Cost Component
Scenario 1.3
Benefits
Scenario 1.3
Costs
Scenario 1.7
Benefits
Scenario 1.7
Costs
Scenario 1.4
Benefits
Scenario 1.4
Costs State Tax Credits $0.0 $0.0 $0.0 $0.0 $0.0 $0.0
Federal Tax Credits $20.9 $0.0 $48.3 $0.0 $71.7 $0.0
Gasoline Cost $48.6 $0.0 $195.0 $0.0 $421.7 $0.0
Carbon from Gasoline $1.9 $0.0 $9.3 $0.0 $21.2 $0.0
Incremental Vehicle Cost $0.0 $50.9 $0.0 $160.0 $0.0 $315.3
Charger Costs $0.0 $9.9 $0.0 $44.1 $0.0 $94.5
T&D Cost $0.0 $0.0 $0.0 $0.9 $0.0 $6.0
Capacity Cost $0.0 $1.0 $0.0 $3.9 $0.0 $8.3
Energy Cost $0.0 $6.4 $0.0 $24.5 $0.0 $52.4
RPS Cost $0.0 $0.0 $0.0 $0.0 $0.0 $0.0
Carbon from Electricity $0.0 $1.1 $0.0 $5.6 $0.0 $12.7
Program Costs $0.0 $0.0 $0.0 $0.0 $0.0 $0.0
Net TRC Benefit*
$2.1 – $13.6 – $25.4 –
The Net TRC Benefit is not proportional to the number of vehicles. Figure 3-10 shows the per-vehicle Net TRC Benefit. In this case, the vehicle count is a complex weighting of active cost-benefit components per year, according to the adoption curves seen in Figure 3-1.

3-19
Figure 3-10 Scenarios 1.3, 1.7, and 1.4 net TRC benefit (2016$/vehicle)
As explained earlier, the relation between vehicle adoption and the Net TRC Benefit is complex when more home charging is performed. The cost-benefit breakdown of by scenario in million 2016$ and the per-vehicle values are shown in Table 3-13. It is apparent that neither the per-vehicle benefits nor costs are changing in proportion to the weighted vehicles, which is an estimate of the vehicles clustered near the average of the curves shown in Figure 3-1.
Table 3-13 Scenarios 1.3, 1.7, and 1.4 TRC benefits and costs (totals and per vehicle)
Scenario WeightedVehicles
TRC Benefit(million 2016$)
TRC Cost
(million 2016$)
TRC Benefit (2016$
/vehicle)
TRC Cost(2016$
/vehicle)
Net TRCBenefit (2016$
/vehicle)
1.3 4,917 71.41 69.34 14,523 14,102 421
1.7 26,241 252.57 238.99 9,625 9,108 518
1.4 58,673 514.64 489.21 8,771 8,338 433
Because the values of the per-vehicle Net TRC Benefit vary widely, it is again not clear whether there is a definite trend in how the TRC components change with vehicle adoption. Figure 3-11 shows the cost components across these scenarios in order of increasing vehicle adoption. The benefit categories (Avoided Gasoline Cost, Federal Tax Credits, and Avoided Carbon from Gasoline) have thicker lines than the cost categories.
0
100
200
300
400
500
600
0 10,000 20,000 30,000 40,000 50,000 60,000
Ne
t T
RC
Be
nefi
t (2
016$
/ve
hic
le)
Average # of Vehicles
Net TRC Benefit per Vehicle

3-20
Figure 3-11 Scenarios 1.3, 1.7, and 1.4 net TRC benefit (2016$/vehicle)
One key observation is that with More Home Charging, the Charger Costs are just above the Energy Cost, whereas with 50/50 home/public charging they were the third highest cost. This difference is large enough for the scenario to pass the TRC.
Figure 3-12 shows a high-level cost-benefit comparison for the RIM.
Figure 3-12 Scenarios 1.3 and 1.4 RIM test results (million 2016$)
The RIM test for Scenario 1.3 indicates that all ratepayers are deriving net benefits of $13.6 million because of a small private investment in electric vehicles and charging infrastructure. The corresponding value in Scenario 1.4 is $107.7 million.
Table 3-14 presents detailed figures for the RIM components.

3-21
Table 3-14 Scenarios 1.3 and 1.4 RIM test results (million 2016$)
Cost Component
Scenario 1.3
Benefits
Scenario 1.3
Costs
Scenario 1.7
Benefits
Scenario 1.7
Costs
Scenario 1.4
Benefits
Scenario 1.4
Costs Utility Bills $22.1 $0.0 $87.0 $0.0 $187.1 $0.0
T&D Cost $0.0 $0.0 $0.0 $0.9 $0.0 $6.0
Capacity Cost $0.0 $1.0 $0.0 $3.9 $0.0 $8.3
Energy Cost $0.0 $6.4 $0.0 $24.5 $0.0 $52.4
RPS Cost $0.0 $0.0 $0.0 $0.0 $0.0 $0.0
Carbon from Electricity $0.0 $1.1 $0.0 $5.6 $0.0 $12.7
RB Charger Cost $0.0 $0.0 $0.0 $0.0 $0.0 $0.0
Program Costs $0.0 $0.0 $0.0 $0.0 $0.0 $0.0
Net RIM Benefit*
$13.6 – $52.1 – $107.7 –
Clearly, the RIM passes for all scenarios with More Home Charging.
Scenario 1.8 – More Public Charging
Scenario Vehicle
Adoption Charging Behavior
Gasoline Price
1.0 Medium Equal Medium
1.8 Medium More Public Medium
Scenario 1.8 differs from 1.0 by having More Public Charging. The ratio of home/public charging in Scenario 1.8 is 20/80, compared to 50/50. The result is that the Net TRC Benefit decreases by $14.7 million from -$1.6 million in Scenario 1.0 to -$16.3 million. This can be seen in Table 3-15, which presents the detailed TRC components for Scenario 1.8 and their differences from those in Scenario 1.0.

3-22
Table 3-15 Scenario 1.8 TRC test results (million 2016$)
Cost Component
Scenario 1.8
Benefits
Scenario 1.8
Costs
Scenario 1.8
– Scenario 1.0
Benefits
Scenario 1.8
– Scenario 1.0
Costs State Tax Credits $0.0 $0.0 $0.0 $0.0
Federal Tax Credits $48.3 $0.0 $0.0 $0.0
Gasoline Cost $195.0 $0.0 $0.0 $0.0
Carbon from Gasoline $9.3 $0.0 $0.0 $0.0
Incremental Vehicle Cost $0.0 $160.0 $0.0 $0.0
Charger Costs $0.0 $73.5 $0.0 $14.7
T&D Cost $0.0 $1.3 $0.0 $0.0
Capacity Cost $0.0 $3.9 $0.0 $0.0
Energy Cost $0.0 $24.5 $0.0 $0.0
RPS Cost $0.0 $0.0 $0.0 $0.0
Carbon from Electricity $0.0 $5.6 $0.0 $0.0
Program Costs $0.0 $0.0 $0.0 $0.0
Net TRC Benefit* -$16.3 – -$14.7 –
The only differences occur in Charger Costs, which is understandable, because drivers are charging more at work than at home and using more of the public infrastructure. While greater investment is required in the public charging infrastructure, it is interesting that this infrastructure does not require new T&D investment, which is based on the assumption that TOU rates create incentives for avoiding peak charging and thus added T&D Cost and Capacity Cost and that the existing infrastructure has significant headroom for the additional charging energy. The increased investment in public infrastructure ($14.7 million) makes Scenario 1.8 fail the TRC test with lower net benefits than Scenario 1.0.
Table 3-16 contains detailed figures for the RIM components for Scenario 1.8 and differences from Scenario 1.0. The only difference is that Utility Bills have been reduced, which means that there is a $2.5 million increase in ratepayer benefits.
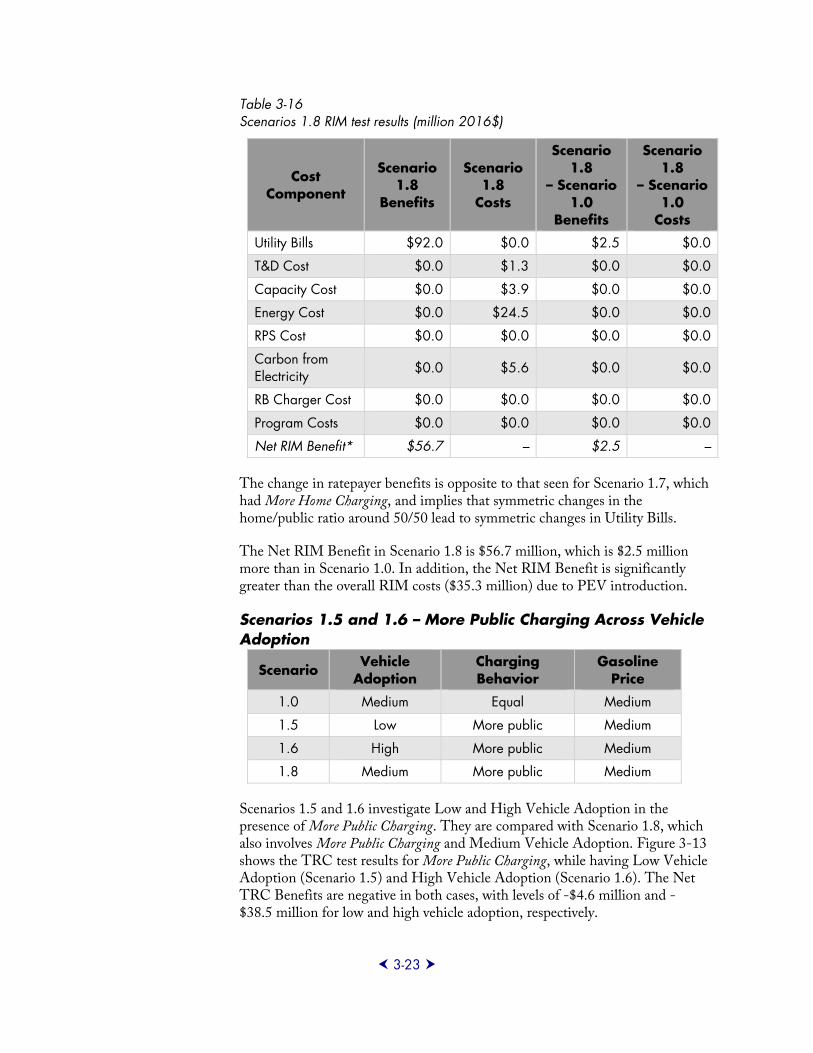
3-23
Table 3-16 Scenarios 1.8 RIM test results (million 2016$)
Cost Component
Scenario 1.8
Benefits
Scenario 1.8
Costs
Scenario 1.8
– Scenario 1.0
Benefits
Scenario 1.8
– Scenario 1.0
Costs Utility Bills $92.0 $0.0 $2.5 $0.0
T&D Cost $0.0 $1.3 $0.0 $0.0
Capacity Cost $0.0 $3.9 $0.0 $0.0
Energy Cost $0.0 $24.5 $0.0 $0.0
RPS Cost $0.0 $0.0 $0.0 $0.0
Carbon from Electricity $0.0 $5.6 $0.0 $0.0
RB Charger Cost $0.0 $0.0 $0.0 $0.0
Program Costs $0.0 $0.0 $0.0 $0.0
Net RIM Benefit* $56.7 – $2.5 –
The change in ratepayer benefits is opposite to that seen for Scenario 1.7, which had More Home Charging, and implies that symmetric changes in the home/public ratio around 50/50 lead to symmetric changes in Utility Bills.
The Net RIM Benefit in Scenario 1.8 is $56.7 million, which is $2.5 million more than in Scenario 1.0. In addition, the Net RIM Benefit is significantly greater than the overall RIM costs ($35.3 million) due to PEV introduction.
Scenarios 1.5 and 1.6 – More Public Charging Across Vehicle Adoption
Scenario Vehicle
Adoption Charging Behavior
Gasoline Price
1.0 Medium Equal Medium
1.5 Low More public Medium
1.6 High More public Medium
1.8 Medium More public Medium
Scenarios 1.5 and 1.6 investigate Low and High Vehicle Adoption in the presence of More Public Charging. They are compared with Scenario 1.8, which also involves More Public Charging and Medium Vehicle Adoption. Figure 3-13 shows the TRC test results for More Public Charging, while having Low Vehicle Adoption (Scenario 1.5) and High Vehicle Adoption (Scenario 1.6). The Net TRC Benefits are negative in both cases, with levels of -$4.6 million and -$38.5 million for low and high vehicle adoption, respectively.

3-24
Figure 3-13 Scenarios 1.5 and 1.6 TRC test results (million 2016$)
As in the previous sensitivity to vehicle adoption for equal charging behavior, Avoided Gasoline Cost and the Federal Tax Credits dominate the benefits. The major cost components are consistently the Incremental Vehicle Cost, Charger Costs, and Energy Cost. The Incremental Vehicle Cost is increasing significantly relative to the Base Scenario because more public charging infrastructure is being installed.
Investigation of the detailed component values for the TRC test will help in determining how these components vary with vehicle adoption. Table 3-17 presents detailed TRC component values for Scenarios 1.5, 1.8, and 1.6 in increasing order of vehicle adoption.
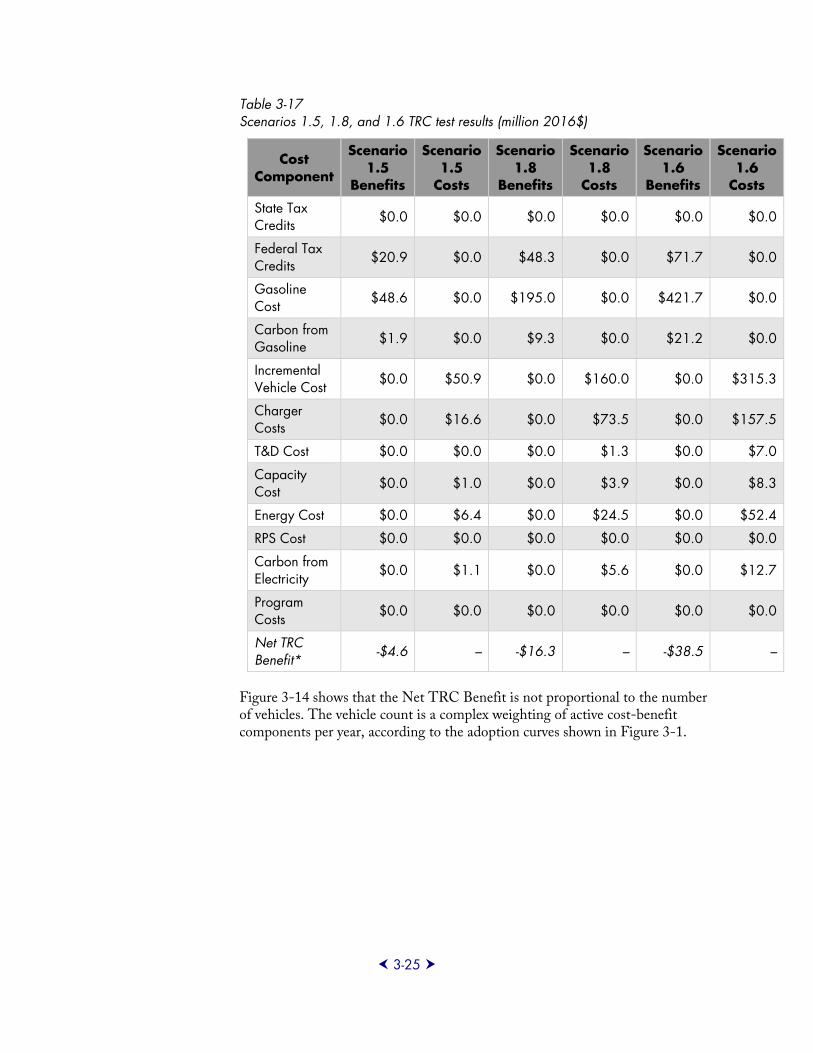
3-25
Table 3-17 Scenarios 1.5, 1.8, and 1.6 TRC test results (million 2016$)
Cost Component
Scenario 1.5
Benefits
Scenario 1.5
Costs
Scenario 1.8
Benefits
Scenario 1.8
Costs
Scenario 1.6
Benefits
Scenario 1.6
Costs State Tax Credits $0.0 $0.0 $0.0 $0.0 $0.0 $0.0
Federal Tax Credits $20.9 $0.0 $48.3 $0.0 $71.7 $0.0
Gasoline Cost $48.6 $0.0 $195.0 $0.0 $421.7 $0.0
Carbon from Gasoline $1.9 $0.0 $9.3 $0.0 $21.2 $0.0
Incremental Vehicle Cost $0.0 $50.9 $0.0 $160.0 $0.0 $315.3
Charger Costs $0.0 $16.6 $0.0 $73.5 $0.0 $157.5
T&D Cost $0.0 $0.0 $0.0 $1.3 $0.0 $7.0
Capacity Cost $0.0 $1.0 $0.0 $3.9 $0.0 $8.3
Energy Cost $0.0 $6.4 $0.0 $24.5 $0.0 $52.4
RPS Cost $0.0 $0.0 $0.0 $0.0 $0.0 $0.0
Carbon from Electricity $0.0 $1.1 $0.0 $5.6 $0.0 $12.7
Program Costs $0.0 $0.0 $0.0 $0.0 $0.0 $0.0
Net TRC Benefit*
-$4.6 – -$16.3 – -$38.5 –
Figure 3-14 shows that the Net TRC Benefit is not proportional to the number of vehicles. The vehicle count is a complex weighting of active cost-benefit components per year, according to the adoption curves shown in Figure 3-1.

3-26
Figure 3-14 Scenarios 1.5, 1.8, and 1.6 net TRC benefit (2016$/vehicle)
As shown earlier, the relation between vehicle adoption and the net TRC benefit is complex when More Home Charging is performed. The cost-benefit breakdown by scenario in million 2016$ and the per-vehicle values are shown in Table 3-18. It is apparent that neither the per-vehicle benefits nor costs are changing in proportion to the weighted vehicles, which is an estimate of the vehicles clustered near the average of the curves shown in Figure 3-1.
Table 3-18 Scenarios 1.5, 1.8, and 1.6 TRC benefits and costs (totals and per vehicle)
Scenario WeightedVehicles
TRC Benefit(million 2016$)
TRC Cost
(million 2016$)
TRC Benefit (2016$
/vehicle)
TRC Cost (2016$
/vehicle)
Net TRC Benefit(2016$/vehicle)
1.5 4,917 71.41 75.96 14,523 15,448 -925
1.8 26,241 252.57 268.85 9,625 10,245 -620
1.6 58,673 514.64 553.17 8,771 9,428 -657
Because the values of the per-vehicle Net TRC Benefit vary widely, it is again not clear whether there is a clear trend in how the TRC components change with vehicle adoption. Figure 3-15 shows the cost components across these scenarios in order of increasing vehicle adoption. The benefit categories (Avoided Gasoline Cost, Federal Tax Credits, and Avoided Carbon from Gasoline) have thicker lines than the cost categories.
-1,000
-900
-800
-700
-600
-500
-400
-300
-200
-100
0
0 10,000 20,000 30,000 40,000 50,000 60,000
Ne
t T
RC
Be
nefi
t (2
016$
/ve
hic
le)
Average # of Vehicles
Net TRC Benefit per Vehicle

3-27
Figure 3-15 Scenarios 1.5, 1.8, and 1.6 net TRC benefit (2016$/vehicle)
The important observation is:
With More Public Charging, the charger costs become larger than the Federal Tax Credit. This difference is large enough to fail the TRC, regardless of the tested levels of vehicle adoption.
Figure 3-16 presents a high-level cost-benefit comparison for the RIM.
Figure 3-16 Scenarios 1.5 and 1.6 RIM test results (million 2016$)
The RIM test for Scenario 1.5 indicates that all ratepayers are deriving net benefits of $14.9 million because of a small portion investing privately in electric vehicles and charging infrastructure. The corresponding value in Scenario 1.6 is $117.5 million.
Table 3-19 presents detailed figures for RIM components.

3-28
Table 3-19 Scenarios 1.5, 1.0, and 1.6 RIM test results (million 2016$)
Cost Component
Scenario 1.5
Benefits
Scenario 1.5
Costs
Scenario 1.0
Benefits
Scenario 1.0
Costs
Scenario 1.6
Benefits
Scenario 1.6
Costs Utility Bills $23.4 $0.0 $89.5 $0.0 $197.8 $0.0
T&D Cost $0.0 $0.0 $0.0 $1.3 $0.0 $7.0
Capacity Cost $0.0 $1.0 $0.0 $3.9 $0.0 $8.3
Energy Cost $0.0 $6.4 $0.0 $24.5 $0.0 $52.4
RPS Cost $0.0 $0.0 $0.0 $0.0 $0.0 $0.0
Carbon from Electricity $0.0 $1.1 $0.0 $5.6 $0.0 $12.7
RB Charger Cost $0.0 $0.0 $0.0 $0.0 $0.0 $0.0
Program Costs $0.0 $0.0 $0.0 $0.0 $0.0 $0.0
Net RIM Benefit*
$14.9 – $54.2 – $117.5 –
Clearly, the RIM passes for all scenarios with More Public Charging.
Scenarios 1.9 and 1.10 – Gasoline Prices
Scenario Vehicle
Adoption Charging Behavior
Gasoline Price
1.0 Medium Equal Medium
1.9 Medium Equal Low
1.10 Medium Equal High
The most significant benefit seen in all cases is avoided Gasoline Cost. As mentioned above in describing the scenario variables and the trajectories for gasoline prices, the current prices are low enough to cause the Scenario 1.0 TRC to barely fail. This sensitivity analysis examines the impact of changing future gasoline prices according to the most recent projections from the U.S. Department of Energy’s Annual Energy Outlook 2015. Reference Case prices have been used in all prior scenarios. The Low Oil Price Case in Scenario 1.9 and the High Oil Price Case in Scenario 1.10 will now be examined.
Figure 3-17 depicts the layered cost-benefit components of the TRC test for Scenario 1.9 (left) and Scenario 1.10 (right). The Net TRC Benefit ranges from -$30.4 million for low gasoline prices to $159.1 million for high gasoline prices.
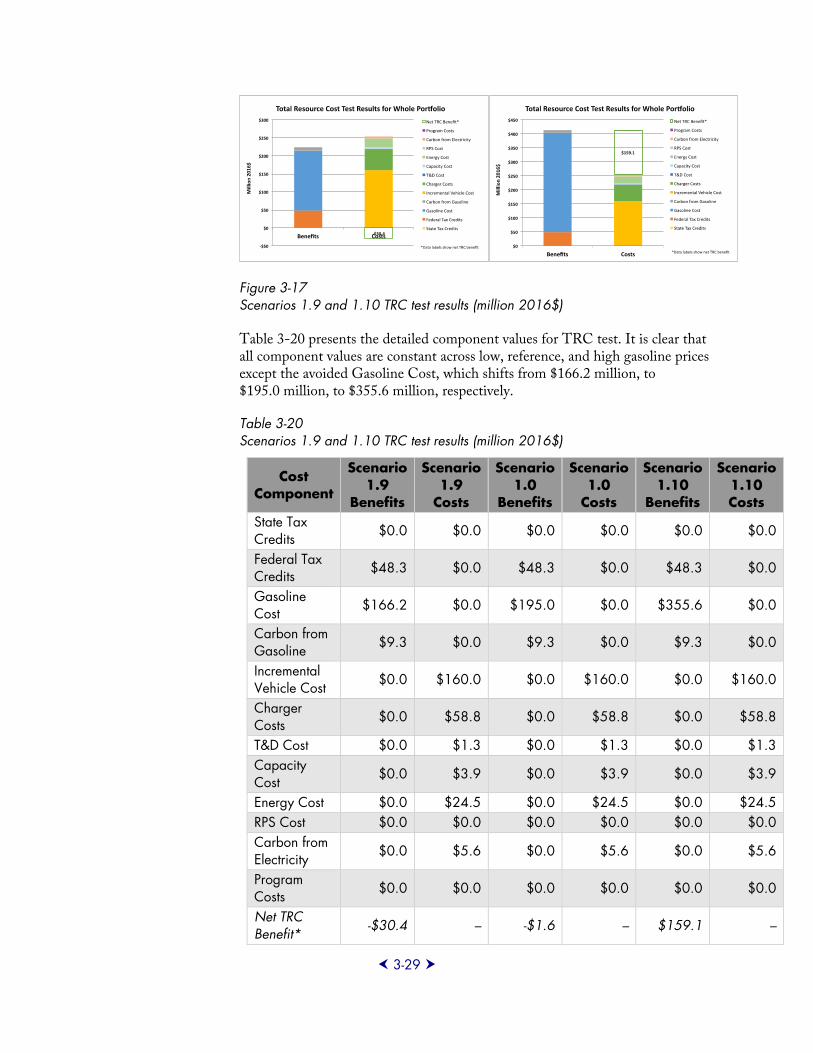
3-29
Figure 3-17 Scenarios 1.9 and 1.10 TRC test results (million 2016$)
Table 3-20 presents the detailed component values for TRC test. It is clear that all component values are constant across low, reference, and high gasoline prices except the avoided Gasoline Cost, which shifts from $166.2 million, to $195.0 million, to $355.6 million, respectively.
Table 3-20 Scenarios 1.9 and 1.10 TRC test results (million 2016$)
Cost Component
Scenario 1.9
Benefits
Scenario 1.9
Costs
Scenario 1.0
Benefits
Scenario 1.0
Costs
Scenario 1.10
Benefits
Scenario 1.10 Costs
State Tax Credits $0.0 $0.0 $0.0 $0.0 $0.0 $0.0
Federal Tax Credits $48.3 $0.0 $48.3 $0.0 $48.3 $0.0
Gasoline Cost
$166.2 $0.0 $195.0 $0.0 $355.6 $0.0
Carbon from Gasoline $9.3 $0.0 $9.3 $0.0 $9.3 $0.0
Incremental Vehicle Cost $0.0 $160.0 $0.0 $160.0 $0.0 $160.0
Charger Costs
$0.0 $58.8 $0.0 $58.8 $0.0 $58.8
T&D Cost $0.0 $1.3 $0.0 $1.3 $0.0 $1.3Capacity Cost
$0.0 $3.9 $0.0 $3.9 $0.0 $3.9
Energy Cost $0.0 $24.5 $0.0 $24.5 $0.0 $24.5RPS Cost $0.0 $0.0 $0.0 $0.0 $0.0 $0.0Carbon from Electricity
$0.0 $5.6 $0.0 $5.6 $0.0 $5.6
Program Costs $0.0 $0.0 $0.0 $0.0 $0.0 $0.0
Net TRC Benefit* -$30.4 – -$1.6 – $159.1 –

3-30
The implication is that the breakeven point for gasoline price, relative to the 2025 value, is just above the medium (Reference Case) price at $2.79. The key conclusion is as follows:
If the medium price track were just slightly higher, then Scenario 1.0 would break even.
Because the RIM test does not include avoided Gasoline Cost, the results for Scenarios 1.9 and 1.10 are identical to those in Scenario 1.0.
Summary
This Sensitivity Analysis Case Study has arrived at several major points. It had a strong focus on the impacts of vehicle adoption relative to charging behavior and on the impact of gasoline prices. Taking one point at a time, we find the following:
All scenarios pass the RIM test, with net RIM benefits greater than the total RIM costs.
The strong implication is that, for the given scenarios, existing electricity infrastructure is being used more effectively, which delivers clear benefits to all ratepayers. This is supported by the RIM benefits being more than twice as high as the RIM costs.
The Base Scenario (1.0) is very close to the breakeven point.
The Net TRC Benefit is -$1.6 million, a small fraction of the larger cost-benefit components. Small increases in the home charging behavior gasoline price would allow this scenario to pass the TRC test.
The relation between vehicle adoption and the Net TRC Benefit is complex.
The way that TRC cost-benefit components change under a 10-year decision horizon, which extends a further 10 years for retirements, is complicated by the exponential growth in most model parameters, net present value discounting over time, and assumptions about how long the federal tax credit remains active.
The most important inputs are the Federal Tax Credits, Gasoline Prices, Energy Prices, Charger Costs, and Incremental Vehicle Costs.
The significance of these components over others is due directly to assumptions about the values of the model inputs.
The less-important categories are Carbon from Gasoline, Carbon from Electricity, Capacity Cost, and T&D Cost because the current infrastructure can handle most of the load needed to support electric transportation.
Even with plots and detailed tables to investigate of the sensitivity of the TRC cost-benefit components to vehicle adoption, it is too complicated to establish trends within the range of the given scenarios. As such, it is important to have background knowledge on the important inputs and to establish annual time series from this background.

3-31
All major per-vehicle benefits and costs decrease with increased vehicle adoption.
Vehicle adoption helps increase the utilization of fixed investments in charging and other electricity infrastructure, which lowers the per-vehicle cost of these investments, because more vehicles are responsible for slowly rising fixed costs.
The major per-vehicle Federal Tax Credits decrease faster than charger costs but not as fast as incremental vehicle cost.
Assumptions about the relative impacts of Federal Tax Credits and the premium for PEVs, which is represented as the Incremental Vehicle Cost and the Charger Cost, is important to develop robust background material. The relative changes in these components in the long term (10 years and further) have a significant impact on the TRC.
Per-vehicle avoided Gasoline Cost is falling faster than Energy Cost, the latter of which is relatively small and constant.
An important tradeoff is the fuel switching from gasoline to electricity. Background knowledge is needed to specify these values for credible results. The relative prices of these energy categories are important as are technology improvements in efficiencies of energy conversion to miles driven, which was not addressed directly in this case study.
Home charging reduces the cost of charging infrastructure.
The reduced need for greater charging infrastructure allows the Base Scenario to pass the TRC.
If the medium price track for gasoline were just slightly higher, then Scenario 1.0 would break even.
Gasoline prices of the given scenarios have the strongest impact on the TRC test results. Between the low and high gasoline price values, the Net TRC Benefit spans more than $160 million, driven solely by changes in the avoided Gasoline Cost.

4-1
Section 4: Critical Short-Term Benefits This chapter describes the second case study, which is an analysis of critical short-term benefits. The immediate context for vehicle and charger planning decisions is the year 2016, which has relatively low gasoline prices and a temporary Federal Tax Credit. This case study describes the way that these factors impact plans to purchase PEVs and charging stations from an economic standpoint.
Base Scenario Inputs
The Base Scenario inputs for this case study are intended to establish conditions found in 2016 over a five-year decision period.
The last year of vehicle deployment in this case study is 2020, and the vehicle and charger lifetimes are 10 years. As a result, the planning horizon extends from 2016–2030. Electricity rates are flat but vary by winter and summer seasons. There is an accounting of carbon emissions from electricity generation and gasoline. All scenarios include a public charging program administration cost of $500,000 per year for the first five years.
The existing (2016) PEV fleet is comprised of about 5,000 vehicles, and the target population is about 20,000 vehicles by 2020. Only LDVs are included in the analysis, and existing vehicles and chargers are retired and replaced based on a linear schedule that produces additional ongoing costs. Home chargers are mostly Level 1 type, and public chargers are all Level 2 type. Public charging installations are driven by the purchase of vehicles at a rate of one public charger for every five vehicles. The cost of charging infrastructure decreases by 5% per year; 25% of the Charger Costs are included in the rate base.
Electricity and capacity costs reflect average values for the industry in 2016. Emissions from electricity are accounted for. Three typical distribution feeders are included in the analysis and add a small cost in all of the scenarios, as will be noted later.
Scenario Variables
There are two scenario variables: gasoline prices and Federal Tax Credit. Their values are described as follows.

4-2
Gasoline Prices
The starting gasoline price in 2016 is $1.80/gal for scenarios. Growth rates are used to raise the gasoline price to the Annual Energy Outlook 2015 for either the Reference Case scenario or the High Oil Price Case scenario by 2025. Gasoline prices for 2025 and later values grow from there according to the AEO forecasts, as shown in Table 4-1.
Table 4-1 Critical short-term benefits case study: gasoline price scenario values
Gasoline Price Value Description
AEO Reference Case
Motor gasoline is $2.95/gal in 2025, $3.20/gal in 2030, and $3.53/gal in 2035.
AEO High Oil Price Case
Motor gasoline is $4.56/gal in 2025, $5.05/gal in 2030, and $5.64/gal in 2035.
Federal Tax Credit
The Federal Tax Credit is a benefit for each vehicle purchase. While it may vary by vehicle type and other parameters, this study assumes an average value in scenarios when it is available, as shown in Table 4-2.
Table 4-2 Critical short-term benefits case study: federal tax credit scenario values
Federal Tax Credit Value Description
None No tax credit is used.
AEO High Oil Price Case
There is a $5,000 tax credit to counteract the high initial incremental vehicle cost.
Scenarios
The focus of this case study is to identify costs and benefits and then the breakeven point for introducing public infrastructure. As an example, the scenarios are combined as shown in Table 4-3 to determine the range of levels of vehicle adoption that pass all tests.
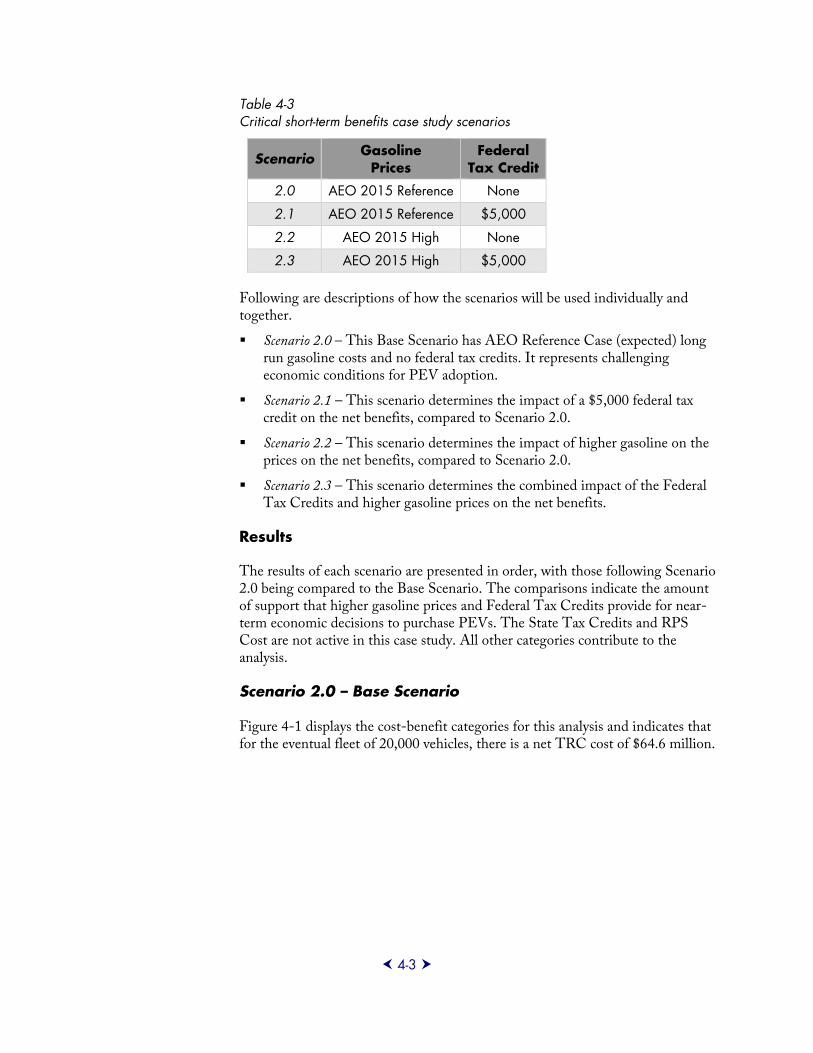
4-3
Table 4-3 Critical short-term benefits case study scenarios
Scenario Gasoline Prices
Federal Tax Credit
2.0 AEO 2015 Reference None
2.1 AEO 2015 Reference $5,000
2.2 AEO 2015 High None
2.3 AEO 2015 High $5,000
Following are descriptions of how the scenarios will be used individually and together.
Scenario 2.0 – This Base Scenario has AEO Reference Case (expected) long run gasoline costs and no federal tax credits. It represents challenging economic conditions for PEV adoption.
Scenario 2.1 – This scenario determines the impact of a $5,000 federal tax credit on the net benefits, compared to Scenario 2.0.
Scenario 2.2 – This scenario determines the impact of higher gasoline on the prices on the net benefits, compared to Scenario 2.0.
Scenario 2.3 – This scenario determines the combined impact of the Federal Tax Credits and higher gasoline prices on the net benefits.
Results
The results of each scenario are presented in order, with those following Scenario 2.0 being compared to the Base Scenario. The comparisons indicate the amount of support that higher gasoline prices and Federal Tax Credits provide for near-term economic decisions to purchase PEVs. The State Tax Credits and RPS Cost are not active in this case study. All other categories contribute to the analysis.
Scenario 2.0 – Base Scenario
Figure 4-1 displays the cost-benefit categories for this analysis and indicates that for the eventual fleet of 20,000 vehicles, there is a net TRC cost of $64.6 million.

4-4
Figure 4-1 Scenario 2.0 TRC test results (million 2016$)
The indication from the Scenario 2.0 TRC is that the benefits derive from avoided Gasoline Cost ($100.5 million) and Carbon from Gasoline ($8.3million) and are dominated by costs. The main cost categories are Incremental Vehicle Cost, Charger Costs, and Energy Costs ($163.5 million). There are smaller contributions from T&D Costs, electricity Capacity Cost, Carbon from Electricity, and administrative Program Costs, totaling $9.8 million. Table 4-4 contains the detailed component values for the TRC test.
Table 4-4 Scenario 2.0 TRC test results (million 2016$)
Cost Component Scenario 2.0
BenefitsScenario 2.0
Costs State Tax Credits $0.0 $0.0 Federal Tax Credits $0.0 $0.0 Gasoline Cost $100.5 $0.0 Carbon from Gasoline $8.3 $0.0 Incremental Vehicle Cost $0.0 $126.3 Charger Costs $0.0 $23.9 T&D Cost $0.0 $1.1 Capacity Cost $0.0 $1.4 Energy Cost $0.0 $13.4 RPS Cost $0.0 $0.0 Carbon from Electricity $0.0 $5.3 Program Costs $0.0 $2.1 Net TRC Benefit* -$64.6 –

4-5
It is important to note that Scenario 2.0 includes Charger Costs of $23.9 million to accommodate home and public charging for the additional PEVs, rising from 5,000 in 2016 to 20,000 in 2020 and for replacement of the existing charging stations.
Figure 4-2 presents a high-level cost-benefit comparison for the RIM.
Figure 4-2 Scenario 2.0 RIM test results (million 2016$)
The RIM test for Scenario 2.0 indicates that all ratepayers derive net benefits of $33.8 million because of a small portion of private investments in electric vehicles and the charging infrastructure. Table 4-5 presents detailed component values for the RIM test.
Table 4-5 Scenario 2.0 RIM test results (million 2016$)
Cost Component Scenario 2.0Benefits
Scenario 2.0 Costs
Utility Bills $62.9 $0.0 T&D Cost $0.0 $1.1 Capacity Cost $0.0 $1.4 Energy cost $0.0 $13.4 RPS Cost $0.0 $0.0 Carbon from Electricity $0.0 $5.3 RB Charger Cost $0.0 $6.0 Program Costs $0.0 $2.1 Net RIM Benefit* $33.8 –

4-6
The major cost components that subtract from the ratepayer benefits are Energy Cost ($13.4 million) for incremental wholesale energy supply, Carbon from Electricity ($5.3 million) for the incremental electrical energy, and RB Charger Cost ($6.0 million). The Net RIM Benefit is more than 50% of the total ratepayer benefits of $62.9 million. Thus, the marginal benefit from charging electric vehicles is significant to all ratepayers.
Scenario 2.1 – Federal Tax Credit
Adding a $5,000 Federal Tax Credit as a benefit to the vehicle owner is now compared to Scenario 2.0, which lacked that benefit. Figure 4-3 shows that this level is sufficient to pass the TRC. The Net TRC Benefits become $7.0 million, whereas they are -$64.6 million without the Federal Tax Credit. This indicates that the credit is a critical factor in short-term PEV investment decisions.
Figure 4-3 Scenario 2.1 TRC test results (million 2016$)
Unchanged from Scenario 2.0 are the other TRC benefits from avoided Gasoline Cost and avoided Carbon from Gasoline. Table 4-6 presents detailed component values for the TRC test and the incremental changes from Scenario 2.0. All incremental components are zero except for the full $71.6 million for Federal Tax Credits.
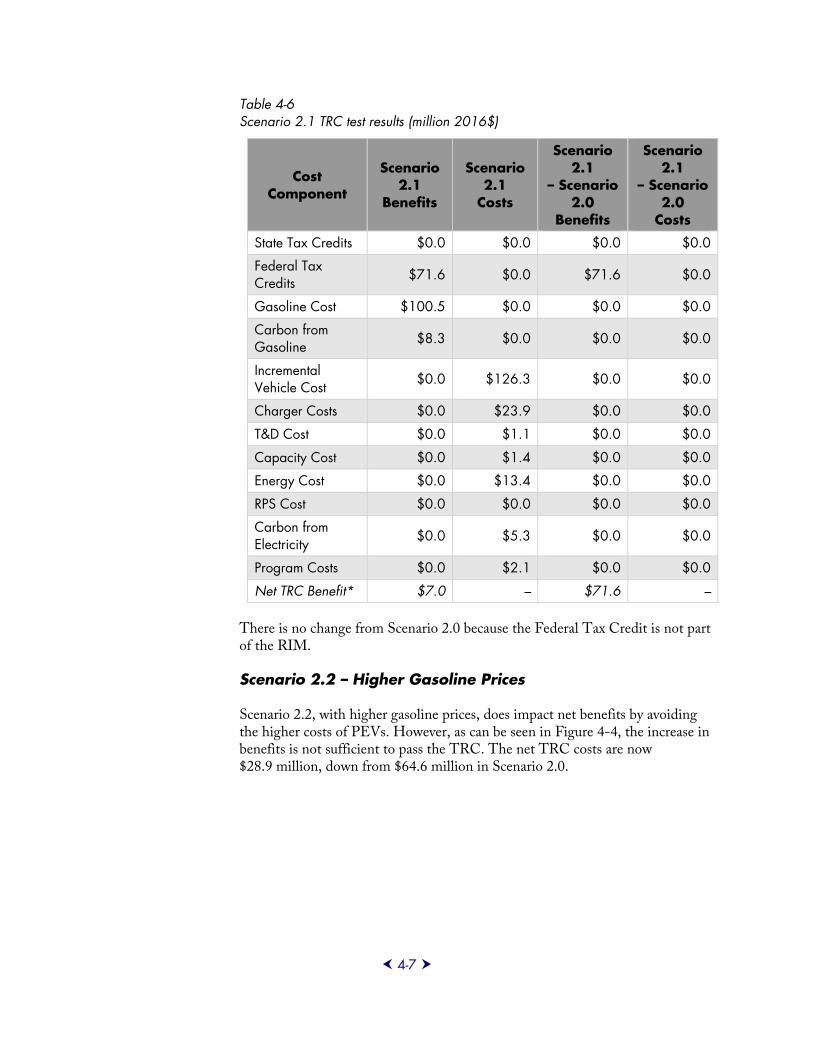
4-7
Table 4-6 Scenario 2.1 TRC test results (million 2016$)
Cost Component
Scenario 2.1
Benefits
Scenario 2.1
Costs
Scenario 2.1
– Scenario 2.0
Benefits
Scenario 2.1
– Scenario 2.0
Costs State Tax Credits $0.0 $0.0 $0.0 $0.0
Federal Tax Credits $71.6 $0.0 $71.6 $0.0
Gasoline Cost $100.5 $0.0 $0.0 $0.0
Carbon from Gasoline $8.3 $0.0 $0.0 $0.0
Incremental Vehicle Cost $0.0 $126.3 $0.0 $0.0
Charger Costs $0.0 $23.9 $0.0 $0.0
T&D Cost $0.0 $1.1 $0.0 $0.0
Capacity Cost $0.0 $1.4 $0.0 $0.0
Energy Cost $0.0 $13.4 $0.0 $0.0
RPS Cost $0.0 $0.0 $0.0 $0.0
Carbon from Electricity $0.0 $5.3 $0.0 $0.0
Program Costs $0.0 $2.1 $0.0 $0.0
Net TRC Benefit* $7.0 – $71.6 –
There is no change from Scenario 2.0 because the Federal Tax Credit is not part of the RIM.
Scenario 2.2 – Higher Gasoline Prices
Scenario 2.2, with higher gasoline prices, does impact net benefits by avoiding the higher costs of PEVs. However, as can be seen in Figure 4-4, the increase in benefits is not sufficient to pass the TRC. The net TRC costs are now $28.9 million, down from $64.6 million in Scenario 2.0.
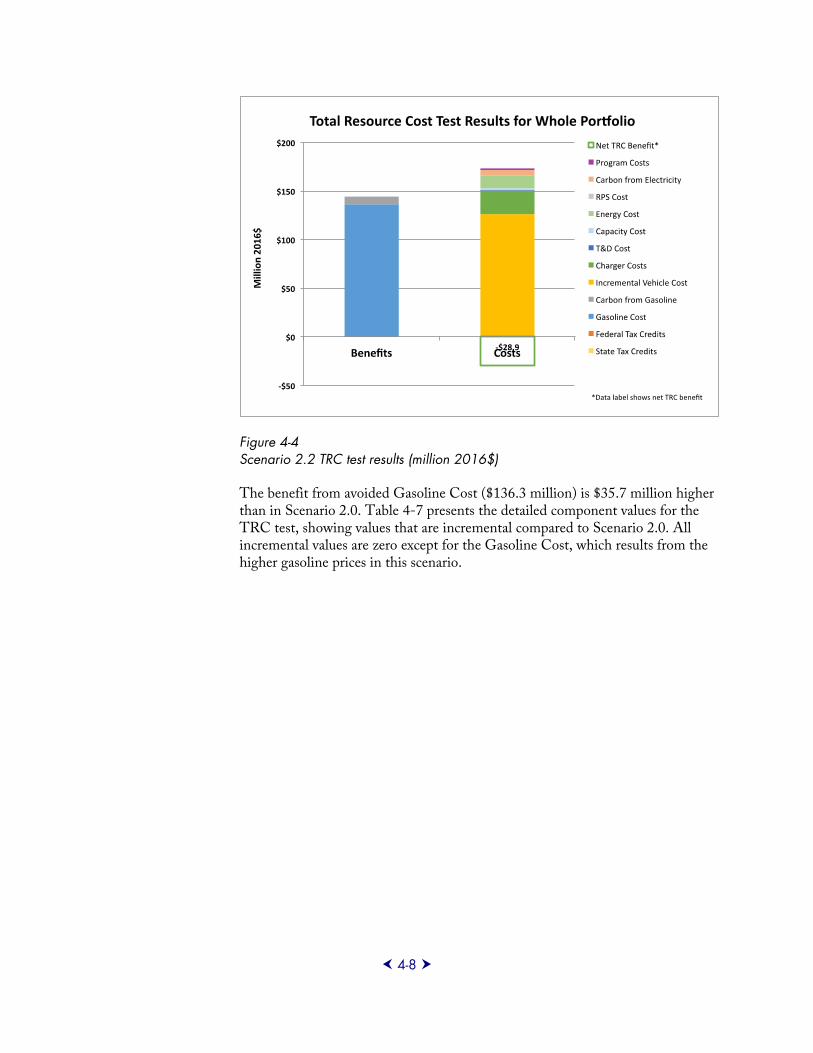
4-8
Figure 4-4 Scenario 2.2 TRC test results (million 2016$)
The benefit from avoided Gasoline Cost ($136.3 million) is $35.7 million higher than in Scenario 2.0. Table 4-7 presents the detailed component values for the TRC test, showing values that are incremental compared to Scenario 2.0. All incremental values are zero except for the Gasoline Cost, which results from the higher gasoline prices in this scenario.

4-9
Table 4-7 Scenario 2.2 TRC test results (million 2016$)
Cost Component
Scenario 2.2
Benefits
Scenario 2.2
Costs
Scenario 2.2
– Scenario 2.0
Benefits
Scenario 2.2
– Scenario 2.0
Costs State Tax Credits $0.0 $0.0 $0.0 $0.0
Federal Tax Credits $0.0 $0.0 $0.0 $0.0
Gasoline Cost $136.3 $0.0 $35.7 $0.0
Carbon from Gasoline $8.3 $0.0 $0.0 $0.0
Incremental Vehicle Cost $0.0 $126.3 $0.0 $0.0
Charger Costs $0.0 $23.9 $0.0 $0.0
T&D Cost $0.0 $1.1 $0.0 $0.0
Capacity Cost $0.0 $1.4 $0.0 $0.0
Energy Cost $0.0 $13.4 $0.0 $0.0
RPS Cost $0.0 $0.0 $0.0 $0.0
Carbon from Electricity $0.0 $5.3 $0.0 $0.0
Program Costs $0.0 $2.1 $0.0 $0.0
Net TRC Benefit* -$28.9 – $35.7 –
Avoided Gasoline Cost is not part the RIM test, so it does not change.
Scenario 2.3 – Combined Benefits
The combined impact of the federal tax credits and higher gasoline prices on the net benefits is additive. The $7.0 million Net TRC Benefit from Scenario 2.1 and the $35.7 million incremental benefit from Scenario 2.2 added together give $42.7 million, as can be seen in Figure 4-5.

4-10
Figure 4-5 Scenario 2.3 TRC test results (million 2016$)
The avoided Gasoline Cost and Federal Tax Credits add to the benefit side of the TRC and lead to total benefits of $216.1 million, which easily dominate the cost components ($173.4 million).
Table 4-8 presents detailed component values for the TRC test and values that are incremental from Scenario 2.0. It is readily apparent that the only differences are in the Federal Tax Credits and gasoline costs and that these contribute added benefits of $107.3 million to pass the TRC.
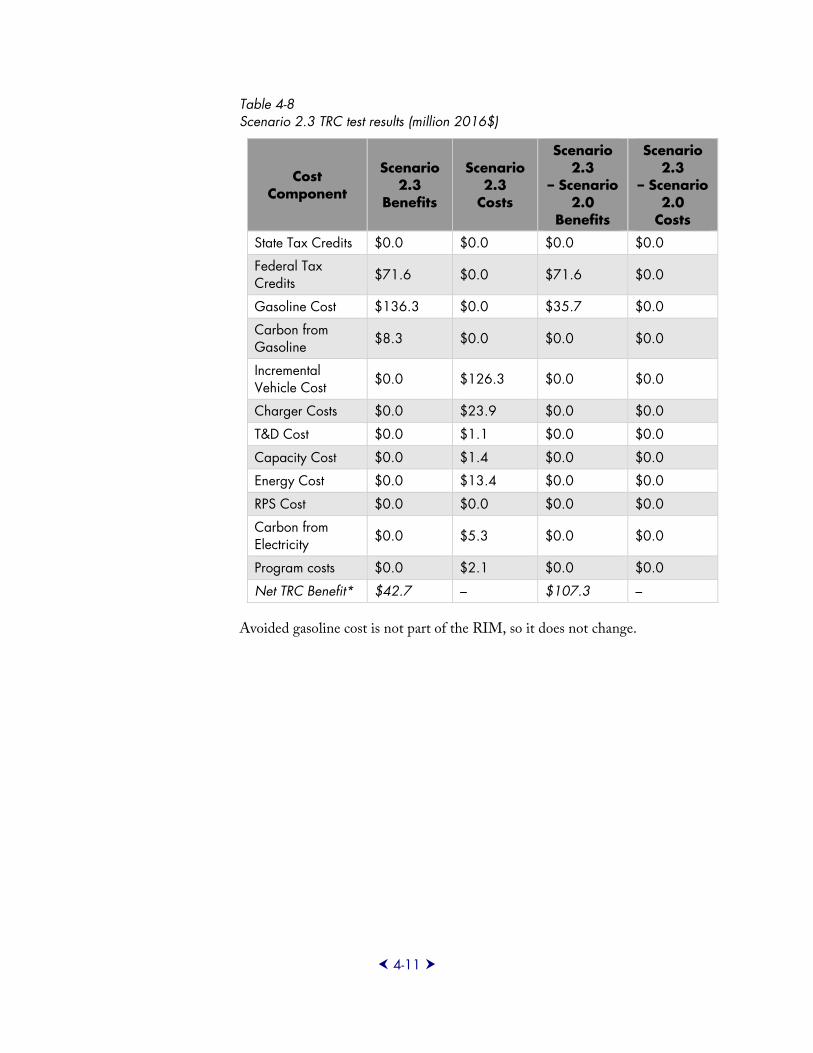
4-11
Table 4-8 Scenario 2.3 TRC test results (million 2016$)
Cost Component
Scenario 2.3
Benefits
Scenario 2.3
Costs
Scenario 2.3
– Scenario 2.0
Benefits
Scenario 2.3
– Scenario 2.0
Costs
State Tax Credits $0.0 $0.0 $0.0 $0.0
Federal Tax Credits $71.6 $0.0 $71.6 $0.0
Gasoline Cost $136.3 $0.0 $35.7 $0.0
Carbon from Gasoline $8.3 $0.0 $0.0 $0.0
Incremental Vehicle Cost $0.0 $126.3 $0.0 $0.0
Charger Costs $0.0 $23.9 $0.0 $0.0
T&D Cost $0.0 $1.1 $0.0 $0.0
Capacity Cost $0.0 $1.4 $0.0 $0.0
Energy Cost $0.0 $13.4 $0.0 $0.0
RPS Cost $0.0 $0.0 $0.0 $0.0
Carbon from Electricity $0.0 $5.3 $0.0 $0.0
Program costs $0.0 $2.1 $0.0 $0.0
Net TRC Benefit* $42.7 – $107.3 –
Avoided gasoline cost is not part of the RIM, so it does not change.

5-1
Section 5: Public Infrastructure Study This section describes the results of simulations of vehicle adoption and charger use. Chargers are used usually at home, but with the RB public charging infrastructure, added benefits can be obtained for both ratepayers and investors. The key success factor is vehicle adoption. Three scenarios have been examined for vehicle adoption, showing that the nominal forecast is close to the breakeven point for a $21.6 million public charging infrastructure program.
The period of active vehicle adoption and charging infrastructure construction is from 2016–2025. Given that these additions are assumed to have lifetimes of 10 years, the horizon extends to 2035 in order to represent retirements.
The Base Scenario assumes that there are no federal tax credits because most of the vehicle adoption is occurring after 2020, the assumed sunset year for the credit3. The gasoline costs begin relatively low at $2/gal and rise to the AEO 2015 values by 2025.
There are no added generation or transmission capacity costs because it is assumed that the added load from electric vehicle charging is managed by demand response technology to avoid these added costs. In addition, the traditional system peak is between 4:00 p.m. and 6:00 p.m., which is not coincident with peak public charging periods in the early morning and early afternoon.
Electricity energy costs are based on publicly available forecasts. Carbon costs for electricity are based on utility resource mix forecasts. Avoided future NOx and SOx benefits are not included.
The incremental vehicle cost uses a default, declining trajectory.
Scenario Variables
Three scenario variables will help evaluate changes in the following:
Vehicle adoption
Public charging deployment
3 By default, the model assumes a steeply escalating introduction rate, which pushes most benefits to later years. If introduction occurs more rapidly, the benefits will be discounted less and should pay off the fixed costs earlier.

5-2
Charging behavior
Vehicle Adoption
These values come from EPRI research and consider benefits from vehicles that are sold from 2016 through 2025. The vehicles retire over the years 2026 through 2035 because they are assumed to have a 10-year lifetime. Figure 5-1 shows low, medium, and high adoption values for the scenario.
Table 5-1 Public infrastructure case study: vehicle adoption scenario values
Value Description
Low 5,559 vehicles in 2025
Medium 29,733 vehicles in 2025
High 73,533 vehicles in 2025
Public Charging Deployment
The analysis assumes three potential levels for charging deployment, as shown in Table 5-2. These levels represent no investment, a fixed investment of $21.6 million, and a sensitivity case that assumes that investments costs are 50% higher than expected.
Table 5-2 Public infrastructure case study: public charging deployment scenario values
Value Description
None No public charging infrastructure is added. No cost for commercial charging stations.
Nominal This includes 1,000 L2 dual-head charging stations at a cost of $20M and 15 direct current fast charging stations at a cost of $1.6M—total $21.6 million.
High cost This includes 1,000 L2 dual-head charging stations at a cost of $30M and 15 direct current fast charging stations at a cost of $2.4M.
This analysis includes an estimated $250k/year O&M cost for the program. The NPV of this cost for 10 years is $2.0 million, based on 3% escalation and 6.34% discount. This is about 10% of the capital costs and likely increases the breakeven vehicle adoption by a similar amount.
Charging Behavior
The analysis includes two scenarios for charging use, as shown in Table 5-3. The first assumes charging at home only, and the second assumes that the infrastructure that has been constructed is in use.

5-3
Table 5-3 Public infrastructure case study: charging behavior scenario values
Value Description
None Little to no new public charging is installed. Everyone is assumed to charge at home.
Some public charging
The utility installs public charging equipment used by PEV owners, which may incentivize vehicle sales.
Scenarios
The focus of the case study is to identify costs and benefits and then the breakeven point for introducing a public infrastructure. Table 5-4 describes all of the scenarios in terms of the scenario definitions for vehicle adoption, public charging deployment, and charging behavior.
Table 5-4 Scenario definitions
Scenario Vehicle AdoptionPublic
Charging Deployment
Charging Behavior
3.0 Low None None
3.1 Low Nominal Some public charging
3.2 Medium Nominal Some public charging
3.3 High Nominal Some public charging
3.4 Low High cost Some public charging
3.5 Medium High cost Some public charging
3.6 High High cost Some public charging
Following are descriptions of how the scenarios will be used individually and together:
Scenario 3.0 – Base Scenario having no new public infrastructure, which is to be used for cost comparisons
Scenario 3.2 – Introduction of public infrastructure with nominal cost and nominal sales
Scenario 3.5 – Introduction of public infrastructure with high cost and nominal sales
Scenarios 3.1 and 3.3 – Used to determine the breakeven point of benefits to cover costs of public infrastructure having nominal cost by varying vehicle sales with a low-cost public charging infrastructure

5-4
Scenarios 3.4 and 3.6 – Used to determine the breakeven point of benefits to cover costs of public infrastructure having high cost by varying vehicle sales with a high-cost public charging infrastructure
Results
In the subsections below, Base Scenario (Scenario 3.0) results are presented first. Scenario 3.2 and Scenario 3.5 are presented as variations on Scenario 3.0 adding a public charging infrastructure. Scenario 3.2 results show the effects of increased infrastructure investment and increased sales, and Scenario 3.5 shows the effects on Scenario 3.2 results if infrastructure installation costs are higher than expected (by 50% in this scenario).
Finally, four additional sensitivity scenarios are presented. Scenario 3.1 shows the effects of investing in infrastructure but achieving no additional sales, and Scenario 3.3 shows the beneficial support of vehicle adoptions that exceed those in Scenario 3.2 for these same investments.
Scenarios 3.4 and 3.6 show how many additional PEV sales would be required to overcome additional costs if costs are 50% higher than expected.
It is important to note that all dollar figures will be reported in millions of 2016 dollars (million 2016$).
Scenario 3.0 – Base Scenario
The Base Scenario results represent the value of the installed base and a low forecast for vehicle adoption. These base results establish a point of comparison for assessing the impacts of introducing a public charging infrastructure. The following figures present the results of the Base Scenario and indicate significant nominal benefits in the given area. The TRC reveals that net benefits total $4.4 million from the nominal increase from 1,596 PEVs in 2016 to 5,559 PEVs in 2025. This increase is due to “organic” sales unrelated to the proposed infrastructure program.
As shown in Figure 5-1, the Net TRC Benefit is $4.4 million, deriving mainly from avoided Gasoline Cost ($17.2 million) and Carbon from Gasoline ($1.4 million), despite significant Energy Cost, Charger Costs, Incremental Vehicle Cost, and Carbon from Electricity ($14.3 million). It is important to note that the Federal Tax Credit is zero in all scenarios because most vehicles are being purchased in the latter part of the horizon.
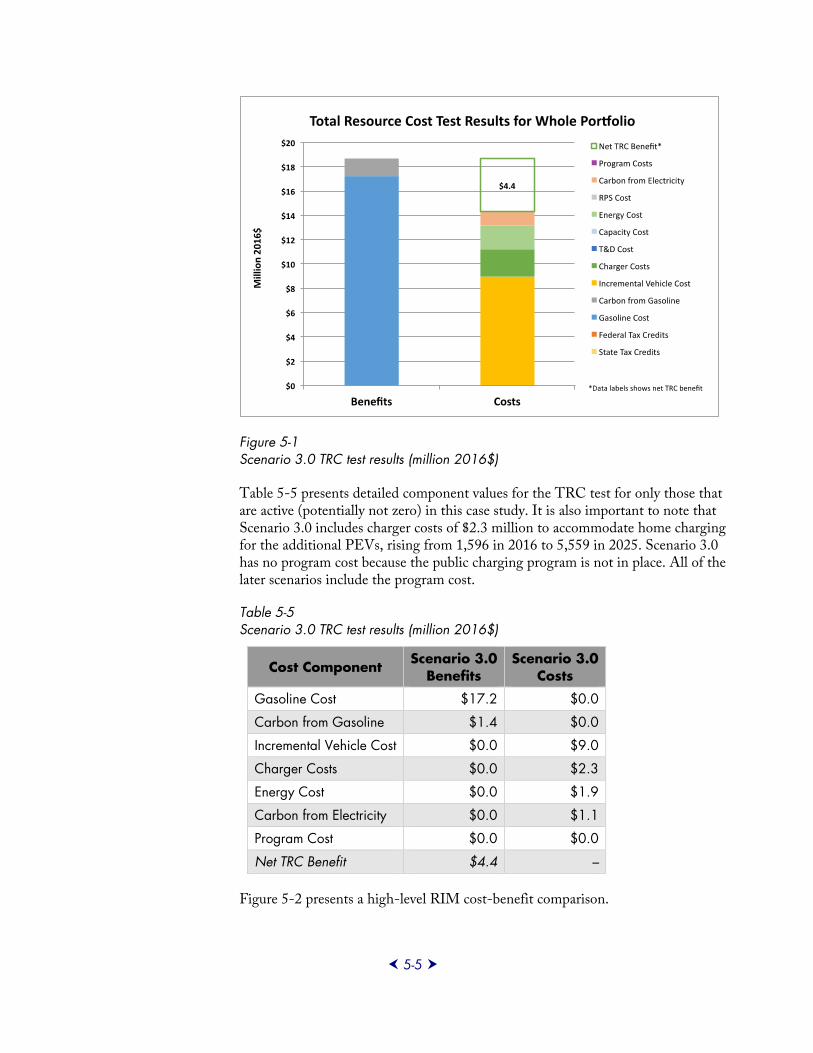
5-5
Figure 5-1 Scenario 3.0 TRC test results (million 2016$)
Table 5-5 presents detailed component values for the TRC test for only those that are active (potentially not zero) in this case study. It is also important to note that Scenario 3.0 includes charger costs of $2.3 million to accommodate home charging for the additional PEVs, rising from 1,596 in 2016 to 5,559 in 2025. Scenario 3.0 has no program cost because the public charging program is not in place. All of the later scenarios include the program cost.
Table 5-5 Scenario 3.0 TRC test results (million 2016$)
Cost Component Scenario 3.0Benefits
Scenario 3.0 Costs
Gasoline Cost $17.2 $0.0
Carbon from Gasoline $1.4 $0.0
Incremental Vehicle Cost $0.0 $9.0
Charger Costs $0.0 $2.3
Energy Cost $0.0 $1.9
Carbon from Electricity $0.0 $1.1
Program Cost $0.0 $0.0
Net TRC Benefit $4.4 –
Figure 5-2 presents a high-level RIM cost-benefit comparison.

5-6
Figure 5-2 Scenario 3.0 RIM test results (million 2016$)
The RIM test for Scenario 3.0 indicates that all ratepayers derive net benefits of $4.0 million because of a small portion investing privately in electric vehicles and charging infrastructure.
Table 5-6 presents detailed component values for RIM test.
Table 5-6 Scenario 3.0 RIM test results (million 2016$)
Cost Component Scenario 3.0Benefits
Scenario 3.0 Costs
Utility Bills $7.1 $0.0
Energy Cost $0.0 $1.9
Carbon from Electricity $0.0 $1.1
RB Charger Cost $0.0 $0.0
Program Cost $0.0 $0.0
Net RIM Benefit* $4.0 –
The major cost components that subtract from the ratepayer benefits are Energy Cost ($1.9 million) for incremental wholesale energy supply and Carbon from Electricity ($1.1 million).

5-7
the infrastructure is accounted separately from that of maintaining the program over the 10-year horizon—a $2.0 million program cost.
The following will show the absolute costs and benefits of this scenario as well as the incremental changes that this impact has when compared to Scenario 3.0. In Figure 5-3, the TRC has risen to $9.4 million from Scenario 3.0 due to the addition of the public infrastructure.
Figure 5-3 Scenario 3.2 TRC test results (million 2016$)
Scenario 3.2 – Nominal Public Infrastructure Cost
This scenario introduces to Scenario 3.0 a $21.6 million public charging infrastructure project that is supported 100% by the rate base. The cost of installing

5-8
Table 5-7 presents detailed component values for the TRC test.
Table 5-7 Scenario 3.2 TRC test results (million 2016$)
Cost Component
Scenario 3.2
Benefits
Scenario 3.2
Costs
Scenario 3.0
– Scenario 3.2
Benefits
Scenario 3.0
– Scenario 3.2
Costs Gasoline Cost $121.8 $0.0 $104.6 $0.0
Carbon from Gasoline $10.0 $0.0 $8.6 $0.0
Incremental Vehicle Cost $0.0 $62.1 $0.0 $53.1
Charger Costs $0.0 $36.7 $0.0 $34.4
Energy Cost $0.0 $13.6 $0.0 $11.7
Carbon from Electricity $0.0 $8.0 $0.0 $6.9
Program Cost $0.0 $2.0 $0.0 $2.0
Net TRC Benefit $9.4 – $5.0 –
The indication is that an additional $5.0 million in net benefits—derived mainly from avoided Gasoline Cost and Carbon from Gasoline (up $113.2 million)—are added to the Net TRC Benefit despite significant changes in Incremental Vehicle Cost, Charger Costs, Energy Costs, and Carbon from Electricity ($106.1 million), plus the $2.0 million Program Cost.
It is important to note that incremental Charger Costs total $34.4 million. The additional cost of Carbon from Electricity ($6.9 million) is around half of the incremental wholesale energy cost ($11.7) and is exceeded by the change in benefits from avoided Carbon from Gasoline ($8.6 million). Figure 5-4 provides a high-level RIM cost-benefit comparison.
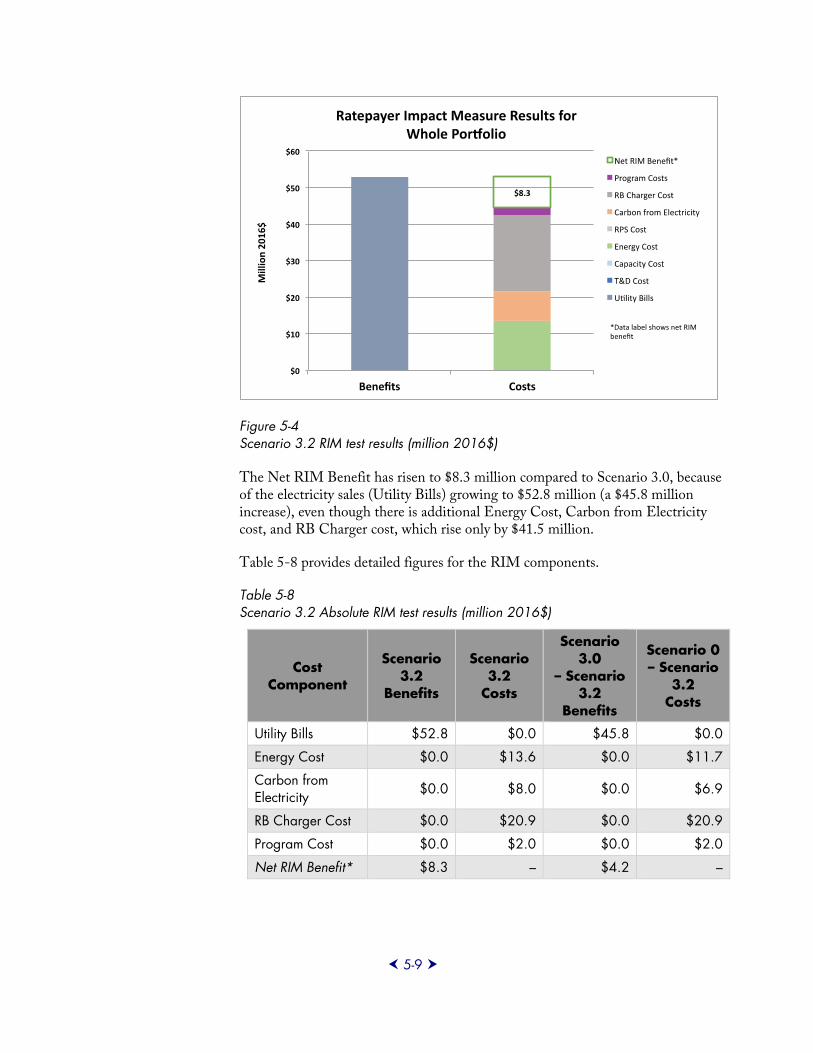
5-9
Figure 5-4 Scenario 3.2 RIM test results (million 2016$)
The Net RIM Benefit has risen to $8.3 million compared to Scenario 3.0, because of the electricity sales (Utility Bills) growing to $52.8 million (a $45.8 million increase), even though there is additional Energy Cost, Carbon from Electricity cost, and RB Charger cost, which rise only by $41.5 million.
Table 5-8 provides detailed figures for the RIM components.
Table 5-8 Scenario 3.2 Absolute RIM test results (million 2016$)
Cost Component
Scenario 3.2
Benefits
Scenario 3.2
Costs
Scenario 3.0
– Scenario 3.2
Benefits
Scenario 0 – Scenario
3.2 Costs
Utility Bills $52.8 $0.0 $45.8 $0.0
Energy Cost $0.0 $13.6 $0.0 $11.7
Carbon from Electricity $0.0 $8.0 $0.0 $6.9
RB Charger Cost $0.0 $20.9 $0.0 $20.9
Program Cost $0.0 $2.0 $0.0 $2.0
Net RIM Benefit* $8.3 – $4.2 –

5-10
The incremental RIM test results indicate that all ratepayers derive significant absolute benefits ($8.3 million) from the new public charging infrastructure, and that those benefits have increased by $4.3 million with respect to Scenario 3.0.
The target cost of the nominal case is $21.6 million, and this model, having rough control over actual costs, results in rate-based charger cost of $20.9 million, which is within 3% of the target cost. The program cost of $2.0 million is added separately to the rate base.
Scenario 3.5 – High Public Infrastructure Cost
This scenario introduces to Scenario 3.0 a $32.4 million public charging infrastructure project supported 100% by the rate base. While this scenario assumes the same number of chargers and additional vehicles as Scenario 3.2, it also assumes that public infrastructure costs are 50% higher than the $21.6 million currently planned. Figure 5-6 shows absolute results and Table 5-9 shows both absolute results and the incremental changes that this impact has when compared to Scenario 3.0.
Figure 5-5 Scenario 3.5 TRC test results (million 2016$)

5-11
Figure 5-6 presents detailed component values for the TRC test.
Table 5-9 Scenario 3.5 TRC test results (million 2016$)
Cost Component
Scenario 3.5
Benefits
Scenario 3.5
Costs
Scenario 3.0
– Scenario 3.5
Benefits
Scenario 3.0
– Scenario 3.5
Costs Gasoline Cost $121.8 $0.0 $104.6 $0.0
Carbon from Gasoline $10.0 $0.0 $8.6 $0.0
Incremental Vehicle Cost $0.0 $62.1 $0.0 $53.1
Charger Costs $0.0 $47.2 $0.0 $44.9
Energy Cost $0.0 $13.6 $0.0 $11.7
Carbon from Electricity $0.0 $8.0 $0.0 $6.9
Program Cost $0.0 $2.0 $0.0 $2.0
Net TRC Benefit -$1.0 – -$5.4 –
It is important to note that there are $53.1 million in incremental charger costs over Scenario 3.0, when both home chargers and public infrastructure costs are included.
The indication is that the Net TRC Benefit is slightly negative (-$1.0 million), and there is an incremental net TRC cost of $5.4 million, when compared to Scenario 3.0. The major components of the incremental net benefits are avoided Gasoline Cost and Carbon from Electricity ($131.8 million), which is not enough to overcome the significant total costs ($132.9 million).
The main observations about the TRC analysis from this scenario include the following:
High infrastructure cost has positive Net TRC Benefits for the nominal vehicle adoption forecast, but there is an incremental cost when compared to Scenario 3.0.
The vehicle adoption target for Scenario 5 is close to the level needed to pass the TRC test.
Figure 5-6 shows a high-level cost-benefit comparison for the RIM test.

5-12
Figure 5-6 Scenario 3.5 RIM test results (million 2016$)
Table 5-10 presents detailed figures for the RIM components.
Table 5-10 Scenario 3.5 RIM test results (million 2016$)
Cost Component
Scenario 3.5
Benefits
Scenario 3.5
Costs
Scenario 3.0
– Scenario 3.5
Benefits
Scenario 0 – Scenario
3.5 Costs
Utility Bills $52.8 $0.0 $45.8 $0.0
Energy Cost $0.0 $13.6 $0.0 $11.7
Carbon from Electricity $0.0 $8.0 $0.0 $6.9
RB Charger Cost $0.0 $31.4 $0.0 $31.4
Program Cost $0.0 $2.0 $0.0 $2.0
Net RIM Benefit* -$2.1 – -$6.2 –
The Net RIM Benefit results indicate that all ratepayers derive marginal costs ($2.1 million) from the new public charging infrastructure, and there is an incremental net RIM cost of $6.2 million when compared to Scenario 3.0.
The target cost of the high infrastructure cost case is $32.4 million, and this model, having rough control over actual costs, results in a rate-based charger cost of $31.4 million, which is within 3% of the target cost. The program cost of $2.0 million is added separately to the rate base.

5-13
The primary observations about the RIM analysis from this scenario include the following:
High infrastructure cost is detrimental to the nominal forecast for Net RIM Benefits.
The vehicle adoption target for Scenario 3.5 is close to level needed to support the RIM.
Scenario 3.1 – Nominal Infrastructure Cost, Low Vehicle Adoption
Because Scenario 3.2 passes all tests, Scenario 3.1, with low vehicle penetration, is necessary for determining the crossover point of the amount of vehicle adoption that can support the new public infrastructure. Table 5-7 shows a high-level TRC cost-benefit comparison.
Figure 5-7 Scenario 3.1 TRC test results (million 2016$)
Table 5-11 presents detailed component values for the TRC test. The changes between Scenario 3.0 and 3.1 are increased cost of the public infrastructure and the program cost, and this shows up as a $23.3 million dollar difference in costs.

5-14
Table 5-11 Scenario 3.1 TRC test results (million 2016$)
Cost Component
Scenario 3.1
Benefits
Scenario 3.1
Costs
Scenario 3.0
– Scenario 3.1
Benefits
Scenario 3.0
– Scenario 3.1
Costs Gasoline Cost $17.2 $0.0 $0.0 $0.0Carbon from Gasoline
$1.4 $0.0 $0.0 $0.0
Incremental Vehicle Cost
$0.0 $9.0 $0.0 $0.0
Charger Costs $0.0 $23.5 $0.0 $21.3Energy Cost $0.0 $1.9 $0.0 $0.0Carbon from Electricity
$0.0 $1.1 $0.0 $0.0
Program Cost $0.0 $2.0 $0.0 $2.0Net TRC Benefit -$18.9 – -$23.3 –
The target cost of the nominal infrastructure scenario is $21.6 million, and this model, having rough control over actual costs, results in rate-based charger cost of $21.3 million, which is within 2% of the target.
Figure 5-8 shows a high-level RIM cost-benefit comparison, and indicates that low vehicle adoption is detrimental to recovering the infrastructure and program costs.
Figure 5-8 Scenario 3.1 RIM test results (million 2016$)

5-15
Table 5-12 presents detailed component values for the RIM test. It also shows that the primary difference from Scenario 3.0 is in RB Charger Cost and Program Cost.
Table 5-12 Scenario 3.1 RIM test results (million 2016$)
Cost Component
Scenario 3.1
Benefits
Scenario 3.1
Costs
Scenario 3.0
– Scenario 3.1
Benefits
Scenario 0 – Scenario
3.1 Costs
Utility Bills $7.5 $0.0 $0.4 $0.0Energy Cost $0.0 $1.9 $0.0 $0.0Carbon from Electricity $0.0 $1.1 $0.0 $0.0
RB Charger Cost $0.0 $21.3 $0.0 $21.3Program Cost $0.0 $2.0 $0.0 $2.0Net RIM Benefit* -$18.9 – -$22.9 –
Scenario 3.3 – Nominal Infrastructure Cost, High Vehicle Adoption
Because Scenario 3.2 passes all tests, Scenario 3.3 with high vehicle penetration, is not necessary for determining the crossover point. Scenario 3.3, as shown in Figure 5-9, is included to show how the value of the public charging infrastructure changes as even more vehicles are adopted over Scenario 3.0.
Figure 5-9 Scenario 3.3 TRC test results (million 2016$)

5-16
Table 5-13 presents detailed component values for the TRC test.
Table 5-13 Scenario 3.3 TRC test results (million 2016$)
Cost Component
Scenario 3.3
Benefits
Scenario 3.3
Costs
Scenario 3.0
– Scenario 3.3
Benefits
Scenario 3.0
– Scenario 3.3
Costs Gasoline Cost $310.8 $0.0 $293.6 $0.0
Carbon from Gasoline $25.6 $0.0 $24.2 $0.0
Incremental Vehicle Cost $0.0 $157.4 $0.0 $148.4
Charger Costs $0.0 $60.9 $0.0 $58.6
Energy Cost $0.0 $34.7 $0.0 $32.8
Carbon from Electricity $0.0 $20.4 $0.0 $19.3
Program Cost $0.0 $2.0 $0.0 $2.0
Net TRC Benefit $61.0 – $56.6 –
The additional public charging infrastructure shows up as an additional $58.6 million over Scenario 3.0, which is more than the expected program cost of $21.6 million because the high vehicle adoption also leads to greater need for home charging. The additional vehicles also result in increases in the Incremental Vehicle Cost ($148.4 million), Energy Cost ($32.8 million), and Carbon from Electricity ($19.3 million).
Figure 5-10 presents a high-level RIM cost-benefit comparison.

5-17
Figure 5-10 Scenario 3.3 RIM test results (million 2016$)
Table 5-14 presents detailed figures for the RIM components.
Table 5-14 Scenario 3.3 RIM test results (million 2016$)
Cost Component
Scenario 3.3
Benefits
Scenario 3.3
Costs
Scenario 3.0
– Scenario 3.3
Benefits
Scenario 0 – Scenario
3.3 Costs
Utility Bills $134.7 $0.0 $127.6 $0.0
Energy Cost $0.0 $34.7 $0.0 $32.8
Carbon from Electricity $0.0 $20.4 $0.0 $19.3
RB Charger Cost $0.0 $20.8 $0.0 $20.8
Program Cost $0.0 $2.0 $0.0 $2.0
Net RIM Benefit* $56.7 – $52.7 –
Table 5-14 shows not only increases in costs but also increases in sales that represent higher utility bills as ratepayer benefits ($134.7 million), which is $127.6 million higher than in Scenario 3.0.

5-18
Scenario 3.4 – High Infrastructure Cost, Low Vehicle Adoption
Since Scenario 3.5 results barely change the TRC and RIM tests, it is necessary to investigate Scenario 3.4, which has lower vehicle adoption. This investigation, shown in Figure 5-11, will help to determine the marginal effect of lower vehicle adoption.
Figure 5-11 Scenario 3.4 TRC test results (million 2016$)

5-19
Table 5-15 presents detailed component values for the TRC test.
Table 5-15 Scenario 3.4 TRC test results (million 2016$)
Cost Component
Scenario 3.4
Benefits
Scenario 3.4
Costs
Scenario 3.0
– Scenario 3.4
Benefits
Scenario 3.0
– Scenario 3.4
Costs Gasoline Cost $17.2 $0.0 $0.0 $0.0
Carbon from Gasoline $1.4 $0.0 $0.0 $0.0
Incremental Vehicle Cost $0.0 $9.0 $0.0 $0.0
Charger Costs $0.0 $34.1 $0.0 $31.9
Energy Cost $0.0 $1.9 $0.0 $0.0
Carbon from Electricity $0.0 $1.1 $0.0 $0.0
Program Cost $0.0 $2.0 $0.0 $2.0
Net TRC Benefit -$29.6 – -$33.9 –
The only change between Scenario 3.0 and Scenario 3.1 is regarding an increased cost of the public infrastructure, which shows up as a $31.9 million dollar difference in charger costs and a $2.0 million difference in program cost.
The main observation about the TRC analysis from this scenario is:
Low vehicle adoption is detrimental to high charger costs, with a TRC loss of $29.6 million.
Figure 5-12 presents a high-level RIM cost-benefit comparison.

5-20
Figure 5-12 Scenario 3.4 RIM test results (million 2016$)
Table 5-16 presents detailed component values for the RIM test.
Table 5-16 Scenario 3.4 RIM test results (million 2016$)
Cost Component
Scenario 3.4
Benefits
Scenario 3.4
Costs
Scenario 3.0
– Scenario 3.4
Benefits
Scenario 0 – Scenario
3.4 Costs
Utility Bills $7.5 $0.0 $0.4 $0.0
Energy Cost $0.0 $1.9 $0.0 $0.0
Carbon from Electricity $0.0 $1.1 $0.0 $0.0
RB Charger Cost $0.0 $31.9 $0.0 $31.9
Program Cost $0.0 $2.0 $0.0 $2.0
Net RIM Benefit* -$29.5 – -$33.5 –
The Net RIM Benefit value for Scenario 3.4 is -$29.5 million, which is $33.5 million lower than Scenario 3.0. The RB Charger Cost is $31.9 million, the Program Cost is $2.0 million, and there is little extra benefit to ratepayers ($0.4 million) when compared to Scenario 3.0.

5-21
The main observation about the RIM analysis from this scenario is:
Low vehicle adoption is detrimental to high charger costs, with a RIM loss of $29.5 million.
Scenario 3.6 – High Infrastructure Cost, High Vehicle Adoption
Scenario 3.6 has higher infrastructure cost, like Scenario 3.5, but it also has higher vehicle adoption to support that cost. In fact, Scenario 3.6, as shown in Figure 5-13 and Figure 5-14, passes the TRC and RIM tests and can serve a part in estimating the marginal effect of increased vehicle adoption.
Figure 5-13 Scenario 3.6 TRC test results (million 2016$)

5-22
Table 5-17 presents detailed component values for the TRC test.
Table 5-17 Scenario 3.6 TRC test results (million 2016$)
Cost Component
Scenario 3.6
Benefits
Scenario 3.6
Costs
Scenario 3.0
– Scenario 3.6
Benefits
Scenario 3.0
– Scenario 3.6
Costs Gasoline Cost $310.8 $0.0 $293.6 $0.0
Carbon from Gasoline $25.6 $0.0 $24.2 $0.0
Incremental Vehicle Cost $0.0 $157.4 $0.0 $148.4
Charger Costs $0.0 $71.3 $0.0 $69.0
Energy Cost $0.0 $34.7 $0.0 $32.8
Carbon from Electricity $0.0 $20.4 $0.0 $19.3
Program Cost $0.0 $2.0 $0.0 $2.0
Net TRC Benefit $50.6 – $46.2 –
The changes in inputs between Scenarios 3.0 and 3.6 are in regard to the increased cost of the public charging infrastructure. These extra Charger Costs are $69.0 million more than those in Scenario 3.0 because the additional vehicle adoption also leads to greater need for home charging. The increases in the Incremental Vehicle Cost ($148.4 million), Energy Cost ($32.8 million), and Carbon from Electricity ($19.3 million) are also from the extra vehicles.
The main observation about the TRC analysis from this scenario is:
High vehicle adoption is beneficial to high charger costs, with a TRC gain of $52.7 million over Scenario 3.0.
Figure 5-14 presents a high-level RIM cost-benefit comparison.

5-23
Figure 5-14 Scenario 3.6 RIM test results (million 2016$)
Table 5-18 presents detailed figures for the RIM components.
Table 5-18 Scenario 3.6 Absolute RIM test results (million 2016$)
Cost Component
Scenario 3.6
Benefits
Scenario 3.6
Costs
Scenario 3.0
– Scenario 3.6
Benefits
Scenario 3.0
– Scenario 3.6
Costs Utility Bills $134.7 $0.0 $127.6 $0.0
Energy Cost $0.0 $34.7 $0.0 $28.9
Carbon from Electricity $0.0 $20.4 $0.0 $19.3
RB Charger Cost $0.0 $31.2 $0.0 $31.2
Program Cost $0.0 $2.0 $0.0 $2.0
Net RIM Benefit* $46.3 – $42.3 –
As seen in Table 5-18, the RIM test reveals not only increases in costs but also increases in sales that represent higher Utility Bills as ratepayer benefits (Utility Bills = $134.7 million), which are $127.6 million higher than in Scenario 3.0.
High vehicle adoption is beneficial to high charger costs, with a RIM benefit of $46.3 million, $42.3 million more than in Scenario 3.0.
5-24
Discussion
This section collects and explains the main conclusions from the individual scenarios. The format is a repetition of an earlier point, followed by an explanation of its implications.
With nominal infrastructure costs and nominal vehicle adoption, both TRC and RIM tests show that PEV deployment is beneficial. The TRC shows a net benefit of $9.4M, and the RIM test shows a net benefit of $8.3M, both relative to Scenario 3.0.
With high infrastructure costs, there are positive net TRC benefits for the nominal vehicle adoption forecast, but there is an incremental cost when compared to Scenario 3.0.
The increase in public infrastructure cost is evident in the TRC and RIM tests. The Net TRC Benefits are positive overall, but the extra $10.8 million cost for the High Infrastructure Cost indicates that Scenario 3.5 is marginal and that more vehicle adoption is needed for strongly positive results.
The vehicle adoption target for Scenario 3.5 is close to the level needed to support the TRC and RIM tests.
The vehicle adoption target for the nominal forecast is 29,733 total vehicles in 2025. This level is very close to that needed to support the $21.6 million in new public infrastructure.
The low vehicle adoption seen in Scenario 3.1 and 3.4 is detrimental to the public charging project.
It is expected that vehicle adoption is a key success factor. The low vehicle adoption rate of 5,559 total vehicles in 2025 is not sufficient to support the public charging program.
High vehicle adoption is beneficial to high charger costs, as seen in Scenario 3.6, with a TRC gain of $46.2 million over Scenario 3.0, and a net RIM benefit of $46.3 million, $42.3 million more than Scenario 3.0.
The high vehicle adoption scenario is sufficient to support a wide range of public charging infrastructure costs.

6-1
Section 6: Conclusions EPRI analyzed the effects of investments in public charging infrastructure on electric vehicle drivers and utility customers as a whole, relying on the TRC and RIM results. This analysis simulated vehicle adoption and charging station use. Charging stations are used nominally at home, but with rate-based public charging infrastructure, added benefits can be obtained for both electric vehicle drivers and utility customers. Vehicle adoption is the key success factor. Specifically detailed in this report are a total of 22 scenarios encompassing a Sensitivity Analysis, Critical Short-Term Benefits, and Public Infrastructure case studies.
Sensitivity Analysis Case Study Summary – Scenarios 1.0–1.10
This Sensitivity Analysis case study addressed three major areas—vehicle adoption, charging behavior, and gasoline price—to arrive at several major points. The Sensitivity Analysis Case Study focused strongly on the impacts of vehicle adoption relative to charging behavior and on the impact of gasoline prices. In fact, the most important inputs proved to be the Federal Tax Credits, Gasoline Prices, Energy Prices, Charger Costs, and Incremental Vehicle Costs. Less important were Carbon from Gasoline and Electricity Cost, Capacity Cost, and T&D Cost because the current infrastructure can handle most of the load needed to support electric transportation. Table 6-1 has a complete list of the TRC and RIM test results.

6-2
Table 6-1 Scenarios 1.0–1.10 summary of net TRC and RIM benefits (million 2016$)
Scenario Vehicle Adoption
ChargingBehavior
Gasoline Price
TRC Benefits
RIM Benefits
1.0 Medium (48,184) Equal Medium -$1.6 $54.2
1.1 Low (7,995) Equal Medium -$1.2 $14.2
1.2 High
(111,872) Equal Medium -$6.5 $112.6
1.3 Low (7,995) More home Medium $2.1 $13.6
1.4 High
(111,872) More home Medium $25.4 $107.7
1.5 Low (7,995) More public Medium -$4.6 $14.9
1.6 High
(111,872) More public Medium -$38.5 $117.5
1.7 Medium (48,184)
More home Medium $13.6 $52.1
1.8 Medium (48,184)
More public Medium -$16.3 $56.7
1.9 Medium (48,184) Equal Low -$30.4 $54.2
1.10 Medium (48,184) Equal High $159.1 $54.2
Particularly positive is the fact that all scenarios passed the RIM test, with net RIM benefits greater than the total RIM costs. However, the relation between vehicle adoption and the net TRC benefit is complicated by exponential growth, net present cost (NPC) discounting, and the longevity of the Federal Tax Credits. The Base Scenario (1.0) was very close to the breakeven point. Home charging dramatically reduced the cost of the charging infrastructure and thus allowed the Base Scenario to pass the TRC. Gasoline played a key role in the breakeven scenario, with avoided Gasoline Costs having the highest impact on the Net TRC Benefit.

6-3
Effect of Charging Behavior
Table 6-2 lists the sensitivity of net TRC and RIM benefits to charging behavior, relative to Scenario 1.0.
Table 6-2 Scenarios 1.7, 1.0, and 1.8 summary of net TRC and RIM benefits (million 2016$)
Scenario Vehicle Adoption
ChargingBehavior
Gasoline Price
TRC Benefits
RIM Benefits
1.7 Medium (48,184)
More home Medium $13.6 $52.1
1.0 Medium (48,184) Equal Medium -$1.6 $54.2
1.8 Medium (48,184)
More public Medium -$16.3 $56.7
It shows that more home charging has a positive effect on the TRC test, with the value changing by $12.0 million while the percentage of home charging changes from 50% to 80%. The RIM benefits are much less sensitive, and they change in the opposite direction (-$2.1 million). Public charging infrastructure is more expensive to install, which decreases the TRC benefits, but it has requires less T&D costs, which increases the RIM benefits.
The marginal TRC benefit is $400,000 for each additional percentage portion of home charging, which places its breakeven point at close to 54% home charging.
Table 6-3 lists the sensitivity of net TRC and RIM benefits to vehicle adoption, relative to Scenario 1.0, with equal amounts of public and home charging.
Table 6-3 Scenarios 1.1, 1.0, and 1.2 summary of net TRC and RIM benefits (million 2016$)
Scenario Vehicle Adoption
ChargingBehavior
Gasoline Price
TRC Benefits
RIM Benefits
1.1 Low (7,995) Equal Medium -$1.2 $14.2
1.0 Medium (48,184) Equal Medium -$1.6 $54.2
1.2 High
(111,872) Equal Medium -$6.5 $112.6
It shows that both the TRC benefits decrease monotonically and the RIM benefits increase monotonically with increasing vehicle adoption. As mentioned above, the installation of public charging at a portion of 50% does not pass the TRC test in Scenario 1.0, and the model’s reaction to scaling vehicle adoption is

6-4
to scale the charging infrastructure. This does nothing to improve the TRC benefits, but it does improve the RIM benefits.
Table 6-4 lists the sensitivity of net TRC and RIM benefits to vehicle adoption relative to Scenario 1.7, with more home charging behavior, relative to Scenario 1.0.
Table 6-4 Scenarios 1.3, 1.7, and 1.4 summary of net TRC and RIM benefits (million 2016$)
Scenario Vehicle Adoption
ChargingBehavior
Gasoline Price
TRC Benefits
RIM Benefits
1.3 Low (7,995) More home Medium $2.1 $13.6
1.7 Medium (48,184)
More home Medium $13.6 $52.1
1.4 High
(111,872) More home Medium $25.4 $107.7
It shows that both the TRC and RIM benefits increase monotonically with the increasing vehicle adoption. Given that more home charging passes both tests, and the model’s reaction to changing vehicle adoption is to scale the charging infrastructure likewise, this result is expected.
Table 6-5 lists the sensitivity of net TRC and RIM benefits to vehicle adoption relative to Scenario 1.8, with more public charging behavior.
Table 6-5 Scenarios 1.5, 1.8, and 1.6 summary of net TRC and RIM benefits (million 2016$)
Scenario Vehicle Adoption
ChargingBehavior
Gasoline Price
TRC Benefits
RIM Benefits
1.5 Low (7,995) More public Medium -$4.6 $14.9
1.8 Medium (48,184)
More public Medium -$16.3 $56.7
1.6 High
(111,872) More public Medium -$38.5 $117.5
It shows results similar to those relative to equal public and home charging, and for the same reason; the TRC test fails and scaling it does not change that fact.
Table 6-6 lists the sensitivity of net TRC and RIM benefits to gasoline prices relative to Scenario 1.0, with more public charging behavior.

6-5
Table 6-6 Scenarios 1.9, 1.0, and 1.10 summary of net TRC and RIM benefits (million 2016$)
Scenario Vehicle Adoption
ChargingBehavior
Gasoline Price
TRC Benefits
RIM Benefits
1.9 Medium (48,184) Equal Low -$30.4 $54.2
1.0 Medium (48,184) Equal Medium -$1.6 $54.2
1.10 Medium (48,184) Equal High $159.1 $54.2
It shows that the TRC benefits increase monotonically with increasing gasoline prices. The RIM benefits are not affected, because avoided gasoline costs are not part of the RIM test. The TRC benefits increase by $160.7 million as the gasoline price increases from $2.77/gal (Medium) to $4.56/gal (High) in the year 2025, which we will use as a benchmark. The increase in gasoline prices is $1.79/gal.
The marginal TRC benefit is $89.8 million for each $1 increase in the gasoline prices, which places the breakeven gasoline price in 2025 close to $2.79/gal, relative to Scenario 1.0.
Critical Short-Term Benefits Summary – Scenarios 2.0–2.3
The Critical Short-Term Benefits case studies all passed the RIM. This is largely because when all of the investment in new vehicles and charging stations is taken into account, only 25% of the charger costs are included in the rate base. As a result, the increased revenue and capacity utilization from electric vehicle charging creates a significant marginal benefit to all ratepayers. Because the RIM test does not include the case study scenario variables—Federal Tax Credits and Gasoline cost—this high marginal ratepayer benefit remains constant across all scenarios.

6-6
Table 6-7 lists the TRC and RIM benefits for critical short-term benefits of gasoline prices and the Federal Tax Credit.
Table 6-7 Scenarios 2.0–2.3 summary of net TRC and RIM benefits (million 2016$)
Scenario Gasoline Prices
Federal Tax Credit
TRC Benefits
RIM Benefits
2.0 AEO 2015 Reference None -$64.6 $33.8
2.1 AEO 2015 Reference $5,000 $7.0 $33.8
2.2 AEO 2015 High None -$28.9 $33.8
2.3 AEO 2015 High $5,000 $42.7 $33.8
Without the Federal Tax Credits, the short-term (five years) economics do not promote investment in PEVs and charging stations. However, with an average Federal Tax Credit of $5,000 per vehicle, the economic value becomes compelling to potential owners. The Net TRC Benefits rose to $7.0 million, from -$64.6 million. This leaves room for gasoline prices to be lower than those in the AEO 2015 Reference Case, and it promotes further benefits from avoided Gasoline Cost should prices rise to the level of the High Oil Price Case.
The TRC benefit increases by $71.6 million when the Federal Tax Credit changes from $0 to $5,000.
The marginal TRC benefit from the changing Federal Tax Credit is 14,320 $/$, implying that the breakeven point for Federal Tax Credit is about $4,611, relative to Scenario 2.0.
The TRC benefit increases by $35.7 million in response to increasing gasoline prices in 2025 from $2.95/gal in the AEO 2015 Reference to $4.56/gal in the AEO 2015 High Case, a change of $1.61/gal.
The marginal TRC benefit from the changing 2025 gasoline price is $22.2 million per $1/gal, implying that the breakeven point for 2025 gasoline prices is about $4.42/gal, relative to Scenario 2.0.
Recall that in Case Study 2, the 2016 gasoline price starts at $1.80/gal and rises exponentially to the 2025 price. Thereafter, the gasoline prices change according to the profiles provided in the specified AEO 2015 cases.
Public Infrastructure Summary – Scenarios 3.0–3.6
This summary of the Public Infrastructure case studies collects the TRC and RIM test results in one place and explains how the RIM benefits shift from negative to positive for the nominal and high-cost public charging deployments when vehicle adoption reaches a breakeven point.
Table 6-1 summarizes the TRC and RIM test results across all Public Infrastructure scenarios and allows for comparisons across the vehicle adoption

6-7
scenarios in order to estimate the breakeven adoption rates needed to support the nominal and high-cost public charging deployments.
Table 6-8 Scenarios 3.0–3.6 summary of net TRC and RIM benefits (million 2016$)
Scenario Vehicle
Adoption
Public Charging
Deployment
Charging Behavior
TRC Benefits
RIM Benefits
3.0 Low (5,559) None None $4.4 $4.0
3.1 Low (5,559) Nominal Some public charging
-$18.9-$23.3*
-$18.9-$22.9*
3.2 Medium (29,733) Nominal
Some public charging
$9.4$5.0*
$8.3$4.2*
3.3 High (73,533) Nominal Some public charging
$61.1$56.6*
$56.7$52.7
3.4 Low (5,559) High cost Some public charging
-$29.6-$33.9*
-$29.4-$33.5*
3.5 Medium (29,733) High cost
Some public charging
-$1.0-$5.4*
-$2.1-$6.2*
3.6 High (73,533) High cost Some public charging
$50.6$46.2*
$46.3$42.3*
* Incremental net benefits over Base Scenario 3.0.
At the budgeted nominal public charging station deployment costs and medium vehicle adoption (Scenario 3.2), the incremental net ratepayer benefit is $6.3 million when compared to the Scenario 3.0, which represents business-as-usual.
Vehicle Adoption to Support Public Infrastructure
A straight-line approximation between Scenarios 3.1 and 3.2 vehicle adoption and RIM test results is used to estimate the breakeven point for ratepayers in the nominal public charging infrastructure scenario. This approximation uses the incremental RIM benefits over Scenario 3.0 in order to isolate the effects of the added infrastructure from other effects due to the initial conditions. Likewise, Scenarios 3.5 and 3.6 are used to estimate the breakeven point for the high nominal public charging infrastructure.
The breakeven point for vehicle adoption for the $21.6 million public charger program plus the $2.0 million program cost is near 26,000 vehicles.

6-8
At the high public charging station deployment cost (150% of nominal cost), Scenario 3.5 shows that with the medium adoption rate, the ratepayers do not reach the breakeven point because the incremental Net RIM Benefits over Scenario 3.0 are -$6.2 million.
The breakeven point for vehicle adoption for the $32.4 million public charging station program plus the $2.0 program cost is near 35,600 vehicles.
Effect on Customers
In this summary, we review the electricity energy sales for the nominal scenarios in each case study involving the installation and adoption of electric vehicles. These scenarios are:
Scenario 1.0 – Case Study 1: Base Scenario.
Scenario 2.1 – Determines the impact of a $5,000 federal tax credit on the net benefits, compared to Scenario 2.0.
Scenario 3.2 – Introduction of public infrastructure with nominal cost and nominal sales.
As a reminder, Table 6-9 lists the scenario variables, their values, and the net RIM benefit and Utility Sales for each of them.
Table 6-9 Sales impact on nomincal case study scenarios
Scenario Vehicle Adoption
Charging Behavior
Gasoline Price
Net RIM
Benefit (Million 2016$)
Utility Sales
(Million 2016$)
1.0 Medium Equal Medium $54.2 $89.5
Gasoline Prices
Federal Tax
Credit
2.1 Medium AEO 2015 Reference $5,000 $33.8 $62.9
Public
Charging Deployment
Charging Behavior
3.2 Medium Nominal
Cost
Some public
charging $8.3 $52.8
Note that all three scenarios pass the RIM test and that utility sales are on the order of 10’s of millions of dollars. Scenarios 1.0 and 2.1 pass the RIM test with net benefits of more than half of utility sales.

6-9
Effect on Utility Sales
Another perspective on utility sales is the increase in electric vehicle charging load each year. Figure 6-1 plots the three curves for these nominal scenarios.
Figure 6-1 Scenario 3.0 TRC test results (million 2016$)
Recall that the horizons for Case Studies 1 and 3 are 10 years in length, while that for Case Study 2 is 5 years in length. Thus, over the period depicted, from 2016 to 2025, sales for Case Study 2 begins to decrease after 5 years, which is just an artifact of the truncated horizon.
Because the net RIM benefits are positive, they can be a significant portion of overall utility sales, and the annual energy sales increase are on the order of 10’s of GWh, we reach the following conclusion:
Transportation electrification increases utility sales in a way that may significantly benefit all ratepayers in the long-term.
0
20
40
60
80
100
120
140
160
180
200
2016 2017 2018 2019 2020 2021 2022 2023 2024 2025
Annu
al S
ales
GW
h/yr
Scenario 1.0 Scenario 2.1 Scenario 3.2

7-1
Section 7: Annotated Bibliography California Transportation Electrification Assessment: Phase 1: Final Report [1]
This ICF International report, prepared with analytical support from Energy and Environmental Economics (E3), updates California Electric Transportation Coalition (CalETC) estimates for transportation electrification. These estimates include market sizing, forecasts, and societal benefits for each TE technology; this report adds technologies for off-road vehicles and extends the analysis to 2030. The report also includes a benefit-cost analysis of certain TE technologies. The benefits derive from multiple sources, and the report documents the market gaps, barriers, and potential solutions toward achieving them.
California Transportation Electrification Assessment: Phase 2: Grid Impacts [2]
This ICF International report, prepared with analytical support from E3, documents Phase 2 of the CalETC project. It analyzes the cost-benefit of PEV charging projects under many circumstances, based on assumed PEV penetration levels. The report summarizes the analysis as net benefits, which are an indicator of the overall benefit of such a program. The analysis investigates the potential for positive net benefits among the three California Investor-Owned Utilities: Pacific Gas and Electric (PG&E), Southern California Edison (SCE), and San Diego Gas and Electric (SDG&E) as well as the municipal utility, Sacramento Municipal Utility District (SMUD). The study is based on detailed distribution system data and accounts for distribution upgrade costs in detail. The reporting is in standardized formats used by the California Air Resources Board (CARB) and the California Public Utility Commission (CPUC).
Electrification Knowledge Base (EKB) v1.0 [3]
The EKB stores information surrounding electronic technologies as well as quantitative data practical for evaluating the cost-effectiveness of technology alternatives. The EKB also contains qualitative information such as applicability, technical considerations, and market barriers. This information may be used in support of end-use customer decisions when replacing existing equipment or in greenfield applications.

7-2
Environmental and Societal Benefits of Electrifying Transportation: Plug-in Hybrid Vehicle Environmental Study Analysis Structure [4]
National interest in electric transportation has shown a dramatic increase, as depicted through major media exposure, incentives, research and development (R&D) language in the Energy Policy Act of 2005, and public support by several senators and prominent public figures. This growing interest and the attention from the operation of the PHEV Sprinter vans in the United States will continue to drive an interest in the emissions offsets resulting from transferring vehicle emissions to the power grid. The objective of this analysis is to measure the resulting energy consumption and emissions from the expansion of electric transportation in a given metropolitan region. Petroleum fuels are displaced by grid electricity as electric drive vehicle (EDV) market penetration increases, causing a change in emissions signatures and energy consumption patterns.
Regional Economic Benefits from Electric Transportation: Case Study of the Cleveland, Ohio Metropolitan Statistical Area [5]
This study considers the economic impacts from EDV market penetration in the Cleveland metropolitan statistical area. It focuses on the economic impacts caused by petroleum displacement and decreased pollution control compliance costs for local industry. A regional input-output analysis is applied to create regional economic impact multipliers (REIMs) for EDV evaluation. These REIMs are combined into a spreadsheet based on the Cleveland EDV Economic Impact Model (CEEIM). Using CEEIM, the study includes an illustrative example demonstrating that significant regional economic benefits can be achieved by large-scale EDV use in urban areas.
Plug-in Hybrid Electric Vehicles and Petroleum Displacement: A Regional Economic Impact Assessment [6]
This study analyzes the regional economic impacts linked to the large-scale use of PHEVs in six major U.S. cities (Cleveland, OH; Austin, TX; Birmingham, AL; Kansas City, KS/MO; Newark, NJ; and Sacramento, CA). The focus is on impacts due to petroleum displacement, increased electricity demand, and annual fuel cost savings by households.
The study implements regional input-output analysis to measure the potential macroeconomic impacts of transportation fuel switching. It shows that when petroleum prices are at or above present levels, all six study cities can achieve regional economic benefits. Assuming lower petroleum prices, economic impacts vary by study region, with the most beneficial results seen in the Cleveland, Kansas City, and Birmingham regions.

7-3
The Direct and Indirect Costs of Regulatory Compliance: A Value Proposition for Electric Transportation [7]
This report provides an overview of both air quality and air quality regulation in the United States. It reviews the theory and empirical literature on the economic impacts of environmental regulation, with a focus on the manufacturing sector. The document presents air quality compliance cost estimates and explores regional costs of air quality regulations. An analytical template and example of how to use it are presented to help analysts evaluate the direct and indirect impacts of air quality regulations in their regions.
Overcoming Barriers to Deployment of Plug-in Electric Vehicles [8]
This study—commissioned by the U.S. Congress, funded by the U.S. Department of Energy, and published by the U.S. National Academy of Sciences (NAS) and the National Academy of Engineering (NAE)—describes present-day (2013) barriers to the deployment of PEVs. High vehicle cost, short all-electric driving range, and long battery-charging infrastructure to support PEVs at multiple locations have all had an impact on the PEV deployment. Included are a short interim report and this comprehensive final report.
The recommendations are as follows:
Standardize plugs and charging behavior and use standard methods of payment at all public charging stations.
Provide consumers with accurate information about tax credits, other incentives, and the value of PEV ownership.
Provide stable research funding for lowering the cost of PEV batteries and better understanding the role of the public charging infrastructure.
Keep PEVs free of special roadway and registration surcharges.
Promote building codes and streamlined processes for the public charging infrastructure.
Encourage a workplace charging infrastructure.
Refrain from technology lock-in at this time.
Ensure that charging occurs during low-cost periods.
Provide purchase incentives beyond the current quotas for a period of five years, convert to a point-of-sale rebate, and research those PEV incentives that work best.
Electric Vehicle Charging Station Pilot Evaluation Report [9]
This May 2015 report by Xcel Energy documents a pilot study of PEV 20 charging stations implemented in 2013 and 2014. Xcel monitored the charging patterns and compared them to existing load patterns and behaviors. They also studied the technical and operational use of interrupted charging as a form of

7-4
demand response (DR) and the extent to which adding charging stations can impact their distribution system. The DR portion of the project offered a $100 incentive and the ability to keep the charging station at the end of the project in exchange for Xcel control of the charging patterns, at most 12 times per year, and data collection.
Aggregated charging peaks were observed consistently at 09:00 and 23:00, while individual peaks varied. This resulted in little impact to the system peak and potentially little benefit from controlling the charging load as part of a DR program. Distribution system impacts, based on the projected penetration of charging stations, are seen to be a distant 10 years for any feeders or transformers. Any significant impact will occur at 4% PEV penetration, with increasing risk of peak load increases, due to variations in charging behavior.
The Colorado Electric Vehicle Market Implementation Study [10]
This 2015 study credits fuel savings, unstable gasoline prices, government incentives, and multiple available PEV choices as leading to increasing PEV adoption in Colorado. Strong local efforts also provide technical services and a public charging infrastructure. The increase in PEVs provides environmental, energy, and economic security benefits. The source of benefits is through reduced energy consumption, lower reliance on imported petroleum, and lower fuel and maintenance costs to consumers. The report ranks remaining market barriers to PEV penetration, via a 285-response survey, as being vehicle cost, vehicle range, charging convenience, and vehicle performance.
The report body quantifies the environmental, energy, and security benefits, which can help serve as benchmarks for further research. The report also provides a quick summary of the methodologies used for these quantifications and identifies vehicle and charging station locations. This report identifies airports, trailheads, restaurants, and other “attractions” as locations for the charging infrastructure. The attractions with the longest dwell times are ski resorts, stadiums, and universities (page 31). Dwell times are suggested as a means to determine the level of charging needed by location. The shortest dwell-time locations are bookstores, government offices, and department/grocery stores.
Another aspect of the report is the concept of an “electric highway” featuring public charging at regular intervals. This would involve 21 Level-3 charging stations to traverse the two major highways in Colorado at 50-mile intervals. Finally, the report surveys Colorado policy and makes recommendations on further policy improvements.
Colorado Electric Vehicle & Infrastructure Readiness Plan [11]
This 2012 report describes a policy framework for promoting PEVs in Colorado, with goals to use domestic energy sources in order to improve air quality and promote economic sectors of energy, manufacturing, transportation, and construction. The plan provides an analysis of the Colorado PEV market,

7-5
consumers, market barriers, and growth strategies. The immediate need is identified to be establishing a charging infrastructure. The framework addresses seven issue areas: education and outreach, permitting and installation, local ordinances, fleets, policy, regulatory and utility, and emissions impact. No near-term grid impacts were foreseen in 2012, yet utilities were viewed as appropriate entities to facilitate the process of transportation electrification.
Field Testing Plug-in Hybrid Electric Vehicles with Charge Control Technology in the Xcel Energy Territory [12]
This 2007 National Renewable Energy Laboratory (NREL) report describes collaboration between NREL and Xcel Energy to analyze fuel switching, cost reductions, and emission reductions from modified 2006 and 2007 Ford Escape PHEVs driven in Denver, CO, and Minneapolis/Saint Paul, MN. It quantified all three effects through direct measurements of the driving behavior of three primary subjects behaving as consumers. The report identified four scenarios of charging behavior and four scenarios for providing alternative charging incentives.
Costs and Emissions Associated with Plug-in Hybrid Electric Vehicle Charging on the Xcel Energy Colorado Service Territory [13]
This NREL report describes a series of simulations of the Xcel Energy Colorado power system with the added load of a PHEV fleet. This was done under various scenarios concerning how the vehicles will be charged. The simulations indicate impacts to the total system load, emissions changes due to added PHEV charging, potential reductions in conventional vehicle use, marginal costs of PHEV charging, and potential system benefits from controlled charging.
NREL used a 2007 baseline to add certainty about the system hourly dispatch over one year. They used the PROSYM model to establish the base case behavior and scenarios for 1) uncontrolled charging at home, 2) delayed charging (after 23:00), 3) off-peak charging (23:00 to 07:00), and 4) continuous charging (at home and at public stations).
Uncontrolled and continuous charging adds to the system peak, and relies more on simple cycle and other gas generation. Delayed and off-peak charging does not affect the system peak and relies more on baseload generation (combined cycle and coal). Costs are lower for delayed and off-peak charging. PHEV emissions are mixed, depending on the type of emission. Net emissions, which account for upstream sources, are lower in all scenarios when compared to conventional vehicles.
This report is short and well structured, with a clear communication of the major factors affected by increased PHEV charging.

7-6
Electrifying Vehicles: Insights from the Canadian Plug-in Electric Vehicle Study [14]
This report by Simon Fraser University involves surveys of new vehicle owners and new PEV owners across Canada about their awareness of alternative vehicle options, PEV charger access, their valuation of PEV attributes, anticipated and actual vehicle use, and acceptance of controlled charging. These survey results are explained and then used as a basis for estimating PEV adoption rates, charging patterns, and greenhouse gas (GHG) impacts.
The results represent the vehicle market characteristics and estimate significant GHG reductions from PEV use, especially in hydro-dominated areas. Acceptance of controlled charging is described in terms of customers who focus on full charge, cost, and renewables.
Boulder Electric Vehicle Infrastructure and Adoption Assessment [16]
This April 2015 report by the Southwest Energy Efficiency Project (SWEEP) documents numbers and locations of PEVs and fast chargers, with attention to increasing use of the public charging infrastructure. It further gives detailed instructions on providing workplace charging, conducting pilot studies, building codes, planning requirements, interfacing with public transport, bike share, ride share options, and public education about PEVs and the charging infrastructure. This assessment provides a useful guide to planning and implementing PEV adoption strategies.
Considering a Regional Network of Bus Rapid Transit in the Denver Metro Area [17]
This October 2014 report by SWEEP is a proposal for the Denver regional transportation planning entities to consider bus rapid transit (BRT) in addition to rail service. SWEEP describes very high-level analyses of several commuter corridors as candidates for BRT development.
This report does not address transportation electrification directly. Instead, it offers BRT alternatives to an electric rail service promoted by a voter initiative and called FasTracks. There is no mention of emission impacts of these alternatives.
Economic and Air Quality Benefits of Electric Vehicles in Nevada [18]
This September 2014 report by SWEEP assesses the emission reductions and economic benefits of introducing electric vehicles (including PHEVs) in various Nevada counties. Emission decreased in almost all cases except for SO2 in a high-coal county. Because Nevada imports all of its petroleum products, in-state efficiencies and transportation electrification are seen as steps to improve the in-state economy. SWEEP cites a 2012 California study by D. Roland-Holst, Plug-

7-7
in Electric Vehicle Deployment in California: An Economic Jobs Assessment, on economic benefits; SWEEP authors translate these benefits to Nevada.
The estimates of job creation are based on EIA forecasts of EV penetration in the Mountain Region (from 1.8%–8% of sales by 2030). Economic estimates use the EIA Reference Case and High Oil Price Case (as in AEO 2013). These cases, however, are no longer relevant. While results in this report are outdated in terms of oil prices, the framework is sound and serves as a quick, high-level means to perform a screening analysis.
NV Energy: Leading the Way on Electric Vehicles [19]
This August 2014 report by SWEEP asserts that policies promoting electric vehicles (EVs) can help smooth electricity production and increase off-peak electricity demand, thus benefiting all Nevada consumers. The report focuses on a single Nevada utility, NV Energy, and describes how increased electricity sales and higher capacity utilization could benefit that utility. The report describes programs by NV energy to promote charging infrastructure, TOU and EV-specific rates, shared investment in charging stations, training and technical assistance, and investments in EVs. The report also documents other utility activities like these, especially those in Nevada, but also broader regionally in the Southwest and nationally.
Policies to Promote Electric Vehicles in the Southwest: A State Government Report Card (2014 edition) [20]
This April 2014 report by SWEEP describes activities in Southwestern U.S. states regarding the promotion of PEVs and infrastructure. SWEEP rates the policies/programs according to their potential to promote PEVs in each state, specifically, Arizona, Colorado, New Mexico, Nevada, Utah, and Wyoming. Each state receives a final grade based on the accumulation of these points. Only Colorado rates an A. This report provides a good summary for those interested in policy/program details and the SWEEP interpretation.
Air Quality and Economic Benefits of Electric Vehicles in New Mexico [21]
This January 2014 report by SWEEP analyzes the economic and emission benefits of EVs in New Mexico in a fashion similar to the one about Nevada [18]. This report precedes the Nevada report but uses the same AEO reference year, 2013. It is not clear what year the gasoline prices are based upon or what nominal values are used in reporting.
Air Quality and Economic Benefits of Electric Vehicles in Arizona [22]
This September 2013 report by SWEEP analyzes the economic and emission benefits of EVs in New Mexico in a fashion similar to ones about Nevada [18]

7-8
and New Mexico [21]. This report precedes the other two, but uses the same AEO reference year (2013) and other analytical methods.
Air Quality Benefits of Electric Vehicles in the Denver Metro and North Front Range Area [23]
This September 2013 report by SWEEP analyzes the emission benefits of EVs in New Mexico in a fashion similar to ones about Nevada [18], New Mexico [21], and Arizona [22].
Economic Benefits of Transit Systems: Colorado Case Studies [24]
This September 2013 report by SWEEP describes various transit systems in Colorado and how they provide economic benefits through economic efficiency of transport services. Direct benefits come from reduced travel times, increased mobility, and less demand for roads and parking. Indirect benefits come from reduced congestion and changes in land use, which provide benefits outside of transport users. The methodology takes direct reporting of vehicle miles traveled and estimates displaced gasoline consumption, the reduced expenditure for that gasoline, and reduced vehicle maintenance costs.
Reduced congestion leads to quantified hours not spent delayed in traffic according to the Texas Transportation Institute assessment of urban congestion (Texas Transportation Institute 2011 Urban Mobility Report, http://mobility.tamu.edu/ums/). Further, the methods used to determine parking infrastructure and other benefits are described in the methodology section and can serve as a useful reference for similar analyses.
The Potential for Electric Vehicles to Reduce Emissions and Improve Air Quality on the Wasatch Front [25]
This August 2013 report by SWEEP analyzes the emission benefits of electric vehicles in New Mexico in a fashion similar to ones about Nevada [18], New Mexico [21], Arizona [22], and the Denver Area [23].
On-Road and Off-Road Electrotechnology Programs: Identifying Opportunities for Potential Revenue Growth [26]
This 2015 white paper by ICF International describes the potential benefits of off-road electrification in terms of increased load, reduced ozone emissions, CO2 emissions, and lifetime revenue through illustrative examples. It describes potential case studies for 1) materials handling, 2) agricultural pumping, and 3) forklifts. It also describes briefly the types of analysis that could be conducted: technology assessment, market assessment, cost-benefit analysis, program design, and program implementation. This white paper does not describe methods.
7-9
EV Roadmap Conference [27]
This conference explores the strategies utilities are testing to take advantage of the lessons they are learning and the opportunities for expanded utility engagement in the transportation sector.
Electric Vehicle Benefits and Costs in the United States [28]
This Policy Brief from Carnegie Mellon University (CMU) describes in two pages the technical inputs and implications of determining EV economic benefits and costs. Metrics include energy security, air quality, climate change, and economics. The inputs are oil use and imports, vehicle type, driving patterns, electricity generation fuel sourcing, regional climate, charging profiles, and fuel economy policy. Based on these inputs (factors) the best-case scenario for improving the metrics is to focus on hybrid electric vehicles (HEVs) and PHEVs by city drivers in mild-climate regions with a clean electricity grid,
CMU asserts that even the best-case scenario could increase emissions if a national policy is implemented, based on their estimate that, on average, GHG emissions increase in the United States for each PEV sold.
Electric Vehicle Adoption Potential in the United States [29]
This Policy Brief from CMU describes in two pages the technical inputs and implications of determining HEV adoption in the United States. It compares vehicle designs for conventional vehicles as well as three hybrid electric vehicles. The Policy Brief identifies the key factors that govern HEV adoption as being vehicle range, charging infrastructure, parking, consumer preferences (in terms of bias toward or against electric vehicles), cost, and policy. The CMU conclusion is that electric vehicles have several major hurdles to overcome before widespread adoption.
National Economic Value Assessment of Electric Transportation [30]
DOE/NREL/EEI are conducting a study based on a state-by-state look at the public benefits of electric transportation. Differing from the EPRI collaborative study, this one focuses on internal communication within the utility to the executive team. This report is not yet published.
Environmental Assessment of a Full Electric Transportation Portfolio: Executive Summary [31]
EPRI and the Natural Resources Defense Council (NRDC) produced the Environmental Assessment of a Full Electric Transportation Portfolio to provide an in-depth analysis of the environmental impact of electrifying a range of vehicles, including U.S. light-duty and medium-duty transportation and industrial equipment such as forklifts. The study simulates emissions and air quality

7-10
impacts of a significant shift from internal combustion engines to electric vehicles and equipment.
Related EPRI Reports
Environmental Assessment of a Full Electric Transportation Portfolio, Volume 1: Background, Methodology, and Best Practices. EPRI, Palo Alto, CA: 2015. 3002006875. http://www.epri.com/abstracts/Pages/ProductAbstract.aspx?productId=000000003002006875
Environmental Assessment of a Full Electric Transportation Portfolio, Volume 2: Greenhouse Gas Emissions. EPRI, Palo Alto, CA: 2015. 3002006876 http://www.epri.com/abstracts/Pages/ProductAbstract.aspx?productId=000000003002006876
Environmental Assessment of a Full Electric Transportation Portfolio, Volume 3: Air Quality Impacts. EPRI, Palo Alto, CA: 2015. 3002006880. http://www.epri.com/abstracts/Pages/ProductAbstract.aspx?productId=000000003002006880
Environmental Assessment of a Full Electric Transportation Portfolio: Frequently Asked Questions. EPRI, Palo Alto, CA: 2015. 3002006898. http://www.epri.com/abstracts/Pages/ProductAbstract.aspx?productId=000000003002006898

8-1
Section 8: References [1] ICF International (2014). California Transportation Electrification
Assessment: Phase 1: Final Report. ICF International, San Francisco, CA: August 2014; updated September 2014. http://www.caletc.com/wp-content/uploads/2014/09/CalETC_TEA_Phase_1-FINAL_Updated_092014.pdf
[2] ICF International (2014). California Transportation Electrification Assessment: Phase 2: Grid Impacts. ICF International, San Francisco, CA: October 2014. http://www.caletc.com/wp-content/uploads/2014/10/CalETC_TEA_Phase_2_Final_10-23-14.pdf
[3] EPRI (2014). Electrification Knowledge Base (EKB) v1.0. EPRI, Palo Alto, CA: 2014. 3002003544. https://membercenter.epri.com/programs/105741/pages/productabstract.aspx?ProductId=000000003002003544 http://ekb.epri.com/
[4] EPRI (2005). Environmental and Societal Benefits of Electrifying Transportation: Plug-In Hybrid Electric Vehicle Environmental Study Analysis Structure. EPRI, Palo Alto, CA: 2005. 1010204. https://membercenter.epri.com/abstracts/Pages/ProductAbstract.aspx?ProductId=000000000001010204
[5] EPRI (2006). Regional Economic Benefits from Electric Transportation: Case Study of the Cleveland, Ohio Metropolitan Statistical Area. EPRI, Palo Alto, CA: 2006. 1012466. https://membercenter.epri.com/abstracts/Pages/ProductAbstract.aspx?ProductId=000000000001012466
[6] EPRI (2007). Plug-in Hybrid Electric Vehicles and Petroleum Displacement: A Regional Economic Impact Assessment. EPRI, Palo Alto, CA: 2007. 1013781. https://membercenter.epri.com/abstracts/Pages/ProductAbstract.aspx?ProductId=000000000001013781
[7] EPRI (2006). The Direct and Indirect Costs of Regulatory Compliance: A Value Proposition for Electric Transportation. EPRI, Palo Alto, CA: 2006.

8-2
1010567. https://membercenter.epri.com/abstracts/Pages/ProductAbstract.aspx?ProductId=000000000001010567
[8] NAS (2015). Overcoming Barriers to Deployment of Plug-In Electric Vehicles. National Academy of Sciences, Washington, D.C.: 2015. http://www.nap.edu/openbook.php?record_id=21725
[9] Xcel Energy (2015). Electric Vehicle Charging Station Pilot Evaluation Report. Xcel Energy: May 2015. http://www.xcelenergy.com/staticfiles/xe-responsive/Admin/Managed%20Documents%20&%20PDFs/CO-DSM-2014-EV-Pilot-Evaluation.pdf
[10] Colorado Energy Office (2015). Electric Vehicle Market Implementation Study. Prepared by BCS for Colorado Energy Office, January 2015. https://www.colorado.gov/pacific/energyoffice/atom/14086
[11] Denver Metro CleanCities (2012). Colorado Electric Vehicle & Infrastructure Readiness Plan, September 2012. http://lungwalk.org/CleanCitiesWebsite/wordpress/wp-content/uploads/2015/05/Colorado-PEV-Readiness-Plan.pdf
[12] NREL (2009). Field Testing Plug-In Hybrid Electric Vehicles with Charge Control Technology in the Xcel Energy Territory. National Renewable Energy Laboratory, Golden, CO: August 2009. NREL/TP-550-46345. http://www.nrel.gov/docs/fy09osti/46345.pdf
[13] NREL (2007). Costs and Emissions Associated with Plug-In Hybrid Electric Vehicle Charging in the Xcel Energy Colorado Service Territory. National Renewable Energy Laboratory, Golden, CO: May 2007. NREL/TP-640-41410. http://www.altomelbilen.dk/rapporter/El%20vehicles%20%20and%20hybrids%20study.pdf
[14] Axsen, J., S. Goldberg, J. Bailey, G. Kamiya, B. Langman, J. Cairns, M. Wolinetz, and A. Miele (2015). Electrifying Vehicles: Insights from the Canadian Plug-in Electric Vehicle Study. Simon Fraser University, Vancouver, Canada. http://rem-main.rem.sfu.ca/papers/jaxsen/Electrifying_Vehicles_(FINAL)_V2.8_(July10).pdf
[15] SWEEP (2015). Southwest Energy Efficiency Project website. http://www.swenergy.org/publications/transportation
[16] SWEEP (2015). Boulder Electric Vehicle Infrastructure and Adoption Assessment. Southwest Energy Efficiency Project: April 2015. http://www.swenergy.org/data/sites/1/media/documents/publications/docu

8-3
ments/Boulder_Electric_Vehicle_Infrastructure_and_Adoption_Assessment_April-2015.pdf
[17] SWEEP (2014). Considering a Regional Network of Bus Rapid Transit in the Denver Metro Area. Southwest Energy Efficiency Project: October 2014. http://www.swenergy.org/data/sites/1/media/documents/publications/documents/Regional_BRT_in_Denver_Oct_2014.pdf
[18] SWEEP (2014). Economic and Air Quality Benefits of Electric Vehicles in Nevada. Southwest Energy Efficiency Project: September 2014. http://www.swenergy.org/data/sites/1/media/documents/publications/documents/Economic_and_AQ_Benefits_of_EVs_in_NV-Sept_2014.pdf
[19] SWEEP (2015). NV Energy: Leading the Way on Electric Vehicles. Southwest Energy Efficiency Project: September 2014. http://www.swenergy.org/data/sites/1/media/documents/publications/documents/NV_Energy_Leading_the_Way_on_EVs_08-2014.pdf
[20] SWEEP (2014). Policies to Promote Electric Vehicles in the Southwest: A State Government Report Card (2014 edition). Southwest Energy Efficiency Project: September 2014. http://www.swenergy.org/data/sites/1/media/documents/publications/documents/EV%20Report%20Card%20-%202014%20UpdateFNLBody.pdf
[21] SWEEP (2014). Air Quality and Economic Benefits of Electric Vehicles in New Mexico. Southwest Energy Efficiency Project: January 2014. http://www.swenergy.org/data/sites/1/media/documents/publications/documents/Air_Quality_Economic_Benefits_EVs_in_NM_Jan2014.pdf
[22] SWEEP (2013). Air Quality and Economic Benefits of Electric Vehicles in Arizona. Southwest Energy Efficiency Project: September 2013. http://www.swenergy.org/data/sites/1/media/documents/publications/documents/AZ%20EV%20AirQuality.EconAnalysis.9.26.13%20.pdf
[23] SWEEP (2013). Air Quality Benefits of Electric Vehicles in the Denver Metro and North Front Range Area. Southwest Energy Efficiency Project: September 2013. http://www.swenergy.org/data/sites/1/media/documents/publications/documents/Denver%20Metro%20Air%20Quality%20Analysis.pdf
[24] SWEEP (2013). Economic Benefits of Transit Systems: Colorado Case Studies. Southwest Energy Efficiency Project: September 2013. http://www.swenergy.org/data/sites/1/media/documents/publications/documents/Transit_Benefits_Colorado_Sept_2013.pdf
[25] SWEEP (2013). The Potential for Electric Vehicles to Reduce Emissions and Improve Air Quality on the Wasatch Front. Southwest Energy Efficiency Project: August 2013.

8-4
http://www.swenergy.org/data/sites/1/media/documents/publications/documents/Wasatch%20Front%20Air%20Quality%20Analysis.pdf
[26] ICF International (2015). On-Road and Off-Road Electrotechnology Programs: Identifying Opportunities for Potential Revenue Growth. ICF International white paper and webinar: June 2015. http://www.icfi.com/insights/white-papers/2015/non-road-electrotechnology-programs http://www.icfi.com/events/webinars/2015/07/on-road-off-road-electrotechnology-programs
[27] Drive Oregon (2015). EV Roadmap Conference. http://evroadmapconference.com/program/
[28] CMU. (2015). Electric Vehicle Benefits and Costs in the United States. Policy Brief, June 2015. http://www.cmu.edu/epp/policy-briefs/briefs/Electric-Vehicles-Costs-Benefits.pdf
[29] CMU. (2015). Electric Vehicle Adoption Potential in the United States. Policy Brief, June 2015. http://www.cmu.edu/epp/policy-briefs/briefs/Electric-Vehicle-Adoption.pdf
[30] NREL (2015). National Economic Value Assessment of Electric Transportation.
[31] EPRI, NRDC (2015). Environmental Assessment of a Full Electric Transportation Portfolio: Executive Summary. EPRI, Palo Alto, CA: 2015. 3002006881. http://www.epri.com/abstracts/Pages/ProductAbstract.aspx?ProductId=000000003002006881

A-1
Appendix A: Data Template This appendix describes in minimal terms the input data for the transportation electrification model. The utility participants used it as a template for describing the data they included in the model. It did not necessarily have all the input values, but instead described the sources of the input data and the rationale for the settings. The text “TBD source/reason” is a placeholder for the utility to document the data source and their rational.
The data is organized hierarchically in the formatted used by the model. The headings and terms are exactly as they appear in the model for easy reference.
Base Year Data and Escalation Rates
Analysis Details
Scenario Name
This value should use the convention “UtilX_Scenario_Y”. The model will automatically append a version number and increment it as necessary.
Analysis Duration
Last year of vehicle deployment – The default is 2030.
TBD source/reason.
Sales and RPS Assumptions
TBD source/reason.
Total Utility Sales
TBD source/reason.
Base Value – TBD source/reason.
Growth Rate – TBD source/reason.

A-2
RPS Compliant Sales
TBD source/reason.
Base (2016) Value as % of Total Sales – TBD source/reason.
Target as % of Sales – TBD source/reason.
Compliance Year – TBD source/reason.
Utility Financials
Revenue Requirement
TBD source/reason.
Base value – TBD source/reason.
Annual growth rate – TBD source/reason.
Program Cost (Operating Expenditures)
TBD source/reason.
Base value – TBD source/reason.
Annual growth rate – TBD source/reason.
Financial Parameters
TBD source/reason.
Utility discount rate (%) – TBD source/reason.
Cost of debt (%) – TBD source/reason.
Return on (cost of) equity (%) – TBD source/reason.
Equity share for financing – TBD source/reason.
Federal income tax (%) – TBD source/reason.
State income tax (%) – TBD source/reason.
Time-of-Use Details
Simple (Four-Period) Definition\
TBD source/reason.
Summer start month – TBD source/reason.
Summer end month – TBD source/reason.
Summer on-peak first hour (ending) – TBD source/reason.
Summer on-peak last hour (ending) – TBD source/reason.
Winter on-peak first hour (ending) – TBD source/reason.
A-3
Winter on-peak last hour (ending) – TBD source/reason.
Rate Details
TBD source/reason.
Residential rates (less than 800 kWh) – TBD source/reason.
TBD source/reason.
Summer on-peak energy, summer off-peak energy – TBD source/reason.
Winter on-peak energy, winter off-peak energy – TBD source/reason.
Summer demand charge, winter demand charge – TBD source/reason.
Customer charge – TBD source/reason.
Annual rate escalation – summer, annual rate escalation – winter – TBD source/reason.
Commercial rates (first 50 kW)
TBD source/reason.
Summer on-peak energy, summer off-peak energy – TBD source/reason.
Winter on-peak energy, winter off-peak energy – TBD source/reason.
Summer demand charge, winter demand charge – TBD source/reason.
Customer charge – TBD source/reason.
Annual rate escalation – TBD source/reason.
Utility Financials
Fuel Prices: Gasoline Price
TBD source/reason.
Base ($/gal) – TBD source/reason.
Annual growth rate (%) – TBD source/reason.
Pollutant Prices
TBD source/reason.
CO2 price ($/ton) – TBD source/reason.
NOx price ($/ton) – TBD source/reason.
SOx price ($/ton) – TBD source/reason.
PM price ($/ton) – TBD source/reason.
VOC price ($/ton) – TBD source/reason.

A-4
Energy Adders
TBD source/reason.
RPS adder ($/MWh) – TBD source/reason.
Energy security adder ($/gal) – TBD source/reason.
Vehicle and Charger Data
TBD source/reason.
Scenario Definition
TBD source/reason.
Include vehicles purchased before model start year in the analysis?
TBD source/reason.
Incentive Details (LDVs Only)
Federal Incentives
TBD source/reason.
State Incentives
TBD source/reason.
Adoption Parameters
EPRI has developed vehicle adoption data for many utility service territories. Those utilities having multiple disjoint territories or multiple jurisdictions may wish to prepare multiple workbooks with parameters varying accordingly.
Light-Duty Vehicles
TBD source/reason.
Forklifts
TBD source/reason.
Buses
TBD source/reason.
A-5
Charger Configuration and Usage Fleet Charging Locations and Type
Default values are available. Are these values OK to get started?
Plug-In Hybrid Electric Vehicle (PHEV)10 Charging Behavior
The charging default is 50% home and 50% mixed between public (work) and home.
The default is that public charging involves all fast chargers (Level 2, 240-V), while home charging involves only 15% fast chargers. All other chargers could be categorized as slow chargers.
TBD source/reason.
PHEV20 Charging Behavior
The charging default is 50% home and 50% mixed between public (work) and home.
The default is that workplace involves all fast chargers, and homes involve 15% fast chargers. All other chargers could be categorized as slow chargers.
TBD source/reason.
PHEV40 Charging Behavior
The charging default is 50% home and 50% mixed between public (work) and home.
The default is that workplace involves all fast chargers, and homes involve 15% fast chargers. All other chargers could be categorized as slow chargers.
TBD source/reason.
Battery Electric Vehicle (BEV) Charging Behavior
The charging default is 50% home and 50% mixed between public (work) and home.
The default is that workplace is all fast chargers, and homes are 90% fast chargers. All other chargers could be categorized as slow chargers.
Medium Forklift Charging Behavior
The charging default is all fast chargers.
TBD source/reason.

A-6
Large Forklift Charging Behavior
The charging default is all fast chargers.
TBD source/reason.
Workplace Charging Parameters
The default scenario includes no chargers.
The default charger timing at the workplace is to start at HE10 and finish at HE18, which means 09:00 to 18:00.
The default number of workplace vehicles per charger is five.
TBD source/reason.
% of Costs Allocated to Rate Base by Charger Type
The default is that 0% of charging costs are rate based.
TBD source/reason.
Electricity Capacity and Energy Costs
Annual Capacity Prices
Capacity prices can either be entered as specified annual values or calculated based on annual growth rates. Where specific values are provided, the model will use these even if there is also a growth rate specified.
The “Avoided Resource Cost” tab can be important, since these data are used to calculate the cost of capacity and the cost of energy supply to the vehicles.
Base (2016) Value
TBD source/reason.
Default Growth Rate
TBD source/reason.
Specified Value
TBD source/reason.
Specified Growth Rate
TBD source/reason.

A-7
Active Value
TBD source/reason.
Hourly Energy Costs
Yearly values should be entered for avoided energy costs. The user is required to supply information for the initial year in the 8760-hour format. For years beyond that, avoided costs can be specified on an 8760 basis or calculated as percent growth relative to the previous year. Growth rates will only be used to calculate energy prices in those years and hours for which there is not a specific value.
Specified Growth Rates
TBD source/reason.
Hourly Energy Avoided Costs
The default energy cost values average to ~$0.023/kWh, which may be quite low. Additionally, if a user wishes to evaluate a factor such as the value of load shifting, this is the place where variations in energy cost enter. The model does not necessarily need 8760 values, but can utilize extra data for accurate cost reporting.
TBD source/reason.
Electricity Generation Portfolio Emission Profiles
The electricity generation portfolio emission profiles can be specified hourly throughout a year.
To calculate the full emissions impact of the EV program, the user should enter the hourly emissions profile of the utility’s generation portfolio.
CO2 Emissions (tons / kWh)
TBD source/reason.
SOx Emissions (tons / kWh)
TBD source/reason.
NOx Emissions (tons / kWh)
TBD source/reason.
VOC Emissions (tons / kWh)
TBD source/reason.

A-8
PM Emissions (tons / kWh)
TBD source/reason.
Distribution Feeders
The table below allows the user to specify characteristics of up to 1000 representative feeder types to be used in the analysis. The user is responsible for entering the percent share of system feeders represented by each feeder type, the percentage allocations of charging loads to each feeder type, and a number of parameters indicating the current state of the feeder and the point at which a feeder upgrade will become necessary. The user also specifies the total number of feeders on the system.
When a feeder type represents multiple feeders, allocation of charging load among the represented feeders can be ambiguous. The “Feeder Allocation” dropdown allows the user to select how the charging load is distributed among these feeders. Selecting “Uniform” will allocate the charging load as evenly as possible among feeders of the same type. Selecting “Uniform Random” will randomly assign the load to feeders of the same feeder type with equal probability. The resulting allocation of charging load on feeders will then vary slightly from simulation to simulation. Selecting “Worst Scenario” will allocate the entire charging load to a single feeder of the given feeder type.
System Parameters
Feeder Types Specified
TBD source/reason.
Total Feeders on the System
TBD source/reason.
Reference Year for Circuit Data
TBD source/reason.
Depreciable Lifetime for Feeder Investments
TBD source/reason.
Feeder Allocation
TBD source/reason.
Specified Feeder Type (Override)
TBD source/reason.

A-9
% Share of Total System Feeders
TBD source/reason.
Allocation of Vehicles to Feeders
% of LDVs (home charging) – TBD source/reason.
% of LDVs (work charging) – TBD source/reason.
% of forklifts – TBD source/reason.
% of buses – TBD source/reason.
Rating (kW)
TBD source/reason.
Urban / Rural? (Optional)
This is the proportion of the load served from urban or rural load shapes.
TBD source/reason.
% of Rating at Which Upgrade is Triggered
TBD source/reason.
Upgrade Cost ($)
The user can set this value to zero ($0) to make this inconsequential.
Upgrade Increment (kW)
TBD source/reason.
Upgrade Type (Optional)
TBD source/reason.
Customer Share by Sector
Residential – TBD source/reason.
Commercial – TBD source/reason.
Industrial – TBD source/reason.
Growth Rate (%/yr)
TBD source/reason.

A-10
Peak Day Shape—kW Load
TBD source/reason.
Annual Data
Fuel/Carbon Price Assumptions
Gasoline prices – If no change is reported, then “Controls” tab values are used.
CO2 prices – If no change is reported, then “Controls” tab values are used.
NOx prices – If no change is reported, then “Controls” tab values are used.
SOx prices – If no change is reported, then “Controls” tab values are used.
PM prices – If no change is reported, then “Controls” tab values are used.
VOC prices – If no change is reported, then “Controls” tab values are used.
Energy / Fuel Price Adders
RPS adder – If no change is reported, then “Controls” tab values are used.
Energy security – If no change is reported, then “Controls” tab values are used.
Utility Projections
Total retail sales – If no change is reported, then “Controls” tab values are used.
RPS requirement – If no change is reported, then “Controls” tab values are used.
Program cost – If no change is reported, then “Controls” tab values are used.
Revenue requirement – If no change is reported, then “Controls” tab values are used.


Electric Power Research Institute 3420 Hillview Avenue, Palo Alto, California 94304-1338 • PO Box 10412, Palo Alto, California 94303-0813 USA
800.313.3774 • 650.855.2121 • [email protected] • www.epri.com
The Electric Power Research Institute, Inc. (EPRI, www.epri.com)
conducts research and development relating to the generation, delivery
and use of electricity for the benefit of the public. An independent,
nonprofit organization, EPRI brings together its scientists and engineers
as well as experts from academia and industry to help address
challenges in electricity, including reliability, efficiency, affordability,
health, safety and the environment. EPRI members represent 90% of the
electric utility revenue in the United States with international participation
in 35 countries. EPRI’s principal offices and laboratories are located in
Palo Alto, Calif.; Charlotte, N.C.; Knoxville, Tenn.; and Lenox, Mass.
Together...Shaping the Future of Electricity
© 2016 Electric Power Research Institute (EPRI), Inc. All rights reserved. Electric Power Research Institute, EPRI, and TOGETHER...SHAPING THE FUTURE OF ELECTRICITY are registered service marks of the Electric Power Research Institute, Inc.
Export Control RestrictionsAccess to and use of EPRI Intellectual Property is granted with the spe-
cific understanding and requirement that responsibility for ensuring full
compliance with all applicable U.S. and foreign export laws and regu-
lations is being undertaken by you and your company. This includes
an obligation to ensure that any individual receiving access hereunder
who is not a U.S. citizen or permanent U.S. resident is permitted access
under applicable U.S. and foreign export laws and regulations. In the
event you are uncertain whether you or your company may lawfully
obtain access to this EPRI Intellectual Property, you acknowledge that it
is your obligation to consult with your company’s legal counsel to deter-
mine whether this access is lawful. Although EPRI may make available
on a case-by-case basis an informal assessment of the applicable U.S.
export classification for specific EPRI Intellectual Property, you and your
company acknowledge that this assessment is solely for informational
purposes and not for reliance purposes. You and your company ac-
knowledge that it is still the obligation of you and your company to make
your own assessment of the applicable U.S. export classification and
ensure compliance accordingly. You and your company understand and
acknowledge your obligations to make a prompt report to EPRI and the
appropriate authorities regarding any access to or use of EPRI Intellec-
tual Property hereunder that may be in violation of applicable U.S. or
foreign export laws or regulations.
Program:
Electric Transportation
3002007751