the sun: earth's external heat engine spn#32
TRANSCRIPT
THE SUN: EARTH’S EXTERNAL HEAT ENGINE Part 1 of the Astronomy Model
SPN LESSON #32
TEACHER INFORMATION LEARNING OUTCOME After completing modeling activities, students are able to describe the structure of the Sun and cite variables that control Earth’s solar energy supply.
LESSON OVERVIEW Students become familiar with the variables that control Earth’s solar energy supply. After exploring the source and nature of solar energy, the genesis of radiation, and the structure of the Sun, gas spectra are observed and sample astronomical spectra are analyzed. Mathematical models are developed and used to make calculations for the following astronomical variables that control solar energy availability on Earth.
1. the yearly variations in Earth-to-Sun distance as the cause of seasons; and 2. the differences in Earth’s polar versus equatorial distance to the Sun as the cause
of equatorial and polar climates. In Part 2, SPN #33, a scale model of Earth’s orbit is mathematically modeled and evaluated, locations of Earth on that orbit are determined, and a model of Earth is used to study the effect of latitude on the availability of sunlight energy at Earth’s surface. Also, models of Earth are used to measure sunlight angles at solar noon and to compare length of daylight for various latitudes at the solstices and equinoxes.
GRADE-LEVEL APPROPRIATENESS This Level II or III Physical Setting lesson is designed for students in grades 8–12 who are enrolled in Regents Earth Science.
MATERIALS
Calculator (for each student team) Spectroscope (for each student) Emission Spectra wall chart Gas tubes of various elements, including hydrogen Gas tube sockets New York State Earth Science Reference Tables
nyserda.ny.gov/School-Power-Naturally

The Sun: Earth’s External Heat Engine, Part 1 Physical Setting, Earth science; Levels II and III
32.2
SAFETY Students should be warned not to touch the high-voltage gas tube sockets except to turn them on or off. They should also be warned to not look directly at the Sun when they view the sky light with their spectroscopes.
TEACHING THE LESSON Set aside approximately six class periods for this lesson, including two periods for laboratory observations plus homework time to complete the activity.
ACCEPTABLE RESPONSES FOR DEVELOP YOUR UNDERSTANDING SECTION
SECTION A:
PART 1:
1. a) A = 386,000 km; B = 696,000 km b) 1.8 times greater 2. Because the temperature is so high that they have melted and then evaporated 3. a) 7000oC b) 7273 K 4. a) hydrogen b) Atoms of hydrogen are fusing together to form helium.
5. a) infrared and visible light b) no ultraviolet c) [This is a good opportunity to
expose your students to conversion factors—a multiplier fraction that has equivalent terms of different units at the top and bottom.] So:
1 centimeter
9613 A = 9.613 x 103 X 108 angstroms = 9.613 x 10⁻⁵ cm d) Only the radiation having wavelengths between 4000 and 7000 A
6. a) Total radiation output increases (the area under the curve is greater). b) The peak radiation wavelength shifts to the left (to a shorter, more energetic
wavelength). Another possible response: Shorter wavelength (ultraviolet) radiation is emitted.
7. a) The wavelength of the peak radiation shortens from 9613 A to 4800 A. b) 4.8 x 10 –5 cm falls in the blue section of the visible spectrum. c) Student response should be < 4800 A. [Wien’s Law allows direct computation of the wavelength by the formula: λ max = a/T, where λ is the wavelength in angstroms, a = 2.89 x 10⁷, and T is the absolute temperature: 2.89 x 10⁷/ 8 x 103 = 3613 A]
d) ultraviolet 8. The 5500 K line should be drawn approximately halfway between the 5000 K line and the 6000 K line. The peak should be 5255 K. 9. The total amount of radiation increases, the peak radiation moves to shorter wavelengths, and shorter wavelengths are radiated.
10. approximately 6000 K 11. Appropriate responses would describe the process of the absorption of the outward moving heat energy by the overlying material it encounters on its long trip to the surface.

The Sun: Earth’s External Heat Engine, Part 1 Physical Setting, Earth science; Levels II and III
32.3
12. a) The student-drawn line should trace the circle that passes over the top of the sunspot shown. b) 6000 K or 6273o C 13. convection
PART 2:
14. Vc
15. a) It is shorter. b) Vc represents more energy than the others. c) Yes. d) These wavelengths are in the visible part of the electromagnetic spectrum.
16. Va produces a red line, Vb produces a blue line (almost green), and Vc produces a blue line (almost violet).
17. a) UVd b) more c) No. d) It is shorter than blue, probably ultraviolet. 18. A nearly continuous spectrum
SECTION B:
1. violet 2. red 3. The longer the wavelength, the less the degree of refraction 4. a) longer wavelengths than red b) shorter wavelengths than violet
c) a = infrared, b = ultraviolet 5. A complete visible spectrum like the rainbow 6. a) 4 x 10⁻⁵ b) 7 x 10⁻⁵
7. a) violet b) red 8. The color bands should be directly above the color names below the spectrum
form. 9. The sky spectrum is the same as the classroom lights. 10. Yes, the hydrogen spectrum has the three spectral lines, as expected. 11. Responses will vary according to gas samples selected. 12. That more distant galaxies are moving faster than those closer to Earth 13. They shift toward the ultraviolet end of the spectrum (shorter wavelength). 14. The granules are the tops of the convection cells in the convection zone.
Alternating up-and-down currents across the slit of the spectroscope cause side- by-side red and blue shifts, making the spectral lines zigzag.
15. The blue shift seen in light from the left side of the Sun indicates that the left side is moving toward Earth. The right-side red shift indicates that the right side is moving away from Earth. Taken together, they indicate that the Sun rotates.
16. a) The gases are rising at us and falling away from us. b) Since the slit of the spectroscope covers a portion of the Sun’s surface, gases within that portion are both rising toward us and falling away from us back into the Sun. c) Motion away from us causes a red shift and motion toward us causes a blue shift. So the line zigzags.
17. a) Shifted toward the blue end of the spectrum b) That it spins on its axis: the left side spins toward us (blue shift) and the right side spins away from us (red shift) c) A gas in space between Earth and the Sun (a good guess) but actually its absorption by oxygen gas within Earth’s atmosphere

The Sun: Earth’s External Heat Engine, Part 1 Physical Setting, Earth science; Levels II and III
32.4
18. a) Orionis rotates on its axis. b) Since the star is only a spot of distant light, we receive light from the whole surface simultaneously. Thus the radiation is shifted both to the red from the side spinning away from us and to the blue by the side spinning toward us. That motion also dilutes the intensity of the light because the line is spread.
SECTION C:
1. a) 4 squares b) ¼ c) ¼ 2. a) 1/9 b) yes 3. a) 1/16 ( b + c)
Chart: Distance
from Light
Amount of Original Light in Small Square
Light Intensity
1 1 1 2 1/4 1/4 3 1/9 1/9 4 1/16 1/16 5 1/25 1/25
Graph: 1
Light .5
Intensity
0 1 2 3 4 5 6 7
4. a) I2 = 1/22 b) I3 = 1/32 and I4 = 1/42 c) Id = 1/d2
5. a) summer (is typical) b) warmer (is typical) 6. 945/915 = 1.033 of Dmin
7. 10 cal/ (Dmin)2 = 10 cal/ (1.033)2 = 10 cal/1.067 = 9.4 cal 8. a) 9.4 cal b) 94% of winter sunlight c) does not
SECTION D: 1. 6052 km 2. 12,756 km/ 2 = 6,378 km, the radius of Earth x .62137 = 3963.1 miles 3. Hopefully not 4. Using 93,000,000 miles as the average Earth-to-Sun distance, the change in
radiation intensity is: 93,003,963 mi/93,000,000 = 1.0000426 of Dave.

The Sun: Earth’s External Heat Engine, Part 1 Physical Setting, Earth science; Levels II and III
32.5
5. a) If we use the same 10 calories as above, then 10 cal/ 1.0000852 = 9.999 cal or 99.9% of the radiation received at the equator. b) No.
Conclusions: 1. Nuclear fusion of hydrogen to helium. 2. Electrons of atoms dropping from a higher to a lower energy level. 3. Shifted to longer wavelength—a red shift. 4. No, the Northern Hemisphere is warmer when we are farther away from the Sun. 5. Not really significant—only a miniscule amount of change in energy.
ADDITIONAL SUPPORT FOR TEACHERS
SOURCE FOR THIS ADAPTED ACTIVITY This is not an adapted lesson.
BACKGROUND INFORMATION
Energy and the Development of Stars: Most of the necessary details for
students on the origin of solar radiation are included in the text of this activity. Current scientific belief is that the contraction of nebular gases and dust, caused by the growing gravitational forces associated with the protoSun’s increasing mass, changed gravitational energy into heat (as proposed by Helmholtz in the mid-1800s). Developing stars of this type are generally located above and to the right of the main sequence stars on the Hertzsprung-Russell diagram. Using models based on the assumption that stars are essentially large gaseous balls in space, the basic gas law (pressure x volume = gas constant x absolute temperature) leads to the interpretation that central temperatures within the Sun are approximately 15 x 106 K. Such high temperatures allow hydrogen nuclei to collide to form deuterium (heavy hydrogen), which collides with another hydrogen nucleus to form the helium isotope, He3, which in turn combines with another He3 to form helium, He4. During this process, according to Einstein’s E = mc2, 0.03 atomic mass units are converted to gamma ray energy. This conversion begins the radiation processes we eventually experience as insolation on Earth.
As long as the supply of hydrogen is sufficient, stars remain within the main sequence for a period of time inversely related to their mass. As hydrogen within the core nears exhaustion, the star contracts and increases slightly in both temperature and luminosity briefly until the hydrogen is consumed. At this point, hydrogen within the shell surrounding the core undergoes fusion to helium causing the star’s atmosphere to greatly expand in size and creating a much larger and cooler radiative surface: the red giant phase. These stages in stellar evolution—from the main sequence to the red giant stage—are shown in the diagram sequence on the next page.

The Sun: Earth’s External Heat Engine, Part 1 Physical Setting, Earth science; Levels II and III
32.6
(Modified from McLaughlin, Introduction to Astronomy, 1961, p. 382)
During this phase, the newly created shell helium accumulates in the core until approximately 40% of the star’s mass is located there. The core contracts gravitationally, causing core temperatures to exceed 140 x 106 K. This process in turn causes helium to begin to fuse with carbon and it also causes the temperature of the surface to increase. This will probably be the highest fusion process the Sun will be capable of undertaking, but larger stars will be able to fuse larger and larger atoms according to the star mass. Stars up to 1.4 times the mass of the Sun will gradually consume their nuclear fuel and collapse in size, eventually forming a white dwarf star of decreased luminosity and temperature. A complete life cycle of the Sun as represented by the Hertzsprung-Russell diagram is shown below.
The Sun: Earth’s External Heat Engine, Part 1 Physical Setting, Earth science; Levels II and III
32.7
The Source of Radiation, Quantum Theory, and the Quantum Mechanical Model: The exercise text provides a simplified explanation and models concerning quantum theory. This information should alleviate most student concerns regarding the source of radiation. Teachers should be aware that the relationship between radiation emission and electron quantum drops was first discovered within the hydrogen atom and that the process occurs in the more complex elements. More recent developments have led to mathematical probability models concerning the location and movement of electrons about the atomic nucleus. These models are too abstract for most Earth science students.
Emphasize that the bright line spectra are produced by gases at high temperatures and that these same gases are capable of absorbing the same wavelengths of radiation that they produce: creating a dark line spectrum.
REFERENCES FOR BACKGROUND INFORMATION
Baker, Robert: Astronomy, Van Nostrand, 1964. Strahler, Arthur: The Earth Sciences, Harper & Row, 1963. This book in any of its many editions is an invaluable reference. McLaughlin, Dean: Introduction to Astronomy, Houghton Mifflin, 1961. Skilling, William and Richardson, Robert: Astronomy, Holt, 1948.
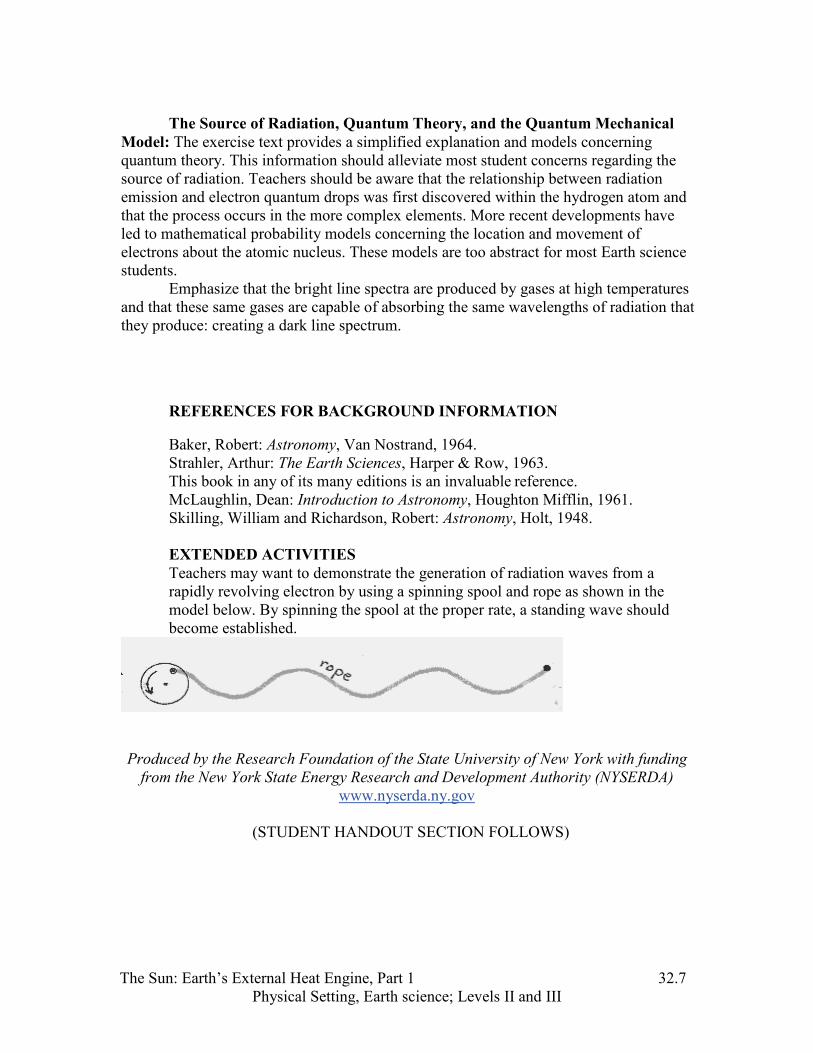
EXTENDED ACTIVITIES Teachers may want to demonstrate the generation of radiation waves from a rapidly revolving electron by using a spinning spool and rope as shown in the model below. By spinning the spool at the proper rate, a standing wave should become established.
Produced by the Research Foundation of the State University of New York with funding from the New York State Energy Research and Development Authority (NYSERDA)
www.nyserda.ny.gov
(STUDENT HANDOUT SECTION FOLLOWS)
32.1
Name Date
THE SUN: EARTH’S EXTERNAL HEAT ENGINE Part 1 of the Astronomy Model
SECTION A: The Structure of the Sun and the Source of Solar Radiation
As young children we learned that the Sun is Earth’s primary source of light and external heat. We observed the daytime-nighttime cycle early on, and learned to expect and appreciate the warmth of the Sun’s rays on a cool morning and the change of seasons from winter to spring. Here an opportunity is provided to build upon your youthful understandings of these natural patterns, as you learn more about the Sun. So,
a. What is the source of the Sun’s light energy? b. How is this energy produced? c. How does this energy get to us on Earth’s surface?
What do you know now about these three questions? Even if you don’t know how to respond for sure, compose a hypothesis that could turn out to be the appropriate response for each:
a.
b.
c.

The Sun: Earth’s External Heat Engine, Part 1 32.2
PART 1: The Sun
Diagram 1: The Relative Size of the Sun Compared to Moon’s Orbit and Earth
(Modified from Skilling, Astronomy, 1948, p. 207)
1. The Sun is a huge, 864,000-mile-diameter sphere consisting of compressed gases that have been heated to the plasma state. Its volume is 1.3 million times the volume of Earth.
(a) Using your Earth Science Reference Tables, determine the values of A and B in the diagram above in kilometers:
A = km
B = km
(b) How much larger is the Sun’s diameter than the diameter of the orbit of Earth’s moon?
2. The Sun’s mass is 330,000 times greater than that of Earth, producing a surface gravity 34 times more than Earth’s. The effect of this tremendous gravity is to compress and thicken the Sun’s gases, making them unlike the density we observe in Earth’s gases. In addition, the components of this mix of gases within the Sun are not the components of Earth’s mix: most elements listed on the chemical periodic table have been identified in the gaseous mix of the Sun. So more than just hydrogen and helium are present. For instance, substances such as iron, gold, and copper, to name a few, have been identified.

The Sun: Earth’s External Heat Engine, Part 1 32.3
On the Sun these substances are gaseous metals. Explain why such substances are gases on the Sun.
The response that they are in the gaseous state because it’s so hot there is fine, but how hot is it? What is the source of this tremendous heat? How do we know the composition of the Sun? The questions never end in science and it’s difficult for the answers to keep pace.
3. Before scientists knew that nuclear reactions existed, they assumed that the primary cause of the Sun’s heat was gravitational: that the heat was produced by the gravitational compression of the nebular material from which the Sun was formed. [They believed that the compression was created as the nebular material from which the Sun was formed collected and collapsed upon itself.] This same kind of process, in part, accounts for some of the residual heat found within Earth’s interior. By the way, this residual heat is believed to be partially responsible for the convection cells that move Earth’s surface tectonic plates.
(a) Using your Earth Science Reference Tables, determine how much Earth’s temperature increases from the surface to the center of the core.
degrees C
(b) Using a Kelvin chart, what would this number be?
4. But since the Sun is so much larger than Earth, gravitational forces produced more energy within the Sun than they did within Earth. Scientists now believe that this gravitational energy created so much heat that it started another energy mechanism. This mechanism, which now accounts for the majority of the Sun’s energy output, is the nuclear fusion of hydrogen (thought to comprise 90% of the Sun’s composition) into helium (8% of the Sun’s composition). The nuclear processes began as the internal temperature of the Sun rose above 1,000,000 Kelvin. Finally, at a temperature of 1.5 x 10⁷, the hydrogen-to-helium fusion reaction began. Small amounts of the mass of the reacting atoms are converted into energy. Some of this energy eventually escapes from the Sun in the form of electromagnetic radiation.
(a) What is the most abundant element found within the Sun?
(b) What is happening to that element within the Sun’s core?

The Sun: Earth’s External Heat Engine, Part 1 32.4
5. Diagram 2 below shows how the amounts and kinds of radiation from sources having different temperatures differ. Each solid graphed line shows the relative amounts of radiation emitted at various wavelengths by sources at five different temperatures. The height of the graph line indicates the amount of radiation emitted at a particular wavelength. The diagram provides numerous graphical details about radiation in general and the Sun in particular.
Diagram 2: Emission Spectra from Sources Having Different Temperature
Type of Radiation and Wavelengths (in 10-8 cm) (Modified from Skilling, Astronomy, 1948, p. 312)
Find the bottommost graph line (labeled 3000 K) in diagram 2.
(a) According to this line, most of the radiation given off from a source of this temperature falls in which portion of the electromagnetic spectrum?
(b) In general terms, how much ultraviolet radiation is emitted from this temperature source?

The Sun: Earth’s External Heat Engine, Part 1 32.5
(c) A point on this line is labeled 9613 (angstroms). Although it is difficult to see this point on such a flat line, it indicates the highest point on the curve: the wavelength of radiation produced in the greatest abundance by a source at this temperature. Since 108
angstroms equals 1 centimeter, how many centimeters long is a wavelength of this radiation?
cm
(d) Which, if any, of this radiation is visible to humans?
6. Describe two changes that occur in the radiation output as the temperature of a radiation source increases from 3000 K to 4000 K. (a)
(b)
7. (a) Describe the pattern of change in the wavelength of the peak radiation as the temperature changes from 3000 K to 6000 K.
(b) Using your Earth Science Reference Tables chart on page 14, describe what we would “see” if we looked only at the light of this peak wavelength of radiation produced at 6000 K.
(c) When the temperature of the source is 8000 K, at what wavelength would the greatest amount of radiation be given off?
(d) In what part of the electromagnetic spectrum is this peak?
8. On diagram 2, draw the graph of the radiation produced by a radiation source at a temperature of 5500 K.
9. In summary, describe what this graph reveals about the amount and type of radiation
coming from an object as the temperature of the object increases.
Amount
Type
10. Previously we learned that the Sun’s temperature was in the millions of degrees. But what does this graph tell us about the temperature of the Sun?
The Sun: Earth’s External Heat Engine, Part 1 32.6
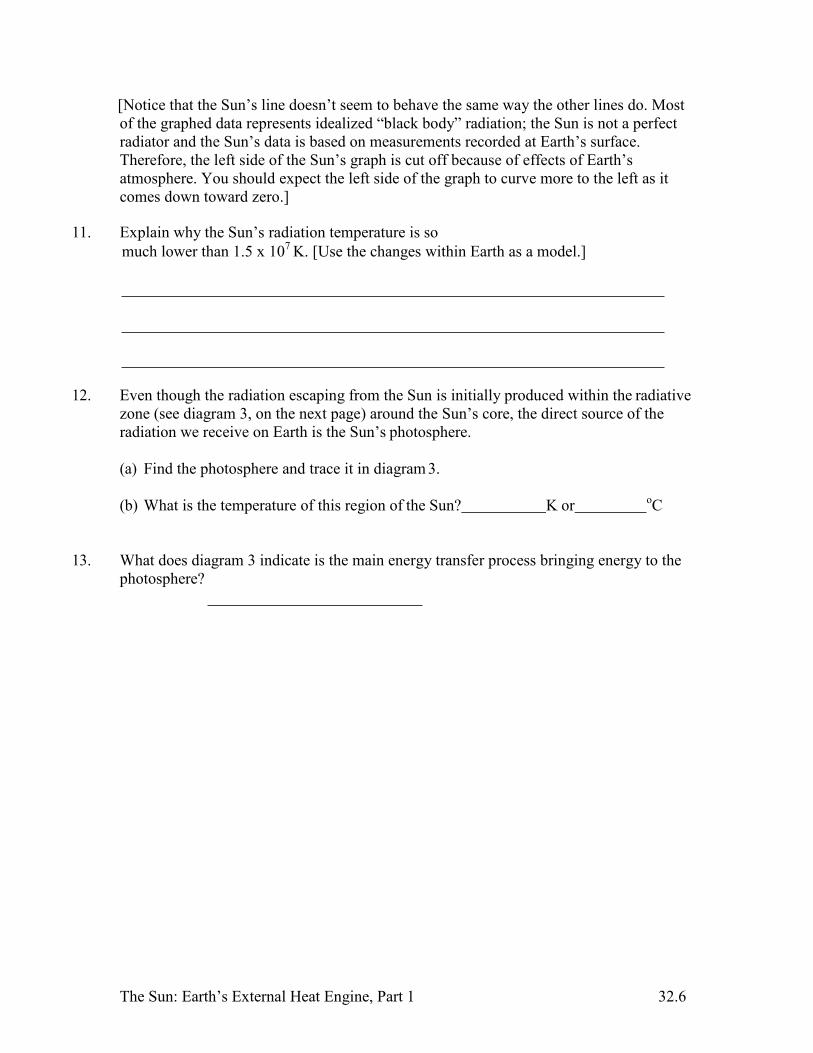
[Notice that the Sun’s line doesn’t seem to behave the same way the other lines do. Most of the graphed data represents idealized “black body” radiation; the Sun is not a perfect radiator and the Sun’s data is based on measurements recorded at Earth’s surface. Therefore, the left side of the Sun’s graph is cut off because of effects of Earth’s atmosphere. You should expect the left side of the graph to curve more to the left as it comes down toward zero.]
11. Explain why the Sun’s radiation temperature is so
much lower than 1.5 x 10⁷ K. [Use the changes within Earth as a model.]
12. Even though the radiation escaping from the Sun is initially produced within the radiative zone (see diagram 3, on the next page) around the Sun’s core, the direct source of the radiation we receive on Earth is the Sun’s photosphere.
(a) Find the photosphere and trace it in diagram 3.
(b) What is the temperature of this region of the Sun? K or oC
13. What does diagram 3 indicate is the main energy transfer process bringing energy to the photosphere?

The Sun: Earth’s External Heat Engine, Part 1 32.7
Diagram 3: The Structure of the Sun
(Modified from McLaughlin, Introduction to Astronomy, 1961, p. 236)
PART 2: The Source of Radiation
But where does all this radiation come from at the photosphere, and what is its actual source? Why does radiation have a wavelength? And why does it behave like a wave on the ocean? Diagram 4 below may help you to respond to these questions. This diagram is a drawing of a hydrogen atom; more accurately, the diagram might be described as a scale model of a hydrogen atom. Some chemistry review is helpful to understand the model. [There are numerous resources on this topic if you want additional information.]
The atom of hydrogen is as simple as atoms get: it has a nucleus composed of one proton that is positively charged, and it has one negatively charged electron whirling around that proton. It is this whirling electron that is the ultimate source of the radiation produced by the hydrogen atom. If you look on the left side of diagram 4, you will see a black dot that represents the nucleus of the hydrogen atom. You will notice that the next circle out from the nucleus is labeled “Ground State” as well as “Energy Level 1.” This is the normal home for hydrogen’s electron—the approximate location of the electron’s orbit under normal conditions.

The Sun: Earth’s External Heat Engine, Part 1 32.8
Diagram 4: A Model of Hydrogen and Some Wavelengths of Electromagnetic Energy Produced by Loss of Energy by Hydrogen’s Electron When Changing Energy Levels
(Modified from McLaughlin, Introduction to Astronomy, 1961, p. 303) However, conditions on the Sun are far different from normal conditions as we conceive of them. The approximate 6000 Kelvin temperature at the Sun’s photosphere, the source of most solar radiation, provides tremendous amounts of heat energy that the electron can absorb. All of the solar gases present are moving at very high velocities and crashing continuously into one another. These factors tend to constantly supply energy to, and excite, hydrogen’s electron.
According to classic quantum theory proposed by Max Planck, the electron jumps from the lowest energy level, the ground state, to one of several higher energy levels, shown by the curving concentric lines depicting energy levels in diagram 4. The amount of the jump is determined by the specific amount of energy absorbed. Planck determined that when the electron falls back from one of these higher levels toward the nucleus of the atom, as shown by the right-to-left arrows in diagram 4, a certain amount (a quantum) of energy is released from the rapidly revolving electron. The amount of energy is determined by which level the excited electron occupies and how far back toward the nucleus the electron falls.

The Sun: Earth’s External Heat Engine, Part 1 32.9
The important outcome of Planck’s work can be seen in diagram 4 in the relationship between the energy drops labeled Va, Vb, and Vc, and the wavelengths of electromagnetic energy that these drops produce.
14. Since the arrows represent three possible changes in energy level by the hydrogen
electron, which arrow represents the greatest drop in energy?
If you answered “Vc,” you were correct, but why did you choose this response? Logically it seems to make sense that since Vc falls farther than either Va or Vb, then Vc’s change should release more energy. It does, in the same way that the farther a rock is from the floor when it is dropped, the louder the noise it makes when it hits.
15. Another way to determine your response to question 14 is to look at the wavelength of
radiation produced by each of these electron movements. The upside-down y symbol is lambda, the symbol for wavelength. (a) How does the wavelength produced by Vc compare to the wavelengths of Va and Vb?
(b) Which wavelength represents the greatest amount of energy?
(c) Can humans see either one of these wavelengths of radiation?
(d) Why?
16. Each time the electron falls inward toward the nucleus through these transitions, exactly the same amount of energy is released, producing these particular wavelengths of visible light radiation. On the blank spectrum form below, draw these three lines in the correct location using the appropriate color of pencil.
17. Notice that for each of the quantum changes that produce visible light, the electron only falls as far as energy level 2, not all the way to the ground state. There are times when the electron falls all the way from energy level 5 inward to the lowest energy level.

The Sun: Earth’s External Heat Engine, Part 1 32.10
(a) Which labeled arrow shows this movement?
(b) Does this change release more or less energy than change Vc?
(c) Do you think humans can see this radiation?
(d) Support your response.
18. Planck’s model requires that hydrogen can emit only very specific wavelengths of radiation. If hydrogen gas were the only element producing radiation, the three lines you drew above would be all the light that we could see. However, hydrogen is not the only radiation-producing element: the electrons in each element behave in much the same way, producing wavelengths of radiation specific to each element—a fingerprint of radiation lines. Since most elements have a greater number of valence electrons than hydrogen, the number of changes possible is much greater and more complex. What is the combined result of all of the chemical elements (and compounds) producing radiation?
. SECTION B: Looking at Radiation: What Can We See?
Materials: Student spectroscope Colored pencil set Gas tubes Gas tube sockets Spectrum Analysis wall chart
The spectroscope is a powerful instrument that allows astronomers to do their work. While their spectroscopes may be a bit more sophisticated than the ones you will use in this activity, they all work about the same way. Since light has wave properties, it bends (diffracts) when it passes from one medium into another of different density. Different wavelengths diffract at different angles. As white light passes through a triangular prism or diffraction grating, it separates and looks like a rainbow, as shown in diagram 1 on the next page.

The Sun: Earth’s External Heat Engine, Part 1 32.11
Diagram 1: Refraction of White Light Radiation by a Glass Prism
1. Which color is diffracted the most?
2. Which color is diffracted the least?
3. State the relationship between wavelength and the degree of diffraction that occurs when radiation passes from one medium into another.
4. (a) What wavelengths of radiation would you expect in the area indicated by R?
(b) In the area indicated by V?
(c) What types of radiation are these? (a) R is and
(b) V is
So, light that may look like one color is often made up of several separate color bands of light of several different wavelengths. Let’s look at some other examples of this phenomenon using a diffraction grating in a spectroscope to separate the wavelengths in place of the prism.

The Sun: Earth’s External Heat Engine, Part 1 32.12
5. Your spectroscope has an eyepiece for you to look through. On most student lab spectroscopes, this piece is located at the narrow end. Look through the eyepiece while you aim the other end at a classroom light. What do you see?
6. You should see a numbered scale occupying most of the view. What are the numbers at the ends of this scale?
(a) and (b)
7. These numbers correspond to wavelengths of the electromagnetic spectrum. Use your Earth Science Reference Tables to determine what kind of light they represent.
(a) and (b)
8. On one side of the number scale, you should see a narrow vertical slit. If that slit is aimed near the classroom light, you should see the vertical bands of color produced by that light source. In the space provided below, draw these color bands at the proper locations on the wavelength scale.
9. Look at the blue sky next. DO NOT LOOK AT THE SUN. Draw the colored
spectrum that you see through your spectroscope. Once again, pay attention to where you place the colors on the wavelength scale.

The Sun: Earth’s External Heat Engine, Part 1 32.13
10. Since the Sun is composed of most of the elements known, the spectrum produced by the Sun provides a fairly continuous band of wavelengths in the visible portion of the electromagnetic spectrum. However, as you have previously learned, not all gaseous light sources produce this type of spectrum. When only one chemical element is present in the radiation source, the radiation produced is more like the hydrogen spectrum previously discussed. Look at the hydrogen gas light source and compare it to your previous drawing of the hydrogen spectrum. Are the same three lines visible?
11. Use your spectroscope to study each of the other gas tube light sources around the room. Be careful not to touch the tube bases—they carry high voltages and are delicate. Carefully record the bands of light produced by each of these sources in the blank spectrograph forms provided on the next page. Accurately record the color of each band and its proper location along the wavelength scale.

The Sun: Earth’s External Heat Engine, Part 1 32.14

The Sun: Earth’s External Heat Engine, Part 1 32.15
12. After you have recorded your observations, identify each of the unknown gases by comparing your data with the spectral fingerprint of the elements shown on the wall chart (or other source provided by your teacher). Write the name of the identified unknowns in the spaces provided above.
Now that you have some understanding of how a spectroscope functions and knowledge of the variety and uniqueness of patterns produced by various chemical elements, let’s look at some of the ways astronomers use the spectroscope.
13. One of the most important discoveries concerning the formation of the universe
resulted from the study of radiation coming to Earth from distant galaxies. When studying the spectrum fingerprints from known chemical elements found in these galaxies, scientists discovered that each of the visible light spectral lines was shifted toward the red end of the spectrum. This is known as a red shift. The conclusion drawn from this observation was that these galaxies were moving away from Earth and that the motion of the source made the wavelength longer. An additional conclusion was that the greater the amount of the red shift, the faster the stars were moving away from Earth. Chart 1 on the next page shows the inferred velocities of some of these distant galaxies.

The Sun: Earth’s External Heat Engine, Part 1 32.16
Chart 1: The Velocities of Distant Galaxies and Their Distance from Earth
Nebular Cluster
Distance from Earth (in 106 light years)
Velocity away from Earth (in km/sec)
Virgo 38 1,136 Pegasus I 124 3,810 Perseus 173 5,430 Coma 190 6,657 Hercules 340 10,400 Pegasus II 470 12,800 U. Ma. I 720 15,500 Cor. Bor. 810 21,650 Gemini 980 23,400 Bootes 1500 39,400 U. Ma. II 1500 40,400 Hydra 1880 60,000
Create a line graph of this data on graph 1 below, using an appropriate scale and labeling the vertical axis.
Graph 1: Relationship Between Distance from Earth and Velocity of Star Clusters
0 1 2 3 4 5 6 7 8 9 10 11 12 13 14 15 16 17 18 19 20
Distance from Earth (in 106 light years) 14. The upper portion of diagram 1 on the next page shows radiation waves of a
particular frequency being emitted to the left and right from a stationary object. Demonstrate that you understand the concept of a red shift by showing how the same wavelength of radiation would appear if the source were moving to the right and the radiation were moving to the left.

The Sun: Earth’s External Heat Engine, Part 1 32.17
Diagram 1: Radiation from a Stationary Source and a Moving Source
These observations are the underpinnings of the big bang theory, which states that a large explosion formed the universe. The rapid outward movement of the galaxies as indicated by the red shift is evidence of the continued expansion of the universe.
15. If an object giving off radiation is moving toward Earth through space, how
do the spectral lines change?
In the lower section of diagram 1 above, show how the radiation shown in the upper section of the diagram would change when emitted from a moving object by drawing a radiation wave traveling to the right.
Let’s investigate some other information that spectroscopes have revealed about the Sun and other stars. Look at the dark line absorption spectra below and see if you can interpret them. Gaseous elements that emit specific spectral lines also absorb those specific wavelengths of radiation (as do the greenhouse gases in Earth’s atmosphere). Some spectra have been altered a little to make them more visible, and it is helpful in understanding the spectra for you to know that several of the effects shown are the result of the red and blue shifts explored in steps 13 and 14 above.
16. Look carefully at the enlarged spectral lines in Spectrum A. These spectral lines
show the odd behavior of the radiation from a small region of the gases above the surface of the Sun’s photosphere. The patterns of the lines themselves are a bit blurry, so an example line has been added to the right. It may help if you go back to diagram 3 in the previous section to review that the photosphere is the top of the Sun’s convection layer. But note also that the reversing layer, as well as the chromosphere and the corona, are composed of hot gases as indicated by the spicules, prominences, and streamers.

The Sun: Earth’s External Heat Engine, Part 1 32.18
(a) What kind of motion is occurring in this region of the Sun?
(b) How does this help us interpret the spectrum from the photosphere’s surface? Spectrum A: The Sun’s Atmosphere
(Modified from McLaughlin, Introduction to Astronomy, p. 242)
(c) Why do these spectral lines zigzag as shown in the example line to the right?
17. The spectra below were made from a location on Earth and show two spectra from the Sun: one from the right edge and one from the left. Notice in particular the absorption lines marked by the arrows below the left-side spectrum.
(a) What has happened to those lines in the spectrum above?
(b) Actually, the lines both above and below have shifted. What do you think this shift indicates about the Sun?
(c) The nonmoving lines in these spectra are telluric lines, which are also lines produced by the absorption of solar radiation. Where do you think this absorption occurs?

The Sun: Earth’s External Heat Engine, Part 1 32.19
Spectra B: The Two Edges of the Sun
18. The spectra below show the same three radiation lines from two stars. The lines from Orionis have been darkened to make them more visible.
(a) Which star rotates and which one does not?
(b) How can you tell?
Spectra C: Spectra of Two Stars: One Rotates, One Does Not
(from McLaughlin, Introduction to Astronomy, p. 311)
SECTION C: Solar Misconception 1 Are seasons in New York State caused by
changes in the Earth-to-Sun distance? PRELAB PREPARATION:
The Sun provides the energy that warms the surface of Earth as Earth moves in its elliptical orbit around the Sun. On the basis of your personal experiences with other sources of radiant energy such as campfires or room radiators, you probably understand that the closer you stand to a source of energy, the more heat you feel. So when you first find out that the distance between the Sun and Earth is not constant, many of you logically conclude that:
(a) when our season is warm (as in summer), Earth must be closer to the Sun; and
(b) when our season is cold (as in winter), we must be farther away from the Sun.

The Sun: Earth’s External Heat Engine, Part 1 32.20
Has this been part of your thinking? Let’s see how important this change in Sun-to-Earth distance is.
An increase in distance from a radiation source does reduce the amount of energy from that source, but why and by how much? The intensity of the radiation is reduced according to the pattern shown in diagram 1 below. Essentially the radiation, and therefore the amount of energy received, spreads out as shown in the diagram below.
Diagram 1: The Change in Intensity of Radiation as Distance from the Source Increases
(from Skilling, Astronomy, 1948, p. 31) To evaluate how the change in distance between the Sun and Earth affects the amount of radiation received by Earth, we need a mathematical relationship between distance and radiation intensity. We can determine this relationship from diagram 1. The numbers 1, 2 and 3 in the diagram indicate the distance from the light source. In the first square at a distance of one unit from the light source, the light fills an area of one square.
1. (a) How many squares does the radiation spread out to fill at a distance of two units from the light source?
(b) How much of the original light energy passes through each of these four small squares? of the original energy
(c) So, if the distance doubles, the radiation intensity decreases to only a fraction of the original amount. This fraction is: 1/2 1/4 1/6 1/8 (circle one) of the original intensity.
2. (a) After the light has traveled a distance of three units, how much of the original
light energy passes through one of the small squares?
(b) Is the light energy getting weaker (less intense) with increased distance from the light source?

The Sun: Earth’s External Heat Engine, Part 1 32.21
3. (a) How much of the original energy will pass through the area of one small square at a distance of four units from the candle?
Were you able to come up with the correct response of 1/16?
(b) Summarize the relationship between distance from the light source and the intensity of radiation by completing the chart below. (c) After labeling and filling in the vertical scale on the graph grid to the right, draw the line graph of this relationship.
Chart: Graph:
Distance from
Light
Amount of Original Light in Small Square
Light Intensity
1 2 3 4 5
0 1 2 3 4 5
Distance
4. Can you state this relationship as a mathematical formula? This task will be easier if you break it down into small steps.
(a) By now we’ve decided that if the distance from the light source is doubled, then the intensity of the light is reduced to 1/4 of what it was initially. Stated as an equation, we would say: Intensity at twice the distance = 1/4 or I2 = 1/4. What is the mathematical relationship between the change in distance (2) and the denominator of the fraction (4)?
The intensity of light at twice the distance =
(b) In the same way, I3 = and I4 = .
(c) And in general, Id =
5. This relationship, called the inverse square law, mathematically determines the changes in the amount of light energy received at locations at different relative distances from a light source such as the Sun. So to determine the relative change in insolation received by Earth in summer and winter, we need to know how much our distance from the Sun changes during the year. As you probably know at this point, the reason the
The Sun: Earth’s External Heat Engine, Part 1 32.22
distance between the Sun and Earth changes is that the orbit of Earth around the Sun is an ellipse, with the Sun located at one of the foci of the ellipse. How much does the Earth- to-Sun distance change during the year and when are we closer to the Sun? The closest that Earth gets to the Sun (this point is called perihelion) is approximately 91,500,000 miles. The furthest point (called aphelion) is a distance of 94,500,000 miles. These points lie at opposite ends of Earth’s orbit, marking the endpoints of the ellipse’s major axis. The Sun’s position is also located on this axis closer to the Earth at perihelion by 3,000,000 miles.
(a) At what time of year do you think Earth is closest to the Sun?
(b) Why do you think that? -
6. Many New York State students (as well as Harvard graduates) think Earth is closest to the Sun in our summer and farthest from the Sun in our winter. This is not the case. Perihelion occurs around January 5th, coinciding with some of our coldest weather. How can this be? It clearly means that the change in distance between the Sun and Earth is not all that important compared to other factors that control climate. Our previous discussion of the inverse square law can help us determine exactly how important this 3,000,000- mile change in distance is.
Remember that it’s the ratio between the two distances that you have to use. Let the perihelion distance of 91,500,000 miles be equal to one Earth-to-Sun distance. Let’s call this Distance minimum, or in symbols, Dmin.
Then how much is Distance maximum? We know it’s 94,500,000 miles, but relative to Dmin, it is 9.45 x 10⁷/ 9.15 x 10⁷ or 945/ 915, which equals: of Dmin.
7. For every 10 calories of energy received by Earth when we’re closest to the Sun, how much less do we receive when we are farthest from the Sun? (Use the space below to show your work.)
Work:
8. Because of the increase in Earth-to-Sun distance, in summer Earth receives
(a) calories for every 10 calories we receive in winter.
This is a decrease to (b) % of our winter sunlight!
The Sun: Earth’s External Heat Engine, Part 1 32.23
d South Pole
Obviously, even though there is a change in Earth’s energy supply between summer and winter, the change in distance from the Sun
(c) (does or does not) cause our change of seasons.
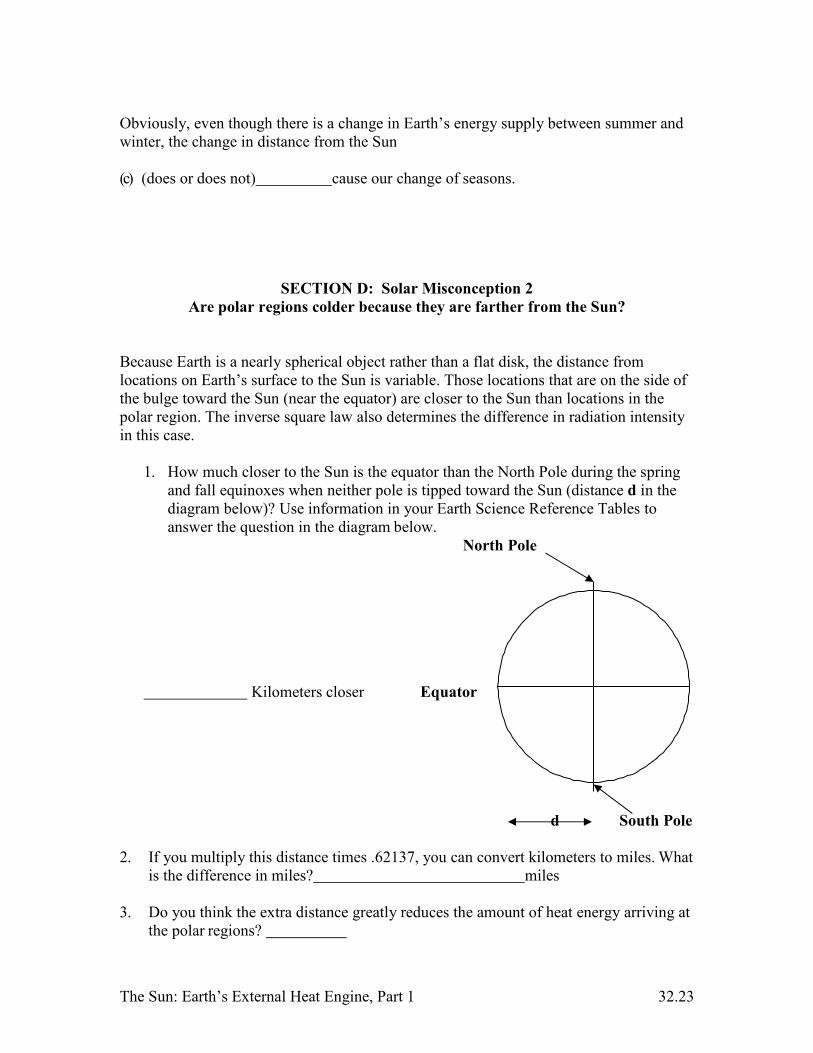
SECTION D: Solar Misconception 2 Are polar regions colder because they are farther from the Sun?
Because Earth is a nearly spherical object rather than a flat disk, the distance from locations on Earth’s surface to the Sun is variable. Those locations that are on the side of the bulge toward the Sun (near the equator) are closer to the Sun than locations in the polar region. The inverse square law also determines the difference in radiation intensity in this case.
1. How much closer to the Sun is the equator than the North Pole during the spring
and fall equinoxes when neither pole is tipped toward the Sun (distance d in the diagram below)? Use information in your Earth Science Reference Tables to answer the question in the diagram below.
North Pole
Kilometers closer Equator
2. If you multiply this distance times .62137, you can convert kilometers to miles. What is the difference in miles? miles
3. Do you think the extra distance greatly reduces the amount of heat energy arriving at
the polar regions?
The Sun: Earth’s External Heat Engine, Part 1 32.24
4. Using the same calculation method as in Section C above, calculate the effect that the greater distance from the Sun to the poles has on the radiation intensity. Show your work in the space below. Since we are using the equinox position, use the average Earth-to-Sun distance (93 x 106 miles) for the distance between the Sun and Earth.
Work: 5. The poles receive
(a) % of the heat energy received by the equator because of the
difference in distance from the source of that radiation, the Sun.
(b) Do you think this is why the poles are so much colder than the equator?
Conclusions:
1. What is the principal nuclear process occurring within the Sun’s core?
2. What is the source of electromagnetic radiation?
3. How does the electromagnetic radiation change when it comes from a source that is moving away from the observer?
4. Does the change in distance from the Sun cause summer and winter?
5. Are the poles colder than the equator because they are farther from the Sun?