the state of the staffing industry
TRANSCRIPT

© Copyright 2014 Inavero, Inc. All Rights Reserved. Net Promoter, NPS, and Net Promoter Score are trademarks of Satmetrix Systems, Inc., Bain & Company, and Fred Reichheld.
State of the Staffing Industry An Industry Report from Inavero & the American Staffing Association

Use of mobile devices continues to rise among staffing clients & talent
2
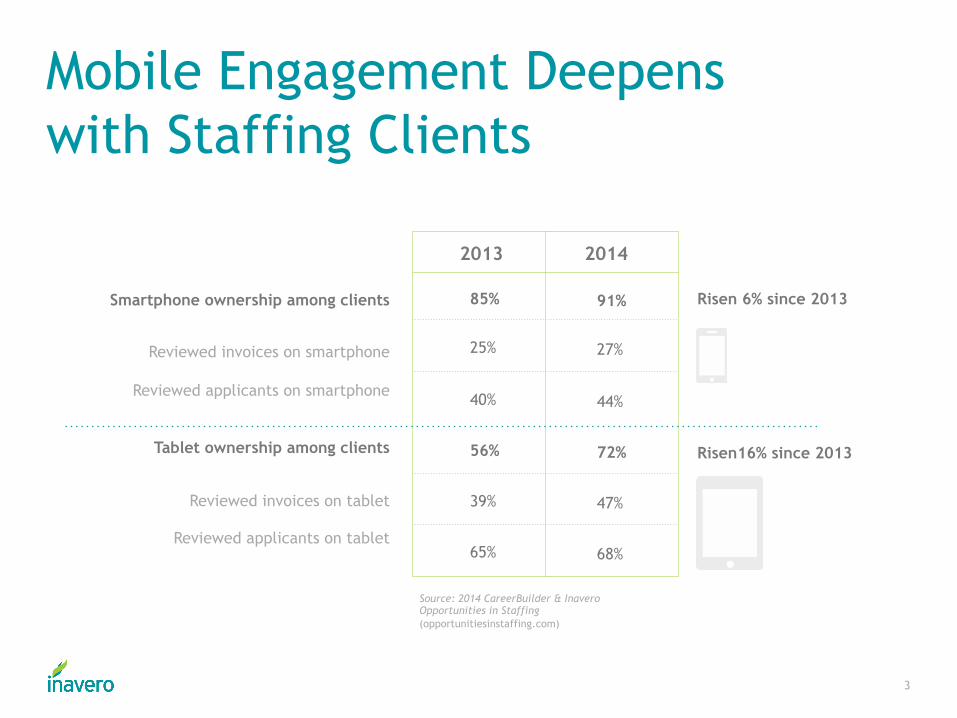
Mobile Engagement Deepens with Staffing Clients
3
Smartphone ownership among clients
Reviewed invoices on smartphone
Reviewed applicants on smartphone
Tablet ownership among clients
Reviewed invoices on tablet
Reviewed applicants on tablet
2013
85%
25%
40%
56%
39%
65%
2014
91%
27%
44%
72%
47%
68%
Risen 6% since 2013
Risen16% since 2013
Source: 2014 CareerBuilder & Inavero Opportunities in Staffing (opportunitiesinstaffing.com)

Job Candidates Use Tablets Extensively in Search
4
Smartphone ownership among talent
Looked for a job on a smartphone
Applied for a job on a smartphone
Tablet ownership among clients
Looked for a job on a tablet
Applied for a job on a tablet
2013
69%
67%
35%
37%
81%
53%
2014
76%
71%
44%
50%
89%
51%
Risen 6% since 2013
Risen16% since 2013
Source: 2014 CareerBuilder & Inavero Opportunities in Staffing (opportunitiesinstaffing.com)

5
What Does “Mobile-Optimized” Mean in the Staffing Industry?
Mobile
optimized
61%
Not
mobile
optimized
39%
% of Staffing Firms Whose Website is:
27%
% Who Believe Their Mobile Site Works “Very Well”

6
Lack of Mobile Optimization Can Negatively Effect a Staffing Agency
% of Whose Opinion Changes for the Worse if Staffing Site is Not Mobile Optimized:
63%
37%
0% 40% 80%
Clients
Job
Candidates

7
The Evolution of “Mobile Optimized” in the Staffing Industry
% of Staffing Firms Whose Mobile Website Allows People to:
78%
68%
50%
42%
42%
26%
25%
0% 40% 80%
Search for jobs
Apply for jobs
Find answers to common
questions
Reach out to speak to
someone directly
Find tools to help them
with their job search
Find tools to help when
they are on assignment
Submit timecards

Your brand isn’t what you say about yourself, but what others say about you.
8

9
5 Reasons You Should Start Your Online Review Strategy Tomorrow 1. Getting positive reviews published after you have
negative reviews is harder.
2. 1 in 4 of your job candidates are utilizing them as part of their vetting process.
3. 1 in 4 clients who search for your firm online also read reviews.
4. Both are significantly higher amongst Generation Y.
5. Google LOVES Online Reviews.
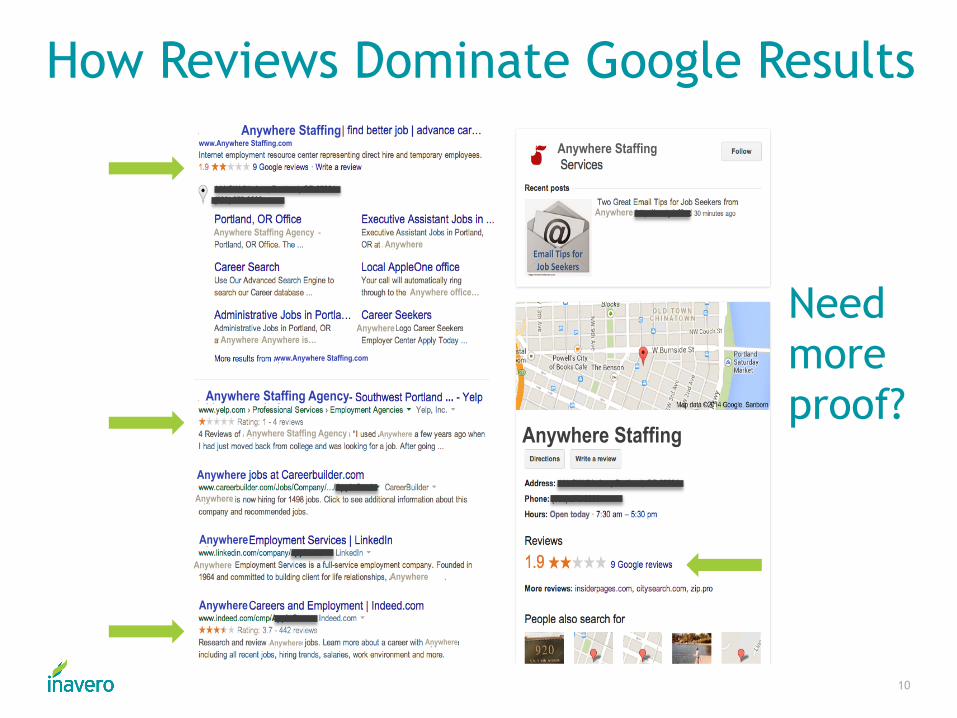
10
How Reviews Dominate Google Results Anywhere Staffing
Anywhere Staffing www.Anywhere Staffing.com
Anywhere
Anywhere Anywhere Staffing Agency
Anywhere Anywhere is… Anywhere
Anywhere office…
www.Anywhere Staffing.com
Anywhere Staffing Agency
Anywhere
Anywhere
Anywhere
Anywhere
Anywhere Staffing Anywhere Staffing Agency Anywhere
Anywhere
Anywhere Anywhere
Anywhere Anywhere
Anywhere
Anywhere Anywhere
Anywhere
Need more proof?

11
The Majority of Staffing Firms have No Strategy in Place to Manage Online Reputation
Strategy
in Place
37% No
Strategy
in Place
63%

12
Industry Data Shows Trending Improvement

13
Monthly Temporary Help Penetration Rate Continues to Grow
1.96% 1.97% 1.97%
2.00%
2.02% 2.02% 2.04%
2.05% 2.07% 2.06% 2.07% 2.08%
2.09% 2.10% 2.11%
1.94% 1.95% 1.96% 1.97% 1.98%
1.99% 2.00%
2.02% 2.03%
2.04% 2.05% 2.06% 2.07% 2.08% 2.08%
1.85%
1.90%
1.95%
2.00%
2.05%
2.10%
2.15%
Temporary Help Penetration Rate (August 2013–July 2014)
Actual rate for the month Rolling 6-month average
Source: U.S. Bureau of Labor Statistics, temporary help services seasonally adjusted employee counts from Current Employment Statistics survey
14
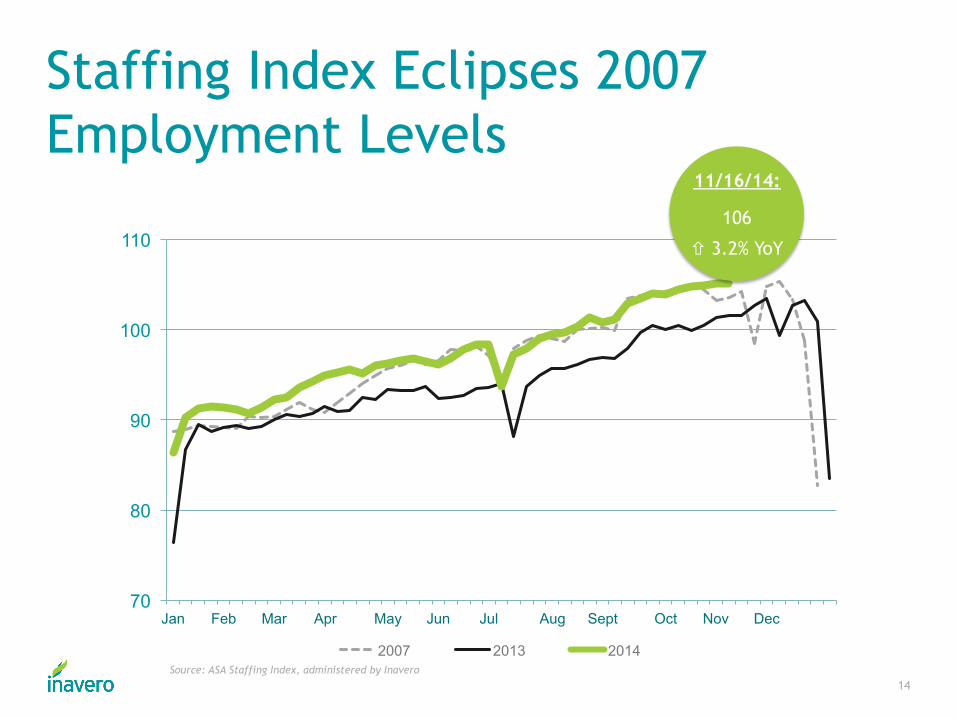
Staffing Index Eclipses 2007 Employment Levels
70
80
90
100
110
Jan Feb Mar Apr May Jun Jul Aug Sept Oct Nov Dec
2007 2013 2014
11/16/14:
106
ñ 3.2% YoY
Source: ASA Staffing Index, administered by Inavero

15
Industry Employment Near Prerecession Level
2.00
2.50
3.00
3.50
2000 2001 2002 2003 2004 2005 2006 2007 2008 2009 2010 2011 2012 2013 2014
Aver
age
Wee
kly
Empl
oym
ent
(Mill
ion'
s)
Temporary Help Average Weekly Employment
Q3 2014:
3.26M People
ñ 3.0% YoY
Source: Quarterly ASA Staffing Employment and Sales Survey, administered by Inavero

16
More Than 60% of Firms Grew Revenue Over Same Quarter in 2013
62.8%
51.4%
Q2 2012 Q3 2012 Q4 2012 Q1 2013 Q2 2013 Q3 2013 Q4 2013 Q1 2014 Q2 2014 Q3 2014 40%
50%
60%
70%
80%
% of Firms with YoY Sales Growth % of Firms that Increased GM %
52%
63%
Percent of Firms With Improved GM % Compared to Same Period Last Year
Percent of Firms That Grew Revenue Compared to Same Period Last Year
Source: Quarterly ASA Staffing Employment and Sales Survey, administered by Inavero

17
Economists See Growth, but Lower Projections for Next Two Quarters
3.5%
-2.1%
4.6%
3.5%
2.7% 2.8% 3.1%
2.8%
-3.0%
-2.0%
-1.0%
0.0%
1.0%
2.0%
3.0%
4.0%
5.0%
Q4 2013 Q1 2014 Q2 2014 Q3 2014 Q4 2014 (Est.)
Q1 2015 (Est.)
Q2 2015 (Est.)
Q3 2015 (Est.)
Source: U.S. Bureau of Economic Analysis and Federal Reserve Bank of Philadelphia Q2 2014 Survey of Professional Forecasters

18
Want to learn more?
Download our free comprehensive guide on satisfaction survey best practices
Guide Download