the stability of teacher effects on student math and
TRANSCRIPT

THE STABILITY OF TEACHER EFFECTS ON STUDENT MATH AND
READING ACHIEVEMENT OVER TIME: A STUDY OF ONE MIDSIZE
DISTRICT
BY
JENNIFER BESSOLO
Submitted to the graduate degree program in Educational Leadership and Policy Studies and the
Graduate Faculty of the University of Kansas in partial fulfillment of the requirements for the
degree of Educational Doctorate.
________________________________
Chairperson Dr. Howard Ebmeier
________________________________
Dr. Argun Saatcioglu
________________________________
Dr. Thomas DeLuca
________________________________
Dr. Marc Mahlios
________________________________
Dr. Perry Perkins
Date Defended: April 5th
, 2013

ii
The Dissertation Committee for JENNIFER BESSOLO
certifies that this is the approved version of the following dissertation:
THE STABILITY OF TEACHER EFFECTS ON STUDENT ACHIEVEMENT
OVER TIME: A STUDY OF ONE MIDSIZE DISTRICT
________________________________
Dr. Howard Ebmeier
Date approved:

2
ABSTRACT
Increased attention on teacher accountability via student achievement gains has brought
proposed policy changes which recommend teachers receive performance pay as recognition for
effective teaching. In response to the growing consensus that teachers’ contributions to student
learning should be a part of the teacher evaluation process, education reformers have begun
implementing pay-for-performance models that reward teacher performance by the scores their
students receive on high-stakes testing through the use of sophisticated value-added models.
There is currently a broad scope of value-added models based on student academic achievement
gains, and the majority of studies centering on these diverse models indicate little stability in
teacher scores across time. This study takes into account the previous research on value-added
growth models, and explores the uncharted territory of measuring teacher stability on state
assessment scores in one midsize district over a longer period of time. Results from this study
showed weak to moderate correlations from one year to the next in stability of teacher scores,
with more stability evidenced in math than in reading. As a result of the instability of teacher
scores over time, teacher characteristics attributed to stable and unstable teachers respectively
could not be determined.
3
TABLE OF CONTENTS
Chapter 1: INTRODUCTION……………………………………………………………………..5
Chapter 2: LITERATURE REVIEW……………………………………………………………………….7
Defining Teacher Effectiveness…………………………………………………………………....8
Evaluating and Measuring Teacher Effectiveness………………………………………………..11
Value-Added Models as Tools to Measure Teacher Effectiveness……………………………....14
Benefits of Value-Added Analysis………………………………………………………14
Weaknesses and Criticisms of Value-Added Analysis………………………………….16
Teacher Performance Stability Data……………………………………………………………...24
Teacher Performance Stability Data Using Alternative Instruments…………..………...28
Considerations in Regard to Teacher Stability on Performance Data……………...…....29
Teacher Characteristics as Contributable Factors to Student Achievement……………………...30
Chapter 3: METHODOLOGY……………………………………………………………………….........35
Research Design…………………………………………………………………………………..35
Participants and Sampling………………………………………………………………………..35
Data Collection…………………………………………………………………………………...37
Data Analysis……………………………………………………………………………………..38
Chapter 4: FINDINGS…………………………………………………………………………………….42
Correlations of Data from Year to Year…………………………………………………………..43
Teacher Performance Movement over Time…………………...………………………………...45
Tracking High and Low Teacher Performance over Time…………………………………….....49
Teacher Movement in Math Quartiles……………...…………………..………………..49
Teacher Movement in Reading Quartiles.....…………………………………………….54
Stability of Value-Added Teaching Rankings in Dual Subject Teachers………..……...56
Characteristics of Top and Bottom Teachers…...……………………………………….57

4
Chapter 5: DISCUSSION OF FINDINGS………………………………………………………………...59
Teacher Movement Over Time Compared to Other Findings……………………………………59
Rationale for Volatility in Teacher Scores………………………………………………………..62
Policy Implications……………………………………………………………………………….65
Using Value-Added Models for Teacher Evaluation Purposes…………………………….…….66
Study Limitations and Further Considerations………………………...………………………....69
Teacher Characteristic Findings for Top and Bottom Performing Teachers…………………......72
Conclusion and Future Studies…………………………………………………………………...73
RESOURCES……………………………………………………………………………………………..76
APPENDIX………………………………………………………………………………………………..82

5
Chapter One
The purpose of this study was to examine the stability of teacher effects on student math
and reading assessment scores over time. This study also examined teacher characteristics of the
same high-, low-, and average-ranked teachers to determine if a relationship exists between
stable teacher scores and teacher characteristics that could later have implications for personnel
selection or for policies to further define teacher effectiveness. Driving this study is the question,
is there stability of teacher test scores over time?
Only a handful of studies have analyzed teacher performance stability using value-added
models, with even fewer studies addressing stability of teacher test scores longitudinally. A few
studies have focused on the stability of teacher effects over time in metropolitan school districts,
such as San Diego, Chicago Public Schools, and several large school districts in Florida
(Aaronson et al., 2007; Kane and Staiger, 2008; Sass, 2009). From these studies, results show at
best a moderate-to-weak correlation in stability of teacher scores over time across the one to two
years studied. The results published from these studies typically show instability in teacher test
scores, but to varying degrees. Relevant to the important policy implications that could stem
from these results, replication of similar studies is needed to make informed decisions regarding
implementation on what some educational reformers are calling the fourth major change1 in
teacher compensation plans.
This study examines one typical midsize district. If teacher effectiveness is going to be
measured in achievement gains or by student performance on standardized assessments, it is
1 Three major phases in teacher compensation in the United States: 1) “The Boarding Round” where teachers
taught in exchange for room and board in a community, reflective of the bartering mentality. 2) The “Position Based” salary system which required some pre-service training and reflected the societal systems in place with unequal salaries in regards to gender and race. 3) “Single Salary Schedule”-known today as the standardized system for teacher pay with factors such as experience and advanced degrees defined on salary schedules.
6
logical to examine long-term effects of teachers on student assessment performance. If teachers
cannot consistently achieve high rankings on assessments over multiple years, then the means by
which we evaluate teachers, in this case average scores of state assessments, is either 1)
misinforming, or 2) provides evidence that teachers are not consistently effective. In these
circumstances, the probability of their students passing the state assessment has more to do with
varying cohorts and other factors than with consistently high performance on the part of teachers.
If this method of evaluation is not reliable, administrative personnel decisions could
unwittingly be made in error, and educational reformers would likewise be implementing a new
teacher evaluation system that is anything but effective, which could have detrimental impacts on
the teaching profession. The stability of teacher performance on student state scores has been
studied over shorter, one-to-two year time frames. As a result, ineffective or potentially
ineffective teachers could be retained or financially rewarded for unstable performance over time
if these results were used alone for teacher evaluation policy decisions. This study examined
teacher performance on student test scores over a three to six year fixed period to assess if
teacher performance could be predicted or, in other words, if the data showed that a portion of
teachers could be consistently ranked as “stable” or “unstable.” Those considered stable as high
and low performers (also referred to as effective and non-effective based on value-added theory)
were analyzed to examine if a relationship exists between teacher characteristics of those with
stable scores and unstable scores, respectively.
7
Chapter Two
Review of Literature
The U.S. Department of Education’s Race to the Top initiative has four key program
policies; three of these policies directly or indirectly address management of teacher quality.2
With a new emphasis on teacher accountability and measurement of teacher effectiveness growth
models, educational reformers across the nation are approaching the issue of measuring teacher
quality more precisely. From educational researchers and policymakers comes the consensus that
current teaching evaluation systems lack the ability to adequately improve instruction or decision
making regarding personnel (Darling-Hammond et al., 2011).
In response to a new policy of improving student achievement outcomes, educational
leaders and state departments of education have shown increased interest in assessing teacher
performance to account for teacher contribution to learning gains. This method of accountability,
often referred to as value-added models or VAMs, evaluates individual teacher performance
from year to year, taking into account student characteristics such as socioeconomic status, to
statistically account for teacher outputs. Implementation of these growth models in school
districts has resulted in several pay-for-performance compensation plans, where effective
teachers are financially compensated for student achievement gains on high-stakes testing.
From consensus that teachers are the most crucial student-based resource in student
achievement and an understanding that good teaching results in the greatest student gains, policy
makers have turned their attention to value-added models of assessing individual teacher
effectiveness, often a component of teacher evaluation, by using performance scores of students
2 Race to the Top encourages policies designed to 1) recruit and retain effective teachers; 2) build longitudinal data
systems that will provide feedback on teacher effectiveness; 3) assist in turning around the lowest performing schools.

8
to measure that effectiveness. These results are often used in evaluation systems to inform
administrative decisions on teacher retention and compensation. With increased emphasis placed
on measuring teacher effectiveness in the classroom, individual school districts have not only
implemented varying pay-for-performance (also known as merit pay) programs, but also used
teacher effectiveness scores to publicly rank teachers. Additionally discussed is the concept of
making personnel decisions based on teachers’ statistically calculated performance scores.
From adopting contracts for pay-for-performance teaching in Denver, Colorado to
implementing value-added models to inform personnel decisions in Tennessee, the effort to
measure teacher effectiveness and to make decisions based on these measurements all rest on the
assumption that “teacher quality is a stable attribute in teachers” (Goldhaber and Hansen, 2010).
In its simplest form this assumption implies that effective teachers in the present will continue to
be effective teachers in the future, and that ineffective teachers will remain ineffective in the
future.
Defining Teacher Effectiveness
Research shows that teachers are the most influential school-based resource in student
learning and that good teaching does matter (Ferguson, 1991; Darling-Hammond, 2000; Wright,
Horn, and Sanders, 2007). Additionally, William Sanders (2000) concludes that teacher
effectiveness is the single largest factor contributing to the difference in academic growth of
populations of students. While few argue over effective teaching as the most critical school-
based factor in student learning, defining how teachers influence learning is a challenge.
Studies demonstrate that students who are consistently taught by effective teachers
benefit much more so than students not consistently taught by effective teachers (Gordon et al.,

9
2006). Sanders and Horn’s (1998) study showed that second grade students had comparable
student achievement results, yet in the fifth grade had very different outcomes in performance.
These results were not due to student socioeconomic status (SES), class sizes, or even
attendance, but to the teachers the students had over the years (Sanders and Horn, 1998;
Schacter, 2010). While few argue that teacher quality and teacher effects on student achievement
are the most critical school-based attribute to student gains in the classroom, defining what
teacher effectiveness actually is can be a complicated task. Lewis et al. (1999) states, “teacher
quality is a complex phenomenon, and there is little consensus on what it is and how to measure
it.” The term teacher effectiveness itself remains a challenging concept when one considers the
multiple contexts a teacher performs within in their line of work, as well as the variable
components of those contexts. A review from the National Institute of Child Health and Human
Development echoed this educational observation, “Rigorous experimental and qualitative
research that defines and characterizes effective teaching methodologies that demonstrate
improved student performance is limited.”
Conversations continue over best ways to determine teacher effectiveness. Earlier
definitions of teacher effectiveness have been described in various ways. For example, Clark’s
study in 1993 states, “the definition involves someone who can increase student knowledge, but
it goes beyond this in defining an effective teacher.” Million’s (1987) definition of effective
teaching relies more on the teacher’s lesson design and delivery. Papanastasiou (1999) states
that, “no single teacher attribute or characteristic is adequate to define an effective teacher”. Vogt
(1984) relates effective teaching to a teacher’s skill in providing instruction to different students
of varying abilities while assessing various learning styles and including appropriate
instructional methods. Wenglinsky (2000) says that the learning that happens in the classroom is
10
what is most important and that teacher effectiveness ultimately comes down to classroom
practices. Absent in these earlier studies of teacher effectiveness is the connection of student
achievement data with teacher performance --- if this is a viable piece in determining
effectiveness of teachers. Clark (1993) shared that the problem lies in determining how best to
measure student achievement. Only recently has attention turned to measuring student
achievement, and therefore, teacher effectiveness, using standardized scores, achievement data,
and student gains (Markley, 2004). “One area that was avoided by most authors was the idea of
using student achievement as a measure of effectiveness” (Clark, 1993). Currently, the definition
of an effective teacher by the Department of Education’s Race to the Top is “a teacher whose
students achieve acceptable rates (e.g., at least one grade level in an academic year) of student
growth.” The question remains, however, from numerous researchers’ reviews, “whether a
teacher who is effective or ineffective once is equally effective or ineffective a second time” (p 7
Newton et al., 2010).
In the narrowest modern definition, teacher effectiveness can be defined merely by
student gains a teacher achieves in his or her classroom, meaning a teacher can be ranked or
perceived as more or less effective than their peers simply by the scores their students receive on
the state assessment that year compared to other teachers (Goe et al., 2008). In this definition, it
is difficult to determine if the achievement growth reflected in the test scores was achieved by a
narrowing of curriculum or implementation of good instructional practices rich in student
engagement, motivating activities, and a productive student environment. “The major research
finding is that student achievement is related to teacher competence in teaching,” (Kemp and
Hall, 1992). While this statement is dated, the question that needs to be answered is how student
achievement is accurately and fairly measured, through what means of measurement, and how

11
the measurement relates to teacher effectiveness. In this time of educational reform, legislators
continue to look at defining teacher effectiveness through a measurement of standardized scores,
a definitive change from researchers’ definitions of teacher effectiveness 30 years ago in the
1980s.
The popular definition of teacher effectiveness in 2012 comes largely from policy makers
in support of using value-added mathematical models to assess teacher performance based on
their students’ test scores. A standard definition of teacher effectiveness for recent educational
reformers is a teacher’s ability to produce “higher than average” student scores on standardized
assessments (Goe et al., 2008). In a similar fashion, states are moving toward models of
measuring teacher effectiveness through measurement of their students’ performance on
standardized tests (i.e., test scores). This study examines the pragmatism of this practice and the
stability of teacher math and reading scores over time in identifying the effective teachers from
the least effective teachers using a value-added model of measurement.
Evaluating and Measuring Teacher Effectiveness: An Analysis of Methods Used
The process of evaluating and measuring teacher effectiveness has changed over time due
to increased attention from both state and federal policy makers. Largely as a result of No Child
Left Behind (NCLB) and President Obama’s Race to the Top, legislators across the country are
hesitant to increase education funding without having an adequate tool for assessing teacher
accountability (Markley, 2004). School reforms holding teachers accountable for student
learning on high-stakes assessments have become increasingly popular. Yet, the focus on
effective teaching started before NCLB legislation in 2001. When A Nation At Risk Report
(National Commission on Excellence in Education 1983) was published, the nation was

12
informed that education was in trouble, and as a result, Clark’s (1993) study later describes how
education evolved into “… teacher-proof curriculums, test-based instructional management, and
student competence testing. …” Spurred also by this national report were numerous studies
about student achievement tied to teacher performance on entrance and exit exams, in attempts to
identify effective teachers (Summers & Wolfe, 1977; Pugach & Raths, 1983; Lovelace, 1984;
Evertson, Hawley, & Zlotnik, 1985). Later analysis in measuring effective teaching evolved to
studying teacher experience compared to student achievement. From several studies came the
findings that for teachers with master’s degrees and five or more years of teaching experience,
there was little to no evidence of increased student achievement over their less experienced
counterparts (Darling-Hammond, 1995; Ferguson and Ladd, 1996). As the literature shows, past
research on teacher quality lacks a specific method or even a specific form of measurement to
accurately assess effective teaching. Teacher exams, higher degrees, and years of experience
have all proved to be rather inconclusive in identifying characteristics of effective and ineffective
teachers.
NCLB policy and Adequate Yearly Performance (AYP) performance measurements
brought about several growth models to measure school performance: status, improvement,
growth, and value-added are the four generic types of models used (Goldschmidt et al., 2005).
By looking at the evolution of these models, observations can be made that educational
reformers have developed methods measuring teacher accountability by examining student
achievement. When defining the four accountability prototypes, a status model compares a
snapshot of student performance against a target or national goal, such as AYP performance
targets. An improvement model compares student performance from the current year to student
performance in the same grade the previous year, assessing growth of two different cohorts of

13
students. For example, performance would be assessed based on growth of fourth grade scores
this year compared with last year’s fourth grade scores. The third type of performance measure is
the growth model, which tracks individual student growth from one year to the next using
preferably two points of baseline data each year. Growth models account for the relationship
between the beginning academic status and growth of students, often measured by a target goal
for all students. Lastly, value-added models are the most recent form of analyzing teacher
effectiveness and are a type of growth model (Aaronson et al., 2007; Goldschmidt et al., 2005).
Value-added models are a statistical calculation in which states or districts take into account
student background specifics as mathematical controls, and, therefore, are meant to separate
student performance from outside contributing factors when studying student performance gains
(Kane and Staiger, 2008). Value-added assessment is used specifically to calculate and track
individual student progress on state assessments each school year. The simplified idea in value-
added models is to calculate the value the teacher adds for each student. This contribution can be
measured in a model of statistical calculations developed by Dr. William Sanders who at the time
was a researcher at the University of Tennessee (Weldon, 2011). The idea of using a value-added
model, in contrast to comparing raw assessment data, is that teachers will be measured based on
their impact or contribution to the students’ learning, no matter if they are an advanced or
remedial student in the content area (Walden, 2011). Factors such as SES, school quality, student
ability, and family inputs are examples of some of the factors considered in the statistical
analysis for measuring teacher effectiveness. The idea of using value-added models to measure
teacher effectiveness is debated thoroughly in research, with seemingly more critics than
supporters for this method of evaluation (Rothstein, 2009a; Kane and Staiger, 2002b; Sass, 2008;
Aaronson, 2007). While most studies conducted of this nature have focused on one to two years

14
of teacher performance data, “… all the extant analyses suggest that value-added measures of
teacher performance, are, at best, moderately stable over time” (Sass, 2008).
Value-Added Models as the Tool to Measure Teacher Effectiveness
Nearly all proposals to use value-added models seeking to hold teachers accountable for
student performance gains have been met with mixed reactions from both teachers and
administrators as practitioners in the field. Overall, the hesitancy is largely due to belief that test
scores cannot reliably measure teacher effectiveness (Alliance for Excellent Education, 2008).
Darling-Hammond (2007) suggests that effectiveness measures be used to inform improvement
practices, for example, teacher training programs, reviewing value-added models, and in
improving accountability models, but not as a way to rank teachers in terms of quality. Current
research exists which both criticizes and supports value-added models as tools for measuring
teacher effectiveness (Aaronson, 2007; Koedel and Betts, 2007; Rothstein, 2008; 2009a, 2009b;
Kane and Staiger, 2002b; Sass, 2008; Harris and Sass, 2008; Jacob and Lefgren, 2008;
McCaffrey et al., 2008).
Benefits of Using Value-Added Analysis The argument for value-added measurement states that
by tracking a teacher’s performance and the related value added to a student’s learning from year
to year, the teacher’s effectiveness can be accurately measured. Researchers Aaronson and
colleagues (2007) think that measuring teacher effectiveness through value-added models has
some accuracy and value state, “when value-added is done carefully and supplemented with
other measures of student learning, it can generate reliable data that can be used to help teachers
improve.”

15
The goals behind the use of value-added models also speak to how much impact
individual teachers have on individual student achievement, as opposed to evaluating the entire
school on general student performance. Supporters of value-added analysis used in conjunction
with accountability systems think that it provides a more reasonable method of measuring
teacher impact on student performance because of its measurement of student growth, rather than
of student attainment levels, where students may enter a classroom at high levels of achievement
but not excel specifically as a result of the teacher’s instruction. Additionally, variable factors
affecting student performance, such as socioeconomic status (SES) are removed from the
statistical calculations in value-added models, in theory, providing teachers an equal playing
field for performance comparisons.
Those in support of value-added measures also claim that retaining or selecting teachers
based on value-added scores can lead to positive gains in student achievement. Value-added
models are also said to more accurately measure student progress and can also track the same
student over time much better than with systems such as AYP, which compares one cohort’s
scores against the grade levels’ former cohort’s scores (Braun, 2005).
In a significant study recently published by Harvard University, Chetty, Friedman, and
Rockoff (2011) explored the debate over the effectiveness of using value-added models by
examining two issues: 1) whether value-added measures provide unbiased accounts of teacher
impact on student achievement, and 2) if value-added measures impact students in the long term.
In this research, Chetty and colleagues studied school district data on 2.5 million students in
grades 3-8, taking into account parent tax records and analyzing changes in teaching staff. Their
results indicate that students assigned to higher-ranked, value-added teachers were indeed more
likely to attend college, as well as select more prestigious colleges. These same results showed

16
the populations of students assigned to higher-ranked value-added teachers were also more likely
to save for retirement, have a higher socioeconomic status, and overall earn higher salaries
(Chetty et al., 2011). Their study concluded that replacing a teacher ranked in the bottom 5
percent of the value-added teaching pool would increase a student’s lifetime income by more
than $250,000 for the average classroom sample. The major conclusion from the study was that
good teachers have long-term effects on student scores over time, and student value-added test
score gains can indeed identify quality teachers (Chetty et al., 2011). The study also emphasizes
that good teachers do have “added value,” and that the implications for determining teacher
effectiveness and teacher quality are worth exploring. Sanders and Horn’s work (1995) is often
brought into discussions of support for value-added model implementation. Their findings show
that “assessment should be a tool for educational improvement, providing information that
allows educators to determine which practices result in desired outcomes and which do not.”
Despite concerns of value-added models measuring teacher performance by student test
scores, a popular study from Sanders and River (1996) states, “... students benefiting from
regular yearly assignment to more effective teachers (even if by chance) have an extreme
advantage in terms of attaining higher levels of achievement.” In this study, results of student
performance as related to identified effective and less effective teachers over a three-year time
span showed a value-added difference in student achievement between students assigned to
identified effective teachers each year and students assigned to the less effective teachers each
year (Sanders and River, 1996).
Weaknesses and Criticisms of Value-Added Analysis While Sanders and River’s study shows
that students clearly benefit from learning from more effective teachers as identified by value-

17
added models, other research heavily criticizes the effectiveness of using value-added models in
accurately identifying effective teachers (Rothstein, 2009a, 2009b; Kane and Staiger, 2002b;
Gordon, Kane, and Staiger, 2006; Baker et al., 2010; Goe et al., 2008; Alliance for Excellence in
Education, 2008). Concerns when using value-added models to assess teacher performance
include 1) the use of one-time, high-stakes testing for an important measurement such as teacher
performance, 2) issues regarding the standardized testing instrument itself, and 3) instability of
teacher data as research has demonstrated (McCaffrey, 2008; Koedel and Betts, 2008; Kane and
Staiger, 2002b). As opposed to Aaronson and colleagues’ (2007) suggestion that value-added
analysis generates reliable data when supplemented with other student learning measures, value-
added models are typically known for use as one high-stakes test for statistical measurement.
The use of a high stakes assessment as an evaluation of teacher effectiveness is cause for concern
to some. Used in isolation, as opposed to current practices of also using teacher qualifications
and employing a variety of styles of evaluations to assess teacher effectiveness, these measures
of student learning are said to focus solely on the end result of what effective teaching should
accomplish (Alliance for Excellence in Education, 2008). Standardized tests in themselves are
not perfect, and every assessment has limitations in measuring student learning. Research shows
us that standardized assessments are not “explicitly designed to measure teacher quality; test
scores have margins of error, and some tests do not align to curriculum standards (Braun, 2005;
Gore, 2007; Elmore, 2002). Furthermore, judging teachers on a “single” assessment is said to not
be an effective measurement of the students’ learning (Alliance for Excellent Education, 2008).
While research shows that good teaching matters and that it could be the single most
important value added for increasing student achievement, researchers also show that there are
limitations and concerns to evaluating teacher performance through student test scores alone

18
(Darling-Hammond, 2000; Wright, Horn, and Sanders, 2007). The narrowed definition of teacher
effectiveness as defined by value-added models alludes to a teacher’s ability to produce higher
than expected student gains on test scores. In Goe et al.’s (2008) synthesis of evaluating teacher
effectiveness, there remains concern that rewarding teacher performance based on student high-
stakes test scores will result in a narrowed curriculum focus, or that the practices of teaching to
the test will become an even greater issue when teacher’s jobs are on the line and they feel
pressure to generate expected to above-expected student scores. Additionally, critics of high-
stakes testing to measure teacher performance state that implementation of value-added models
in their present form takes the assumption of teacher effectiveness too far. In this argument,
value-added does not credit the student with enough responsibility for and ownership of active
learning, but places the sole accountability for student learning on the teacher, with the premise
that it is only through the teachers inputs that students learn (Kane and Staiger 2008).
Furthermore, those who oppose using value-added models to evaluate teacher
effectiveness argue that they are a poor indicator of teacher quality (Gordon, Kane, and Staiger
2006; Baker et al., 2010). A recurring concern is that high performing students will continue to
hit the target despite the teacher’s performance, while low achieving students may continue to
struggle to meet proficiency standards despite a teacher’s best teaching. These same reformers
argue that the best way to assess a teacher’s effectiveness is to measure their performance over
time on several assessments (Kane and Staiger, 2006). Critics of value-added analysis are also
concerned that using one form of assessment to speak for a student’s full range of learning can
result in inaccurate data, reiterating that one of the most challenging aspects of any incentive
program is the measurement of the outputs (Eberts, Hollenbeck, and Stone, 2002).

19
The current debate over measuring teacher effectiveness extends to whether we should
evaluate effectiveness based on teacher “inputs,” teacher “outputs,” or a mix of both (Stronge et
al., 2011). Teacher inputs can be defined more by what teachers do and how they well they do it,
such as classroom instructional practices, for example; where teacher outputs reflect what
teachers accomplish, or what students learn. The pay-for-performance model is a teacher output
model based on student standardized assessment performances, but it assumes that student test
score gains are a direct result of effective instruction. Although research examining the broad
array of value-added models relies on “very strong and often untestable statistical assumptions
about the roles of schools, multiple teachers, student aptitudes, efforts, and families in producing
student learning gains,” these same models continue to gain increasing attention from policy
makers due to the “scientific appearance” of their method of calculation, as well as conceptual
appeal (Newton et al., 2010). McCaffrey and colleagues (2003) point out the use of assessment
data in value-added models is subject to error, as any tool has statistical limitations in measuring
such a complex value-added subject as student learning.
In the study from Chetty et al. (2010), which supports the use of value-added models,
Chetty and colleagues discovered that two important issues must be taken into consideration
before acknowledging that existing value-added models positively impact student achievement
long term. The first issue to consider is whether value-added measures will encourage a
narrowing of the curriculum on high-stakes tests or incite cheating from teachers to achieve
higher scores. The second issue is the potential personnel costs that implementation of value-
added models can add to a school district through increased turnover rates for underperforming
teachers (Chetty et al., 2011). From an economic standpoint, the study also demonstrates the
worthwhile investment of parents paying an additional retention bonus to teachers performing at

20
one standard deviation above their colleagues as determined by their mean assessment scores
(Chetty et al., 2011). In public education, however, this option is generally not applicable to
school finance formulas, leaving the financial responsibility of increased teacher turnover costs
and retention bonuses to the school districts to support and sustain.
While select education reformers and policy makers have moved forward with
implementation of value-added models, some conclude that growth models, specifically the
Tennessee Value-Added Assessment System (TVAAS)3, may become “black box mechanisms”
(Kupermintz et al., 2001). The concern lies in the value-added models sharing little insight as to
what actually makes a teacher effective or ineffective in the classroom. Caution is needed when
looking at implementing value-added models or using student test scores as the only way to
measure teacher effectiveness (Newton et al., 2010).
Some critics of value-added models feel that too strong a connection, and emphasis on
that connection, has been made between student success on state assessments and good teaching
practices (i.e., effective teaching). The TVAAS assumes that effective teachers will naturally
demonstrate student gains and success in the classroom (Sanders and Horn, 1998). There is
concern that by linking teacher effectiveness with student performance gains, policymakers and
educational reformers may misconstrue the definition of teacher effectiveness to one measured
by student performance gains only, rather than a definition which also includes characteristics of
teacher quality and the use of research-based practices for improving instruction (Kupermintz et
al., 2001). Researchers show concern that value-added ratings cannot truly “disentangle” their
results from contributed factors which impact their scores (Darling-Hammond, 2011). Students
may receive additional tutoring or learn how to calculate physics problems using skills taught
3 Based on pilot studies of William Sanders’ 1980s value added model later supported by the Tennessee
Educational Improvement Act of 1992.
21
from a math teacher, and these effects are difficult to measure from classroom instruction.
Effects of reading instruction are equally difficult to determine in terms of accountability to one
instructor, as parents may play a role in the support of their child’s reading growth.
Among concerns regarding value-added models is the reliability of tracking methods so
that teacher performance information is transferred when instructors move to new school districts
or states. Statutes in 19 states currently link student promotion to teacher performance on a
district or state assessment (ECS, 2000). Seven of these states, however, do not have unique state
ID numbers assigned to teachers, so teacher movement from one district to another is not tracked
on an individual basis. Critics share concern that implementation of these models without better
tracking systems in place will lead to inaccurate information reported at the state level
concerning district teacher performance over time. While the number of states that have teacher-
assigned ID numbers is growing, the logistics and ability to track teacher performance continues
to be a challenge to state departments of education.
The purpose of assigning ID numbers to teachers extends beyond analyzing teacher
effectiveness longitudinally, according to the Data Quality Campaign. The purpose of tracking
teacher performance among districts is to also provide states with information regarding most
and least effective teacher preparation programs, school working condition effects on teachers,
experience of teachers in schools of high and low SES in relation to academic growth, and
teacher preparation in tested subject areas in relationship to low-income student performance on
state assessments (Berry et al., 2007). California, Florida, Louisiana, New York, North Carolina,
Tennessee, Texas, and Utah are already using various value-added models, also referred to as
“data systems,” to measure teacher effectiveness.
22
High schools especially have the most difficulty in accurately and statistically
determining a teacher’s “added value” to student performance gains because students see
multiple teachers in any given day. Student achievement, for example, in the Humanities, is
influenced by many teachers, with often more than one class with embedded reading skills in a
student’s schedule each semester. To more accurately employ the use of value-added models in
high schools, it is suggested that secondary education systems look toward using an end-of-
course exam to measure the impact a teacher makes on a student, instead of using standardized
assessments given intermittently throughout their high school years in limited subject areas.
Another criticism of value-added models is the complexity of how teacher performance is
calculated. The statistical nature that value-added models require to provide accurate data
necessitate the translation of the statistical information concerning value-added data into a user-
friendly model that teachers can use to guide and inform their own instruction over the years.
An additional issue that arises when measuring teacher test score performance data in
secondary levels of education is the practice of assigning higher achieving students to the more
experienced teachers, therefore leaving the less experienced teachers to teach classes with higher
English Language Learners (ELL) and special education student populations. This practice
creates the potential for the more advanced students to be assigned to the more experienced
teachers. These students would then naturally outperform the students of the less experienced
teachers newer to the teaching field (Weldon, 2011). The reason for skepticism in using value-
added models to some researchers and even policy makers is due to the fluctuation of teacher
performances in their students’ assessment scores when analyzed over time, in some cases with
uneven distribution within the same school district (Viadero, 2008a). This is partially due to

23
potential for bias because of nonrandom assignment of students to teachers, as well as concern
that student performance data is missing (Viadero, 2008a).
Another concern regarding the broad array of teacher effectiveness models based on
student test scores is the idea of evaluating teachers through a statistical tool which is essentially
driving the definition of teacher effectiveness, rather than having researchers accurately define
teacher effectiveness first, and then measuring it (Campbell et al., 2003). Campbell and
colleagues further explain that just because society has the capability to match teachers to their
student scores and use this measurement to assess teacher effectiveness, does not mean it is the
only way to measure teacher effectiveness with their students. Value-added models are said to be
such an extreme example of a data-driven evaluation tool that defines teacher effectiveness to the
extent that in some states it affects teachers’ employment status and has been used to publicly
rank teachers.
Adequate research can be found both supporting and criticizing value-added models as a
means to evaluate teacher effectiveness. No matter what model is used for this method of teacher
evaluation, from Denver’s recently adopted pay-for-performance contract, to teacher tenure
retention programs based on student outcomes in Tennessee, there are attempts to manage
teacher performance based on the assumption that teacher quality is a “stable attribute,” meaning
there are simply good teachers who teach well, and poor teachers who teach poorly (Goldhaber
et al., 2010).
Overall, the use of assessment scores to measure student effectiveness, even in the most
carefully designed statistical ways, can only tell us that a student and, therefore, his or her
teacher, did or did not meet the academic expectations set. It does not inform administrators or
policymakers as to which instructional practices were or were not used effectively, or which
24
practices need to be changed by that instructor. Braun (2005) asks policymakers to consider that
evaluating teachers by performance on student state or standardized assessment scores may leave
out a great deal of teacher impact and other contributable factors. Also to be considered is that
teachers are not randomly assigned classes (e.g., advanced versus remedial), and the lack of
yearly assessments in multiple high school subjects add to additional inconsistencies in teacher
effectiveness data.
Kupermintz et al. (2001) call for “more systematic studies” of models that use
standardized assessments to measure teacher effectiveness. Specifically, more attention to
studying “the potential confounding of teacher effects and other independent factors contributing
to student academic progress, the dependency estimates of teacher effects on model assumptions
… and the explicit links between student score gains and instructional practices” (Kupermintz et
al., 2001).
Teacher Performance Stability Data
Prior research studies on value-added models of teacher effectiveness have found teacher
effectiveness rankings and ratings vary greatly from class to class as well as from year to year
(Newton et al., 2010; Koedel and Betts, 2007, McCaffrey et al., 2008). For example, Newton and
colleagues (2010) found that teacher rankings of performance and, therefore, stability, varied
“substantially” from one year to the next. Their study ranked teacher performance using multiple
models to evaluate stability and still found that teacher stability varied greatly over types of
courses and types of students, as well as when using the statistical model that made different
assumptions concerning the external influences that should be controlled.
25
The handful of studies measuring the performance stability of teachers over time show
mixed results and have typically studied teacher performance over a two-year period, with a few
studies measuring performance up to five years (Newton et al., 2010; Rothstein, 2010; Kane and
Staiger, 2008; McCaffrey, 2003; Aaronson et al., 2007; Koedel and Betts, 2009; Harris and Sass,
2007; Kane and Staiger, 2002b). Some of these studies have found some consistency in teacher
performance scores from year to year, but none overwhelming so. What is not known is the
degree of measurement error from the actual teacher effectiveness occurring in the classroom.
This is due to the shorter time frame of the two-year studies.
Researchers are starting to explore the impact that a larger time span of study has on the
effects of value-added results regarding teacher performance. The primary reason for including
multiple years of teacher data (rather than a single year) is “to improve the statistical power in
estimating teacher effectiveness ----a natural consequence of spanning multiple years of teacher
observations is the increased number of student observations used to estimate a teacher’s value-
added effect” (p 5 Goldhaber and Hansen, 2010). Ballou (2005) was one of the first to
acknowledge this finding. Based on one year of teacher performance, his findings showed less
than a third of teachers had significantly differing effects from the average as shown in math
scores. Using a three-year estimate, more than half the math scores showed statistically different
effects from the average, which demonstrates the increased variance that can be observed over a
longer period of observation.
Koedel and Betts’ (2009) study also acknowledges variations in using value-added
models as ways to measure teacher effectiveness, with cautionary suggestions regarding
measurement practices. The study shows that even detailed value-added models estimating
teacher effects across cohorts can produce biased teacher estimates, but not as large a bias as
26
Rothstein’s (2009a, 2009b) studies found in contrast and critique to Ronald Ferguson’s research
(2010) funded by the Bill Gates Foundation, which supported the stability of value-added
models. While biased teacher estimates are largely due to non-random student assignment to
teachers, suggested practice for those using value-added models is to attempt to randomize
student assignment to teachers and utilize multiple years of cohort studies in statistical
calculations (Koedel and Betts, 2009).
Rothstein’s two studies on variations of teacher effectiveness (2009a, 2009b) are the most
popular critical studies addressing the bias of value-added models primarily due to nonrandom
assignment of students to teachers and instability of teacher results. Results of his studies
measuring teacher effectiveness using several different value-added models conclude that even
the best value-added models may be biased, with bias stemming from the nonrandom assignment
of students to teachers (Rothstein, 2009b). Rothstein’s initial study showed little replication of
teacher effectiveness over time, and stated that the effects of stable teachers “wear off” or are
inconsistent when analyzed over a longer period of time (2009a). Rothstein’s research was a
direct analysis of Ronald Ferguson’s (2010) research, critiquing Ferguson for interpreting his
initial findings incorrectly, as viewed by Rothstein.
In the small handful of studies concerning stability of teacher performance on test scores,
the majority of the research describes irregularities and inconsistencies in measurement studies.
McCaffrey and colleagues (2008) found instability in value-added rankings of teachers when
studying five urban school districts. From this study’s rankings of top teachers, 20-30 percent fell
in the same quintile a year later, with a similar proportion of teachers once in the top quintile
falling to the bottom two quintiles a year later. Additionally, Kane and Staiger’s (2002a, 2002b)
multiple studies confirmed that there is high variability of student scores within several years’

27
time between cohorts in small schools. It was shown in Kane and Staiger’s (2002b) study that
when smaller schools’ test score levels and gains were graphed, nearly all the smaller schools
were represented in either the highest or lowest ranked categories of performance. This could be
attributed to the variance in sampling in less populated districts, where several excelling students
can greatly impact achievement levels for the cohort. When the scores from 1998-1999 were
studied, researchers also found that small schools were most likely to show the biggest changes
in mean scores and gains from one year to the next (Kane and Staiger, 2008). In conclusion,
empirical studies addressing stability of teacher effectiveness rankings over time have been
inconclusive and the issue needs further investigation (Newton et al., 2010).
Other studies conducted have measured teacher effectiveness by one assessment score,
such as the state math assessment. Value-added models have shown that some teachers have
higher value-added scores in some subjects than others. Without measuring teaching
effectiveness in at least math and reading subjects, it becomes difficult to identify the effective
teachers from non-effective teachers using just one score (Berry et al., 2007). From Kane and
Staiger’s study (2002b) of teacher stability of test scores, two causes of variation over time could
be identified: sampling error and what was termed “non-persistent changes” in performance.
Sampling errors referred to contributors in individual student scores after variables had been
controlled for, and non-persistent changes refer to all other factors that contribute to teacher
changes of performance measurements other than sampling errors, which, for example, could
include disruptions during the test day or the parallels of test items to specific concepts taught.
Researchers caution that school performance data is very difficult to accurately measure when
looking at one year’s worth of data or when results are compared from different tests (Lockwood
et al., 2007; Gates Foundation, 2010).
28
When examining the stability of teacher impact on student test scores, trend data should
be considered in a longitudinal fashion rather than assessing teacher performance on a yearly
basis. “The best way to reduce sampling error is to include information from more students …
this can be accomplished by pooling estimates across years, for example, using a three‐year
average of performance measures rather than a measure from a single year” (Buddin et al.,
2007). Only a few studies have measured the variability of teacher effects on test scores. What
has been discovered is that assessing performance over multiple years results in different data
than assessing teacher data for one year. A study performed by Aaronson, Barrow, and Sanders
(2007) compared teacher rankings in the Chicago Public Schools over a two-year time span.
They discovered that 36 percent of teachers ranked in the lowest quartile in performance two
years in a row. Twenty-nine percent moved into the next quartile the second year, with 35
percent moving up into the top half of the quartile distribution. Among the higher ranking
teachers, Aaronson et al. (2007) found that 57 percent of teachers remained in the top half of the
quartile distribution for both years, 23 percent moved down to the third lowest quartile, and 20
percent fell down into the lowest two quartiles of performance. While some studies support the
statistical findings of value-added models, research has shown that variances exist in the stability
of results found, depending on models, sampling variation, or other factors to be determined.
Teacher Performance Stability Using Alternative Instruments to State Assessments. Further
examination of teacher effects can be done by looking at stability of student results using a
different test instrument than state assessment scores. The state of Florida gives a norm
referenced test called the Stanford Achievement Test (NRT) and a high-stakes “criterion-
referenced” exam called the “Sunshine State Standards” (SSS) to students in third through tenth

29
grades. In ranking elementary teachers in a two-year period based on the stability of their scores
on both tests, it was discovered that there is less variability in scores on different tests given at
the same time than with the same test over time, meaning year to year testing provides the least
consistent performance and stability of scores. This was represented with 42 percent of teachers
ranking in the top quintile when administering the NRT assessment and also ranking in the top
quintile in student scores on the SSS. The correlation in teacher effects on both assessments
given the same year was .48, much higher than the correlation of .27 on the NRT student scores
given from one year to the next (Sass, 2008). While variability of the correlations could be
attributed to different responses to accountability pressures, different content being tested, or
different proficiencies scores in maximum achievement, one observation from looking at
multiple studies is that teacher stability on student scores has some value-added, but to what
extent is an area that needs further research.
Considerations in Regard to Teacher Stability Performance Data. Measuring teacher
effectiveness on one particular test administered once a year is disconcerting to researchers in the
field. Particularly disruptive students or inclement weather on test days are examples of factors
that could throw off consistency of testing on a one year basis. However, if a teacher’s stability
of test scores in a five-year span, for example, has one “off” year, perhaps other factors should be
considered. In these cases, the teacher’s scores should then return to the high performance
ranking they had been in the past. The concern with this approach from Kane and Staiger’s study
(2008) is that states will focus on the outlier schools, the highest and lowest performing,
therefore targeting the smaller schools that statistically fall most into these two categories due to
their sampling size and variability in test scores. Kane and Staiger (2008) point out that a
30
student’s baseline data and trajectory of scores is not equal to all students. In their analysis of
North Carolina student performance on assessments, they found that students with higher
educated parents have higher baseline scores, but also gained more from year to year.
While many research studies have established, at minimum, that a certain degree of
value-added is seen when measuring teacher effectiveness through student performance gains in
test scores, Goe and colleagues (2008) found that value-added cannot be determined based on the
relationship between teacher scores and student gains alone. Rather, the researchers explain, a
teacher’s effectiveness should be determined by the relationship between that teacher’s
performances and the intended value-added, whether that value-added is student participation
rates or value-added scores. Their argument yields the suggestion that perhaps teacher
effectiveness could be better defined in a broader scope, as one single measurement of a
teacher’s performance in one year does not often provide an accurate picture of a teacher’s true
performance.
Teacher Characteristics as Contributable Factors to Student Achievement
There is a general consensus that teacher quality is essential to academic performance,
but little agreement as to which specific teacher characteristics factor into the definition of what
makes a good teacher (Hanushek and Rivkin, 2006). Specific teacher characteristics relating to
student achievement remains a debatable topic to many due to the difficult nature in measuring
teacher quality. Faced with these challenges in assessing teacher quality, researchers defer to
utilizing measurable proxies such as certification, experience, salary, and advanced degrees,
among other teacher characteristics, to discover patterns of teacher qualities in effective teachers.
Research can only account for teacher attributes as 3 percent of overall value-added in student
31
test scores (Rivkin et al., 2005; Goldhaber et al., 1999). One study in 1998 showed a slightly
higher percentage of 7.5 percent in the overall value-added of student achievement resulting
directly from teacher quality, with estimates that the percentage could actually be as high as 20
percent (Hanushek et al., 1998). The following research on teacher characteristics is by no means
an exhaustive account of all literature on teacher quality effects, but provides popular descriptors
used as teacher characteristics for this study.
Experience. Assessing multiple studies on teacher quality, teaching experience has been linked
to student score achievement. Research has demonstrated that novice teachers on average
produce smaller learning gains than more experienced teachers, and that teacher effectiveness
tends to increase over the first five years in a position, although effects of experience are not
conclusive after that five-year mark (Harris and Sass, 2007; Nye et al., 2004; Clotfelter et al.,
2007). Hanushek, Kain, O’Brien, & Rivkin (2005), would disagree; however, with research that
shows very little increase in student performance gains after the first year of teaching. Teacher
experience as a reliable characteristic to determine teacher effectiveness remains debatable.
Certification. In a quantitative analysis study by Darling-Hammond (2000), teacher qualities
affecting student achievement were measured controlling for student language and
socioeconomic status. Teacher preparation programs and teacher certification were by far the
strongest predictors correlating with student achievement in reading and math. Studies found in
math content areas especially, that deep knowledge of content is a teacher attribute that
correlates with positive student achievement. Math licensure test scores, certification, math
degrees, and math professional development all correlate to student achievement scores (Harris
and Sass, 2007; Goldhaber and Brewer, 1999; Clotfelter et al., 2007). Studies such as these,
which demonstrate the positive effects of teacher quality in areas such as teacher preparation,

32
certification, and years of experience, provided key findings that impacted teacher-quality
standards and resulted in the federal No Child Left Behind Act of 2001, which specifically states
that core teachers must be “highly qualified.”
An additional study by Wilson and Young (2005) substantiates the positive impact
teacher certification has on student achievement. After conducting eight large-scale studies
comparing certified math teachers’ to uncertified math teachers’ impact on student achievement
between 1985 and 2002, seven of the eight studies found positive correlations between teacher
certification and student achievement.
Undergraduate College Selection. A teacher’s selection of undergraduate college has been
considered to affect teacher quality. Studies dating back to the 1970s show teachers who were
more selective in choosing an undergraduate college later showed higher student achievement
(Ehrenberg & Brewer, 1994; Summers & Wolf, 1977). Clofter and colleagues (2004) pulled a
data set from administrators across North Carolina and discovered as part of their study that
teachers who attended more competitive colleges (as ranked in Barron’s Guide to
Undergraduate Colleges) went on to produce higher student achievement (Clofter et al., 2004).
Kennedy and colleagues (2008) offers the “bright, well-educated hypothesis”---that wealthier,
and, therefore, potentially more educated students often attend the most competitive universities
as the reason behind the data showing higher achievement from students attending more
competitive universities. Findings in the study suggest that “bright, well-educated people add 3-4
percent in student achievement gains” (Kennedy et al., 2008).
Advanced Degrees. Studies have found that teachers with graduate degrees are generally not
more effective in increasing student achievement than their colleagues who possess a bachelor’s
degree (Darling-Hammond 1995; Ferguson and Ladd, 1996). In a review of five different studies

33
performed by Rice (2003) it was determined that advanced degrees for teachers have no
significant impact on their students’ performance. Clofter et al., (2007) found similar findings in
that elementary teachers who possessed a master’s degree were actually less effective, on
average, than their colleagues without graduate degrees if advanced degrees were earned more
than five years after they began teaching. The one study Rice (2003) found that did show
achievement gains related to teachers with advanced degrees was for black students assigned to
such a teacher in an urban school setting.
While there is little to no effect of teachers with advanced degrees to student achievement
in elementary students, this is not the case in secondary schools, according to three studies with
similar findings. Both Goldhaber and Brewer’s (1997; 1998) and Clotfelter et al.’s, (2007)
studies showed that high school students assigned to teachers with graduate degrees in math and
science did show increased achievement compared to students assigned to teachers with
bachelor’s degrees.
Salary. Research shows that teacher salary is a weak predictor of teacher performance (Koedel
and Betts, 2007; Darling-Hammonds, 1995; Ferguson and Ladd, 1996). The newer policy
conversation regarding teacher compensation ties teacher salary to student achievement (most
often referred to as pay-for-performance) as the prior literature review describes. There are a vast
number of studies examining pay-for-performance through a variety of lenses, and scholars
continue to state that it is difficult for researchers to attempt to answer all the questions in just
one study.
Other Characteristics: Race as a factor of increased student achievement has been studied, but
comes with its own set of cautions, and the research has produced mixed results (Ferguson,
1998). Findings of these studies require careful analysis, and they often show a stronger relation

34
to urban settings than in less racially diverse environments. Higher teacher scores in entrance and
exit exams also show very low correlations to student achievement in the classroom.
Research shows inconsistent and, at times, inconclusive answers in regards to identifying
the teacher characteristics that can be used to define a good teacher. Overall findings show there
is little empirical evidence to create informed, reliable systems to reward or compensate teachers
based on qualifications or characteristics.
As the literature shows, the definition of teacher effectiveness changes dramatically when
adopting and implementing value-added models as the primary instrument to evaluate teachers.
Measuring and evaluating teachers with value-added models would be the fourth major change
to teacher evaluation and compensation in the United States if pay-for-performance plans persist.
The research shows multiple studies in support and in criticism of the stability of value-added
models as the sole measurement of teacher effectiveness, most analyzing teacher score
performance over one to two years. Before implementing reforms concerning teacher
compensation, evaluation, or reward systems, policymakers are encouraged to examine the
stability of teacher performance on student test scores over multiple years in various-sized
school districts to examine the stability and validity of value-added measurement for school
districts and teachers across the nation.

35
Chapter 3
Methods
Research Design. The purpose of the study is to analyze the stability of teacher test scores over
a three-to-six-year period. The study was purposefully conducted in a fairly large school district
for the state, size 5A4 (the second largest sized school district in Kansas), although much smaller
than metropolitan studies conducted. The rationale for this sample size was that if a larger school
district in the state struggles to show stability of teacher performance as measured by student test
scores, then smaller districts may struggle even more to show stability due to variation of
sampling size. This study evaluated the consistencies of teacher mean test scores from year to
year and looked for consistency in high and low teacher rankings year to year in math and
reading state assessment scores of students assigned to teachers. From teachers considered to
have stable results from year to year, demographic characteristics were analyzed in attempts to
derive any patterns to what might distinguish a high performing teacher from a low performing
teacher.
Participants and Sampling. In this study, the participants were elementary and middle school
teachers in a midsize school district of nearly 3,600 students in the state of Kansas. There are
approximately 12 elementary classes at each grade level in the district from four different
elementary schools, averaging three classes at every grade level in each school. The middle
school serves 7th
and 8th
graders only and administers the state assessment in reading and math to
students in both grades. The sampling size consisted of 48 teachers: 36 elementary teachers who
4 Kansas divides school districts into leagues based on enrollment for athletic competitions and championships.
This district studies is classified as 5A, with 6A schools as the largest 32 districts in the state of Kansas, followed by the next largest 32 districts classified as 5A, and the next 32 classified as 4A until the remaining districts are classified as 1A. All districts are re-evaluated each year according to changes in enrollment. Average daily attendance is 3480 students a day.

36
had both math and reading state assessment data available (one 6th
grade teacher had math
alone), and 12 teachers from the middle school (6 math teachers and 6 English teachers who,
because of their teaching assignments, had much larger data sets to study as they taught multiple
sections of math and English courses). Overall, there were 42 sets of math scores and 41 sets of
reading scores in the years between fall 2006 and spring 2012. This comprised 83 different data
points of math and reading student scores tracked over time for this study.
Teachers in the study had three to six years of state assessment score data and remained
at the same school at the same grade level for the designated years. Two elementary school
teachers were the exception, as they had only two years of student assessment data, but in both
math and reading. Teacher test scores utilized for this study required a teacher to be responsible
as the primary instructor for 3rd
, 4th
, 5th
, 6th
, 7th
, or 8th
grades. The test scores collected were both
math and reading state standardized assessment scores. Kindergarten, 1st, and 2
nd grade teachers
were excluded because they do not administer state assessments. High school teachers were
excluded because of a model in which students could retake the assessment one time in the
following school year under a different teacher. Descriptive characteristics, such as teacher
graduate degrees, teaching experience, and salary, as a few examples, were collected for the
random sample of teachers studied was varied. This information was used as a second
component of the study to identify if patterns could be identified among teachers with stable high
or low performance rankings. Table 1 shows a breakdown of teacher data in consecutive years.
Teacher Years Taught in Same Subject, Grade, and School Table 1
6 Yrs Math
Scores
5 Yrs Math
Scores
4 Yrs Math
Scores 3 Yrs Math
Scores 2 Yrs Math
Scores Teacher Totals
13 teachers 8 teachers 14 teachers 5 teachers 2 teachers 42 teachers
6 Yrs Reading
Scores 5 Yrs Reading
Scores 4 Yrs Reading
Scores 3 Yrs Reading
Scores 2 Yrs Reading
Scores Teacher Totals
11 teachers 11 teachers 10 teachers 7 teachers 2 teachers 41 teachers
37
Of the 3,600 students in attendance in this public school district, 49.92 percent are female
and 50.08 percent are male. 33.35 percent of these students receive free or reduced lunches.
Student ethnicities among the district are 5.89 percent African American, 13.19 percent
Hispanic, 73.28 percent White, and 7.64 percent Other. This district currently does not have
merit pay or pay-for-performance programs in place, although discussions are in place to adopt a
new teacher evaluation tool for the following year which will include student achievement as a
component to teacher evaluation.
Data Collection. Collecting student performance data on math and reading state assessments
was a two-part process. The public school state assessment database used by all Kansas school
districts, The Center of Kansas Educational Testing and Evaluation (CETE), can only provide
teacher-student matched state assessment scores for the 2010-2011 and 2011-2012 school years
due to their data collection process, with complete records for the 2011-2012 year. To match
teacher-to-student performance data on state assessment scores, it was necessary to first pull
student state assessment scores from the CETE website by year; and then cross-list each student
by student ID; and in some cases class, content area, and year, with class rosters obtained from
the school district’s archived student database records. An unexpected challenge in the data
collection process was a two-year period in two elementary schools during which 6th
grade
students were assigned to a homeroom teacher for most classes, yet traveled to another teacher
for math or reading instruction. The archived student records allowed for each of the students’
actual math and reading teachers to be identified with the correct student score, rather than
relying on homeroom assignments. The impact of this arrangement, especially for reading, is
discussed more in the discussion of findings.

38
Also collected were the following teacher characteristics to serve as proxies for teacher
descriptors in the study. This information was collected from the school district’s personnel
database to later be used in attempts to establish characteristics of consistently high and low
ranking teachers.
Teacher Characteristic Descriptors Table 2
Teacher Characteristics
Total years of teaching experience
Years of teaching experience in the school district
Years of teaching experience at the specified grade level
Other Grade Levels Taught
Age
Undergraduate College
Advanced Degrees (Content Related/Not Content Related)
Areas of Certification
Traditional vs. Alternative Certification
Teacher Salary
ELL Certification
To maintain teacher confidentiality, each teacher whose scores were collected for this
research study was assigned an identification number for the remainder of the study. Also, the at-
risk student population was accounted for through percentages of students receiving free and
reduced lunches. Percentage numbers of free and reduced lunches for each class for every school
year identified in the study was collected. This information was accessed and provided by the
Food Service Director of the school district.
Data Analysis. First, reading and math state assessment scores were pulled from the state
database housing site, CETE, for the 48 elementary and middle school staff included in this
39
study for the last six years of testing data. The state tests in both math and in reading were
redesigned in 2004-2005 and piloted in 2005-2006. According to the state testing department,
state assessments have not incurred significant changes with regard to grade level tests since the
2006-2007 data, the start of the data procured for this study.
For data compilation, each teacher was assigned their own Excel workbook with a file
each for math and reading, within each file were tabs for each year of assessments. Those tabs
contained the names of students individually assigned to them with state assessment score
performance for each individual for every year of available data.
Once student scores were matched with the corresponding math and reading teachers
responsible for direct instruction in the content area, another spreadsheet was created, identifying
which teachers had test scores in math, in reading, or in both, for each of the six years
researched. Teacher characteristics such as years of teaching, advanced degrees, salary, and
additional certifications, for example, were pulled and organized by teacher in a separate
worksheet.
The next step was to determine the SES associated with each class for each year in the
study. Free and reduced lunch data was used to account for the effects of student SES
(specifically identifying at-risk populations). Using a formula in Excel, percentages of students
receiving free and reduced lunches was calculated for each class in each year of the study. That
percentage was assigned to each teacher as his or her percentage of at-risk students. An
additional Free/Reduced column was added to include these percentages in the Excel worksheets
for math and reading scores for every teacher for each year.
State assessment averages for every subject, at every grade level, and for each teacher for
each class were calculated for each year using Excel. Then, a new list was made using only the
40
math and reading averages, also shown for each grade level and teacher for each year. District
averages for each grade, subject, and teacher were then calculated and added to the table. Lastly,
the district standard deviation was calculated to assess how each of the average scores varied
from the average of the subject, grade, and year. The district standard deviation was also added
to the table (see Appendix Table 1A). The purpose of this information was to calculate the Z
Scores by class to normalize the data.
Once Z Scores were established, two separate files were created, one for reading and one
for math, in which teacher residuals, Z Scores for each class, and the free and reduced percentage
for each class were listed for all years. Teachers without scores for the year were taken out of
that year’s list. A regression was then used to compute how far above and below the actual score
the teacher was from the predicted score based on the effects of the free and reduced
percentages. This showed the adjusted test scores of teachers taking out the effects of student
socioeconomic status. The residuals were graphed on a scatter plot in Excel with a line of best fit
established to provide a visual.
To determine correlations from one year to the next, a new spreadsheet was created in
which teacher residual data was displayed in rows, using the three to six years of data.
Correlations were calculated between year 1 and year 2, between year 2 and year 3, and so on
throughout the three to six years for each individual teacher.
To analyze stability or non-stability in teacher scores over time, teachers were ranked by
adjusted Z Scores (residuals) across the years, accounting for SES as part of the statistical model.
Grade levels were still associated with these teachers, as movement of one teacher could be
compared only with that of other teachers in their grade level to account for concerns of
assessments differing from one grade level to the next. Teachers were also ranked in both math

41
and reading adjusted scores and their movement tracked by placing them in quartiles of
performance, Quartile 1 for top performers and Quartile 4 for bottom performers, so that
movement between quartiles could be noted by percentages of teachers staying in the same
quartile from year to year, and of those in moving from one quartile to another. Data was tracked
and analyzed in several ways: by percentage of movement per grade level from one year to the
next in both math and reading, through non-consecutive year placement consistencies in quartiles
over time in both subjects, and by comparing quartile rankings of the top and bottom performers
in each grade level with prior years of quartile rankings in both math and reading. This data
compared both teacher performance and movement against other years to establish stability.
Lastly, teachers who showed relative stability, as either top or bottom performers, were analyzed
for similarities in characteristics and qualifications that might be useful in future personnel
policies and desired teaching qualifications.

42
Chapter 4
Findings
The initial purpose of this study was to examine the research question, is there stability
in teacher test scores over time? The plot graphs of Teacher Z Scores versus Free and Reduced
Lunch Percentage Scores (in Figures 1 and 2 below) for reading and math depict teachers who
scored above or below the projected scores with a line of best fit, essentially enabling
comparison between them, and the ranking of teachers in terms of yearly performance. Tables
A3 and A4 found in the Appendix show the statistical regressions calculated for both math and
reading. Findings from the residuals graphed conclude that more variability is shown in reading
residuals from line of best fit than in math. Both regression calculations showed a large and
significant relationship between free and reduced lunch and achievement scores, as could be
expected based on studies of at-risk students and achievement gains (Lampley and Johnson,
2010; Johnson, 2006).
Figure 1
-4
-3
-2
-1
0
1
2
3
0 50 100
Z
S
c
o
r
e
sFree and Reduced Percentages
Plot of Math Z Scores vs. Free and Reduced Lunch Percentages Scores
Class Z-Score
Linear (Class Z-Score)

43
Figure 2
-3
-2
-1
0
1
2
3
0 20 40 60 80Z-Sc
ore
s
%Free&Reduced
Plot of Reading Z Scores vs. Free and Reduced Lunch Percentages
Scores
Z-Scores
Predicted Z-Scores
Correlations of Data from Year to Year. Correlations of year to year teacher performance
were calculated for math and reading separately based on the residual data from one year to
another. Examinations of the patterns of correlation coefficients in math scores show there are
positive correlations between year to year residual scores. These correlations were moderate at
best, ranging from 0.4 to 0.7, with higher correlations in the more recent years of adjusted scores
district wide (see Table 3). The average correlation across all years was 0.48, which makes 23
percent of the variance, leaving more than three fourths of the teacher performance attributable
to something other than teacher effects.

44
Math Year to Year Correlations Table 3
2006-2007 2007-2008 2008-2009 2009-2010 2010-2011
2006-2007
2007-2008 0.441591
2008-2009 0.355849 0.546657
2009-2010 0.331904 0.302457 0.539203
2010-2011 0.251733 0.316154 0.488774 0.72359
2011-2012 0.379666 0.362823 0.419883 0.607361 0.631889
Correlations between year to year teacher performance in reading across grade levels
were also positive, but show very weak correlation coefficients of 0.18 and 0.2 for the first three
years of the study (from 2006-2007 through 2008-2009). In the latter two years of the study, the
correlations were moderate at 0.5 and 0.6, but still not strong. Table 4 shows year to year
comparisons of correlation coefficients for reading. The average correlation across all six years
was 0.3, showing a variance of 9 percent, leaving ninety-one percent of the variance not
accounted for by teacher effects.
Reading Year to Year Correlations Table 4
2006-2007 2007-2008 2008-2009 2009-2010 2010-2011
2006-2007
2007-2008 0.181927
2008-2009 -0.10924 0.210295
2009-2010 0.503478 0.273599 0.201883
2010-2011 0.172313 0.221492 0.217091 0.547867
2011-2012 0.157634 -0.0988 0.36133 0.358376 0.61526
From the correlation findings in both math and reading scores, correlations for teacher
math scores shows moderate stability, at best, from one year to another, meaning teachers’ scores
from one year had weak to moderate relationships with the next year of scores. Reading scores

45
were more volatile than math scores, with extremely low correlations in comparing the years
2006-2007, 2007-2008, and 2008-2009 with the following years. In years 2009-2010 and 2010-
2011, a more moderate relationship was found with the consecutive year of reading scores.
Teacher Performance Movement over Time. After teachers’ scores were normed and adjusted
to remove the effects of socioeconomic status, teachers were ranked by quartile for each subject
and year. (Tables A5 and A6 in the Appendix show teacher quartile rankings for math and
reading across all years of data). Stability of scores was first tracked by analyzing the adjusted
teacher scores from year to year, showing the percentage of teachers with stable scores from year
to year and those who moved quartiles from one year to the next. Table 5 below shows the
breakdown of tracked teacher math movement by grade level and the variability of teacher
stability from one year to the next. The findings show in math that with the exception of Year 3
to 4 and Year 4 to 5 data, teacher movement in this district varies from one quartile to another,
with percentages of overall movement from year to year being 83, 68, 45, 43, and 59 percent.
Teachers who stayed in the same quartile from one year to the next showed anywhere from 16 to
54 percent stability, with an average of 32 percent over the six years of data. The overall mean of
the six years of percentile movement tracked shows that 39 percent of all teachers will move
either up or down one quartile from year to year (shown at the bottom of Table 5). Also found
was that 20 percent (or fewer) of math teachers jumped two quartile rankings or more (either up
or down) from year to year, with a mean average of 11 percent over six years of data. At the
bottom of Table 5 below are the mean percentages of 32, 39, and 11 percent of all math teachers
who, respectively, stayed within their ranked quartile from one year to the next, moved to a

46
quartile above or below, or moved either up or down two quartiles away from their previous
ranking.
The findings for math at all grade levels show a bell curve of stability, with teachers
moving up or down one quartile from one year to the next as the majority of movement in
percentages, averaging 40-50 percent from year to year. Approximately 30 percent of the time
teachers stayed in the same quartile from one year to the next when looking at years overall (with
the exception of 4th
grade). The least often occurring teacher score movement was movement
two or more quartiles away, for example, from the top quartile to the bottom, which showed the
most variability of teacher stability. This frequency of movement to two or more quartiles away
ranged from 0-33 percent from year to year and on average accounted for less than 20 percent of
movement.
Math Teacher Movement in Percentage from Year to Year Table 5
3rd
Grd Math Teacher Movement Yr 1 to Yr 2 Yr 2 to Yr 3 Yr 3 to Yr 4 Yr 4 to Yr 5 Yr 5 to Yr 6 Mean
Same Quartile 0% 17% 43% 38% 22% 20%
Movement to Quartile Above/Below 60% 83% 43% 50% 78% 52%
Movement Two Quartiles Away 33% 0% 14% 0% 0% 16% 4
th Grade Math Teacher
Movement Yr 1 to Yr 2 Yr 2 to Yr 3 Yr 3 to Yr 4 Yr 4 to Yr 5 Yr 5 to Yr 6 Mean
Same Quartile 50% 57% 50% 60% 44% 43%
Movement to Quartile Above/Below 50% 29% 30% 20% 44% 28%
Movement Two Quartiles Away 0% 14% 14% 10% 11% 8%
5th
Grade Math Teacher
Movement Yr 1 to Yr 2 Yr 2 to Yr 3 Yr 3 to Yr 4 Yr 4 to Yr 5 Yr 5 to Yr 6 Mean
Same Quartile 0% 25% 50% 43% 43% 27%
Movement to Quartile Above/Below 50% 50% 17% 29% 57% 14%
Movement Two Quartiles Away 50% 25% 33% 29% 0% 23%
6th
Grade Math Teacher
Movement Yr 1 to Yr 2 Yr 2 to Yr 3 Yr 3 to Yr 4 Yr 4 to Yr 5 Yr 5 to Yr 6 Mean
Same Quartile 0% 0% 75% 50% 38% 27%
Movement to Quartile Above/Below 100% 0% 25% 33% 50% 35%
Movement Two Quartiles Away 0% 100% 0% 17% 12% 22%
7th
Grade Math Teacher
Movement (only 3 teachers tracked) Yr 1 to Yr 2 Yr 2 to Yr 3 Yr 3 to Yr 4 Yr 4 to Yr 5 Yr 5 to Yr 6 Mean
Same Quartile 0% 0% 67% 67% 100% 39%
Movement to Quartile Above/Below 100% 100% 33% 33% 0% 44%
Movement Two Quartiles Away 0% 0% 0% 0% 0% 0%
8th
Grade Math Teacher
Movement (only 3 teachers tracked) Yr 1 to Yr 2 Yr 2 to Yr 3 Yr 3 to Yr 4 Yr 4 to Yr 5 Yr 5 to Yr 6 Mean
Same Quartile 0% 0% 33% 100% 50% 31%
Movement to Quartile Above/Below 100% 100% 0% 0% 50% 42%

47
Movement Two Quartiles Away 0% 0% 66% 0% 0% 11%
Overall Math Teacher Movement Yr 1 to Yr 2 Yr 2 to Yr 3 Yr 3 to Yr 4 Yr 4 to Yr 5 Yr 5 to Yr 6 Mean
Same Quartile 16% 27% 54% 54% 41% 32%
Movement to Quartile
Above/Below 67% 54% 27% 32% 54%
39%
Movement Two Quartiles Away 16% 14% 18% 11% 5% 11%
The results of reading teacher movement from one year to the next provide similar
results, although reading percentages of movement overall were slightly more variable than
results of math movement alone. Similar to what is found in math percentages, there is an
increase of teacher stability percentages in reading in both Year 3 to Year 4 and again in Year 4
to Year 5. On average, the majority of teacher movement is in movement one quartile up or
down in ranking from year to year. Despite this, the percentage of reading teachers whose scores
stayed in the same quartile from one year to the next, those who moved up or down one quartile
to the next, and teachers jumping two quartiles up or down (essentially moving to the bottom or
to the top) all varied from 0-100 percent for each category and specific grade level, showing the
significant variance of teacher performance from year to year.
Overall means of reading movement varied less from one year to the next, while
individual teacher movement between quartiles was more volatile. The mean average of reading
scores for those maintaining the same quartile from one year to the next was 29 percent. The
mean of reading teachers moving up or down one quartile included the largest number of
teachers at 40 percent. Reading teachers who moved two quartiles away (top to bottom or bottom
to top) had a mean of 11 percent. Table 6 below shows both grade level stability as well as
overall stability across years.
Grade level reading teacher movement between quartiles shows more variability from
year to year, although averages of movement were similar to math’s average percentages of
movement across the six years of data. Because only three middle school teachers were tracked
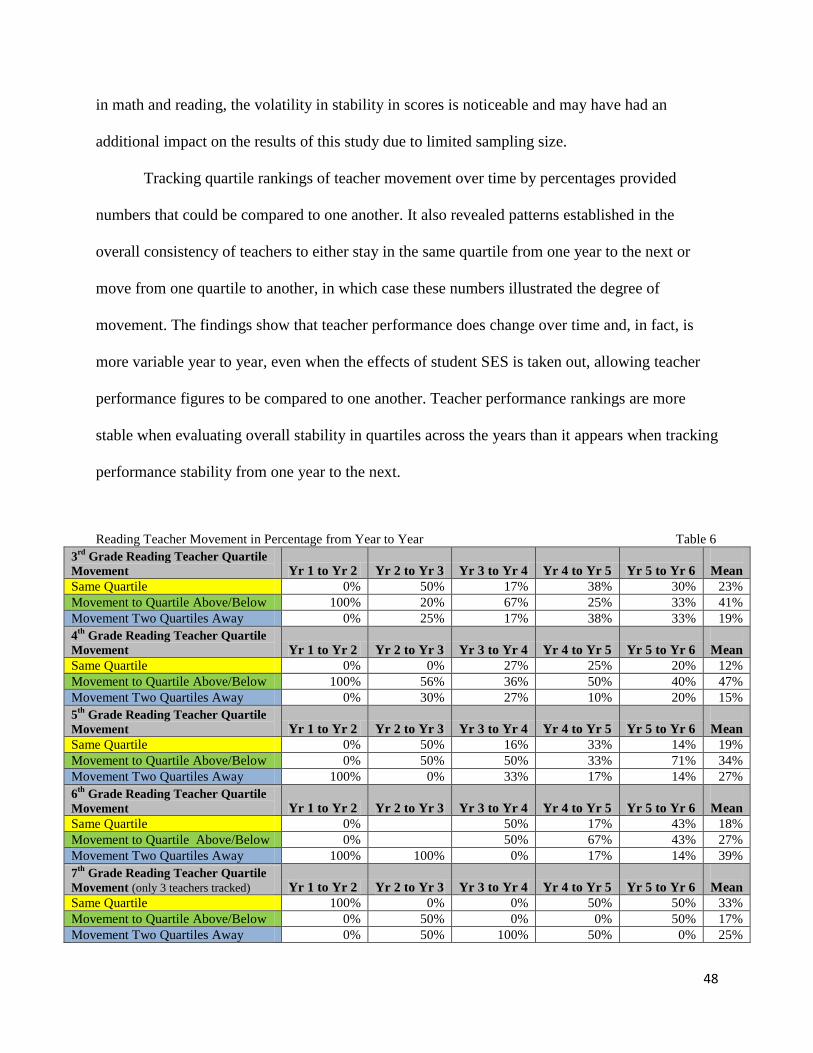
48
in math and reading, the volatility in stability in scores is noticeable and may have had an
additional impact on the results of this study due to limited sampling size.
Tracking quartile rankings of teacher movement over time by percentages provided
numbers that could be compared to one another. It also revealed patterns established in the
overall consistency of teachers to either stay in the same quartile from one year to the next or
move from one quartile to another, in which case these numbers illustrated the degree of
movement. The findings show that teacher performance does change over time and, in fact, is
more variable year to year, even when the effects of student SES is taken out, allowing teacher
performance figures to be compared to one another. Teacher performance rankings are more
stable when evaluating overall stability in quartiles across the years than it appears when tracking
performance stability from one year to the next.
Reading Teacher Movement in Percentage from Year to Year Table 6
3rd
Grade Reading Teacher Quartile
Movement Yr 1 to Yr 2 Yr 2 to Yr 3 Yr 3 to Yr 4 Yr 4 to Yr 5 Yr 5 to Yr 6
Mean
Same Quartile 0% 50% 17% 38% 30% 23%
Movement to Quartile Above/Below 100% 20% 67% 25% 33% 41%
Movement Two Quartiles Away 0% 25% 17% 38% 33% 19%
4th
Grade Reading Teacher Quartile
Movement Yr 1 to Yr 2 Yr 2 to Yr 3 Yr 3 to Yr 4 Yr 4 to Yr 5 Yr 5 to Yr 6
Mean
Same Quartile 0% 0% 27% 25% 20% 12%
Movement to Quartile Above/Below 100% 56% 36% 50% 40% 47%
Movement Two Quartiles Away 0% 30% 27% 10% 20% 15%
5th
Grade Reading Teacher Quartile
Movement Yr 1 to Yr 2 Yr 2 to Yr 3 Yr 3 to Yr 4 Yr 4 to Yr 5 Yr 5 to Yr 6
Mean
Same Quartile 0% 50% 16% 33% 14% 19%
Movement to Quartile Above/Below 0% 50% 50% 33% 71% 34%
Movement Two Quartiles Away 100% 0% 33% 17% 14% 27%
6th
Grade Reading Teacher Quartile
Movement Yr 1 to Yr 2 Yr 2 to Yr 3 Yr 3 to Yr 4 Yr 4 to Yr 5 Yr 5 to Yr 6
Mean
Same Quartile 0%
50% 17% 43% 18%
Movement to Quartile Above/Below 0%
50% 67% 43% 27%
Movement Two Quartiles Away 100% 100% 0% 17% 14% 39%
7th
Grade Reading Teacher Quartile
Movement (only 3 teachers tracked) Yr 1 to Yr 2 Yr 2 to Yr 3 Yr 3 to Yr 4 Yr 4 to Yr 5 Yr 5 to Yr 6
Mean
Same Quartile 100% 0% 0% 50% 50% 33%
Movement to Quartile Above/Below 0% 50% 0% 0% 50% 17%
Movement Two Quartiles Away 0% 50% 100% 50% 0% 25%
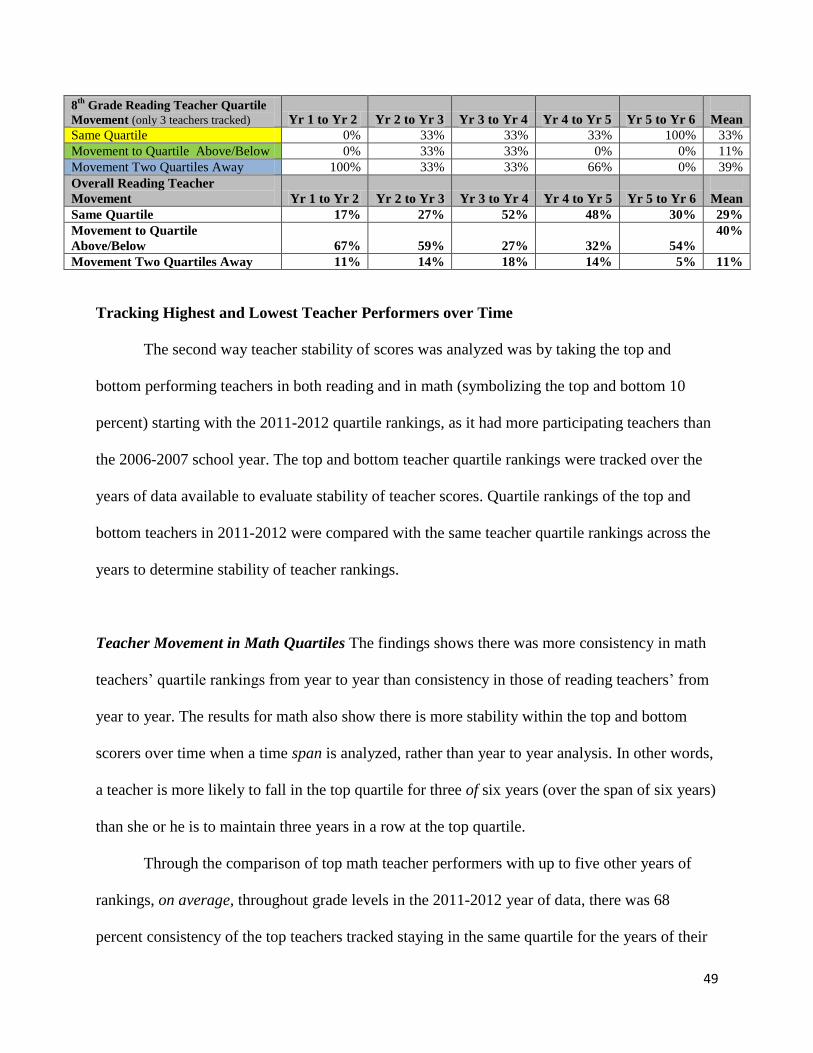
49
8th
Grade Reading Teacher Quartile
Movement (only 3 teachers tracked) Yr 1 to Yr 2 Yr 2 to Yr 3 Yr 3 to Yr 4 Yr 4 to Yr 5 Yr 5 to Yr 6
Mean
Same Quartile 0% 33% 33% 33% 100% 33%
Movement to Quartile Above/Below 0% 33% 33% 0% 0% 11%
Movement Two Quartiles Away 100% 33% 33% 66% 0% 39%
Overall Reading Teacher
Movement Yr 1 to Yr 2 Yr 2 to Yr 3 Yr 3 to Yr 4 Yr 4 to Yr 5 Yr 5 to Yr 6
Mean
Same Quartile 17% 27% 52% 48% 30% 29%
Movement to Quartile
Above/Below 67% 59% 27% 32% 54%
40%
Movement Two Quartiles Away 11% 14% 18% 14% 5% 11%
Tracking Highest and Lowest Teacher Performers over Time
The second way teacher stability of scores was analyzed was by taking the top and
bottom performing teachers in both reading and in math (symbolizing the top and bottom 10
percent) starting with the 2011-2012 quartile rankings, as it had more participating teachers than
the 2006-2007 school year. The top and bottom teacher quartile rankings were tracked over the
years of data available to evaluate stability of teacher scores. Quartile rankings of the top and
bottom teachers in 2011-2012 were compared with the same teacher quartile rankings across the
years to determine stability of teacher rankings.
Teacher Movement in Math Quartiles The findings shows there was more consistency in math
teachers’ quartile rankings from year to year than consistency in those of reading teachers’ from
year to year. The results for math also show there is more stability within the top and bottom
scorers over time when a time span is analyzed, rather than year to year analysis. In other words,
a teacher is more likely to fall in the top quartile for three of six years (over the span of six years)
than she or he is to maintain three years in a row at the top quartile.
Through the comparison of top math teacher performers with up to five other years of
rankings, on average, throughout grade levels in the 2011-2012 year of data, there was 68
percent consistency of the top teachers tracked staying in the same quartile for the years of their

50
analyzed data, although this was not the overall stability from year to year. When tracking
movement of math teachers who either stayed in the same quartile or moved one quartile down,
there was an average of 88 percent consistency within the grade levels over time.
The bottom performers showed only moderate stability over time (again, not
consecutively year to year). Fifty-four percent of top teachers in 2011-2012 state math scores
maintained the same quartile ranking for all years of data over time, and 77 percent of teachers
stayed either in the first quartile or moved to the second quartile. When top and bottom scorers
were tracked in movement from year to year, the averages were much lower. Movement
measured from 2011-2012 data was closer to overall teacher percentages, with an average of 37
percent of teachers maintaining the same quartile from one year to the next, 28 percent average
of top performers moving up or down one quartile, and 3 percent average of teachers moving
from the bottom to top quartiles. Bottom performers showed very similar results: 38 percent of
2011-2012 top and bottom teachers maintained the same quartile, 32 percent moved from one
quartile to the next, and an increased average of 21 percent movement was found in teacher
adjusted scores of those jumping two quartiles to the top. These percentages were found by
averaging the means of each the three categories of movement: stable, moving one quartile up or
down, and moving more than two quartiles away, across the years.
When tracking the highest and lowest performing math teachers over the available years
of test data and tracking the consistency of their scores in the same quartile over time, the results
showed a similar pattern of instability, shown in Figure 3. Only one of the top teachers from each
grade level was able to maintain the top quartile ranking every year for all six years. A clear
disadvantage in attempting to accurately track teacher movement in performance rankings is the
lack of the full six years of data for all teachers. Figure 3 shows that the top performing teacher
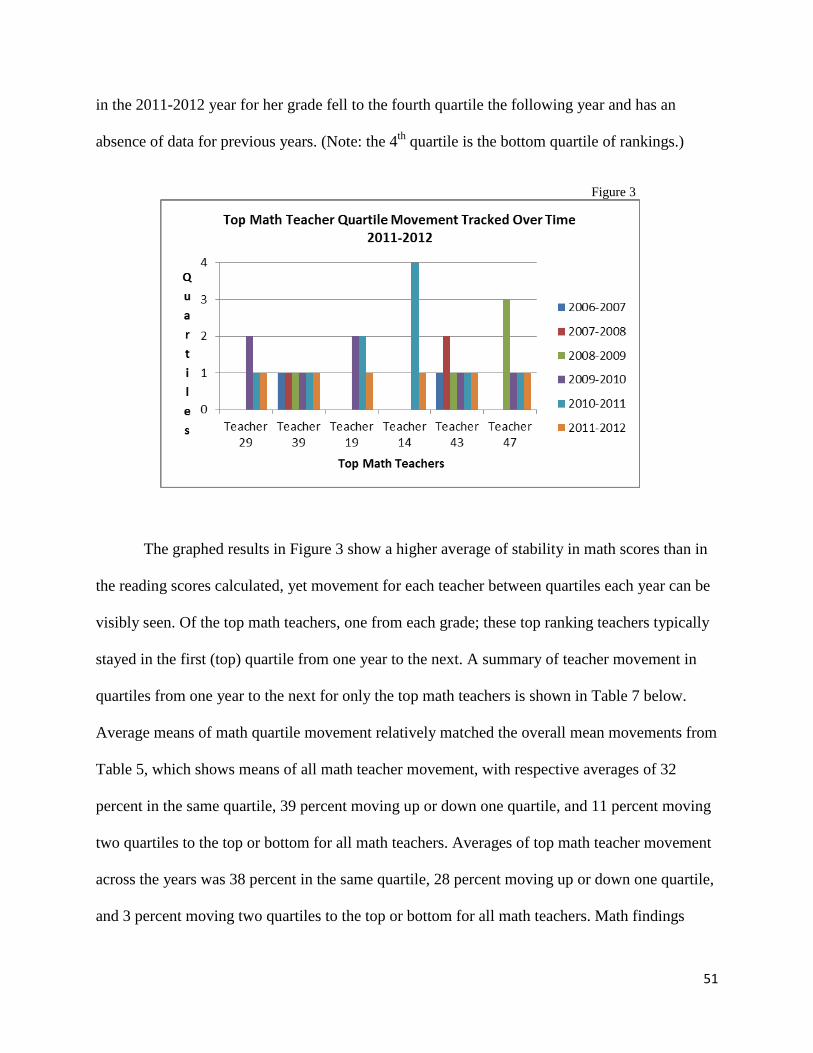
51
in the 2011-2012 year for her grade fell to the fourth quartile the following year and has an
absence of data for previous years. (Note: the 4th
quartile is the bottom quartile of rankings.)
Figure 3
The graphed results in Figure 3 show a higher average of stability in math scores than in
the reading scores calculated, yet movement for each teacher between quartiles each year can be
visibly seen. Of the top math teachers, one from each grade; these top ranking teachers typically
stayed in the first (top) quartile from one year to the next. A summary of teacher movement in
quartiles from one year to the next for only the top math teachers is shown in Table 7 below.
Average means of math quartile movement relatively matched the overall mean movements from
Table 5, which shows means of all math teacher movement, with respective averages of 32
percent in the same quartile, 39 percent moving up or down one quartile, and 11 percent moving
two quartiles to the top or bottom for all math teachers. Averages of top math teacher movement
across the years was 38 percent in the same quartile, 28 percent moving up or down one quartile,
and 3 percent moving two quartiles to the top or bottom for all math teachers. Math findings

52
showed slightly more stability in top performing teachers as a group than when looking at all
math teachers. (Note: Table 7 means do not add up to 100 percent due to not all teachers having
six years of data to use in year to year comparisons. Respectively, yearly comparisons of quartile
rankings were only used for teachers who had scores for both years compared, which were then
compared to one another).
Summary of Top Math Teacher Movement Percentages Year to Year 2011-2012 Table 7 Top Math Teachers All Grades
Tracked 2011-2012 Year
Year 1 to
Year 2
Year 2 to
Year 3
Year 3 to
Year 4
Year 4 to
Year 5
Year 5 to
Year 6
Mean
Same Quartile 50% 50% 66% 80% 66% 37%
Movement to Quartile Above/Below 50% 50% 33% 20% 17% 28%
Movement Two Quartiles Away 0% 0% 0% 0% 17% 3%
This pattern of instability, with the exception of about one third of top performing
teachers, shows that while some top ranking teachers can be recognized as top performers and
even rewarded as such, the other two thirds of top performers are moving out of the top quartile
the very next year.
Similar findings can be seen in the 2011-2012 bottom performers for each grade level
when tracked across the years to determine stability of bottom performance. Slightly more
stability was found in the bottom teachers compared to the averages of all teachers. For lowest
scoring teachers in 2011-2012 who maintained the same quartile from one year to the next there
was a mean average of 38 percent of bottom teachers who stayed in the same quartile. Thirty-two
percent of teachers showed movement up or down of one quartile from one year to the next, and
21 percent of teachers moved up at least two quartiles to the top quartile. Again, these averages
closely mirrored the overall average of movement between quartiles for all math teachers of 32
percent same quartile, 39 percent up or down a quartile, and 11 percent moving from top to
bottom or from bottom to top. Figure 4 depicts bottom math teacher quartile movement, which
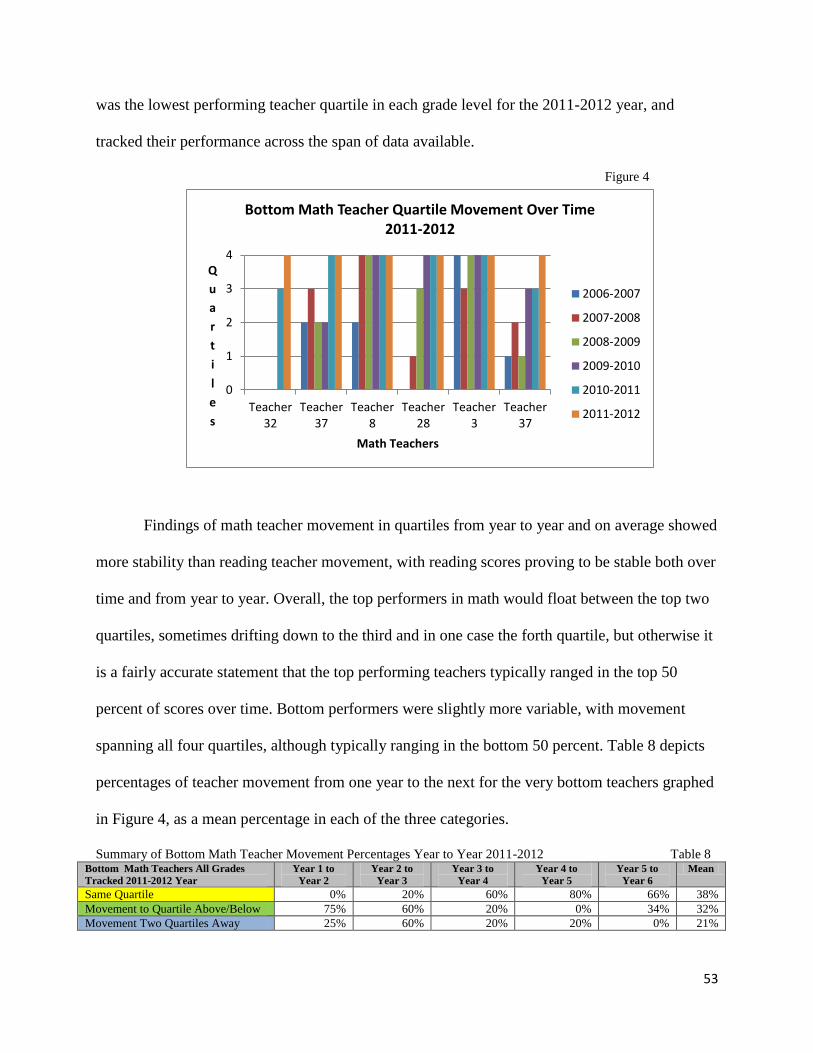
53
was the lowest performing teacher quartile in each grade level for the 2011-2012 year, and
tracked their performance across the span of data available.
Figure 4
0
1
2
3
4
Teacher32
Teacher37
Teacher8
Teacher28
Teacher3
Teacher37
Q
u
a
r
t
i
l
e
s
Math Teachers
Bottom Math Teacher Quartile Movement Over Time 2011-2012
2006-2007
2007-2008
2008-2009
2009-2010
2010-2011
2011-2012
Findings of math teacher movement in quartiles from year to year and on average showed
more stability than reading teacher movement, with reading scores proving to be stable both over
time and from year to year. Overall, the top performers in math would float between the top two
quartiles, sometimes drifting down to the third and in one case the forth quartile, but otherwise it
is a fairly accurate statement that the top performing teachers typically ranged in the top 50
percent of scores over time. Bottom performers were slightly more variable, with movement
spanning all four quartiles, although typically ranging in the bottom 50 percent. Table 8 depicts
percentages of teacher movement from one year to the next for the very bottom teachers graphed
in Figure 4, as a mean percentage in each of the three categories.
Summary of Bottom Math Teacher Movement Percentages Year to Year 2011-2012 Table 8 Bottom Math Teachers All Grades
Tracked 2011-2012 Year
Year 1 to
Year 2
Year 2 to
Year 3
Year 3 to
Year 4
Year 4 to
Year 5
Year 5 to
Year 6
Mean
Same Quartile 0% 20% 60% 80% 66% 38%
Movement to Quartile Above/Below 75% 60% 20% 0% 34% 32%
Movement Two Quartiles Away 25% 60% 20% 20% 0% 21%

54
Teacher Movement in Reading Quartiles. Movement of reading teachers proved to be more
volatile, with year to year percentages in reading movement varying more widely than math.
When top and bottom reading teachers were tracked in quartile movement from year to year, the
overall consistency of reading teachers maintaining a quartile over the years of data available
was lower than math. For example, in 2011-2012 top scoring reading teachers could only
maintain a 49 percent average for staying within that quartile (compared to math with a 68
percent average). Only 66.5 percent of reading teachers on average were able to stay in the same
quartile or within one quartile of movement. Figure 5 and Table 9 show two different
illustrations of top reading teacher quartile movement from one year to the next, providing a
visual that shows the variability from year to year with each top teacher tracked. (Note: 1st
quartile represents the top, “most effective,” teachers and the 4th
quartile the bottom, “least
effective,” teachers.)
Figure 5
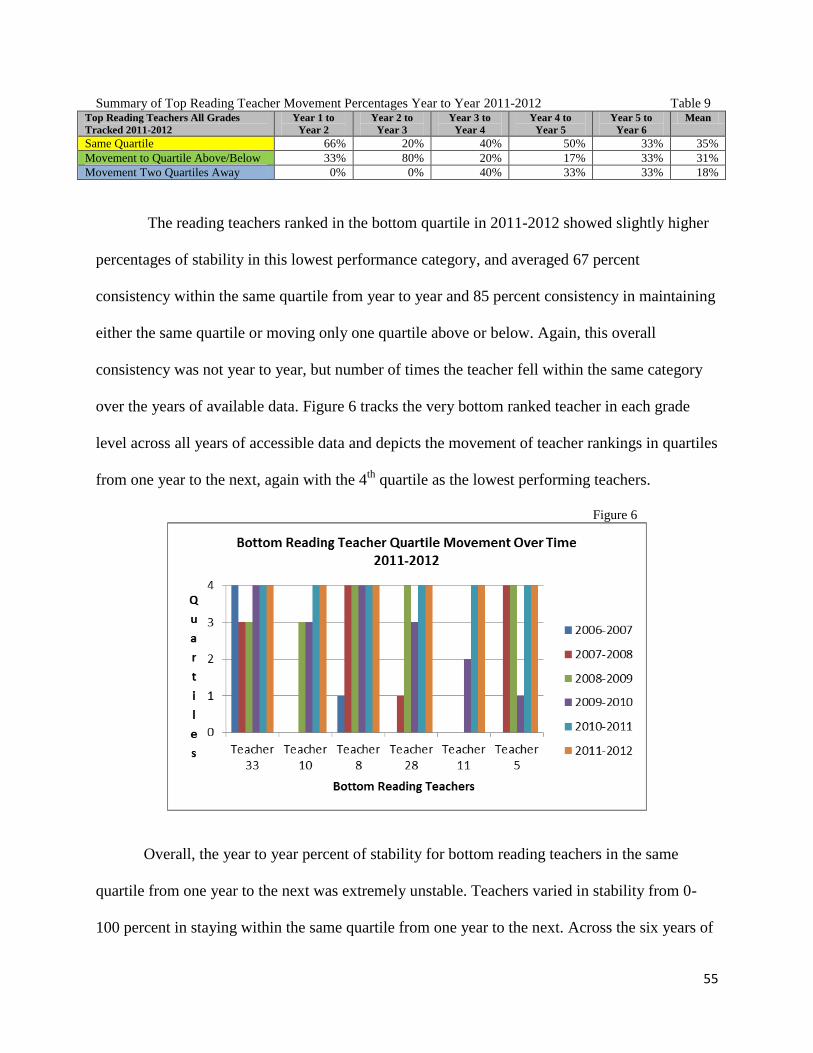
55
Summary of Top Reading Teacher Movement Percentages Year to Year 2011-2012 Table 9 Top Reading Teachers All Grades
Tracked 2011-2012
Year 1 to
Year 2
Year 2 to
Year 3
Year 3 to
Year 4
Year 4 to
Year 5
Year 5 to
Year 6
Mean
Same Quartile 66% 20% 40% 50% 33% 35%
Movement to Quartile Above/Below 33% 80% 20% 17% 33% 31%
Movement Two Quartiles Away 0% 0% 40% 33% 33% 18%
The reading teachers ranked in the bottom quartile in 2011-2012 showed slightly higher
percentages of stability in this lowest performance category, and averaged 67 percent
consistency within the same quartile from year to year and 85 percent consistency in maintaining
either the same quartile or moving only one quartile above or below. Again, this overall
consistency was not year to year, but number of times the teacher fell within the same category
over the years of available data. Figure 6 tracks the very bottom ranked teacher in each grade
level across all years of accessible data and depicts the movement of teacher rankings in quartiles
from one year to the next, again with the 4th
quartile as the lowest performing teachers.
Figure 6
Overall, the year to year percent of stability for bottom reading teachers in the same
quartile from one year to the next was extremely unstable. Teachers varied in stability from 0-
100 percent in staying within the same quartile from one year to the next. Across the six years of

56
comparisons, mean averages of teachers staying in the same quartile was 38 percent, the largest
group. Table 10 below shows the percentages of stability for the bottom teachers tracked over
time, one for each grade level. Similar to math, the means of top and bottom reading teachers
does not add up to 100 percent due to the fact that not all teachers had data to compare from one
year to the next.
Summary of Bottom Reading Teacher Movement Percentages Year to Year 2011-2012 Table 10 Bottom Reading Teachers All Grades
Tracked 2011-2012
Year 1 to
Year 2
Year 2 to
Year 3
Year 3 to
Year 4
Year 4 to
Year 5
Year 5 to
Year 6
Mean
Same Quartile 0% 75% 20% 33% 100% 38%
Movement to Quartile Above/Below 50% 0% 40% 33% 0% 21%
Movement Two Quartiles Away 50% 25% 17% 33% 0% 21%
A last look at instability of teacher scores can be seen in overall movement of bottom
reading teachers from one year to the next. When tracking bottom ranked reading teachers only
from year to year for stability, 66 percent of teachers maintained the bottom quartile from Year 5
to Year 6. Only 55 percent of those same teachers maintained the same quartile from Year 4 to
Year 5 to Year 6. When tracking these quartile rankings to examine the relationship between
Year 3 to Year 4, only 33 percent of those same teachers maintained the bottom quartile,
showing, in this case, that instability increases the broader the span of years that are studied.
Top performers in reading were slightly more variable than top performers in math. The
top performing reading teachers in 2011-2012 typically maintained 1st and 2
nd quartile rankings,
but on occasion dipped into third and fourth quartiles more so than did those in math. Bottom
performing reading teachers tended to stay in the bottom 50 percent (3rd
and 4th
quartiles).
Stability of Value-Added Teacher Rankings in Dual Subject Teachers
Of the top and bottom performing teachers who taught both math and reading in 2011-
2012, elementary teacher rankings were studied for commonalities in teachers’ rankings between
57
math and reading subjects. Findings showed only one elementary teacher ranked as a top
performer in both math and reading, and two of the very bottom-ranked elementary teachers
were consistently the worst performing teacher for their grade in both math and in reading for the
2011-2012 school year. Of the 36 elementary teachers who had student scores in both math and
reading, 11 (31 percent) of these teachers remained in the same value-added category in math
and in reading in the 2011-2012 school year. An additional 16 (44 percent) of elementary
teachers with both math and reading scores were ranked within one quartile of their math or
reading score.
Characteristics of Top and Bottom Performing Teachers
Goldhaber (2002) proposed a question that directly relates to the latter part of this study,
“What does the empirical evidence have to say about the specific characteristics of teachers and
their relationship to student achievement?” (p 50). The purpose in assessing this relationship is to
evaluate the connection between effective and non-effective teachers and their respective,
specific characteristics, which could then lead to better identification of good teachers. The
results of this study showed that of the top and bottom teachers analyzed for stability of math
scores over time, there were two math teachers who maintained top quartile performance in
either five or six years out of the six years of data available. Similarity in characteristics between
these two consistently top performers included their both having taught 30 years or more, being
of similar age, and both teachers possessing a master’s degree. Differences in characteristics
included gender; certification (one taught middle school math and the other fourth grade); and
their colleges, as one attended a Division II university and the other a Division I. The bottom
math scorers who had four to five consistent years of bottom scores were equally inconclusive in
identifying similar characteristics. Differences included age, building level certification, grade

58
taught, and colleges attended. Two of the teachers had master’s degrees in their fields. The only
similarity these teachers had in common was their gender, years of experience (13-15), and age,
as both teachers were in their 30s.
Of the top and bottom teachers analyzed for stability of both math and reading scores
over time, there was only one teacher who maintained the top reading quartile at over 50 percent
consistency and was one of the top performers in math over time as well. There were three
teachers identified as consistently in the bottom reading quartile with 66 percent consistency or
more. These teachers had little in common but approximate age (30-40 years) and that their
gender was female. These teachers graduated from different universities, one maintained an
additional ELL certification, two were elementary and one middle school certified, and their
years in the teaching profession ranged from 15-20. One of these teachers additionally had an
additional endorsement in math certification and a behavioral license to work with emotionally
disturbed students. In this case, two of the three bottom performing teachers had master’s
degrees in their fields. The small sampling size directly contributed to the instability of teacher
scores over time, making results in identifying characteristics of stable teachers, effective or non-
effective, inconclusive.
The findings presented in Chapter 4 address the research question, is there stability of
teacher test scores over time? Overall, results show there were weak to moderate correlations
in year to year analysis of teacher effects on student test scores over time, with weaker
correlations in reading than in math. While there is approximately an average of 30 percent
stability of teacher scores from one year to the next, the majority of teacher movement in
consecutive years accounts for 50 percent of all quartiles, which demonstrates quite variable
movement and instability of teacher scores when examined over time.

59
Chapter 5
Discussion of Findings
Few would argue that the teacher is the common denominator in student achievement
(Stronge et al., 2011; Palardy and Rumberger, 2008). Student achievement is just one measure of
teacher performance, however, with value-added models as one specific tool that could be used
to determine teacher effectiveness. In an era of educational reform and increased accountability
pressures nationwide, policy makers continue to look for better ways to measure, identify, and
assess effective teachers. This endeavor, however, must first look at teacher performance over
time, not only in two or three year data snapshots, in which this data can appear more stable in
shorter time spans than it does when examined over a longer period. Additionally, caution should
be exercised in using value-added models alone for major evaluation purposes, as results tend
towards moderate to low stability over time.
Teacher Movement over Time as Compared to Other Findings
Results from this study aligned very closely to results found in both Koedel and Betts
(2007) and McCaffrey et al., (2008) with the caution that they split the teacher rankings in
quintiles rather than quartiles. Where this study found top and bottom rankings teachers to stay in
the same top and bottom quartiles from year to year 37 percent of the time, the Koedel and Betts
and McCaffrey studies found that 25-33 percent of their teachers tracked in the top and bottom
quintiles stayed in the same quintiles from year to year, and roughly 10-15 percent of teachers
moved up from the bottom quintile or down from the top quintile. In total, their results showed
an average of 12 percent of the lowest and highest performing teachers moving up from bottom
quintiles or down from top quintiles. McCaffrey and colleagues (2008) found instability in value-
added rankings in an analysis of five urban school districts in various parts of the country, results

60
that are also comparable to this study’s findings. Yet, their results show more instability due to
the use of quintiles instead of quartiles. These research findings showed that of the teachers
ranked in the bottom quintile of teacher effectiveness in one year, only 25-35 percent were
ranked in the same quintile the following year. Of teachers in the top quintile one year, only 20-
30 percent were ranked in the same quintile a year later, while about the same percentage of
teachers fell to the bottom quintile of performance.
McCaffrey and colleagues (2008) discovered a moderate correlation at best of 0.2 to 0.3
between value-added rankings of math teachers in various elementary and middle school years in
Florida schools when studying the stability of teacher effectiveness on student achievement
gains. This study found slightly more moderate correlations of 0.48 on average in math. Ranking
teachers in quintiles, McCaffrey and colleagues’ results showed that consistent to this study, 25-
30 percent of teachers were stable in their quintile ranking from one year to the next, while 10-15
percent of teachers moved from the bottom quintile to the top, with an equal number falling from
the top quintile to the bottom the following year. Put into a context in which teachers would
receive bonuses for scoring in the top 20 percent using value-added measurements, about one
third of the teachers would receive a bonus two years in a row, and one in 10 teachers who
receive a bonus one year would be ranked in the bottom quintile of teachers the next year (Sass,
2008). In this same study by McCaffrey et al. (2008), they found many of the inconsistencies
discovered could be attributed to “student-level variation in test performance over time” and not
to true teacher changes in their teaching productivity (Sass, 2008). Explained differently, student
learning gains from year to year alter without concrete explanation. Changes in family dynamics,
peer-related issues, and motivation all contribute to the variability found in studies using teacher
value-added models in their student scores from year to year. “Financial awards [given] to
61
teachers based on these models would likely result in substantial differences in the so‐called
“best” teachers from year‐to‐year” (Buddin et al., 2007). McCaffrey and colleagues’ 2008 study
was the only study (other than this) that tracked teacher stability over five years of teacher scores
based on these models. While the study had a much larger sample size of five major metropolitan
areas, the results from their study were very similar to the results of this research, perhaps
because of the similarities in studying longer time spans.
Newton et al. (2010) ran a similar study across five different school districts using several
different models and ranked teachers by movement across deciles. Their results were also
similar, with variances accounted for between the models used. Comparing their data over years
to the data from this study, the numbers were similar to those found in this midsized district.
Newton and colleagues (2010) found that only 20-30 percent of teachers in the bottom 20
percent of scores had the same rankings the following year. The same results were found for
teachers scoring in the top of the distribution from one year to the next. This study’s results
actually showed more stability in teachers remaining in one quartile from one year to the next
than Newton and his colleagues found. Overall, Newton and his colleagues found that most
teacher scores moved to other parts of the decile distribution from one year to the next. Similar to
the findings from McCaffrey et al. (2008), Newton and colleagues, supported by Briggs and
Dominique (2011), found that observations of teacher effectiveness changes “significantly”
depending on the statistical methods used.
Williams and Sanders (1995) found different results, however. Their study shows the
correlation of predicted scores to actual scores was 0.8, where the correlations found in math and
reading in our study averaged 0.48. In Williams’ study, the variance accounted for was about
two- thirds, or 64 percent, showing that 33 percent of the variance in the actual scores was not

62
accounted for in the model constructed (Sanders, 2009). Newton et al., (2010) found similar
results as well. While they compared teacher rankings over years based on five different models
for two years of data, (2005-2006 and 2006-2007), they found a modest correlation of 0.4 for
reading teachers and a more moderate correlation of 0.6 for math, although the correlation was
lower without the inclusion of fixed school effects. Newton et al.’s English teacher data
correlation of 0.4 was nearly identical to the average of 0.48 found in this study for reading
teachers. Their correlation of 0.6 for math was slightly higher than the 0.5 correlation found in
this study. Newton and colleagues’ study also found that while correlations were much higher in
year-to-year performance, teacher rankings were also found to be unstable in the two-year period
they studied. Fluctuation of teacher rankings varied the greatest across courses and years, rather
than from year to year time frames, in some cases moving eight deciles over time (Newton et al.,
2010). As a result of more student variables accounted for in this value-added model, Newton
and colleagues were able to clearly find that student characteristics do affect teacher performance
and should be accounted for in use of value-added models. This study closely resembled work
from McCaffrey et al. (2008), and Koedel and Betts (2007), but over a longer duration of time
and in a mid-sized district.
Rationale for Volatility in Teacher Test Scores
Before assessing policy implications for the use of value-added models in teacher pay-
for-performance plans, considerations must be given first to understanding why teacher
performance appears unstable over time. “It should be noted that even value-added measures
have a certain degree of “noise”— measurement error that reduces the validity of performance
distinctions between teachers and schools—that needs to be considered” (Center for Educators

63
Compensation Reform, 2012). If instability of teacher performance is tied to testing “noise,” then
legitimate concerns about tying financial incentives or rewards to measures that include elements
beyond a teacher’s control must be given consideration. The work of McCaffrey and colleagues
suggests that additional statistical layers be put into place to account for such factors to make
results more accurate. Yet as Sass (2008) discusses, “such procedures come at a cost of reducing
the transparency of teacher quality measures,” or in other words, further complicate an already
complex evaluation system for teachers. Policymakers should consider the negative impact that a
difficult to understand statistical model could have on prospective teachers heading into the field.
McCaffrey et al. (2008) also found unexplainable student learning gain variations from
one year to the next. He found that the causes of unstable teacher results have more to do with
student variation in test performance over the years due to factors not necessarily tied to teacher
performance. Sass (2008) supports the notion that, unlike student variation of scores from year to
year with relatively unknown causes, variation of teacher performance from one year to the next
may be attributed to additional factors, stating “….the observed variation in measured teacher
performance over time is not necessarily a bad thing”. Teacher movement in rankings over time
may be attributed to teacher quality variance from one year to another, alluding to changes in
teacher productivity, or increased teaching competency due to additional training. Instability of
teacher scores over time appearing as a much smaller percentage could potentially identify weak
instructors or show a declining pattern of effectiveness. However, compared to studies with a
majority of consistently unstable scores, which this study also discusses, it leaves room for doubt
in counting on value-added models as the sole evaluation tool of teacher performance.
Another consideration that affects teacher movement over time is the type of instrument
used to test students and evaluate teachers. States such as California and Texas have changed
64
their statewide testing instrument over the past several years, which inspired a comparison study
from Harris and Sass (2010) in the state of Florida in which stability of student scores were
compared with those of the Sunshine State Standards test (SSS) and the Stanford Achievement
Test (NRT), a norm-referenced assessment. Results from this study showed that 70 percent of
teachers ranking in the top quartile on the SSS ranked in the top two quartiles of the NRT.
However, cross-exam correlations measuring teacher effects is .48, much higher than the year to
year correlation of NRT teacher scores of 0.27. This shows that different high stakes assessments
could result in different teacher rankings and must be considered, especially when assessments
change or if teachers are rewarded based on student performance over time.
Kane and Staiger (2008) found that volatility of test scores comes from two major
sources. The first is sampling variation, or lack thereof, especially found in elementary
classrooms where numbers of students testing per grade level is often fewer than 65. While
averaging test scores often reduces fluctuation, the smallest variances demonstrate an impact in
these averages. In the case of this school district, there was little diversity among students, and
the number of special education students placed in individual classrooms was not accounted for
in the study. Some public education classes are designed to support special education students
with a paraprofessional or co-teaching support staff. While this was not part of the study, it could
have affected teacher scores if students were not truly assigned at random to teachers over the
course of the six years studied or had unaccounted for assistance. While socioeconomic status
was controlled for and is a large predictor of at-risk students (Placier, 1993), a measurement of
poverty through SES is often not entirely accurate, as some parents do not apply for these
programs. Controlling for these factors in addition to SES may show different results. The
second source of volatility in teacher test scores could be attributed to one-time factors such as
65
disruptions in the test environment, student illness, or even “favorable chemistry” between
certain students and their teacher. This volatility could change from year to year, affecting
student performance, and may explain the oddities found in student variance in performance
from year to year, therefore also impacting teacher performance and their rankings of
effectiveness.
Few studies have examined the relationship of teacher effects on the stability of student
test scores for more than one to three years at a time. Examining this relationship over a longer
period of time in a midsize school district provides a different lens through which assessing
teacher performance as part of an evaluation or personnel tool should be viewed in before
statewide implementation begins. A midsize district, such as the one used in this study, would
have a difficult time establishing consistency of stable scores over time, and therefore would
struggle to make accurate evaluative personnel decisions due to the instability of teacher scores.
Policy Implications
The importance of these findings is applicable to policy discussions regarding how
teachers may be evaluated based on student performance. The results of this study show that
because teacher performance can vary significantly from year to year, one-or two-year snapshots
of standardized student test score data cannot accurately assess a teacher’s effectiveness or
ranking, nor is this ranking stable over time. These findings should be considered in regard to
teacher pay-for-performance plans, by which teachers are financially rewarded for higher student
performance. For example, based on these findings, if teachers were rewarded bonuses for their
performance based on value-added scores from one year to the next, about 30 percent of teachers
would be rewarded for two years of consistent data, and one in 12 teachers who received the

66
bonus for their initial performance would fall into the bottom ranked teachers for the next year.
Policy makers must consider the implications of rewarding teachers for high student achievement
if teachers cannot consistently produce quality results from one year to the next, especially when
teacher quality measurements remain uncertain. The same scenario applies for teachers ranked in
the bottom quartiles of this study. As more consistency was found in teacher scores over a time
span rather than from year to year (especially in reading), policy makers must take into
consideration that using value-added data for personnel reasons, such as teacher dismissal, based
on student testing data performance for one or two years at a time may not be a responsible
decision. Even when assessing stability of teacher scores over the years versus from one year to
the next, the highest percentage of consistency on average in non-consistent performance of
teachers staying in the same quartile across the years was 67 percent, showing that major policy
changes still cannot be made based on semi-stable results over time.
It was more difficult to establish stability of reading teachers than it was math teachers,
perhaps due to outside contributable factors such as parent or other teacher and course support in
reading instruction. Math results may have been more stable because the majority of math
instruction occurs in the math classroom, while more parents and outside sources, including
other teachers, play a role in reading development. Comparative studies typically did not
separate reading and math scores, so additional study in this area would be needed to assess if
math teachers actually have more stable scores than reading teachers over time.
Using Value-Added Models for Teacher Evaluation Purposes
With Obama’s Race to the Top Initiative, policy makers are looking for a more
quantifiable, objective method for measuring teacher performance than the established measures.
67
Implementation of value-added models has resulted in pay-for-performance programs,
monitoring of school and teacher performance according to VAM standards, and public ranking
of teaching personnel. In some districts value-added models have become embedded in teacher
evaluation programs, in some cases affecting tenure status. This study was designed to observe
the stability of teacher scores on standardized assessments over time, not for use in pay-for-
performance or teacher evaluation programs. However, because value-added models such as the
one used in this study are currently being considered for use in teacher evaluation systems
statewide, caution must be exercised in how this data is used. While the observation-only style of
evaluations is said to be flawed (Peterson, 2000; Stronge & Tucker, 2003), relying solely on
another single system of measurements, such as value-added models, as the sole method of
observation is equally flawed (Peterson, 2006). Based on a review of the results of this study, it
is not recommended to make high-stakes decisions based on one to two years of teaching data,
especially in smaller school districts where volatility of data may be increased due to sample
size. Secondly, since stability of teacher test scores was not established, it is suggested that
valued-added models should be utilized as only one part of a teacher evaluation program, and not
as the sole basis for high-stakes decisions regarding teacher personnel issues.
Debate continues whether value-added models can identify teacher effectiveness with
sufficient accuracy to be used for evaluation purposes, and yet the question remains: How should
we use the results of value-added models? The findings here show there is enough evidence of
instability in the scores for policymakers to question the stability of teacher scores over time
when measuring effectiveness through value-added statistical models. “The research base is
currently insufficient to support the use of VAMs for high-stakes decisions about individual
teachers or schools” (McCaffrey et al., 2005). A further complication to be considered is the

68
appropriate use of value-added scores of elementary teachers who are responsible for both math
and reading instruction and who would be evaluated for performance in both areas.
Also to be considered is if the amount of data available for each teacher is sufficient for
objective personnel decisions to be made. The accuracy of the measurement of a teacher’s
performance using value-added models varies depending on the amount of data available for
calculation. “Teachers with less data are evaluated with less precision” (Kupermintz et al., 2001).
This study showed that evaluating a teacher based on a two-year performance of test scores
might lead to a different personnel or evaluative decision than would looking at a teacher’s
performance over the course of multiple years. Consecutive year-to-year data is much less stable
than the overall consistency of rankings across a given time span.
High school teacher performance numbers were specifically omitted from this study, as
the state’s current testing procedures allows for a student to retest the following year under a
different teacher, which would skew the data. Yet another point of concern in using value-added
models with secondary schools is the course assignment and impossible-to-track impact that
other teachers may directly have on one subject area’s test scores, such as reading. For example,
a high school social studies teacher may be effective at teaching students how to read complex
texts and answer questions by use of specific, research-based strategies. The same student may
employ these reading techniques on their reading assessment, yet it would be their English
teacher that would benefit from the student’s knowledge and ability used on the reading state
assessment. The situation of the social studies teacher may also apply to a particularly effective
former teacher whose teaching directly impacts the student’s performance the following year in
the same subject. Policy makers must also consider how they would evaluate teachers who have
high value-added scores in math but not in reading or vice versa, as is sometimes the case in this
69
study for elementary teachers. Findings from this research showed that only 16 percent of the
elementary teachers studied had the same value-added rankings for both reading and math, with
another 44 percent of teachers ranked in a quartile above or below their reading quartile rankings
compared to their math quartile rankings. If teachers are evaluated on value-added performance
scores, variable performances between math and reading performance should be taken into
consideration. Assessing how to most fairly hold all teachers accountable for standardized
assessment performance continues to be a challenge across most states, especially in secondary
schools, where elective teachers may be evaluated differently.
While discourse continues over the use of value-added models for teacher evaluation and
personnel decisions, considerations should be given to using student achievement data, (i.e.,
teacher performance data), as one of the pieces for evaluating teachers. Harris and Sass (2007)
along with Jacob and Lefgren (2008) both found that principals can effectively identify which
teachers will have the most impact on student achievement, and that principals are better
predictors of teacher “ value-added inputs” than are characteristics such as experience or
education. Value-added performance measures could be utilized in tandem with performance
measures and additional evaluation criteria such as student and parent surveys, portfolios which
demonstrate evidence of student learning, other pre- and post-assessments, classroom
walkthroughs, and other evidence of student learning as specific accomplishments tied to the
curriculum.
Study Limitations and Further Considerations
This study was purposefully designed to assess teacher effects on student scores over
time in a midsize district. Sampling size could be considered an issue, as only approximately 10

70
different sets of teacher test scores were tracked in each grade level, with even fewer (an average
of three) for middle school grades. This most likely increased the variability of movement in the
results from one year to the next. However, this was partly the purpose of the study in assessing
how a midsize district might fare under a policy which evaluates teachers based on test scores
over time. Because of the smaller sample size of teachers, relative to those of the national studies
conducted, quartiles, rather than quintiles, were used to rank teachers. This may have
inadvertently accounted for the similarity of teacher movement between present and outside
studies. However, if quintiles had been used in this study, due to the smaller sample size much
larger variance and teacher movement between quintiles would have been seen.
While the district size was unique to this study, there were also several limitations to and
challenges in the study that must be considered. First, there was the absence of a collection tool
that could provide teacher performance on test scores or even tie student performance to a
specific teacher. This required student names to be matched to their teachers using data from two
different data systems. An unexpected challenge with collecting data for the study was found in
the 6th
grade of one elementary school, where students traveled to another 6th
grade teacher in
their building for all math instruction for two consecutive years, and for one year, traveled to
another teacher for reading instruction. This posed an additional difficulty as there was missing
data for those years of instruction for the other 6th
grade teachers, and a much larger data set for
the teachers who taught these multiple sections of math and reading to the students who traveled
to them. A known challenge going into this study was the range of data to be assessed and the
fact that not all math and reading teachers had six years of consecutive data in in the same
building and grade level. Teachers had three to six years of test scores for this study. Assessing
percentages of movement from one year to the next was challenging when teachers had data sets

71
missing within this time span of data pulled. In those cases, missing data sets and teachers were
disregarded as if the teacher was not there, which reduced the teacher sample size for those years
and accounted for increased variability in some cases where data was slimmer in some years than
in others. This reveals an issue that states would realistically face in tracking teachers over time.
When teachers switch grade levels or even buildings, additional factors such as student
characteristics and different assessments given should be considered before comparing data over
the years. Notwithstanding these challenges, researchers have found that, despite various gaps in
data, estimates of school and teacher effects tend to be consistent from year to year (Grant,
Stronge, and Ward, 2011).
Scheerens and Bosker studied a similar concept in the late 1990s, but without accounting
for SES and prior achievement. They found that “when student achievement was measured at a
single point in time, about 15-20 percent of the variance in student achievement lies among
schools, another 15-20 percent lies among classrooms within schools, and the remaining 60-70
percent of variance lies among students.”
Since then, studies of a similar nature to this one conducted over shorter time spans have
produced mixed results, with some showing statistical support for the concept of value-added
models and others showing instability in the results found (Goldhaber & Hansen, 2008, 2010;
Sanders & Horn, 1994; Sass, 2008). Viadero (2008a) found that teacher performance does
fluctuate over time and is not distributed evenly through different school districts. One criticism
applicable to the district studied here is the question of whether students are truly assigned at
random to teachers. Students are sometimes purposefully assigned to teachers for various special
education supports, and due to limited resources such as assistive personnel for these students,

72
there may not be an equal distribution of students with disabilities across all grade levels. In
theory, results can be biased if students are not randomly assigned to teachers (Viadero, 2008b).
Teacher Characteristics Findings for Top and Bottom Performing Teachers
The results examined when attempting to find consistencies in teacher characteristics
among top and among bottom performers in math and in reading turned out to be inconclusive
for two reasons. First, there was too much movement between quartiles to accurately track
student scores as related to teacher effectiveness and to identify as effective enough teachers to
find patterns of characteristics and form accurate conclusions. Second, the few teachers whose
scores showed enough stability to analyze their qualifications did not have enough characteristics
in common to form conclusions for future personnel decisions. Teachers with master’s degrees
and 10+ years of experience were identified both as top and bottom performers. Additional
certifications, such as ELL, made no notable differences in performance, as measured by the
VAM, nor did alumni colleges, or age or salaries paid, as no patterns could be established. While
initially this could have been partly due to the small sampling size, research has shown it
difficult to determine what characteristics make teachers more effective than others (Strong, John
Gargani, and Özge Hacifazlioglu, 2011). More so “teacher aptitude”, as scholar Gregory Gilpin
references in his study, has a positive correlation of 0.132 to teacher salaries, showing a rather
weak correlation, and thus, a rather weak rationale for higher paid teachers with higher test
scores than lower paid teachers (Gilpin, 2012). In a study of similar of a similar nature by Grant,
Stronge, and Ward (2011), the researchers were not able to find any relationship between teacher
experience and effectiveness, either, even when comparing achievement results of teachers with
less than five years, five to 10 years, and more than 10 years of experience. Overall, these
researchers found no significant differences in achievement between these groups, nor were any

73
findings substantial enough to formulate a conclusion in this study, other than that due to the
unstable results, patterns of high and low performing teacher characteristics could not be
established.
Lastly, the stability of teacher scores over time does not imply that top performing
teachers are the best teachers or demonstrate best practices. Student achievement on standardized
test scores was the variable measured to determine teacher effectiveness. The fact that states and
school districts are looking at using this as a tool for evaluation, personnel decisions, and even as
a reward system often gives it more credence than suggested as warranted by the results of this
study.
Conclusion and Future Studies
It would be beneficial to run consecutive studies of a similar nature in a different school
district of the same size to assess if the results can be replicated. Additional areas of interest
suggested by this study are to find out to what degree that students are actually randomly
assigned to teachers and to include special education student percentages, percentages of
assistant teachers present to help, and additional instruction provided such as literacy tutors for
reading or “wheel classes” for math that are currently offered in this district as well as in other,
similar districts in the area. Additionally, reading instruction varies widely. It is important to
mitigate the effects of prior reading instruction from another teacher on the teacher effectiveness
score for the reading teacher evaluated. Lastly, it may be advisable to run this study again in both
a larger and a smaller district to see if volatility of the sample size increases or decreases with
school size, or if similar results are found. Replication of this study’s results by ranking teachers

74
by quintiles as larger studies have (rather than the quartiles used in this study due to limited
sample size) would show even more variability in the stability of teacher scores over time.
Research suggests that effectiveness of teachers cannot clearly be determined by
characteristics such as salary, advanced degrees, or even years of experience (Hanushek et al.,
2005; Ballou and Podgursky, 2000; Murnane, 1975; and Ehrenberg and Brewer, 1994). For
future efforts to improve the quality found in the teaching profession, research also demonstrates
that linking teacher evaluation systems to student performance may in fact discern effective
teachers from non-effective teachers, as measured by student performance scores (Mohrman,
Mohrman, & Odden, 1996; Odden, 2000; Odden & Kelley, 2002). Yet any tool utilized for high-
stakes decision making such as teacher evaluation and teacher retention must be an instrument
which accurately and fairly measures teacher performance. In the case of using value-added
methods of calculating teacher effectiveness, researchers have found that teacher valued-added
levels vary from year to year (Goldhaber & Hansen, 2008; Koedel & Betts, 2009; McCaffrey,
Sass, & Lockwood, 2008; Sass, 2008).
“There is a growing consensus that one year of value-added data
may not be sufficiently reliable for making high-stakes decisions about
individual teacher effectiveness—particularly when determining teacher
tenure or hiring/firing decisions.” (Schochet & Chiang, 2010).
There are a variety of value-added models that use statistical calculations to assess
teacher performance. Policy makers must carefully evaluate the effectiveness of these models on
all sizes of districts and consider creating evaluation systems that use multiple points of data
collection to accurately evaluate teacher effectiveness. There is clearly a call for more data in this
area, and the results of this study show three findings. First, teachers should not be evaluated

75
based on year to year performance. Second, financial incentives or rewards should not be granted
based on one source of data. Third, teacher characteristics of effective teachers or non-effective
teachers have yet to be determined using value-added models such as these. Problems with
“omitted variable bias,” sampling variation, reverse causation, and measurement error are all
concerns of studies in the past several years (Ferguson and Brown, 2000). Caution is advised
before applying a “one size fits all” approach to state level teacher evaluation systems, as smaller
school districts may not be able to sustain the results desired per value-added models due to
sampling variation and non-random student assignment. While there are positives to the
progressive nature of value-added models in determining teacher effectiveness, further studies
should be conducted until a specific tool, model, or statistical formula can show stable results
over time to determine teacher effectiveness, despite district size. With the correct tool or
evaluation system in place, new data can be discovered which may impact the education system
as we know it today, and inform the decisions made in shaping the education system of the
future.

76
References
Aaronson, Daniel, Lisa Barrow, and William Sander (2007). Teachers and Student Achievement
in Chicago Public High Schools .Journal of Labor Economics 24(1): 95-135.
Alliance for Excellent Education (2008). Alliance for Excellent Education 2008 the effectiveness
of high school teachers. Washington, DC. www.all4ed.org.
Baker, Eva L., Paul E. Barton, Linda Darling-Hammond, Edward Haertel, Helen F. Ladd, Robert
L. Linn, Diane Ravitch, Richard Rothstein, Richard J. Shavelson, and Lorrie A. Shepard.
(2010). Problems with the Use of Student Test Scores to Evaluate Teachers. Economic
Policy Institute Brieng Paper 278.
Berry, Barnett, Ed Fuller, Cynthia Reeves, and Elizabeth Laird (2007). Linking teacher and
student data to improve teacher and teaching quality. Data Quality Campaign. Center for
Teaching Quality and National Center for Educational Accountability: 1-12.
Bill and Melinda Gates Foundation (2010). Learning about Teaching: Initial Findings from the
Measures of Effective Teaching Project. Seattle: Author. Rothstein, Jesse (2011). Review
of ‘Learning About Teaching: Initiation Findings from the Measures of Effective
Teaching Project. Boulder, CO: National Education Policy Center.
Braun, H.I. (2005). Using student progress to evaluate teachers: A primer on value-added
models. Princeton, NJ: Educational Testing Service.
Raj Chetty & John N. Friedman & Jonah E. Rockoff (2011). The Long-Term Impacts of
Teachers: Teacher Value-Added and Student Outcomes in Adulthood, NBER Working
Papers 17699, National Bureau of Economic Research, Inc.
Clark, D. (1993). Teacher Evaluation: A review of the literature with implications for
educators. Unpublished Seminar Paper, California State University at Long Beach.
Clotfelter, C.T., Ladd, H.F., Vigdor, J.L. (2007) How and why do teacher credentials matter
for student achievement? Calder Center.
Consortium for Policy Research in Education (2012). History of Teacher Pay. The University of
Wisconsin Madison.
Darling-Hammond, L. (2000). Teacher quality and student achievement: A review of
state policy evidence. In Educational Policy Analysis Archives, 8(1) http://
olam.ed.asu.edu/epaa/v8n1/.
Darling-Hammond, L., & McLaughlin, M. (1995). Policies that support professional
development in an era of reform. Phi Delta Kappan, 76, 597-604.

77
Darling-Hammond, L. (2007). Recognizing and enhancing teacher effectiveness: A
policymaker’s guide. In L. Darling-Hammond and C. D. Prince (eds.), Strengthening
teacher quality in high-need schools—policy and practice. Washington, DC: The Council
of Chief State School Officers.
Eberts, Randall, K. Hollenbeck, and J. Stone (2002). Teacher Performance Incentives and
Student Outcomes. The Journal of Human Resources, Vol. 37, No. 4. 913‐27.
ECS (2000). ECS State Notes, Education Commission of the States (www.ecs.org).
Elmore, R. 2002. Testing trap. Harvard Magazine. September–October 2002.
Evertson, C.M., Hawley, W.D., & Zlotnik, M. (1985). Making a Difference in Educational
Quality Through Teacher Education. Journal of Teacher Education, 2-12.
Ferguson, R. (1991). Paying for Public Education: New Evidence on How and Why Money
Matters. Harvard Journal of Legislation 28: 465–98.
Ferguson, R. F. (1998). Can schools narrow the Black-White test score gap? The Black-White
test score gap Washington, DC: Brookings Institution, 318-374.
Gilpin, Gregory A. (2012) Teacher salaries and teacher aptitude: An analysis using quantile
regression. Economics of Education Review, Vol. 31, Issue 3, 15-29,
http://www.sciencedirect.com/science/article/pii/S0272775712000052.
Goldhaber, D., Brewer, D. (1999), Teacher licensing and student achievement".
Goldhaber, D. and Hansen, M. (2008). Is it just a bad class? Assessing the stability of measured
teacher performance (CRPE Working Paper No. 2008_5). Retrieved from
http:www.crpe.org/cs/crpe/download/csr_files/wp_crpe5_badclass_nov08.pdf.
Goldhaber, Daniel, and Dominic Brewer (1997). Evaluating the Effect of Teacher Degree Level
on Educational Performance. In W. Fowler, ed., Developments in School Finance,
1996NCES. Washington, DC: U.S. Department of Education, National Center for
Education Statistics. 97–535.
Goldschmidt, P., Pat Roschewski, Kilchan Choi, William Auty, Steve Hebbler, Rolf Blank, and
Andra Williams. (2005). Policymakers’ Guide to Growth Models for School
Accountability: How do accountability models differ? CCSSO Accountability Systems
and Reporting State Collaborative on Assessment and Student Standards. The Council of
Chief State School Officers. http://www.ccsso.org/Documents/2005/Policymakers
_guide_to_growth_2005.pdf.
Goe, Bell, and Little (2008). Approaches to evaluating teacher effectiveness: A research
synthesis. Washington D.C. National Comprehensive Center for Teaching Quality.
78
Gore, L. (2007). The link between teacher quality and student outcomes: A research synthesis.
Washington, DC: National Comprehensive Center for Teacher Quality.
Gordon, Robert, Thomas J. Kane, and Douglas O. Stagier (2006). Identifying effective teachers
using performance on the job. The Hamilton Project White Paper 2006-01.
Ferguson, R.F. & Ladd, H.F. (1996). How and why money matters: An analysis of alabama
schools. In Helen Ladd (Ed.), Holding Schools Accountable. Washington, D.C.:
Brookings Institution, 265-298.
Hanushek, E.A., Kain, J.F., and Rivkin, S.G. (1998). Teachers, Schools, and Academic
Achievement. (NBER Working Paper No. w6691), National Bureau of Economic
Research.
Harris, Douglas N., and Tim R. Sass (2007). Teacher training, teacher quality and student
achievement. CALDER Working Paper 3. Washington, DC: The Urban Institute.
Kane, Thomas J. and Douglas O. Staiger (2002a). Volatility in School Test Scores: Implications
for Test-Based Accountability Systems. In Brookings Papers on Education Policy.
Washington, DC: Brookings Institution.
Kane, Thomas J. and Douglas Staiger (2002b). The Promise and Pitfalls of Using Imprecise
School Accountability Measures. The Journal of Economic Perspectives. American
Economic Association Vol. 16, No. 4, 91-11.
http://www.jstor.org.www2.lib.ku.edu:2048/stable/3216916
Kemp, L., and Hall, A. H. (1992). Impact of effective teaching research on student achievement
and Teacher performance: Equity and Access Implications for Quality Education.
Jackson, MS: Jackson State University. ERIC Document Reproduction Service No. ED
348-360.
Koedel, Cory and Julian Betts (2009). Value-Added to What? How a Ceiling in the Testing
Instrument Influences Value-Added Estimation. NBER Working Papers 14778, National
Bureau of Economic Research, Inc.
Kupermintz, H., Shepard, L., & Linn, R. (2001). Teacher effects as a measure of teacher
effectiveness: construct value added considerations in TVALUE ADDEDAS (Tennessee
Value Added Assessment System). Paper presented at the Annual Meeting of the
National Council on Measurement in Education, Seattle, WA.
Lazear, Edward P. (2000). Performance Pay and Productivity. American Economic Review, Vol.
93, No.5. 1346‐61.
Lazear, Edward P. (2003). Teacher Incentives, Swedish Economic Policy Review, Vol. 10, No. 2,
179‐214.
79
Lewis, L., B. Parsad, N. Carey, N. Bartfai, E. Farris, and B. Smerdon (1999). Teacher Quality: A
Report on the Preparation and Qualifications of Public School Teachers. NCES 1999-
080. U.S. Department of Education, National Center for Education Statistics, Office of
Educational Research and Improvement.
Lovelace, B. & Peace, B. (1984). Update of Secondary Vocational Education Data Processing
Curriculum, Final Report. Austin, TX: Texas Education Agency, Department of
Occupational Education and Technology.
Markley, Tim (2004). Defining the effective teacher: Current arguments in education. New
Hampshire White Mountains Regional School District.
McCaffrey, D. F., Lockwood, J. R., Koretz, D. M., & Hamilton, L. S. (2003). Evaluating value-
added models for teacher accountability, (MG-158-EDU). Santa Monica, CA: RAND.
Million, S. (1987). Demystifying teacher evaluation: The multiple-strategies model used as
an assessment device. Paper presented at the annual meeting of the National Council of
States on in-Service Education, San Diego, CA.
National Commission on Excellence in Education (1983). A nation at risk: The imperative for
educational reform. Washington, DC. Government Printing Office.
Newton, X., Darling-Hammond, L., Haertel E., Thomas, E. (2010). Value added modeling of
teacher effectiveness: An exploration of stability across models and contexts, 1-31.
Nye, Barbara, Spyros Konstantopoulos, and Larry Hedges (2004). How Large Are Teacher
Effects? Educational Evaluation and Policy Analysis, 26(3).
Peterson, K. D. (2006). Using multiple data sources in teacher evaluation. In J. H. Stronge (Ed.),
Evaluating teaching: A guide to current thinking and best practice (2nd ed. 212-232).
Thousand Oaks, CA: Corwin Press.
Pugach, M.C. & Raths, J.D. (1983). Testing Teachers: Analysis and Recommendations. Journal
of Teacher Education, 34(1), 37-43.
Protsik, J. (1996). History of teacher pay and incentive reforms. Journal of School Leadership,
6(2).
Rivkin, Steven G., Eric A. Hanushek, and John F. Kain (2005). Teachers, Schools, and
Academic Achievement. Econometrica 73(2), 417-458.
Rothstein, Jesse. 2009a (forthcoming). Teacher Quality in Educational Production: Tracking,
Decay, and Student Achievement. Quarterly Journal of Economics.

80
Rothstein, Jesse. (2009b). Student Sorting and Bias in Value-Added Estimation: Selection on
Observable and Un-observables. Education Finance and Policy, 4.
Sanders, W.L. & Horn, S.P. (1998). Research Findings from the Tennessee Value Added
Assessment System (TVALUE ADDEDAS) Database: Implications for Educational
Evaluation and Research. Journal of Personnel Evaluation in Education, 12 (3), 247-256.
Sanders, W.L., & Rivers, J.C. (1996). Cumulative and residual effects of teachers on future
Student academic achievement. Research Progress Report. Knoxville: University of
Tennessee Value-Added Research and Assessment Center.
Sass, Tim (2008). The stability of value-added measures of teacher quality and implications for
teacher compensation policy. National Center for Analysis of Longitudinal Data in
Education Research (4).
Sanders, William L. & Horn, S.P. (1995). Educational assessment reassessed: The usefulness of
standardized and alternative measures of student achievement as indicators for the
assessment of educational outcomes. Education Policy Analysis Archives, 3(6).
http://seamonkey.ed.asu.edu/epaa.
Schacter, John (1999). Teacher performance based accountability: Why, what, and how. Milken
Family Foundation. Santa Monica, CA. 1-7.
Strong, Gargani, and Hacifazlioğlu (2011). Do We Know a Successful Teacher When We See
One? Experiments in the Identification of Effective Teachers. Journal of Teacher
Education September/October 2011 62: 367-382.
Summers, A.A. & Wolfe, B.L. (1977). Do Schools Make a Difference? American Economic
Review, 67(4), 639-652.
Weldon, Tim (2011). Does merit pay for teachers have merit? Pros and cons of new models for
teacher compensation. The Council of State Governments. Education Research.
Viadero, D. (2008a). Scrutiny heightens for “value added” research method. Education Week, 27
(36), 1, 12-13.
Vogt, W. (1984). Developing a teacher evaluation system. Spectrum, 2 (1). 41-46.
Wenglinsky, H. (2000). How teaching matters: Bringing the classroom back into
discussions of teacher quality. Princeton, NJ: The Milken Family Foundation and
Educational Testing Service.
Wright, S. P., Horn, S. P., & Sanders, W.L. (1997). Teacher and classroom context effects on
student achievement: Implications for teacher evaluation. Journal of Personnel
Evaluation in Education, (11), 57–67. Retrieved October 15, 2012.
http://www.sas.com/govedu/edu/teacher_evalue addedl.pdf.
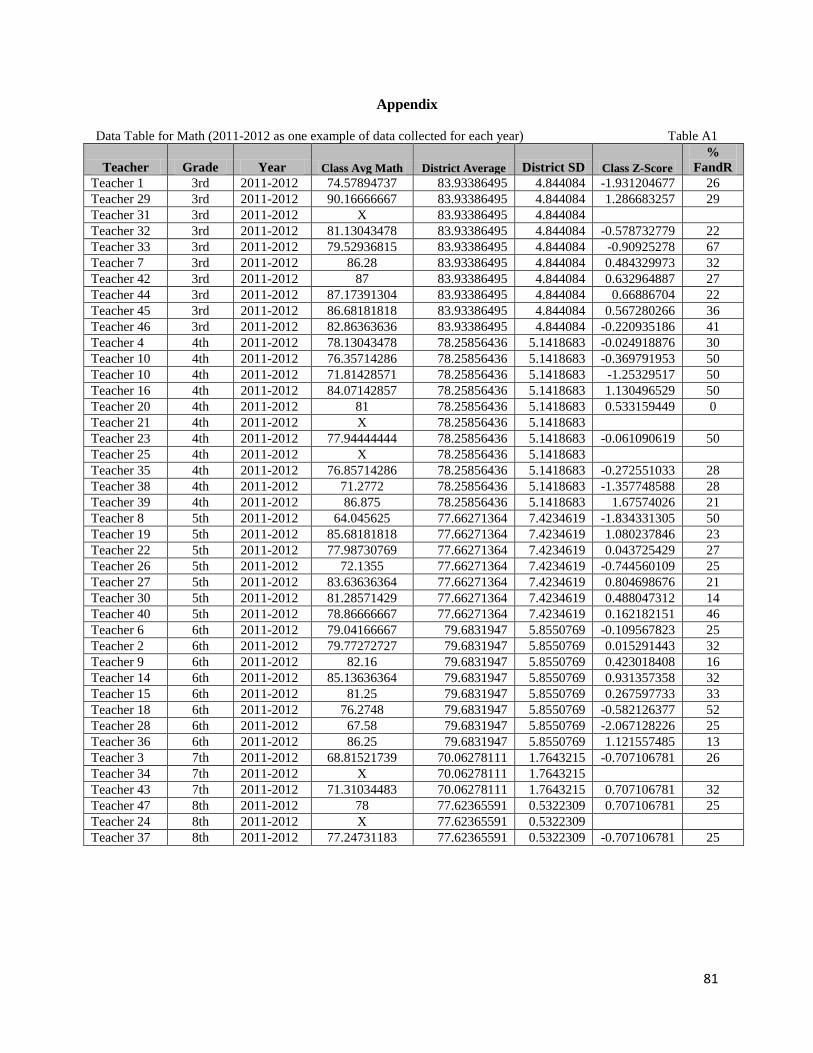
81
Appendix
Data Table for Math (2011-2012 as one example of data collected for each year) Table A1
Teacher Grade Year Class Avg Math District Average District SD Class Z-Score
%
FandR
Teacher 1 3rd 2011-2012 74.57894737 83.93386495 4.844084 -1.931204677 26
Teacher 29 3rd 2011-2012 90.16666667 83.93386495 4.844084 1.286683257 29
Teacher 31 3rd 2011-2012 X 83.93386495 4.844084
Teacher 32 3rd 2011-2012 81.13043478 83.93386495 4.844084 -0.578732779 22
Teacher 33 3rd 2011-2012 79.52936815 83.93386495 4.844084 -0.90925278 67
Teacher 7 3rd 2011-2012 86.28 83.93386495 4.844084 0.484329973 32
Teacher 42 3rd 2011-2012 87 83.93386495 4.844084 0.632964887 27
Teacher 44 3rd 2011-2012 87.17391304 83.93386495 4.844084 0.66886704 22
Teacher 45 3rd 2011-2012 86.68181818 83.93386495 4.844084 0.567280266 36
Teacher 46 3rd 2011-2012 82.86363636 83.93386495 4.844084 -0.220935186 41
Teacher 4 4th 2011-2012 78.13043478 78.25856436 5.1418683 -0.024918876 30
Teacher 10 4th 2011-2012 76.35714286 78.25856436 5.1418683 -0.369791953 50
Teacher 10 4th 2011-2012 71.81428571 78.25856436 5.1418683 -1.25329517 50
Teacher 16 4th 2011-2012 84.07142857 78.25856436 5.1418683 1.130496529 50
Teacher 20 4th 2011-2012 81 78.25856436 5.1418683 0.533159449 0
Teacher 21 4th 2011-2012 X 78.25856436 5.1418683
Teacher 23 4th 2011-2012 77.94444444 78.25856436 5.1418683 -0.061090619 50
Teacher 25 4th 2011-2012 X 78.25856436 5.1418683
Teacher 35 4th 2011-2012 76.85714286 78.25856436 5.1418683 -0.272551033 28
Teacher 38 4th 2011-2012 71.2772 78.25856436 5.1418683 -1.357748588 28
Teacher 39 4th 2011-2012 86.875 78.25856436 5.1418683 1.67574026 21
Teacher 8 5th 2011-2012 64.045625 77.66271364 7.4234619 -1.834331305 50
Teacher 19 5th 2011-2012 85.68181818 77.66271364 7.4234619 1.080237846 23
Teacher 22 5th 2011-2012 77.98730769 77.66271364 7.4234619 0.043725429 27
Teacher 26 5th 2011-2012 72.1355 77.66271364 7.4234619 -0.744560109 25
Teacher 27 5th 2011-2012 83.63636364 77.66271364 7.4234619 0.804698676 21
Teacher 30 5th 2011-2012 81.28571429 77.66271364 7.4234619 0.488047312 14
Teacher 40 5th 2011-2012 78.86666667 77.66271364 7.4234619 0.162182151 46
Teacher 6 6th 2011-2012 79.04166667 79.6831947 5.8550769 -0.109567823 25
Teacher 2 6th 2011-2012 79.77272727 79.6831947 5.8550769 0.015291443 32
Teacher 9 6th 2011-2012 82.16 79.6831947 5.8550769 0.423018408 16
Teacher 14 6th 2011-2012 85.13636364 79.6831947 5.8550769 0.931357358 32
Teacher 15 6th 2011-2012 81.25 79.6831947 5.8550769 0.267597733 33
Teacher 18 6th 2011-2012 76.2748 79.6831947 5.8550769 -0.582126377 52
Teacher 28 6th 2011-2012 67.58 79.6831947 5.8550769 -2.067128226 25
Teacher 36 6th 2011-2012 86.25 79.6831947 5.8550769 1.121557485 13
Teacher 3 7th 2011-2012 68.81521739 70.06278111 1.7643215 -0.707106781 26
Teacher 34 7th 2011-2012 X 70.06278111 1.7643215
Teacher 43 7th 2011-2012 71.31034483 70.06278111 1.7643215 0.707106781 32
Teacher 47 8th 2011-2012 78 77.62365591 0.5322309 0.707106781 25
Teacher 24 8th 2011-2012 X 77.62365591 0.5322309
Teacher 37 8th 2011-2012 77.24731183 77.62365591 0.5322309 -0.707106781 25

82
Data Table for Reading (2011-2012 as one example of data collected for each year) Table A2
Teacher Grade Year Class Avg Reading District Average District SD Class Z-Score %FandR
Teacher 1 3rd 2011-2012 82.68421053 79.18929157 2.852554 1.225189243 26
Teacher 29 3rd 2011-2012 78.54166667 79.18929157 2.852554 -0.227033322 29
Teacher 32 3rd 2011-2012 77.22727273 79.18929157 2.852554 -0.687811193 23
Teacher 33 3rd 2011-2012 75.179375 79.18929157 2.852554 -1.405728345 25
Teacher 7 3rd 2011-2012 79.08333333 79.18929157 2.852554 -0.037145036 33
Teacher 42 3rd 2011-2012 82.90909091 79.18929157 2.852554 1.304023982 32
Teacher 44 3rd 2011-2012 82.47826087 79.18929157 2.852554 1.152990915 22
Teacher 45 3rd 2011-2012 77.9047619 79.18929157 2.852554 -0.45030856 38
Teacher 46 3rd 2011-2012 76.69565217 79.18929157 2.852554 -0.874177684 39
Teacher 4 4th 2011-2012 79.13043478 79.03216768 4.615056 0.021292721 30
Teacher 10 4th 2011-2012 70.96866667 79.03216768 4.615056 -1.747216168 53
Teacher 12 4th 2011-2012 74.68285714 79.03216768 4.615056 -0.942417651 50
Teacher 16 4th 2011-2012 79.57142857 79.03216768 4.615056 0.116848172 50
Teacher 20 4th 2011-2012 83.57142857 79.03216768 4.615056 0.98357649 38
Teacher 21 4th 2011-2012 X 79.03216768 4.615056
Teacher 23 4th 2011-2012 82.77777778 79.03216768 4.615056 0.811606586 50
Teacher 25 4th 2011-2012 X 79.03216768 4.615056
Teacher 31 4th 2011-2012 X 79.03216768 4.615056
Teacher 35 4th 2011-2012 79.85714286 79.03216768 4.615056 0.178757338 29
Teacher 38 4th 2011-2012 75.5025 79.03216768 4.615056 -0.764815733 29
Teacher 39 4th 2011-2012 85.22727273 79.03216768 4.615056 1.342368245 23
Teacher 8 5th 2011-2012 66.166875 78.34626556 6.681598 -1.822825999 50
Teacher 19 5th 2011-2012 85.04545455 78.34626556 6.681598 1.002632749 27
Teacher 22 5th 2011-2012 78.41038462 78.34626556 6.681598 0.009596365 27
Teacher 26 5th 2011-2012 73.62 78.34626556 6.681598 -0.707355569 25
Teacher 27 5th 2011-2012 83.01818182 78.34626556 6.681598 0.699221391 18
Teacher 30 5th 2011-2012 78.2962963 78.34626556 6.681598 -0.00747864 15
Teacher 40 5th 2011-2012 83.86666667 78.34626556 6.681598 0.826209703 47
Teacher 6 6th 2011-2012 83.08333333 81.34138603 4.981914 0.349654207 25
Teacher 9 6th 2011-2012 83.16666667 81.34138603 4.981914 0.366381378 17
Teacher 14 6th 2011-2012 82.68181818 81.34138603 4.981914 0.269059655 36
Teacher 15 6th 2011-2012 85.56521739 81.34138603 4.981914 0.847833 35
Teacher 18 6th 2011-2012 76.032 81.34138603 4.981914 -1.065732107 52
Teacher 28 6th 2011-2012 72.819 81.34138603 4.981914 -1.710664917 25
Teacher 36 6th 2011-2012 86.04166667 81.34138603 4.981914 0.943468783 17
Teacher 11 7th 2011-2012 79.28089888 80.03175379 1.061869 -0.707106781 24
Teacher 13 7th 2011-2012 80.7826087 80.03175379 1.061869 0.707106781 25
Teacher 17 7th 2011-2012 X 80.03175379 1.061869
Teacher 5 8th 2011-2012 79.45918367 80.96954063 1.334392 -1.131868592 27
Teacher 48 8th 2011-2012 81.46067416 80.96954063 1.334392 0.368057775 31
Teacher 41 8th 2011-2012 81.98876404 80.96954063 1.334392 0.763810817 30

83
Summary Output of Math Regressions (Plotted in Table 3) Table A3 SUMMARY OUTPUT-
MATH REGRESSIONS
Regression Statistics
Multiple R 0.17248248
R Square 0.0297502 Adjusted R
Square 0.02467036
Standard Error 0.91293041 Observations 193
ANOVA
df SS MS F Significance F
Regression 1 4.8810708 4.8810708 5.8565218 0.01645598
Residual 191 159.187408 0.83344192 Total 192 164.068478
Coefficients Standard Error t Stat P-value Lower 95% Upper 95% Lower 95.0%
Upper
95.0%
Intercept 0.30758444 0.1485255 2.07092012 0.03971071 0.01462354 0.60054533 0.01462354 0.60054533
%FandR -0.01200998 0.00496275 -2.42002517 0.01645598 -0.02179881
-
0.00222114 -0.02179881 -0.00222114
RESIDUAL OUTPUT-
MATH
Observation Predicted Class Z-Score Residuals
Observation Predicted Class Z-Score Residuals
1 0.091404817 0.322619
100 0.103415 -0.158881
2 -0.172814718 -0.71535
101 0.055375 0.7296424 3 -0.208844655 1.550214
102 0.175475 0.8094107
4 -0.052714929 0.276532
103 0.211505 -0.955143
5 -0.016684993 -1.07436
104 -0.41301 0.8197218 6 -0.088744866 -0.66356
105 -0.23286 -0.690687
7 0.247534542 0.322797
106 -0.05271 0.4966323
8 0.151454711 -1.10686
107 -0.07673 0.8664753 9 -0.36497438 -0.26361
108 -0.12477 -0.883037
10 -0.028694972 0.123797
109 0.175475 -0.843289
11 0.187484648 1.48338
110 -0.07673 1.4422536 12 -0.641203894 0.244249
111 0.079395 -0.866973
13 0.247534542 0.889996
112 -0.01668 -0.320819
14 -0.112764824 -0.62781
113 0.091405 1.0336778 15 -0.088744866 0.088745
114 0.091405 1.0611246
16 0.031354923 -0.73846
115 0.079395 -0.716954 17 0.019344944 0.687762
116 0.067385 -0.582355
18 0.151454711 -0.85856
117 -0.07673 -1.11407
19 0.199494627 0.507612
118 -0.01668 1.5690764 20 0.235524564 -0.96968
119 -0.18482 0.0580996
21 -0.328944444 -0.84675
120 -0.29291 -0.507814
22 -0.076734887 0.98864
121 -0.00468 1.327815 23 -0.040704951 0.094997
122 0.151455 0.6935893
24 -0.292914507 1.713162
123 -0.00468 -0.752141
25 -0.016684993 -0.45991
124 -0.01668 -0.650845 26 -0.196834676 -1.57102
125 -0.29291 0.1149437
27 0.307584437 0.336499
126 -0.0407 0.7402452
28 -0.292914507 1.218391
127 -0.401 -0.328368 29 0.091404817 -0.78394
128 -0.0407 -2.065003
30 0.019344944 -0.29747
129 -0.25688 0.2206996
31 0.007334965 0.151012
130 0.211505 0.4170194 32 0.16346469 0.847139
131 -0.12477 0.4436991
33 -0.14879476 -1.24808
132 0.163465 0.0185739
34 0.043364902 0.931307
133 0.079395 0.1836425 35 -0.112764824 0.393214
134 0.103415 -0.862876
36 -0.064724908 0.206481
135 -0.08874 1.6274067
37 0.091404817 0.363135
136 -0.37698 -0.959939 38 -0.028694972 0.720689
137 0.151455 0.1332944
39 0.019344944 -1.16588
138 0.103415 -1.268891
40 -0.112764824 -0.59434
139 0.031355 0.4429033 41 -0.004675014 0.711782
140 -0.12477 1.7033829

84
42 0.031354923 -0.73846
141 0.007335 0.2212039
43 0.05537488 0.651732
142 -0.08874 0.0249901 44 0.007334965 -0.64193
143 -0.1608 0.6166472
45 -0.064724908 -0.80196
144 0.091405 -0.247203
46 0.043364902 2.002321
145 -0.00468 1.666943 47 -0.040704951 0.438481
146 0.211505 -0.955732
48 0.091404817 -0.18543
147 0.127435 -0.380584
49 0.05537488 -0.22006
148 -0.22085 -0.892203 50 0.115424775 -0.79888
149 0.103415 -1.063029
51 0.007334965 0.997852
150 -0.18482 1.2925622
52 -0.112764824 0.250322
151 0.043365 -1.123822 53 -0.076734887 -1.74073
152 -0.05271 0.2401565
54 0.247534542 -0.01672
153 -0.08874 0.9817607
55 0.199494627 -1.09486
154 0.091405 0.9533779 56 -0.028694972 0.282655
155 0.103415 -1.051625
57 0.115424775 -0.45165
156 0.115425 -0.211997
58 -0.088744866 -0.77131
157 -0.00468 -1.92653 59 0.151454711 0.606916
158 -0.0407 1.3273882
60 0.031354923 1.491862
159 0.043365 -0.622098
61 0.019344944 -1.16896
160 -0.49708 -0.412169
62 0.307584437 -0.62588
161 -0.07673 0.5610649
63 0.043364902 -0.44932
162 -0.01668 0.6496499
64 -0.028694972 1.224143
163 0.043365 0.6255021 65 0.247534542 1.027904
164 -0.12477 0.6920551
66 -0.172814718 -0.42419
165 -0.18482 -0.03611
67 0.139444733 -2.98734
166 -0.05271 0.0277961 68 0.127434754 0.59924
167 -0.29291 -0.076877
69 -0.040704951 0.90039
168 -0.29291 -0.960381 70 -0.004675014 -1.27565
169 -0.29291 1.423411
71 0.139444733 -0.44548
170 0.307584 0.225575
72 0.103414796 -0.97714
171 -0.29291 0.2318239 73 -0.028694972 -0.18825
172 -0.02869 -0.243856
74 0.019344944 1.071318
173 -0.02869 -1.329054
75 -0.004675014 -0.29243
174 0.055375 1.6203654 76 0.175474669 -0.99325
175 -0.29291 -1.541417
77 0.067384859 1.047499
176 0.031355 1.0488829
78 0.139444733 -0.46784
177 -0.01668 0.0604104 79 -0.004675014 0.600427
178 0.007335 -0.751895
80 0.247534542 0.678516
179 0.055375 0.7493238
81 -0.088744866 -2.06003
180 0.139445 0.3486026 82 -0.076734887 0.88738
181 -0.24487 0.4070567
83 0.091404817 0.363798
182 0.007335 -0.116903
84 -0.016684993 -0.38708
183 -0.07673 0.0920263 85 0.007334965 -0.67856
184 0.115425 0.3075936
86 -0.076734887 0.841254
185 -0.07673 1.0080922
87 -0.028694972 0.739132
186 -0.08874 0.3563426 88 -0.292914507 0.018994
187 -0.31693 -0.265192
89 -0.25688457 -1.907
188 0.007335 -2.074463
90 -0.088744866 0.331612
189 0.151455 0.9701028 91 0.247534542 -0.53311
190 -0.00468 -0.702432
92 0.199494627 0.665627
191 -0.07673 0.7838417
93 0.091404817 0.067568
192 0.007335 0.6997718 94 -0.052714929 -0.29872
193 0.007335 -0.714442
95 0.103414796 -1.01572
96 -0.184824697 0.538432 97 0.079394838 1.576728
98 -0.064724908 -1.79525
99 0.079394838 0.40307
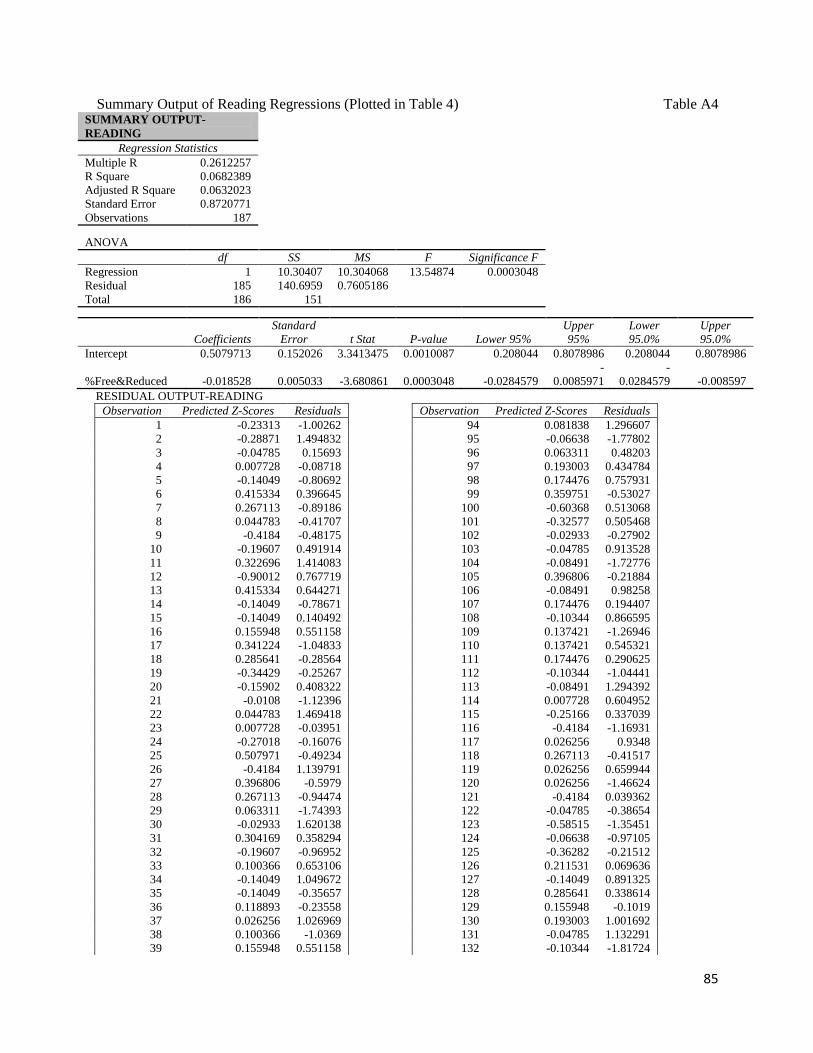
85
Summary Output of Reading Regressions (Plotted in Table 4) Table A4 SUMMARY OUTPUT-
READING
Regression Statistics
Multiple R 0.2612257
R Square 0.0682389
Adjusted R Square 0.0632023
Standard Error 0.8720771
Observations 187
ANOVA
df SS MS F Significance F
Regression 1 10.30407 10.304068 13.54874 0.0003048
Residual 185 140.6959 0.7605186
Total 186 151
Coefficients
Standard
Error t Stat P-value Lower 95%
Upper
95%
Lower
95.0%
Upper
95.0%
Intercept 0.5079713 0.152026 3.3413475 0.0010087 0.208044 0.8078986 0.208044 0.8078986
%Free&Reduced -0.018528 0.005033 -3.680861 0.0003048 -0.0284579
-
0.0085971
-
0.0284579 -0.008597
RESIDUAL OUTPUT-READING
Observation Predicted Z-Scores Residuals
Observation Predicted Z-Scores Residuals
1 -0.23313 -1.00262
94 0.081838 1.296607
2 -0.28871 1.494832
95 -0.06638 -1.77802
3 -0.04785 0.15693
96 0.063311 0.48203
4 0.007728 -0.08718
97 0.193003 0.434784
5 -0.14049 -0.80692
98 0.174476 0.757931
6 0.415334 0.396645
99 0.359751 -0.53027
7 0.267113 -0.89186
100 -0.60368 0.513068
8 0.044783 -0.41707
101 -0.32577 0.505468
9 -0.4184 -0.48175
102 -0.02933 -0.27902
10 -0.19607 0.491914
103 -0.04785 0.913528
11 0.322696 1.414083
104 -0.08491 -1.72776
12 -0.90012 0.767719
105 0.396806 -0.21884
13 0.415334 0.644271
106 -0.08491 0.98258
14 -0.14049 -0.78671
107 0.174476 0.194407
15 -0.14049 0.140492
108 -0.10344 0.866595
16 0.155948 0.551158
109 0.137421 -1.26946
17 0.341224 -1.04833
110 0.137421 0.545321
18 0.285641 -0.28564
111 0.174476 0.290625
19 -0.34429 -0.25267
112 -0.10344 -1.04441
20 -0.15902 0.408322
113 -0.08491 1.294392
21 -0.0108 -1.12396
114 0.007728 0.604952
22 0.044783 1.469418
115 -0.25166 0.337039
23 0.007728 -0.03951
116 -0.4184 -1.16931
24 -0.27018 -0.16076
117 0.026256 0.9348
25 0.507971 -0.49234
118 0.267113 -0.41517
26 -0.4184 1.139791
119 0.026256 0.659944
27 0.396806 -0.5979
120 0.026256 -1.46624
28 0.267113 -0.94474
121 -0.4184 0.039362
29 0.063311 -1.74393
122 -0.04785 -0.38654
30 -0.02933 1.620138
123 -0.58515 -1.35451
31 0.304169 0.358294
124 -0.06638 -0.97105
32 -0.19607 -0.96952
125 -0.36282 -0.21512
33 0.100366 0.653106
126 0.211531 0.069636
34 -0.14049 1.049672
127 -0.14049 0.891325
35 -0.14049 -0.35657
128 0.285641 0.338614
36 0.118893 -0.23558
129 0.155948 -0.1019
37 0.026256 1.026969
130 0.193003 1.001692
38 0.100366 -1.0369
131 -0.04785 1.132291
39 0.155948 0.551158
132 -0.10344 -1.81724

86
40 0.026256 -0.73336
133 0.267113 0.245075
41 0.026256 -0.89831
134 0.193003 -0.76129
42 0.044783 1.046713
135 0.063311 -0.07236
43 0.081838 -0.30128
136 -0.19607 1.375973
44 -0.23313 -0.04704
137 0.044783 0.292264
45 0.100366 -1.49119
138 -0.08491 0.553791
46 0.026256 1.058596
139 -0.2146 0.711999
47 0.118893 0.425639
140 0.026256 0.305929
48 -0.4184 1.308931
141 0.359751 0.286939
49 0.211531 -1.06045
142 0.248586 0.176162
50 0.063311 0.787698
143 -0.30724 -1.8399
51 -0.14049 -0.37077
144 0.211531 -0.53743
52 -0.0108 -2.30857
145 0.248586 0.323438
53 0.415334 0.267173
146 0.118893 -0.826
54 0.341224 -0.96652
147 -0.15902 0.866126
55 -0.04785 0.653997
148 -0.0108 -1.14111
56 0.174476 0.271882
149 0.063311 0.443167
57 0.044783 -0.83895
150 0.026256 0.619176
58 -0.19607 0.227179
151 0.026256 1.198934
59 0.267113 0.198308
152 -0.02933 -0.19771
60 0.081838 1.085713
153 0.081838 -0.76965
61 0.063311 -1.09984
154 0.044783 -1.45051
62 -0.14049 0.149146
155 -0.10344 0.066292
63 0.507971 -0.64576
156 -0.08491 1.388933
64 0.100366 -0.29379
157 0.100366 1.052625
65 0.026256 0.324377
158 -0.19607 -0.25423
66 0.415334 1.544521
159 -0.2146 -0.65958
67 -0.19607 -0.75533
160 -0.04785 0.069147
68 0.137421 -0.84453
161 -0.47399 -1.27323
69 0.267113 0.439993
162 -0.4184 -0.52401
70 0.026256 -0.73336
163 -0.4184 0.535253
71 -0.56663 1.273732
164 -0.19607 1.179651
72 0.063311 -1.21572
165 -0.4184 1.230011
73 0.026256 0.486962
166 -0.02933 0.208084
74 0.322696 0.316494
167 -0.02933 -0.73549
75 0.248586 1.850431
168 0.081838 1.26053
76 0.007728 -0.56001
169 -0.4184 -1.40442
77 -0.10344 -0.86128
170 0.007728 0.994905
78 -0.08491 -0.51292
171 0.007728 0.001868
79 0.193003 -1.00932
172 0.044783 -0.75214
80 0.007728 0.399895
173 0.174476 0.524746
81 0.137421 0.272825
174 0.230058 -0.23754
82 -0.15902 0.173296
175 -0.36282 1.189032
83 0.026256 0.968088
176 0.044783 0.304871
84 -0.32577 -0.45466
177 0.193003 0.173378
85 -0.30724 -2.04228
178 -0.15902 0.428079
86 -0.10344 -0.66721
179 -0.14049 0.988325
87 0.415334 -0.2633
180 -0.45546 -0.61027
88 0.322696 0.280253
181 0.044783 -1.75545
89 0.174476 -0.15706
182 0.193003 0.750465
90 -0.04785 0.146228
183 0.063311 -0.77042
91 0.415334 0.322825
184 0.044783 0.662324
92 0.174476 -0.68574
185 0.007728 -1.1396
93 -0.25166 0.681799
186 -0.06638 0.43444
187 -0.04785 0.811665
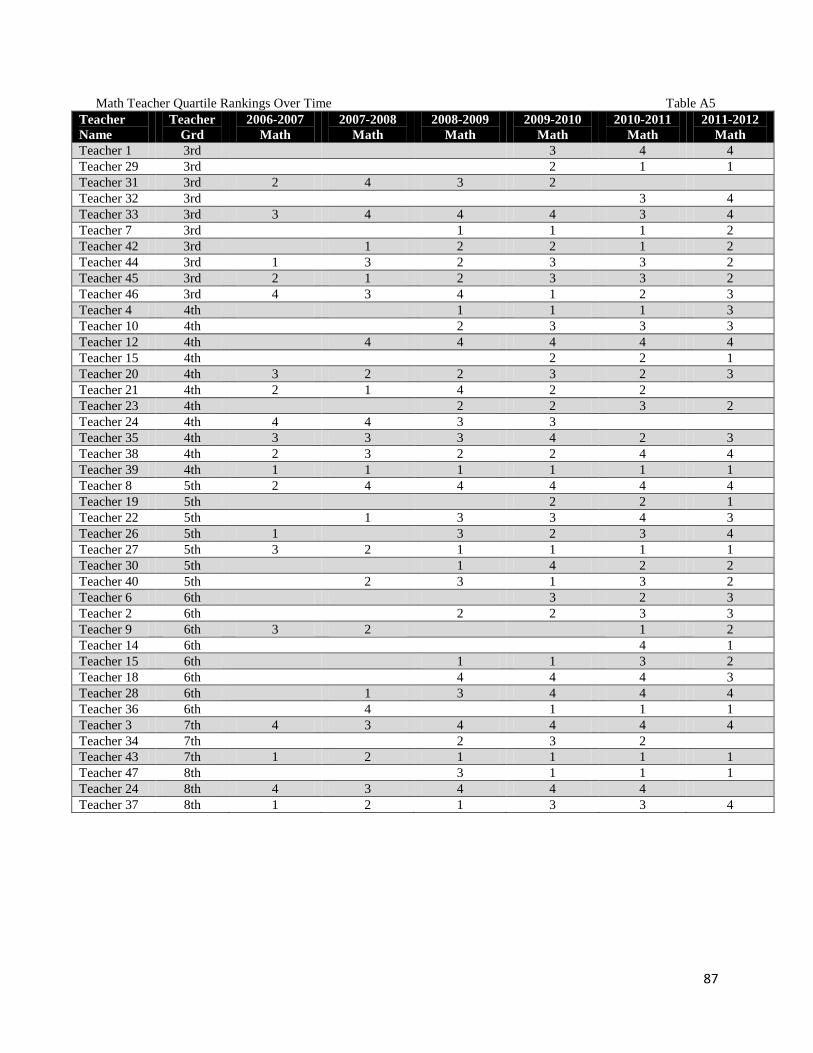
87
Math Teacher Quartile Rankings Over Time Table A5 Teacher
Name
Teacher
Grd
2006-2007
Math
2007-2008
Math
2008-2009
Math
2009-2010
Math
2010-2011
Math
2011-2012
Math
Teacher 1 3rd
3 4 4
Teacher 29 3rd
2 1 1
Teacher 31 3rd 2 4 3 2
Teacher 32 3rd
3 4
Teacher 33 3rd 3 4 4 4 3 4
Teacher 7 3rd
1 1 1 2
Teacher 42 3rd
1 2 2 1 2
Teacher 44 3rd 1 3 2 3 3 2
Teacher 45 3rd 2 1 2 3 3 2
Teacher 46 3rd 4 3 4 1 2 3
Teacher 4 4th 1 1 1 3
Teacher 10 4th
2 3 3 3
Teacher 12 4th
4 4 4 4 4
Teacher 15 4th
2 2 1
Teacher 20 4th 3 2 2 3 2 3
Teacher 21 4th 2 1 4 2 2
Teacher 23 4th
2 2 3 2
Teacher 24 4th 4 4 3 3
Teacher 35 4th 3 3 3 4 2 3
Teacher 38 4th 2 3 2 2 4 4
Teacher 39 4th 1 1 1 1 1 1
Teacher 8 5th 2 4 4 4 4 4
Teacher 19 5th
2 2 1
Teacher 22 5th
1 3 3 4 3
Teacher 26 5th 1
3 2 3 4
Teacher 27 5th 3 2 1 1 1 1
Teacher 30 5th
1 4 2 2
Teacher 40 5th 2 3 1 3 2
Teacher 6 6th 3 2 3
Teacher 2 6th
2 2 3 3
Teacher 9 6th 3 2
1 2
Teacher 14 6th
4 1
Teacher 15 6th
1 1 3 2
Teacher 18 6th
4 4 4 3
Teacher 28 6th
1 3 4 4 4
Teacher 36 6th 4 1 1 1
Teacher 3 7th 4 3 4 4 4 4
Teacher 34 7th
2 3 2
Teacher 43 7th 1 2 1 1 1 1
Teacher 47 8th
3 1 1 1
Teacher 24 8th 4 3 4 4 4
Teacher 37 8th 1 2 1 3 3 4

88
Reading Teacher Quartile Rankings Over Time Table A6
Teacher
Name Teacher
Grd 2006-2007
Reading
2007-2008
Reading
2008-2009
Reading
2009-2010
Reading
2010-2011
Reading
2011-2012
Reading
Teacher 1 3rd 1 1 1
Teacher 29 3rd 4 2 3
Teacher 32 3rd 2 4
Teacher 33 3rd 4 3 3 4 4 4
Teacher 7 3rd 4 3 1 3
Teacher 42 3rd 2 1 4 3 1
Teacher 44 3rd 1 4 2 2 1 1
Teacher 45 3rd 2 1 1 2 4 3
Teacher 46 3rd 3 2 4 3 3 4
Teacher 4 4th 1 1 3 3
Teacher 10 4th 3 3 4 4
Teacher 12 4th 2 4 4 4 3
Teacher 16 4th 4 3 2
Teacher 20 4th 4 3 2 3 3 1
Teacher 21 4th 2 1 4 2 1
Teacher 23 4th 1 3 2 1
Teacher 25 4th 3 2 3
Teacher 31 4th 3 4 3 2
Teacher 35 4th 3 4 2 4 3 2
Teacher 38 4th 2 1 2 1 1 4
Teacher 39 4th 1 2 1 1 1 1
Teacher 8 5th 1 4 4 4 4 4
Teacher 19 5th 3 2 3 1
Teacher 22 5th 2 3 2 4 3
Teacher 26 5th 1 3 1 3 4
Teacher 27 5th 3 1 2 1 2
Teacher 30 5th 1 3 2 3
Teacher 40 5th 3 3 2 2 1
Teacher 6 6th 2 1 2
Teacher 9 6th 2 3 3 2 3
Teacher 14 6th 2 2
Teacher 15 6th 1 3 1
Teacher 18 6th 4 4 4 3
Teacher 28 6th 1 2 3 4 4
Teacher 36 6th 4 1 2 2
Teacher 11 7th 2 4 4
Teacher 13 7th 1 2 3 1 1 2
Teacher 17 7th 3 4 1 4
Teacher 5 8th 4 4 1 4 4
Teacher 48 8th 1 1 2 2 2
Teacher 41 8th 3 3 2 4 2 2
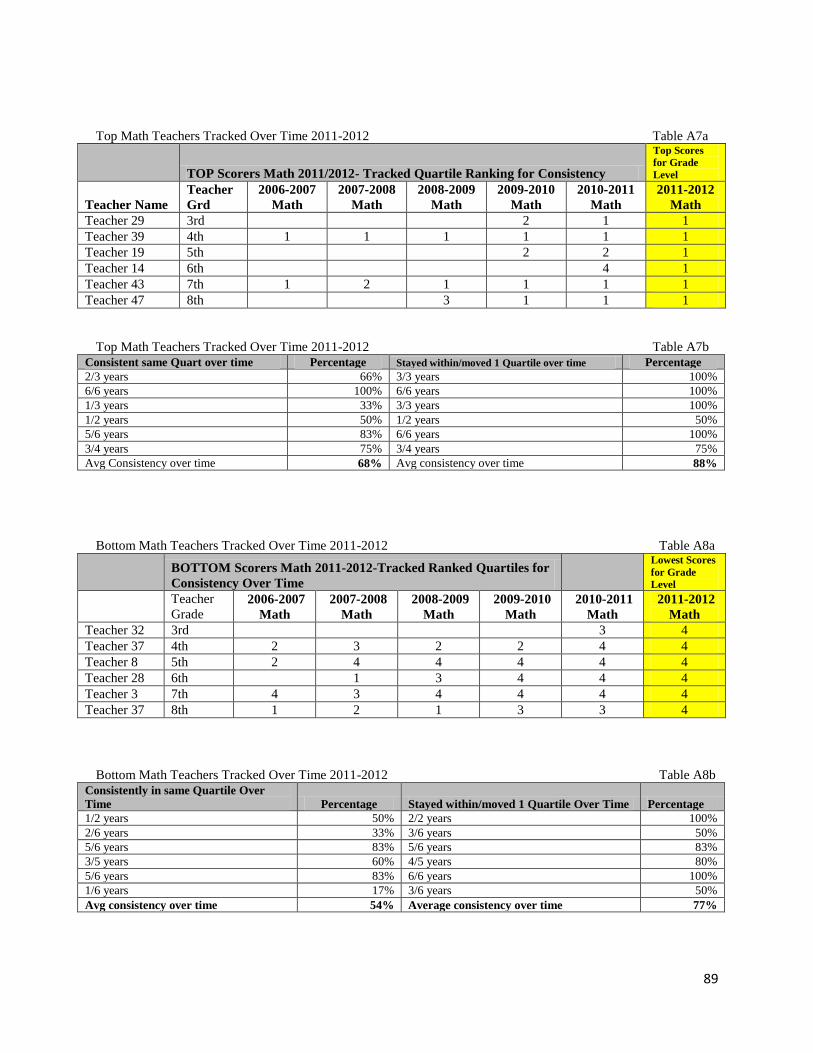
89
Top Math Teachers Tracked Over Time 2011-2012 Table A7a
TOP Scorers Math 2011/2012- Tracked Quartile Ranking for Consistency
Top Scores
for Grade
Level
Teacher Name
Teacher
Grd
2006-2007
Math
2007-2008
Math
2008-2009
Math
2009-2010
Math
2010-2011
Math
2011-2012
Math
Teacher 29 3rd
2 1 1
Teacher 39 4th 1 1 1 1 1 1
Teacher 19 5th
2 2 1
Teacher 14 6th
4 1
Teacher 43 7th 1 2 1 1 1 1
Teacher 47 8th
3 1 1 1
Top Math Teachers Tracked Over Time 2011-2012 Table A7b
Consistent same Quart over time Percentage Stayed within/moved 1 Quartile over time Percentage
2/3 years 66% 3/3 years 100%
6/6 years 100% 6/6 years 100%
1/3 years 33% 3/3 years 100%
1/2 years 50% 1/2 years 50%
5/6 years 83% 6/6 years 100%
3/4 years 75% 3/4 years 75%
Avg Consistency over time 68% Avg consistency over time 88%
Bottom Math Teachers Tracked Over Time 2011-2012 Table A8a
BOTTOM Scorers Math 2011-2012-Tracked Ranked Quartiles for
Consistency Over Time
Lowest Scores
for Grade
Level
Teacher
Grade 2006-2007
Math
2007-2008
Math
2008-2009
Math
2009-2010
Math
2010-2011
Math
2011-2012
Math
Teacher 32 3rd
3 4
Teacher 37 4th 2 3 2 2 4 4
Teacher 8 5th 2 4 4 4 4 4
Teacher 28 6th
1 3 4 4 4
Teacher 3 7th 4 3 4 4 4 4
Teacher 37 8th 1 2 1 3 3 4
Bottom Math Teachers Tracked Over Time 2011-2012 Table A8b
Consistently in same Quartile Over
Time Percentage Stayed within/moved 1 Quartile Over Time Percentage
1/2 years 50% 2/2 years 100%
2/6 years 33% 3/6 years 50%
5/6 years 83% 5/6 years 83%
3/5 years 60% 4/5 years 80%
5/6 years 83% 6/6 years 100%
1/6 years 17% 3/6 years 50%
Avg consistency over time 54% Average consistency over time 77%

90
Top Reading Teachers Tracked 2011-2012 Table A9a
TOP Scorers Reading 2011-2012- Tracked for Consistency
Top Scores
for Grade
Level
Teacher
Name Grade
2006-2007
Reading
2007-2008
Reading
2008-2009
Reading
2009-2010
Reading
2010-2011
Reading
2011-2012
Reading
Teacher 42 3rd
2 1 4 3 1
Teacher 39 4th 1 2 1 1 1 1
Teacher 40 5th
3 3 2 2 1
Teacher 15 6th
1 3 1
Teacher 13 7th 2 2 3 1 1 2
Teacher 41 8th 3 3 2 4 2 2
Top Reading Teachers Tracked 2011-2012 Table A9b
Consistent to same Quartile Over
Time Percentage Stayed within/moved 1 Quartile over time Percentage
2/5 years 40% 2/5 years 40%
5/6 years 83% 6/6 years 100%
1/5 years 20% 3/5 years 60%
2/3 years 67% 2/3 years 67%
3/6 years 50% 4/6 years 66%
2/6 years 33% 4/6 years 66%
Average consistency over time 49% Average consistency over time 66.5%
Bottom Reading Teachers Tracked 2011-2012 Table A10a
BOTTOM Scorers Reading 2011/2012- Tracked for Consistency
Bottom
Scores for
Grade
Level
Teacher
Name Grade
2006-2007
Reading
2007-2008
Reading 2008-2009 Reading
2009-2010
Reading
2010-2011
Reading
2011-2012
Reading
Teacher 33 3rd 4 3 3 4 4 4
Teacher 10 4th 3 3 4 4
Teacher 8 5th 1 4 4 4 4 4
Teacher 28 6th 1 4 3 4 4
Teacher 11 7th 2 4 4
Teacher 5 8th 4 4 1 4 4
Bottom Reading Teachers Tracked 2011-2012 Table A10b
Consistent same Quart over time Percentage
Stayed within/moved 1 Quartile Over
Time Percentage
4/6 years 67% 6/6 years 100%
2/4 years 50% 4/4 years 100%
5/6 years 83% 5/6 years 83%
3/5 years 60% 4/5 years 80%
2/3 years 66% 2/3 years 66%
4/5 years 80% 4/5 years 80%
Average Consistency Over Time 67% Average Consistency Over Time 85%