symphony math teacher guide - unit 5
TRANSCRIPT

symphony math
teacher guide

Copyright and Trademark Notice 2012 © Symphony Learning, LLC. All rights reserved.
Symphony Math is a trademark of Symphony Learning, LLC. Director is a trademark of Adobe. Macintosh is a trademark of Apple Computer, Inc. MS Windows is a trademark of Microsoft Corporation. Symphony Math has been created with Adobe Director software.
Published by: Symphony Learning, LLC. PO Box 5491 Hanover, NH 03755
Phone: 800.234.3030 www.symphonylearning.com [email protected]
Information in this document is subject to change without notice and does not represent a commitment on the part of Symphony Learning, LLC. The software described in this document is furnished under a license agreement or non-disclosure agreement. The software may be used only in accordance with the terms of the agreement. This docu-ment and the software described within it may not, in whole or in part, be copied, photocopied, reproduced, translated, or reduced to any electronic medium or machine-readable form other than that which has been specified herein with-out prior written consent from Symphony Learning, LLC.
Acknowledgments: We thank the many math researchers, teachers and cognitive scientists for their research and practice in the field of mathematics education upon which this program is based.
Version 6.01

iii
contents
symphony math
Table of Content | Overview of Symphony Math
01 overview of the symphony math program . . . . . . . . . . . . . . . . . . . . . 1introduction . . . . . . . . . . . . . . . . . . . . . . . . . . . . . . . . . . . . . . . . . . . . . . . . . . . . . . . . . . . . . . . . . 1Screener . . . . . . . . . . . . . . . . . . . . . . . . . . . . . . . . . . . . . . . . . . . . . . . . . . . . . . . . . . . . . . . . . . . . 1Benchmarker . . . . . . . . . . . . . . . . . . . . . . . . . . . . . . . . . . . . . . . . . . . . . . . . . . . . . . . . . . . . . . . . 1Intervention . . . . . . . . . . . . . . . . . . . . . . . . . . . . . . . . . . . . . . . . . . . . . . . . . . . . . . . . . . . . . . . . . 2The Symphony Approach . . . . . . . . . . . . . . . . . . . . . . . . . . . . . . . . . . . . . . . . . . . . . . . . . . . . . . 2Efficient Implementation . . . . . . . . . . . . . . . . . . . . . . . . . . . . . . . . . . . . . . . . . . . . . . . . . . . . . . . 4Using the Symphony Math Program . . . . . . . . . . . . . . . . . . . . . . . . . . . . . . . . . . . . . . . . . . . . . 6Alternative Uses of Symphony Math . . . . . . . . . . . . . . . . . . . . . . . . . . . . . . . . . . . . . . . . . . . . . 7
02 symphony math screener . . . . . . . . . . . . . . . . . . . . . . . . . . . . . . . . . . . 8Introduction . . . . . . . . . . . . . . . . . . . . . . . . . . . . . . . . . . . . . . . . . . . . . . . . . . . . . . . . . . . . . . . . . 8Defining Risk . . . . . . . . . . . . . . . . . . . . . . . . . . . . . . . . . . . . . . . . . . . . . . . . . . . . . . . . . . . . . . . . . 8Screener Reports . . . . . . . . . . . . . . . . . . . . . . . . . . . . . . . . . . . . . . . . . . . . . . . . . . . . . . . . . . . . 10Three Testing Windows Each School Year . . . . . . . . . . . . . . . . . . . . . . . . . . . . . . . . . . . . . . . . 11
03 symphony math benchmarker . . . . . . . . . . . . . . . . . . . . . . . . . . . . . 13Introduction . . . . . . . . . . . . . . . . . . . . . . . . . . . . . . . . . . . . . . . . . . . . . . . . . . . . . . . . . . . . . . . . 13Benchmarker Methodology . . . . . . . . . . . . . . . . . . . . . . . . . . . . . . . . . . . . . . . . . . . . . . . . . . . 13Benchmarker Norm-Referenced Scores . . . . . . . . . . . . . . . . . . . . . . . . . . . . . . . . . . . . . . . . . 14
04 symphony math intervention . . . . . . . . . . . . . . . . . . . . . . . . . . . . . . . 18Introduction . . . . . . . . . . . . . . . . . . . . . . . . . . . . . . . . . . . . . . . . . . . . . . . . . . . . . . . . . . . . . . . . 18The Big Ideas of Mathematics . . . . . . . . . . . . . . . . . . . . . . . . . . . . . . . . . . . . . . . . . . . . . . . . . 18Multiple Ways of Knowing . . . . . . . . . . . . . . . . . . . . . . . . . . . . . . . . . . . . . . . . . . . . . . . . . . . . . 20Learning Through Thinking and Making Connections . . . . . . . . . . . . . . . . . . . . . . . . . . . . . . 24Dynamic Branching Allows Students to Learn at Their Own Level . . . . . . . . . . . . . . . . . . . . 26Comprehensive Reports . . . . . . . . . . . . . . . . . . . . . . . . . . . . . . . . . . . . . . . . . . . . . . . . . . . . . . 27Who Can Use Symphony Math? . . . . . . . . . . . . . . . . . . . . . . . . . . . . . . . . . . . . . . . . . . . . . . . 28
05 intervention scope and sequence . . . . . . . . . . . . . . . . . . . . . . . . . . 29Introduction . . . . . . . . . . . . . . . . . . . . . . . . . . . . . . . . . . . . . . . . . . . . . . . . . . . . . . . . . . . . . . . . 29The Seventeen Stages of Symphony Math . . . . . . . . . . . . . . . . . . . . . . . . . . . . . . . . . . . . . . . 30Big Idea #1: Quantity . . . . . . . . . . . . . . . . . . . . . . . . . . . . . . . . . . . . . . . . . . . . . . . . . . . . . . . . 30Big Idea #2: Parts-To-Whole . . . . . . . . . . . . . . . . . . . . . . . . . . . . . . . . . . . . . . . . . . . . . . . . . . . 32Big Idea #3: Hierarchical Groupings . . . . . . . . . . . . . . . . . . . . . . . . . . . . . . . . . . . . . . . . . . . . 35

ivTable of Content | Overview of Symphony Math
Big Idea #4: Hierarchical Groupings with Parts-to-Whole . . . . . . . . . . . . . . . . . . . . . . . . . . . 36Big Idea #5: Repeated Equal Groupings . . . . . . . . . . . . . . . . . . . . . . . . . . . . . . . . . . . . . . . . 39Big Idea #6: Repeated Equal Groupings with Parts-to-Whole . . . . . . . . . . . . . . . . . . . . . . . . 41
06 setting up accounts and classes . . . . . . . . . . . . . . . . . . . . . . . . . . . . 44Introduction . . . . . . . . . . . . . . . . . . . . . . . . . . . . . . . . . . . . . . . . . . . . . . . . . . . . . . . . . . . . . . . . 44System Requirements for the Symphony Administration Panel . . . . . . . . . . . . . . . . . . . . . . 44Logging in to the Symphony Math Administration Panel . . . . . . . . . . . . . . . . . . . . . . . . . . . 45Symphony Dashboard . . . . . . . . . . . . . . . . . . . . . . . . . . . . . . . . . . . . . . . . . . . . . . . . . . . . . . . 45Creating Student Accounts and Your Class . . . . . . . . . . . . . . . . . . . . . . . . . . . . . . . . . . . . . . 46Using the Import Tab to Create Student Accounts and Classes . . . . . . . . . . . . . . . . . . . . . . 49Introduction . . . . . . . . . . . . . . . . . . . . . . . . . . . . . . . . . . . . . . . . . . . . . . . . . . . . . . . . . . . . . . . . 53System Requirements . . . . . . . . . . . . . . . . . . . . . . . . . . . . . . . . . . . . . . . . . . . . . . . . . . . . . . . . 53
07 installing symphony math intervention . . . . . . . . . . . . . . . . . . . . . . . . . . . . . 53Introduction . . . . . . . . . . . . . . . . . . . . . . . . . . . . . . . . . . . . . . . . . . . . . . . . . . . . . . . . . . . . . . . . 53System Requirements . . . . . . . . . . . . . . . . . . . . . . . . . . . . . . . . . . . . . . . . . . . . . . . . . . . . . . . . 53Download and Install the Symphony Math Application . . . . . . . . . . . . . . . . . . . . . . . . . . . . 54Student Sign In . . . . . . . . . . . . . . . . . . . . . . . . . . . . . . . . . . . . . . . . . . . . . . . . . . . . . . . . . . . . . . 56Network Installation Instructions . . . . . . . . . . . . . . . . . . . . . . . . . . . . . . . . . . . . . . . . . . . . . . . 56Set Up the School-To-Home Option . . . . . . . . . . . . . . . . . . . . . . . . . . . . . . . . . . . . . . . . . . . . . 57
08 district set up . . . . . . . . . . . . . . . . . . . . . . . . . . . . . . . . . . . . . . . . . . . . 58Introduction . . . . . . . . . . . . . . . . . . . . . . . . . . . . . . . . . . . . . . . . . . . . . . . . . . . . . . . . . . . . . . . . 58Compatible Web Browsers for Administration Panel . . . . . . . . . . . . . . . . . . . . . . . . . . . . . . . 58Configuring the Administration Panel . . . . . . . . . . . . . . . . . . . . . . . . . . . . . . . . . . . . . . . . . . . 59Logging in to the Symphony Math Administration Panel . . . . . . . . . . . . . . . . . . . . . . . . . . . 59Changing District Settings . . . . . . . . . . . . . . . . . . . . . . . . . . . . . . . . . . . . . . . . . . . . . . . . . . . . . 60Creating School Accounts . . . . . . . . . . . . . . . . . . . . . . . . . . . . . . . . . . . . . . . . . . . . . . . . . . . . 62Creating Student Accounts . . . . . . . . . . . . . . . . . . . . . . . . . . . . . . . . . . . . . . . . . . . . . . . . . . . 63Using the Import Tab to Create Student Accounts and Classes . . . . . . . . . . . . . . . . . . . . . . 64Installing the Symphony Math Intervention Application . . . . . . . . . . . . . . . . . . . . . . . . . . . . 68System Requirements . . . . . . . . . . . . . . . . . . . . . . . . . . . . . . . . . . . . . . . . . . . . . . . . . . . . . . . . 68Ensuring Student Access to the Symphony Web Servers . . . . . . . . . . . . . . . . . . . . . . . . . . . . 68Deciding Between Local and Network Installation . . . . . . . . . . . . . . . . . . . . . . . . . . . . . . . . 69
09 installing intervention at home . . . . . . . . . . . . . . . . . . . . . . . . . . . . . . 70Introduction . . . . . . . . . . . . . . . . . . . . . . . . . . . . . . . . . . . . . . . . . . . . . . . . . . . . . . . . . . . . . . . . 70System Requirements . . . . . . . . . . . . . . . . . . . . . . . . . . . . . . . . . . . . . . . . . . . . . . . . . . . . . . . . 70Download and Install the Symphony Math Intervention Application . . . . . . . . . . . . . . . . . 71Student Signin . . . . . . . . . . . . . . . . . . . . . . . . . . . . . . . . . . . . . . . . . . . . . . . . . . . . . . . . . . . . . . 72
10 using symphony math intervention . . . . . . . . . . . . . . . . . . . . . . . . . . . . . . . . . . . . . 73Introduction . . . . . . . . . . . . . . . . . . . . . . . . . . . . . . . . . . . . . . . . . . . . . . . . . . . . . . . . . . . . . . . . 73The Student Signin Screen . . . . . . . . . . . . . . . . . . . . . . . . . . . . . . . . . . . . . . . . . . . . . . . . . . . . 73The Student Scoreboard Screen . . . . . . . . . . . . . . . . . . . . . . . . . . . . . . . . . . . . . . . . . . . . . . . 74The Thinking Round . . . . . . . . . . . . . . . . . . . . . . . . . . . . . . . . . . . . . . . . . . . . . . . . . . . . . . . . . . 75The Help Button . . . . . . . . . . . . . . . . . . . . . . . . . . . . . . . . . . . . . . . . . . . . . . . . . . . . . . . . . . . . . 77The Mastery Round . . . . . . . . . . . . . . . . . . . . . . . . . . . . . . . . . . . . . . . . . . . . . . . . . . . . . . . . . . 78

vTable of Content | Overview of Symphony Math
11 the intervention dashboard . . . . . . . . . . . . . . . . . . . . . . . . . . . . . . . . 79Overview of the Dashboard . . . . . . . . . . . . . . . . . . . . . . . . . . . . . . . . . . . . . . . . . . . . . . . . . . . 79Status Over Past Four Weeks . . . . . . . . . . . . . . . . . . . . . . . . . . . . . . . . . . . . . . . . . . . . . . . . . . . 80The Dashboard Categories . . . . . . . . . . . . . . . . . . . . . . . . . . . . . . . . . . . . . . . . . . . . . . . . . . . 81Understanding the Gauges . . . . . . . . . . . . . . . . . . . . . . . . . . . . . . . . . . . . . . . . . . . . . . . . . . . 81How to Remedy Common Implementation Issues . . . . . . . . . . . . . . . . . . . . . . . . . . . . . . . . 83The Overall Status Statistics . . . . . . . . . . . . . . . . . . . . . . . . . . . . . . . . . . . . . . . . . . . . . . . . . . . 84Understanding the Progress Over Time Graphs . . . . . . . . . . . . . . . . . . . . . . . . . . . . . . . . . . . 84Other Important Dashboard Features . . . . . . . . . . . . . . . . . . . . . . . . . . . . . . . . . . . . . . . . . . . 86
12 reports . . . . . . . . . . . . . . . . . . . . . . . . . . . . . . . . . . . . . . . . . . . . . . . . . . 87Overview of Reports . . . . . . . . . . . . . . . . . . . . . . . . . . . . . . . . . . . . . . . . . . . . . . . . . . . . . . . . . 87Symphony Math Reports . . . . . . . . . . . . . . . . . . . . . . . . . . . . . . . . . . . . . . . . . . . . . . . . . . . . . . 88Selecting Reports . . . . . . . . . . . . . . . . . . . . . . . . . . . . . . . . . . . . . . . . . . . . . . . . . . . . . . . . . . . . 89Screener Reports . . . . . . . . . . . . . . . . . . . . . . . . . . . . . . . . . . . . . . . . . . . . . . . . . . . . . . . . . . . . 90Compare Groups: Screener Status . . . . . . . . . . . . . . . . . . . . . . . . . . . . . . . . . . . . . . . . . . . . . 90Benchmarker Reports . . . . . . . . . . . . . . . . . . . . . . . . . . . . . . . . . . . . . . . . . . . . . . . . . . . . . . . . 93Intervention Reports . . . . . . . . . . . . . . . . . . . . . . . . . . . . . . . . . . . . . . . . . . . . . . . . . . . . . . . . . 98
13 managing user accounts . . . . . . . . . . . . . . . . . . . . . . . . . . . . . . . . . 114Staff Access . . . . . . . . . . . . . . . . . . . . . . . . . . . . . . . . . . . . . . . . . . . . . . . . . . . . . . . . . . . . . . . .114Managing School Accounts Within a District . . . . . . . . . . . . . . . . . . . . . . . . . . . . . . . . . . . . .116Creating Staff Accounts . . . . . . . . . . . . . . . . . . . . . . . . . . . . . . . . . . . . . . . . . . . . . . . . . . . . . .117Managing Student Accounts . . . . . . . . . . . . . . . . . . . . . . . . . . . . . . . . . . . . . . . . . . . . . . . . . .118Managing Classes . . . . . . . . . . . . . . . . . . . . . . . . . . . . . . . . . . . . . . . . . . . . . . . . . . . . . . . . . . 122
14 symphony math intervention advanced settings . . . . . . . . . . . . . . . . . 124Introduction . . . . . . . . . . . . . . . . . . . . . . . . . . . . . . . . . . . . . . . . . . . . . . . . . . . . . . . . . . . . . . . 124Settings Panel . . . . . . . . . . . . . . . . . . . . . . . . . . . . . . . . . . . . . . . . . . . . . . . . . . . . . . . . . . . . . . 124Account Information . . . . . . . . . . . . . . . . . . . . . . . . . . . . . . . . . . . . . . . . . . . . . . . . . . . . . . . . 125Student Settings . . . . . . . . . . . . . . . . . . . . . . . . . . . . . . . . . . . . . . . . . . . . . . . . . . . . . . . . . . . . 126Network Settings . . . . . . . . . . . . . . . . . . . . . . . . . . . . . . . . . . . . . . . . . . . . . . . . . . . . . . . . . . . 127Graphics and Sound Settings . . . . . . . . . . . . . . . . . . . . . . . . . . . . . . . . . . . . . . . . . . . . . . . . . 127Administration . . . . . . . . . . . . . . . . . . . . . . . . . . . . . . . . . . . . . . . . . . . . . . . . . . . . . . . . . . . . . 129
15 technical troubleshooting . . . . . . . . . . . . . . . . . . . . . . . . . . . . . . . . . 130Ensuring Student Access to the Symphony Web Servers . . . . . . . . . . . . . . . . . . . . . . . . . . . 130Deciding Between Local and Network Installation . . . . . . . . . . . . . . . . . . . . . . . . . . . . . . . .131Importing Students, Teachers, and Classes . . . . . . . . . . . . . . . . . . . . . . . . . . . . . . . . . . . . . 132Fixing Program Slowness, Crashes, and Error Messages . . . . . . . . . . . . . . . . . . . . . . . . . . . 136Symphony Math Intervervention Automatic Updates . . . . . . . . . . . . . . . . . . . . . . . . . . . . . 137Symphony Math Intervention School-to-Home Use . . . . . . . . . . . . . . . . . . . . . . . . . . . . . . 137
16 preparing for a new school year . . . . . . . . . . . . . . . . . . . . . . . . . . . 139Option 1: Delete All Students and Re-Import School Roster . . . . . . . . . . . . . . . . . . . . . . . . 140Option 2: Update the Existing School Roster . . . . . . . . . . . . . . . . . . . . . . . . . . . . . . . . . . . . . 140

viTable of Content | Overview of Symphony Math
17 frequently asked questions . . . . . . . . . . . . . . . . . . . . . . . . . . . . . . . . 142Assessment . . . . . . . . . . . . . . . . . . . . . . . . . . . . . . . . . . . . . . . . . . . . . . . . . . . . . . . . . . . . . . . 142Using Symphony Math Intervention . . . . . . . . . . . . . . . . . . . . . . . . . . . . . . . . . . . . . . . . . . . 144Symphony Math Intervention Installation & Setup . . . . . . . . . . . . . . . . . . . . . . . . . . . . . . . . 147Symphony Math Administration Panel . . . . . . . . . . . . . . . . . . . . . . . . . . . . . . . . . . . . . . . . . 148Contacting Technical Support . . . . . . . . . . . . . . . . . . . . . . . . . . . . . . . . . . . . . . . . . . . . . . . . 148
Appendices . . . . . . . . . . . . . . . . . . . . . . . . . . . . . . . . . . . . . . . . . . . . . . 149Appendix A: Symphony Math Intervention Scope & Sequence . . . . . . . . . . . . . . . . . . . . . . . . . . . . . . . . 149Appendix B: Symphony Math Intervention Word List . . . . . . . . . . . . . . . . . . . . . . . . . . . . . 155Appendix C: Assessment Criteria and Specifications . . . . . . . . . . . . . . . . . . . . . . . . . . . . 156Appendix D: Research Base . . . . . . . . . . . . . . . . . . . . . . . . . . . . . . . . . . . . . . . . . . . . . . . . . 162

1
introductionSymphony Math is a three-step program that identifies and supports students who need help with
math. Each step in the Symphony Math process is supported by one of the program tools: Screener,
Benchmarker, and Intervention. Together the three tools offer a framework for identifying students
at risk for math failure, quantifying their rate of progress, and filling in gaps in their mathematical
development.
Symphony Math efficiently identifies students in need of additional support in mathematics, then pro-
vides the tools to track and support the effort to close the gap with their peer group. The program is
suitable for students in kindergarten through grade eight. The assessments are designed to measure
learning against the Common Core State Standards for Mathematics. The three tools can be used
individually or together to support Response to Intervention.
ScreenerSymphony Math Screener is a quick and accurate tool for identifying which students in a school (or
district) are at-risk or borderline for math failure. With an average test time of five minutes, Screener
quickly determines a student’s at-risk status. Screener is given three times a year (Fall/Winter/Spring).
BenchmarkerSymphony Math Benchmarker is a computer adaptive test (CAT) that determines the instructional
level of each student and quantifies their progress over the course of the school year. The average
test time for Benchmarker is twenty minutes. The assessment provides a standard score, grade-level
overview of the symphony math program01
Chapter 01 | Overview of the Symphony Math Program

2
equivalent, and percentile rank for each student. As students repeat the assessments a second and
third time, Benchmarker provides scores that show the rate of student learning from one testing
period to the next.
InterventionSymphony Math Intervention helps address one of the primary causes of poor math performance:
Weak foundation skills. The Intervention tool provides students with the experience of learning and
thinking about the most important mathematical concepts through a systematic progression.
The Symphony ApproachMany students have not become proficient in math because they have not mastered the foundational
concepts with sufficient depth. Symphony Math philosophy emphasizes the development of a deeper
understanding of critical mathematical concepts. There are several pedagogic techniques the
program employs to support the development of a profound understanding of mathematics:
l Symphony Math Screener and Benchmarker probe for in-depth understanding by using
technology-enhanced test items. Symphony assessment problems challenge students to
produce multiple correct solutions, demonstrate fluency, graph lines, use measurement
tools, and solve for the exact answer, instead of providing only a simple, multiple choice.
These technology-enhanced problems require students to demonstrate a deeper level of
understanding to produce correct responses.
l Symphony Math Screener & Benchmarker are multi-skill assessments. They do not focus on
one or two specific skills, but have a databank that contains several assessment problems
for each Common Core State Standard from kindergarten through grade eight.
Chapter 01 | Overview of the Symphony Math Program

3
l Symphony Math assessments are suitable for younger students. This allows educators to
identify students at risk for math failure in the first month of kindergarten, instead of waiting
until grade 4 when end-of-year grade 3 results become available. Instructional supports can
be implemented early in the student’s learning career, to close the gap with peers before it
becomes unmanageably large.
l Symphony Math conforms to the Common Core State Standards (CCSS), and adopts the same commitment to in-depth learning and understanding. By aligning its assessments to the CCSS, Symphony Math enables schools to focus on assessing a narrow range of target concepts, at the in-depth and rigorous level specified by the CCSS.
l Symphony Math supports Response to Intervention, helping assess and develop indepth understanding of mathematics. Some screeners used for Response to Intervention only measure fluency, or focus on a single skill, and are not aligned to the depth and rigor of the Common Core State Standards. However, using Symphony Math minimizes the chance that an at-risk student might quickly learn a skill needed to pass the fluency screener (e.g. single digit addition) without acquiring the in-depth and rigorous understanding necessary to succeed in a CCSS curriculum.
l The Symphony Math Benchmarker provides growth scores for each student, class, grade, and school. Growth scores may be used to ensure that ALL students are making expected progress: With Benchmarker growth data at hand, schools can readily identify students who -- while not currently on the edge of the pass-fail bubble -- still are not showing appropriate advancement. Resources may therefore be allocated to help those students just beginning to fall behind, Benchmarker supports students who may not be making appropriate growth, as well as assisting those well below the pass-fail bubble who will need two to three years to achieve proficiency.
Chapter 01 | Overview of the Symphony Math Program
4
Efficient ImplementationHaving accurate, effective assessment and intervention tools is often not enough to successfully man-
age a large-scale, data-driven educational program. The tools must also be easy to use, and consume
as little instructional time as possible. That’s why efficiency of implementation forms another key
component of Symphony Math philosophy. If the screening and benchmarking process takes too long,
educators do not have sufficient time to teach their students during the intervention phase.
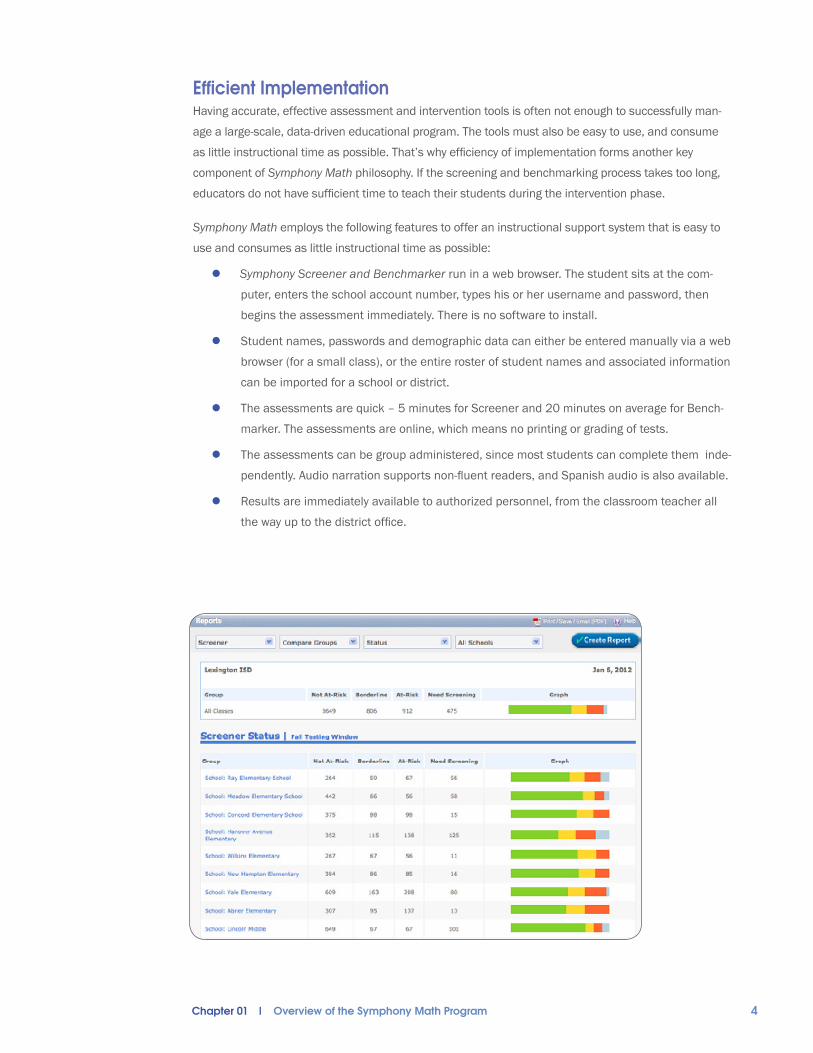
Symphony Math employs the following features to offer an instructional support system that is easy to
use and consumes as little instructional time as possible:
l Symphony Screener and Benchmarker run in a web browser. The student sits at the com-
puter, enters the school account number, types his or her username and password, then
begins the assessment immediately. There is no software to install.
l Student names, passwords and demographic data can either be entered manually via a web
browser (for a small class), or the entire roster of student names and associated information
can be imported for a school or district.
l The assessments are quick – 5 minutes for Screener and 20 minutes on average for Bench-
marker. The assessments are online, which means no printing or grading of tests.
l The assessments can be group administered, since most students can complete them inde-
pendently. Audio narration supports non-fluent readers, and Spanish audio is also available.
l Results are immediately available to authorized personnel, from the classroom teacher all
the way up to the district office.
Chapter 01 | Overview of the Symphony Math Program

5
Using the Symphony Math ProgramThe three Symphony Math tools can be used individually or together as an integrated system. Indi-
vidual use might consist of only using Screener to quickly identify at-risk students across a district.
Benchmarker can be used as a stand-alone tool to measure student growth over the course of the
school year. Intervention could be used as a school-wide math support program, perhaps where previ-
ous data has already identified that the majority of students are at risk for math failure, and Interven-
tion should part of the core curriculum.
Below is an outline of how Symphony Math can be implemented as an integrated system to identify
and support students at-risk for math failure.
Step 1: Screen All StudentsAt the beginning of the school year, screen all students in kindergarten through grade eight with
Symphony Math Screener. Students can login from desktop computers using a web browser. Screener
takes about five minutes, and returns one of three outcomes for each student:
l Not at-risk – the student is above the at-risk threshold.
l Borderline – the student is very close to the at-risk threshold and should be given the longer
Benchmarker assessment.
l At-risk – the student is below the at-risk threshold and should be given the longer. Bench-
marker assessment to confirm this result.
Chapter 01 | Overview of the Symphony Math Program

6
Students take the screener in the fall, winter and spring. Screener consists of eight test items that are
at or near the at-risk threshold for the student’s grade level. For example, if the risk threshold is set
to the 20th percentile, a grade two student will see eight test items during their screening that are at
or near the 20th percentile for second grade students. Immediately after the screening, teachers can
access online reports that document which students are not at-risk, borderline, or at-risk.
Step 2: Benchmark At-Risk and Borderline StudentsThe second step in the Symphony Math process is benchmarking students with an at-risk or
borderline status. Benchmarking each student identified as at-risk or borderline gives the student
an opportunity to reject their status and demonstrate more of their mathematical knowledge. The
benchmarking process also provides a baseline diagnostic score, which helps determine a student’s
instructional level, and charts the student’s growth over the course of the school year.
Step 3: Intervene with At-Risk and Borderline StudentsThe third step in the Symphony Math process is implementing Intervention with students identified
as borderline or at-risk. Intervention requires a minimum of 45 minutes of use each week, and
is designed to help students fill in gaps in their foundational understanding of mathematics. This
could be a part of a student’s tier II or tier III intervention program in the RtI framework. Fidelity of
implementation is vital, as students at-risk for math failure often need intensive and consistent
practice with foundational concepts in order to develop mastery.
Chapter 01 | Overview of the Symphony Math Program

7
Alternative Uses of Symphony MathSome schools only use Symphony Math Intervention, forgoing screening and benchmarking. Their
data-driven decision making has lead them to conclude that more than twenty percent of their entire
school population is at-risk for math failure, and therefore needs intensive support at the tier I level.
Many schools find it more efficient to administer Screener and Benchmarker together in their
integrated form to all students: The 20-minute average test time for Benchmarker is not prohibitively
long, and they want to track the growth of all students. This is the default setting for Symphony Math,
where Screener and Benchmarker are given together in one 20-minute session.
Ideally, each school or district will use the Symphony Math tools in the way that makes the most sense
for their students, and which produces the most optimal outcomes.
Chapter 01 | Overview of the Symphony Math Program

8
IntroductionSymphony Math Screener quickly and accurately identifies students at risk for math failure. Screener
is especially useful for large schools or districts that want to screen all students, but do not have the
time, or computer availability, for longer tests. The assessment time for Screener averages less than 5
minutes per student.
Defining RiskThe first step in implementing Screener is setting the cut score definition of “at-risk.” When a student
is said to be “at-risk for mathematics failure,” there must be a definition of what “at-risk” means.
In the context of Response to Intervention, “at-risk” is typically defined as a cut score based on the
percentile rank of a student. The 25th percentile is a common cut score for the definition of at-risk:
All students who are at or below the 25th percentile are deemed “at-risk,” and should be monitored
more closely.
In a school or district with many students performing below grade level, using the 25th percentile may
be inappropriate. If a school screens all of its students using a cut score at the 25th percentile, then
finds half of the students at-risk, the school could not easily provide progress monitoring and interven-
tions for all of those students. In such cases, a lower cut score should be considered, one that is more
likely to identify 15 to 20 percent of the students as being at-risk.
On the other hand, for a school or district that has many students performing at or above grade
level, a higher cut score may be appropriate. Some schools might use the 40th percentile cut score,
because it effectively identifies the struggling learners of that particular school system.
symphony math screener02
Chapter 02 | Screener

9
Administrators can define the At-Risk threshold from the online Administration Panel.
Schools that are not using a multi-tiered system may be more comfortable defining risk in terms of
months below grade level. For example: At the beginning of the school year, a grade three student
testing at the 2.1 grade level is 12 months below grade level. If risk is defined as 12 months below
grade level, this student would be positively identified. The 12-Months-Below grade level setting
can make more intuitive sense than the more abstract percentile setting. If a teacher knows that
a student is one year (or 18 months, or 24 months) below grade level, it makes it very clear that a
different instructional approach will be necessary.
If a school or district wants to experiment with different risk definitions, we recommend assessing
students with the longer Benchmarker assessment tool. After students have been benchmarked, the
risk definition can be modified in the Administration Panel, and reports reviewed to determine the
appropriateness of the risk definition. The reports will update dynamically and display the distribution
of at-risk students each time Benchmarker receives new data. If only Screener is administered,
changes to the risk definition will not be reflected until the next testing window.
Chapter 02 | Screener

10
Screener ReportsScreener produces one of three outcomes for each student tested:
l Not at-risk: The student is above the at-risk threshold. If at-risk is defined as the 25th
percentile, a student identified as not at-risk is at least five percentile points above the 25th
percentile.
l Borderline: the student is very close to the at-risk threshold, and should be given the longer
Benchmarker assessment to better determine his or her status. If at-risk is defined as the
25th percentile, a student identified as borderline is between the 20th and 30th percentiles.
Borderline status results from a score that is plus or minus five percentile points from the
at-risk cut score.
l At-risk: The student is below the at-risk threshold, and should be given the longer
Benchmarker assessment to confirm the positive result. If the at-risk definition is set to the
25th percentile, a student identified is at-risk is at least below the 20th percentile, since the
borderline status is used for plus or minus five percentile points.
Chapter 02 | Screener

11
Three Testing Windows Each School YearSymphony Math Screener may be administered to a student three times each school year. It is
possible that a student not identified as at-risk after the fall screening will be identified as at-risk at
the winter or spring screening, if the student did not make sufficient progress to keep up with the peer
group.
The exact date ranges of the testing windows may be defined in the online Administration Panel.
Defining the date range ensures that students are not accidently tested before or after the desired
test period.
Screener Methodology: An Emphasis on Saving TimeThe design of Screener emphasizes quick and efficient assessments on a large scale. Screener
provides very specific information (a student’s at-risk status) resulting from a very short test (3-5
minutes). Screener also allows for custom cut scores to be designated in advance of the assessment.
Screener achieves this efficiency by only administering test items that have a difficulty rating that is
approximate to the cut score. If the cut score (definition of at-risk status) is set to 12-months below
grade level, then a student will only see test items that are 12-months below his or her current grade
level. If the student does well on these items, the test determines that she is above the cut score,
and not at risk. If the student does poorly on these test items, she will be identified as at-risk. A mixed
performance would result in a status of borderline.
Administrators can define the starting date for each testing window from the on-line Administration Panel
Chapter 02 | Screener

12
At-Risk Borderline StudentsStudents who are identified as at-risk or borderline by Screener should be given the longer
Benchmarker assessment to confirm the at-risk status, and give the student more of an opportunity to
demonstrate her math knowledge. It is possible that the short Screener assessment did not provide
enough time for that student to become comfortable with the online testing interface. Or maybe the
student was momentarily distracted during the screening. Benchmarker, with an average test time
closer to 20 minutes, is more in-depth. After completing Benchmarker, the student’s status in the
screener reports will be updated if there are any changes to her status.
Screener or BenchmarkerSchools and districts have the option of configuring Symphony Math to provide an integrated
screening and benchmarking assessment. This assessment session will output all of the data in
Screener reports, as well as a standard score, grade level equivalent, percentile rank, and growth
score. If a school or district has the time and computer capacity for the longer Benchmarker it may
prefer this configuration in order to obtain more comprehensive data. The administration of Screener
by itself is only for those interested in the shortest, most efficient mathematics screening process
available.
Chapter 02 | Screener

13
IntroductionWhen a teacher begins the school year with a new class of students, most curricula are designed with
the assumption that all of the students in the class are at the same general level of academic ability.
In reality, the typical elementary classroom will reveal a wide range of student ability. There may be
some students that are one or two years below grade level, in terms of academic knowledge and
skills; other students may be above grade level. And of course there will be a middle group with skills
and knowledge within the grade-level range.
The challenge for the teacher is to engage and teach the specified curriculum to all of these students
of varying levels of ability and learning readiness. How can the teacher quickly determine where each
student is in relation to each other? How can the teacher ensure that each student is improving and
benefiting from instruction over the course of the year?
Symphony Math Benchmarker is designed to help answer these questions. Benchmarker is an online
assessment that provides a standard score, grade-level equivalent, and percentile rank for each
student three times a year. Twice a year Benchmarker generates a growth score. These scores supply
the teacher with the means to better understand the needs and capabilities of each student.
Benchmarker MethodologyBenchmarker is a Computer Adaptive Test (CAT) that dynamically locates each student on a standardized
scale of mathematical ability. The test is based upon an item bank of 900 test items that were specifi-
cally designed to measure progress against the Common Core State Standards (CCSS) for Mathematics.
Benchmarker test items have been calibrated and organized on a scale of low difficulty to high difficulty;
the program applies Item Response Theory algorithms which move the student to an easier item after
an incorrect response, and to a harder item after a correct response.
symphony math benchmarker03
Chapter 03 | Benchmarker

14
Each student begins Benchmarker with an assessment item that is two years below the student’s
enrolled grade level. Depending on the student’s pattern of correct and incorrect responses, the test
items will become more or less difficult. A student may see between 18 and 24 assessment items
during a Benchmarker session. Benchmarker ends the assessment after it has seen enough re-
sponses to determine the student’s location on the standardized scale of CCSS mathematics ability.
Benchmarker Norm-Referenced ScoresAfter students complete the test, Benchmarker outputs four performance scores: Scale Score,
Percentile, Grade-Level Equivalency, and (after initial testing) Growth.
Scale Scores
All students receive a standardized score on a common vertical scale which reveals how the tested
students performed in comparison to grade-specific national norms. Such standard scores are known
for all grades, and the score averages for each grade are listed in the following table.
Grade Mean Scale Score*
Kindergarten 485
Grade 1 581
Grade 2 664
Grade 3 735
Grade 4 794
Grade 5 841
Grade 6 876
Grade 7 899
Grade 8 910
*Scale scores are for end of school year for each grade level
Because students’ performance increases over the school year the table only shows data for the last
month of instruction, typically the month of May. For instance, a fifth-grader who in May received a
scale score of 865 performed above average on the test, while a sixth-grader with the same score is
below average. And, because Symphony norms are based on nationwide data, this also means that
this particular fifth-grader performed better than most other fifth-graders nationwide who were tested
in May. The other grades are normed in the same fashion. While the table only shows the average
scores for the end of the school year, the dynamic reports of Symphony Math use month by month
tables to automatically provide the percentile rank for the month Benchmarker was administered.
Because Symphony Benchmarker scores are expressed on a vertical scale, students’ scores can be
readily compared across grades. We all expect that most first-graders have learned more than most
kindergartners, most second-graders have learned more than most first-graders, and so on. With
Symphony’s scale scores, teachers can track performance regardless of assigned grade, allowing
tracking of students across grades, thus supplying a detailed picture of their progress over time.
Chapter 03 | Benchmarker

15
Percentile
A percentile rank tells what percentage of students in a specific group received lower scores than the
student in question. The range is from 1-99.
Each student’s score corresponds to a percentile relative to the distribution of other students’ scores
in the same grade, for a particular month. The percentage of scores at or below a particular value
defines scores’ percentiles. Students with score percentiles near 50 are at the average for the month
in which the assessment was taken. Lower percentiles indicate slower overall growth, while higher
values indicate accelerated overall growth relative to the nation at large.
For instance, assume that a third grader obtains a score of 800 when tested in May. From our data
we estimate that this particular score equals or exceeds that of 70% of all other third graders tested
nationwide in May. Therefore, this third grader’s percentile score is 70, or the 70th percentile. It is
to be expected that students’ score percentiles will vary somewhat across the school year. Yet, while
most students’ scale scores naturally rise over time, their positions within the national distribution –
and therefore their percentile score – are often quite stable.
Chapter 03 | Benchmarker

16
Grade Level Equivalent
Grade-level equivalents express students’ performance as being typical of some particular grade and
month of instruction.
The word “typical” in this context refers to the median or middle score (or 50th percentile).If a
student receives a grade equivalent of “7.2,” then this student’s score corresponds to that of an
average (median) seventh-grader after two months of instruction. Grade-Level Equivalents make
it immediately clear whether a student is ahead, behind, or average with respect to his or her test
performance.
Growth Score
Benchmarker generates a growth score after the second and third test administrations. The growth
score is simply the recent scale score subtracted by an earlier scale score. For example, the winter
growth score is determined by subtracting the fall scale score from the winter scale score. A student’s
growth for the entire school year is determined by subtracting the fall scale score from the spring scale
score.
Because these scores are based on an equal interval, vertical scale, Benchmarker growth scores
can be used to compare growth among students, or among groups of students, such as classes and
grades.
Chapter 03 | Benchmarker

17
Configuring Assessment Options
Benchmarker can be administered in one of two ways. The online Administration Panel can be con-
figured to give Screener and Benchmarker in one integrated assessment session, or as two separate
assessments. In the latter case, only the students identified as at-risk or borderline by Screener take
Benchmarker afterwards.
For those electing to administer Benchmarker as a separate assessment from Screener, there is an
additional option to have students take Benchmarker immediately after their screening (if they test
positively for risk), or on a subsequent day.
As with the Symphony Screener, there are three testing windows each year. The dates of these testing
windows are the same for Benchmarker as for Screener, and can be configured in the online Adminis-
tration Panel.
Chapter 03 | Benchmarker

18
IntroductionSymphony Math is an intervention program designed to help students develop a profound under-
standing of the most important mathematical concepts. Many students struggle to become proficient
in math because they do not have the opportunity to master foundational concepts with sufficient
depth. In an age when most curricula value covering a large number of topics, some students are
falling through the cracks. They need more time and more practice working with the big ideas of
mathematics in order to develop the proper foundation.
Symphony Math is an educational software program that provides students with the experience of
learning and thinking about the most important mathematical concepts. This experience provides
the necessary foundation for a successful future of math learning. Symphony Math helps students
achieve this solid mathematical foundation by implementing several key research-based pedagogic
strategies. These strategies are recommended by leading experts in the field of mathematics educa-
tion (see Research Base in the Appendix), and have improved student learning and understanding.
The Big Ideas of MathematicsThe conceptual sequence of Symphony Math consists of a tightly connected progression of the most
important mathematical ideas. These underlying “big ideas” are important because they provide the
foundation for later mathematical learning. The program helps students develop a profound under-
standing of the big ideas listed in this table.
symphony math intervention04
Chapter 04 | Intervention

19
Mathematical Topic Underlying Big Idea Stages
Number Quantity 1, 16
Addition and Subtraction Part-to-whole relations 2, 4, 6
Place Value Hierarchical groupings 3, 5
Multiplication and Division Repeated equal groupings 8, 13
Multi-digit Addition and Subtraction
Hierarchical groupings coordinated with part-to-whole relations 7, 9, 11
Fractions Repeated equal groupings coordinated with part-to-whole relations 12, 14, 15, 17
Symphony Math guides students through a carefully constructed sequence of these big ideas which
are broken down into smaller concepts and presented in a developmental sequence. It’s easier for
students to work through the big ideas in smaller parts, since it can be difficult to internalize them all
at once. Each concept provides the foundation for the subsequent concept, and later concepts are
built upon and coordinated with earlier concepts.
Symphony Math’s conceptual sequence provides an in-depth learning experience because it gradually
builds the complexity of problems to a more advanced level than students typically encounter. For
example, to help students develop a deep understanding of Quantity (or number sense), the program
guides students through the following sequence of concepts from Stage 1:
Concept Example Solution
Equal 3 = ? 3 = 3
Greater 8 > ? 8 > 2
Less 5 < ? 5 < 7
Between 4 < ? < 9 4 < 6 < 9
Missing comparison 2 ? 5 ? 7 2 < 5 < 7
Not equal 7 ≠ ? 7 ≠ 10
A student does not move on to the next concept in the sequence until she has mastered the current
concept. One concept follows logically from the previous concept. While a student is working on a new
concept she sees review concepts that help support her learning of the new concept. This process
helps the student connect new knowledge to previous knowledge.
Numbers represent relative quantities, or amounts. This is the fundamental idea that students
work on in Stage 1. Symphony Math challenges students to develop an internal number line so that
they can quickly and easily see numbers as a network of related quantities. Solving more complex
problems (e.g., 1 < ? < 6, solved three different ways) leads to a more robust understanding for the
student. Compare this to the more superficial understanding some students develop during elemen-
tary school, where numbers are just a sequence of memorized sounds and symbols. Counting is an
important skill. However, it is only the beginning of understanding the number system.
Chapter 04 | Intervention

20
Multiple Ways of KnowingIntegrated with the Symphony Math conceptual sequence are six distinct activity environments. These
activities provide multiple representations of each concept in the program.
Activity Purpose
Manipulatives Conceptually understand what the concept “looks like”
Manipulatives & Symbols Explicitly connect symbols to their visual representations
Symbols Understand the concept at the abstract level
Auditory Sentences Learn the formal language of mathematics
Story Problems Extend understanding to real life problem solving
Mastery Round Develop immediate recall of number relationships
The use of different activities accomplishes several goals. First, it introduces concepts at the concrete
(or visual) level. Students can see what the concept looks like, and this helps them develop a mental
model of its meaning. In stage two, Intro to Addition & Subtraction, students work with manipula-
tives to internalize the Parts-to-Whole big idea that underpins addition and subtraction. In this stage,
students encounter problems like the one below:
Five bar must be inserted in this area.
A three bar and a two bar are combined.
Students must find a number bar that is the same length as the 3 bar and the 2 bar combined. Later,
they will see a problem like the one below. The whole is on top and is represented by the yellow 5 bar.
One of the parts is below and is represented by the blue 4 bar. The student needs to find the length of
the missing part. In symbols, this problem would be represented as ? + 4 = 5
Chapter 04 | Intervention

21
The whole is five units long.
A part is missing. (One unit long.)
In this way students come to understand how to solve problems like 2 + 5 = ?
and 4 + ? = 9 using manipulatives. The process helps students understand the
Parts-to-Whole big idea and its different variations.
The use of a variety of activities also helps students make the connection
between symbols and the concepts that the symbols represent. At a superficial
level some students can memorize the counting sequence and basic number
facts without appreciating their meaning. A student may understand that 5 + 2 =
7 because 7 comes 2 numbers after 5. However, the student may not know what
5 + 2 = 7 looks like concretely, or may not know why it is also true that 2 + 5 = 7.
The Manipulatives & Symbols activity helps with this issue by explicitly challeng-
ing students to connect symbols with concrete representations. A student will be
given a number sentence such as 8 + 1 = ? and must construct the correspond-
ing visual representation. Or, they will be given the problem with number bars
and they must provide the corresponding symbols.
8 + 1 = 9 is given with number bars.
Student must construct the corresponding problem with symbols.
In this way, students explicitly connect symbols with visual representations and
manipulatives with symbolic representations. This is the bridge from the concrete
Chapter 04 | Intervention

22
(manipulatives) to the abstract (symbols) and helps students connect their intuitive understanding of
number relationships to the formal number system we use to represent them.
The third activity uses only symbols. Now that the student has demonstrated proficiency with the ma-
nipulatives in the first activity and the meaning of symbols in the second activity, she gains proficiency
with procedures in the the third activity. The Symbols activity presents problems with symbols, but the
integer bars will appear automatically if a student makes a mistake or asks for help.
The fourth activity emphasizes spoken language. Students hear the problem, then must construct it
with symbols and solve it. This activity helps students learn the formal language of mathematics and
connect it to the symbols and manipulatives from earlier activities.
The fifth activity challenges students with story problems. Students are presented with a written word
problem as shown below. Students must construct the corresponding number sentence and solve
it. If they need to, they can press a button and have the story problem read out loud, with each word
highlighted as it is read. This activity challenges students to extend their knowledge to real life prob-
lems. Story problems are traditionally quite hard for struggling math students. A student’s previous
in-depth work with manipulatives, symbols, and language helps provide the conceptual foundation
and experience they need to succeed.
Students can press this button to hear the story problem.
Solution is constructed here.
The sixth activity environment is the Mastery Round, shown on the next page. This is a fluency activity
that helps students develop immediate recall of number relationships. Students are presented with
number relationships problems with symbols or spoken language. They need to answer correctly
before the problem disappears to demonstrate mastery. Only concepts and number relationships
with which students have demonstrated proficiency in an untimed setting are presented during the
mastery round. This avoids the too-common problem of encouraging students to memorize what they
do not understand.
Chapter 04 | Intervention

23
Students need to solve the problem before the cube falls away from view.
Chapter 04 | Intervention

24
Learning Through Thinking and Making ConnectionsThe pedagogic style of Symphony Math emphasizes thinking, figuring out, and making connections.
The program is designed to be used as a complement to the classroom learning experience. Students
receive direct instruction and group learning in a classroom setting. The program provides the op-
portunity for individual practice at the developmental level of each student. The style of this practice
encourages independent thinking and problem solving, and this is accomplished through the use of
three important pedagogic strategies.
Instructive FeedbackSymphony Math encourages independent thinking by providing instructive feedback that reveals the
nature of each incorrect response. For example, if a student answers 3 + ? = 6 with a 2, the program
immediately shows that a 3 bar combined with a 2 bar is not the same length as a 6 bar.
The number bars automatically appear to illustrate that a 3 bar and a 2 bar are not the same length as a 6 bar.
The student solves this number sentence incorrectly.
Providing instructive feedback encourages students to deduce for themselves why an incorrect
answer is not accepted. This is preferred to saying something like “that’s not right, try again” because
that approach often leads to guessing and not understanding why the answer is not correct.
Using the Help ButtonAnother way that Symphony Math encourages learning through thinking is the use of the Help button.
The Help button provides scaffolding, which leads the student closer to the solution but does not give
the answer immediately. Additionally, the scaffolding provided by the Help button does not directly
explain the procedures for achieving the solution. Immediately providing the correct procedures or
solution undermines the thinking and understanding of the student and encourages her to depend on
the program for solutions instead of developing her own problem solving skills.
If a student is confronted with the problem 8 + 1 = ?, she can press the Help button to activate
scaffolding that will help her connect 8 + 1 with her existing knowledge of the concept and number
relationships. This maintains the emphasis on thinking and making connections. If she needs more
help, she can continue to press the Help button. The sequence of the help scaffolding for the problem
8 + 1 = ? is shown in the table below.
Chapter 04 | Intervention

25
Help Button Activation Help Provided for the Problem 8 + 1 = ?
1st Show a “near neighbor”: 7 + 1 = 8
2nd Show a second “near neighbor”: 9 + 1 = 10
3rd Show 8 + 1 using number bars
4th Show that the 9 bar is equal in length to the 8 and 1 bar
The Help button provides hints and scaffolding that challenge students to make inferences and con-
nect what they are learning to concepts they have already mastered. This helps guide the disposition
of the student toward problem solving and independent thinking, not copying or guessing.
In-Depth Problem SolvingA third strategy that Symphony Math uses to encourage independent thinking is the use of specially
designed problems that provoke thinking. For example, to master place value concepts students will
be asked to solve a series of problems designed to help understand the base ten system. Students
will combine numbers of different place values, such as “30 + 400 + 7 = ?”. They will also be asked
to create number sentences where the sum is provided but the addends are missing, such as
“? + ? + ? = 286”. Each addend must correspond to the ones, tens and hundreds place value
(e.g. 200 + 80 + 6 = 286). At the most difficult level, students need to provide three different solu-
tions to this type of problem.
Each stage in the program has specially designed problems that keep the focus on thinking and
understanding. Students are not specifically told how to solve problems such as ? + ? + ? = 431 or
? - ? = 3, but they logically deduce the solutions by connecting these problems to similar problems
that they have previously mastered.
Chapter 04 | Intervention
26
Dynamic Branching Allows Students to Learn at Their Own LevelSymphony Math works with each student at his or her developmental level. The “dynamic branching”
of the program and detailed progression of the scope and sequence allows students to work within
their developmental zones. An advanced student who has complete mastery of all of the program’s
concepts can complete the program in less than two hours. An intermediate student might move
through the program to stage eight in less than an hour, but then spend several weeks working on
stage eight because that is her specific area of need. A younger or struggling math student may only
progress to stage two and then spend the rest of the school year working on Stage 2 concepts. The
amount of time and practice that students need to understand mathematical concepts is not uniform.
Symphony Math allows students to spend the time they need mastering foundational concepts. In
addition, the program quickly moves students through the conceptual progression of the program to
identify their area of need. Once the area of need has been identified, the program slows the progress
until the necessary understanding has been achieved.
Dynamic branching not only assesses students’ understanding vertically through the hierarchy of
stages, but it also tracks students’ proficiency horizontally across the six different activity environ-
ments. In addition, Symphony Math tracks and branches students according to their mastery of
specific number relationships. For example, the program tracks whether a student understands what
1/6 of 12 is, or 2/3 of 9. The program systemically records which number relationships have been
mastered and which have not, and branches students accordingly. Another example is the number
relationships for multiplication and division. Not only does the program track basic multiplication
and division number relationships such as 2 x 3 and 8 ÷ 4, but it also records progress with number
relationships such as missing dividend (? ÷ 4 = 2), missing multiplicand (3 x ? =12), and missing
multiplier (? x 2 = 8).
This detailed level of data tracking allows Symphony Math to find a student’s area of need down to
the specific concept, representation, and number relationship. The branching responds in a way that
helps the student fill in these gaps in her learning while quickly moving through those areas that have
been mastered.
Chapter 04 | Intervention

27
Comprehensive ReportsWith each day of student use, Symphony Math provides teachers with detailed reports that inform
their classroom instruction. The program reports provide a big-picture look at where students are in
their overall mathematical development. Detailed reports inform teachers of students’ progress with
specific concepts and number relationships. The Symphony Dashboard alerts teachers to specific
issues that need to be addressed. For example, the Dashboard may alert a teacher about a student
who needs help with missing addends using symbols. Digging deeper into the reports might reveal
that the student is specifically having difficulty with 9 + ? = 16 and 5 + ? =13.
Chapter 04 | Intervention

28
Who Can Use Symphony Math?The rigorous application of cognitive development principles in Symphony Math make it a suitable in-
tervention program for a wide range of students. The program seeks to identify gaps in each student’s
mathematical understanding, and then present a series of problems designed to fill in those gaps.
Grades Category Objective Recommended Use
K - 2 Gifted Enhancement 15 minutes 2 times per week
1 - 4 On Grade Level Deepen understanding and support instruction 15-20 minutes 3 times per week
2 - 6+ Remediation Identify and fill in gaps in mathematical foundation 20 minutes 5 times per week
Gifted students in kindergarten through second grade may use Symphony Math to enhance their
knowledge and move ahead to where their ability and motivation takes them. Students performing
on grade level in grades one through four can use the program to deepen their understanding and to
support teachers’ classroom instruction. Struggling students in grades two through six (and beyond)
may use the program to identify gaps in their mathematical foundation and begin to fill them in. The
age neutral interface of Symphony Math makes it comfortable for a wide age range of students to
enjoy and benefit from the program.
Chapter 04 | Intervention

29
IntroductionSymphony Math is an intervention program designed to help students develop a profound under-
standing of the most important mathematical concepts. Symphony Math focuses on the big ideas of
mathematics — the foundational knowledge upon which all later math learning is based. The six “big
ideas” developed in Symphony Math include:
l Quantity
l Parts-to-Whole
l Hierarchical Groupings
l Repeated Equal Groupings
l Hierarchical Groupings with Parts-to-Whole
l Repeated Equal Groupings with Parts-to-Whole.
Each big idea consists of a network of related concepts which are sequenced throughout the seven-
teen stages of Symphony Math.
Another important component of the Symphony Math Scope & Sequence is the multiple representa-
tions of each concept. The program uses a mixture of manipulatives, symbols, language, story prob-
lems, and auditory and symbolic fluency to help students make connections between representations
and more fully understand each big idea. While this chapter lays out the sequence of stages and
concepts, it is important to remember that each concept utilizes multiple representations throughout
the program. See Chapter 1 for an overview of the different representations used in Symphony Math.
intervention scope and sequence05
Chapter 05 | Scope and Sequence

30
The Seventeen Stages of Symphony Math
# Stage Name Example Underlying Big Idea
1 Number Sense 4 < ? < 7 Quantity
2 Introduction to Addition & Subtraction 2 + 1 = ? Parts-to-Whole
3 Ones, Tens & Hundreds 100 + 100 + 100 = ? Hierarchical Groupings
4 Intermediate Addition & Subtraction 5 + 6 = ? Parts-to-Whole
5 Two-Digit & Three-Digit Numbers 300 + 40 + 1 = ? Hierarchical Groupings
6 Advanced Addition & Subtraction 9 + 8 = ? Parts-to-Whole
7 Adding & Subtracting One-Digit Numbers
8 + 7 = ? (vertical format)
Hierarchical Groupings with Parts-to-Whole
8 Introduction to Multiplication & Division 2 x 1 = ? Repeated Equal Groupings
9 Adding & Subtracting Two-Digit Numbers 56 + 75 = ? Hierarchical Groupings
with Parts-to-Whole
10 Three-Part Addition & Subtraction 8 + 5+ 2 = ? Parts-to-Whole
11 Adding & Subtracting Three-Digit Numbers 342 + 237 = ? Hierarchical Groupings
with Parts-to-Whole
12 Introduction to Fractions 1/2 of 2 = ? Repeated Equal Groupings with Parts-to-Whole.
13 Intermediate Multiplication & Division 3 x 9 = ? Repeated Equal Groupings
14 Unit Fractions 1/2 of 4 = ? Repeated Equal Groupings with Parts-to-Whole
15 Non-Unit Fractions 2/3 of 9 = ? Repeated Equal Groupings with Parts-to-Whole
16 Not Greater & Not Less 4 >/ ? Quantity
17 Improper Fractions 3/2 of 4 = ? Repeated Equal Groupings with Parts-to-Whole
Big Idea #1: Quantity
Quantity is the big idea that describes amounts, or sizes. It is a fundamental idea that refers to
quantitative properties. The different types of quantitative properties include the size of things
(magnitude), such as weight, height, or length, and the number of things (multitude), such as the
amount of objects.
Quantity is a big idea of mathematics because so many mathematical concepts are dependent upon
it. Take for example the five mathematical content strands from the National Council of Teachers
of Mathematics. At the heart of each of these strands is the big idea of Quantity. Geometry is the
quantity of space. Number is the quantity of things. Measurement is the quantity of dimensions.
Algebra is the relationship of quantities. Statistics is the representation and analysis of quantities.
Chapter 05 | Scope and Sequence

31
Why Students Need to Understand Quantity
Quantity means that numbers represent amounts. If students do not understand Quantity, their
understanding of other areas will be undermined. Understanding Quantity helps students develop
number conceptualization. The sequence of numbers is determined by each number’s magnitude, a
concept that not all children understand.
Some students learn the number system as they do the alphabet. They memorize the sequence of
sounds and symbols. However, unlike the alphabet, numbers represent concepts. The sequence of
counting numbers represents an increase in size with each number. Some students can learn to solve
simple math problems without understanding that a number is a concept that represents a quantity. A
student may know that 9 comes after 8 but not know that 9 represents a larger quantity than 8.
It is possible for a student to navigate through an elementary math curriculum without understanding
the concept of Quantity. Students apply strategies that produce correct answers without having to pay
attention to the fact that the numbers in the equations represent real amounts. Students can rely on
counting to produce correct answers without understanding the meaning. However, as the curriculum
becomes more complex this superficial understanding of Quantity may undermine their progress.
How Symphony Math Helps Students Understand Quantity
Stage 1, Number Sense, is designed to help students move from counting to understanding that
numbers represent quantities. If a student already has this understanding she will move quickly
through the stage. If a student does not understand the big idea of quantity, she will spend time in
Stage 1 developing this understanding.
Stage 1 begins with the concepts of same, taller, and shorter. Students work with number bars to
identify which ones have the same height, are taller, or are shorter. Most students come to school
with this intuitive understanding of relative heights using concrete objects. In Stage 1 they learn to
extend this understanding to symbols. They connect the idea that an object can be taller or shorter
than another object to the idea that a symbol can represent a number than can be greater or smaller
than another number.
Chapter 05 | Scope and Sequence

32
At higher levels of Stage 1 students must find number bars or numerals that are between two other
bars or numerals. For example, students need to find a number that is greater than 3 and less than
7. These kinds of problems help students develop an internal number line and an appreciation for the
fact that numbers represent quantities.
Big Idea #2: Parts-To-Whole
Parts-to-Whole is the big idea that underlies addition and subtraction. The idea is that there is a whole
that can be partitioned into a certain number of parts. If we combine the parts, they equal the whole.
If the whole is 8, the parts could be 6 and 2. Combine the two parts (6 + 2), they equal the whole (8).
We can change the order of the parts (2 + 6) and they still equal the whole. We can also find several
different ways of making a whole (8) out of two parts, such as 7 + 1 or 3 + 5.
A part can be taken away form the whole leaving another part left over. The whole is 8, we take away
5, 3 is left over. A student that has developed in-depth understanding of the Parts-to-Whole big idea
can see addition and subtraction as different ways of forming number relationships, often called “fact
families.”
l 5 + 3 = 8
l 3 + 5 = 8
l 8 - 3 = 5
l 8 - 5 = 3
Chapter 05 | Scope and Sequence

33
Why Students Need to Understand Parts-to-Whole
Students need to understand Parts-to-Whole in order to move beyond numeracy as counting to
understand numbers as an inter-related system. An understanding of Parts-to-Whole leads to a better
understanding of addition and subtraction, success with story problems and provides the necessary
foundation for understanding later mathematical concepts.
It is possible to solve simple addition and subtraction problems by using the counting strategy in place
of understanding the big idea of Parts-to-Whole. For example, to solve 6 + 3, the student counts to six,
and then counts three more, often ticking off the last 3 on her fingers, arriving at 9. You ask the same
student 9 - 3, she starts at nine and counts backwards three numbers to arrive at 6.
While this student may answer with correct answers, this does not mean she necessarily understands
Parts-to-Whole. When faced with the following story problem:
“Joe has $4. Sam and Joe have $7 together. How many dollars does Sam have?”
The student who does not have an understanding of Parts-to-Whole may look for a keyword and then
count to find the solution. The keyword in this example is “together”, which the student has been told
means to count on. So the student starts with 7, counts on 4 more and arrives at 11 as an incorrect
answer.
The student who understands Parts-to-Whole approaches this problem in a different way. For 6 +
3, the student can mentally picture 6 combined with 3 as being equal to 9. When asked what 9 - 3
equals she knows that since 6 + 3 = 9, therefore 9 - 3 must equal 6. For the word problem example
she identifies 7 as the whole and 4 as one of the two parts, leading her to conclude that 3 is the
missing part.
The Parts-to-Whole idea is also foundational for place value, multiplication and division as well as frac-
tions. Students who do not understand Parts-to-Whole and who can only solve addition and subtrac-
tion with counting may not have the conceptual foundation to understand these later concepts.
How Symphony Math Helps Students Understand Parts-to-Whole
Stages 2, 4, 6, and 10 emphasize the understanding of the big idea of Parts-to-Whole. This is the key
idea that students need to internalize to understand addition and subtraction.
Chapter 05 | Scope and Sequence

34
In Stage 2 students are introduced to the Parts-to-Whole big idea with simple addition. Using number
bars they see that two small bars combined to equal the length of a longer bar. They then work to
understand missing parts. After working on missing part, subtraction is introduced. A long bar is
presented, the students needs to determine which bar would be left over if a certain bar was taken
away form the whole.l 2 + 1 = ?l 2 + ? = 3l 3 - 1 = ?
Stages 4 and 6 introduce more difficult number relationships as well as two missing parts and a miss-
ing whole and a missing part.l 10 - ? = ?l ? + ? = 10
Stage 10 introduces three-part and four-part problems.l 2 + 3 + ? = 10l 2 + 4 = ? + 3
As students work their way through stages 2, 4, 6 and 10 they develop a deep understanding of the
Parts-to-Whole idea. This leads to a strong understanding of addition and subtraction and provides
the foundation for later concepts such as multiplication, division, place value and fractions.
Chapter 05 | Scope and Sequence

35
Big Idea #3: Hierarchical Groupings
Hierarchical Groupings is the idea that amounts can be grouped into a system of sets and subsets.
We can count 11 objects and group them into 1 ten and 1 ones, or we can call them 11 ones. One
hundred and seventy nine represents 1 hundred, 7 tens, and 9 ones.
In order to progress mathematically students need to be able to perceive the place value structure of
a number -- they need to be able to understand what larger numbers mean. Without understanding
this structure 179 is just the number that comes after 178 and before 180. While this may be cor-
rect, on its own it does not represent a sufficient understanding.
There are of course other examples of hierarchical groupings, further illustrating why this is an
important big idea. Time, for example, is organized in terms of seconds, minutes, hours, days and
so on. Sixty seconds equals one minute, 60 minutes equals one hour, and 24 hours equals 1 day.
Time is a particularly complex system for young students to master because it involves the base ten
number system as well as the unique hierarchical groupings of the temporal system. Furthermore,
the grouping amounts for each step of the hierarchy may be different -- 60 minutes equals 1 hour but
60 hours does not equal 1 day.
Why Students Need to Understand Hierarchical Groupings
A student who does not have a strong understanding of Hierarchical Groupings may have difficulty
answering the question, “Which number is larger, 79 or 81?”. She might think 79 is larger because
the 7 and the 9 combined make 16 while the 8 and the 1 combined only make 9. This indicates a lack
of understanding that the 7 in 79 equals 7 tens and the 8 in 81 is the same as 8 tens. The under-
standing of how these numbers are composed in the base-ten place-value system is foundational to
success with multi-digit addition and subtraction where students must compose larger numbers in
addition and decompose them for subtraction.
How Symphony Math Helps Students Understand Hierarchical Groupings
Stages 3 and 5 are designed to help students understand Hierarchical Groupings and prepare them
for multi-digit addition and subtraction. The problems in these stages challenge students to compose
and decompose numbers of progressing complexity. In Stage 3 students are asked to take apart and
build numbers in the ones’ place column. For example, 1 + 1 + 1 + 1 = ?.
Understanding of the tens place value is developed by challenging students to solve problems where
they have to compose and decompose numbers such as 10, 20, and 30. For example,
10 + 10 + 10 + 10 = ? and ? + 40 = 100. After successfully developing an understanding of tens,
students progress to the hundreds. For example, 100 + 100 + 100 = ? and ? + 400 = 1000.
Chapter 05 | Scope and Sequence

36
At this point, students have a basic understanding of what 1, 10, 100, and 1000 mean. In Stage 5
students learn how to integrate the ones, tens, and hundreds place values. For example, 50 + 4 = ?.
Some students might answer 9. This is a misapplication of the addition they have learned with the
ones’ place value; they add the 5 from 50 with the 4, not understanding that the 5 in 50 represents
five tens. Once students become proficient at integrating two-digit numbers, they progress to three-
digit numbers.
There are a number of pedagogical strategies in Stages 3 and 5 that are designed to push students’
understanding to a deeper level and help them to make connections between concepts. After solving
a problem such as 300 + 500 = ?, they will be asked 30 + 50 = ? and then 3 + 5 = ?. This is designed
to help students connect the larger place-value numbers with their mastery of smaller number
relationships. Students will also encounter problems such as 971 > ? > 799, in order to consolidate
their emerging knowledge of place value and to explicitly connect it to the concepts they learned in
the Number Sense stage, where they solved problems such as 9 > ? > 7.
Big Idea #4: Hierarchical Groupings with Parts-to-Whole
As its name implies, Hierarchical Groupings with Parts-to-Whole is a complex idea -- one that involves
the coordination of two earlier big ideas. It also illustrates the hierarchal nature of mathematics and
how a poor foundation is likely to interfere with the learning of later concepts.
For this big idea students must coordinate their knowledge of Hierarchal Groupings and Parts-to-
Whole. Let’s look at the following problem:
268
+ 453 _____
Chapter 05 | Scope and Sequence

37
Two hundred sixty eight is one part. The other part is 453. Combined they form the whole. Conceptu-
ally the student needs to understand she is looking for a missing whole. Procedurally, she must un-
derstand that when she combines the 8 and the 3 this yields a 10 and a 1. The ten will be combined
with the other tens (6 and 5).
In this way the student is working with both the Hierarchal Groupings idea and the Parts-to-Whole
idea. Not only is solving multi-digit addition and subtraction problems procedurally complex, but it is
also conceptually complex relative to the preceding concepts in the curriculum. It is one of the first
periods in mathematical learning where many students begin to apply complex procedures they do
not fully understand.
Why Students Need to Understand Hierarchical Groupings with Parts-to-Whole
One of the most common problems for students who do not understand Hierarchal Groupings with
Parts-to-Whole is their tendency to make consistent errors in their problem solving. They attempt to
follow the procedures they have been taught to solve multi-digit addition and subtraction problems.
But these procedures are numerous and complex. Without an in-depth understanding of the two
underlying big ideas students tend to make errors as it is hard to remember the correct sequence of
steps.
For example, given the following problem:
1205
- 302 _____
The student accurately takes 2 from 5 to get 3 for the ones column and correctly places a 0 in the
tens column. In the hundreds column the student places a 1 from taking the 2 away from the 3. The
student forgot that the bottom number is to be taken away from the top number, or maybe took the 2
from the 3 because it is easier and she wasn’t sure how else to subtract the 3 from the 2.
1205
- 302 _____ 1103
The student who has an in-depth understanding of Parts-to-Whole is unlikely to commit this mistake
because she sees the 2 as part of the whole and the 3 as the part that is to be subtracted. Further-
more, an understanding of hierarchical groupings would lead the student to look at this part of the
problem as 12-3 or 12 hundreds minus 3 hundreds.
Finally, the student who is thinking of these numerals as amounts, or concrete values would intuitively
recognize that 1200 minus 300 can not equal 1100, just like 12 minus 3 can not equal 11.
Chapter 05 | Scope and Sequence

38
The student who has not developed an in-depth understanding of these big ideas is likely to rely only
on the step-by-step application of procedures without the supporting understanding of what these
procedures mean and why they work. When she produces a nonsensical answer the mistake is not
apparent because she has stopped looking at the numbers as representing meaningful quantities.
She is simply manipulating symbols as best she can according to the procedure.
How Symphony Math Helps Students Understand Hierarchical Groupings with Parts-to-Whole
Stages 7, 9, and 11 consolidate the ideas developed in the previous stages and extends them into
the process of adding and subtracting large numbers that require regrouping. This process is more
complex both in terms of the necessary conceptual understanding and the number of steps. The
procedural and conceptual complexity of multi-digit addition & subtraction make it one of the biggest
barriers to mathematical learning for some children. The purpose of these stages in Symphony Math
is to help students become accurate and efficient with the procedures of multi-digit addition and
subtraction, as well as to understand its underlying big idea.
Stages 7, 9 and 11 use the traditional algorithm of solving from right to left, starting with the ones col-
umn. There are other methods to solve these types of problems, but this is the most widely accepted
and is effective with all types of problems. Students can also be encouraged to learn alternative solu-
tions in their classroom, but since not all classrooms embrace the teaching of alternative algorithms,
Symphony Math does not introduce them. There is flexibility within the program to use alternate
solution strategies, but their use is not required.
The common critique of the traditional algorithm is that it is not intuitive and some students employ
it in a rote manner without grasping its meaning. Symphony Math addresses this weakness by
Chapter 05 | Scope and Sequence

39
introducing the traditional algorithm through all five Symphony Math representations: Manipula-
tives, Manipulatives and Symbols, Symbols, Auditory Statements, and Story Problems. The process
of decomposing and recomposing larger numbers can be complicated, but through the use of the
manipulatives students intuitively grasp the logic behind the algorithm. Students can see why they
must bring the 10 over from the ones to the tens column in addition and why they must break down
a hundred to bring over a 10 to the tens column in subtraction. Stage 7 begins with addition and
subtraction problems that do not require regrouping and introduces students to the vertical format of
addition and subtraction.
Addition with regrouping is introduced with simple one-digit addends that students will have previously
mastered in the horizontal format in Stages 4 and 6. Familiarity with these number relationships
helps students develop an understanding of adding and subtracting in the vertical format. In Stage 9
students progress to adding two-digit numbers with regrouping. Initially, only one of the two columns
involves regrouping. At the end of the level, both columns involve regrouping. In Stage 11 three-digit
addition follows a similar pattern where students are introduced to the level with only one column
requiring regrouping. With correct responses, students progress to problems that require regrouping
in two columns and eventually in three columns. Subtracting large numbers with regrouping follows a
similar progression.
Big Idea #5: Repeated Equal Groupings
The Repeated Equal Groupings big idea builds upon the Parts-to-Whole idea. With Repeated Equal
Groupings, the whole is not only broken into parts, but broken into a specific number of parts and
each part is of equal size. For example, there are 30 students in the class (the whole). The teacher
divides the class into groups of 6 (the equal groups). These equal groups are repeated 5 times to
equal the whole.
Repeated equal groupings is the big idea that underlies multiplication and division. Multiplication
consists of taking a part (the multiplicand) and repeating it a certain number of times (the multiplier)
to equal the whole (the product). Division consists of a whole (the dividend) that is partitioned into a
certain number of equal groups (the divisor) that is equal to the size of the equal parts (the quotient).
Why Students Need to Understand Equal Groupings
It is possible for students to memorize multiplication facts without understanding what they mean.
Students can also use skip counting to correctly solve multiplication problems without appreciating
the significance of how they arrived at the correct answer. In addition to being able to immediately
recall multiplication and division facts, students also need to be able to understand what these opera-
tions mean.
Students who understand equal groupings have a better chance of memorizing multiplication and
division number relationships because they have a conceptual basis to support their learning. For
example, they are more likely to see the connections between:
Chapter 05 | Scope and Sequence

40
l 7 x 4 = 28l 4 x 7 = 28l 28 ÷ 4 = 7l 28 ÷ 7 = 4
In solving story problems, students who understand equal groupings will be better able to identify how
to set up the number sentence to correspond to the story problem.
Equal groupings is also fundamental to fractions. Students who are only relying on memorized facts
and skip counting strategies may have difficulty understanding the meaning of fractions and how they
build upon multiplication and division.
How Symphony Math helps Students Understand Repeated Equal Groupings
Stages 8 and 13 develop an understanding of grouping and partitioning by building upon the Parts-to-
Whole concepts established in Stages 2, 4, and 6. They reinforce the concept of repeated groupings
-- that multiplication represents repeated addition and that division represents repeated subtraction.
Stages 8 and 13 help students develop their conceptual understanding of what these operations
mean and then help students learn the number relationships through systematic practice and evalua-
tion.
Stages 8 and 13 address number relationships with products and dividends up to thirty. This ap-
proach uses the repeated addition model of multiplication and the repeated subtraction model of
division. This helps students understand the connection between addition and multiplication and
between subtraction and division.
Chapter 05 | Scope and Sequence

41
Big Idea #6: Repeated Equal Groupings with Parts-to-Whole
The big idea of Repeated Equal Groupings with Parts-to-Whole is the most complex of the big ideas
addressed so far. Similar to Repeated Equal Groupings this big idea involves repeating an equal sized
group, or partitioning an amount into equal groups. It also involves a ratio of parts to the whole. Not
only do students have to keep track of the whole and its equal groups as with multiplication and divi-
sion, but they also have to be mindful of the number of parts relative to the whole.
For example, with multiplication and division we need to work with the total, the size of the parts and
the number of parts. There are 30 students in the class (the whole equals 30), the teacher divides
the class into 5 groups (the number of parts equals 5), there are six students in each group (the size
of the part equals 6). This leads us to 30 divided by 5 equals 6.
Let’s take that same Equal Groupings example and add the Parts-to-Whole component. What if the
teacher said that 1/5 of the of class received an A on the last math quiz. How can we determine how
many students received an A? The fraction one-fifth is a parts-to-whole representation. It means one
part out of five parts. To determine how many students is equal to 1/5 of 30 we can first use Equal
Groupings. Five equal groups of 30 means that there are 6 students in each group. Therefore, 1/5 of
30 equals 6.
It is for this reason that an in-depth understanding of Repeated Equal Groupings with Parts-to-Whole
is fundamental to understanding fractions. Students need to understand the big idea of Parts-to-
Whole developed with addition and subtraction as well as the big idea of Repeated Equal Group-
ings developed with multiplication and division. These two big ideas coordinated together gives us
Repeated Equal Groupings with Parts-to-Whole, the foundational idea for fractions. This perspective
also helps us understand why fractions can be so difficult for students. Not only do they need to have
mastery of the proceeding big ideas, but they need to coordinate them together.
Why Students Need to Understand Equal Groupings Coordinated with Parts-to-Whole
Because of the complexity of fractions, and other related concepts such as ratios, decimals and
percents, students need to understand the coordination of Equal Groupings with Parts-to-Whole.
An understanding of this big idea will help students better navigate the many counter-intuitive and
confusing aspects of fractions.
Fractions are difficult for students to learn not only because of its conceptual complexity but also
because many of its features appear contradictory to what students have learned previously. For
example, the concept of equivalence in fractions indicates that two halves equal one whole, and four
quarters equal two halves, and so on. Previously students have learned that numbers indicate differ-
ent amounts. They learned that 2 does not equal 1. But with fractions 2/2 does equal 1.
Equally confusing is the fact that fractions with the same numerals can equal different amounts. A
student might expect that 1/2 always equals 1/2. But the student must consider 1/2 of what? One-
half of $100 does not equal 1/2 of $50.
Chapter 05 | Scope and Sequence

42
Students may also find the names of fractions to be confusing. Previously students have understood
later numbers in the counting sequence to represent larger quantities. Twelve is greater than 2, for
example. However, with fractions 1/12 is not greater than 1/2.
When some students are confronted with the complexity of fractions and they do not have sufficient
mastery of the necessary big ideas they may resort to memorized strategies that lead to correct
answers. They learn rules like “find the common denominator, then add.” Or, “flip it and multiply.”
They might remind themselves that “the bigger the denominator the smaller the fraction.” While these
memorized strategies may lead to correct answers, on their own they do not lead to a deep under-
standing of fractions.
How Symphony Math Helps Students Understand Equal Groupings with Parts-to-Whole
The earlier stages of Symphony Math systematically lay the the foundation to understand Equal
Groupings with Parts-to-Whole. Stages 12, 14, 15 and 17 build on this foundation to help students
understand Equal Groupings with Parts-to-Whole. There are four concepts that comprise the Equal
Groupings with Parts-to-Whole big idea.
l The whole is divided.
l There are a specific number of parts.
l The parts are of equal size.
l The parts equal the whole.
Symphony Math begins fractions problems with visual models to help students see these four
concepts. The visual models illustrate the properties of these four concepts and become a visual
language for understanding Equal Groupings with Parts-to-Whole. With every problem students solve
the visual model reminds them of the four concepts of Equal Groupings with Parts-to-Whole. If they
make a mistake they will see that the number of parts are too many or not enough, or that the size of
the parts does not equal the whole, or that the parts are not of equal size.
Chapter 05 | Scope and Sequence

43
Stage 12 introduces students to fractions using only unit fractions where the whole is the same
number as the denominator. For example, students are asked to find 1/4 of 4 or 1/2 of 2. In stage
14 students continue to work with unit fractions but here the denominator can be a different number
than the whole. For example, find 1/4 of 8, or 1/6 of 12. In Stage 15 students find problems with
non-unit fractions, such as find 2/3 of 9. Finally, in Stage 17, students must solve improper fractions,
such as 3/2 of 4.
For each of these stages students are challenged to find missing parts (e.g. 1/4 of 4 = ?), missing
wholes (e.g. 1/4 of ? = 1), and missing relationships (e.g. ?/? of 4 = 1). By solving these problems
from the perspective of missing parts, missing wholes, and missing relationships students come to a
better understanding of the Equal Groupings with Parts-to-Whole big idea.
Chapter 05 | Scope and Sequence

44
Introduction
Symphony Math is an Web-enabled application. The student software program is installed on your
schools’ file server or on each workstation. You will use a web browser to manage student accounts
and review reports. Data from student use of the software program is stored and maintained on a se-
cure server at Symphony Learning. All transactions during use of Symphony Math use SSL encryption
to ensure the best available privacy of student records. Each workstation requires an active Internet
connection (28 kbps or better per workstation) in order to run the program software. Symphony Math
is not recommended for sites that do not have reliable Internet access.
System Requirements for the Symphony Administration Panel
Mac Windows
OS X version 10.2 + Windows 2000, XP, Vista
Safari 2+, Firefox 2+ Internet Explorer 7+, Firefox 2+
Active Internet connection (28 kbps or better) Active Internet connection (28 kbps or better)
setting up accounts and classes06
Chapter 06 | Setting Up Accounts and Classes

45
Configuring the Administration PanelSymphony Math is a Web-enabled program and all student and class data is stored online. The
program is installed on each workstation or on the school server, and student data is transmitted over
the internet to the Symphony Server. For this reason, you can add students and classes before you
install the program. All class and student data is created and modified via an online administration
panel using a Web browser. To login, you must enter your site ID, Username and Password.
If you have not received a Symphony Math Welcome Email, contact Symphony Support at
800.234.3030 or email [email protected].
Logging in to the Symphony Math Administration Panel
To access your administration panel:1 Open your web browser and go to the Symphony Math website: www.symphonymath.com.
2 Click School Login.
3 Enter your School Account Number, your Username, and your Password.
4 Click Login.
School Login Button. Click here to access the administration panel.
Symphony Dashboard
Once you have logged in you will see your Symphony Dashboard. If your students have not used Sym-
phony Math yet your Dashboard will not show any information. Once your students begin using the
program you can consult your Dashboard on a regular basis for important information on the progress
and needs of your students.
Chapter 06 | Setting Up Accounts and Classes

46Chapter 06 | Setting Up Accounts and Classes
Creating Student Accounts and Your Class
To create student accounts:1 Click the Students tab from the online Administration Panel.
2 Click Add Student.
3 Enter the student information. Only the first name, username and password fields are required.
4 Click Save Changes.
5 You will be returned to the list of student names where you can see the new student ac-count.
Customize Settings for the Symphony Math
Intervention.
Set Availablility of Screener and Benchmarker tools.
Enter student information in these fields. Fields* are required.

47
To change the program narration language setting:
l When creating a new student, click the Narration pulldown to choose another language.
l Click on the name of an existing student to see the Student Settings. Click the Narration pulldown to change the language setting.
To change the session time limit:
l Click on the name of an existing student to see the Advanced Settings, then enter your desired time limit in the Session Time Limit box. If you do not want a time limit on your students’ sessions select the No Time Limit radio button.
To change Screener Availability:
l Choose Active to make Screener active for this student. Screener will be given the first that the student logs in after the beginning of each of the fall, winter, and spring testing windows.
l Choose Inactive to disable the Screener for this student. No testing will be given..
To change Mastery Round Timing:
l Click on Add to time limit of each number fact. Type a number between 1 and 99 seconds. When students are in the Mastery Round, this number of seconds will be added to the existing threshold for mastery. For example, if 5 seconds are allowed for a number fact, and 10 seconds are added in this setting, then the student will have 15 seconds to answer the number fact correctly in order for it to be judged as Mastered.
To change Benchmarker Availability:
l Choose Active to make Benchmarker active for this student. The Benchmarker will be given the first that the student logs in after the beginning of each of the fall, winter, and spring testing windows.
l Choose Active only if At-Risk or Borderline to give Benchmarker to this student only if they are judged At-Risk or Borderline by Screener during the current testing window.
l Choose Inactive to disable Benchmarker for this student. No testing will be given.
To change Benchmarker Administration settings:
l When Integrated with Screener to give the Benchmarker and Screener during the same administration for this student. This can save time, and student’s Benchmarker results will be used for both the Screener and Benchmarker reports.
l Click Next login after Screener to administer the Screener and Benchmarker as separate test administrations during the current testing window.
To modify which Stages are available:
l When creating a new student, select the These Stages radio button under the Stages Available to Student Advanced Setting. Select the stages you want this student to see in Symphony Math.
Chapter 06 | Setting Up Accounts and Classes

48
!
l Click on the name of an existing student to see the Advanced Settings, then select the These Stages radio button under the Stages Available to Student. Select the stages you want this student to see in Symphony Math.
Do not turn off early stages for new studentsAll students should start at the beginning of the program, Stage 1, and work their way up to their level of challenge. Starting at the beginning of the program allows new students to learn the conventions of the program and ensures that they have the necessary mathematical foundation for the later stages.
To create your class:
1 Click the Class tab from the online Administration Panel.
2 Click Add Class.
3 Enter the class name.
4 Select a teacher.
5 Click Save Changes.
6 You will be returned to the list of class names where you can see the new class account.
To enroll your students in your class:
1 Click the Class tab from the online Administration Panel.
2 Click on the name of the class you in which want to enroll your students.
3 Select student names to add to the class.
4 Click Add.
5 Click Save Changes.
Enter name of the class you are creating.
Select the teacher for this class.
Select a student name to add to the class roster. Command click to select mul-tiple names.
Using the Import Tab to Create Student Accounts and Classes
Chapter 06 | Setting Up Accounts and Classes
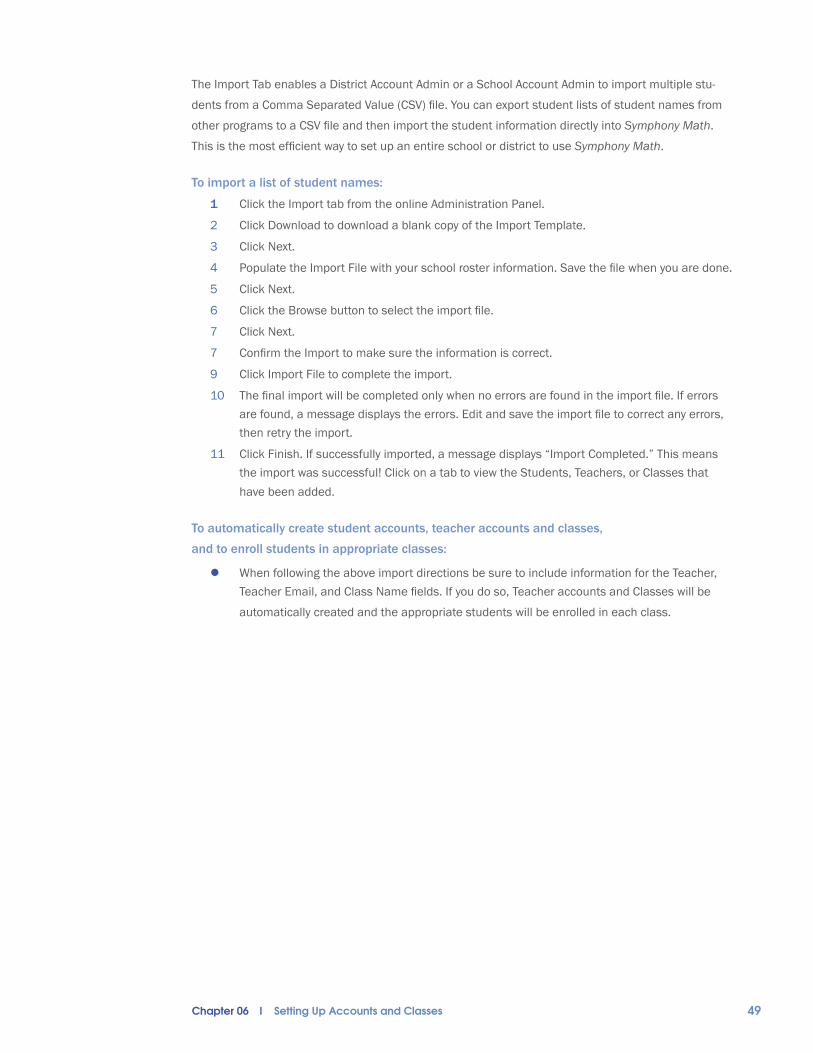
49
The Import Tab enables a District Account Admin or a School Account Admin to import multiple stu-
dents from a Comma Separated Value (CSV) file. You can export student lists of student names from
other programs to a CSV file and then import the student information directly into Symphony Math.
This is the most efficient way to set up an entire school or district to use Symphony Math.
To import a list of student names:
1 Click the Import tab from the online Administration Panel.
2 Click Download to download a blank copy of the Import Template.
3 Click Next.
4 Populate the Import File with your school roster information. Save the file when you are done.
5 Click Next.
6 Click the Browse button to select the import file.
7 Click Next.
7 Confirm the Import to make sure the information is correct.
9 Click Import File to complete the import.
10 The final import will be completed only when no errors are found in the import file. If errors are found, a message displays the errors. Edit and save the import file to correct any errors, then retry the import.
11 Click Finish. If successfully imported, a message displays “Import Completed.” This means the import was successful! Click on a tab to view the Students, Teachers, or Classes that have been added.
To automatically create student accounts, teacher accounts and classes, and to enroll students in appropriate classes:
l When following the above import directions be sure to include information for the Teacher, Teacher Email, and Class Name fields. If you do so, Teacher accounts and Classes will be
automatically created and the appropriate students will be enrolled in each class.
Chapter 06 | Setting Up Accounts and Classes

50
Student Data Import Formats
Header Data Type
Max Length Format Required? Comments
Account # Number 5 Numeric Yes Same Account # that is used to login to Administrative Panel
First Name String 32 Character Yes
Last Name String 32 Character No
MI String 1 Character No
Username String 64 Character or Numeric
• Must be unique for all students
• Using StudentID from Student Management System is recommended
Password String 32 Character or Numeric Yes • Can be the same for
multiple students
Grade String 2 Character or Numeric Yes PK, K, or 1 through 13
DOB Birth Date 10 mm/dd/yyyy No
Gender String 1 Character No See Table 2 for codes
Race String 1 Character No See Table 1 for codes
Language String 3 Character No See Table 3 for codes
Characteristics String 256 Characters NoSee Table 4 for codes - sepa-rate each code with a hyphen, e.g. “ESL-ADA”
Table 1: Ethnicity / Race
Code Ethnicity
I American Indian or Alaska Native
A Asian or Pacific Islander
B Black or African American
H Hispanic or Latino
C White
None Specified (blank)
Chapter 06 | Setting Up Accounts and Classes

51
Table 2: Gender
Code Gender
M Male
F Female
U Unassigned
Table 3: Language
Code Ethnicity
ARA Arabic
CAN Chinese: Cantonese
MND Chinese: Mandarin
CHI Chinese: Unspecified
HMG Hmong
JPN Japanese
CAM Khmer
KOR Korean
POR Portuguese
RUS Russian
SCC Serbo-Croatian
SPA Spanish
ENG English
FRE French
GER German
GUJ Gujarti
CRP Haitian Creole
LAO Lao
MAY Malay
NAV Navajo
OTH Other
POL Polish
TAG Tagalong or Filipino
URD Urdu
VIE Vietnamese
Chapter 06 | Setting Up Accounts and Classes

52
Table 4: Student Characteristics
Code Characteristic
ADA American with Disabilities (ADA)
AR At-Risk Students
BIL Bilingual Education
ESL English as a Second Language (ESL)
FL Free Lunch
GT Gifted/Talented
LD Learning Disabled
LEP Limited English Proficiency (LEP)
MG Migrant
NA Non-Resident Alien
PD Physically Disabled
RL Reduced-Price Lunch Program
SE Special Education
T1 Title I
CUS1 Custom Field 1
CUS2 Custom Field 2
CUS3 Custom Field 3
CUS4 Custom Field 4
Chapter 06 | Setting Up Accounts and Classes

53
IntroductionThe Symphony Math application must be installed on each workstation or on the school file server.
During the installation process you will enter the school account number, username, and password
which will enable the application to connect to the Symphony server over the internet. This allows the
progress of your students to be saved on the Symphony server and reported back to you through the
Symphony Administration Panel that you configured in the previous chapter.
The benefits of this hybrid system allow your students to use a rich, three dimensional graphical in-
terface with supporting sound and narration through the Symphony Math application that resides on
each workstation or the school server. You are able to access student reports and configure student
accounts from the convenience of any Web browser with an active internet connection. Because the
Symphony Math application is installed locally there is no need to transmit sound and graphic files
over the internet, which otherwise could slow down your school’s network performance.
System Requirements
Mac Windows
OS X version 10.2 + Windows 2000, XP, Vista, Windows 7
256 MB RAM 256 MB RAM
16 MB Video acceleration 16 MB Video acceleration
35 MB free hard drive space 35 MB free hard drive space
Active Internet Connection* Active Internet Connection*
Web Browser: Web Browser:
Safari 2+ Internet Explorer 7+
Firefox 2+ Firefox 2+
Flash Plugin version 9.0 or greater Flash Plugin version 9.0 or greater
installing symphony math intervention07
Chapter 07 | Installing Symphony Math
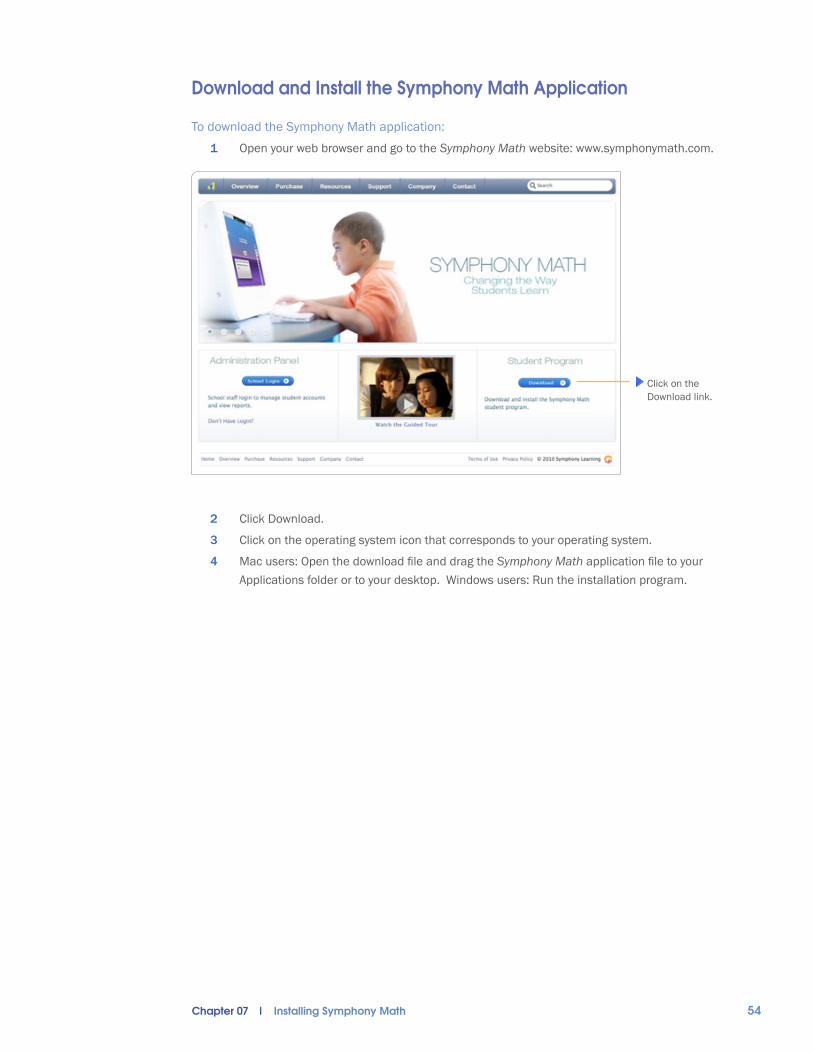
54
Download and Install the Symphony Math Application
To download the Symphony Math application:1 Open your web browser and go to the Symphony Math website: www.symphonymath.com.
Click on the Download link.
2 Click Download.
3 Click on the operating system icon that corresponds to your operating system.
4 Mac users: Open the download file and drag the Symphony Math application file to your Applications folder or to your desktop. Windows users: Run the installation program.
Chapter 07 | Installing Symphony Math

55
To configure the Symphony Math application:1 Launch the Symphony Math application.
2 Click School to continue the configuration.
3 Enter your Activation Code. This code is available in your setup email, or in the School tab within the online Administration Panel.
4 Click Register to continue the configuration.
5 Choose the type of signin you would you students to use.
Student Sign In
Chapter 07 | Installing Symphony Math

56
!
If you select “List of Students” for the signin type students will need to click their name and enter their
password. When they click ‘OK’, their session of Symphony Math will begin. If you choose “Username
/ Password” students will need to enter the school account number, their username and password.
This option helps prevent students mistakenly choosing the wrong name to signin.
Network Installation InstructionsSymphony Math is designed to be run as a standalone application (installed on each student worksta-
tion), or as a shared application on a network file server. To ensure proper performance, the following
steps should be followed when performing a network installation.
To install Symphony Math on a Windows Server:1 Complete the download, installation, and configuration steps detailed above.
2 Copy the C:\Program Files\Symphony Learning\ directory to the file server.
3 Ensure that permissions are set correctly so that network users can access the program. Permissions can be set by right-clicking on the Symphony Learning folder, choosing Proper-ties, and selecting the Sharing tab. Ensure that your student account has Read and Execute permissions only.
4 Create shortcuts to each student workstation that will point to the Symphony Math applica-tion on the server. In the Symphony Learning folder, right-click the SymphonyMathematics.exe file. Select Create Shortcut.
To install Symphony Math on a Mac Server:1 Complete the download, installation, and configuration steps detailed above.
2 Copy the Symphony Math program (the Symphony blue and yellow icon) to the file server.
3 Set the permissions correctly so that network users can access the program at the same time. This may require the use of Workgroup Manager. For step-by-step directions for differ-ent versions of Workgroup Manager, please see our online documentation available at www.symphonymath.com.
a. Right-click the Symphony Learning folder and select Properties.
b. From the Properties dialog box, ensure the Read-only check box is checked, and press the OK button.
c. If prompted, choose to make the changes for all subfolders and files.
4 Create shortcuts to each student workstation that will point to the Symphony Math blue and yellow icon that you modified in step 3.
To auto update the software on an a network installation:Symphony Math has an auto-update capability that is prohibited across network paths. If client work-stations report seeing an Update Available icon on the login screen, run the Symphony Math program from the local path on the server to download the update.
Chapter 07 | Installing Symphony Math

57
Set Up the School-To-Home OptionAll customers of Symphony Learning are entitled to use the Symphony Math program outside of
school. Students may have computer access at home, a public after-school program, or a library.
Students use the same Symphony Math program, but use their own unique username and password.
At school, students may see a list where they choose their name. At home, students type the school
account number, their account, username, and password in a signin box. The home login helps to
avoid students mistakenly using another student account.
To send instructions to families about using Symphony Math:1 The Symphony Math Administration Panel can automatically generate “School-to-Home”
letters for your students. The School-to-Home letters contain directions for downloading and installing Symphony Math as well as student signin information. Please see chapter 11, Symphony Math Advanced Settings for more information on how to generate School-to-Home letters for your students.
2 Symphony Learning does not provide phone or email tech support for home users. As the school representative, you are responsible for helping your students with any issues in the installation and use of Symphony Math at home. Please make sure to place your contact information at the top of the School-to-Home template so that families have a way to address any issues in the setup and use of Symphony Math at home.
Home Login Students enter the school account number, their username and password.
Chapter 07 | Installing Symphony Math

58
Introduction
Symphony Math is a Web-enabled application. The student software program is installed on your
schools’ file server or on each workstation. You will use a web browser to manage student accounts
and review reports. Data from student use of the software program is stored and maintained on a se-
cure server at Symphony Learning. All transactions during use of Symphony Math use SSL encryption
to ensure the best available privacy of student records. Each workstation requires an active Internet
connection (28 kbps or better per workstation) in order to run the Symphony Math software, and the
program is not recommended for sites that do not have reliable Internet access.
If your district has purchased the Symphony Math District Administration Panel you have the capability
to create school accounts and distribute licenses. Your Symphony Math welcome email will indicate if
you have a district account or a school account.
Compatible Web Browsers for Administration Panel
Mac Windows
OS X version 10.2 + Windows 2000, XP, Vista
Safari 2+ Internet Explorer 7+
Firefox 2+ Firefox 2+
district set up08
Chapter 08 | District Setup

59
Configuring the Administration PanelSymphony Math is a Web-enabled program and all student and class data is stored online. The
program is installed on each workstation or on the school server, and student data is transmitted over
the internet to the Symphony Server. For this reason, you can add students and classes before you
install the program. All class and student data is created and modified via an online administration
panel using a Web browser. To login, you must enter your site ID, Username and Password.
If you have not received a Symphony Math Welcome Email, contact Symphony Support at
800.234.3030 or email [email protected].
Logging in to the Symphony Math Administration Panel
To access your administration panel:1 Open your web browser and go to the Symphony Math website: www.symphonymath.com.
2 Click School Login.
3 Enter your School Account Number, your Username, and your Password.
4 Click Login.
School Login Button Click here to access the administration panel.
Chapter 08 | District Setup

60
!
Changing District Settings
To modify settings for all schools in district:1 Use your District Administrator account number, username, and password to sign in to the
Symphony Administration Panel at www.symphonymath.com.
2 Click the District tab from the online Administration Panel.
3 Make changes for the Screener and Benchmarker and Students settings as necessary.
4 Click Save Changes NOTE: Changes to the district settings will affect all schools in your district.
District Settings determine settings for all schools .School accounts that are part of a District account use the District Settings for Screener & Bench-marker settings and Custom Demographic labels. The settings below will not be available to schools, and must be set by a District Administrator.
To change the definition of At-Risk for all students in the district:
l Select either the Percentile or months below grade level in the Screener & Benchmarker area.
l Select from the options to define the threshold for At-Risk. These settings will affect all students, and are used in the Screener reports.
Chapter 08 | District Setup

61
To modify the Availability of the Screener and Benchmarker tests:
l Select an option under Availability in the Screener & Benchmarker area.
l If applicable, choose the time range that the testing should be administered. For example, if you do not want students to see tests except during school hours, select the time that the school day starts and ends.
To define the starting date for each testing window of the Screener and Benchmarker:
l Select the month and day for the fall, winter, and spring testing windows. Students who log into Symphony Math or the Symphony Math web site on these dates or any time afterward will receive the Screener and Benchmarker for that testing window.
l Please note that the dates for each testing window are arranged from early in the School Year (August) to later in the School Year (July).
Chapter 08 | District Setup

62
Creating School Accounts
To create a School Account:1 Use your District Administrator account number, username, and password to sign in to the
Symphony Administration Panel at www.symphonymath.com.
2 Click the Schools tab from the online Administration Panel.
3 Click Add School. The School Settings window appears.
4 Enter the required information.
5 Click Save Changes.
To modify the number of concurrent users reserved at each school:1 Use your District Technical Administrator account number, username, and password to sign
in to the Symphony Administration Panel at www.symphonymath.com.
2 Click the Schools tab from the online Administration Panel.
3 Enter the number of concurrent users to the left of each school name.
4 Click Save Changes.
Each school account that is created can be registered when the Symphony Math student program
is installed and configured. In the example above, six school accounts have been created. At As-
tor Elementary, Account Number 3206 and the Username and Password would be used when the
Symphony Math student application is installed.
Chapter 08 | District Setup

63
Creating Student Accounts
To create student accounts:1 Click the Students tab from the online Administration Panel.
2 Click Add Student.
3 Enter the student information. Only the first name, username, and password fields are required.
4 Click Save Changes.
5 You will be returned to the list of student names where you can see the new student account.
To change the program narration language setting:
l When creating a new student, click the Program Narration pulldown to choose another language.
l Click on the name of an existing student to see the Advanced Settings, then click Program Narration pulldown to change the language setting.
To change the session time limit:
l When creating a new student, enter your desired time limit in the Session Time Limit box. If you do not want a time limit on your students’ sessions, select the No Time Limit radio button.
Enter student information in these fields. Fields* are required.
Customize Settings for the Symphony Math
Intervention.
Set Availablility of Screener and Benchmarker tools.
Chapter 08 | District Setup
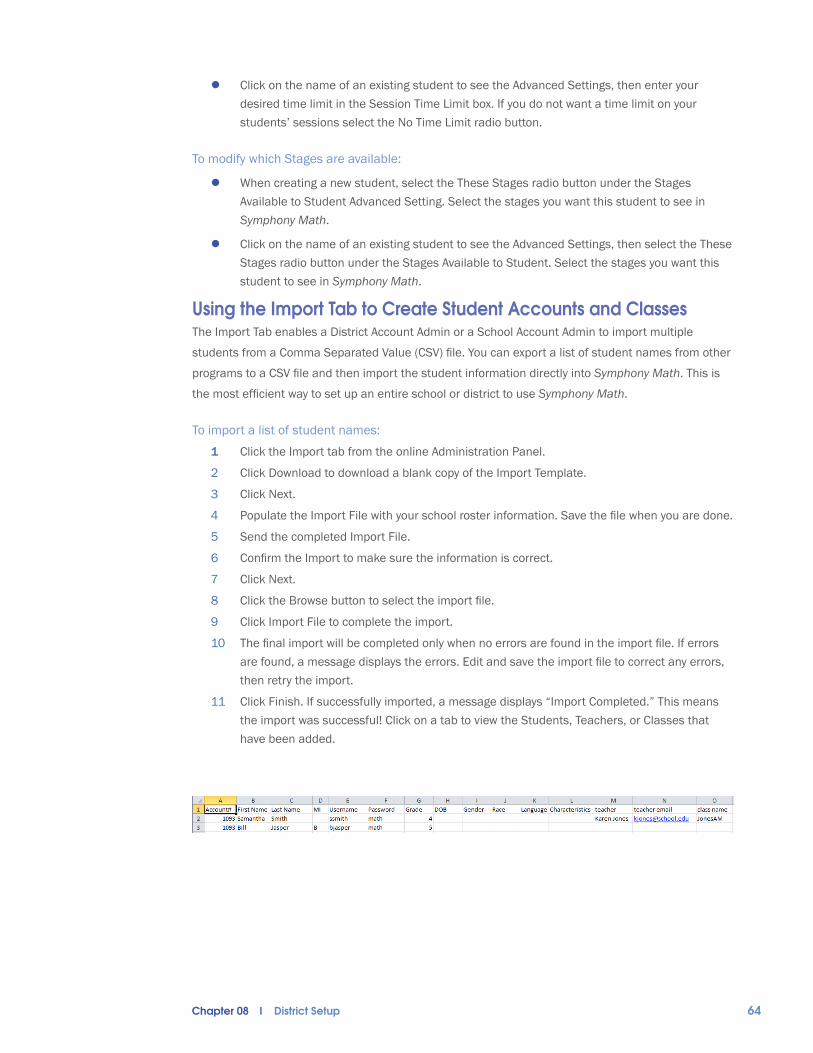
64
l Click on the name of an existing student to see the Advanced Settings, then enter your desired time limit in the Session Time Limit box. If you do not want a time limit on your students’ sessions select the No Time Limit radio button.
To modify which Stages are available:
l When creating a new student, select the These Stages radio button under the Stages Available to Student Advanced Setting. Select the stages you want this student to see in Symphony Math.
l Click on the name of an existing student to see the Advanced Settings, then select the These Stages radio button under the Stages Available to Student. Select the stages you want this student to see in Symphony Math.
Using the Import Tab to Create Student Accounts and ClassesThe Import Tab enables a District Account Admin or a School Account Admin to import multiple
students from a Comma Separated Value (CSV) file. You can export a list of student names from other
programs to a CSV file and then import the student information directly into Symphony Math. This is
the most efficient way to set up an entire school or district to use Symphony Math.
To import a list of student names:1 Click the Import tab from the online Administration Panel.
2 Click Download to download a blank copy of the Import Template.
3 Click Next.
4 Populate the Import File with your school roster information. Save the file when you are done.
5 Send the completed Import File.
6 Confirm the Import to make sure the information is correct.
7 Click Next.
8 Click the Browse button to select the import file.
9 Click Import File to complete the import.
10 The final import will be completed only when no errors are found in the import file. If errors are found, a message displays the errors. Edit and save the import file to correct any errors, then retry the import.
11 Click Finish. If successfully imported, a message displays “Import Completed.” This means the import was successful! Click on a tab to view the Students, Teachers, or Classes that have been added.
Chapter 08 | District Setup
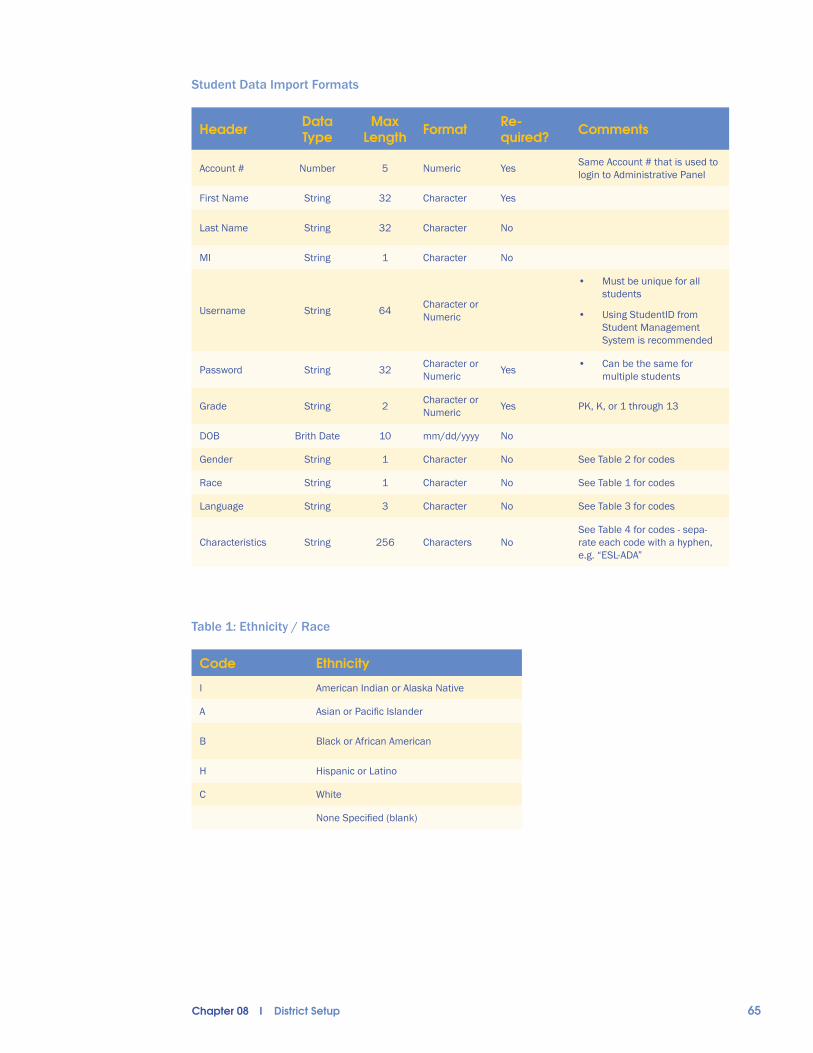
65
Student Data Import Formats
Header Data Type
Max Length Format Re-
quired? Comments
Account # Number 5 Numeric Yes Same Account # that is used to login to Administrative Panel
First Name String 32 Character Yes
Last Name String 32 Character No
MI String 1 Character No
Username String 64 Character or Numeric
• Must be unique for all students
• Using StudentID from Student Management System is recommended
Password String 32 Character or Numeric Yes • Can be the same for
multiple students
Grade String 2 Character or Numeric Yes PK, K, or 1 through 13
DOB Brith Date 10 mm/dd/yyyy No
Gender String 1 Character No See Table 2 for codes
Race String 1 Character No See Table 1 for codes
Language String 3 Character No See Table 3 for codes
Characteristics String 256 Characters NoSee Table 4 for codes - sepa-rate each code with a hyphen, e.g. “ESL-ADA”
Table 1: Ethnicity / Race
Code Ethnicity
I American Indian or Alaska Native
A Asian or Pacific Islander
B Black or African American
H Hispanic or Latino
C White
None Specified (blank)
Chapter 08 | District Setup

66
Table 2: Gender
Code Gender
M Male
F Female
U Unassigned
Table 3: Language
Code Ethnicity
ARA Arabic
CAN Chinese: Cantonese
MND Chinese: Mandarin
CHI Chinese: Unspecified
HMG Hmong
JPN Japanese
CAM Khmer
KOR Korean
POR Portuguese
RUS Russian
SCC Serbo-Croatian
SPA Spanish
ENG English
FRE French
GER German
GUJ Gujarti
CRP Haitian Creole
LAO Lao
MAY Malay
NAV Navajo
OTH Other
POL Polish
TAG Tagalog or Filipino
URD Urdu
VIE Vietnamese
Chapter 08 | District Setup

67
Table 4: Student Characteristics
Code Characteristic
ADA American with Disabilities (ADA)
AR At-Risk Students
BIL Bilingual Education
ESL English as a Second Language (ESL)
FL Free Lunch
GT Gifted/Talented
LD Learning Disabled
LEP Limited English Proficiency (LEP)
MG Migrant
NA Non-Resident Alien
PD Physically Disabled
RL Reduced-Price Lunch Program
SE Special Education
T1 Title I
CUS1 Custom Field 1
CUS2 Custom Field 2
CUS3 Custom Field 3
CUS4 Custom Field 4
Chapter 08 | District Setup

68
System Requirements
Ensuring Student Access to the Symphony Web ServersSymphony Math stores student data on secure internet servers. If your school has internet filtering
software that restricts access to internet sites, you will need to ensure that the Symphony data serv-
ers are allowed access to and from student workstations.
The Symphony Math student program must have access to the following URLS:
http://www.symphonylearning.com/ (main web site, automatic downloads)
https://admin.symphonylearning.com/ (Program Communications)
https://assess.symphonylearning.com/ (Screener and Benchmarker)
https://my.symphonylearning.com/ (Adminstrative Panel)
https://pdf.symphonylearning.com/ (Reports/PDF server)
Add the URLs above to your “acceptable” list of URLs to allow student data to be sent to and from the
Symphony Learning server.
Deciding Between Local and Network Installation
Installing the Symphony Math Intervention ApplicationThe Symphony Math application must be installed on each workstation or on the school file server.
During the installation process you will enter the school account number, username and password
which will enable the application to connect to the Symphony server over the internet. This allows
the progress of students to be saved on the Symphony server and reported back to you through the
Symphony Administration Panel that you configured in Chapter 2.
The benefits of this hybrid system allow your students to use a rich three dimensional graphical in-
terface with supporting sound and narration through the Symphony Math application that resides on
each workstation or the school server. You are able to access student reports and configure student
accounts from the convenience of any Web browser with an active internet connection. Because the
Symphony Math application is installed locally there is no need to transmit sound and graphic files
over the internet, which otherwise could slow down your school’s network performance.
Mac Windows
OS X version 10.2 + Windows 2000, XP, Vista, Windows 7
256 MB RAM 256 MB RAM
16 MB Video acceleration 16 MB Video acceleration
35 MB free hard drive space 35 MB free hard drive space
Active Internet Connection* Active Internet Connection*
Web Browser: Web Browser:
Safari 2+ Internet Explorer 7+
Firefox 2+ Firefox 2+
Flash Plugin version 9.0 or greater Flash Plugin version 9.0 or greater
Chapter 08 | District Setup

69
Symphony Math can be installed as a standalone program (on each student workstation) or as a
shared application on a network file server. Both methods have advantages, and your installation type
should be decided by choosing the method that works best for your technology and implementation
plan for Symphony Math.
Standalone Installation Advantages Network Installation Advantages
Little impact on the school network traffic. No disk space required at student workstations.
Allows custom graphics settings at the workstation level. Settings changes made to server install affect all users.
Staff members can change settings without access to school server.
Program updates only need to be applied to the server, rather than to each workstation.
To install Symphony Math as a standalone application on each workstation:
1 Log in to the workstation as an administrator or user that has permission to install programs.
2 Go to www.symphonymath.com.
3 Click the Download link.
4 Choose your operating system to download the program installer.
5 Follow the onscreen directions to install Symphony Math.
6 Run the program one time, and register the school account information.
To install Symphony Math on a network:First, follow the steps above to download, install, and configure Symphony Math on your network’s
server.
1 Copy the entire C:\Program Files\Symphony Learning\ folder to a network location. Macintosh OS X: copy the Symphony Math icon to a network location.
2 Ensure that the Symphony Learning folder gives students Read and Execute permissions. On Novell Servers, give students ‘Read and Filescan’ permissions.
3 Create a shortcut to the Symphony Math program from the Symphony Mathematics.exe icon (on Windows) or the Symphony Math icon (OS X).
4 Copy the shortcut to each workstation.
Chapter 08 | District Setup

70
Introduction
Congratulations! Your school has purchased Symphony Math, which entitles your child to use the
Symphony Math software at home. During the installation process you will enter the school account
number, username, and password which will enable the application to connect to the Symphony
server over the internet. This allows your child’s progress to be saved on the Symphony server and
reported to your child’s school. Symphony Learning does not provide technical support to home users.
If you have misplaced your child’s login information or if you have questions about Symphony Math,
contact your child’s school.
System Requirements
Mac Windows
OS X version 10.2 + Windows 2000, XP, Vista
256 MB RAM 256 MB RAM
16 MB Video acceleration 16 MB Video acceleration
One CPU & video card per student One CPU & video card per student
30 MB available hard-drive space 30 MB available hard-drive space
Active Internet connection (28 kbps or better) Active Internet connection (28 kbps or better)
installing intervention at home09
Chapter 09 | Installing Intervention At Home
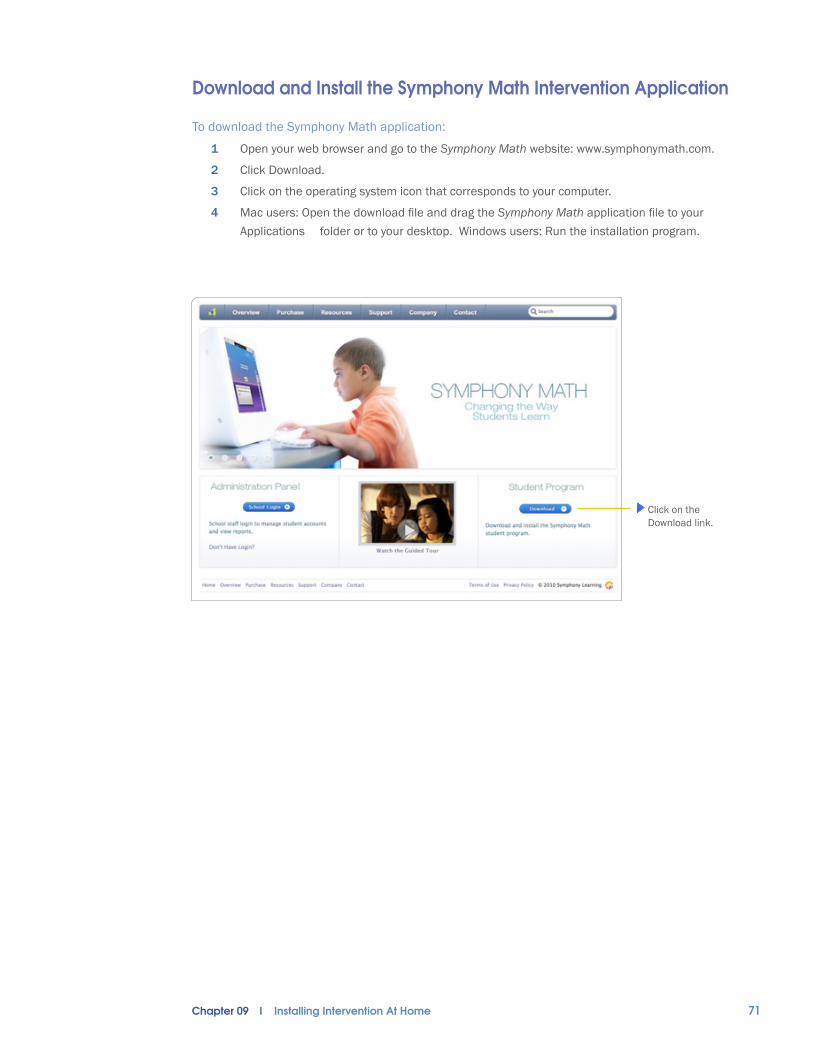
71
Download and Install the Symphony Math Intervention Application
To download the Symphony Math application:
1 Open your web browser and go to the Symphony Math website: www.symphonymath.com.
2 Click Download.
3 Click on the operating system icon that corresponds to your computer.
4 Mac users: Open the download file and drag the Symphony Math application file to your Applications folder or to your desktop. Windows users: Run the installation program.
Click on the Download link.
Chapter 09 | Installing Intervention At Home

72
To configure the Symphony Math Intervention application:
1 Launch the Symphony Math application.
2 Click Home to continue the configuration.
3 Enter your School Account Number, Username, and Password.
4 Click Save to complete the Configuration process.
Student Signin
Each time students start a Symphony Math session, they will need to enter their password. When they
click the green checkmark, their session will begin.
Home Login Students enter
their username and password.
Chapter 09 | Installing Intervention At Home

73
Introduction
After the Symphony Math Intervention program has been installed on each workstation (or the school
file server) and the student accounts have been created using the online administration panel, your
students can begin using the program.
The Student Signin ScreenTo begin using the Symphony Math Intervention application:
1 Launch the Symphony Math Intervetion program from your desktop or dock. If the Symphony Math icon is not visible, locate it in your Program Files folder (Windows) or Applications folder (Mac).
2 Direct your students to locate their name in the student list and click on it.
3 Direct your students to type their passwords and click OK.
Alpha Scroll Select a letter to scroll the list of student names.
Volume Control Click to increase program volume. Con-tinue clicking to decrease.
Refresh Button Click to refresh the list of student names. Classes
Pulldown Click to limit the list of student names to a specific class.
Name Selec-tion Window Student se-lects her name to sign in to the program.
Settings Button Click to access the Settings screen.
Exit Button Click to quit the program.
using symphony math intervention10
Chapter 10 | Using Symphony Math Intervention

74
If you do not see a list of students names, and instead see a prompt for account number, useraname and password, students will need to enter that information each time they use the
program.
To narrow the list of names in the Name Selection Window:
l Use the Classes Pulldown to select your class name. This will reduce the list to only students enrolled in your class, making it easier for students to find their name.
To automatically scroll the list of names to those starting with a specific letter:
l Click the letter in the alphabet above the student list that corresponds to the first name of the student. Or, use the keyboard to type the first letter of the first name.
To refresh the list of student names in the Name Selection Window:
l Click the refresh button at the top right of the list of student names. You may need to do this if you recently created a new student account but that account is not showing in the Name Selection Window.
To exit the sign-in screen and quit Symphony Math:
l Click the EXIT button at the top right corner of the screen.
The Student Scoreboard ScreenThe Student Scoreboard screen is designed to show students where they are in the Symphony Math
program. Students begin and end each session at the Scoreboard screen. Students click the Go but-
ton to begin their Symphony Math session.
To see the name of the stage that the student is currently working on:
l View the Overall Progress indicator at the bottom of the screen. To see the stage name, place the cursor on the stage number.
Volume Control Click to in-crease program volume. Con-tinue clicking to decrease.
Badges Students earn badges for each Stage they complete.
Current Stage Progress Shows percentage complete in the current stage.
Overall Progress Shows Stages completed.
Progress Over Time Button
Exit Button Click to return to the Sign In Screen.
Go Button Click to begin the session.
Mastery Points Indicator
Rankings Button
Chapter 10 | Using Symphony Math Intervention

75
To see how far a student has progressed through the program:
l View the Current Stage Progress indicator at the bottom of the screen.
To see the number of mastery points a student has earned:
l Refer to the box towards the bottom right of the scoreboard.
To see how far a student has progressed through the current stage:
l View the Current Stage Progress indicator at the bottom of the screen.
To see the student’s Progress Over Time Graph:
l Click on the graph icon at the top left of the screen. A graph will appear that shows the progress of the student through the stages relative to the time she has used the program.
To see the current ranking of a student:
l Click the Rankings button at the top of the screen.
To begin a Symphony Math session:
l Click the Go Button.
To return to the Sign-in Screen:
l Click the EXIT Button at the top right corner of the screen.
The Thinking Round
After the student clicks on the Go Button, she will be brought to the Thinking Round. There are five
activities in the Thinking Round. The emphasis is on thoughtful problem solving in an untimed setting.
Students are automatically branched between the five activities in a way that helps them make con-
nections between different mathematical representations.
Students complete nine tasks in the Thinking Round. For every correct answer they earn additional
time in the Mastery Round. Student progress can be tracked by viewing the Status Window. Each
correct answer will be indicated with a green light. A problem solved with one incorrect attempt will
be displayed in yellow. A problem solved with multiple incorrect attempts will be shown in orange. If a
student is moving quickly through a stage because they are answering most questions correctly, they
may see less than 9 problems in the Thinking Round.
Chapter 10 | Using Symphony Math Intervention

76
To adjust the volume setting:
l Click on the headphones icon. Each click increases the sound, and then decreases the sound.
To quickly obtain student status:
l View the Status Window. Mostly green indicator lights indicate excellent progress. Two or three yellow lights indicates the student is at their challenge level. Four or more yellow or orange lights indicates that the student may be struggling and the program will automatically reduce the level of challenge.
To exit the Thinking Round and return to the Student Scoreboard:
l Click the EXIT Button at the top right of the screen.
Volume Control Click to increase pro-gram volume. Continue clicking to decrease.
Flashing Area Represent missing values that must be filled by the student.
Check Button Will become active once a problem has been com-pleted.
Help Button Click to receive help.
Directions But-ton Click to hear directions.
Exit Button Click to return to the Sign In Screen.
Null Button Click this button when there are no valid solu-tions.
Status Window Branching Indicator
The Branching Indicator
Symphony Math has four different branching modes. The Branching Indicator shows which mode is
currently active. If the student answers problems incorrectly the branching speed is reduced. Succes-
sive correct answers can increase the branching speed.
Chapter 10 | Using Symphony Math Intervention

77
Mode
Problems per Stage % Review
Problems
Audio Feedback for Correct
Answers
Visual Feedback for Correct
Answers
Increase Branching
Mode
Decrease Branching
ModeMastery StandardThinking Mastery
Placement
4-8 4-10 0% No No Beginning of each stage
2 incorrect responses 80% Correct
Skim
20-40 20-40 0% Yes No Beginning of each session
2 incorrect responses 80% Correct
Learning
60+ 60+ 10% Yes Yes
5 correct responses in a
row to move into Skim mode
3 incorrect in last 6
response80% Correct
Remediation
120+ 120+ 30% Yes Yes
4 of 6 correct responses to
move into Learn-ing mode
-
Mastery cannot be
achieved in Remediation
mode
The Help Button
Students can ask the program for help by pressing the life saver icon at the top right corner of the
screen. Clicking the Help Button will provide students with some scaffolding that will make the
problem less complex or lead students toward a solution. Clicking the Help Button also signals the
program that the student is at a good level of challenge and it will slow down the branching so that the
level of challenge for the next problem will not increase. If a student presses the Help Button several
times the next problem will be easier. The Branching Button will be deactivated if the student engages
it for three problems in a set of nine problems.
To activate automatic help:
l Click the life saver icon below the EXIT button.
To hear the directions again:
l Click the thought bubble icon below the Help Button.
To hear the story problems:
l Click the Read to Me Button.
Read to Me Button Click this button to hear the story problems.
Chapter 10 | Using Symphony Math Intervention

78
The Mastery Round
After solving nine problems in the Thinking Round the student is brought to the Mastery Round. In
the Mastery Round students are challenged to solve number sentences in five seconds or less. Only
number relationships and concepts that have been mastered in the Thinking Round are introduced
in the Mastery Round. This avoids the problem of requiring students to memorize what they do not
understand.
In the Mastery Round students will solve symbols problems and auditory problems. Students must
consistently solve number sentences in a limited amount of time (between 5 and 12 seconds) in order
for mastery to be achieved and to move ahead in the program.
Timer When the timer expires the round ends.
Branching Mode Indicator Indicates the branching speed.
Exit Button Click to return to the Scoreboard.
Volume Control Click to in-crease program volume. Con-tinue clicking to decrease.
The Mastery Round ends when the Timer has counted down to zero. Following the Mastery Round a
new series of nine tasks in the Thinking Round begins. During a typical 20-minute session, a student
will complete three nine-problem series in the Thinking Round and three Mastery Rounds.
Chapter 10 | Using Symphony Math Intervention

79
Overview of the Dashboard
The Intervention Dashboard is a formative assessment tool that provides you with the most important
information about your students’ use of Symphony Math. Are your students using Symphony Math
often enough? Are they making progress? Does anyone need your help with a specific concept? These
are the questions that you can answer quickly by consulting the Dashboard.
There are three components to the Dashboard. The colored gauges in the Status Over Past Four
Weeks section provide a quick status update of all of your students. Green gauges indicates that
everything is progressing well. Red indicates that there are issues that need to be addressed, such
as students needing to use the program more often or who need help with specific concepts. Yellow
indicates borderline issues. The Overall Status section provides summary statistics for your students’
use of Symphony Math. The progress over time graphs show the progress of students relative to the
time they have used the program.
the intervention dashboard11
Chapter 11 | The Intervention Dashboard

80
Group Pulldowns
Selectors allow Dashboard to narrow to a specific school, class, or grade.
Status Over Past Four Weeks
Indicate the status of students using Symphony Math.
Help Button Provides
explanation of Dashboard issues and sug-gests remedies.
Progress Over Time Graphs
Indicates stu-dent progress relative to time on task.
PDF Button
You can log in to your Dashboard on a regular basis to see how your students are progressing. If all
the gauges are green then there are no issues that you need to address.
To access your Dashboard:1 Open your web browser and go to the Symphony Math website: www.symphonymath.com.
2 Click School Login.
3 Enter your School Account Number, your Username, and your Password.
If you do not have a Symphony Math Username and Password, please contact your School Technical
Administrator.
Status Over Past Four WeeksThe Dashboard gauges reflect the status of students using Symphony Math over the past four weeks.
This ensures that your gauges are reflecting the recent status of your students. A student who has
not used Symphony Math in the past four weeks will not be included in the gauges. If your students
do not use Symphony Math during a vacation the Dashboard will reflect this with more red in the Use
gauge. However, once students return to school and their regular Symphony Math use schedule the
gauge will soon return to green. The gauges reflect recent changes in your students’ use of Symphony
Math.
Chapter 11 | The Intervention Dashboard
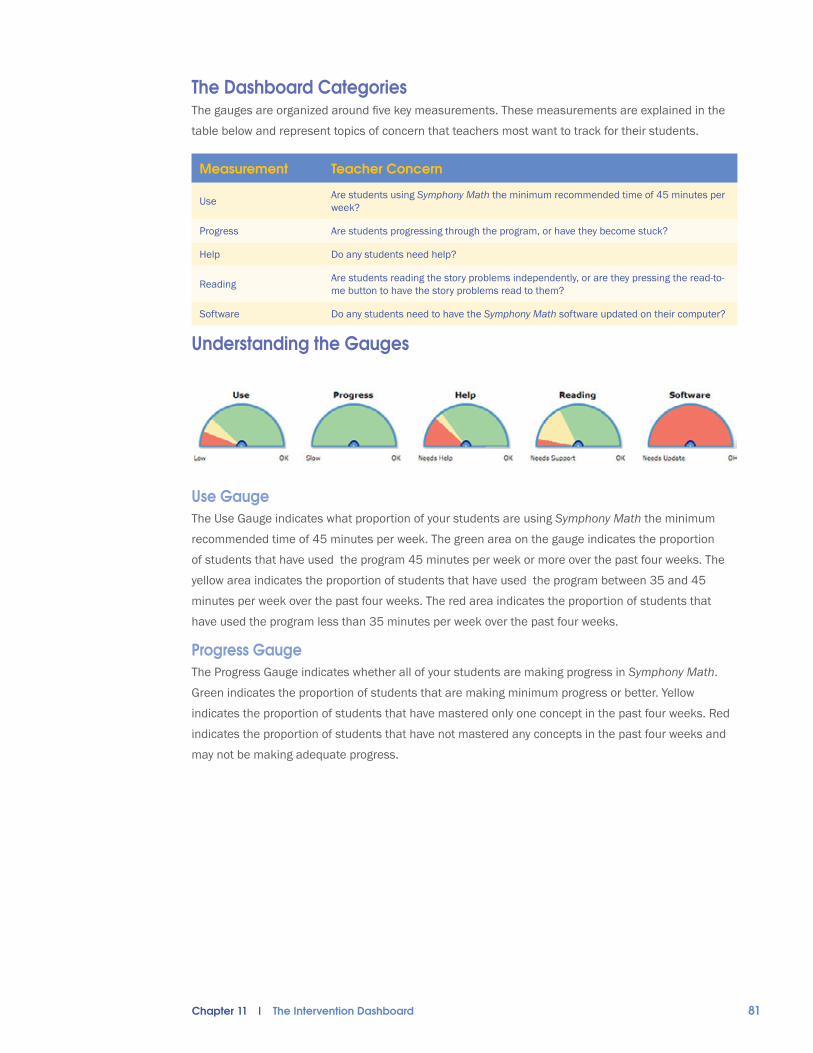
81
The Dashboard CategoriesThe gauges are organized around five key measurements. These measurements are explained in the
table below and represent topics of concern that teachers most want to track for their students.
Measurement Teacher Concern
Use Are students using Symphony Math the minimum recommended time of 45 minutes per week?
Progress Are students progressing through the program, or have they become stuck?
Help Do any students need help?
Reading Are students reading the story problems independently, or are they pressing the read-to-me button to have the story problems read to them?
Software Do any students need to have the Symphony Math software updated on their computer?
Understanding the Gauges
Use GaugeThe Use Gauge indicates what proportion of your students are using Symphony Math the minimum
recommended time of 45 minutes per week. The green area on the gauge indicates the proportion
of students that have used the program 45 minutes per week or more over the past four weeks. The
yellow area indicates the proportion of students that have used the program between 35 and 45
minutes per week over the past four weeks. The red area indicates the proportion of students that
have used the program less than 35 minutes per week over the past four weeks.
Progress GaugeThe Progress Gauge indicates whether all of your students are making progress in Symphony Math.
Green indicates the proportion of students that are making minimum progress or better. Yellow
indicates the proportion of students that have mastered only one concept in the past four weeks. Red
indicates the proportion of students that have not mastered any concepts in the past four weeks and
may not be making adequate progress.
Chapter 11 | The Intervention Dashboard

82
Help GaugeThe Help Gauge indicates the proportion of your students who need help with Symphony Math. The
green portion represents those students who do not need help. The yellow portion is for students
who have solved more than 200 problems for a concept but have not yet mastered it. The red portion
indicates the proportion of students who have completed more than 250 problems for a concept and
have not mastered it.
Reading GaugeThe Reading gauge indicates the proportion of students who are pressing the Symphony Math button
to have the story problems read to them. Typically these are the non-fluent readers. This gauge helps
you see how many of your students are relying on the computer to read the story problems to them.
The green area of the gauge indicates the proportion of students who are pressing the Read To Me
Button less than one out of every two story problems. The yellow indicates those who are pressing
the Read To Me Button between about every two story problems. The red indicates students who are
pressing the Read To Me Button at least once for every story problem.
Software GaugeThe Software Gauge indicates the proportion of students who need to update the software on the
computer they used. Green indicates the proportion of students who used the most recent version of
the Symphony Math software. Yellow indicates students who used a version of Symphony Math that
is lacking small bug fixes and refinements. Red indicates students who used software that is a major
version older than what is currently available. These students do not have access to major improve-
ments and new components of the curriculum.
Chapter 11 | The Intervention Dashboard

83
How to Remedy Common Implementation IssuesA red portion of a dashboard gauge means there is an issue that needs to be addressed. Clicking on
the gauge itself will link you to the Group Alerts Report which will provide the name or names of the
students who have the identified issue. We suggest the following remedies as interventions that can
address the issues identified in the Symphony Dashboard.
To remedy a red Use Gauge:
l Schedule more Symphony Math sessions each week.
l Inquire with the parents if Symphony Math can be used at home.
l Explore after-school or before-school use opportunities.
To remedy a red Progress Gauge:
l Students who are making slower progress than other students could benefit from using the program an extra session or two each week.
l Look at a student’s progress report to identify which concepts the student is working on and provide additional instruction and practice aside from the computer. Explore opportunities to use Symphony Math outside of school.
l Sit with the student and watch him or her use Symphony Math. Are they being distracted by other students? Are there parts of the instructions they do not understand? Ask them to explain to you what they are doing and why. Make sure they are on task, understand the directions, and feel good about their work.
l Are they using Symphony Math often enough? Look at the Use Alert Tab on your dashboard to see if the student appears as an alert for low use. If the student is listed in red or yellow on the Use tab that means they are not using Symphony Math the minimal 45-minutes a week
and this has contributed to their slow progress.
To remedy a red Help Gauge:
l Watch students use Symphony Math. If students seem frustrated (or says they are), they should stop using the program.
l The Alerts Report for Help will indicate the concept with which the student needs help. Off-computer instruction and practice can be provided.
l After additional instruction has been provided and the student has taken a break from using the program, he or she can begin using the program again to see if she is better prepared to
progress.
To remedy a red Software Gauge:
l Update the Symphony Math software to the most current version.
Chapter 11 | The Intervention Dashboard

84
!
The Overall Status Statistics
Category Metric
Schools: The number of schools in the district with a Symphony Maths license.
Grades: The number of grades that have students enrolled in Symphony Math.
Classes: The number of classes that have students enrolled in Symphony Math.
Enrolled Students: The number of students that are enrolled in Symphony Math.
Active Students: The number of enrolled students that have used Symphony Math in the last four weeks.
Inactive Students: The number of enrolled students that have not used Symphony Math in the last four weeks.
Average Sessions: The average number of times students have used Symphony Math.
Average Time: The average length of each Symphony Maths session.
Average Stage: The average stage number that students have achieved in Symphony Maths.
Mastery Index: The percent of students that have completed the program (grade three students and above) or have mastered their respective grade level stages (k through grade 2 students).
Students with Alerts: The percentage of students that have an active alert. Click on the number to link to the Alerts Report.
Staff Logins Per Week: The average number of times staff members have logged in to the Symphony Math Administration Panel.
The data on the dashboard reflects the information for the schools, grades or classes that are selected in the group pull down selectors above the gauges.
Understanding the Progress Over Time GraphsThe Progress Over Time Line Graph displays the average progress for a group of students as well
as their average weekly use. The left vertical axis reflects the seventeen stages of the program. The
horizontal axis indicates the weeks of the year. The line graph shows the upward movement of the
group through the weeks of the year. The bars correspond to the right vertical axis which indicates
average weekly use. If the average weekly use is the minimum recommended 45 minutes or more it
will be shown with a green bar. If the average weekly use is less than the minimum recommended 45
minutes it will indicated by a red bar.
Chapter 11 | The Intervention Dashboard

85
The Progress Over Time Scatter Plot provides a visual representation of where students are in Sym-
phony Math, in terms of the current stage the student is working on and the amount of time invested
in the program. At the district level dots represent specific classes of students using Symphony Math.
The dot indicates the average stage the class is working on and the average amount of time spent
using the program. At the school level the dots represent specific students.
Dots to the far right represent classes or students that have spent more time using the program. Dots
to the far left represent classes or students that have spent less time using the program. Dots towards
the top represent classes or students who have made the most progress, while dots towards the bot-
tom represent classes or students that have made less progress.
To see the class or student name of a specific dot on the scatter plot:
l Place your mouse arrow over the dot for several seconds. A window will appear that shows the name of the class or student, the number of concepts mastered, and the hours of use.
To see more detailed information about a student represented by a specific dot:
l Click on the dot. A report window will open up with detailed information about the progress of the class or student through Symphony Math.
Chapter 11 | The Intervention Dashboard

86
Other Important Dashboard Features
Group Pulldowns
Selectors allow Dashboard to narrow to a specific school, class, or grade.
Help Button Provides
explanation of Dashboard issues and sug-gests remedies.
PDF Button
To see data for a specific school:
l Use the pulldown selector for school at the top of the Dashboard to limit the students included in the display to a specific school. For example, to see data only for ‘Meadow Elementary’ set the school pulldown selector to ‘Meadow Elementary.’ the data will reload and then show only information about students from ‘Meadow Elementary.’
To see data for a specific grade:
l Use the pulldown selector for grade at the top right of the Dashboard to limit the students included in the display to a specific grade. For example, to see data only for third grade students set the grade pulldown selector to grade three. The data will reload and then show only information about grade three students.
To see data for a specific class:
l Use the pulldown selector for class at the top right of the Dashboard to limit the students included in the display to a specific class. For example, to see data only for class “2A”, set the class pulldown selector to 2A. The data will reload and then show only information about the students in class 2A that have been using Symphony Math.
To see how many students are included in the Dashboard analysis:
l Refer to the Status bar in the top left corner of the Dashboard. The Status bar reveals how many students have used Symphony Math in the past four weeks. Only student who have used the program in the past four weeks will be included in the Dashboard.
To get more help on the Dashboard:
l Select the question mark icon at the top right corner of the Dashboard to open the Dash-board Help File.
Chapter 11 | The Intervention Dashboard

87
Overview of ReportsThe Reports tab can generate reports for each of the Symphony Math tools: Screener, Benchmarker,
and Intervention. Screener reports provide group and student information on the at-risk status of stu-
dents. Benchmarker reports contain grade-level, standard score, percentile rank and growth scores
for all students, both as groups and as individual students. Intervention reports provide summary
information and detailed reporting on use of Symphony Math Intervention. Use the report selector pull
down menus at the top of the Reports screen to choose the report you need. Reports data is compiled
in real time and reflects the most recent use of Symphony Math by your students. The reports are
designed to provide you with the information you need to monitor implementation, guide classroom
instruction, and document student progress and areas of need.
reports12
Chapter 12 | Reports

88
Symphony Math ReportsThere are nineteen different Symphony Math reports. The purpose of each report is explained below.
Area Category Report Purpose
Screener CompareGroups Screener Status Compares the At-Risk status for a District, School,
or Grade.
CompareGroups Implementation
Provides summary information on the implementation of the Screener, Benchmarker, and Intervention.
CompareStudents Screener Status Compares the At-Risk status for each student in a
School, Grade, or Class.
Benchmarker CompareGroups Benchmarker Status Compares Benchmarker performance for schools,
grades, or classes in the current testing window.
Compare Groups Benchmarker Growth Provides growth comparison for districts, schools,
or grades.
CompareStudents Benchmarker Status Shows Benchmarker testing details for each
student in a group for the current testing window.
Compare Students Benchmarker Growth Provides growth comparison for individual students
in a school, grade, or class.
Individual Student Student Graph Provides a visual of a student’s progress during
the three Benchmarker testing windows.
Intervention CompareGroups Intervention Status Summarizes the status for multiple groups of
students.
CompareGroups Intervention Alerts Compares the number of Dashboard Alerts for
different groups of students.
CompareStudents Intervention Status Provides a list of all students in a specified group
with their overall use, progress, and status.
CompareStudents Intervention Alerts Summarizes the Dashboard Alerts for a group of
students.
CompareStudents Intervention Graph Graphically displays the progress and use of
Intervention of a group of students.
CompareStudents Intervention Concepts
Displays a list of students from a defined group with a visual representation of their progress through the stages and concepts of Intervention.
Individual Student Intervention Status
Provides concept-by-concept information on the progress of a specific student through the Intervention stages and concepts.
Individual Student Intervention Graph Graphically displays a specific student’s progress
and use of Intervention.
Individual Student Intervention Fluency
Reports the proficiency of a specific student with each number relationship addressed in Intervention.
Individual Student Daily Progress Displays the session-by-session details of the use
of Intervention by a specific student.
Individual Student Home Report Summarizes student progress for parents.
Chapter 12 | Reports

89
Selecting ReportsUse the report selector pull downs and the create report button to generate your report.
To generate a report:1 Click the Tool menu and select the type of report you would like to generate.
2 Click the Category menu and select the category of report you would like to generate.
3 Click the Report menu and select the type of report.
4 Click the Students menu and select the group or student for your report.
5 The progress reports and graphs allow you to specify the date range for the data in your report. Select the start and end dates or use the default dates.
6 Click the Create Report button.
Report Pulldowns
Select the type of report and the grade or class.
Create Report Button After selecting report and defining your group click this button to create your report.
Chapter 12 | Reports

90
Screener Reports
Compare Groups: Screener StatusThe Screener Status Report compares the At-risk status for a District, School, or Grade. The definition of ‘at-risk’ is set in the District or School tab, and is the 20th Percentile by default.
Click on a column to sort the data by that variable.
Click on a group name for more information.
Use the PDF button to generate a PDF that you can print, save, or e-mail.
Use the Help button to view column heading explainations.
To sort the data in the report by a specific variable:
l Click on the column heading to sort the data by that variable. Click again to reverse sort. For example, clicking on the At-Risk column sorts the data by bringing the group with the lowest number of At-Risk students to the top of the list. Clicking the column heading again brings the groups with highest number of At-Risk students to the top of the list.
The table below provides an explaination for each of the columns from the Screener Status Report:
Column Explaination
Group The School, Grade, or Class name
Not At-Risk The number of students who have taken Screener and are not categorized as At-Risk or Borderline
Borderline The number of students who have taken Screener and are near (Plus or minus 5 percentile points) the At-Risk threshold.
At-Risk The number of students who have taken Screener and fall below the At-Risk threshold.
Need Screening The number of students who need to take Screener.
GraphA visual representation of the previous columns’ data. The bar shows the percentage of students Not At-Risk (Green), Borderline (Yellow), At-Risk (Red), and Need screening (Light Blue) for the group.
Chapter 12 | Reports

91
Compare Groups: Implementation ReportThe Implementation Report provides summary information on the implementation of the Screener,
Benchmarker, and Intervention.
Click on a column to sort the data by that variable.
Use the Help button to view column heading explainations.
The table below provides an explaination for each of the columns from the Implementation Status Report:
Column Definition
Group The School, Grade, or Class name
Students The total number of students enrolled who are in the group
Screened The number of students who have taken the Screener
Benchmarked The number of students who have taken the Benchmarker
Using Intervention The number of students who have used Intervention in the past 4 weeks
Chapter 12 | Reports

92
Compare Students: Screener StatusThe Screener Status Report compares the At-risk status for each student in a School, Grade, or Class.
The definition of ‘At-risk’ is set in the District or School tab, and is the 20th Percentile by default. This
report displays information for each Testing Window (Fall, Winter, and Spring). The testing windows are
set in the District or School tab.
Click on a column to sort the data by that variable.
Use the Help button to view column heading explainations.
The table below provides an explaination for each of the columns from the Screener Status Report:
Column Definition
Student The student name, organized by Last name, first name
Fall The date of administration and Status for Screener during the Fall testing window.
Winter The date of administration and Status for Screener during the Winter testing window.
Spring The date of administration and Status for Screener during the Spring testing window.
Use the PDF button to generate a PDF that you can print, save, or e-mail.
Chapter 12 | Reports

93
Benchmarker Reports
Compare Groups: Benchmarker StatusThe Benchmarker Status Report compares performance for groups of students in the current testing
window for Benchmarker. You can click on a group name to see more detailed information on that
group.
Click on a column to sort the data by that variable.
Click on a group name for more information.
Use the Help button to view column heading explainations.
To sort the data in the report by a specific variable:
l Click on the column heading to sort the data by that variable. Click again to reverse sort. For example, clicking on the Percentile Rank column sorts the data by bringing the group with the lowest number of Percentile Rank to the top of the list. Clicking the column heading again brings the groups with highest number of Percentile Rank to the top of the list.
The table below provides an explaination for each of the columns from the Benchmarker Status Report:
Column Definition
Group The School, Grade, or Class name
Students The total number of students who have taken Benchmarker.
Standard Score The average Standard Score for the group of students. Standard Scores range from 0 - 1200.
GradeEquivalent
The average Grade Equivalent for the group of students. Grade Equivalent is measured in Grade and School Month. For example, “2.3” means the “2nd grade, month 3 (November). August and September are both treated as the first month of the school year.
Percentile RankThe average Percentile Rank for the group of students. Students with percentiles near 50 are near the average for the month in which the test was taken. Lower percentiles indicate slower growth relative to the nation at large.
Compare Students: Benchmarker Status
Chapter 12 | Reports

94
Compare Group: Benchmarker GrowthThe Benchmarker Growth Report displays the change in standard score for different Benchmarker
testings during each testing window.
Click on a column to sort the data by that variable.
Use the Help button to view column heading explainations.
To sort the data in the report by a specific variable:
l Click on the column heading to sort the data by that variable. Click again to reverse sort. For example, clicking on the Growth column sorts the data by bringing the group with the lowest average growth at the top of the list. Clicking the column heading again brings the groups with highest average growth to the top of the list
The table below provides an explaination for each of the columns from the Benchmarker Status Report:
Column Definition
Group The School, Grade, or Class name.
Fall/Winter The average standard score for each testing window for the group.
Growth The change in average standard score from the fall testing window to the winter testing window.
Winter/Spring The average standard score for each testing window for the group.
Growth The change in average standard score from the fall testing window to the winter testing window.
Total Growth The overall change in average standard score for the group over all three testing windows.
Click on a group name for
more information.
Chapter 12 | Reports

95
The Benchmarker Status Report shows details for each student in the current testing window for
Benchmarker.
Click on a column to sort the data by that variable.
Use the Help button to view column heading explainations.
The table below provides an explaination for each of the columns from the Benchmarker Status Report:
Column Definition
Student The student names in last name, first name format.
Date The date of the student completed the Benchmarker test.
Standard Score The average Standard Score for the group of students. Standard Scores range from 0 - 1200.
GradeEquivalent
The average Grade Equivalent for the group of students. Grade Equivalent is measured in Grade and School Month. For example, “2.3” means the “2nd grade, month 3 (November). August and September are both treated as the first month of the school year.
Percentile RankThe average Percentile Rank for the group of students. Students with percentiles near 50 are near the average for the month in which the test was taken. Lower percentiles indicate slower growth relative to the nation at large.
Chapter 12 | Reports

96
Compare Students: Benchmarker GrowthThe Benchmarker Growth Report displays the change in standard score for each student over the
course of the three testing windows.
Click on a column to sort the data by that variable.
Use the Help button to view column heading explainations.
To sort the data in the report by a specific variable:
l Click on the column heading to sort the data by that variable. Click again to reverse sort. For example, clicking on the Growth column sorts the data by bringing the group with the lowest average growth at the top of the list. Clicking the column heading again brings the groups with highest average growth to the top of the list
The table below provides an explaination for each of the columns from the Benchmarker Status Report:
Column Definition
Student The student names in last name, first name format.
Fall/Winter The average standard score for each testing window for the group.
Growth The change in average standard score from the fall testing window to the winter testing window.
Winter/Spring The average standard score for each testing window for the group.
Growth The change in average standard score from the fall testing window to the winter testing window.
Total Growth The overall change in average standard score for the group over all three testing windows.
Chapter 12 | Reports

97
Individual Student: Benchmarker GraphThe Benchmarker Graph provides a visual of a student’s progress during the three Benchmarker
testing windows.
Use the Help button to view column heading explainations.
The graph shows two lines:
Line Definition
Student The student’s scale scores (Dark Blue), and their projected growth (Blue) (if two scale scores are available).
At-Risk Threshold The trend line for At-Risk scores throughout three assessment windows.
Chapter 12 | Reports

98
Intervention Reports
Compare Groups: Intervention StatusThis report summarizes the status for multiple groups of students using Intervention. Use the selec-
tors at the top of the page to select all of the classes in a grade, all of the grades in a school, or all
of the schools in a district. The report provides basic summary data of use and progress. The green
Student Use bar indicates the percentage of students who have been using Intervention the minimum
required amount (45 minutes per week). The blue Mastery Index bar indicates the percentage of
students that have achieved mastery of foundational math concepts in the program appropriate for
their grade level.
To sort the data in the report by a specific variable:
l Click on the column heading to sort the data by that variable. Click again to reverse sort. For example, clicking on the Use column sorts the data by bringing the students with the lowest amount of use to the top of the list. Clicking the Use column heading again brings the
students with highest amount of use to the top of the list.
To sort the data in the report by multiple variables:
l Hold down the shift key while selecting the columns by which you would like to sort.
Click on a column to sort the data by that variable.
Click on a group name for more informa-tion.
Use the Help button to view column heading explanations.
Use the PDF button to gener-ate a PDF that you can print, save, or e-mail.
Chapter 12 | Reports

99
The table below provides an explanation for each of the columns from the School Status Report:
Column Definition
Group The name of the school, grade or class
Students The number of students in the selected group that have been enrolled in Intervention
Time The total time the group has used Intervention
First The date of the first Intervention session
Last The date of the most recent Intervention session
Last 4 Weeks –Active Students
The number of students in the selected group that have used Intervention in the last four weeks
Last 4 Weeks – Stu-dents with Alerts
The percentage of students in the selected group that have used in the last four weeks and have alerts
Last 4 Weeks – Student Use
The percentage of students in the selected group that have used Intervention at least 45 minutes per week
Mastery Index The percentage of students in the selected group that have mastered all stages for their grade level. For students in grade three and above this means completing the program
Average Stage The current average stage in Intervention for all students in the selected group
Chapter 12 | Reports

100
Compare Groups: Intervention AlertsThis report compares the number of Dashboard Alerts for different groups of students. The groups
could be a classes, grades, or schools. The report displays the percentage of students with alerts for
Use, Progress, Help, Reading and Software. You can click on the name of a group in the left column to
go to the Intervention Alerts Report for that specific group and see lists of the specific students with
details on the nature of their alerts.
Click on a column to sort the data by that variable.
Click on a group name for more informa-tion.
Use the Help button to view column heading explanations.
Use the PDF button to gener-ate a PDF that you can print, save, or e-mail.
The table below provides an explanation for each of the columns from the Intervention Status Report:
Column Definition
Group The name of the school, grade or class
Students The number of students in the selected group that have been enrolled in Intervention
Active Students The number of students in the selected group that have used Intervention in the past four weeks
Use Alerts The percentage of students that are not using Intervention the minimum recommended time of 45 minutes per week
Progress Alerts The percentage of students that have not mastered a concept in the past four weeks
Help Alerts The percentage of students that need help with a specific concept in Intervention
Reading Alerts The percentage of students that are not reading the story problems independently. They are pressing the read-to-me button to have the story problems read to them
Software Alerts The percentage of students that need to have the Intervention software updated on their computer
Chapter 12 | Reports

101
Compare Students: Intervention StatusThe Intervention Status Report provides summary and status data for each student in the group. The
first four columns provide general use data such as total use time and the most recent date of use.
The next five columns provide a status update using colored icons. The colored icons correspond to
the colors used in the Dashboard (see chapter 4). A student with a row of five green icons does not
have any Symphony Math issues that need to be addressed. A yellow or red icon indicates that there
is or may be an issue to address, such as not using the program often enough or needing help with a
specific concept.
Click on a column to sort the data by that variable.
Click on a student name for more information.
Column heading explanations are available by pressing help button.
Scroll over a data field to get more detail.
To sort the data in the report by a specific variable:
l Click on the column heading to sort the data by that variable. Click again to reverse sort. For example, clicking on the Use column sorts the data by bringing the students with the lowest amount of use to the top of the list. Clicking the Use column heading again brings the
students with highest amount of use to the top of the list.
To sort the data in the report by multiple variables:
l Hold down the shift key while selecting the columns by which you would like to sort.
Chapter 12 | Reports

102
The table below provides an explanation for each of the columns from the Intervention Status report:
Column Definition
Student The name of the student
Time The total time using Intervention, in hours:minutes format
First The date of the first session
Last The date of the most recent session
Sessions The total number of sessions
Last 4 Weeks - Use
Green - The student has been using the program for 45 minutes a week or more over the last four weeks
Yellow - The student has been using the program between 35 and 44 minutes a week over the past four weeks
Red - The student has been using the program for less than 35 minutes a week over the past four weeks
Last 4 Weeks - Progress
Green - The student has mastered two concepts or more over the past four weeks
Yellow - The student has mastered one concept over the past four weeks
Red - The student has not mastered a concept over the past four weeks
Last 4 Weeks - Help
Green - The student does not need teacher help with any Intervention concept
Yellow - The student has completed 200 problems for one concept and has not yet mastered it
Red - The student has completed over 250 problems for one concept and has not yet mastered it. The student needs teacher help with the concept
Last 4 Weeks - Reading
Green - The student is reading the story problems independently
Yellow - The student is pressing the Read To Me Button for the story problems one time for every other story problem
Red - The student is pressing the Read To Me Button one time or more for each story problem
Last 4 Weeks - Software
Green - The student used the most recent version of Intervention during their last use of the program
Yellow - The student used a version of Intervention that is lacking small bug fixes and refinements
Red - The student used a version of Intervention that is a major version older than what is cur-rently available
Current Stage
The scope and sequence of Intervention is organized into stages. The student’s progress is reported by stage. For a detailed breakdown of the student’s progress through the stages select the Student Concepts Report. The higher the stage the further along a student is through the program
Chapter 12 | Reports

103
Compare Students: Intervention ConceptsThe Intervention Concepts Report provides a visual summary of each student’s progress through the
stages and concepts of Intervention. A green icon means a student has mastered that concept. A
yellow icon means a student is working on the concept. A red icon indicates a student needs help with
the concept.
Click on the top arrow to expand or collapse all of the stages.
Click on an arrow to see the concepts.
Scroll over an icon to see more detail.
Chapter 12 | Reports

104
To expand a stage and view stage detail data:
l Click the arrow to the left of the stage you would like to expand or collapse.
To expand or collapse all stages:
l Click on the top most arrow to the left of the Stage column.
The table below provides an explanation for each of the columns from the Intervention Concepts
report:
Column Definition
StageThe scope and sequence of Intervention is organized into stages. The student’s progress is reported by stage. Each stage consists of a number of concepts. Click the arrow to the left of the stage to see each concept for that stage. Click the top most arrow to expand (and then collapse) all stages
Status
Indicates the current status of the student with the specific concept or stage
Not Started: The student has not worked on this concept or stage. The student will encounter this stage when the preceding stages have been mastered
Skipped: The student has skipped this concept because he or she is providing mostly correct answers and has mastered subsequent concepts that are more advanced than the skipped concept. It is not possible to skip stages. Only concepts can be skipped
Mastered: The student has mastered this concept or stage. Mastery generally means an 80% or better success rate with the concept
Working On: The student is currently working on this concept or stage and has not yet mastered it
Needs Help: The student has completed more than 250 problems for this concept and has not mastered it. The student likely needs additional instruction on this concept. If the student needs help on Stage 1 he or she may not have a sufficient foundation to use Intervention
Chapter 12 | Reports

105
Compare Students: Intervention AlertsThe Intervention Alerts Report summarizes all of the Dashboard Alerts for a group of students. The
group could be a class, grade, school or district. Alerts for Use, Progress, Help, Reading and Software
are displayed. The details column indicates how many students have the specific issue indicated by
the alert. Selecting the arrow in the left column expands the row and shows all of the students with
the issue.
Click on the top arrow to expand or collapse all of the Alert categories.
Click on an arrow to see the concepts.
To see a list of students for each alert category:
l Click on the arrow in the left column to expand the section.
The table below provides an explanation for each of the columns from the Intervention Alerts report:
Column Definition
Alert The Dashboard category
Details The number of students in the selected group that have an alert for the listed category
Chapter 12 | Reports

106
Compare Students: Intervention GraphThe Intervention Progress Graph illustrates the rate of progress for a group of students. You can use
this report to look at the progress over time for a specific class, grade, school or district. The line with
blue dots indicates the average Intervention Stage for the group on a specific date. The bars represent
the average weekly use for the group. Green bars indicate that the group achieved minimum use for
the week. Red indicates that less than the required minimum use was achieved.
The line graph tracks the stu-dent’s progress through the stages of the program.
Scroll over a dot to see more details for that session.
Green and red bars indicate the amount of use per week in minutes.
To view sessions for a specific date range:1 Click on the calendar icon next to the Create Report button.
2 Click on the left date window below the report selector pulldown at the top left of the screen.
3 Enter the start date or use the pop-up calendar to select the date.
4 Repeat for the end date using the right date window. Click OK.
5 Click Create Report.
To see more information on a specific session:
l Scroll over a dot on the graph. A pop-up window will appear with the session details for that
date.
Chapter 12 | Reports

107
Individual Student: Intervention StatusThe Intervention Status Report provides a detailed look at the progress through the stages and con-
cepts of Intervention for a specific student. For each stage and concept the report reveals what has
been mastered, what the student is still working on, and the concepts with which the student needs
help. The report also details how many problems the student has solved for a specific concept or
stage. The number of problems solved is an indicator of how much work a student needed to master a
specific concept.
Data is also provided regarding the average for the grade level of the student. The average for the
grade provides a reference point or peer group to compare the progress of the student. The percent-
age of students in the grade level of the student that have mastered the specific stage or concept is
also provided as another peer group comparison.
To expand a stage and view concept level data:
l Click the arrow to the left of the name of the stage you would like to expand.
To expand or collapse all stages:
l Click the top most arrow to the left of the Stage column.
To see more detail on a Fluency concept:
l Click the name of the Fluency concept (in blue type) and a Number Relationship report will appear for that concept.
Click on the top arrow to expand or collapse all of the stages.
Header provides summary and status informa-tion.
Click on an arrow for a stage to see more detail.
Column heading explanations are available by pressing help button.
Scroll over a data field to get more detail.
Chapter 12 | Reports

108
Click on the stage arrow to expand
or collapse the stage.
Click on the fluency concept
name to see the Number
Relationships Report.
The table below provides an explanation for each of the columns from the Intervention Status Report:
Column Definition
Stage
The scope and sequence of Intervention is organized into stages. The student’s progress is reported by stage. Each stage consists of a number of concepts. Click the arrow to the left of the stage to see the student’s status with each concept for that stage. Click the top most arrow to expand (and then collapse) all stages
Example An example of the type of problem that can be found within this stage
Grade LevelEach stage and concept is given a grade level according to the guidelines found in the NCTM Curriculum Focal Points. Please note that many of the problems presented in Intervention take concepts to a deeper level than the typical math curriculum or framework
Status
Shows the percentage of students at this school in this student’s grade that have mastered the concept
Not Started: The student has not worked on this concept or stage. The student will encoun-ter this stage when the preceding stages have been mastered
Skipped: The student has skipped this concept because he or she is providing mostly correct answers and has mastered subsequent concepts that are more advanced than the skipped concept. It is not possible to skip stages. Only concepts can be skipped
Mastered: The student has mastered this concept or stage. Mastery generally means an 80% or better success rate with the concept
Working On: The student is currently working on this concept or stage and has not yet mastered it
Needs Help: The student has completed more than 250 problems for this concept and has not mastered it. The student likely needs additional instruction on this concept. If the student needs help on Stage 1 he or she may not have a sufficient foundation to use Intervention
Problems SolvedThe number of problems a student has solved for this concept or stage. The number of problems solved indicates how much work a student had to complete in order to master a concept
Grade Average - Mastery
The percentage of students in the same grade that have mastered this concept or stage. This only includes students from the same school, in the same grade, that have been enrolled in the Intervention program
Grade Average - Problems Solved
The average number of problems solved for students in the same grade that have mas-tered this concept or stage. A student who has mastered a concept with fewer problems solved than the grade average is progressing faster than his or her peers. A student who is working on a concept or has mastered a concept with more problems solved than the grade average is progressing slower than his or her peers
Chapter 12 | Reports

109
Individual Student: Daily ProgressThe Intervention Daily Progress Report provides a detailed summary of each session a student has
used Intervention. The report displays the session date, length of the session in minutes, and the
concepts with which the student worked. For each concept the student worked on the number of
problems is reported for that session as well as the overall number of problems solved from all ses-
sions for that concept.
The arrow next to the stage label can be selected to collapse the details for each session. This will
then provide you with a condensed list of the session dates and durations for the specific student.
Click on the top arrow to expand or collapse all of the sessions.
Date selection windows to define date range.
Click on an arrow for a session to collapse or expand it.
Column heading explanations are available by pressing help button.
Scroll over a data field to get more detail.
To view sessions for a specific date range:1 Click on the calendar icon next to the Create Report button.
2 Click on the left date window below the report selector pulldown at the top left of the screen.
3 Enter the start date or use the pop-up calendar to select the date.
4 Repeat for the end date using the right date window.
5 Click Create Report.
To expand a session and view session level data:
l Click the arrow to the left of the date of the session you would like to expand or collapse.
To expand or collapse all sessions:
l Click on the top most arrow to the left of the Stage column.
Chapter 12 | Reports

110
The table below provides an explanation for each of the columns from the
Intervention Daily Progress report:
Column Definition
Stage
The scope and sequence of Intervention is organized into stages. The student’s progress is reported by stage. Each stage consists of a number of concepts. Click the arrow to the left of the stage to see the student’s status with each concept for that stage. Click the top most arrow to expand (and then collapse) all stages
Date The date the session took place and the length of the session in minutes
Example An example of the type of problem that can be found within this stage
Grade LevelEach stage and concept is given a grade level according to the guidelines found in the NCTM Curriculum Focal Points. Please note that many of the problems presented in Intervention take concepts to a deeper level than the typical math curriculum or framework
Status
Shows the percentage of students at this school in this student’s grade that have mastered the concept
Not Started: The student has not worked on this concept or stage. The student will encounter this stage when the preceding stages have been mastered
Skipped: The student has skipped this concept because he or she is providing mostly correct answers and has mastered subsequent concepts that are more advanced than the skipped concept. It is not possible to skip stages. Only concepts can be skipped
Mastered: The student has mastered this concept or stage. Mastery generally means an 80% or better success rate with the concept
Working On: The student is currently working on this concept or stage and has not yet mastered it
Needs Help: The student has completed more than 250 problems for this concept and has not mastered it. The student likely needs additional instruction on this concept. If the student needs help on Stage 1 he or she may not have a sufficient foundation to use Intervention
Problems Solved - Session The number of problems a student has solved for this concept during this session
Problems Solved - Overall
The number of problems a student has solved for the concept in all Intervention sessions to date
Chapter 12 | Reports

111
Individual Student: Intervention FluencyThe Intervention Fluency Report displays the students’ progress with Intervention
mastery round activities. These are timed activities where the student must
answer the number sentence correctly in five seconds or less in order to demon-
strate mastery. Only the stages displayed within this report have mastery rounds
that require students to answer correctly within five seconds or less, therefore
you will not find all 17 stages represented in the report. Number relationship
fluency data is available for addition, subtraction, multiplication, division, and
fractions problems. Stages that do not require fluency for mastery are those
focused on place value and multi-digit addition and subtraction.
Click on the top arrow to expand or collapse all of the stages.
Click on the stage arrow to expand or collapse the stage.
Scroll over a number relationship to get more detail.
To expand a stage and view stage detail data:
l Click the arrow to the left of the date of the session you would like to expand or collapse.
To expand or collapse all stages:
l Click on the top most arrow to the left of the Stage column.
Chapter 12 | Reports

112
Click on the stage arrow to expand or collapse the stage.
Scroll over a number relation-ship to get more detail.
The table below provides an explanation for each of the columns from the
Intervention Fluency report:
Column Definition
Stage
The scope and sequence of Intervention is organized into stages. The student’s progress is reported by stage. Each stage consists of a number of concepts. Click the arrow to the left of the stage to see the student’s status with each concept for that stage. Click the top most arrow to expand (and then collapse) all stages
Status
Indicates the current status of the student with the specific number relationship
Not Started/Skipped: The student has not worked on this number relationship. A student skips number relationships when he or she demonstrates consistent mastery of number relationships that are of greater difficulty
Mastered: The student has mastered this number relationship. Mastery generally means 80% or better success rate with a number relationship
Working On: The student is currently working towards mastery on this number relationship
Needs Help: The student has completed more than 250 problems for the group of number relationships without mastery. This number relationship has a high number of repetitions without mastery. The student likely needs additional instruction on this concept. If the student needs help on Stage 2 number relationships he or she may not be able to work fast enough to solve Intervention fluency problems
Chapter 12 | Reports

113
Individual Student: Intervention Progress Graph
The Intervention Progress Graph illustrates the rate of student progress over
time. A steep upward line moving from left to right indicates quick progress
through the stages of the program. The vertical axis represents the stages of the
program. The horizontal axis represents calendar time.
To view sessions for a specific date range:1 Click on the calendar icon next to the Create Report button.
2 Click on the left date window below the report selector pulldown at the top left of the screen.
3 Enter the start date or use the pop-up calendar to select the date.
4 Repeat for the end date using the right date window.
5 Click Create Report.
To see more information on a specific session:
l Scroll over a dot on the graph. A pop-up window will appear with the session details for that date.
The line graph tracks the student’s progress through the stages of the program.
Green and red bars indicate the amount of use per week in minutes.
Chapter 12 | Reports

114
Staff Access
There are five different levels of access available to perform administrative functions within the Sym-
phony Math Administration Panel. Each level of access has a varying degree of ability to view reports
and manage student accounts, classes, and licenses.
l District Administrative: The District Administrator can manage all student, teacher, class,
and administrator accounts, and access can distribute licenses among campuses within the
district and import external lists of students to create accounts. The District Administrator
is usually the technical administrator for the district, the person who is responsible for the
installation, setup, and maintenance of Symphony Math throughout the district.
l District Read Only: The District Read Only Administrator has read-only access at the district
level. This person can run reports of all students and classes within the district, but cannot
create or delete accounts or manage licenses. This person is usually a Title One director,
curriculum coordinator, or math coach for the district.
l School Administrative: The School Administrator can manage all student, teacher, class,
and administrator accounts within the school and can import external lists to create ac-
counts. This is the highest level of access within a school. Typically this is the person who is
responsible for the installation, setup, and maintenance of Symphony Math at your school.
Every school account must have at least one School Administrator.
l School Read Only: The School Curriculum Administrator can access reports for all students
and classes within the school but cannot create or delete accounts. This person is usually
the principal, curriculum director or math coordinator for the school.
l Class Access: Teachers can access their own classes and students and can generate
reports. Teacher accounts have the ability to create student accounts and enroll students into their classes. Teachers may not delete student accounts but can remove students from
their classes.
managing user accounts13

115
Tab
Function
District Admin
District Read Only
School Admin
School Read Only
Class Access
District Modify Settings a
Schools Create School Accounts a
Distribute Licenses a
Modify School Settings a a
Students View All Student Ac-counts a a
View My Student Ac-counts a
Create Student Accounts a a a
Delete Student Accounts a a
Promote Students to Next Grade a a
Modify Student Accounts a a
Modify My Student Accounts a
Classes View Classes a a a a a
Create Classes a a a a a
Modify Classes a a a
Modify My Classes a
Delete Classes a a a a
Staff View Staff Accounts a a a
Create Staff Accounts a a a
Modify Staff Accounts Properties a a a
Delete Staff Accounts a a
Reports Access Reports for All Students a a a a
Access Reports for My Students a a a a a
Import Import Students a a
Support Access Support Features a a a a a
Chapter 13 | Managing User Accounts

116
Managing School Accounts Within a DistrictIf your district has purchased the Symphony Math District Administration Panel, you have the capa-
bility to create school accounts and distribute licenses in addition to all of the other administrative
features of Symphony Math. Your Symphony Math welcome email will indicate whether you have a
district account or a school account.
Available Licenses Will be used by schools on a first come basis.
To create a School Account:1 Use your account number, username, and password to sign in to the Symphony Administra-
tion Panel at www.symphonymath.com. You must have District Administrative access to create school accounts.
2 Click the Schools tab from the online Administration Panel.
3 Click Add School. The School Properties window appears.
4 Enter the required information.
5 Click Save Changes.
To modify a School Account:1 Use your account number, username, and password to sign in to the Symphony Administra-
tion Panel at www.symphonymath.com. You must have District Administrative access to modify school accounts.
2 Click the Schools tab from the online Administration Panel.
3 Click the name of the school you would like to modify. The School Properties window ap-pears.
4 Enter your changes.
5 Click Save Changes.
Chapter 13 | Managing User Accounts

117
!
To modify the number of concurrent user licenses at each school:1 Use your account number, username, and password to sign in to the Symphony Administra-
tion Panel at www.symphonymath.com. You must have District Administrative access to modify the number of concurrent user licenses at each school.
2 Click the Schools tab from the online Administration Panel.
3 Enter the number of concurrent users to the left of each school name.
4 Click Save Changes.
The unassigned licenses listed in the available row will be automatically used by the first school that runs over their assigned amount. If all of the licenses are left in the available row they will be used by each student in the district on a first come first serve basis. To ensure that a specific school will have at least a certain number of licenses you can allocate a specific number for that school.
Creating Staff Accounts
District Administrative account:
l A District Administrative staff account is created by Symphony Learning. The school account number, username, and password will be sent from Symphony Learning in a welcome email. If you have not received the welcome email please contact Symphony Learning Technical Support at 800-234-3030 ext. 2 or [email protected]
To create a Staff Account:1 Use the District Administrative account number, username, and password to sign in to the
Symphony Administration Panel at www.symphonymath.com.
2 Click the Staff tab from the online Administration Panel.
3 Click Add Staff. The Staff Properties window appears.
4 Enter the required information.
5 Choose the administrative access level.
6 Click Save Changes.
Chapter 13 | Managing User Accounts

118
!
To delete a Staff Account:1 Use your Administrative account number, username, and password to sign in to the Sym-
phony Administration Panel at www.symphonymath.com.
2 Click the Staff tab from the online Administration Panel.
3 Click the check box next to the staff member you would like to delete.
4 Click Delete.
Every school account must have at least one staff member with administrative access.
To modify a Staff Account:1 Use your Administrative account number, username, and password to sign in to the Sym-
phony Administration Panel at www.symphonymath.com.
2 Click the Staff tab from the online Administration Panel.
3 Click the name of the staff member you would like to modify. The Staff Properties window appears.
4 Enter the your changes.
5 Click Save Changes.
Managing Student Accounts
To create student accounts:1 Click the Students tab from the online Administration Panel.
2 Click Add Student.
3 Enter the student information. Only the first name, username, and password fields are required.
4 Click Save Changes.
5 You will be returned to the list of student names where you can see the new student account.
Chapter 13 | Managing User Accounts

119
To modify a Student Account:1 Click the Students tab from the online Administration Panel.
2 Click the name of the student you would like to modify. The Teacher Properties window ap-pears.
3 Enter the your changes.
4 Click Save Changes.
To change the Screener Availability:
l Choose Active to make the Screener active for this student. The Screener will be given the first that the student logs in after the beginning of each of the fall, winter, and spring testing windows.
l Choose Inactive to disable the Screener for this student. No testing will be given.
To change the Benchmarker Availability:
l Choose Active to make the Benchmarker active for this student. The Benchmarker will be given the first that the student logs in after the beginning of each of the fall, winter, and spring testing windows.
Customize Settings for the Symphony Math
Intervention.
Set Availablility of Screener and Benchmarker tools.
Enter student information in these fields. Fields* are required.
Chapter 13 | Managing User Accounts

120
l Choose Active only if At-Risk or Borderline to give the Benchmarker to this student only if they are judged At-Risk or Borderline by the Screener during the current testing window.
l Choose Inactive to disable the Benchmarker for this student. No testing will be given.
To change the Benchmarker Administration settings::
l Choose Integrated with Screener to give the Benchmarker and Screener during the same administration for this student. This can save time, and student’s Benchmarker results will be used for both the Screener and Benchmarker reports.
l Choose Next login after Screener to administer the Screener and Benchmarker as separate test administrations during the current testing window.
To change the program narration language setting:
l When creating a new student, click the Narration pulldown to choose another language.
l Click on the name of an existing student to see the Student Settings, then click Narration pulldown to change the language setting.
To enable student rankings:
l Select the ‘show student rank’ check box to allow students to see their worldwide ranking in
the Symphony Math Program.
To change the session time limit:
l When creating a new student, enter your desired time limit in the Session Time Limit box. If you do not want a time limit on your students’ sessions, select the No Time Limit radio button.
l Click on the name of an existing student to see the Student Settings, then enter your desired time limit in the Session Time Limit box. If you do not want a time limit on your students’
sessions select the No Time Limit radio button.
To change the Mastery Round timing:
l When creating a new student, click the ‘Add to time limit of each number fact’, and type a number of seconds from 1 to 99.
To modify which Stages are available:
l When creating a new student, select the Scope & Sequence button. Select the stages you want this student to see in Symphony Math.
l Click on the name of an existing student to see the Student Settings, then select the Scope & Sequence button to select the Stages available to the student.
To delete student accounts:1 Click the Students tab from the online Administration Panel.
2 Click the check box next to the student name you would like to delete.
3 Click Delete.
Chapter 13 | Managing User Accounts

121
To recover deleted student accounts:1 Click the Students button.
2 From the More Actions pull down select “Recover Deleted Students”.
3 Click the checkbox next to the name of the student(s) you would like to recover.
4 Click the “Recover Deleted Students” button at the bottom right.
Chapter 13 | Managing User Accounts

122
Managing Classes
To create your class:1 Click the Class tab from the online Administration Panel.
2 Click Add Class.
3 Enter the class name.
4 Select a teacher.
5 Click Save Changes.
6 You will be returned to the list of class names where you can see the new class account.
To enroll your students in your class:1 Click the Class tab from the online Administration Panel.
2 Click on the name of the class you in which you want to enroll your students.
3 Select student names to add to the class.
4 Click Add.
5 Click Save Changes.
Chapter 13 | Managing User Accounts

123
Enter name of the class you are creating.
Select the teacher for this class.
Select a student name to add to the class roster. Command click to select mul-tiple names.
To modify a Class:1 Click the Class tab from the online Administration Panel.
2 Click the name of the Class you would like to modify. The Class Proper-ties window appears.
3 Enter the your changes.
4 Click Save Changes.
To modify the properties for all students in a class:1 Click the Class tab from the online Administration Panel.
2 Click the name of the Class you would like to modify. The Class Proper-ties window appears.
3 Click the Change Settings for Entire Class button. The Student Proper-ties window appears.
4 Enter your changes.
5 Click Save Changes.
To delete Classes:1 Click the Classes tab from the online Administration Panel.
2 Click the check box next to the class name you would like to delete.
3 Click Delete.
Chapter 13 | Managing User Accounts

124
Introduction
The Symphony Math Intervention program offers advanced settings to modify the display settings,
video, or sound drivers and to provide access to other controls.
Settings Panel
To access the Settings Panel:1 Launch the Symphony Math Intervention program from your desktop or dock. If the Sym-
phony Math icon is not visible locate it in your Program Files folder (Windows) or Applications folder (Mac).
2 Click on the Settings button at the top left of the signin screen.
Settings Button Click to access the Settings screen.
symphony math intervention advanced settings14
Chapter 14 | Symphony Math Intervention Advanced settings

125
Account Information
The signin screen will function differently depending on what type of account information is entered.
If a District Administrator enters the District Activation Code, the login screen will first ask students to
select their school, then their name. If the School Activation Code is entered, the login screen will only
display student names for that specific school.
Activation Codes can be found within the online Administration Panel. For school accounts, the
Activation Code is found by clicking the School tab. For district accounts, the district Activation Code is
displayed on the Schools tab, and individual school Activation Codes can be displayed by clicking on a
school name.
The signin process will function differently depending on what type of account information is entered
If a District Activation Code is entered, the login screen will first ask students to select their school,
then their name. If a School Activation Code, the login screen will only display student names for that
specific school.
To enter a new Activation Code:1 Click the Account icon.
2 Type an Activation Code.
3 Click Save.
Settings Icons Click on an icon to access settings.
Exit Button Click to quit the program.
Enter Activation Code.
Settings for Automatic Updates.
Run session in Demo Mode.
To modify Automatic Updates settings:
l Click the checkbox for “Download and Install Updates” to automatically check for updates at program launch and to download and install them when available.
Chapter 14 | Symphony Math Intervention Advanced settings

126
l Click the checkbox for “Download Beta Versions” to participate in the Symphony Math beta
program. When a beta version of Symphony Math Intervention is available it will be automati-
cally downloaded and installed.
To run Symphony Math in Demo Mode:
l Demo Mode enables you to view a specific stage, concept, or activity. No data is saved from using the program in Demo Mode. Demo Mode is used to access a specific type of problem for use on an interactive whiteboard in front of the whole class or in a one-to-one tutoring session.
l Click the Demo Mode button to begin. Click the Demo Control button to access the Demo Control.
Student Settings
To modify Student Password settings:
l Click the checkbox for “Password-Protect Program Exiting” to require the teacher or adminis-trator password in order to exit the program. This feature prevents students from exiting the Symphony Math program to access other programs or the internet.
l Click the checkbox for “Require Student Passwords at Signin” to require students to enter their password when they click on their name at the signin screen.
To modify the Signin style for students:1 Click the Students icon.
2 Click either List of Students or Username / Password.
Chapter 14 | Symphony Math Intervention Advanced settings

127
Network SettingsSymphony Math Intervention will attempt to use the default proxy settings for each computer on which
it is run. In some cases it may be necessary to provide custom settings.
To use a Proxy Server:1 Click the Network icon.
2 Click on the “Use Proxy Server” checkbox.
3 Enter Address, Port, UserName, and Password.
4 Click Save.
To require individual student usernames and passwords:
l Click the “Ask For Username/Password Each Use” checkbox. This feature is useful if your school has student-level security settings that allow internet access.
Graphics and Sound SettingsWhen the Fullscreen mode is on, Symphony Math Intervention resizes the desktop resolution to
match the program display size of 1024x768. When the Fullscreen mode is off, the program runs in a
window centered on the monitor, with the remainder of space blacked out.
To run the program in Fullscreen Mode:1 Click the Graphics / Sound icon.
2 Click the checkbox for “Run in Fullscreen Mode”.
Chapter 14 | Symphony Math Intervention Advanced settings

128
Intervention allows three levels of graphics quality. The Best and Better options run the Intervention
in a 1024x768 display window, with the Best option providing a little more quality on some Windows
machines with very modern video cards. The Good (Smaller Window) option runs Symphony Math
in an 800x600 window. This option is useful for netbooks or other computers that cannot run in
1024x768 resolution.
To modify the Graphics Quality:1 Click the Graphics / Sound icon.
2 Click the Graphics Quality pulldown menu to select an option.
3 Click Save.
The Symphony platform supports several 3D driver sets, including OpenGL (all platforms), DirectX7.0
(Windows only), and Software (all platforms). If you experience problems with program performance
(program crashes, mouse slowness, screen anomalies, etc.), follow the steps below.
To modify Video or Sound Drivers:1 Click the Graphics / Sound icon.
2 Select a different video and/or sound driver from the Video Driver or Sound Driver pulldown menu.
3 Click Save.
Chapter 14 | Symphony Math Intervention Advanced settings

129
Administration
The Symphony Administration Panel is available at www.symphonymath.com. The Administration tab
provides quick navigation to the Administration Panel.
To open the Administration Panel in your web browser from the Symphony Math program:1 Click the Administration icon.
2 Click Open Admin Panel.
Chapter 14 | Symphony Math Intervention Advanced settings

130
Symphony Math uses a hybrid architecture. Students use the Symphony Math Intervention program
itself, which is downloaded and installed. Teachers and administrators use an online Administration
Panel. Any technical issues you might encounter will most likely occur in the initial setup and configu-
ration of this system. This chapter is devoted to solutions to these issues.
Ensuring Student Access to the Symphony Web Servers
Symphony Math stores student data on secure internet servers. If your school has internet filtering
software that restricts access to internet sites, you will need to ensure that the Symphony data serv-
ers are allowed access to and from student workstations.
To allow student data to be sent to and from the Symphony Learning server, add these URLs to your
list of “acceptable” URLs:
http://www.symphonylearning.com/ (main web site, automatic downloads)
https://admin.symphonylearning.com/ (Program Communications)
https://assess.symphonylearning.com/ (Screener and Benchmarker)
https://adminpanel.symphonylearning.com (Adminstrative Panel)
https://pdf.symphonylearning.com/ (Reports/PDF server)
technical troubleshooting15
Chapter 15 | Technical Troubleshooting

131
Deciding Between Local and Network Installation
Symphony Math Intervention can be installed as a standalone program (on each student worksta-
tion) OR as a shared application on a network file server. Both methods have advantages, and your
installation type should be decided by choosing the method that works best for your technology and
implementation plan.
Standalone Installation Advantages Network Installation Advantages
Little impact on the school network traffic No disk space required at student workstations
Allows custom graphics settings at the workstation level Settings changes made to server install affect all users
Staff member can change settings without access to school server.
Program updates only need to be applied to the server, rather than to each workstation
To install Symphony Math Intervention as a standalone application on each workstation:
1 Log in to the workstation as an administrator or user that has permission to install programs.
2 Go to www.symphonymath.com.
3 Click the Download link.
4 Choose your operating system to download the program installer.
5 Follow the onscreen directions to install Symphony Math.
6 Run the program one time, and register the school account information.
To install Symphony Math on a network:First, follow the steps above to download, install, and configure Symphony Math on your network’s
server.
1 Copy the entire C:\Program Files\Symphony Learning\ folder to a network location. Macintosh OS X: copy the Symphony Math icon to a network location.
2 Ensure that the Symphony Learning folder gives students Read and Execute permissions. On Novell Servers, give students ‘Read and Filescan’ permissions.
3 Create a shortcut to the Symphony Math program from the Symphony Mathematics.exe icon (on Windows) or the Symphony Math icon (OS X).
4 Copy the shortcut to each workstation.
Chapter 15 | Technical Troubleshooting

132
Importing Students, Teachers, and Classes
The best way to add a large group of students to the Symphony Learning roster is through the Import
tab in the Symphony Administration Panel. This feature allows you to upload a formatted template that
contains information on students, teachers, and class assignments.
To import Students, Teachers, and Class information:1 Log in to your Symphony Administration Panel.
2 Click the Import tab.
3 Download the Import Template file, a comma-separated (CSV) file that contains the proper fields necessary for import.
4 Open the Import Template using a spreadsheet program such as Microsoft Excel. Add the information to the file. The first row of the Import Template file contains field headings. Your finished import template file MUST contain the same first line as shown below:
l If you choose to not include optional fields, leave them blank in the template.
l If you add information for the Teacher, Teacher Email, and Class Name fields, teachers and classes will automatically be created, and students will be enrolled in those classes. You must include information for all three fields.
5 Make sure you are logged in to the Symphony Administration Panel, and are at Step 3 of the Import tab. Click Browse, and a prompt will ask you to locate the Import File that you saved in Step 3. Note: In most cases, this file will be located on the Desktop, where most files are placed by default when downloaded, from Step 3.
6 Review the Import Information. If the information is correct, click Finish to complete the import. If the information is not correct, click Previous to return to the previous step.
Chapter 15 | Technical Troubleshooting

133
Student Data Import Formats
Header Data Type
Max Length Format Re-
quired? Comments
Account # Number 5 Numeric Yes Same Account # that is used to login to Administrative Panel
First Name String 32 Character Yes
Last Name String 32 Character No
MI String 1 Character No
Username String 64 Character or Numeric
• Must be unique for all students
• Using StudentID from Student Management System is recommended
Password String 32 Character or Numeric Yes • Can be the same for
multiple students
Grade String 2 Character or Numeric Yes PK, K, or 1 through 13
DOB Brith Date 10 mm/dd/yyyy No
Gender String 1 Character No See Table 2 for codes
Race String 1 Character No See Table 1 for codes
Language String 3 Character No See Table 3 for codes
Characteristics String 256 Characters NoSee Table 4 for codes - sepa-rate each code with a hyphen, e.g. “ESL-ADA”
Table 1: Ethnicity / Race
Code Ethnicity
I American Indian or Alaska Native
A Asian or Pacific Islander
B Black or African American
H Hispanic or Latino
C White
None Specified (blank)
Table 2: Gender
Code Gender
M Male
F Female
U Unassigned
Chapter 15 | Technical Troubleshooting

134
Table 3: Language
Code Ethnicity
ARA Arabic
CAN Chinese: Cantonese
MND Chinese: Mandarin
CHI Chinese: Unspecified
HMG Hmong
JPN Japanese
CAM Khmer
KOR Korean
POR Portuguese
RUS Russian
SCC Serbo-Croatian
SPA Spanish
ENG English
FRE French
GER German
GUJ Gujarti
CRP Haitian Creole
LAO Lao
MAY Malay
NAV Navajo
OTH Other
POL Polish
TAG Tagalong or Filipino
URD Urdu
VIE Vietnamese
Chapter 15 | Technical Troubleshooting

135
Table 4: Student Characteristics
Code Characteristic
ADA American with Disabilities (ADA)
AR At-Risk Students
BIL Bilingual Education
ESL English as a Second Language (ESL)
FL Free Lunch
GT Gifted/Talented
LD Learning Disabled
LEP Limited English Proficiency (LEP)
MG Migrant
NA Non-Resident Alien
PD Physically Disabled
RL Reduced-Price Lunch Program
SE Special Education
T1 Title I
CUS1 Custom Field 1
CUS2 Custom Field 2
CUS3 Custom Field 3
CUS4 Custom Field 4
Chapter 15 | Technical Troubleshooting

136
Fixing Program Slowness, Crashes, and Error Messages
Symphony Math Intervention uses a 3D rendering engine. The Symphony Math platform supports
several 3D driver sets, including OpenGL (all platforms), DirectX7.0 (Windows only), and Software
Rendering (all platforms). The program defaults may cause a conflict on certain workstations.
To switch the 3D driver, follow these steps:1 Start Symphony Math.
2 At the signin screen (list of names), click Settings in the upper left area of the screen.
3 Click the Graphics/Sound tab.
4 Choose the first available option from the Video Driver pull-down menu.
Choose a video driver to replace the program defaults.
Back Button
5 Go back to the signin screen by selecting the back button at the to left of the screen. Enter the program as a student and select any activity from the menu. If the problem is not resolved, repeat steps 2-4 with the other Video Drivers available in the list above.
If none of the drivers above produce desirable results, an updated driver may be necessary. A full
explanation and description of troubleshooting steps is available at the following address:
http://www.adobe.com/support/director/work_3d/optimizing_performance/optimizing_
performance04.html
Chapter 15 | Technical Troubleshooting
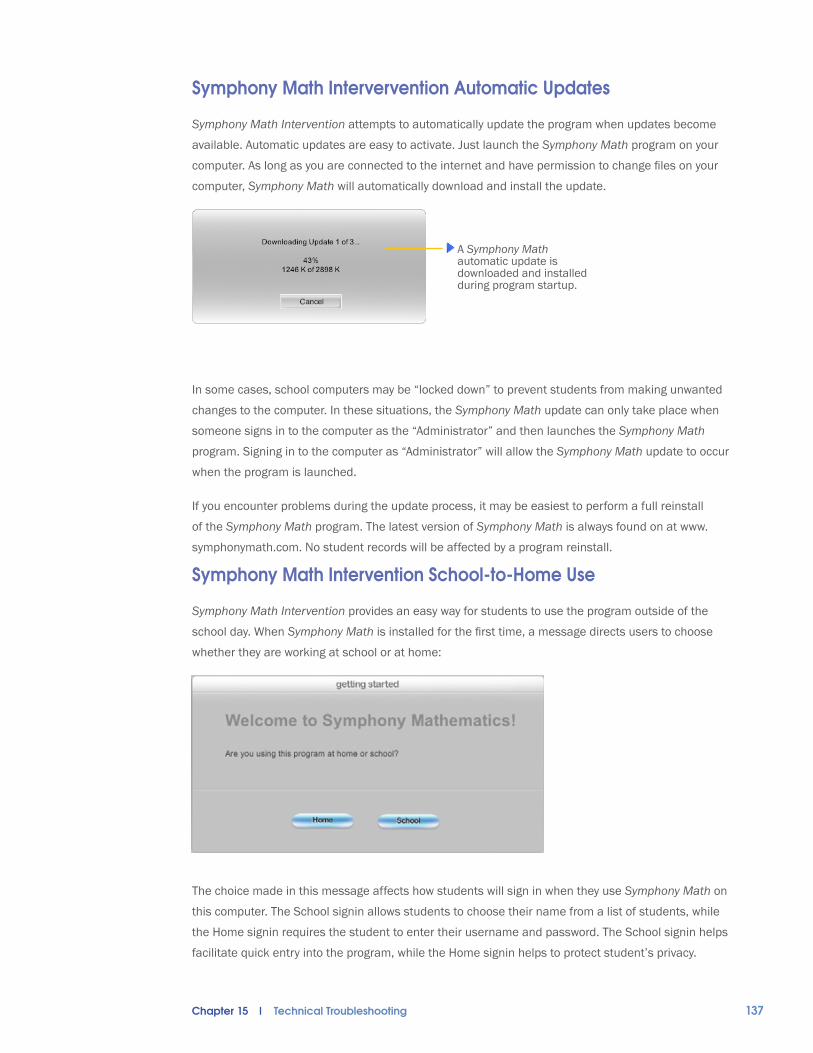
137
Symphony Math Intervervention Automatic Updates
Symphony Math Intervention attempts to automatically update the program when updates become
available. Automatic updates are easy to activate. Just launch the Symphony Math program on your
computer. As long as you are connected to the internet and have permission to change files on your
computer, Symphony Math will automatically download and install the update.
A Symphony Math automatic update is downloaded and installed during program startup.
In some cases, school computers may be “locked down” to prevent students from making unwanted
changes to the computer. In these situations, the Symphony Math update can only take place when
someone signs in to the computer as the “Administrator” and then launches the Symphony Math
program. Signing in to the computer as “Administrator” will allow the Symphony Math update to occur
when the program is launched.
If you encounter problems during the update process, it may be easiest to perform a full reinstall
of the Symphony Math program. The latest version of Symphony Math is always found on at www.
symphonymath.com. No student records will be affected by a program reinstall.
Symphony Math Intervention School-to-Home Use
Symphony Math Intervention provides an easy way for students to use the program outside of the
school day. When Symphony Math is installed for the first time, a message directs users to choose
whether they are working at school or at home:
The choice made in this message affects how students will sign in when they use Symphony Math on
this computer. The School signin allows students to choose their name from a list of students, while
the Home signin requires the student to enter their username and password. The School signin helps
facilitate quick entry into the program, while the Home signin helps to protect student’s privacy.
Chapter 15 | Technical Troubleshooting

138
School Signin Students choose their name from a list of students.
Home Signin Students type their username and password.
To help families get started in using Symphony Math Intervention at home, a School-to-Home template
is available in the Documentation section of the Symphony Math web site. This document can be
opened in Microsoft Word and filled out with the appropriate school and student information. When
filled out properly, this document will provide families the information they need to get started with the
program at home.
For EACH student who will receive the instructions, customize the School-to-Home template. DO NOT
PROVIDE YOUR OWN USERNAME AND PASSWORD. Instead, provide the student’s username and
password, which can be found on the Students tab in the Online Administration Module.
Symphony Learning does not provide phone or email tech support for home users. As the school
representative, you are responsible for helping your students with any issues in the installation and
use of Symphony Math at home. Please make sure to place your contact information at the top of the
School-to-Home template so that families have a way to address any issues in the setup and use of
Symphony Math at home.
Contacting Support
Please use the information below to contact Symphony Learning technical and product support:
Phone: 1 (800) 234-3030 ext. 2, 9 AM - 5 PM (EST)
Fax: 1 (800) 234-3030
Email: [email protected]
Please note that Symphony Learning does not provide phone or email tech support for home users.
Home users should contact your school for support with Symphony Math.
Chapter 15 | Technical Troubleshooting

139
The Symphony Administration Panel provides tools to quickly prepare your school or district adminis-
tration panel for the new school year. The instructions below are for schools and districts that used
Symphony Math in the previous school year.
We recommend that all students start Symphony Math over from the beginning after the summer va-
cation. If students have not used the program in the past four weeks it is best if they start again from
Stage 1. If they truly understand the concepts they worked through during the previous school year
they will move quickly through those stages. When they reach their challenge level they will automati-
cally shift to a slower branching mode.
Students who did not fully comprehend some concepts in Symphony Math will get the chance to work
through those concepts again by starting from the beginning. We have found that students who start
the program over from Stage 1 after a four week or longer vacation will ultimately progress faster than
students who pickup where they left off.
preparing for a new school year16
Chapter 16 | Preparing For A New School Year

140
Option 1: Delete All Students and Re-Import School Roster1 Log in to your Administration Panel as the Account Administrator.
2 Remove all students from the Roster.
a Click the ‘Students’ button.
b Click the top checkbox to select all students.
c Click the ‘Delete’ button
3 Import a new Student Roster using the ‘Import’ button. See Chapter 3 for more information.
Option 2: Update the Existing School Roster1 Log in to your Administration Panel as the Account Administrator.
2 Remove all students from their assigned classes:
a Click the ‘Classes’ button.
b Click the top checkbox, which will select all classes.
c Select ‘Remove Enrollment’ from the ‘More Actions:’ dropdown menu.
3 Delete unwanted student accounts from the ‘Students’ button.
a Click the ‘Students’ button.
b Click the checkbox next to each student that has left the school or who will no longer be using Symphony Math.
c Click the ‘Delete’ button.
Chapter 16 | Preparing For A New School Year

141
4 Promote all students to the next grade:
a Click the ‘Students’ button.
b Click the top checkbox, which will select all students.
c Select ‘Promote to Next Grade’ from the ‘More Actions:’ dropdown menu.
5 Reset all student progress
a Click the ‘Students’ button.
b Click the top checkbox, which will select all students.
c Select ‘Reset Student Progress’ from the ‘More Actions:’ dropdown menu.
6 Add new students individually from the ‘Students’ button or in a group from the ‘Import’ button. See chapter 3 for more information on creating new student accounts.
7 Enroll students in classes by using the ‘Classes’ button. See chapter 3 for more information.
Chapter 16 | Preparing For A New School Year

142
Assessment
Q Where does Benchmarker tell me how a student did on each CCSS cluster or concept?
A Benchmarker is not a diagnostic assessment. It only provides a benchmark measure of overall
mathematics learning against the Common Core State Standards. More detailed performance data is
available on a concept-by-concept basis for students using the Symphony Math Intervention.
Q Why can’t we see the percent of problems answered correctly on the assessment reports?
A The Symphony Math assessments are Computer Adaptive Tests. This means that they do not deter-
mine mathematics learning levels based on a percentage of problems answered correctly as might be
done on an end of chapter test in the classroom. Computer Adaptive Tests determine learning levels
based on the difficulty level of problems that a student can reliably answer. Its possible that two grade
three students both answered 70% of the problems they solved on a Benchmarker assessment. How-
ever, one student answered mostly first and second grade problems while the other student answered
mostly third and fourth grade items. In this way the percent correct can be misleading, as it does not
account for the level of difficulty of the problems that were answered at a rate of 70% correct.
Q Are the assessments timed?
A The assessments are not timed. Students may have as much time as necessary to complete an
assessment. Occasionally there are specific assessment problems that are timed. These are designed
frequently asked questions17
Chapter 17 | Frequently Asked Questions

143
to measure CCSS fluency standards. Students are prompted with an announcement that for the next
problem they must answer as quickly as they can.
Q Can we give the assessments more often than three times a year?
A No. Presently there are only enough assessment problems in the program to allow for three annual
administrations.
Q Are the assessments suitable for young students who have never used a computer or a mouse
before?
A A Symphony Math assessment should not be the first time a student has used a computer before.
Students must have some basic experience with the computer-mouse user interface. The challenge is
that some students arrive in kindergarten competent in clicking and dragging and responding to the
computer interface while other students have never used a computer. This must be a local determina-
tion.
During the field-testing of the Symphony assessments we determined that PK and K students, on
average, are capable of effectively interacting with the assessments. But there was considerable
variability. If this is a concern we recommend skipping the fall assessment and making the winter
assessment the first for K students.
Any computer-based assessment results must take into consideration if the student was comfortable
with the interface just as we might investigate whether a young student was comfortable using a
pencil or speaking with a diagnostician in other math assessment formats.
Q The Benchmarker report says that one of my students has a percentile rank score of 54. What does
that mean?
A The percentile rank and grade level equivalent scores compare the assessed student to a nationally
representative sample of students of the same grade. A student who received a percentile rank score
of 54 performed better than 53 percent of the students in this sample.
Q One of my students was not feeling well during a Benchmarker session. I don’t think the results are
valid. What should I do?
A You may delete invalid tests from the student settings screen of the online administration panel. The
system will behave as if the assessment was never taken and the student may be assessed again.
Q How do I know the Symphony assessments are valid?
A We established the validity of the Symphony assessments in several ways. First, the problems were
written in alignment with the Common Core State Standards. Thus, Symphony assessments address-
es standards that students currently see on state tests, as well as topics that students will encounter
in later years when CCSS computer-based state assessments are implemented. Second, we correlat-
Chapter 17 | Frequently Asked Questions

144
ed the performance of students from New York and Illinois on the Symphony assessments with their
scores on their respective state’s mathematics tests. In both cases, we found excellent correlations,
thus validating the content and the scoring of the Symphony assessments. Finally, the construction of
the Symphony assessments is supervised by professional psychometricians with extensive experience
in commercial and state-level testing. In-depth research was performed into the quality of the test as
a whole, as well as that of the individual questions. We recently reported some of the findings at the
International Association for Computerized Adaptive Testing (IACAT).
Q How did you norm the assessments?
A The Symphony assessments were constructed and validated using students from all over the United
States. To obtain national norms, the Symphony scores of samples of New York and Illinois students
were equated to the National Assessment of Educational Progress (NAEP), using the New York and
Illinois state tests as a bridge. These states were selected because their state performance on NAEP
is very similar to the national average. Having this bridge allows us to express students’ performance
on Symphony mathematics in terms of national percentiles.
Using Symphony Math Intervention
Q I see that the topics taught in Symphony Math Intervention fall mostly within our kindergarten
through grade four curriculum. However, some of the problems look very challenging and the
concepts are taught to a deep level. Is it appropriate to use the program with older students who do
not have a solid math foundation?
A Yes, Symphony Math Intervention may be used with older students. The program is designed with an
age neutral interface that does not use cute cartoon characters or childish themes that make older
students feel the program is inappropriate. Symphony Math Intervention addresses fundamental
math skills that struggling students need to master in order for mathematics to be meaningful. The
program has been used with middle-school and high-school students in remedial settings.
Q For how long and how often do you recommend that a student use Symphony Math?
A We recommend 15- to 20-minute sessions three to five times a week. We recommend that students
not be permitted to use the program more than 30 minutes in any one day.
Q I see that Symphony Math uses number bars. Why not use a different color for each number bar to
help students distinguish them?
A Our research led us to use the blue and yellow bars instead of having a different color for each bar for
two reasons. The first is that children who have color perception difficulties are not able to easily use
a program with 10 different colors on the computer screen. The second reason is that with bars that
have a unique color for each size bar, we found some students rely mostly on verbal memory of the
color relationships of the bar and do not consider the length of the bars.
Chapter 17 | Frequently Asked Questions

145
For example, some students memorize the color combinations, so that when you ask them to find two
bars that equal ten, they know that yellow plus yellow equals orange, but they may not understand
why. The length of each bar is the important mathematical property to which the student needs to at-
tend. We find that with the Symphony number bars students are more focused on the relative lengths
of the bars and thus focused on the key variable of quantity.
Q I find it interesting that you do not have any counting chips, or dots in your program to help students
count their way through the numbers. Why is this?
A One of the key developmental barriers Symphony Math is designed to help students overcome is the
transition from solving math problems by counting-on, to solving math problems by number concep-
tualization. Most students first solve 5+3 by counting “1, 2, 3, 4, 5 . . .” and then counting on three
more, “6, 7, 8.” Subtraction is handled in a similar way by counting down. This is an inefficient and
unreliable strategy for older students, though it is an important developmental accomplishment in
kindergarten. Unfortunately, the sight of third and fifth graders still counting up and counting down
is too prevalent and poses a major barrier to their advancement in math. Number bars are one of
the few concrete representations (or manipulatives) that help students develop number conceptu-
alization. The number bars provide a model to students that five is “five.” Five is not “1, 2, 3, 4, 5”.
Three is “three.” Five plus three is eight. It is not “1, 2, 3, 4, 5 . . . 6, 7, 8.” The counting chips and
other discontinuous representations reinforce the counting strategy. The number bars introduce and
reinforce the number conceptualization strategy which is more efficient and helpful for effective math
learning in the higher grades, especially with fractions.
Q Why don’t the bars have lines marking off each unit?
A We could put lines on the bars that would indicate each unit of the bar. The seven bar could have
equally spaced lines along the bar that divide it into seven equal sections. Similarly, we could have
added lines to the three bar to divide it into three equal sections. To solve the problem 3+7 the
student would only need to count the 10 sections on the two bars to arrive at the answer. While this is
an effective and important strategy at an early stage in math learning, Symphony Math is designed to
help students move beyond the counting strategy to number conceptualization. With Symphony Bars,
the student combines the three and the seven bars and then finds the bar that is the same length.
The students see qualitatively that three and seven equal ten without relying exclusively on counting
strategies.
Q Do we have to use number bars in our classroom?
A Symphony Learning does not sell hands on versions of the blue and yellow numbers bars. It is not
required for students to practice with blue and yellow bars in the classroom in order to progress with
the program. We do recommend that students use a wide variety of concrete representations in their
core curriculum.
Chapter 17 | Frequently Asked Questions

146
Q I noticed the program only uses number bars. Why not use many different representations, such as
cubes, ten frames, counting chips, etc?
A We agree with math experts who advocate a math curriculum that is rich with multiple representa-
tions. Weights on a balance scale, a number line, and dominoes are all examples of powerful math-
ematical representations to help students understand math. Symphony Math is a complementary pro-
gram that offers an additional representation and is not intended to be the only representation used
in a comprehensive and rich math curriculum. Symphony Math allows students to see systematically
how one representation can be used for learning many concepts - such as addition, multiplication,
and fractions - with the same representation. By using the same representation for a variety of math
concepts, students can see a visual model that shows how these concepts are connected.
Q I noticed that Symphony Math does not have the usual cartoon characters, music, and narratives
that I have seen in other educational software. Won’t kids get bored without those cute multimedia
experiences?
A The Symphony Math philosophy is that children are innately curious about their world and if we design
a learning environment that presents mathematical concepts in an interesting and developmentally-
appropriate manner, they will be engaged by these patterns and relationships and will not need
unrelated stories, characters, or music to maintain their interest. We believe children are intrinsically
motivated to learn about math and Symphony Math is designed to tap into this capacity.
Q Why is the program called Symphony Math?
A A “symphony” is something characterized by a harmonious combination of elements. Commonly this
is associated with music. The integration of all of the different instruments in a symphony orchestra is
one example. In the name Symphony Math, the term refers to the goal of our design philosophy which
is to integrate a variety of teaching approaches and methods into one harmonious learning experi-
ence for each student. Some students need to explore concepts. Some need to work on mastering
number relationships. Others need to work on applying their conceptual knowledge. Symphony Math
is designed to evaluate a student’s needs and coordinate a variety of learning environments and
teaching strategies to provide an appropriate and enjoyable learning experience.
Q In other educational software programs our school has used, the instructions are more explicit and
even show the student exactly what to do or how to solve the problem. All the student has to do is
copy what they were shown. Why does Symphony Math not model and explain exactly what students
are supposed to do?
A One of the most important skills in math is problem solving. In order to be able to apply what they have
learned and to solve novel mathematical problems, students must develop the disposition of active
thinkers who identify problems and seek out their solutions. Many of the learning tasks in Symphony
Math are presented as puzzles that need to be “figured out.” Students find satisfaction in making these
connections without being told in advance exactly how to solve the puzzle. The program does provide
Chapter 17 | Frequently Asked Questions

147
scaffolding in the form of instructional feedback when errors are made and in the form of a Help Button
that can be selected for a clue that will lead the student a step closer to the answer.
Q Why doesn’t Symphony Math Intervention teach all of the different math strands and benchmarks
required by my state standards? Topics like time, money, and data do not seem to be taught in
depth in Symphony Math.
A The pedagogical premise of Symphony Math is that many students struggle with mathematics
because they do no have an in-depth understanding of the big ideas of mathematics (please see
Chapters 1 and 2). Symphony Math Intervention is designed to provide students with understanding
of the most important math concepts. Research has shown that an in-depth understanding of these
big ideas of math leads to improved performance on a variety of math topics. Your students should
continue to be taught all of the topics and benchmarks they are required to know. Concurrently they
can receive extra practice with Symphony Math on some of the most important and difficult-to-master
foundational concepts.
Q Why do you recommend that students restart the program after summer vacation or other breaks?
Won’t they have to repeat a lot of material they have already covered?
A We recommend that if a student has not used Symphony Math for four weeks or longer she start
the program from the beginning. Chapter 3 of this guide details how to reset students accounts. We
have found through our research that most students will progress more quickly overall if they start
Symphony Math from the beginning instead of continuing where they left off. If a student truly has
in-depth mastery of the concepts she worked on in Symphony Math the first time, then she will quickly
move through those concepts and return to her challenge level. However, if a student was merely
beginning to make important connections but did not develop in-depth mastery, those weaknesses
will be identified as she moves through the program a second time.
Symphony Math Intervention Installation & Setup
Q Is Symphony Math Intervention an Internet program?
A Symphony Math is a web-enabled application. The student software program is installed on the schools’ file servers or on each workstation. Teachers and administrators use a web browser to manage student accounts and review reports. Data from student use of the Symphony Math program is stored and main-tained on a secure server at Symphony Learning. All transactions during use of Symphony Math use SSL encryption to ensure the best available privacy of student records. Symphony Math is not recommended for sites that do not have reliable Internet access.
Q How much bandwidth does the Symphony Math Intervention program require?
A Each workstation that uses Symphony Math requires an active Internet connection (28 kbps or
better per workstation). Symphony Math requires about 100 Kilobytes (KB) of bandwidth for a typical
20-minute student session.
Chapter 17 | Frequently Asked Questions

148
Q How do I decide whether to install Symphony Math on each workstation or on the school file server?
A Symphony Math can be installed on each workstation or on a school file server. There are advantages
to each type of installation. Installing on each workstation requires very little resources from the
school network, and allows custom settings for each installation. Installation on the school file server
simplifies program updates and settings changes for all students. Your decision should be based on
the speed of the school network and the need for customized settings for individual machines.
Q Can my students use Symphony Math Intervention at home?
A Yes, your students can use Symphony Math Intervention at home. See Chapter 5 for more informa-
tion on installing Symphony Math at home.
Symphony Math Administration Panel
Q Why am I missing some features of the Administration Panel that I need, like deleting a student or
teacher?
A There are different levels of access available to perform administrative functions from the online
Administration Panel. Each level of access has a varying degree of ability to control students, classes,
and other functions. In order to delete students, you must login as a Symphony Math Account
Administrator. For a full description of the levels of administration access, please see Chapter 10 of
this guide.
Contacting Technical Support
Symphony Learning tech support is available to school staff.
Toll-free: (800) 234-3030 ext.2
Fax: (800) 234-3030
email: [email protected]
Chapter 17 | Frequently Asked Questions

149
Appendix A: Symphony Math Intervention Scope & Sequence
# Stage Concept Example
1a Number Sense Equal 3 = ?
1b Number Sense Greater 8 > ?
1c Number Sense Less 5 < ?
1d Number Sense Between 4 < ? < 9
1e Number Sense Missing Comparison 2 ? 5 ? 7
1f Number Sense Not equal 7 ≠ ?
2a Introduction to Addition & Subtrac-tion Introduction to Addition Fluency 1 + 2 = ?
2b Introduction to Addition & Subtrac-tion Introduction to Addition 2 + 1 = ?
2c Introduction to Addition & Subtrac-tion Introduction to Missing Addend Fluency 1 + ? = 3
2d Introduction to Addition & Subtrac-tion Introduction to Missing Addend 2 + ? = 3
2e Introduction to Addition & Subtrac-tion Introduction to Subtraction Fluency 3 - 2 = ?
2f Introduction to Addition & Subtrac-tion Introduction to Subtraction 3 - 1 = ?
2g Introduction to Addition & Subtrac-tion
Introduction to Missing Subtrahend Fluency 3 - ? = 2
2h Introduction to Addition & Subtrac-tion Introduction to Missing Subtrahend 3 - ? = 2
3a Ones, Tens & Hundreds Introduction to 1s 1 + 1 + 1 + 1 = 4
Appendices
Appendix | Overview of Symphony Math

150
# Stage Concept Example
3b Ones, Tens & Hundreds Compose 1s 4 + 5 = 9
3c Ones, Tens & Hundreds Decompose 1s ? + 5 = 9
3d Ones, Tens & Hundreds Comparing 1s 9 > 6
3e Ones, Tens & Hundreds Introduction to 10s 10 + 10 +10 + 10 = 40
3f Ones, Tens & Hundreds Compose 10s 40 + 50 = 90
3g Ones, Tens & Hundreds Decompose 10s ? + 50 = 90
3h Ones, Tens & Hundreds Comparing 10s 90 > 60
3i Ones, Tens & Hundreds Introduction to 100s 100 + 100 + 100 = 300
3j Ones, Tens & Hundreds Compose 1s/10s/100s 400 + 500 = 900
3k Ones, Tens & Hundreds Decompose 100s ? + 500 = 900
3l Ones, Tens & Hundreds Comparing 100s 900 > 600
4a Intermediate Addition & Subtraction Intermediate Addition Fluency 5 + 4 = ?
4b Intermediate Addition & Subtraction Intermediate Addition 5 + 6 = ?
4c Intermediate Addition & Subtraction Intermediate Missing Addend Fluency 5 + ? = 9
# Stage Concept Example
4d Intermediate Addition & Subtraction Intermediate Missing Addend 5 + ? = 11
4e Intermediate Addition & Subtraction Intermediate Missing Addends ? + ? = 11
4f Intermediate Addition & Subtraction Intermediate Subtraction Fluency 9 - 5 = ?
4g Intermediate Addition & Subtraction Intermediate Subtraction 11 - 5 = ?
4h Intermediate Addition & Subtraction Intermediate Missing Subtrahend 11 - ? = 6
4i Intermediate Addition & Subtraction
Intermediate Missing Subtrahend Fluency 9 - ? = 4
4j Intermediate Addition & Subtraction
Intermediate Missing Subtrahend And Minuend ? - ? = 6
5a Two-Digit & Three-Digit Numbers Composing Two-Digit Numbers 3 + 30 = ?
5b Two-Digit & Three-Digit Numbers Decomposing Two-Digit Numbers ? + 30 = 33
5c Two-Digit & Three-Digit Numbers Comparing Two-Digit Numbers 45 < ? < 60
5d Two-Digit & Three-Digit Numbers Composing Three-Digit Numbers 300+40+1=?
5e Two-Digit & Three-Digit Numbers Decomposing Three-Digit Numbers ? + 300 + 40 = 341
5f Two-Digit & Three-Digit Numbers Comparing Quantity W/ Three-Digit Numbers 542 > ? > 498
6a Advanced Addition & Subtraction Advanced Addition Fluency 8 + 5 = ?
6b Advanced Addition & Subtraction Advanced Addition 9 + 8 = ?
Appendix | Overview of Symphony Math

151
# Stage Concept Example
6c Advanced Addition & Subtraction Advanced Missing Addend 9 + ? = 17
6d Advanced Addition & Subtraction Advanced Missing Addend Fluency 8 + ? = 13
6e Advanced Addition & Subtraction Advanced Subtraction
6f Advanced Addition & Subtraction Advanced Subtraction Fluency 13 - 5 = ?
6g Advanced Addition & Subtraction Advanced Missing Subtrahend Fluency 13 - ? = 8
6h Advanced Addition & Subtraction Advanced Missing Subtrahend 17 - ? = 9
7a Adding & Subtracting One-Digit Numbers Adding One Digit Numbers 5 + 4 = ?
7b Adding & Subtracting One-Digit Numbers Missing Addend One Digit Numbers 5 + ? = 9
7c Adding & Subtracting One-Digit Numbers Subtracting One Digit Numbers 9 - 4 = ?
7d Adding & Subtracting One-Digit Numbers Missing Subtrahend One Digit Numbers 9 - ? = 5
7e Adding & Subtracting One-Digit Numbers
Adding One Digit Numbers With Regrouping 8 + 9 = ?
7f Adding & Subtracting One-Digit Numbers
Missing Addend One Digit Numbers With Regrouping 8 + ? = 17
7g Adding & Subtracting One-Digit Numbers
Subtracting One Digit Numbers With Regrouping 12 - 8 = ?
# Stage Concept Example
7h Adding & Subtracting One-Digit Numbers
Missing Subtrahend One Digit Numbers With Regrouping 12 - ? = 4
8a Introduction to Multiplication & Division Introduction to Multiplication 2 x 1 = ?
8b Introduction to Multiplication & Division Introduction to Multiplication Fluency 1 x 2 = ?
8c Introduction to Multiplication & Division Introduction to Missing Multiplier ? x 2 = 2
8d Introduction to Multiplication & Division
Introduction to Missing Multiplier Fluency ? x 1 = 2
8e Introduction to Multiplication & Division Introduction to Missing Multiplicand 2 x ? = 2
8f Introduction to Multiplication & Division Introduction to Division Fluency 2 ÷ 1 = ?
8g Introduction to Multiplication & Division Introduction to Division 2 ÷ 1 = ?
8h Introduction to Multiplication & Division
Introduction to Missing Dividend Fluency ? ÷ 1 = 2
Appendix | Overview of Symphony Math

152
# Stage Concept Example
8i Introduction to Multiplication & Division Introduction to Missing Dividend ? ÷ 1 = 2
8j Introduction to Multiplication & Division Introduction to Missing Divisor 2 ÷ ? = 2
9a Adding & Subtracting Two-Digit Numbers Adding Two-Digit Numbers 12 + 45 = ?
9b Adding & Subtracting Two-Digit Numbers Missing Addend Two-Digit Numbers 12 + ? = 57
9c Adding & Subtracting Two-Digit Numbers Subtracting Two-Digit Numbers 57 - 12 = ?
9d Adding & Subtracting Two-Digit Numbers Missing Subtrahend Two-Digit Numbers 57 - ? = 45
9e Adding & Subtracting Two-Digit Numbers
Adding Two-Digit Numbers With Regrouping 56 + 75 = ?
9f Adding & Subtracting Two-Digit Numbers
Missing Addend Two-Digit Numbers With Regrouping 56 + ? = 131
9g Adding & Subtracting Two-Digit Numbers
Subtracting Two-Digit Numbers With Regrouping 131 - 75 = ?
9h Adding & Subtracting Two-Digit Numbers
Missing Subtrahend Two-Digit Numbers With Regrouping 131 - ? = 56
10a Three Part Addition & Subtraction Three Part Addition 3 + 2 + 5 = ?
10b Three Part Addition & Subtraction 3-Part Addition Fluency 8 + 5 + 2 = ?
10c Three Part Addition & Subtraction Three Part Missing Addend 3 + 2 + ? = 5
10d Three Part Addition & Subtraction Missing Part Of Sum 2 + 3 = ? + 4
10e Three Part Addition & Subtraction Three Part Subtraction 10 - 3 - 2 = ?
10f Three Part Addition & Subtraction 3-Part Subtraction Fluency 13 - 5 - 2 = ?
# Stage Concept Example
10g Three Part Addition & Subtraction Three Part Missing Subtrahend 10 - 3 - ? = 5
11a Adding & Subtracting Three-Digit Numbers Adding Three Digit Numbers 342 + 237 = ?
11b Adding & Subtracting Three-Digit Numbers Missing Addend Three Digit Numbers 342 + ? = 579
11c Adding & Subtracting Three-Digit Numbers Subtracting Three Digit Numbers 579 - 237 = ?
11d Adding & Subtracting Three-Digit Numbers
Missing Subtrahend Three Digit Numbers 579 - ? = 342
11e Adding & Subtracting Three-Digit Numbers
Adding Three Digit Numbers With Regrouping 679 + 834 = ?
11f Adding & Subtracting Three-Digit Numbers
Missing Addend Three Digit Numbers With Regrouping 679 + ? = 1513
11g Adding & Subtracting Three-Digit Numbers
Subtracting Three Digit Numbers With Regrouping 1513 - 834 = ?
11h Adding & Subtracting Three-Digit Numbers
Missing Subtrahend Three Digit Numbers With Regrouping 1513 - ? = 679
12a Introduction to Fractions Unit Fractions: Missing Part 1/2 of 2 = ?
Appendix | Overview of Symphony Math

153
# Stage Concept Example
12b Introduction to Fractions Unit Fractions: Missing Whole 1/2 of ? = 1
12c Introduction to Fractions Fractions Fluency: Missing Part 1/2 of 2 = ?
12d Introduction to Fractions Unit Fractions: Missing Relationship ?/? of 2 = 1
12e Introduction to Fractions Non-Unit Fractions: Missing Part 2/3 of 3 = ?
12f Introduction to Fractions Non-Unit Fractions: Missing Whole 2/3 of ? = 2
12g Introduction to Fractions Non-Unit Fractions: Missing Relation-ship ?/? of 3 = 2
12h Introduction to Fractions Fractions Fluency: Missing Whole 1/2 of ? = 1
12i Introduction to Fractions Whole Fractions: Missing Part 4/4 of 4 = ?
12j Introduction to Fractions Whole Fractions: Missing Whole 4/4 of ? = 4
12k Introduction to Fractions Whole Fractions: Missing Relationship ?/? of 4 = 4
13a Stage 13: Intermediate Multiplica-tion & Division
Introduction to Missing Multiplier And Multiplicand ? x ? = 2
13b Stage 13: Intermediate Multiplica-tion & Division Intermediate Multiplication Fluency 9 x 3 = ?
13c Stage 13: Intermediate Multiplica-tion & Division Intermediate Multiplication 3 x 9 = ?
13d Stage 13: Intermediate Multiplica-tion & Division Intermediate Missing Multiplier Fluency ? x 3 = 27
13e Stage 13: Intermediate Multiplica-tion & Division Intermediate Missing Multiplier ? x 9 = 27
13f Stage 13: Intermediate Multiplica-tion & Division Intermediate Missing Multiplicand 3 x ? = 27
13g Stage 13: Intermediate Multiplica-tion & Division Intermediate Division Fluency 27 ÷ 3 = ?
13h Stage 13: Intermediate Multiplica-tion & Division Intermediate Division 27 ÷ 9 = ?
13i Stage 13: Intermediate Multiplica-tion & Division Intermediate Missing Dividend ? ÷ 9 = 3
# Stage Concept Example
13j Stage 13: Intermediate Multiplica-tion & Division Intermediate Missing Dividend Fluency ? ÷ 3 = 9
13k Stage 13: Intermediate Multiplica-tion & Division Intermediate Missing Divisor 27 ÷ ? = 3
13l Stage 13: Intermediate Multiplica-tion & Division
Intermediate Missing Divisor And Quotient 27 ÷ ? = ?
14a Unit Fractions Advanced Unit Fractions: Missing Part 1/2 of 4 = ?
14b Unit Fractions Advanced Unit Fractions Fluency: Missing Part 1/2 of 4 = ?
14c Unit Fractions Advanced Unit Fractions Fluency: Missing Whole 1/2 of ? = 2
14d Unit Fractions Advanced Unit Fractions: Missing Whole 1/2 of ? = 2
14e Unit Fractions Advanced Unit Fractions: Missing Relationship ?/? of 4 = 2
Appendix | Overview of Symphony Math

154
# Stage Concept Example
14f Unit Fractions Comparing Unit Fractions 1/2 > ? > 1/4
14g Unit Fractions Comparing Unit Fractions: Missing Comparison 1/2 ? 1/3
15a Non-Unit Fractions Advanced Non-Unit Fractions: Missing Part 2/3 of 9 = ?
15b Non-Unit Fractions Advanced Non-Unit Fractions Fluency: Missing Part 2/3 of 9 = ?
15c Non-Unit Fractions Advanced Non-Unit Fractions Fluency: Missing Whole 2/3 of ? = 6
15d Non-Unit Fractions Advanced Non-Unit Fractions: Missing Whole 2/3 of ? = 6
15e Non-Unit Fractions Advanced Non-Unit Fractions: Missing Relationship ?/? of 9 = 6
15f Non-Unit Fractions Comparing Non-Unit Fractions 3/3 < ? < 1/3
15g Non-Unit Fractions Comparing Non-Unit Fractions: Missing Comparison 2/3 ? 4/5
16a Not Greater & Not Less Not Greater Than 4 >/ ?
16b Not Greater & Not Less Not Less Than 4 </ ?
16c Not Greater & Not Less Negative Inequalities 4 </ ? </ 2
16d Not Greater & Not Less Missing Comparisons (Negation) 4 ? 6 ? 8
17a Improper Fractions Improper Fractions: Missing Part 3/2 of 4 = ?
17b Improper Fractions Improper Fractions Fluency: Missing Part 3/2 of 4 = ?
17c Improper Fractions Improper Fractions: Missing Whole 3/2 of ? = 6
17d Improper Fractions Improper Fractions Fluency: Missing Whole 3/2 of ? = 6
17e Improper Fractions Improper Fractions: Missing Relation-ship ?/? of 4 = 6
17f Improper Fractions Comparing Improper Fractions 3/2 < ? < 6/2
17g Improper Fractions Comparing Improper Fractions: Missing Operator 3/2 ? 5/3
Appendix | Overview of Symphony Math

155
Appendix B: Symphony Math Intervention Word List
addadded toadditionalreadyaltogetheramonganotherare leftareaarrowas manyas muchat the same timeavailableaway frombarbetweenbiggerblinking areaboth of thembring overbuildcannotclickcoincomes backcomparecompletecontinuecorrectcursordenominatordescribesdifferentdifferent sizedivided bydivided evenlydivisiondollardowndragdropearlyeighth
eleventhequalequallyequalsexchangefellfifthfindfirstfitfourthfractionfromgavegettinggivegreatergrewhalfhavehave leftheighthow manyhow muchhow oldhow tallhundredsin eachin order toincreaseintojust onelateleavesleftleft overlengthlesslonglooks the samematches withmeasuresminusminute
missingmoremovemultiplicationmust beneedneeds to beninthno possible solu-tionnotnot correctnot equalnothing left overnull buttonnumbernumber of partsnumber of timesnumbers 0-1999numeratorof theseolder thanone or more timesonesonly oneout ofpartpenniesplaceplace valuepluspointing downpointing uppoundput them togetherquantityreceiverepeatedsamesame lengthsame sizesavedsecondselect
separateseventhshareshorterside to sidesixthsize ofslidessmallersolutionsomespentsubtractsubtractionsymboltake awaytalltallerten plus chiptenstenththanthere arethere istheythirdthousandstimetoo bigtooktoptotaltry againtwelfthweighwholewideyears
Appendix | Overview of Symphony Math

156
Appendix C: Assessment Criteria and Specifications
The Symphony Math approach reflects best practices in developmental psychology and cognitive
science. Symphony Math stresses substantive and conceptual understanding, rather than rote
learning and memorization, so that students can advance quickly to sophisticated problem solving.
This approach is reinforced through use of a computer adaptive testing system (CAT) that dynamically
selects questions geared to each student’s level of knowledge and understanding of the material
(for overviews see e.g., Lange, 2007; Wainer, et al., 2000). The targeting of questions to the level of
individual students does away with the assumption that “one size fits all;” moreover, efficiency and
precision are improved as fewer questions are needed to obtain valid and reliable scores. In addition,
by omitting questions that are either too hard or too easy, Symphony Math encourages students to
experience testing as a meaningful activity, thereby boosting their motivation to excel. Symphony
Math further enhances student motivation by allowing partial credit on many questions, not merely
scoring answers as either correct or incorrect (for a discussion, see e.g., Bond and Fox, 2007).
Assessment Scores
For increased flexibility, student performance is quantified in three ways.
• Standard scores (SS) express performance as a number approximately between 0 and 1100 for students in kindergarten through grade 8. The SS define a “vertical scale,” meaning that all grades use the same metric and scores are not grade-specific. Thus, a high performing third grader may obtain a higher SS than does a struggling fourth grader. One beneficial property of Symphony Math standard scores is that score differences will have the same meaning across the entire scale. For instance, the standard scores 220 and 250 reflect the same difference in mathematics performance as do SSs of 640 and 670.
• Grade Equivalents (GE) re-express standard scores in terms of the grade, plus months of instruction within that grade, as measured against scores typical for students nationwide. GE are written as “year.months;” thus a student with GE = 7.2 has a SS that is typical for a student in Grade 7 who received two months of instruction in mathematics (typically in November). In this context, the terms “typical score” or “average score” refer to the median value, i.e., the point above and below which fall exactly 50% of all scores. GEs have the advantage of immediately showing students’ progress, or lack thereof. Nationwide, the aver-age seventh grader has GE = 7.9 at the end of the school year (i.e., in June) and if a seventh-grader obtained GE = 7.2 this would indicate a lack of progress. Of course, GE = 7.2 reflects advanced performance when obtained by, say, a sixth-grader in January (or any other month for that matter).
• Percentile Ranks (PR) express a student’s performance relative to that of other students in the same grade nationwide. For instance, a fourth grader whose performance exceeds that of 70% of all fourth graders nationwide is said to score at the 70th percentile. It is equivalent to saying that this student’s SS has a percentile rank of 70. Note that since fourth graders score higher on average than do third graders, a fourth grader scoring at the 70th percentile has a higher SS than does a third grader with a score whose PR is 70.
Appendix | Overview of Symphony Math

157
Test Development
Item Pool Development
Assessment items were created to measure progress against the Common Core State Standards
for Mathematics (see Common Core State Standards Initiative | Home. Web. 13 Feb. 2012. http://
www.corestandards.org/). Three test items were created for each standard from grade kindergarten
through eight. The three items for each standard were created at increasing difficulty levels, resulting
in an easy, medium and hard level for each CCSE standard. Additional items were created at the
pre-kindergarten level to support the assessment of kindergarten students with below grade-level
learning. This yielded a total item pool of 900 items. From concept through development of each test
question, Symphony Math reflects considerable in-house expertise, as well as that of masters and
doctoral level consultants in curriculum and technology design.
Item Types
The Common Core State Standards present some unique objectives, which in turn necessitated
the development of innovative item types. Specifically, the CCSS emphasize a deeper level of
understanding and add new skills such as fluency. In order to measure these stated learning goals,
we created a variety of item types that challenge students beyond the more superficial responses
required by multiple-choice only assessments. The table below details the different item types used by
the Symphony Screener and Benchmarker.
Item Type Definition
Multiple Choice Select answer from two or four choices.
Fill in the Box Select answer that completes empty box in equation or sentence.
Match Match 3 or 4 answer choices with corresponding targets.
Multiple Correct Select 2-5 correct answers out of a total of 6 answer choices.
Short Answer Use numeric keypad to enter numeric response.
Fluency Answer under time constraint.
Create a Line or Point on a GridPlace a point on a number line or coordinate grid. Draw a line on a coordinate grid
In addition to the item types detailed above, students are also given virtual tools to use in solving
problems. For example, in some items students must use an on screen ruler or protractor to measure
lengths and angles.
Pilot Testing
The questions on Symphony Math all survived rigorous pilot testing in agreement with the
requirement outlined in the standards for educational and psychological testing provided by the
American Educational Research Association. A series of pilot studies were performed using data of
over 29,000 students from 9 states, including California, Connecticut, Florida, Illinois, Massachusetts,
New York, Rhode Island, Tennessee, and Texas. Throughout these studies, Rasch measurement (see
e.g., Bond and Fox, 2007; Custer, Omar, and Pomplun, 2006; Jungnam, et al., 2009) was used to
Appendix | Overview of Symphony Math
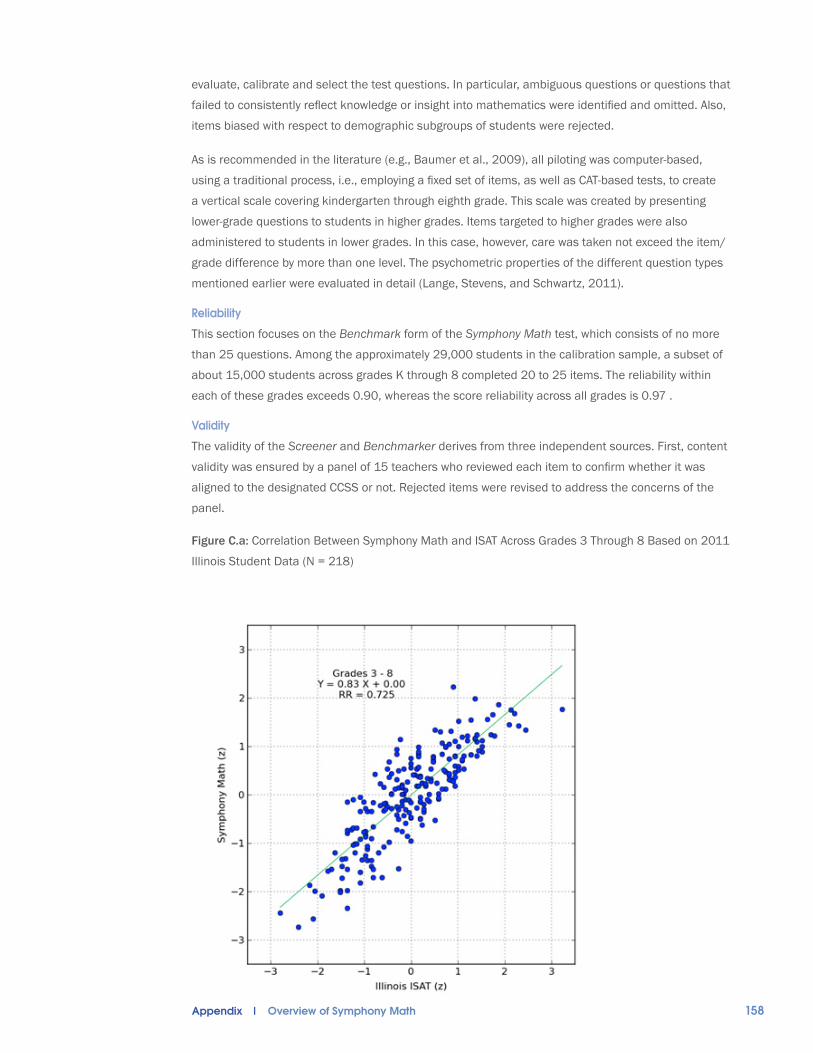
158
evaluate, calibrate and select the test questions. In particular, ambiguous questions or questions that
failed to consistently reflect knowledge or insight into mathematics were identified and omitted. Also,
items biased with respect to demographic subgroups of students were rejected.
As is recommended in the literature (e.g., Baumer et al., 2009), all piloting was computer-based,
using a traditional process, i.e., employing a fixed set of items, as well as CAT-based tests, to create
a vertical scale covering kindergarten through eighth grade. This scale was created by presenting
lower-grade questions to students in higher grades. Items targeted to higher grades were also
administered to students in lower grades. In this case, however, care was taken not exceed the item/
grade difference by more than one level. The psychometric properties of the different question types
mentioned earlier were evaluated in detail (Lange, Stevens, and Schwartz, 2011).
Reliability
This section focuses on the Benchmark form of the Symphony Math test, which consists of no more
than 25 questions. Among the approximately 29,000 students in the calibration sample, a subset of
about 15,000 students across grades K through 8 completed 20 to 25 items. The reliability within
each of these grades exceeds 0.90, whereas the score reliability across all grades is 0.97 .
Validity
The validity of the Screener and Benchmarker derives from three independent sources. First, content
validity was ensured by a panel of 15 teachers who reviewed each item to confirm whether it was
aligned to the designated CCSS or not. Rejected items were revised to address the concerns of the
panel.
Figure C.a: Correlation Between Symphony Math and ISAT Across Grades 3 Through 8 Based on 2011
Illinois Student Data (N = 218)
Appendix | Overview of Symphony Math

159
Second, the test validity of Symphony Math is addressed through the use of Rasch scaling (Bond and
Fox, 2007; Lange, 2007). Valid measurement requires that all items should form a single difficulty
hierarchy; this was enforced through item selection and rewriting. Moreover, the item hierarchy was
constructed to be invariant across subgroups, thereby ensuring a uniform score interpretation and an
absence of bias. To be included in the final pool, items had to demonstrate an absence of bias, i.e.,
questions were rejected when equally proficient members of different student groups (boys vs. girls,
or white vs. black vs. Hispanic students, etc.) had unequal chances of answering questions correctly.
Third, it was possible to study convergent validity by comparing some students’ Symphony Math
scores to scores obtained on another widely accepted mathematics test. Illinois students in grades
3 through 8 are required to take the vertically scaled ISAT test (see, http://www.isbe.state.il.us/
assessment/isat.htm), which includes a shortened form of Pearson’s nationally normed SAT-10.
Mathematics sub scores on the ISAT were available for 218 students who also completed a pilot form
of Symphony Math. As is illustrated in Figure C.a, the correlation between Symphony Math (Y-axis)
and the ISAT (X-axis) scores was 0.83, which explains about 73% of the variance. (Note: In the figure
the test results are expressed as z-scores). The high level of agreement with students’ scores on an
established test of mathematical achievement strongly supports the validity of Symphony Math.
National Norms
National norms were computed for Symphony Math in Grades 4 and 8 based on a two-step process
linking it to established assessments.
1. Symphony Math to New York Mathematics Assessment. In 2011, a sample of 279 students completed the New York Mathematics Assessment as well as the Symphony Math test. Again supporting convergent validity, the correlation between these two sets of tests scores was 0.78. Using equipercentile equating, Symphony standard scores could thus be expressed on the same scale as the New York Mathematics Assessment.
2. New York Mathematics to NAEP. New York’s mathematics performance in grades 4 and 8 on the latest NAEP test (given in 2009) can be found via NAEP’s Data Explorer at http://nces.ed.gov/nationsreportcard/naepdata/. This site provides means as well as the 10th, 25th, 50th, 75th, and 90th score percentiles nationwide, as well as for each of the 50 states. Assuming normality, New York’s test results could thus be transformed into approximate NAEP scores.
Appendix | Overview of Symphony Math

160
Figure C.b: Symphony Math Standard scores in Grades 4 and 8 as a Function of Their Equated NAEP
scores.
Figure C.b shows the relation between six points in the estimated NAEP and Symphony Math standard
scores: The mean (M), P10, P25, P50, P75, and P90. It can be seen that the least-squares regression
lines values fit very well, explaining over 99% of the variation among these statistics in the two tests.
Most importantly, the high end of the regression line for grade 4 nearly coincides with the lower
part of that for grade 8. In other words, the same basic linear relation is carried forward from grade
4 to grade 8. Hence, as is the case for temperatures measured in Celsius vs. degrees Fahrenheit,
Symphony Math and NAEP scores quantify the same concept, as either one is a linear transformation
of the other. Using this transformation, national percentiles can be computed for each Symphony
Math score. Note that Figure C.b also illustrates the overlap in performance of 4th and 8th graders.
In every aspect, and by every measure, Symphony Math proves an effective system of math assessment
and intervention for students from pre-k through 8th grade. Data supports the validity of Symphony
Math, showing it strongly correlated to NAEP and state tests like the ISAT. Analysis of scoring data also
proves Symphony Math a reliable, consistent assessment across demographic groups. Thus, Symphony
Math program provides school districts, schools, classroom teachers and resource professionals with
the means to not only efficiently assess and identify students at risk for math failure, but to track and
support efforts to bring students’ math proficiency in line their peer group.
Appendix | Overview of Symphony Math

161
References
American Educational Research Association, American Psychological Association, & National Council of Measurement in Education. (1999). Standards for educational and psychological testing. Washington, DC: AERA.
Baumer, M., Roded, K., & Gafni, N. (2009). Assessing the equivalence of Internet-based vs. paper-and-pencil psychometric tests. In D. J. Weiss (Ed.), Proceedings of the 2009 GMAC Conference on Comput-erized Adaptive Testing.
Bond, T. G., & Fox, Ch. M. (2007). Applying the Rasch model: Fundamental measurement in the human sciences (2nd ed.). London: LEA.
Custer, M., Omar, M.H., and Pomplun, M. (2006). Vertical Scaling with the Rasch Model Using Default and Tight convergence Settings with Winstepts and Bilog-MG. Applied Measurement in Education, 19, 133-149.
Jungnam, K., Lee, W-C, Kim, D-I, Kelly, K. (2009). Investigation of Vertical Scaling Using the Rasch Model. Paper presented at the annual meeting of the National Council on Measurement in Education. San Diego, CA.
Gorin, J. S., Dodd, B. G., J. Fitzpatrick, S. J., and Shieh , Y. Y. (2005). Computerized adaptive testing with the partial credit model: Estimation procedures, population distributions, and item pool characteris-tics. Applied Psychological Measurement, 29, 433-455.
Lange, R. (2007). Binary Items and Beyond: A Simulation of Computer Adaptive Testing Using the Rasch Partial Credit Model. In: Smith, E. and Smith, R. (Eds.) Rasch Measurement: Advanced and Specialized Applications. Pp. 148-180, Maple Grove, MN: JAM Press.
Lange, R., Stevens, D., and Schwarz, P. (2011). Some Surprising Dynamics of “Technology Enhanced” Item Types: Taking Additional Time is Associated with Increased Student Performance on Some Types of Items, while Decreasing Performance on Others. International Association for Computerized Adap-tive Testing Conference. Pacific Grove, California, October 3-5.
Loyd B. H., & Hoover, H.D. (1980). Vertical equating using the Rasch model. Journal of Educational Measurement, 17, 179-193.
Pomplun, M., Omar, H., & Custer, M. (2004). Comparison of WINSTEPS and BILOG-MG for vertical scaling with the Rasch model. Educational and Psychological Measurement, 64, 600-616.
Wainer, H., Dorans, N.J., Flaugher, R., Mislevy, R.J., Green, B.F., Steinberg, L., and Thissen, D. (2000). Com-puterized Adaptive Testing: A Primer (Second Edition). Hillsdale, NJ: Lawrence Erlbaum Associates.
Appendix | Overview of Symphony Math

162
Appendix D: Research Base
Adey, P., & Shayer, M. (1994). Really raising standards: Cognitive intervention and academic achievement. New York: Routledge.
Allsopp, D. H., Kyger, M. M., Lovin, L. H., (2007). Teaching Mathematics Meaningfully: Solutions for Reach-ing Struggling Learners. Baltimore: Paul H. Brookes Publishing Co.
Baumer, M., Roded, K., & Gafni, N. (2009). Assessing the equivalence of Internet-based vs. paper-and-pencil psychometric tests. In D. J. Weiss (Ed.), Proceedings of the 2009 GMAC Conference on Computer-ized Adaptive Testing.
Bond, T. G., & Fox, Ch. M. (2007). Applying the Rasch model: Fundamental measurement in the human sciences (2nd ed.). London: LEA.
Brown, A. L. (1990). Domain-Specific principles affect learning and transfer. Cognitive Science, 14, 107-133.
Case, R. (1991). The mind’s staircase: Exploring the conceptual underpinnings of children’s thought and knowledge. Hillsdale: Erlbaum.
Case, R. (1998). The development of conceptual structures. In D. Kuhn, & R. S. Siegler (Eds.), Cognition, perception, and language. (pp. 745-800). New York: John Wiley & Sons, Inc.
Case, R., & Okamoto, Y. (1996). The role of central conceptual structures in the development of children’s thought. Monographs of the Society for Research in Child Development, 61(1-2).
Chapin, S. H., Johnson, A., (2006). Math Matters: Understanding the Math You Teach. Sausalito: Math Solutions Publications.
Chapman, M., & McBride, M. L. (1992). Beyond competence and performance: Children’s class inclusion strategies, superordinate class cues, and verbal justifications. Developmental Psychology, 28, 319-327.
Clements, D. H. & Sarama, J., (2009). Learning and Teaching Early Math: The Learning Trajectories Ap-proach. NY: Routledge.Donovan, S., & Bransford, J. D. (2005). How students learn: Mathematics in the classroom. National Academies Press.
Csikszentmihalyi, M. (1991). Flow: The Psychology of Optimal Experience. NY: Harper Perennial.
Custer, M., Omar, M.H., and Pomplun, M. (2006). Vertical Scaling withthe Rasch Model Using Default and Tight convergence Settings with Winstepts and Bilog-MG. Applied Measurement in Education, 19, 133-149.
Feuerstein, R. (1980). Instrumental enrichment: An intervention program for cognitive modifiability. Baltimore: University Park Press.
Fischer, K. W. (1980). A theory of cognitive development: The control and construction of hierarchies of skills. Psychological Review, 87, 477-531.
Fischer, K. W., & Rose, L. T. (2001). Webs of skill: How students learn. Educational Leadership, 59(3), 6-12.
Fuchs, D., and L. S. Fuchs. 2005. Responsiveness-to-intervention: A blueprint for practitioners, policymakers, and parents. Teaching Exceptional Children 38(1): 57-61.
Appendix | Overview of Symphony Math

163
Furth, H. G. (1981). Piaget and knowledge: Theoretical foundations. University of Chicago Press.
Furth, H. G., & Wachs, H. (1974). Thinking goes to school: Piaget’s theory in practice. New York: Oxford University Press.
Gardner, H. (1993). Multiple intelligences: The theory in practice. New York: Basic Books.
Ginsburg, H. P. (n.d.). Mathematics learning disabilities: A view from developmental psychology.
Ginsburg, H. P., & Golbeck, S. L. (2004). Thoughts on the future of research on mathematics and science learning and education.
Ginsburg, H. P., & Pappas, S. (2004). SES, ethnic, and gender differences in young children’s informal addi-tion and subtraction: A clinical interview investigation.
Gorin, J. S., Dodd, B. G., J. Fitzpatrick, S. J., and Shieh , Y. Y. (2005). Computerized adaptive testing with the partial credit model: Estimation procedures, population distributions, and item pool characteristics. Applied Psychological Measurement, 29, 433-455.
Griffin, S. A., Case, R., & Capodilupo, S. (1995). Teaching for understanding: The importance of central conceptual structures in the elementary school mathematics curriculum. In A. McKeough, J. Lupart, & A. Marini (Eds.), Teaching for transfer: Fostering generalization in learning. Hillsdale, NJ: Erlbaum.
Griffin, S. A., Case, R., & Siegler, R. S. (1994). Rightstart: Providing the central conceptual prerequisites for first formal learning of arithmetic to students at risk for school failure. In K. McGilly (Ed.), Classroom lessons: Integrating cognitive theory and classroom practice. Cambridge: MIT Press.
Griffin, S., & Case, R. (1996). Evaluating the breadth and depth of training effects when central conceptu-al structures are taught. Monographs of the Society for Research in Child Development, 60(5/6), 83-101.
Hiebert, J. (1997). Making sense: Teaching and learning mathematics with understanding. Heinemann, 361 Hanover Street, Portsmouth, NH 03801-3912.
Hiebert, J., Carpenter, T. P., Fennema, E., Fuson, K. C., Wearne, D., Murray, H., Olivier, A., & Human, P. (1997). Making Sense: Teaching and Learning Mathematics with Understanding. Portsmouth, NH: Heinemann.
Jungnam, K., Lee, W-C, Kim, D-I, Kelly, K. (2009). Investigation of Vertical Scaling Using the Rasch Model. Paper presented at the annual meeting of the National Council on Measurement in Education. San Diego, CA.
Kamii, C. (1994). Young Children Continue to Reinvent Arithmetic: Implications of Piaget’s Theory. NY: Teach-ers College Press.
Kilpatrick, J., Swafford, J., & Findell, B. (2001). Adding it up: Helping children learn mathematics. Natl Academy Pr.
Lakoff, G., & Nunez, R., (2000). Where Mathematics Comes From: How the Embodied Mind Brings Math-ematics into Being. NY: Basic Books.
Lange, R. (2007). Binary Items and Beyond: A Simulation of Computer Adaptive Testing Using the Rasch Partial Credit Model. In: Smith, E. and Smith, R. (Eds.) Rasch Measurement: Advanced and Specialized Applications. Pp. 148-180, Maple Grove, MN: JAM Press.
Appendix | Overview of Symphony Math

164
Lange, R., Stevens, D., and Schwarz, P. (2011). Some Surprising Dynamics of “Technology Enhanced” Item Types: Taking Additional Time is Associated with Increased Student Performance on Some Types of Items, while Decreasing Per-formance on Others. International Association for Computerized Adap-tive Testing Conference. Pacific Grove, California, October 3-5.
Loyd B. H., & Hoover, H.D. (1980). Vertical equating using the Rasch model. Journal of Educational Measure-ment, 17, 179-193
Ma, L. (1999). Knowing and teaching elementary mathematics: Teachers’ understanding of fundamental mathematics in china and the united states. Lawrence Erlbaum Associates.
National Council of Teachers of Mathematics (2006). Curriculum focal points for prekindergarten through grade 8 mathematics. Reston, VA: The National Council of Teachers of Mathematics, Inc.
National Mathematics Advisory Panel. (n.d.). Foundations for success: The final report of the national mathematics advisory panel. Washington, DC: U.S. Department of Education.
National Research Council. (2001). Adding It Up: Helping Children Learn Mathematics. J. Kilpatrick, J. Swaf-ford, & B. Findell (Eds.), Washington, DC: National Academy Press.
Nunes, T. & Bryant, P., (1996). Children Doing Mathematics. Malden, MA: Blackwell Publishing.
Ogonosky, Andrea. 2008. The response to Intervention handbook: Moving from theory to practice. Austin, TX: Park Place Publications.
Piaget, J., & Brown, T. (1985). The equilibration of cognitive structures: The central problem of intellectual development. University of Chicago Press Chicago.
Piaget, J., & Szeminska, A. (1941). The child’s conception of number. London: Routledge & Kegan Paul.
Pomplun, M., Omar, H., & Custer, M. (2004). Comparison of WINSTEPS and BILOG-MG for vertical scaling with the Rasch model. Educational and Psychological Measurement, 64, 600-616.
RAND Mathematics Study Panel (2003). Mathematical profieciency for all students: Toward a strategic research program in mathematics education. Santa Monica, CA: RAND.
Schmidt, William H., Curtis C. McKnight, and Senta A. Raizen. A Splintered Vision: An Investigation of U.S. Science and Mathematics Education. Dordrecht, The Netherlands: Kluwer, 1997.
Sharma, M.C. (1987). How to take a child from concrete to abstract. Math Notebook, 5.
Sharma, M.C. (1988). Levels of knowing mathematics. Math Notebook, 6.
Sharma, M.C. (1993). Cuisenaire rods and mathematics teaching. Math Notebook, 10.
Stern, C., Stern, M. B. (1971). Children Discover Arithmetic; An Introduction to Structural Arithmetic. NY: Harper & Row Publishers.
Stevens, D. A. (1999). Transfer revisited: A critical review. Cambridge, MA.
Stevens, D. A. (2000). Piaget as a dynamic systems theorist. Thesis, Cambridge, MA: Harvard University.
Stigler, J. W., & Hiebert, J. (1999). The Teaching Gap: Best Ideas from the World’s Teachers for Improving Education in the Classroom. NY: Free Press.
Stigler, J. W., & Hiebert, J. (2009). The teaching gap: Best ideas from the world’s teachers for improving education in the classroom. Free Press.
Appendix | Overview of Symphony Math

165
van Geert, P. (1998). A dynamic systems model of basic developmental mechanisms: Piaget, vygotsky, and beyond. Psychological Review, 105, 634-677.
Wachs, H. (2000). Visual-Spatial thinking. In The interdisciplinary council on developmental and learning disorders: Clinical practice guidelines. (pp. 517-36). Bethesda, MD: ICDL Press.
Wainer, H., Dorans, N.J., Flaugher, R., Mislevy, R.J., Green, B.F., Steinberg, L., and Thissen, D. (2000). Computerized Adaptive Testing: A Primer (Second Edition). Hillsdale, NJ: Lawrence Erlbaum Associates.
Walle, J. A. (2007). Elementary and middle school mathematics: Teaching developmentally. New Jersey: Pearson Education Inc.
Appendix | Overview of Symphony Math