reports guide - symphony math
TRANSCRIPT

1Symphony Math | Reports Guide
Instant Access to Important Information.
The Dashboard is a formative assessment tool that provides you with the most important information about your
students’ use of Symphony Math®. In a glance, you can see the frequency of use, progress over time, and other
critical assessment factors.
Some questions that you can answer quickly by consulting the Dashboard:
l Are your students using Symphony Math® often enough?
l Are they making progress?
l Does anyone need your help with a specific concept?
l What percentage of your students have achieved mastery?
The Dashboard features three components:
l Gauges: The colored gauges provide a quick status update for all students.
l Overall Status: Provides summary statistics for your students’ use of Symphony Math®.
l Progress Graph: These graphs show the progress of each student relative to time invested in the program.
Dashboard

2 Symphony Math | Reports Guide
School Status Report
Essential Data Across Different Groups.
Summarize use and progress for multiple groups of students using Symphony Math®.
The School Status Report leverages two key bar graphs for each group:
l Green Student Use Bar: Indicates the percentage of students who have been using Symphony Math®
the minimum required amount (45 minutes per week).
l Blue Mastery Index Bar: Indicates the percentage of students who have achieved mastery of the program’s foundational math concepts.

3Symphony Math | Reports Guide
School Alerts Report
Easily See Alerts Across Different Groups.
Compare the number of Dashboard Alerts for different groups of students (i.e., classes, grades, or schools).
The School Alerts Report displays the percentage of students with alerts for Use, Progress, Help, Reading, and
Software. You also can click on a group name to see alert data for specific students.

4 Symphony Math | Reports Guide
Instantly Examine Progress for an Entire Group.
Look at progress over time for a specific class, grade, school, or district. The blue dotted line indicates the average
Symphony Math® stage for the group on a specific date.
The bars represent the average weekly use for the group.
l Green bars: Indicate that the group achieved the required minimum use.
l Red bars: Indicate that the group achieved less than the required minimum use.
Group Progress Graph
5Symphony Math | Reports Guide
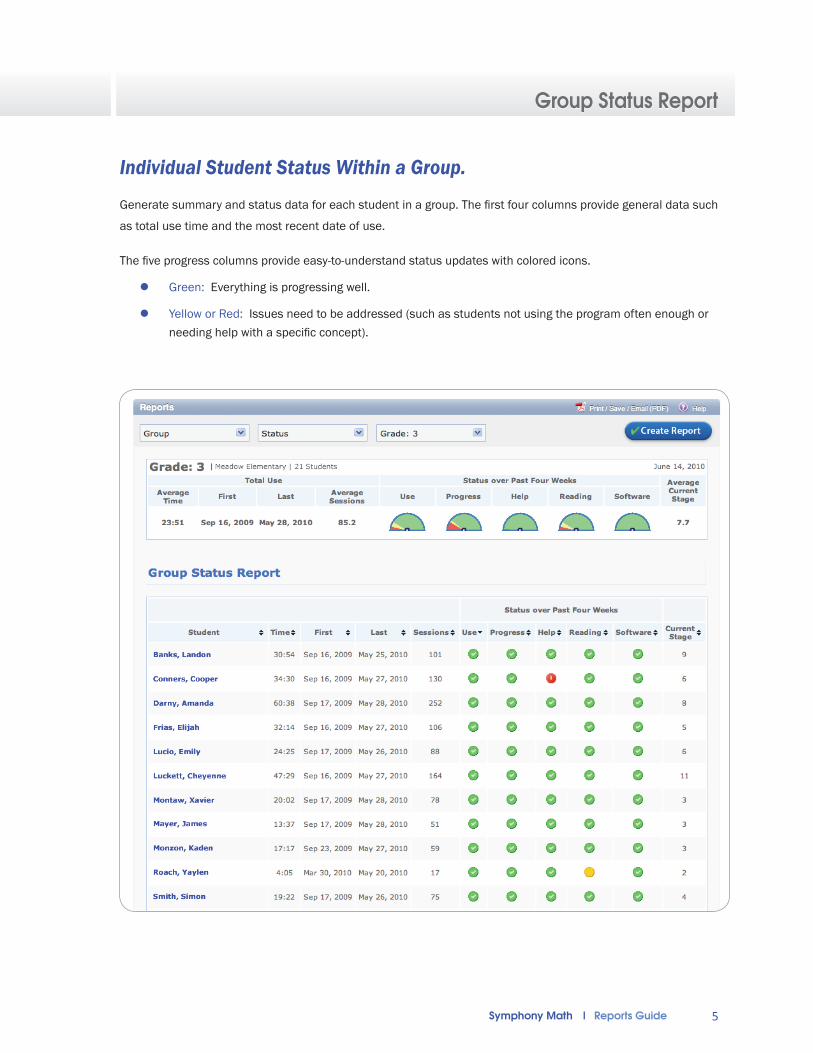
Group Status Report
Individual Student Status Within a Group.
Generate summary and status data for each student in a group. The first four columns provide general data such
as total use time and the most recent date of use.
The five progress columns provide easy-to-understand status updates with colored icons.
l Green: Everything is progressing well.
l Yellow or Red: Issues need to be addressed (such as students not using the program often enough or needing help with a specific concept).
6 Symphony Math | Reports Guide
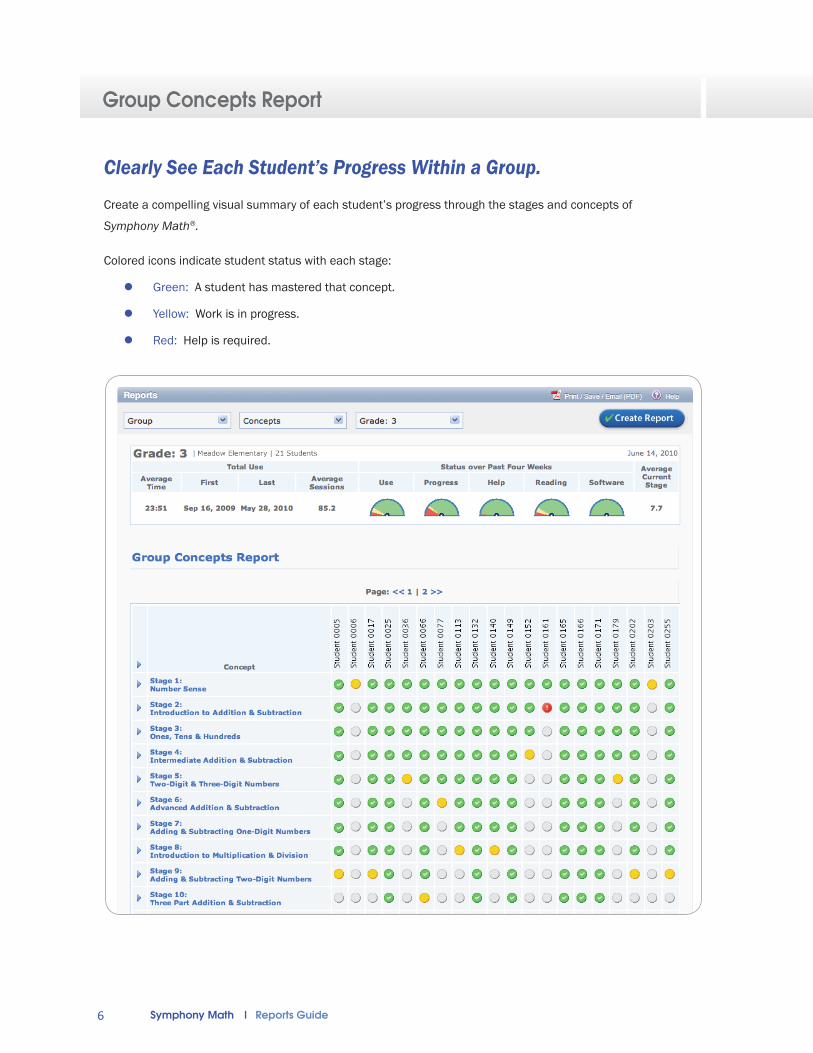
Clearly See Each Student’s Progress Within a Group.
Create a compelling visual summary of each student’s progress through the stages and concepts of
Symphony Math®.
Colored icons indicate student status with each stage:
l Green: A student has mastered that concept.
l Yellow: Work is in progress.
l Red: Help is required.
Group Concepts Report

7Symphony Math | Reports Guide
Group Alerts Report
Examine Alerts for an Entire Group.
Summarize all Dashboard Alerts for students in a specific group (i.e., a class, grade, school, or district).
You can display the number of students with alerts for Use, Progress, Help, Reading, and Software, as well as
expand rows to show each student within a category.

8 Symphony Math | Reports Guide
Student Progress Graph
A Quick Snapshot of Individual Student Progress.
Illustrate the rate of student progress over time.
The vertical axis represents the stages of the program, and the horizontal axis represents calendar time. A
steep upward line indicates quick progress through the program.
Red and green bars indicate the amount of average use per week:
l Green Bars: The minimum required use of 45 minutes per week was achieved.
l Red Bars: The minimum required use of 45 minutes per week was not achieved.

9Symphony Math | Reports Guide
Student Concepts Report
Insightful Details Made Immediately Available.
Get details for a specific student’s progress.
For each concept, this report reveals how many problems have been solved, what has been mastered, what the
student is still working on, and where help is required. For example, the number of problems solved indicates how
much work was needed to master a specific concept.

10 Symphony Math | Reports Guide
Student Daily Progress Report
Up-to-Date, Daily Information.
Get a detailed summary of each session.
The Student Daily Progress Report displays the session date, length of the session in minutes, and the concepts
involved. The number of problems is reported for each concept session as well as for all sessions in total.

11Symphony Math | Reports Guide
Student Number Relationships Report
See Progress with Fluency.
In the Mastery Round activities, the student must answer the number sentence correctly in a timed environ-
ment in order to demonstrate mastery.
The Student Number Relationships Report shows a students’ status with every number relationship in the
program.

12 Symphony Math | Reports Guide
Student Home Report
Keep Parents Involved in their Child’s Education.
Rather than comparing students to peers via charts that may be difficult for parents to follow, this simple and
easy-to-understand report provides insights into a child’s individual progression and fosters open communication
between home and school. Teachers can generate this report and hand or email a PDF copy to parents.