the social implications of sugar: living costs, real
TRANSCRIPT

NBER WORKING PAPER SERIES
THE SOCIAL IMPLICATIONS OF SUGAR:LIVING COSTS, REAL INCOMES AND INEQUALITY IN JAMAICA C1774
Trevor BurnardLaura Panza
Jeffrey G. Williamson
Working Paper 23897http://www.nber.org/papers/w23897
NATIONAL BUREAU OF ECONOMIC RESEARCH1050 Massachusetts Avenue
Cambridge, MA 02138October 2017
The views expressed herein are those of the authors and do not necessarily reflect the views of the National Bureau of Economic Research.
NBER working papers are circulated for discussion and comment purposes. They have not been peer-reviewed or been subject to the review by the NBER Board of Directors that accompanies official NBER publications.
© 2017 by Trevor Burnard, Laura Panza, and Jeffrey G. Williamson. All rights reserved. Short sections of text, not to exceed two paragraphs, may be quoted without explicit permission provided that full credit, including © notice, is given to the source.
The Social Implications of Sugar: Living Costs, Real Incomes and Inequality in Jamaica c1774 Trevor Burnard, Laura Panza, and Jeffrey G. WilliamsonNBER Working Paper No. 23897October 2017JEL No. N16,N36,O54
ABSTRACT
This paper provides the first quantitative assessment of Jamaican standards of living and income inequality around 1774. To this purpose we compute welfare ratios for a range of occupations and build a social table. We find that the slave colony had extremely high living costs, which rose steeply during the American War of Independence, and low standards of living, particularly for its enslaved population. Our results also show that due to its extreme poverty surrounding extreme wealth Jamaica was the most unequal place in the pre-modern world. Furthermore, all of these characteristics applied to the free population alone.
Trevor BurnardDepartment of HistoryUniversity of MelbourneMelbourne, [email protected]
Laura PanzaDepartment of EconomicsUniversity of MelbourneMelbourne, [email protected]
Jeffrey G. Williamson350 South Hamilton Street #1002Madison, WI 53703and Harvard University and CEPRand also [email protected]
2
1. Britain’s Richest Colony? The Issues
The income and wealth of colonial Jamaica around the time of the American
Revolution has been a topic of historiographical interest since a pioneering work by Richard
Sheridan appeared which estimated that Jamaican wealth around 1774 was extremely high,
even by British standards (Sheridan, 1965).1 Sheridan’s work seemed to confirm the famous
thesis put forward by Eric Williams (1944) that the wealth of the British West Indies was
fundamental in financing British industrialisation during the second half of the eighteenth
century. William’s work also played a central role in debates about the value of the British
West Indies to the British Empire.2 By so doing, it helped explain why, during the period of
the American Revolution, a few extremely rich Jamaican planters could persuade the British
government to see Jamaica as the one colony whose loss they could not afford, both with
respect to the money it brought to Britain and also to its geopolitical importance as an island
in the middle of the French and Spanish Empires (Marshall 2005, 363-4). Indeed, Lord North,
Prime minister during Britain’s war with the Thirteen Colonies, used to quip that Jamaican
planters were the only masters he had to bow down before. Some of Jamaica’s planters, like
William Beckford (1709-1770), an extremely influential Lord Mayor of London and close
1 Sheridan’s article provoked a response by R. P. Thomas (1968), in which the latter claimed that Jamaica was a
net drain on rather than a net gain to the British economy, and a rejoinder by Sheridan (1968) refuted those
claims.
2 The debate over the Williams’ thesis has produced a voluminous literature. At the turn of this century it
seemed that the consensus was that the contribution of West Indian wealth to British industrialization was of
marginal importance (Eltis and Engerman, 2000). Williams’ contention that the West Indies were pivotal to
British industrialization have made a comeback since then (see Inikori, 2002) and Beckert, 2014). Recently
Burnard (2018) has argued that Eltis and Engerman were closer to the truth than the more recent enthusiasts for
the Williams position. For a balanced view of the Jamaican economy before and after the abolition of the slave
trade, see Reid (2016).

3
associate of William Pitt, were reputed to be among the richest and most powerful men in
Britain. Sir Simon Taylor (1740-1813), Beckford’s successor as the wealthiest Jamaican
planter, enjoyed a princely income of £47,000 per annum near his death. This figure was five
to eight times higher than the average British aristocrat and the same as the legendary income
that Robert Clive of India was reputed to have made in 1760 (Petley, 2009).
Scholars appear to agree that the income of Jamaica immediately before the American
Revolution was so substantial that it made the colony the jewel in the British Crown.
Jamaica was an extraordinarily rich place then and remained so despite some significant
economic reverses during the War for American Independence. It also provided some free
white inhabitants generous living standards that were above comparable occupations and
social classes in Britain. By 1774, Jamaican performance had confirmed Patrick Browne’s
boast that Jamaica was “the richest … colony at this time under the government of Great
Britain.” It was an island, he declared, that surpassed “all the other English sugar-colonies,
both in quantity of land and the conveniencies of life.” It was “so advantageously situated, in
regard to the main continent, that it has for years been looked upon, as a magazine for all the
neighboring settlements in America” and “the quantity or value of its productions, the number
of men and ships employed in its trade [and] the quantity of valuable commodities imported
there from various parts of Europe” (Browne 1756, p. 9).
Not all observers glowed over Jamaica’s wealth. Others saw instead its poverty, low
living standards for both slaves and poorer free people, and its immense inequality, best
illustrated by Benjamin Franklin’s remarks in his pioneering Observations on the Increase of
Mankind (1750/1961). Franklin claimed that colonial North Americans enjoyed a standard of
living superior to any other people in the world, although he confined himself to white
people, not to African-Americans or Native Americans. With a land-abundant frontier before
them, young Americans could establish economic independence earlier and get married

4
sooner than Europeans, produce larger families and through their demand for imported
consumer goods advance commercial development in the Atlantic economy. Franklin’s
arguments about relatively high living standards for the ordinary man in colonial North
America and its egalitarianism have been confirmed by recent scholarship. Peter Lindert and
Jeffrey Williamson (2016) have shown that the standard of living for ordinary white
Americans in the Thirteen Colonies (that became in 1783 the United States of America) was
remarkably high and egalitarian. 3 The gap between rich and poor was small by contemporary
standards and abundant land, cheap foodstuffs, fuel, lighting and homespuns meant that even
white Americans in the lowest income deciles lived relatively comfortable lives.
Furthermore, poverty and poor relief was much less common than in other societies while
rates of taxation were relatively low (Franklin 1750 in Labaree et al. 1961, 225-34;
Rabushka, 2008, 729-30).
Franklin also initiated a debate that became increasingly intense as abolitionism
began to take hold in the United States and Britain: that slavery was not a source of imperial
economic strength but rather one of imperial weakness. His text contained, inter alia, an
attack on West Indian slavery. His main argument was that while slavery provided profits in
the short-run, it was much less profitable in the long run, at least in the West Indies where
plantation owners drove their slaves exceptionally hard and where the slave system was only
maintained by additional imports of captive Africans every year by an increasingly efficient
Atlantic slave trade. Franklin argued that the promotion of slavery in America and the West
Indies diverted resources from sustainable long term development in a society where all
participated relatively equally.
This essay provides new evidence that supports Franklin’s argument. Specifically, we
provide data used to analyse the cost of living facing ordinary free whites, the cost of slave
3 It was even higher than Britain when America’s slaves are included (Lindert and Williamson 2016, Chp. 2).
5
provisions, standards of living for slaves, free common labor and artisans, and inequality
across all social groups during the years of the American Revolution.4 We argue that Jamaica
was a poor colony in the sense that, while average incomes were certainly high, incomes
were distributed so unequally that the vast majority of all Jamaicans – all blacks, free or
slave, and a large share of whites – did not share any of those riches. Compared with British
North America, Jamaica was an extremely poor place for the vast majority, with levels of
poverty that were well above what was normal in either Britain or British North America,
including the slave societies of the American South. Unlike British North America, which
was largely self-sufficient in food, drink, fuel, lighting and most incidentals, Jamaica had to
import much of its foodstuffs from abroad so that its productive land could be more
effectively devoted to growing tropical crops for export, especially sugar. Thus, Jamaica was
an extremely expensive place to live, especially before transport revolutions of the nineteenth
century lowered greatly the cost of moving commodities long distances, and especially
during imperial conflicts that cut off trade with the mainland and elsewhere, notably during
the American Revolution before France’s entry into the war in 1778 (Carrington, 2002).
It was also a colony marked by extraordinary degrees of income inequality, not just
between free and enslaved but even within the free population. As Franklin argued, the riches
of Jamaica were concentrated in a “few Families … as well as their agents”. Many poor
whites and almost all free people of colour were not so fortunate. Levels of poverty were very
high among the large transient white population of sailors and soldiers as well as among
ordinary whites living in town. The island’s few incredibly rich, therefore, constructed a
strong state fiscal-military regime in which poor relief for whites was abundant and easily
accessed.
4 We concentrate on 1774 for which Jamaican data are most abundant and where the same is true for the
mainland British colonies (Lindert and Williamson 2016).
6
Inequality was, of course, most pronounced on the plantations where the living
standard gap between whites and blacks was enormous. Our data confirms Richard Dunn’s
observation that Jamaican plantations had one of the harshest, if not the harshest, slave
system in history (Dunn 2014, 180). Enslaved blacks produced more for their Jamaican
masters than they did in the American South but received much less for their work. Franklin
also noted that Jamaican slavery was hard-driving, with the enslaved enduring extremely
harsh working conditions, suffering malnutrition from inadequate food provision.5 As we
shall see below, our evidence confirms a slave system based on maximum exploitation and
minimum maintenance. It also suggests that Jamaican planters, and whites more generally,
were not interested in the long term economic prospects of the island. They did little to
reduce their dependence on imported foodstuffs and nothing at all to make the slave system
demographically sustainable without fresh new slaves to replace those who died under it so
soon (Burnard, 2015; Roberts, 2013).
The qualitative literature on the standards of living in eighteenth-century Jamaica is
not lacking but it does not offer a quantitative dimension to make comparative assessments
possible for both slave and free people. Recently, scholars have developed a common
methodology to construct living standard estimates for many eighteenth and nineteenth
century societies including French Canada, what became the United States, many in South
America, Australia, Europe, including Britain. We do the same for c1774 Jamaica in order to
compare our results with these previous studies. The qualitative literature has also given us a
good sense about economic inequality in Jamaica, but we need quantitative evidence thus to
place Jamaica in a comparative perspective. To this purpose, we have built a social table, a
5 That is, provisions from their owners and also from their own plots. Jamaica was one of the few British
American plantation societies where slaves were expected to provide much of their own food, housing and
clothing from their own labor time on Sundays and part of Saturday.
7
common device frequently used by economic historians, for Jamaica c1774, which allows us
to compare it with other times and places – including those that used coerced labor. This
enables us to make empirical statements about inequality among whites, among whites and
free blacks, as well as among all residents, in towns and in the countryside. A new literature
has also developed using purchasing power parity to assess differences in living costs across
time and space, something that we also do here for Jamaica. The next section reports this
evidence for living standards and Section 3 does the same for the cost of living. Section 4
presents a Jamaican social table c1774 and discusses the inequality implications of that new
evidence. Section 5 concludes.
2. Measuring Jamaican Living Standards
This section assesses Jamaican living standards around 1774, following the
methodology pioneered by Robert Allen (Allen, 2001), widely used by economic historians
since (see for example Arroyo-Abad et al, 2012; Geloso, 2016; Lindert, 2016). As far as we
know, this is the first attempt to provide a quantitative estimate of Jamaican living conditions
during pre-industrial times, thus making it possible to locate its experience in a comparative
perspective.
Jamaican living standards are constructed by computing so called welfare ratios,
which allow us to estimate the relative purchasing power of an average Jamaican working
class household. We first calculate the cost of a standard basket of goods representing the
household’s yearly expenditure around 1774. Following common practice (Allen 2001 and
2009; Broadberry et al. 2015), we construct a “bare bones” or subsistence basket including
8
basic necessities which would have ensured a calorie intake of around 2,000 Kcal.6 We use
price data from Long (1774, Book II, 35) and Jamaican probates (Appendix 1) to cost the
basket, and to estimate deflators for nominal annual incomes: these resulting deflated figures
are the welfare ratios that represent the number of baskets that a family could buy, thus
capturing differences in purchasing power across occupations.7
This direct methodology provides an estimate of real income, reflecting the prices and
consumption patterns in late eighteenth century peacetime Jamaica. During this pre-
globalization era, many consumer staples were not traded over great distances so non-
tradables must be included in the consumption basket. But as an island economy, Jamaica
was exceptional in that a very large share of its consumption goods was imported from
Britain, Ireland, Africa and North America while it exported sugar, coffee, and other tropical
products to Britain, Europe and North America (Shepherd and Walton, 1972).
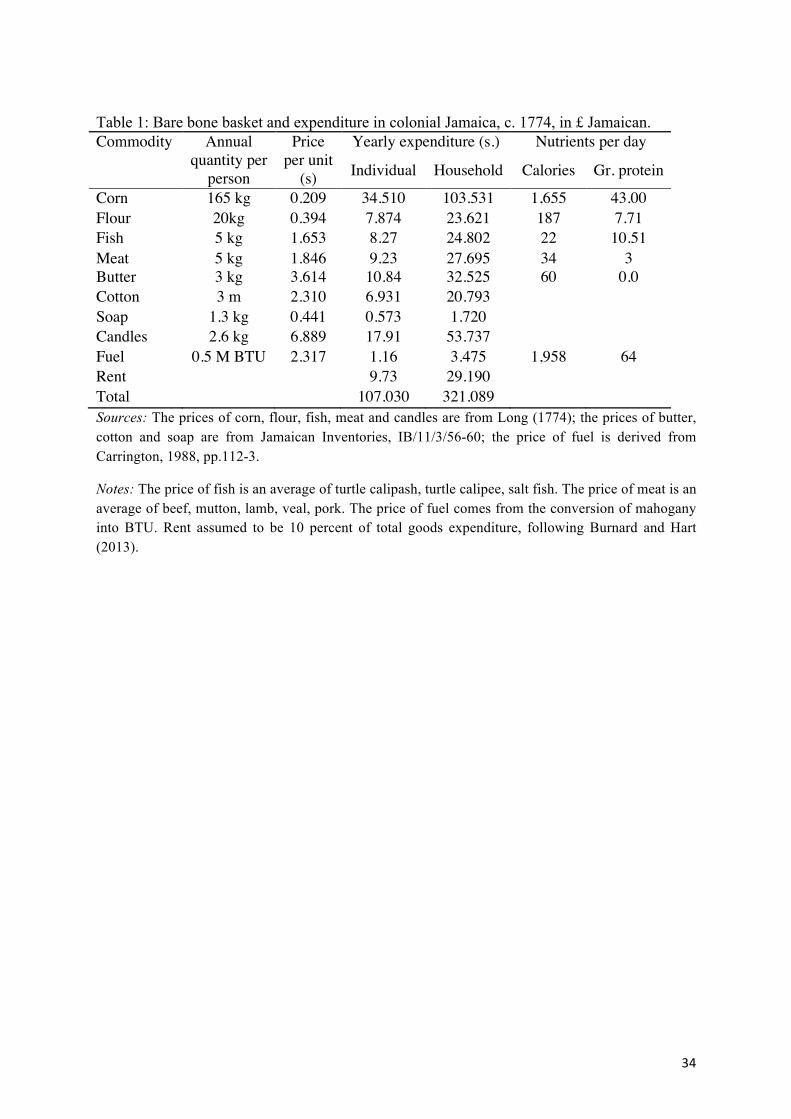
Table 1 presents our consumption basket, which draws on Allen et al (2012): it
reflects Jamaican consumption patterns delivering a subsistence level of 1,958 kilocalories
and 64 grams of protein per day. This basket provides daily nutrition at lowest costs, given
available local supply. The main staple eaten in colonial Jamaica was domestically produced
(country) corn, frequently augmented or replaced by imported wheat flour and corn meal.
The diet was similar to Latin American countries, where most calories came from maize, thus
accounting for the largest share of the cost of the basket (Allen et al. 2012). The principal
sources of protein and fat were fish, meat and butter, much of it imported. Cotton linen,
6 Following Allen (2001; 2009) we consider an average working class family to be made up of four members,
turned into “adult equivalents” by multiplying the cost of a basket for one person by three. The four-member-
family assumption ensures that comparisons between countries and times based on a standardized family size.
7 Our income data are all yearly. Those employed on plantations were also paid food and housing in kind, such
as resident bookkeepers and surgeons. For details see section 4 and the Appendix.
9
candles, soap, fuel and rent constituted the remainder of expenditures.8 The income data used
to compute annual earnings by occupation are described in detail in section 4 and Appendix
2.
[Table 1 around here]
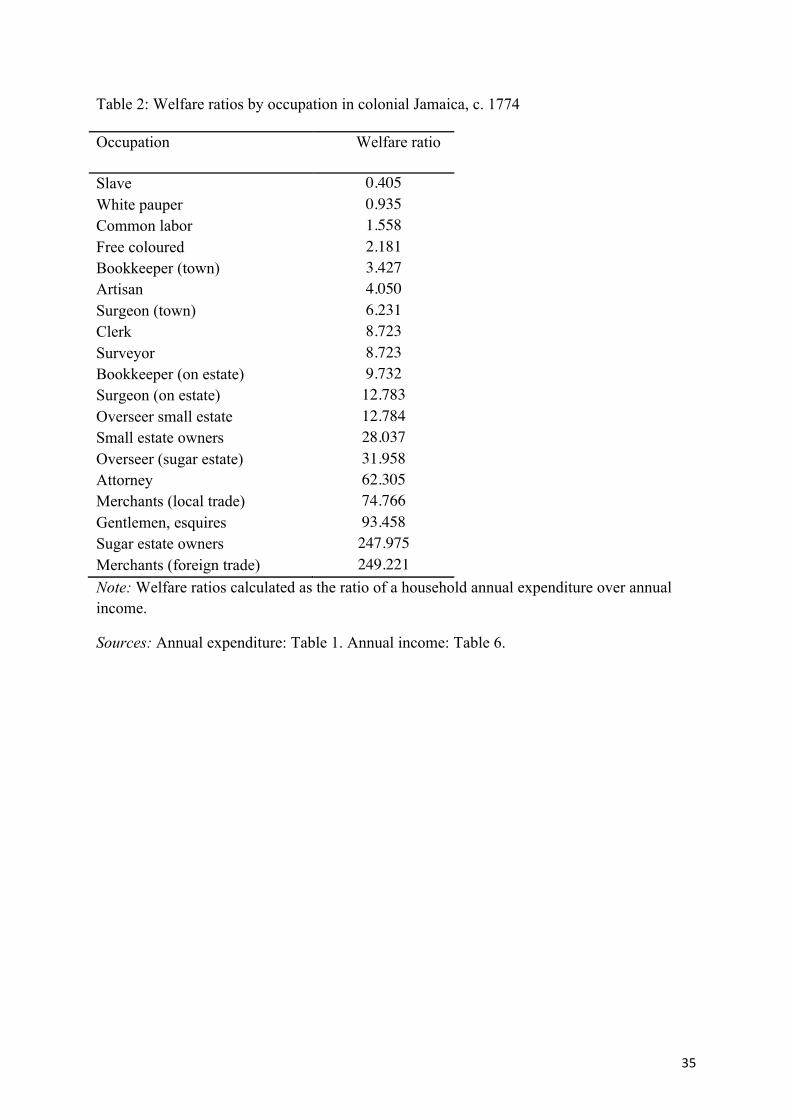
The welfare ratios, measuring how many baskets a household could buy, are reported
in Table 2. They show an extraordinary disparity of real income across occupations: slaves,
white paupers and even common labor had welfare ratios lower than one, which represents
the minimum standard for a laborer working full time to earn just enough to support his
family. Values below one imply either that the household head could only support a smaller
family (perhaps remaining single) or that other household members (women and children)
had to work in order to achieve subsistence, or that malnutrition and short lives resulted.
The white population of Jamaica was demographically unusual, in part because
mortality rates for whites were so high and in part because its plantation economy attracted
immigrants with little attachment to long term settlement and family formation To begin
with, it was very male dominated, especially in the rural interior. In 1774, males accounted
for 70 percent of the white population in Clarendon Parish. Most of them were between the
ages of 21 and 40. Only 12 percent of its white population was aged ten or less and only 2
percent were over 60 (Burnard and Garrigus, 2016). A 1752 census of St. James Parish in
north-western Jamaica offers a detailed breakdown of family members by gender, age, and
status. Most white households had at least one adult male, usually several, indicating that
most included unrelated men who shared expenses and artisanal functions. One third of the
households contained no adult female and nearly half had no children. Most of these white
men worked within the plantation economy, where their living needs were met by their
8 We assumed rent to represent 10 percent of total expenditure, following Burnard and Hart (2013).
10
employers. If they worked outside the plantation economy, such as working in the service
economy in the major town of Kingston, they needed high wages to survive. Those who did
not get high wages were supported by a relatively generous welfare system that channeled
money to the white poor (but not to free people of color, let alone enslaved people) (Greene,
2016, 184-94; Burnard, 2013; Burnard, 1999; Walker, 2014).
Some white Jamaicans were very rich, such as merchants dealing with foreign trade,
owners of sugar plantations, and their attorneys. Merchants engaged in foreign trade and
sugar estate overseers enjoyed high living standards, made possible by the profits of slave-
produced sugar and its trade. The lives and interests of these men and the occasional woman
are well chronicled. It was these rich Jamaicans whose interests were paramount within the
British Empire in the second and third quarters of the eighteenth-century. British ministers
were most concerned about them when constructing imperial policies. Their correspondence
makes it clear that they thought that the Caribbean was the means of acquiring a fortune
impossible in Britain. In 1754, the Bristol merchant Henry Bright argued that “Jamaica is the
only place to get money as great fortunes can be made there and scarce a livelihood can be
got [in Britain] at any business” (Ward, 1978; Morgan, 2007, 36).
Where living standards were especially low was among the enslaved population,
which comprised over 90 percent of the total population. Free people of color, excluded from
systems of poor relief, struggled also in a very expensive island. Our analysis suggests that
Jamaican living standards were very different from those of colonial British America, which
never suffered famine or even particularly hard periods of dearth, thus allowing its population
in the eighteenth century, both black and white, to grow through natural increase
dramatically, as Franklin celebrated in Observations. The utter destitution suffered by
Jamaican slaves meant that the slave population was never able to reach a stage of natural
population growth, as malnourished and often pregnant female slaves overworked as field
11
hands harvesting sugar cane faced severe reproductive handicaps (Morgan, 2006). Similarly,
free laborers outside the plantation economy (black and white) did not earn enough to support
a family of four as their real wage was barely enough to feed a man for a day. Such low
wages undoubtedly worsened the disease mortality and required an active welfare support
system for much of the white population. In 1772, Thomas Thistlewood, a resident small
planter, complained that “such enormous taxes” that he had paid that year were “never known
in Jamaica before.” He paid a parish tax of 3s 9d on slaves and 1s 8d on livestock and a poll
tax of 2s per slave and 6d per head of livestock, making his tax bill £8.30 on income that year
of £207.50 or 4 percent (Hall, 1989, 230; Burnard, 2004, 61). Wealthier Jamaicans paid quite
a lot more in taxes, both in sum and as a proportion of their annual income, at least 6 percent.
Most of the island-wide taxation, which was about two-thirds of the total tax take, went to
security and paying colonial officers. One-third of total taxation was parish taxes, two-thirds
of which was devoted to helping poor whites. If we assume that poor white householders and
their family amounted to about 15 percent of the population, or 1,900 people, then each might
have got £7-8 (Graham, 2017; Long, 1774, I: 61-69). Free blacks, however, got nothing or
very little and enslaved people were dependent on the largesse of their owners (which was
very grudging) or what they could provide for themselves on land they were given to grow
foodstuffs (Mintz and Hall, 1960).
While common labor’s real wages were above subsistence, they were low when
placed in a comparative perspective. They were below those of all Latin American countries
around the same period, even those of rural Mexico and Potosi, the poorest communities of
the region (Allen et al, 2012; Arroyo-Abad et al, 2012). Indeed, they were much lower than
any other European or New World country for which estimates are available, such as
nineteenth-century Australia (Panza and Williamson, 2017), early modern Britain
(Broadberry et al, 2015) and colonial North America and the nineteenth-century United
12
States (Lindert and Williamson, 2016). The low standard of living that most Jamaicans,
black and white, suffered bears out Franklin’s comments about the deleterious consequences
of slavery on such economies.
[Table 2 around here]
2.2 Slave living standards
We report slaves’ living standards in Table 2 by deflating an estimate of slaves’ nominal
maintenance cost of £6.5with the cost of our bare bones consumption basket in Table 1. As
Appendix 2 indicates, such maintenance rates applied mainly to town slaves who did not
work on estates, amounting to yearly food expenditure of £5.5, plus £1 per slave for doctors
and medicines. The amount that slave owners paid for slave maintenance was extremely low,
in part because planters relied on a provision ground system to support their slaves. Slaves
were allocated marginal land on the estate, the crops from which they were expected to
supply much of their food and upon which they built their huts. If a slave was healthy, hard-
working and lucky, he or she might on Saturday afternoons and Sundays be able to grow
enough crops to sell a modest surplus at slave markets. But if he or she was elderly, unwell,
or had children and/or elders to support, the provision ground system could be wholly
inadequate to achieve subsistence.
Moreover, in times of crisis, when Jamaica was battered by hurricanes or when their
provisions from North America were cut off (as during the American Revolution), total
reliance on the provision ground system could easily result in famine (Mintz and Hall, 1960;
Sheridan, 1985, 164-69). Edward Long, writing in 1774, thought that the cost for owners of
maintaining urban slaves was £3.12 per annum. Town slaves were expected, like rural slaves
on their provision grounds, to provide some of their own sustenance from hiring themselves
out for wages when finished with their master’s work. Long’s estimates of slave maintenance
13
costs are borne out by other evidence. Richard Sheridan examined the consolidated Slave Act
of 1788 when the provision ground system came under regulation and notes that owners of
slaves who had no land for provisioning had to find “some other ways or means” equal to
£6.76 per annum (Long, 1774, II: 459; Hall, 1996; Sheridan, 1985, 166). Given that prices
increased considerably between 1774 and 1788, our slave maintenance estimate, including
medical expenses, of £6.5 per town slave and £5.95 per rural slave (see below), seem
reasonable to us.
An alternative way of calculating slaves’ income is by computing an estimate of their
consumption. Available secondary sources provide useful guidelines for this purpose
(Sheridan, 1985, 169-70). The Kingston workhouse specified what enslaved people were to
be provided around 1800: 7 quarts of Guinea/Indian corn per week plus 7 herrings or other
salt fish equivalent to 1.75 lbs of fish, the latter equal to 19.6 grams of protein (Sheridan,
1985, 170).9 Table 3 exploits such information to cost a slave food basket to which we add
clothing, fuel and housing. This enables us to compute the “income” that slaves were allowed
to retain for their own consumption and to compare it with those of free common labor. In
Jamaica, town slaves “retained” 6.5/20.5 = 31.7 percent of their marginal product, and rural
slaves retained 5.95/20.5 = 29 percent (see Appendix 2). The figures were much higher in the
American South, where slaves retained from 52.5 to 61.4 percent of their marginal product
(Lindert and Williamson 2016, Table C-5, 301).
[Table 3 around here]
Our results pinpoint that Jamaican slaves had living standards that were much lower
than in other parts of the British Empire: in fact, the rural poor of England earned more
9 The weekly corn provision could be substituted with 21 pints of wheat flour or 56 plantains or 56 pounds
cocos or yams.
14
during the early seventeenth century, a period of low wages and widespread
underemployment. Indeed, farm labor’s annual income in early seventeenth-century England
was a little more than £9, which was said to barely keep them alive, but was higher than the
income retained by Jamaican slaves in the late eighteenth century, even without taking into
account inflation (Hindle, 2004, 23). Jamaican slaves were probably the poorest people in the
British Empire and certainly in British America on the eve of the American Revolution.
3. Assessing Jamaica’s High Cost of Living
Section 2 provides estimates on Jamaica’s cost of living around 1774: a bare bone basket
cost 107.03 Jamaican shillings, that is 392.8 grams of silver. Compared with other locations
in the Americas and Europe, living expenses were indeed very high in Jamaica. They were
only higher in seventeenth-century Potosi, where the inflationary effects of the silver
economy were felt so strongly, and, for similar reasons, in seventeenth-century Mexico and
Spain, a major silver exporter and importer, respectively (Allen et al., 2012, 874-5).
Before the American War of Independence, 1776-1783, white Jamaicans were able to
cope with a relatively high cost of living. High plantation profits meant that the wealthiest
whites earned so much money from sugar and other tropical commodities or from importing
captive Africans or manufactured goods to not be too concerned that everyday living was
very expensive. Moreover, wealthy whites’ willingness to pay high taxes that helped, among
other things, to fund a generous welfare system for poor whites stopped any political
discontent arising from the high costs of living. The benefits of being white were high,
mainly because rich whites accepted that they had a responsibility to provide for poor whites
(Burnard and Grriguis, 2016). The start of war changed this delicate balance very quickly as
prices ratcheted up.

15
After France and Spain entered the War for American Independence in 1778, Jamaica’s
cost of living skyrocketed. The conflict was shaped by a series of battles for naval
supremacy in the Caribbean and included a French blockade of Britain’s key sugar producing
colonies, Jamaica and the Barbados. Jamaica was heavily reliant on imports, so when food
and other supplies from North America were cut off, the cost of living soared. In addition,
drastic increases in shipping and insurance rates for goods imported from Britain and Ireland
further reduced the supply of consumption goods. These effects led to thousands of slave
deaths from starvation and disease in what Sheridan calls a crisis of slave subsistence.
Although the cost of living began to fall from wartime peaks in 1783, it remained high
through the 1780s, in part due to British refusal to allow the newly formed United States of
America to trade with Jamaica (Sheridan, 1976; Carrington, 2002; Burnard and Garrigus,
2016, Petley, 2017).
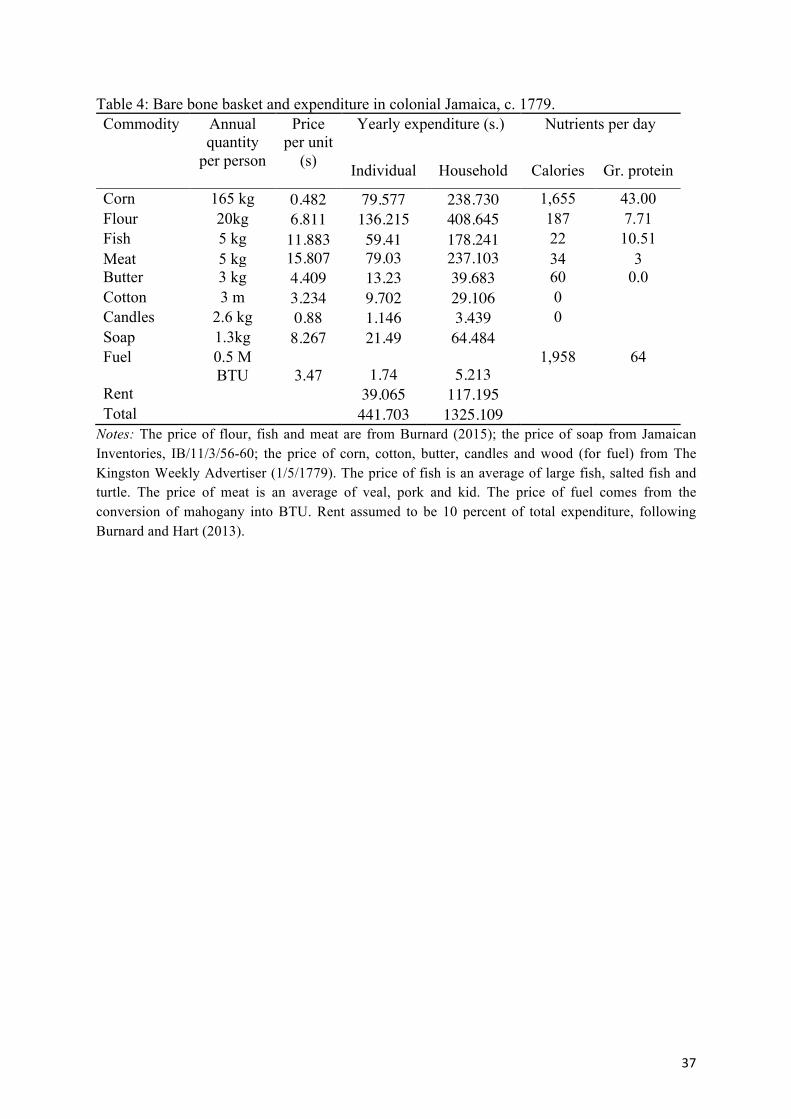
In order to gauge the magnitude of the war’s impact on the island, we computed the cost
of the same bare bone basket presented in Table 1 for the war years 1778-9. The results,
presented in Table 4, point to an extraordinary hike in prices across all commodities. On
average prices rose by 4.7 times. While import prices surged the most, with the highest
increase reported in the price of flour, which rose 17.3 times, domestically produced crops
such as corn (which competed with imports) were also hit by the inflationary surge: corn
prices rose 2.3 times between 1774 and 1779.
[Table 4 around here]
As reported in Table 5, the war basket cost 1620.91 grams of silver, higher than living
costs in any other pre-industrial place for which estimates are available (Allen et al, 2012).
Jamaican costs of living in 1774 were almost double those in Boston (93 percent higher) and
16
four times higher in 1779. As for comparisons with London, costs of living were 50 percent
higher in 1774 Jamaica and six and a half times higher in 1779.
[Table 5 around here]
This increase in living expenses translated into a drastic if short term reduction in real
incomes, confirming that Jamaica faced very tough times for that period of the War for
American Independence (Petley, 2017; Ward, 1978). Using 1778-9 prices to deflate 1774
incomes yields extremely low welfare ratios, namely 25 percent of those reported in Table 2.
This drop affected more than slaves and free common labor, but even artisans and some white
collar occupations, such as town bookkeepers, which had welfare ratios below one.
Conditions were particularly bad for Jamaica’s slaves. Already at subsistence in peacetime,
during the war years slaves became severely malnourished, mortality must have risen, and the
island edged towards famine conditions.10
At the other end of the income spectrum, overseers, merchants and sugar estate owners
also suffered losses during the conflict – after all, export prices and slave labor’s productivity
fell – but they could still afford very comfortable lives. This points again to Jamaica’s very
high levels of inequality.
4. Was Jamaica the Most Unequal Place on the Planet?
How much of Jamaica’s aggregate income accrued to a few plantation owners and their
white management, or to the top 10 percent? How much did a slave field hand receive as “in-10 Slaves living standards declined again as in the early 1780s, when hurricanes hit the island, so that the small
line between deprivation and destitution was stretched. Hector McLean gave evidence to the British Parliament
in 1788 that in the aftermath of the great hurricane of 1780, he experienced “the misery of beholding hundreds
of wretched beings around you, clamouring for food and imploring that assistance which you cannot bestow.”
(Cited in Burnard and Garrigus 2016, 118-9).
17
kind maintenance” compared with his marginal product or with the annual earnings of free
common labor in the towns? How much did skilled white collar clerks, bookkeepers,
attorneys, clergy, surveyors and surgeons get relative to free common labor in town? What
about overall income inequality? Was Jamaica the most unequal place in the Atlantic
economy?
We have such evidence, also based on social tables, for late eighteenth century England,
for the slave-based colonies in the American South, and for Franklin’s almost-completely-
free Middle Atlantic and New England colonies in the American North11 (Lindert and
Williamson, 2016: Chp. 2). Indeed, in a recent study Milanovic, Lindert and Williamson
(2011) were able to exploit social tables for seventeen pre-industrial societies stretching over
time from Rome in 14, to the Ottoman Empire in 1000, to England in 1688, and to India in
1948. Social tables were first used to document national income and its distribution across
social classes more than three centuries ago by the English political arithmeticians William
Petty (written in 1676, published in 1690) and Gregory King (1688; reproduced in Barnett
1936) followed in the eighteenth century by others. Their idea was to rank income earners by
various occupations or social classes from the richest to the poorest with their estimated
number of income earners and their average incomes. Social tables are especially useful in
evaluating pre-industrial societies where classes were clearly delineated, and the differences
in mean incomes between them were substantial. We cannot document income variance
within these classes (driven by age, health, and luck) for Jamaica, but the same is true for the
societies with which we make comparisons. Obviously, the more social classes documented,
the less serious is the within class variance problem. We try to achieve that aim in our
Jamaican c1774 social table (Table 6) by distinguishing between owners of large (sugar)
estates and owners of small (typically coffee or cattle) estates, overseers on small estates 11 With the exception of New York, where slaves comprised about 12 per cent of the population.

18
(with less in-kind income) and overseers on big estates (with more in-kind income), rich
merchants dealing with foreign trade and not-so-rich merchants dealing with local trade,
surgeons on estates (and thus receiving additionally in-kind income) and surgeons in town,
and so on.
[Table 6 about here]
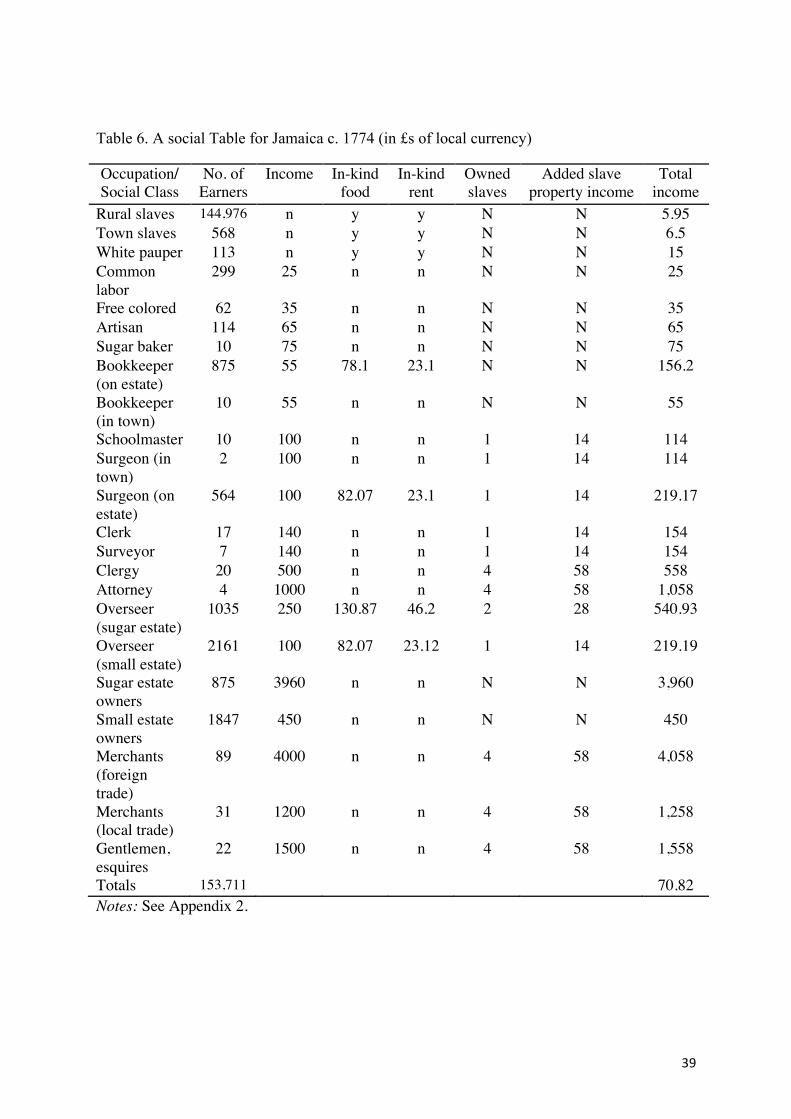
Table 6 offers our estimated Jamaican social table for 1774. There are 23 categories in
the table, and all incomes (including income in-kind where relevant) are in local Jamaican
currency (1.4 Jamaican £s to the £ sterling). What is missing is evidence regarding the market
earnings of white and free black women. While free women were described in records by
their marital or racial status, they were not by occupation. We know that most women in
towns worked, and some women in the countryside were also small property owners, but
there simply is not enough evidence to fit them in our social table with the exception of
female slaves. Those in the military garrison are viewed as transitory, and thus excluded
(although some were retired and paupers). Slave holdings and their value is known for those
owning more than five slaves, but those with five or less escaped tax and tax records so we
had to estimate property incomes from slave ownership for those classes (6 per cent return on
documented slave values) and add the result to the incomes of those more modest, town-
based slave owners. Such slaves would have been off the plantations and in town, and they
make up the urban slave totals. Appendix 2 supplies details on sources and methods.
Table 6 is used to make the comparative income distribution statements in Table 7.
Jamaica certainly was the most unequal society in the Atlantic economy, and by a lot. We
have already discussed the slave retention rate in section 2, but here the reader can see from
Table 7 that the ratio of slave to free common labor “incomes” was barely half of that of the
American South (0.26 vs 0.36), thus confirming the hard-driving characterization of Jamaican

19
slavery. The huge gap between slave and master can best be seen by the ratio of slave
“income” to that of the top 10 percent, 536 in Jamaica and 16 in the American South. The
Gini coefficient summarizes these immense income gaps: it was an extraordinary 0.75 in
Jamaica, well above unequal England (and Wales) which recorded 0.52. That English figure
was higher in 1802, 0.59,12 but still well below 1774 Jamaica. Indeed, the island economy
recorded by far the highest inequality for any pre-industrial economy that can be documented
(Milanovic, Lindert and Williamson, 2011, Figure 2), including British India in 1947 (0.48).
Furthermore, given Jamaica’s estimated per capita income in the late eighteenth century, its
inequality far exceeded the limits dictated by the Milanovic-Lindert-Williamson inequality
possibility frontier, defined as that level of inequality which supplied only a survival level of
subsistence for the majority at the bottom, and thus the maximum surplus that the elite at the
top could squeeze out. Jamaica obviously exceeded that maximum condition, since its low
nutrition, hard-driving work intensity, and resulting high slave mortality required the import
of new slaves to replace them.
[Table 7 about here]
What was true of this large pre-industrial world sample was also true of Franklin’s
mainland British colonies. The richest 10 percent received an astounding 65 percent of total
Jamaican incomes, while the figure for the American South was 38 percent, and 45 percent
for England. The Gini coefficient recorded by the southern slave colonies of British North
America was 0.46, well below the Jamaican 0.75, and, of course, much farther below the
mostly-free American middle colonies where Franklin lived (Philadelphia in Pennsylvania,
0.38). 12 Lindert and Williamson 2016, Table 2.5, p. 39. At least as judged by the Lowlands on the Continent, the 1802
English figure characterized all of pre-industrial Western Europe: e. g. Holland 1732, 0.61, and the Netherlands
1808, 0.56.
20
What is striking about this hard-driving and grossly unequal slave society is that
income was so unequally distributed among free residents (which, of course, included free
but poor emancipated blacks). The ratio of the top 10 per cent share’s average income to that
of common labor was an enormous 128 in Jamaica compared with a modest 5.8 in the
American southern colonies and an egalitarian 2.9 in the American middle colonies. The
richest 10 percent took home 65 percent of total Jamaican income, while the figure was 35
percent in the American South and 29 percent in the American Middle Colonies. The Gini
coefficients were, respectively, 0.73 vs 0.34 and 0.38. Perhaps this result is not surprising
since free common labor in Jamaica had to compete with cheap slave labor.
5. Concluding Remarks
This essay provides new estimates of incomes, cost of living, living standards and income
inequality in colonial Jamaica, and documents that it was markedly different from other
British American colonies given its extreme poverty surrounding extreme wealth. Our
findings signify a radical departure from the usual characterization of Jamaica as the richest
colony in the pre-revolutionary British Empire, a “constant mine,” which provided
“prodigious riches” to its inhabitants and to the imperial state (Sheridan, 1965;
O’Shaughnessy, 2000; Burnard, 2001). The difference in our findings is that we put slaves
front and centre of our analysis. Jamaica was only the richest colony in the empire if we
ignore (as white Jamaicans and most Britons did) that the majority of its inhabitants were
enslaved Africans. It was a bad place to live even for free blacks, and for a large share of
whites. It was only the privileged few who did well. This group, however, dominated
discourse and political realities, thus shaping metropolitan understanding of Jamaica and its
economic value to the empire (Burnard, 2015).

21
We reach these conclusions on Jamaica’s living standards and inequality by the
construction of a social table documenting nominal incomes, common labor and slave
consumption baskets, prices to cost those baskets, and welfare ratios to assess living
standards. There is now similar pre-industrial evidence for the rest of the New World, Britain
and the Continent so that comparisons are possible, and they confirm the assertions in the
previous paragraphs. But it is important to stress that poverty and inequality characterized the
white community alone, a result hardly surprising given that free common labor had to
compete with cheap slave labor. Our evidence also confirms that Jamaica was a very
expensive place to live: it had the highest cost of living among all places for which such
evidence is available. This too is hardly surprising for a small island economy that relied so
heavily on the import of so much of their consumption staples. This high cost of living was
even true of peacetime Jamaica before the American War for Independence shut down trade.
Benjamin Franklin was absolutely correct in seeing that the political economy of the
“sugar islands” was very different from that of British North America, especially outside the
plantation regions. Even including the South, British America was the most income-
egalitarian place on the planet in 1774, with places like Franklin’s Pennsylvania being
especially egalitarian and providing growing incomes for ordinary white folk (Lindert and
Williamson, 2016). It was the best poor man’s place on earth, but Jamaica was the worst. Of
course, the poorest men and women in Jamaica were enslaved people of African descent.
Color made all the difference in the British Empire in which the interests of whites, not
blacks, took precedence.

22
References
Primary sources
Jamaican Inventories, IB/11/3/56-60, Jamaica Archives, Spanishtown Jamaica
The Kingston Weekly Advertiser (1/5/1779)
Journals of the Assembly of Jamaica, (Kingston: Jamaica Assembly, 1805), 10 vols.
Secondary sources
Allen, R. C. (2001). “The great divergence in European wages and prices from the Middle
Ages to the First World War,” Explorations in Economic History, 38, 4: 411-47.
Allen, R. C. (2009). The British Industrial Revolution in Global Perspective (Cambridge:
Cambridge University Press).
Allen, R. C., Bassino, J-P., Ma, D., Moll-Murata, C. van Zanden, J. L. (2001). “Wages,
prices, and living standards in China, 1738–1925: in comparison with Europe, Japan,
and India,” Economic History Review, 64: 8-38.
Allen, R. C., Murphy, T.E. and Schneider, E. B. (2012). “The Colonial Origins of Divergence
in the Americas: A Labor Market Approach,” Journal of Economic History 72: 863-94
and supplementary materials.
Arroyo A., Elwyn Davies, L. and van Zanden, J. L. (2012). “Between Conquest and
Independence: Real Wages and Demographic Change in Spanish America, 1530-1820,”
Explorations in Economic History 49, 2: 149-66.
Beckert, S. (2014). Empire of Cotton: A New History of Global Capitalism (London: Allen
Lane).
Broadberry, S., Campbell, B. Klein, A. Overton, M. and van Leeuwen, B. (2015). British
Economic Growth, 1270-1870 (Cambridge: Cambridge University Press).
Browne, P. (1756). The Civil and natural History of Jamaica (London: T. Osborne).
23
Burnard, T. (1999). ‘The Countrie Continues Sicklie’: White Mortality in Jamaica, 1655-
1780, Social History of Medicine, 12: 45-72.
Burnard, T. (2013). Kingston, Jamaica: A Crucible of Modernity. in Jorge Canizares-
Esguerra, Matt D. Childs, and James Sidbury, eds. The Black Urban Atlantic in the Age
of the Slave Trade (Philadelphia: University of Pennsylvania Press), pp. 123-46.
Burnard, T. (2015). Planters, Merchants, and Slaves Plantation Societies in British America,
1650-1820 (Chicago: University of Chicago Press).
Burnard, T. (2018). “Plantations and the Great Divergence,” in G. Riello and T. Roy eds.
Global Economic History (London: Bloomsbury), ch.6. forthcoming
Burnard, T. and Garrigus, J. (2016). The Plantation Machine: Atlantic Capitalism in French
Saint Domingue and British Jamaica (Philadelphia: University of Pennsylvania Press).
Burnard, T. and Hart, E. (2013). Kingston, Jamaica and Charleston, South Carolina: A New Look
at Comparative Urbanization in Plantation Colonial British America. Journal of Urban History
39: 214-34.
Carrington, S. (1998). The British West Indies during the American Revolution (Dordecht:
Foris)
Carrington, S. (2002). The Sugar Industry and the Abolition of the Slave Trade, 1775-1810.
(Gainesville: University of Florida Press).
Dunn, R. S. (2014). Tale of Two Plantations: Slave Life and Labor in Jamaica and Virginia
(Cambridge, Mass.: Harvard University Press).
Eisner, G. (1961). Jamaica,1830-1930: A study in economic growth. (Cambridge: Cambridge
University Press).
Eltis, D. and S. L. Engerman (2000). The importance of slavery and the slave trade to
industrialising Britain. Journal of Economic History LX: 123-44.
24
Franklin, B. (1750/1961). Observations on the Increase of Mankind, in The Papers of
Benjamin Franklin, ed. L. W. Labaree et al. (New Haven: Yale University Press).
Gauci, P. (2013). William Beckford: First Prime Minister of the London Empire (New Haven:
Yale University Press).
Geloso, Vincent (2016). “Distinct within North America: Living Standards in French Canada,
1688 to 1775.” Available at SSRNhttp://dx.doi.org/10.2139/ssrn.2885514
Graham, A. (2017). The Colonial Sinews of Imperial Power and the Political Economy of
Jamaican taxation, Journal of Imperial and Commonwealth History 45: 188-209
Greene, J.P. (1988). Pursuits of Happiness: The Social Development of Early Modern British
Colonies and the Formation of American Culture (Chapel Hill: University of North
Carolina Press).
Greene, J.P. (2016). Settler Jamaica in the 1750s: A Social Portrait (Charlottesville:
University of Virginia Press).
Hall, D. (1996). “Botanical and Horticultural Enterprises in Eighteenth-Century Jamaica.” In
Roderick A. McDonald, ed., West Indies Accounts: Essays on the History of the British
Caribbean and the Atlantic Economy (Kingston: University of the West Indies Press).
Higman, B.W. (2000). “The Sugar Revolution.” Economic History Review. 53: 213-36
Hindle, S. (2004). On the Parish? The Micro-Politics of Poor Relief in Rural England
c.1550-1750 (Oxford: Oxford University Press).
Inikori, J. E. (2002). Africans and the Industrial Revolution in England: A Study in
International Trade and Economic Development (Cambridge: Cambridge University
Press).
Lindert, P. H. (2016). “Purchasing Power Disparity before 1914?” NBER Working Paper
22896. National Bureau of Economic Research, Cambridge, MA (December).

25
Lindert, P. H. and J. G. Williamson (2016). Unequal Gains: American Growth and Inequality
since 1700 (Princeton: Princeton University Press).
Long, E. (1774). The history of Jamaica: Or, General survey of the ancient and modern state
of that island with reflections on its situation, settlements, inhabitants, climate,
products, commerce, laws and government. London: Lowndes
Marshall, P. J. (2005). The Making and Unmaking of Empires: Britain, India and America
c1760-1783 (Oxford: Oxford University Press).
Milanovic, B., P. H. Lindert, and J. G. Williamson (2011).” Pre-Industrial Inequality,”
Economic Journal 121 (March): 255-72.
Mintz, S. and D.G. Hall (1960). The Origins of the Jamaican Internal Marketing System, Yale
University Publications in Anthropology no. 57.
Morgan, K. (2006). “Slave Women and Reproduction in Jamaica, c.1776-1834,” History 91:
231-53.
Morgan, P.D. (2005). “The Poor: Slaves in Early America,” in D. Eltis, F. D. Lewis and K.
Sokoloff, eds., Slavery in the development of the Americas .(Cambridge: Cambridge
University Press), 288-323.
O’Shaughnessy, A. (2000). An Empire Divided: The American Revolution and the British
Caribbean (Philadelphia: University of Pennsylvania Press).
Petley, C. (2009). “Home” and “this country”: Britishness and Creole identity in the letters of
a transatlantic slaveholder,” Slavery & Abolition 6: 43-61.
Rabushka, A. (2008) Taxation in Colonial America (Princeton: Princeton University Press).
Reid, A. (2016). “Sugar, Slavery and Productivity in Jamaica, 1750-1807,” Slavery and
Abolition 37: 159-82.
Roberts, J. (2013). Slavery and the Enlightenment in the British Atlantic, 1750-1807 (New
York: Cambridge University Press).
26
Shepherd, J.F. and Walton, G.M. (1972). Shipping, Maritime Trade, and the Economic
Development of Colonial North America (Cambridge: Cambridge University Press).
Sheridan, R.B. (1985). Doctors and Slaves: A medical and demographic history of the British
West Indies (Cambridge: Cambridge University Press).
Sheridan, R. B. (1965). “The Wealth of Jamaica in the eighteenth century,” Economic History
Review 2d ser. XVIII: 292-311.
Sheridan, R. B. (1968). “The wealth of Jamaica in the eighteenth century: a rejoinder,”
Economic History Review 2d ser., XXI: 46-60.
Sheridan, R. B. (1971). “Simon Taylor, Sugar Tycoon of Jamaica, 1740-1813,” Agricultural
History 45: 285-96.
Thomas, R. P. (1968). “The sugar colonies of the old empire: profit and loss for Great
Britain,” Economic History Review 2d ser., XXI: 30-45
Walker, C. (2014). “Pursuing Her Profits: Women in Jamaica, Atlantic Slavery and a
Globalising Market, 1700-60.” Gender and History 26: 478-501.
Walvin, J. Sugar: The World Corrupted, from slavery to obesity (London: Robinson).
Williams, E. (1944). Capitalism and Slavery (Chapel Hill, N.C.: University of North Carolina
Press).
27
Appendix 1: Jamaica’s bare bone basket prices in 1774 and 1779
The prices used to calculate the bare bone expenditure in Tables 1 and 4 are all retail prices.
The bare bone baskets are adapted from Allen et al (2012) with the following modifications:
1) Due to data unavailability, we doubled the quantity of candles to make up for missing
lamp oil prices.
2) Because of Jamaica’s hot climate, we used only 1/4 of the BTU indicated in Allen’s
basket, as wood was not used as a heating source, but only for cooking. The 1774 price of
wood is inferred from Carrington (1998, pp. 112-3), who lists price increases during the
American war of Independence in various West Indian islands, including Jamaica. Citing
CO137/85/115 and Ragatz, 1928, p. 153, he notes that lumber costs rose greatly during the
war; specifically, common white oak and pitch boards increased by 150%. We deflated fuel
wood prices accordingly by 150% from 1779 to 1774.
3) We use fish instead of beans/peas as alternative source of protein. In 1774 the price of fish
is an average of turtle calipash, turtle calipee, salt fish, while in 1779 an average of large fish,
salted fish and turtle.
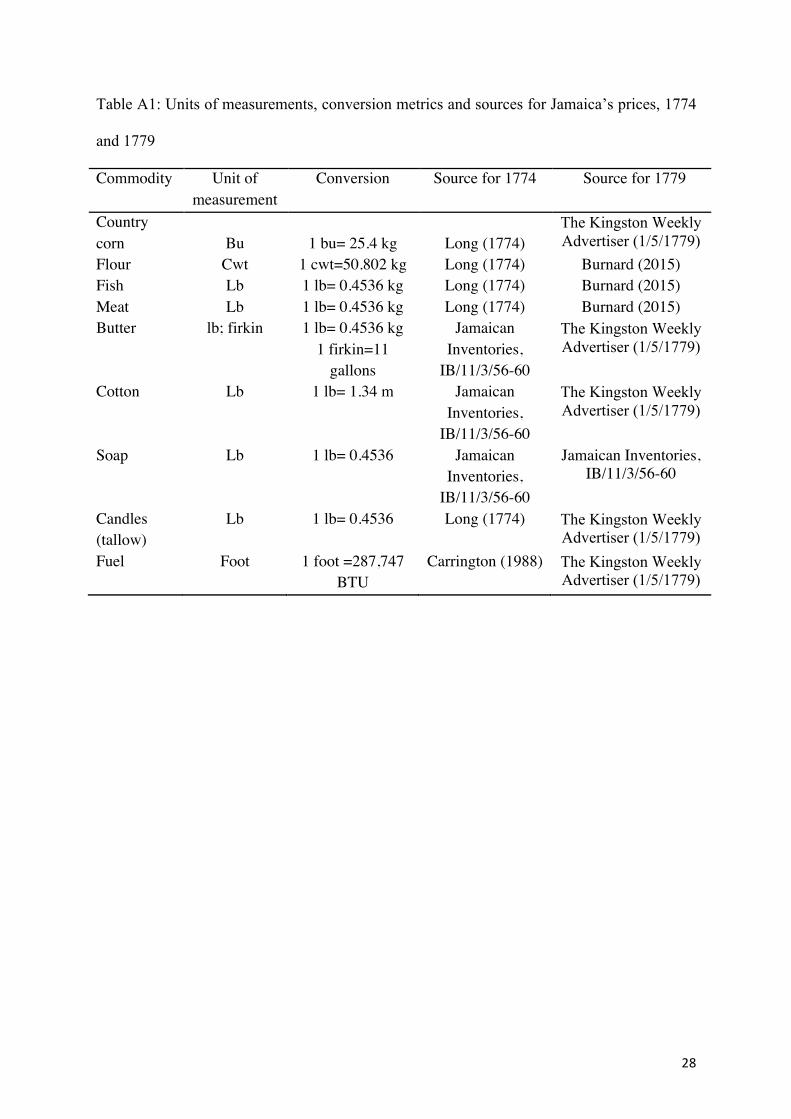
Table A1 provides details of the units of measurements used in the original sources and of the
conversion metrics used to transform them in the units of measurement of the bare bone
basket. The sources used for the conversions are: http://gpih.ucdavis.edu/Converting.htm; and
http://www.convert-me.com/en/.
28
Table A1: Units of measurements, conversion metrics and sources for Jamaica’s prices, 1774
and 1779
Commodity Unit of measurement
Conversion Source for 1774 Source for 1779
Country corn
Bu
1 bu= 25.4 kg
Long (1774)
The Kingston Weekly Advertiser (1/5/1779)
Flour Cwt 1 cwt=50.802 kg Long (1774) Burnard (2015) Fish Lb 1 lb= 0.4536 kg Long (1774) Burnard (2015) Meat Lb 1 lb= 0.4536 kg Long (1774) Burnard (2015) Butter lb; firkin 1 lb= 0.4536 kg
1 firkin=11 gallons
Jamaican Inventories,
IB/11/3/56-60
The Kingston Weekly Advertiser (1/5/1779)
Cotton Lb 1 lb= 1.34 m Jamaican Inventories,
IB/11/3/56-60
The Kingston Weekly Advertiser (1/5/1779)
Soap Lb 1 lb= 0.4536 Jamaican Inventories,
IB/11/3/56-60
Jamaican Inventories, IB/11/3/56-60
Candles (tallow)
Lb 1 lb= 0.4536 Long (1774) The Kingston Weekly Advertiser (1/5/1779)
Fuel Foot 1 foot =287,747 BTU
Carrington (1988) The Kingston Weekly Advertiser (1/5/1779)
29
Appendix 2. Jamaica’s c1774 Social Table
Incomes by Occupation
All of these are annual incomes and in Jamaican currency.
Free Whites on Poor Relief
In 1750-51, the parish of Kingston supported 103 whites at £12.27 per person (Edward
Manning to Journal of Assembly (1751) in Journals of Assembly of Jamaica (1805), IV:
365). We do not have the figure for 1774, but we know from Kingston vestry records that the
amount collected by the poor law tax went up by 10 percent between 1745 and 1770,13
perhaps by 13 percent if the additional four years up to 1774 are included. Thus, the figure
for 1774 might have been around £14. Given the rise in staple prices in the run up to 1774
(see below), the figure was probably closer to £15, which is what we assume here. Edward
Long estimated in 1774 that military subsistence was £13 per annum with a further £9.75 for
the maintenance of a wife and £6.50 for children, making £34.75 for a family of four. (Long,
1774, I: 425)
Slave Maintenance
In 1781, John Slater, the Deputy Marshall of the Kingston goal complained that the allocation
of £16.43 per slave was too low (18 August 1781, Journal of the Assembly of Jamaica).
While the white pauper rate was lower in c1770 (£13.87), staple prices rose 1770-1781
(leading to the Marshall’s 1781 complaint). Thus, we lowered the town slave 1774 figure
accordingly. As section 3 documented, staple prices rose hugely from pre-war (early 1770s)
to wartime (late 1770s and early 1780s). Indeed, imported rice, corn meal and flour prices
rose by about 3.5 times (unweighted average: Sheridan 1985. p. 157; see section 3). But that
figure does not include cheaper local provisions like dried fish and yams, so we assume slave
maintenance prices rose 3 times. This staple price inflation implies that the cost of slave
13 Kingston Vestry Records, 1750-74, IB/2/6/2-5, Jamaica Archives, Spanishtown, Jamaica.

30
maintenance in town was about £5.5 in the early 1770s. Since estate owners and overseers
spent £1 per slave for doctors and medicines (Sheridan, 1985, 315-18) we raise the 1774
town slave maintenance estimate to £6.5. Section 2 offers a rural slave estimate of 5.95£
(prices were lower in the countryside) based on consumption estimates there.
Slave Retention Rate
Slave marginal product = net profit + maintenance = 14 (based on returns to slave wealth: see
below) + 6.5 = 20.5, which is about equal to the male slave hire rate of £20 (see below).
Thus, town slaves “retained” 6.5/20.5 = 31.7 percent and rural slaves 5.95/20.5 = 29 percent
of their marginal product, which is considerably below the 52.5-61.4: mean 57) percent
which prevailed in the American colonial South (Lindert and Williamson 2016, Table C-5, p.
301). This seems consistent with the comparative hard-driving view of Jamaican plantation
policy.
White Common Labor
The starting wage for urban “casual” free labor was £25 per annum (Burnard, 2004), about
double that of a pauper and almost four times the slave maintenance rate.
Artisans
Manufacturers and building tradesmen earned £65 and sugar bakers £75 (Long, 1774, II:
103).
White Collar
Annual average earnings in £s were: bookkeeper 55, plus room and board if on estate; school
master 100; surgeon 100, plus room and board if on estate. clerk 140; surveyor 140; clergy
500; and attorney 1000 (Long, 1774, I: 407, 423, 480).
Overseers
The standard or average rate for an overseer on smaller estates was about £100 in the 1770s
(not including room and board), but it ranged up to as high as £200-300 for experienced men
31
on large sugar estates (Burnard, 2004). These figures are about doubled when in-kind room
and board are included. We take the value of in-kind room as 9 percent of total income: based
on 1354 Kingston houses, annual house rent averaged £46.29 (Burnard and Hart, 2013) or 8.5
percent of a sugar estate overseer’s income, but 20.9 percent of a surgeon’s income if resident
on estate. Of course, the latter did not have use of the whole estate mansion. We take board as
25.5 percent of total income.
Wealthy Slave Owners
The Pennant family owned estates in Clarendon, which yielded in 1772-75 net profits of
£14,242 per annum, or £14.02 per slave. A 6 percent net return and £14.net profit per slave is
repeated and confirmed everywhere in the records. For example, William Perrin, an absentee
plantation owner, got a 6 percent return in 1777, or £14.05 per slave. The Spring estate in St.
Andrew’s parish made £14.29 per slave in the 1770s (Burnard 2015, Table 4.1, p. 160). (If
the slave male/female ratio was around 1, and the average net profit per slave was £14, then
the slave rental should have been about £20 for males and £8 for females. And the hire rate
for males was indeed about £20.) With the available information on slave holdings, we can
calculate incomes of plantation owners, as below.
Probated wealth holders 1774: Those probated averaged 28 slaves, implying incomes of £392
(Burnard 2001, p. 517).
Non-probated wealth holders 1774: These smaller holders made about 67 percent of those
probated, or £262.64. Thus, average income of all slave holders in 1774 (from slaves alone)
was about £308 (Burnard 2015, Table 4.13, p. 207).
Average income from slaves: In 1774, St. James’ parish yielded total slave profits of £16, 613
or £455 per white adult male. These were not, of course, necessarily plantation owners, nor
were the latter the majority.
Sugar Estate Owners:
32
These richest Jamaicans are well documented (Burnard 2015, p. 160) and had average
incomes of about £3,960. We arrive at this estimate as follows. Income of £11000 per annum
with slaves returning £15 per annum would suggest a slave holding of over 700, which was
true of only a few at the top. The average number of slaves held by these 875 sugar estate
owners was about 200. Long was a reliable contemporary observer who estimated that gross
receipts for an estate with 100 slaves was £1980 and net income after expenses £1420 (Long,
1774, I: 459-62). According to this, an estate with 300 slaves would gross £5940 and net
£4260. To be consistent with other social tables with which we compare, we use gross
income applied to the average of 200 slaves for the 875 sugar planters, making average
income for this category £3960.
Other Estate Owners: For these smaller (mostly coffee and cattle) estates, we assume their
incomes to have been that reported above for St. James’ parish, £450.
Income Adjustments for Small Slave Holders in Town:
Those with less than 5 slaves were not taxed and their slave holdings not reported. Our
income estimates add net profits from them (at £14) to total cash incomes, assuming those
with incomes of (in £s): 100-149 held 1 slave; 150-199 held 2 slaves; 200-299 held 3; and
300-400 held 4.
Total Population and Labor Force by Occupation
These figures are taken from the 1774 census for free colored, whites, and slaves (see
Burnard 2015, Table 4.3, p. 161). For free colored and whites, we assume only adult males
worked, but that both male and female adult slaves worked (women even when pregnant).
Town Income Recipients by Occupation
Free whites are reported by occupation for Kingston in 1782 (Higman 1991), and these
numbers are inflated by 1.3 under the assumption that both Montego Bay and Spanish Town
were 15 percent of Kingston’s labor force size (as was population). We assume that free

33
colored (males) were distributed across occupations as were whites except that they were not
gentlemen, professionals, or rich merchants.
Rural Income (and Maintenance) Recipients by Occupation
We use the 1774 St. James parish census for white male and free colored male heads plus
adult slaves as the occupation mix which applied across all rural Jamaica. The share of labor
force participants in total populations were white male adults 0.613, free colored male adults
0.237, and slaves 0.752 Elderly unable to work were a very small share of the total
population.
34
Table 1: Bare bone basket and expenditure in colonial Jamaica, c. 1774, in £ Jamaican. Commodity Annual
quantity per person
Price per unit
(s)
Yearly expenditure (s.) Nutrients per day
Individual Household Calories Gr. protein
Corn 165 kg 0.209 34.510 103.531 1,655 43.00 Flour 20kg 0.394 7.874 23.621 187 7.71 Fish 5 kg 1.653 8.27 24.802 22 10.51 Meat 5 kg 1.846 9.23 27.695 34 3 Butter 3 kg 3.614 10.84 32.525 60 0.0 Cotton 3 m 2.310 6.931 20.793 Soap 1.3 kg 0.441 0.573 1.720 Candles 2.6 kg 6.889 17.91 53.737 Fuel 0.5 M BTU 2.317 1.16 3.475 1,958 64 Rent 9.73 29.190 Total 107.030 321.089 Sources: The prices of corn, flour, fish, meat and candles are from Long (1774); the prices of butter, cotton and soap are from Jamaican Inventories, IB/11/3/56-60; the price of fuel is derived from Carrington, 1988, pp.112-3.
Notes: The price of fish is an average of turtle calipash, turtle calipee, salt fish. The price of meat is an average of beef, mutton, lamb, veal, pork. The price of fuel comes from the conversion of mahogany into BTU. Rent assumed to be 10 percent of total goods expenditure, following Burnard and Hart (2013).
35
Table 2: Welfare ratios by occupation in colonial Jamaica, c. 1774
Occupation Welfare ratio
Slave 0.405 White pauper 0.935 Common labor 1.558 Free coloured 2.181 Bookkeeper (town) 3.427 Artisan 4.050 Surgeon (town) 6.231 Clerk 8.723 Surveyor 8.723 Bookkeeper (on estate) 9.732 Surgeon (on estate) 12.783 Overseer small estate 12.784 Small estate owners 28.037 Overseer (sugar estate) 31.958 Attorney 62.305 Merchants (local trade) 74.766 Gentlemen, esquires 93.458 Sugar estate owners 247.975 Merchants (foreign trade) 249.221 Note: Welfare ratios calculated as the ratio of a household annual expenditure over annual income.
Sources: Annual expenditure: Table 1. Annual income: Table 6.

36
Table 3: Slaves living standards in colonial Jamaica, c. 1774. Commodity
Annual quantity
Price per unit
Yearly expenditure
Nutrients per day
per person (s.) (s.) Calories Gr. protein
Corn 263.55 quarts 0.166 43.753 1,750 46.34 Plantains 0.104 21.146 122 1.59 Fish 1.75 lb 1.653 2.894 41 19.60 Cotton 3 m 2.310 6.931
Soap 1.3 kg 0.441 0.573 Candles 2.6 kg 6.889 17.91
Fuel 0.5 M BTU 2.317 1.16 Rent 4.718
Medical expenses
20
Total 119.088 1, 913 68 Sources: The prices of corn, plantains, fish and candles are from Long (1774); the prices of cotton and soap are from Jamaican Inventories, IB/11/3/56-60; the price of fuel is derived from Carrington, 1988, pp.112-3. The slaves’ basket is constructed based on information contained in Sheridan (1985) and Eisner (1961).
Notes: The price of fish is an average of turtle calipash, turtle calipee, salt fish. The price of fuel comes from the conversion of mahogany into BTU. Rent assumed to be 5 per cent of total expenditure.
37
Table 4: Bare bone basket and expenditure in colonial Jamaica, c. 1779. Commodity Annual
quantity per person
Price per unit
(s)
Yearly expenditure (s.) Nutrients per day
Individual Household Calories Gr. protein
Corn 165 kg 0.482 79.577 238.730 1,655 43.00 Flour 20kg 6.811 136.215 408.645 187 7.71 Fish 5 kg 11.883 59.41 178.241 22 10.51 Meat 5 kg 15.807 79.03 237.103 34 3 Butter 3 kg 4.409 13.23 39.683 60 0.0 Cotton 3 m 3.234 9.702 29.106 0 Candles 2.6 kg 0.88 1.146 3.439 0 Soap 1.3kg 8.267 21.49 64.484 Fuel 0.5 M
BTU 3.47 1.74 5.213 1,958 64
Rent
39.065 117.195 Total 441.703 1325.109
Notes: The price of flour, fish and meat are from Burnard (2015); the price of soap from Jamaican Inventories, IB/11/3/56-60; the price of corn, cotton, butter, candles and wood (for fuel) from The Kingston Weekly Advertiser (1/5/1779). The price of fish is an average of large fish, salted fish and turtle. The price of meat is an average of veal, pork and kid. The price of fuel comes from the conversion of mahogany into BTU. Rent assumed to be 10 percent of total expenditure, following Burnard and Hart (2013).

38
Table 5: Comparative cost of the bare bone basket, gr. of silver
Sources: Beijing, London, Amsterdam, Florence, Wien, Leipzig are from Allen et al. 2011; Boston, Philadelphia, Maryland, Potosi, Mexico, Bogota and Valencia from Allen et al. 2012.
Cost of bare bone basket 1774 1779 1775-99 Jamaica 392.8 1620.91 Beijing 191.34 197.63 London 278.69 245.70 Amsterdam 211.02 168.35 Florence 295.47 262.82 Wien 159.64 143.26 Leipzig 106.69 111.94 Boston 203.36 248.77 Philadelphia 240.98 Maryland 223.51 Potosi 598.01Mexico 312.55 Bogota 240.41 Valencia 393.02
39
Table 6. A social Table for Jamaica c. 1774 (in £s of local currency)
Occupation/ Social Class
No. of Earners
Income In-kind food
In-kind rent
Owned slaves
Added slave property income
Total income
Rural slaves 144,976 n y y N N 5.95 Town slaves 568 n y y N N 6.5 White pauper 113 n y y N N 15 Common labor
299 25 n n N N 25
Free colored 62 35 n n N N 35 Artisan 114 65 n n N N 65 Sugar baker 10 75 n n N N 75 Bookkeeper (on estate)
875 55 78.1 23.1 N N 156.2
Bookkeeper (in town)
10 55 n n N N 55
Schoolmaster 10 100 n n 1 14 114 Surgeon (in town)
2 100 n n 1 14 114
Surgeon (on estate)
564 100 82.07 23.1 1 14 219.17
Clerk 17 140 n n 1 14 154 Surveyor 7 140 n n 1 14 154 Clergy 20 500 n n 4 58 558 Attorney 4 1000 n n 4 58 1,058 Overseer (sugar estate)
1035 250 130.87 46.2 2 28 540.93
Overseer (small estate)
2161 100 82.07 23.12 1 14 219.19
Sugar estate owners
875 3960 n n N N 3,960
Small estate owners
1847 450 n n N N 450
Merchants (foreign trade)
89 4000 n n 4 58 4,058
Merchants (local trade)
31 1200 n n 4 58 1,258
Gentlemen, esquires
22 1500 n n 4 58 1,558
Totals 153,711 70.82 Notes: See Appendix 2.

40
Table 7: Comparative income inequality: Gini coefficients, income shares and income ratios
Sources: The American data are from Lindert and Williamson 2016, Table C-5, p. 301 and data underlying Tables 2-2 - 2-3 and Table 2-4, pp. 29-38. The data for England & Wales are from Lindert and Williamson 2016, Table 2-5, p. 39. The Jamaican figures are based on Table 1.
Jamaica American South
American Middle Colonies
England & Wales
1774 1774 1774 1759 Including Slaves
Slave (rural) retention rate 0.29 0.54 0.53 na Slave (urban) vs free common labor
0.26 0.36 0.43 na
Slave (urban) vs artisan 0.10 0.34 0.37 na Top 10% vs slave (rural) 536.47 15.99 6.73 na Top 10% share (%) 64.97 37.90 30.40 45.10 Top 10% mean income (£) 3192
Gini Coefficient 0.75 0.46 0.38 0.52
Free Only Top 10% vs common labor 127.68 5.75 2.90 na Top 10% share (%) 64.52 35.20 28.80 45.10 Top 10% mean income (£) 3192 Gini coefficient 0.73 0.34 0.38 0.52