the feasibility, costs, and environmental implications...
TRANSCRIPT
The Feasibility, Costs, and Environmental Implications
of Large-scale Biomass Energy
Niven Winchester (with John Reilly)
Joint Program on the Science & Policy of Global Change
Massachusetts Institute of Technology
Contributed presentation at the 60th AARES Annual Conference,
Canberra, ACT, 2-5 February 2016
Copyright 2016 by Author(s). All rights reserved. Readers may make verbatim copies of this document for
non-commercial purposes by any means, provided that this copyright notice appears on all such copies.
Market Cost of Renewable Jet Fuel Adoption in the US
February 4, 2016AARES Conference
http://globalchange.mit.edu/
The Feasibility, Costs, and Environmental Implications of Large-scale Biomass Energy
Niven Winchester (with John Reilly)Joint Program on the Science & Policy of Global Change
Massachusetts Institute of [email protected]
2http://globalchange.mit.edu/
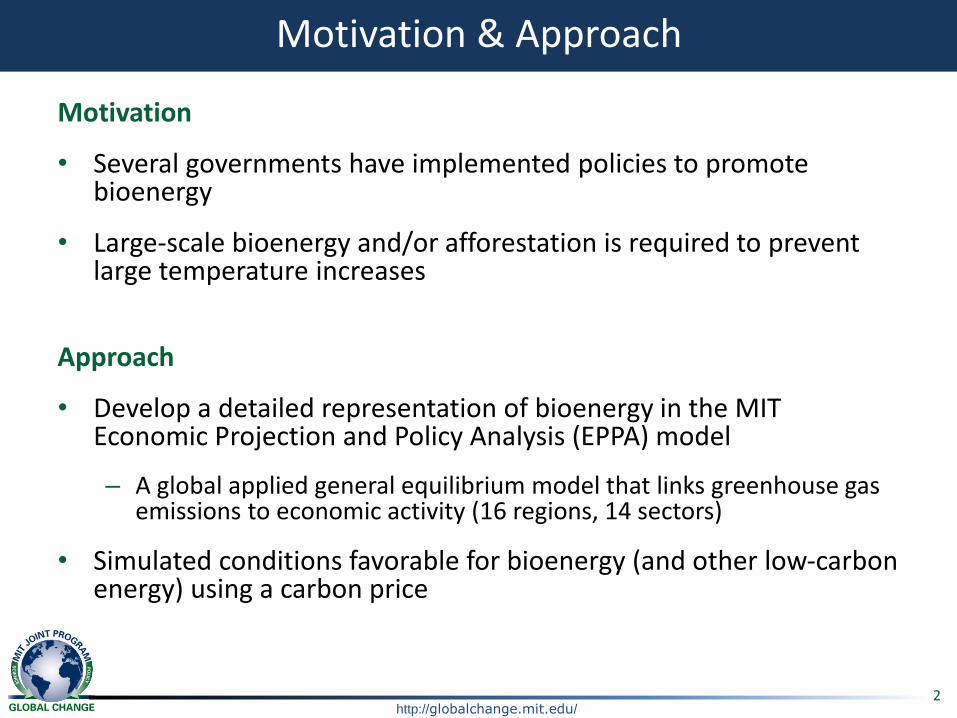
Motivation & Approach
Motivation
• Several governments have implemented policies to promote bioenergy
• Large-scale bioenergy and/or afforestation is required to prevent large temperature increases
Approach
• Develop a detailed representation of bioenergy in the MIT Economic Projection and Policy Analysis (EPPA) model
– A global applied general equilibrium model that links greenhouse gas emissions to economic activity (16 regions, 14 sectors)
• Simulated conditions favorable for bioenergy (and other low-carbon energy) using a carbon price
3
AFRAFRAFRAFRAFRAFRAFRAFRAFRAFRAFRAFRAFRAFRAFRAFRAFRAFRAFRAFRAFRAFRAFRAFRAFRAFRAFRAFRAFRAFRAFRAFRAFRAFRAFRAFRAFRAFRAFRAFRAFRAFRAFRAFRAFRAFRAFRAFRAFRAFRAFRAFRAFRAFRAFRAFRAFRAFRAFRAFRAFRAFRAFR
ANZANZANZANZANZANZANZANZANZANZANZANZANZANZANZANZANZANZANZANZANZANZANZANZANZANZANZANZANZ
ASIASIASIASIASIASIASIASIASIASIASIASIASI
BRA
CAN
CHN
EUREUREUREUREUREUREUREUREUREUREUREUREUREUREUREUREUREUREUREUREUREUREUREUREUREUREUREUREUREUREUREUREUREUREUREUREUREUREUREUREUREUREUR
IND
JPN
LAMLAMLAMLAMLAMLAMLAMLAMLAMLAMLAMLAMLAMLAMLAMLAMLAMLAMLAMLAMLAMLAMLAMLAMLAMLAMLAMLAMLAMLAMLAMLAMLAMLAMLAMLAMLAMLAMLAMLAMLAMLAMLAMLAMLAMLAMLAMLAMLAMLAMLAM
MESMESMESMESMESMESMESMESMESMESMESMESMESMESMEX
REAREAREAREAREAREAREAREAREAREAREAROEROEROEROEROEROEROEROEROEROEROEROEROE
MES
ROEROEROEROEROE
RUS
USA
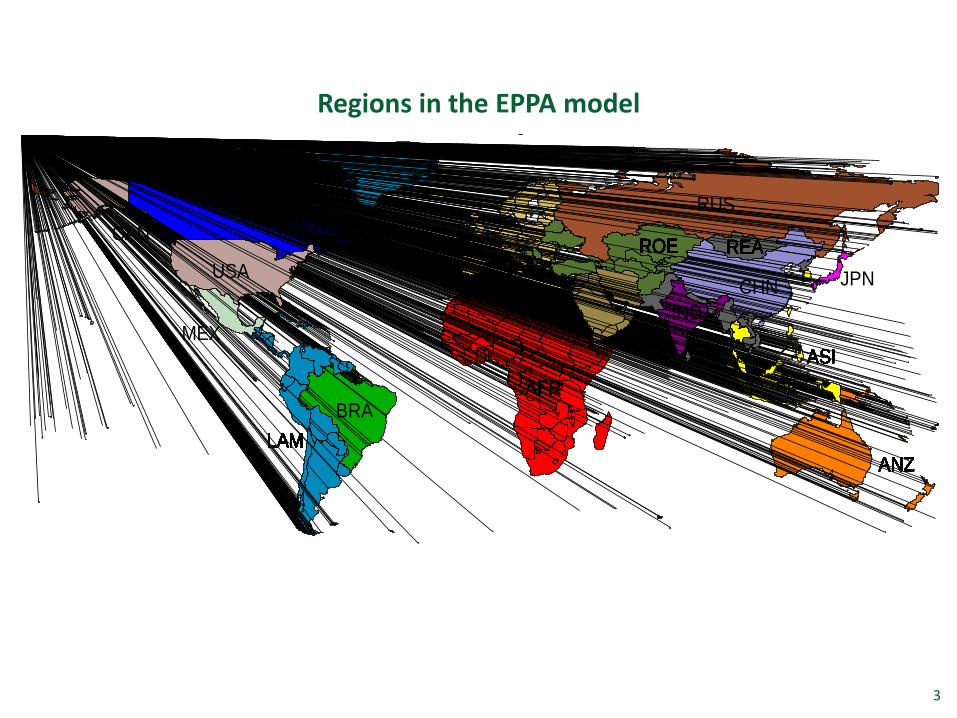
AFR: Africa
ANZ: Australia-New Zealand
ASI: East Asia
BRA: Brazil
CAN: Canada
CHN: China
EUR: European Union
IND: India
JPN: Japan
LAM: Latin America
MES: Middle East
MEX: Mexico
REA: Rest of East Asia
ROE: Rest of Europe & Central Asia
RUS: Russia
USA: United States
EPPA 5 RegionsRegions in the EPPA model
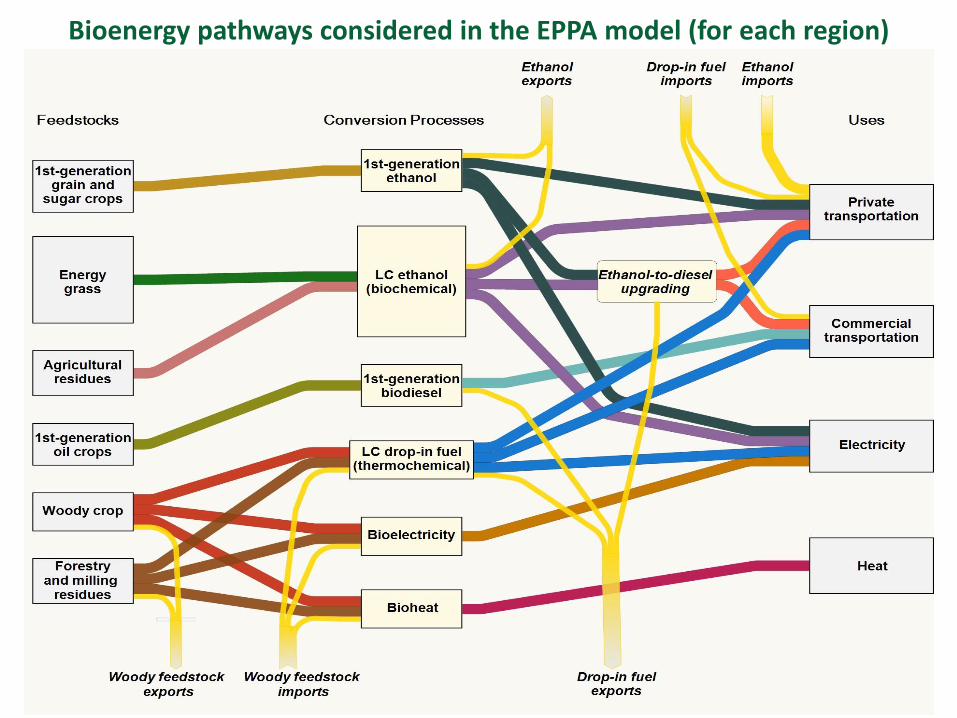
3. The global potential for biofuelsBioenergy pathways considered in the EPPA model (for each region)
5
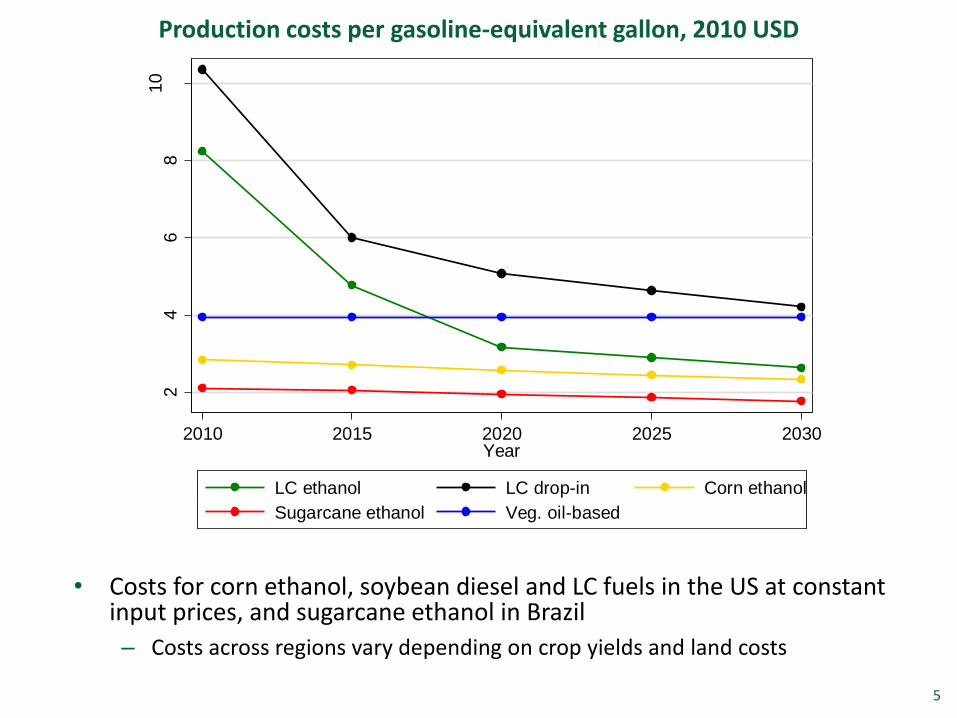
Biofuel costs in the EPPA model
• Costs for corn ethanol, soybean diesel and LC fuels in the US at constant input prices, and sugarcane ethanol in Brazil
– Costs across regions vary depending on crop yields and land costs
24
68
10
20
10$
pe
r g
asolin
e-e
quiv
ale
nt
gallo
n
2010 2015 2020 2025 2030Year
LC ethanol LC drop-in Corn ethanol
Sugarcane ethanol Veg. oil-based
Production costs per gasoline-equivalent gallon, 2010 USD
6http://globalchange.mit.edu/
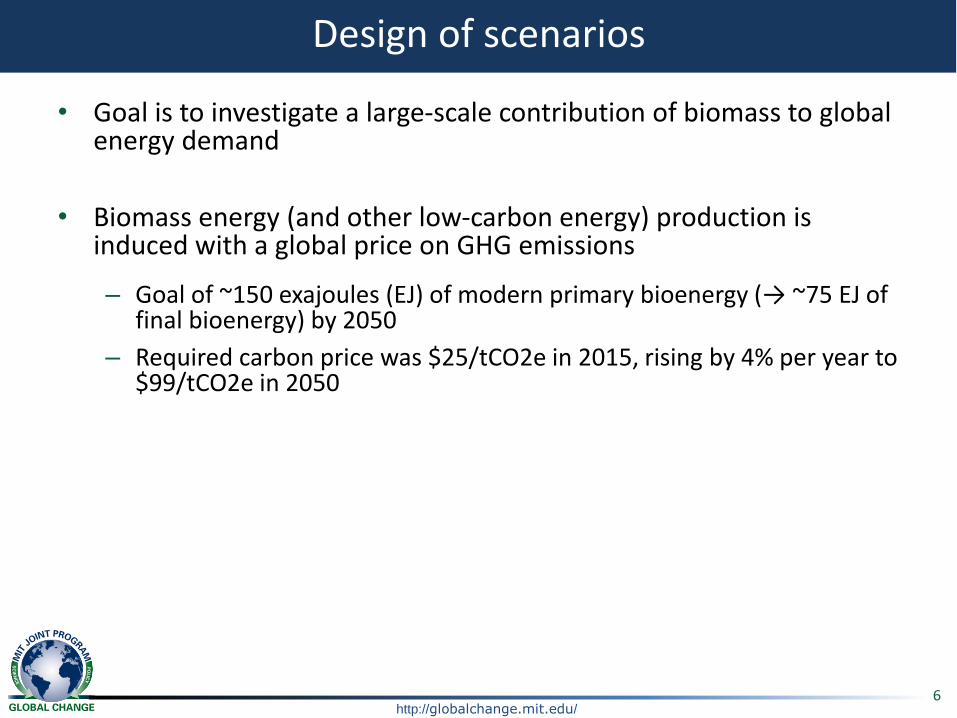
Design of scenarios
• Goal is to investigate a large-scale contribution of biomass to global energy demand
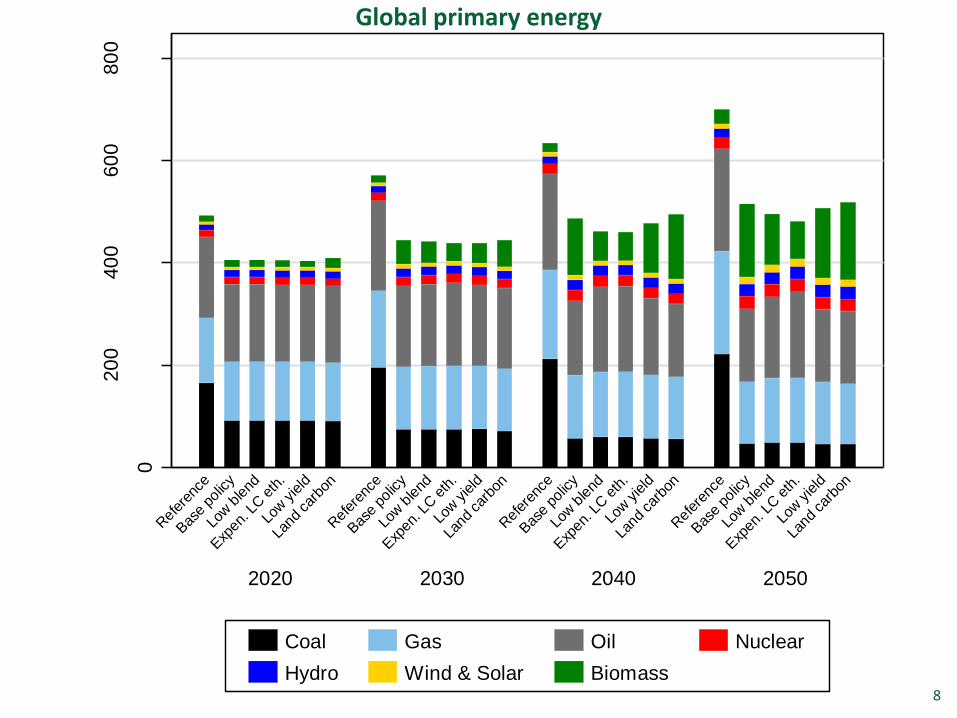
• Biomass energy (and other low-carbon energy) production is induced with a global price on GHG emissions
– Goal of ~150 exajoules (EJ) of modern primary bioenergy (→ ~75 EJ of final bioenergy) by 2050
– Required carbon price was $25/tCO2e in 2015, rising by 4% per year to $99/tCO2e in 2050
7http://globalchange.mit.edu/
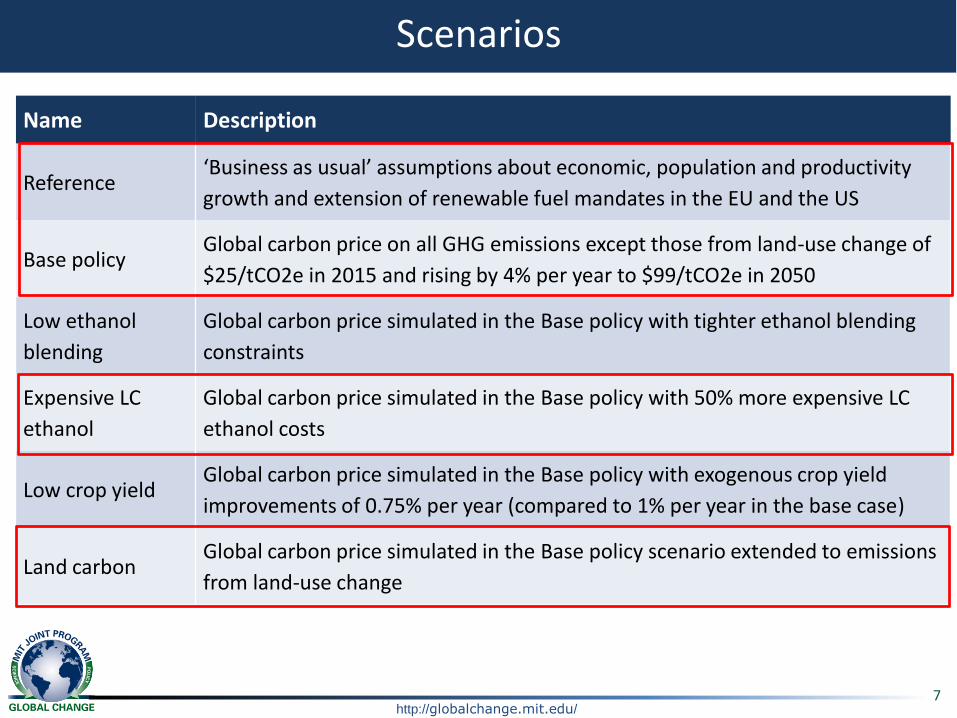
Scenarios
Name Description
Reference‘Business as usual’ assumptions about economic, population and productivity
growth and extension of renewable fuel mandates in the EU and the US
Base policyGlobal carbon price on all GHG emissions except those from land-use change of
$25/tCO2e in 2015 and rising by 4% per year to $99/tCO2e in 2050
Low ethanol
blending
Global carbon price simulated in the Base policy with tighter ethanol blending
constraints
Expensive LC
ethanol
Global carbon price simulated in the Base policy with 50% more expensive LC
ethanol costs
Low crop yieldGlobal carbon price simulated in the Base policy with exogenous crop yield
improvements of 0.75% per year (compared to 1% per year in the base case)
Land carbonGlobal carbon price simulated in the Base policy scenario extended to emissions
from land-use change
0
20
040
060
080
0
Energ
y p
roduction,
EJ
2020 2030 2040 2050
Ref
eren
ce
Bas
e po
licy
Low b
lend
Exp
en. L
C e
th.
Low yield
Land
car
bon
Ref
eren
ce
Bas
e po
licy
Low b
lend
Exp
en. L
C e
th.
Low yield
Land
car
bon
Ref
eren
ce
Bas
e po
licy
Low b
lend
Exp
en. L
C e
th.
Low yield
Land
car
bon
Ref
eren
ce
Bas
e po
licy
Low b
lend
Exp
en. L
C e
th.
Low yield
Land
car
bon
Coal Gas Oil Nuclear
Hydro Wind & Solar Biomass8
Global primary energy
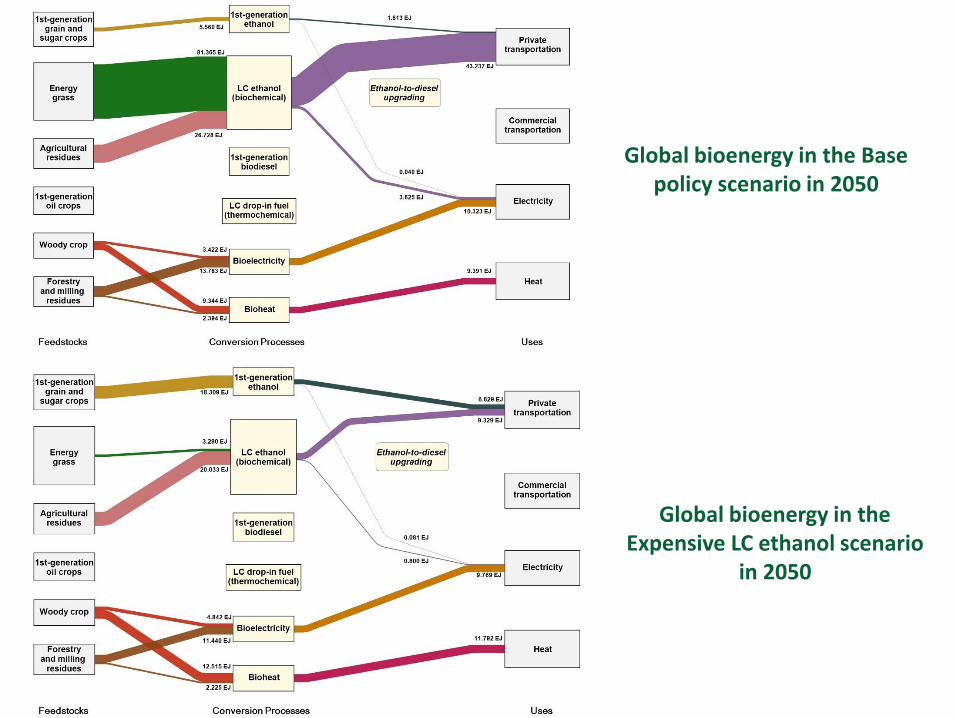
Global bioenergy in the Base policy scenario in 2050
Global bioenergy in the Expensive LC ethanol scenario
in 2050
0
2,0
00
4,0
00
6,0
00
8,0
00
10
,000
La
nd
are
a, m
illio
n h
a
2020 2030 2040 2050
Ref
eren
ce
Bas
e po
licy
Low b
lend
Exp
en. L
C e
th.
Low yie
ld
Land
car
bon
Ref
eren
ce
Bas
e po
licy
Low b
lend
Exp
en. L
C e
th.
Low yie
ld
Land
car
bon
Ref
eren
ce
Bas
e po
licy
Low b
lend
Exp
en. L
C e
th.
Low yie
ld
Land
car
bon
Ref
eren
ce
Bas
e po
licy
Low b
lend
Exp
en. L
C e
th.
Low yie
ld
Land
car
bon
Food crops Bioenergy crops Managed grassland Managed Forest
Natural grassland Natural forest Wind energy
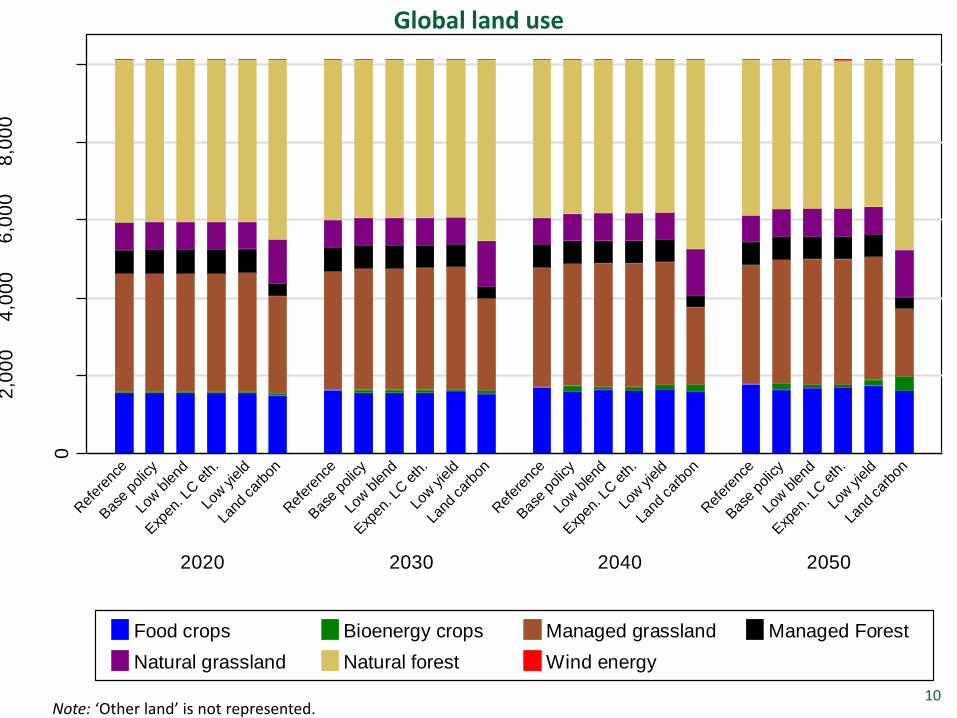
10Note: ‘Other land’ is not represented.
Global land use
11
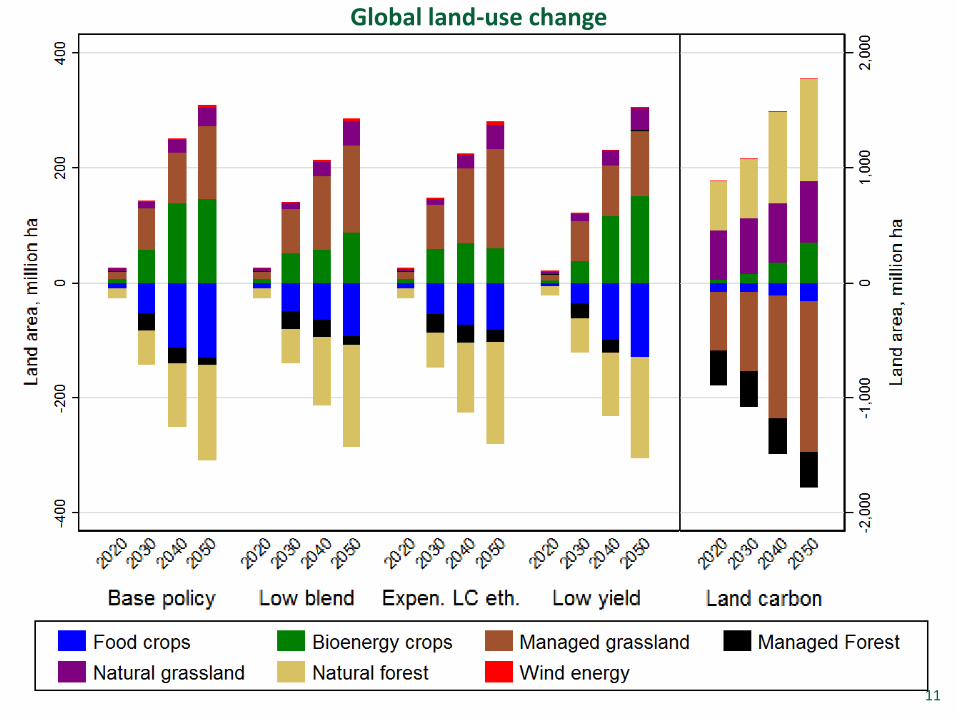
Global land-use change

-20
0
0
200
Lan
d a
rea,
mill
ion
ha
AFR
LAM
BRA
RUS
ANZ
EUR
USA
CAN
ROE
MEX
ASI
MES
CHN
REA
IND
JPN
a) Base policy
-20
0
0
200
Lan
d a
rea,
mill
ion
ha
AFR
LAM
BRA
RUS
ANZ
CAN
MEX
ASI
USA
CHN
MES
ROE
REA
EUR
IND
JPN
b) Low ethanol blending
-20
0
0
200
Lan
d a
rea,
mill
ion
ha
AFR
LAM
BRA
USA
RUS
ANZ
CAN
MEX
ASI
MES
CHN
ROE
REA
EUR
IND
JPN
c) Expensive LC ethanol
-20
0
0
200
Lan
d a
rea,
mill
ion
ha
AFR
LAM
BRA
RUS
ANZ
EUR
USA
ROE
CAN
MEX
ASI
MES
REA
CHN
IND
JPN
d) Low crop yield
-60
0
0
600
Lan
d a
rea,
mill
ion
ha
AFR
LAM
BRA
ANZ
ROE
RUS
MEX
REA
EUR
ASI
CAN
USA
MES
IND
CHN
JPN
e) Land carbon
Food crops Bioenergy crops Managed grassland Managed forest
Natural grassland Natural forest Wind energy12
Modeling scenarioRegional land-use change relative to the reference scenario, 2050
13http://globalchange.mit.edu/
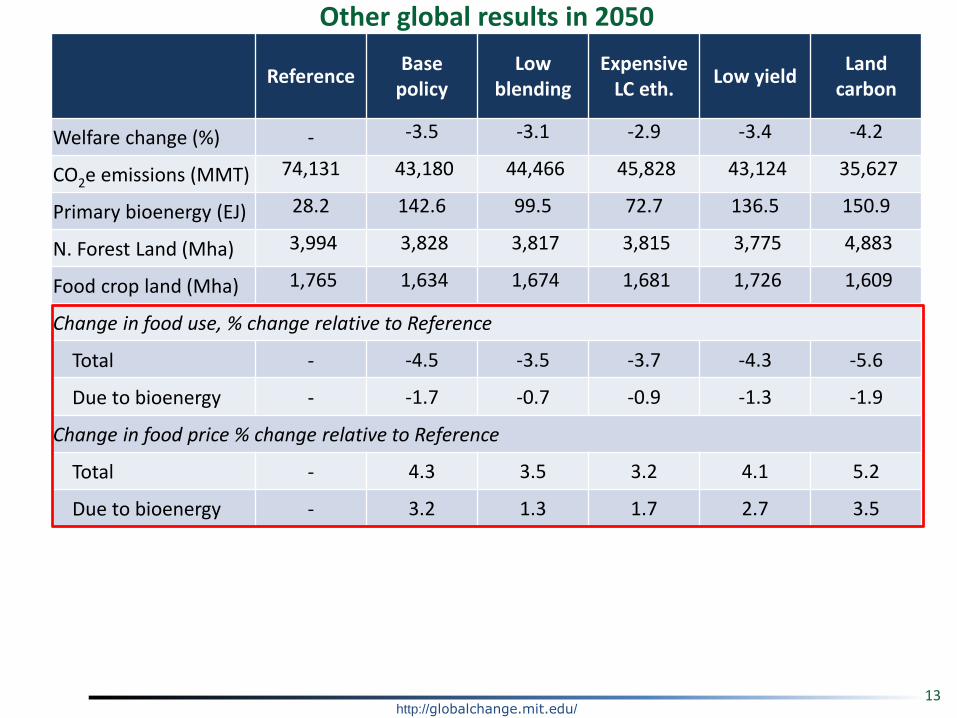
ResultsOther global results in 2050
ReferenceBase
policyLow
blendingExpensive
LC eth.Low yield
Land carbon
Welfare change (%) - -3.5 -3.1 -2.9 -3.4 -4.2
CO2e emissions (MMT) 74,131 43,180 44,466 45,828 43,124 35,627
Primary bioenergy (EJ) 28.2 142.6 99.5 72.7 136.5 150.9
N. Forest Land (Mha) 3,994 3,828 3,817 3,815 3,775 4,883
Food crop land (Mha) 1,765 1,634 1,674 1,681 1,726 1,609
Change in food use, % change relative to Reference
Total - -4.5 -3.5 -3.7 -4.3 -5.6
Due to bioenergy - -1.7 -0.7 -0.9 -1.3 -1.9
Change in food price % change relative to Reference
Total - 4.3 3.5 3.2 4.1 5.2
Due to bioenergy - 3.2 1.3 1.7 2.7 3.5
14http://globalchange.mit.edu/
Conclusions
• The impact of bioenergy production on food prices is limited by:
– Price-induced improvements in crop yields and conversion efficiency, reduced food wastage and incentives to collect more residues
• Penetration of LC biofuels rely on large reductions in costs for these technologies, otherwise first generation biofuels remain in the fuel mix, and bioelectricty and bioheat are the major forms of bioenegry
• Regardless of the location of bioenergy production, deforestation is largest in regions with the lowest barriers to conversion of natural areas
– Policies that specify life-cycle emissions reduction factors based on the location of bioenergy production (or even the type of bioenergy) are unlikely to be successful
Market Cost of Renewable Jet Fuel Adoption in the US
Backup slides
http://globalchange.mit.edu/
The Feasibility, Costs, and Environmental Implications of Large-scale Biomass Energy
16
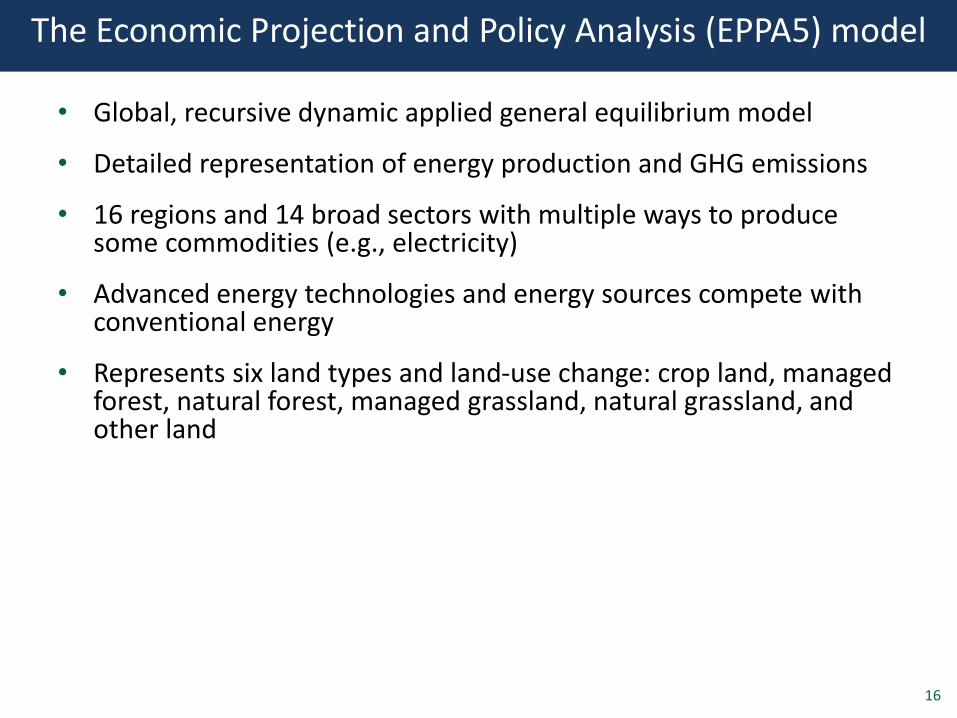
The Economic Projection and Policy Analysis (EPPA5) model
• Global, recursive dynamic applied general equilibrium model
• Detailed representation of energy production and GHG emissions
• 16 regions and 14 broad sectors with multiple ways to produce some commodities (e.g., electricity)
• Advanced energy technologies and energy sources compete with conventional energy
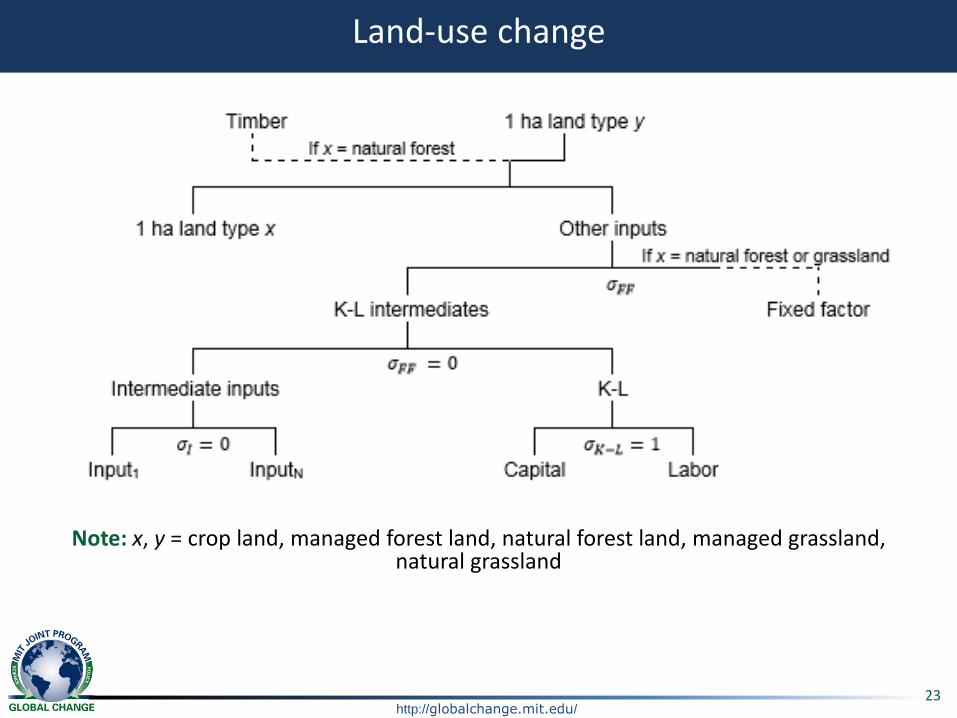
• Represents six land types and land-use change: crop land, managed forest, natural forest, managed grassland, natural grassland, and other land

17http://globalchange.mit.edu/
Modeling scenario
Note: x, y = crop land, managed forest land, natural forest land, managed grassland, natural grassland
Land-use change
18http://globalchange.mit.edu/
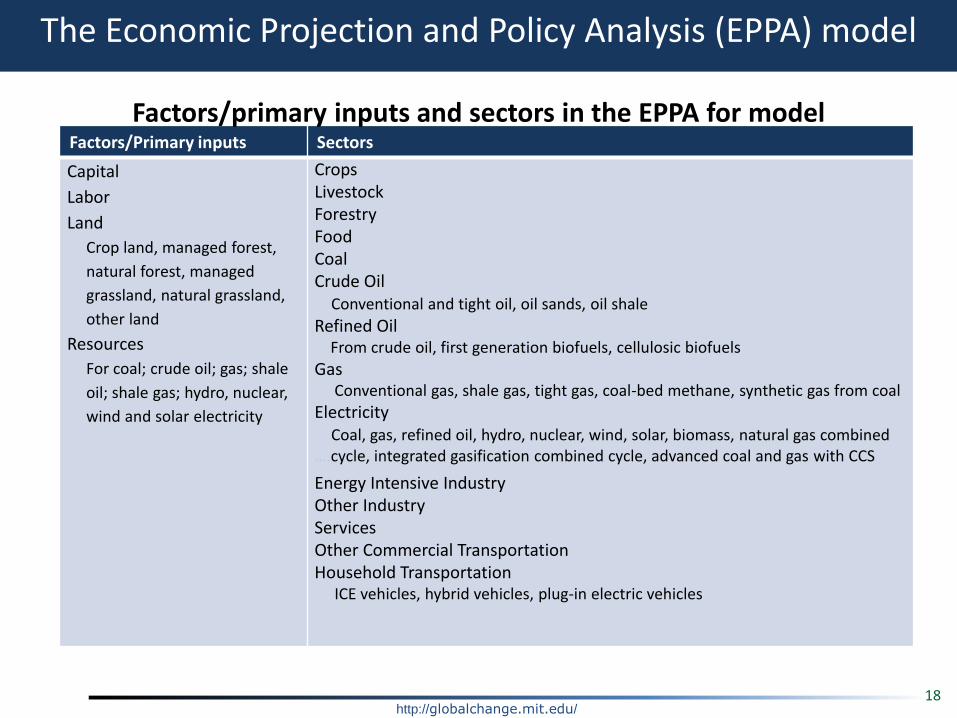
The Economic Projection and Policy Analysis (EPPA) model
Factors/Primary inputs Sectors
Capital
Labor
Land
Crop land, managed forest,
natural forest, managed
grassland, natural grassland,
other land
Resources
For coal; crude oil; gas; shale
oil; shale gas; hydro, nuclear,
wind and solar electricity
CropsLivestockForestryFoodCoal Crude Oil
Conventional and tight oil, oil sands, oil shale
Refined OilFrom crude oil, first generation biofuels, cellulosic biofuels
GasConventional gas, shale gas, tight gas, coal-bed methane, synthetic gas from coal
Electricity Coal, gas, refined oil, hydro, nuclear, wind, solar, biomass, natural gas combined
….cycle, integrated gasification combined cycle, advanced coal and gas with CCS
Energy Intensive IndustryOther IndustryServicesOther Commercial TransportationHousehold Transportation
ICE vehicles, hybrid vehicles, plug-in electric vehicles
Factors/primary inputs and sectors in the EPPA for model
19
20http://globalchange.mit.edu/
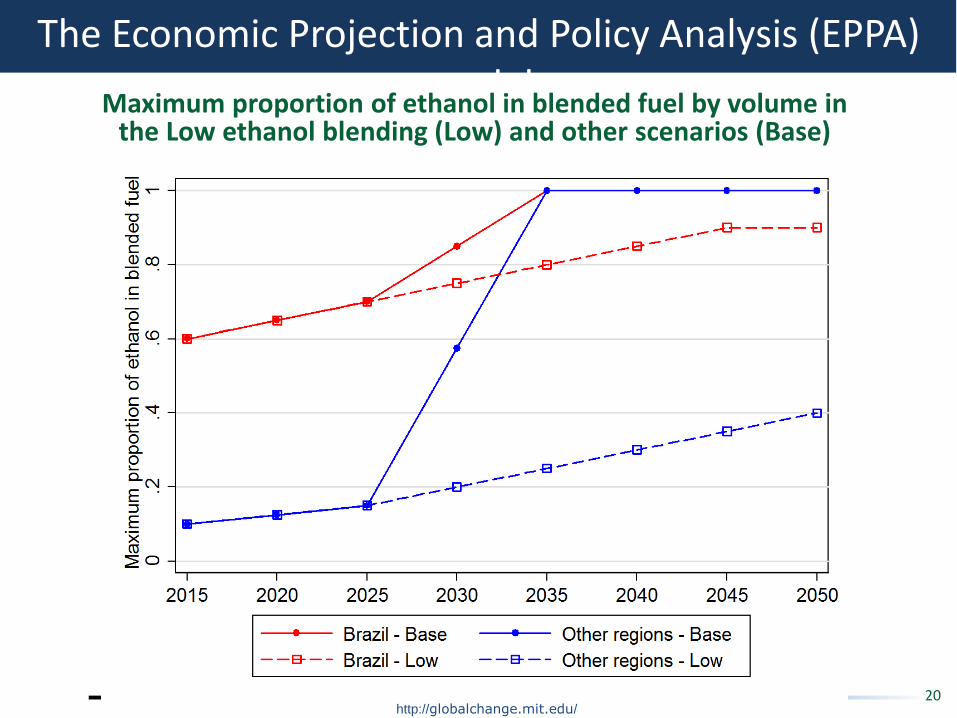
The Economic Projection and Policy Analysis (EPPA) modelMaximum proportion of ethanol in blended fuel by volume in
the Low ethanol blending (Low) and other scenarios (Base)
21http://globalchange.mit.edu/
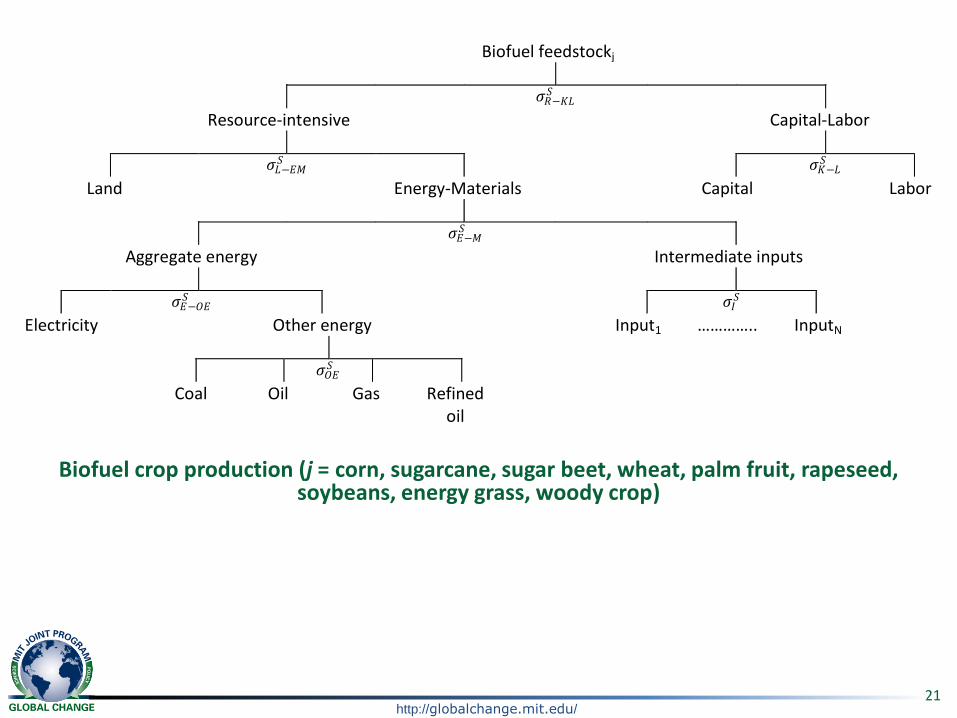
Modeling scenario Biofuel feedstockj
𝜎𝑅−𝐾𝐿𝑆
Resource-intensive Capital-Labor
𝜎𝐿−𝐸𝑀𝑆 𝜎𝐾−𝐿
𝑆
Land Energy-Materials Capital Labor
𝜎𝐸−𝑀𝑆
Aggregate energy Intermediate inputs
𝜎𝐸−𝑂𝐸𝑆 𝜎𝐼
𝑆 Electricity Other energy Input1 ………….. InputN
𝜎𝑂𝐸𝑆
Coal Oil Gas Refined oil
Biofuel crop production (j = corn, sugarcane, sugar beet, wheat, palm fruit, rapeseed, soybeans, energy grass, woody crop)
22http://globalchange.mit.edu/
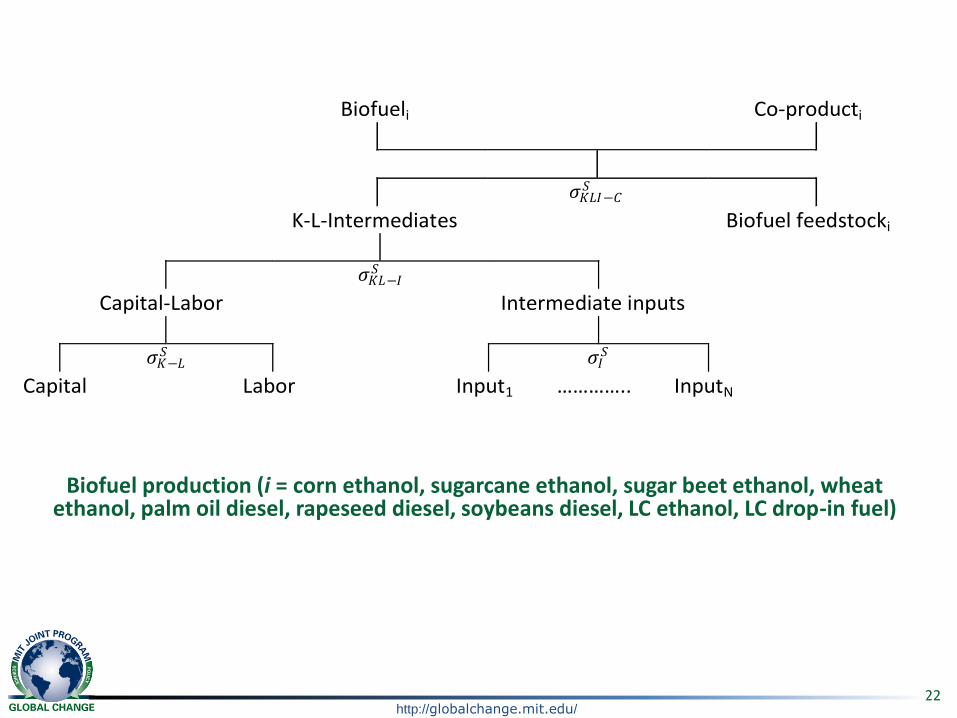
Modeling scenario
Biofuel production (i = corn ethanol, sugarcane ethanol, sugar beet ethanol, wheat ethanol, palm oil diesel, rapeseed diesel, soybeans diesel, LC ethanol, LC drop-in fuel)
Biofueli Co-producti
𝜎𝐾𝐿𝐼−𝐶𝑆
K-L-Intermediates Biofuel feedstocki
𝜎𝐾𝐿−𝐼𝑆
Capital-Labor Intermediate inputs
𝜎𝐾−𝐿𝑆 𝜎𝐼
𝑆 Capital Labor Input1 ………….. InputN
Biofuel production
23http://globalchange.mit.edu/
Modeling scenario
Note: x, y = crop land, managed forest land, natural forest land, managed grassland, natural grassland
Land-use change
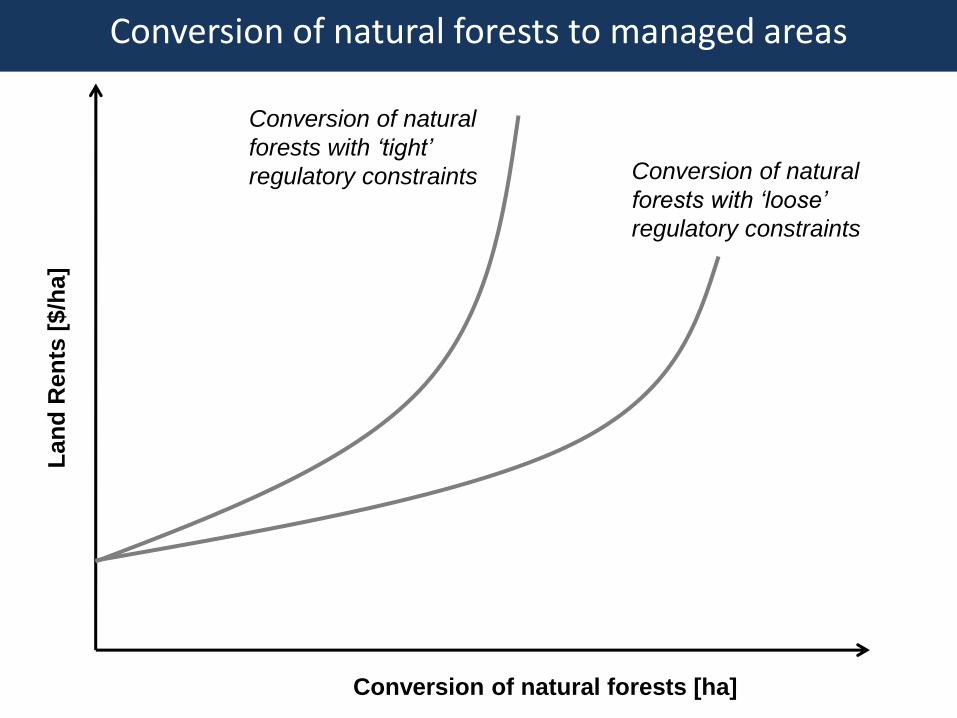
Conversion of natural forests [ha]
Lan
d R
en
ts [
$/h
a]
Conversion of natural
forests with ‘tight’
regulatory constraints Conversion of natural
forests with ‘loose’
regulatory constraints
Conversion of natural forests to managed areas
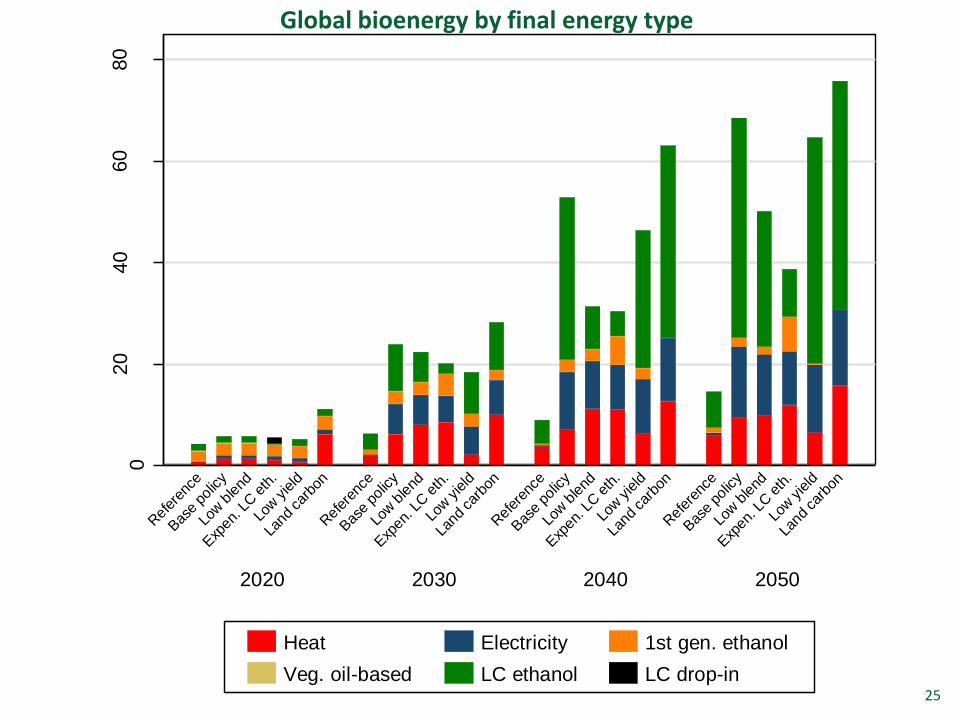
020
40
60
80
Bio
en
erg
y,
EJ
2020 2030 2040 2050
Ref
eren
ce
Bas
e po
licy
Low b
lend
Exp
en. L
C e
th.
Low yield
Land
car
bon
Ref
eren
ce
Bas
e po
licy
Low b
lend
Exp
en. L
C e
th.
Low yield
Land
car
bon
Ref
eren
ce
Bas
e po
licy
Low b
lend
Exp
en. L
C e
th.
Low yield
Land
car
bon
Ref
eren
ce
Bas
e po
licy
Low b
lend
Exp
en. L
C e
th.
Low yield
Land
car
bon
Heat Electricity 1st gen. ethanol
Veg. oil-based LC ethanol LC drop-in25
Global bioenergy by final energy type
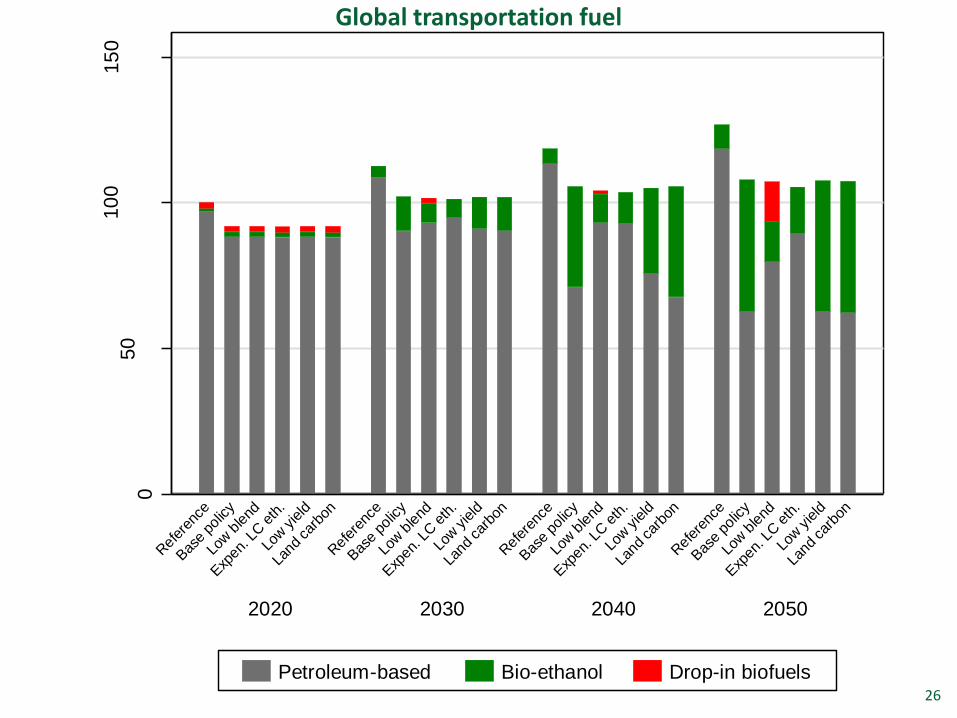
050
10
015
0
Tra
nsport
ation f
uel, E
J
2020 2030 2040 2050
Ref
eren
ce
Bas
e po
licy
Low b
lend
Exp
en. L
C e
th.
Low yield
Land
car
bon
Ref
eren
ce
Bas
e po
licy
Low b
lend
Exp
en. L
C e
th.
Low yield
Land
car
bon
Ref
eren
ce
Bas
e po
licy
Low b
lend
Exp
en. L
C e
th.
Low yield
Land
car
bon
Ref
eren
ce
Bas
e po
licy
Low b
lend
Exp
en. L
C e
th.
Low yield
Land
car
bon
Petroleum-based Bio-ethanol Drop-in biofuels26
Global transportation fuel
050
10
015
0
Ele
ctr
icity p
rod
uctio
n,
EJ
2020 2030 2040 2050
Ref
eren
ce
Bas
e po
licy
Low b
lend
Exp
en. L
C e
th.
Low yield
Land
car
bon
Ref
eren
ce
Bas
e po
licy
Low b
lend
Exp
en. L
C e
th.
Low yield
Land
car
bon
Ref
eren
ce
Bas
e po
licy
Low b
lend
Exp
en. L
C e
th.
Low yield
Land
car
bon
Ref
eren
ce
Bas
e po
licy
Low b
lend
Exp
en. L
C e
th.
Low yield
Land
car
bon
Coal Gas Oil Nuclear
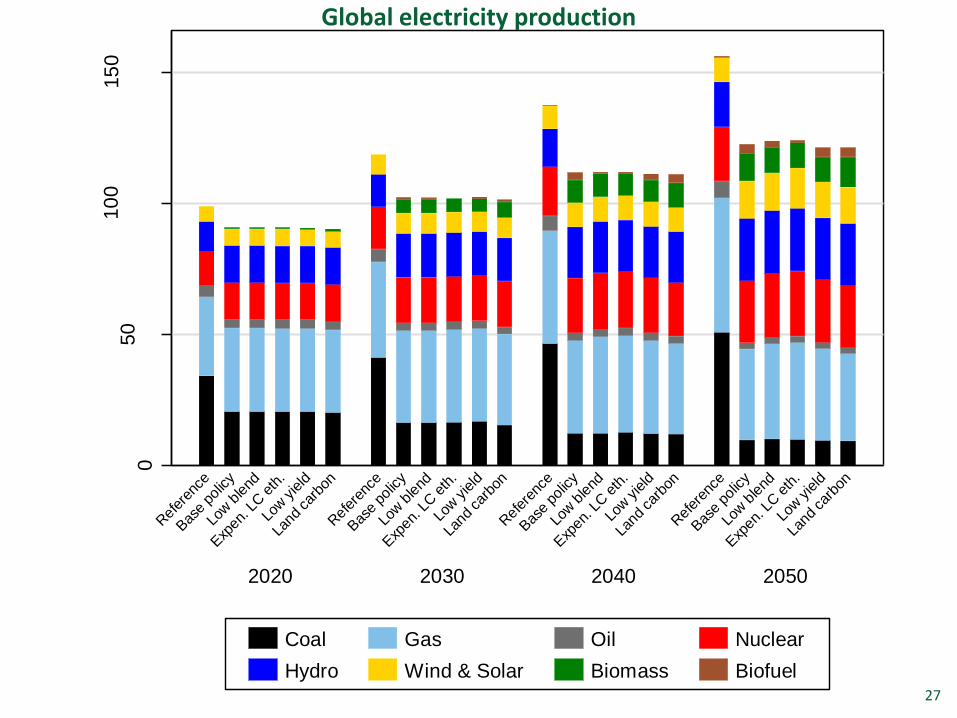
Hydro Wind & Solar Biomass Biofuel27
Global electricity production
020
40
60
80
Bio
en
erg
y,
EJ
2020 2030 2040 2050
Ref
eren
ce
Bas
e po
licy
Low b
lend
Exp
en. L
C e
th.
Low yield
Land
car
bon
Ref
eren
ce
Bas
e po
licy
Low b
lend
Exp
en. L
C e
th.
Low yield
Land
car
bon
Ref
eren
ce
Bas
e po
licy
Low b
lend
Exp
en. L
C e
th.
Low yield
Land
car
bon
Ref
eren
ce
Bas
e po
licy
Low b
lend
Exp
en. L
C e
th.
Low yield
Land
car
bon
Corn Sugarcane Rapeseed
Palm fruit Soybean Energy grass
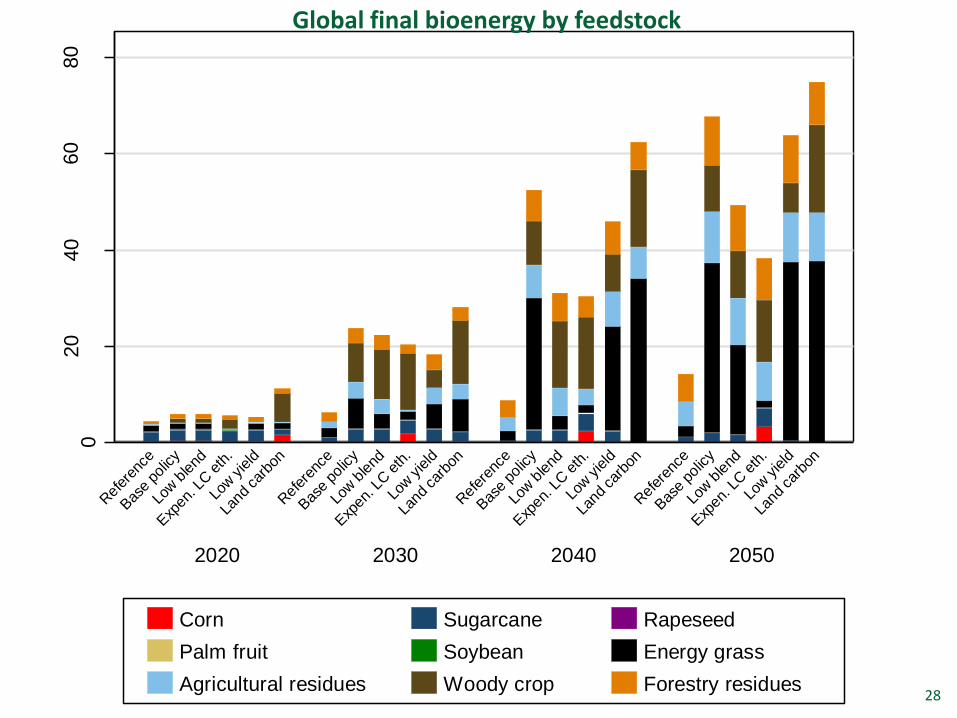
Agricultural residues Woody crop Forestry residues28
Global final bioenergy by feedstock
04
81
21
6
Bio
ene
rgy,
EJ
CHN
IND
USA
AFR
BRA
EUR
ASI
REA
LAM
CAN
MEX
ROE
ANZ
RUS
MES
JPN
a) Reference
04
81
21
6
Bio
ene
rgy,
EJ
AFR
BRA
CHN
IND
RUS
USA
EUR
LAM
ASI
ROE
CAN
REA
ANZ
MEX
MES
JPN
b) Base policy
04
81
21
6
Bio
ene
rgy,
EJ
BRA
AFR
CHN
RUS
IND
ASI
CAN
USA
EUR
LAM
ROE
REA
MEX
ANZ
MES
JPN
c) Low ethanol blending
04
81
21
6
Bio
ene
rgy,
EJ
CHN
BRA
IND
USA
RUS
AFR
CAN
ASI
EUR
ROE
MEX
REA
LAM
ANZ
MES
JPN
d) Expensive LC ethanol
04
81
21
6
Bio
ene
rgy,
EJ
AFR
BRA
CHN
IND
RUS
USA
EUR
LAM
ASI
ROE
CAN
REA
ANZM
EX
MES
JPN
e) Low crop yield
04
81
21
6
Bio
ene
rgy,
EJ
BRA
AFR
LAM
CHN
IND
RUS
USA
CAN
ASI
ANZ
EUR
ROE
REA
MEX
MES
JPN
f) Land carbon
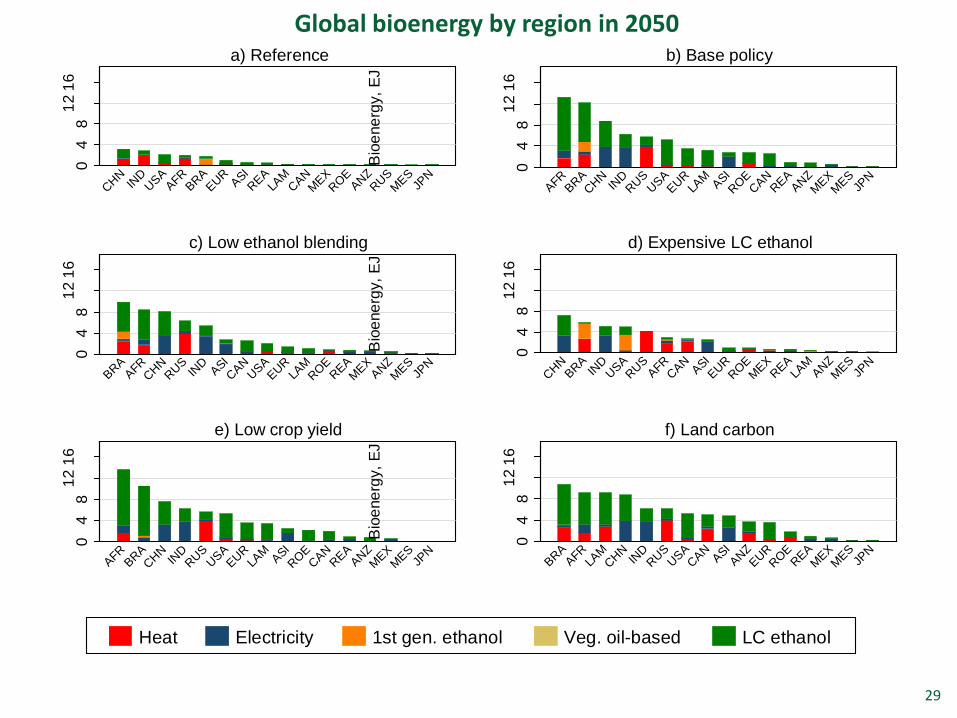
Heat Electricity 1st gen. ethanol Veg. oil-based LC ethanol
29
Global bioenergy by region in 2050

-20
0
0
200
Lan
d a
rea,
mill
ion
ha
AFR
LAM
BRA
RUS
ANZ
EUR
USA
CAN
ROE
MEX
ASI
MES
CHN
REA
IND
JPN
a) Base policy
-20
0
0
200
Lan
d a
rea,
mill
ion
ha
AFR
LAM
BRA
RUS
ANZ
CAN
MEX
ASI
USA
CHN
MES
ROE
REA
EUR
IND
JPN
b) Low ethanol blending
-20
0
0
200
Lan
d a
rea,
mill
ion
ha
AFR
LAM
BRA
USA
RUS
ANZ
CAN
MEX
ASI
MES
CHN
ROE
REA
EUR
IND
JPN
c) Expensive LC ethanol
-20
0
0
200
Lan
d a
rea,
mill
ion
ha
AFR
LAM
BRA
RUS
ANZ
EUR
USA
ROE
CAN
MEX
ASI
MES
REA
CHN
IND
JPN
d) Low crop yield
-60
0
0
600
Lan
d a
rea,
mill
ion
ha
AFR
LAM
BRA
ANZ
ROE
RUS
MEX
REA
EUR
ASI
CAN
USA
MES
IND
CHN
JPN
e) Land carbon
Food crops Bioenergy crops Managed grassland Managed forest
Natural grassland Natural forest Wind energy30
Modeling scenarioRegional land-use change relative to the reference scenario, 2050
31http://globalchange.mit.edu/
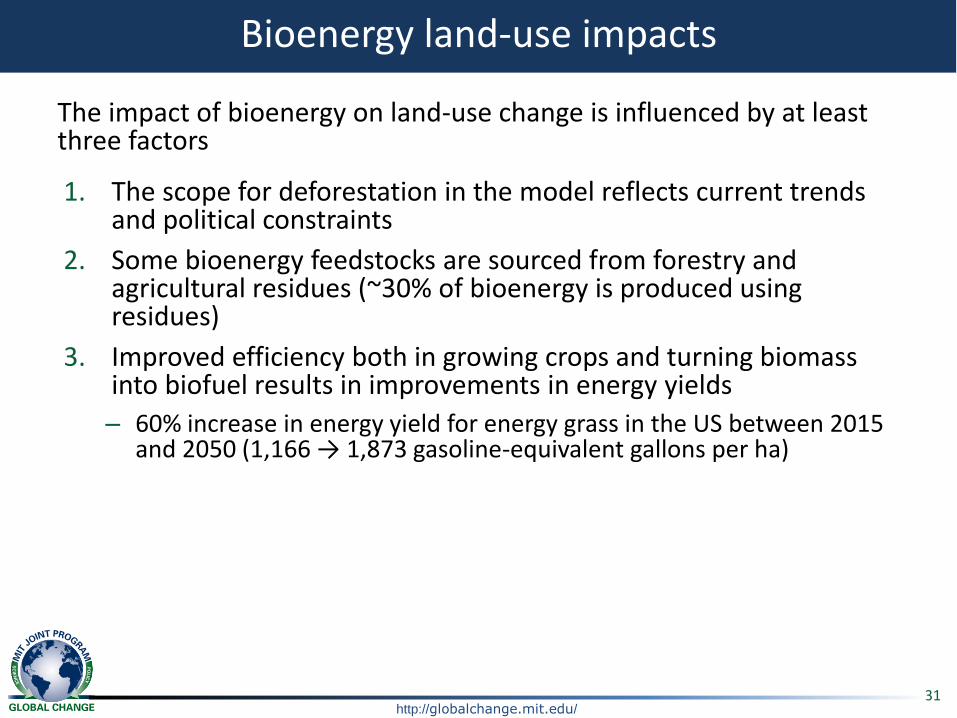
Bioenergy land-use impacts
The impact of bioenergy on land-use change is influenced by at least three factors
1. The scope for deforestation in the model reflects current trends and political constraints
2. Some bioenergy feedstocks are sourced from forestry and agricultural residues (~30% of bioenergy is produced using residues)
3. Improved efficiency both in growing crops and turning biomass into biofuel results in improvements in energy yields
– 60% increase in energy yield for energy grass in the US between 2015 and 2050 (1,166 → 1,873 gasoline-equivalent gallons per ha)
32http://globalchange.mit.edu/
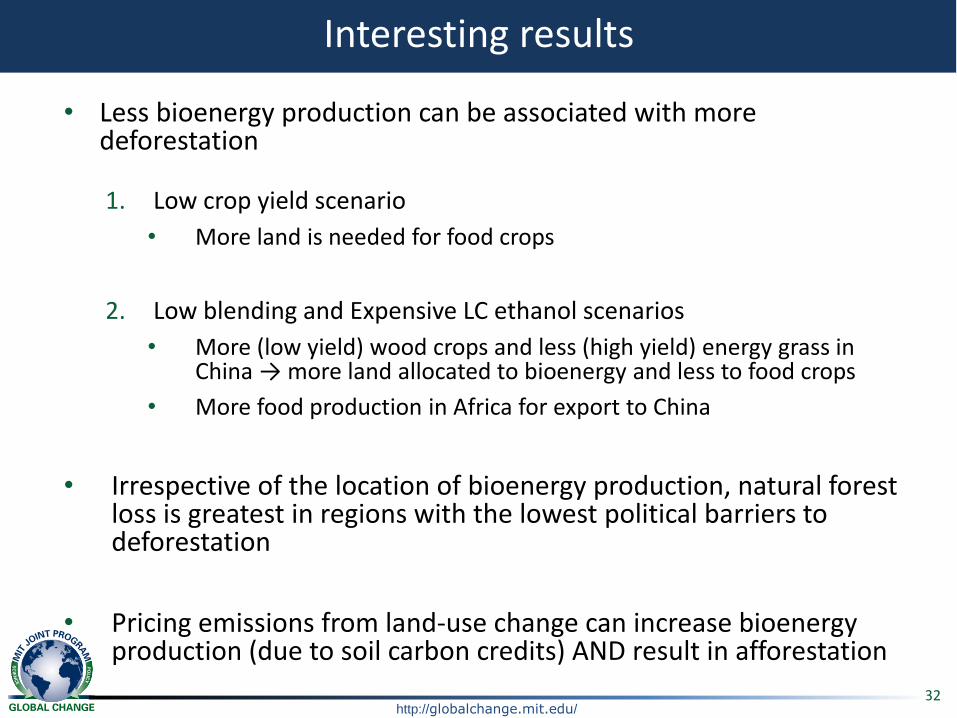
Interesting results
• Less bioenergy production can be associated with more deforestation
1. Low crop yield scenario
• More land is needed for food crops
2. Low blending and Expensive LC ethanol scenarios
• More (low yield) wood crops and less (high yield) energy grass in China → more land allocated to bioenergy and less to food crops
• More food production in Africa for export to China
• Irrespective of the location of bioenergy production, natural forest loss is greatest in regions with the lowest political barriers to deforestation
• Pricing emissions from land-use change can increase bioenergy production (due to soil carbon credits) AND result in afforestation
33http://globalchange.mit.edu/
Modeling scenario
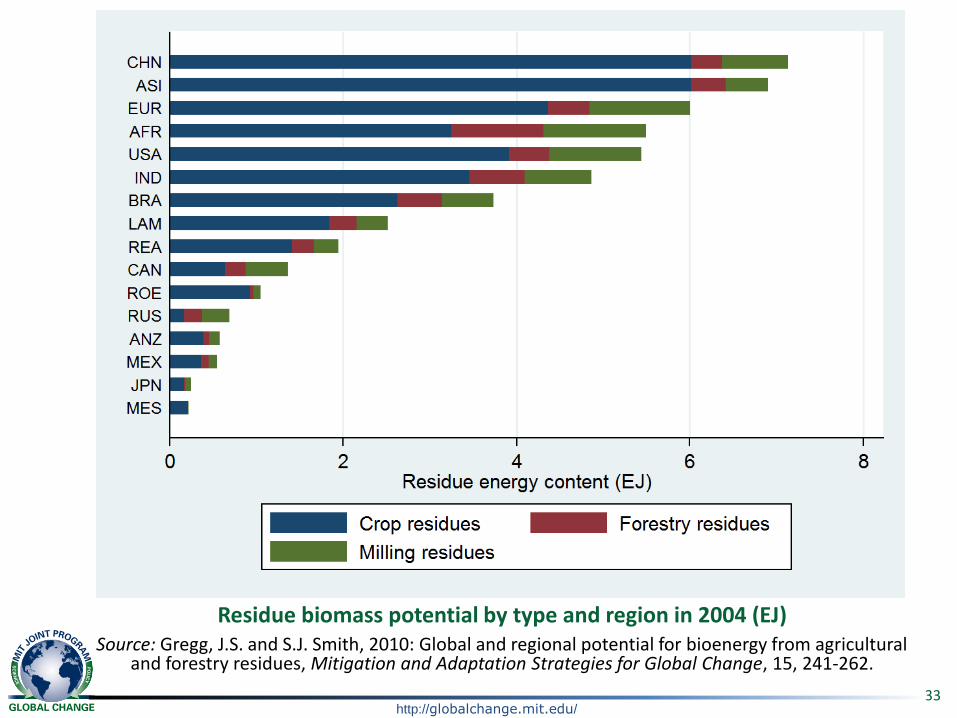
Residue biomass potential by type and region in 2004 (EJ)Source: Gregg, J.S. and S.J. Smith, 2010: Global and regional potential for bioenergy from agricultural
and forestry residues, Mitigation and Adaptation Strategies for Global Change, 15, 241-262.
34http://globalchange.mit.edu/
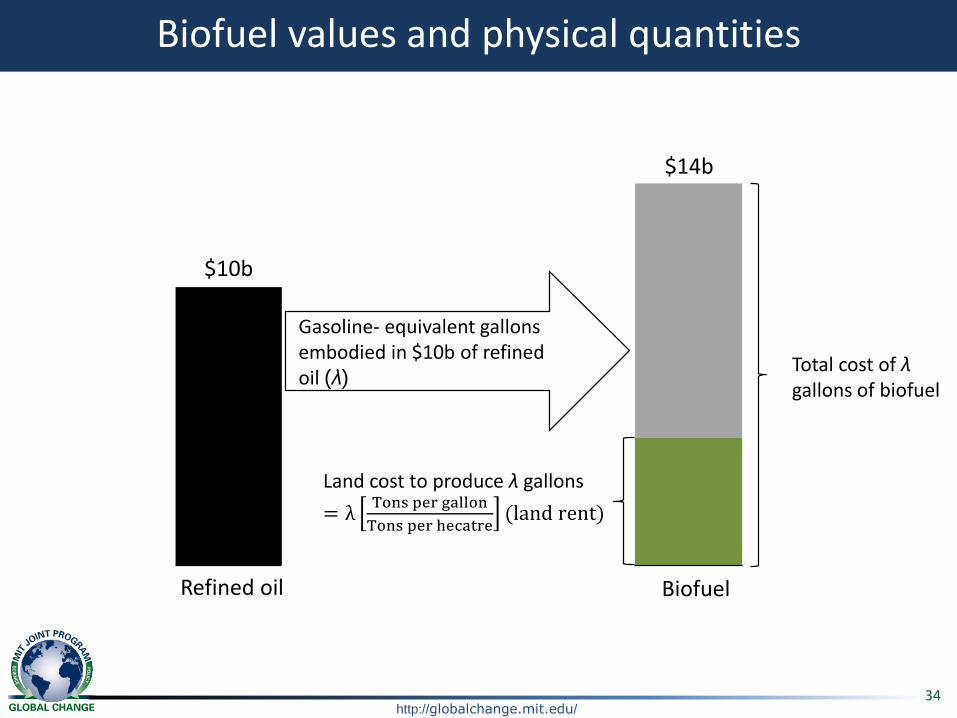
Biofuel values and physical quantities
$10b
Gasoline- equivalent gallons embodied in $10b of refined oil (λ)
Land cost to produce λ gallons
= λTons per gallon
Tons per hecatre(land rent)
Total cost of λgallons of biofuel
$14b
Refined oil Biofuel
35http://globalchange.mit.edu/
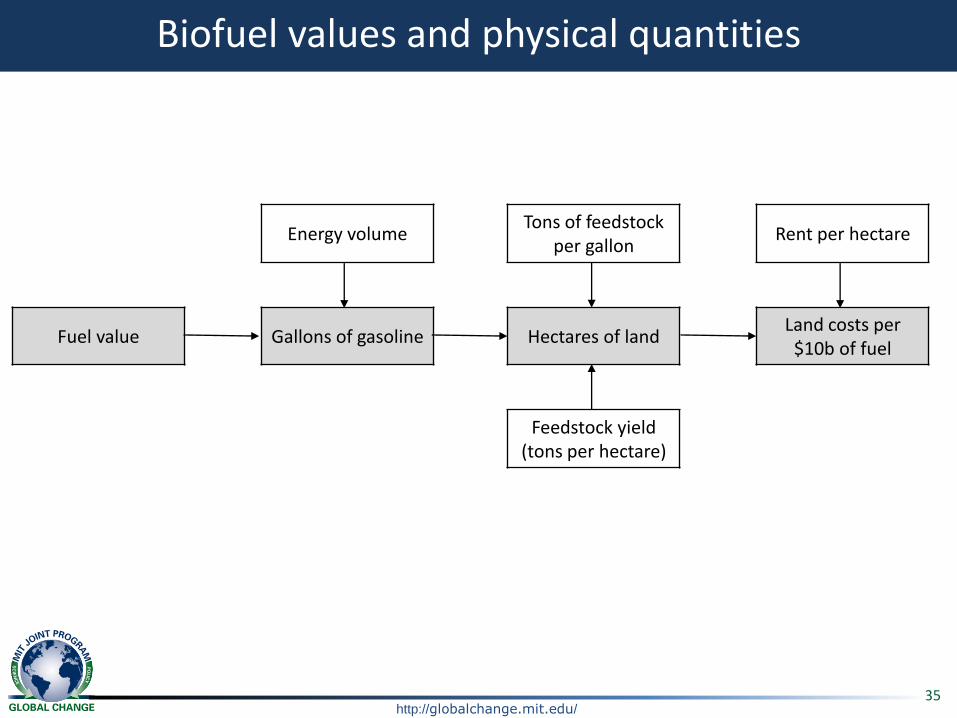
Biofuel values and physical quantities
Energy volumeTons of feedstock
per gallonRent per hectare
Fuel value Gallons of gasoline Hectares of landLand costs per
$10b of fuel
Feedstock yield (tons per hectare)