the role of t-box (tbx) 2 in osteoblast function
TRANSCRIPT

University of ConnecticutOpenCommons@UConn
Master's Theses University of Connecticut Graduate School
1-28-2011
The Role of T-box (Tbx) 2 in Osteoblast FunctionNidhish [email protected]
This work is brought to you for free and open access by the University of Connecticut Graduate School at OpenCommons@UConn. It has beenaccepted for inclusion in Master's Theses by an authorized administrator of OpenCommons@UConn. For more information, please [email protected].
Recommended CitationFrancis, Nidhish, "The Role of T-box (Tbx) 2 in Osteoblast Function" (2011). Master's Theses. 103.https://opencommons.uconn.edu/gs_theses/103

1
The role of T-box (Tbx) 2 on osteoblast function
Nidhish Francis
B.V.Sc. & A.H., Kerala Agricultural University, 2008
A thesis
Submitted in Partial Fulfillment of the
Requirements for the Degree of
Master of Science
at the
University of Connecticut
2011
APPROVAL PAGE
Master of Science Thesis

2
The role of T-box (Tbx) 2 in osteoblast function
Presented by
Nidhish Francis, B.V.Sc. & A.H.
Major Advisor_________________________________________________
Kristen E. Govoni
Associate Advisor________________________________________________
Kumar Venkitanarayanan
Associate Advisor________________________________________________
Gary Kazmer
University of Connecticut
2011

3
ACKNOWLEDGEMENTS
I am extremely grateful to my major advisor, Dr. Kristen Govoni for providing me
a golden opportunity to pursue graduate research in U.S.A. Without her guidance and
support, this thesis would not have been possible. I am very thankful for your constant
encouragement, support throught my graduate studies. I express my special gratitude
for taking your time in correcting my thesis.
I am laso thankful to my associate advisors, Dr. Kumar Venkitanarayanan and
Dr. Gary Kazmer for their constant support. They have been very helpful in
troubleshooting many of my experiments.
I take this opportunity to thank Dr. Hedley C.Freake for allowing me to use his lab
for some of my experiments.
I am extremely thankful to my lab mates, Elizabeth Ackell and Maria Procopio for
helping me throughout my research. Without their moral support and help, it would have
been very difficult to make this thesis possible.
I also acknowledge Kavitha Sankavaram and Leelyn Chong for their immense
help with western blot analysis. I would also like to acknowledge all the graduate
students and staff of the Department of Animal Science for their assistance in my
project.

4
I would also like to thank my friends in India, Aravind and Renjith, who have been
very concerned about my research progress and always helped me out with any issues.
I take this chance to acknowledge my parents, Francis and Valsa for their
affection, care and moral support. Their constant motivation has always helped me in
life.

5
TABLE OF CONTENTS
Approval page………………………………………………………………………….. ii
Title page…………………………………………………………………………………iii
Acknowledgements……………………………………………………………………. iv
Table of contents………………………………………………………………………. v
List of figures……………………………………………………………………………..vii
List of abbreviations…………………………………………………………………….viii
Review of literature
Introduction………………………………………………………………………1
Bone remodeling………………………………………………………………...5
Regulation of bone remodeling………………………………………………11
Transcriptional control of osteoblast function………………………………15
T-box (Tbx) family………………………………………………………………20
Tbx2……………………………………………………………………………...26
Hypothesis and aims……………………………………………………………………32
Materials and methods
Cell culture………………………………………………………………………34
Isolation of mouse bone marrow stromal cells……………………………...34
siRNA transfection……………………………………………………………..35

6
RNA extraction………………………………………………………………….36
Reverse transcription…………………………………………………………..37
Real-time RT-PCR……………………………………………………………..37
Western blot…………………………………………………………………….38
Cell proilferation assay………………………………………………………...40
Cell differentiation assay………………………………………………………42
Stastistical analysis……………………………………………………………..43
Results
Efficiency of siRNA transfection……………………………………………...44
Knockdown of Tbx2 expression using siRNA………………………………44
Western blot analysis…………………………………………………………..45
Role of Tbx2 in osteoblast function………………………………………….46
Figures…………………………………………………………………………..47
Discussion……………………………………………………………………………….55
Appendix…………………………………………………………………………………64
References………………………………………………………………………………83

7
LIST OF FIGURES
Figure Page
1. Transcriptional control of osteoblast and chondrocyte differentiation……16
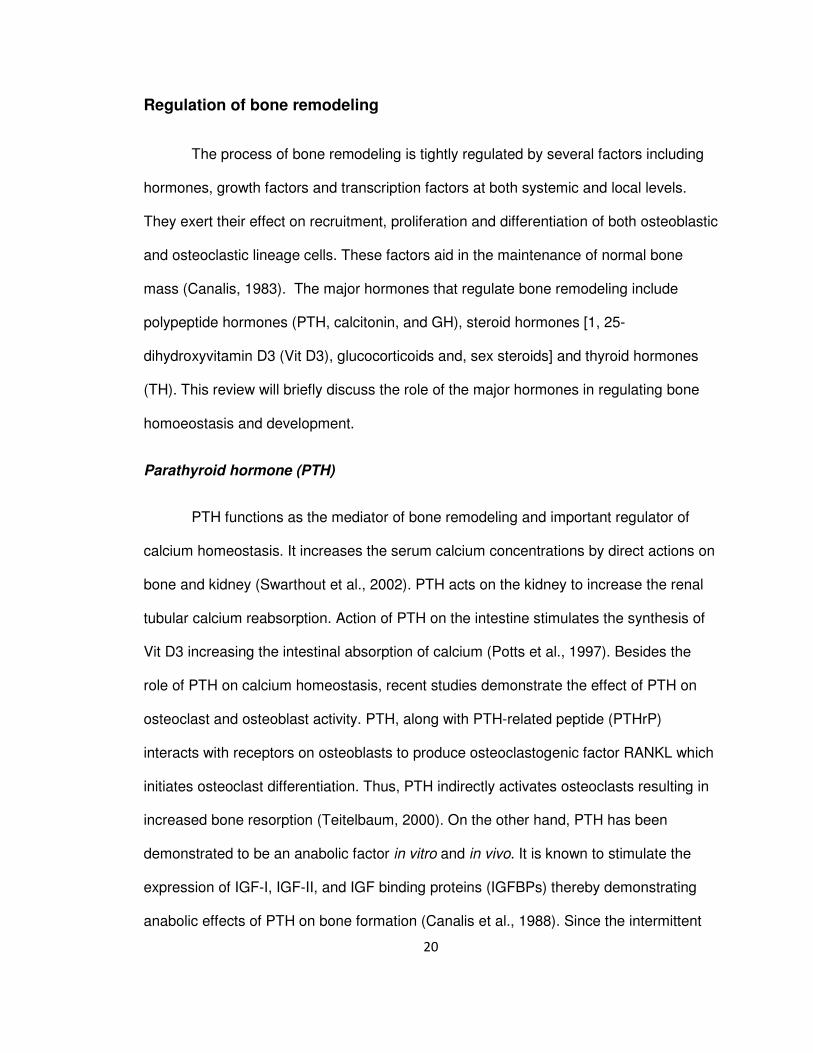
2. Optimization of siRNA transfection. ………………………………………….48
3. Transfection efficiency of MC3T3-E1 cells using 66 nM of
siGLO red siRNA and 1 µL of Lipofectamine 2000. ………………………..49
4. Knockdown of Tbx2 expression……………………………………………….50
5. Expression of Tbx3 in cells transfected with Tbx2 siRNA. ………………..50
6. Tbx2 protein in various tissues and cells. …………………………………...51
7. Confirmation of Tbx2 protein in moue and human samples. ……………..51
8. Role of Tbx2 in osteoblast cell number. …………………………………….52
9. Role of Tbx2 in osteoblast DNA synthesis. …………………………………52
10. Role of Tbx2 in osteoblast differentiation. …………………………………..53

8
ABBREVIATIONS
α–MEM α minimal essential medium
ALP alkaline phosphatase
ANF atrial natriuretic factor
AP1 activator protein 1
ATF4 activating transcription factor 4
BMD bone mineral density
BMPs bone morphogenetic proteins
BMSC bone marrow stromal cells
BMU basic multicellular unit
BSP bone sialoprotein
Coll-l collagen type-l
CREB cAMP reponse elements binding
CS calf serum
Cx connexin
DGS DiGeorge syndrome
Dlx distal-less homeobox
ECM extracellular matrix
FBS fetal bovine serum
FGF fibroblast growth factor
GH growth hormone
GHRH growth hormone releasing hormone
IGF insulin-like growth factor

9
IGFBPs IGF binding proteins
MITF microphthalamia associated transcription factor
MMP matrix metalloproteinases
OCIL osteoclast inhibitory lectin
OCN osteocalcin
Osf osteoblast-specific factor
Osx osterix
PDGF platelet derived growth factor
pNPP p-Nitrophenyl phosphate
POMC pro-opiomelanocortin
PPAR proliferation–activated receptor
PPIA peptidylprolyl isomerase A
PS penicillin-streptomycin
PTH parathyroid hormone
RANKL receptor activator for nuclear factor κ B receptor ligand
Runx2 runt-related transcription factor 2
siRNA small interfering RNA
Shh sonic hedgehog
Sox sry-related HMG box
TBST Tris-buffered saline tween-20
TH thyroid hormone
UMS ulnar mammary syndrome
Vit D3 1, 25-dihydroxyvitamin D3
Wnt wingless-int

10
REVIEW OF LITERATURE
Introduction
Bone is composed of dense connective tissue that forms the structural
framework of vertebrates. There are approximately 206 bones in an adult human body
and 270 in an infant. All these bones vary greatly in their shape and functions. The
functions of bone can be organized into three categories: mechanical, synthetic and
metabolic. Mechanical functions of bone include protection of internal organs, providing
shape to the body and movement. For instance, brain is protected by skull and heart and
lungs are enclosed in the ribcage. Bone, along with muscles, tendons, and ligaments
function together to aid in movement of a part of or the whole body. A specialized
mechanical function of bone is also involved in sound transduction, particularly in the
middle ear. The synthetic function of bone tissue primarily comprises of haematopoesis.
This takes place in the medullary cavity of long bones, where blood cells are produced
from their progenitors. Bone also functions as a storage organ for minerals, growth
factors and fat (energy reservoir) which formulates the bone tissue to play an essential
role in body metabolism.
Based on the structure, bone tissue can be categorized as compact bone or
spongy bone. Compact bone, also called cortical bone, makes up the shaft of long
bones and surfaces of other bones (Galante et al., 1970). Compact bone provides a
smooth, white appearance to the bone and accounts for 80% of total bone mass of the
skeleton. The fundamental functional unit of compact bone is known as Osteon or

11
Haversian system. Osteon is characterized as a long narrow cylinder that is
approximately 10 mm in length and 0.2 µm in width (Buckwalter et al., 1995).
Each osteon consists of a central canal or Haversian canal, which contains bone’s blood
and nerve supplies. Surrounding the canal are concentric layers (lamellae) of compact
bone tissue. Lamellae consist of osteocytes lodged in spaces (lacunae) of mineralized
bony matrix. These osteocytes within an osteon are connected to each other and to the
central canal by fine cellular extensions called canaliculi. These canaliculi facilitate the
exchange of nutrients and metabolite waste between osteocytes and blood vessels.
Osteons are connected to each other and periosteum by oblique channels called as
Volkmann’s canals.
Cellular and molecular structure
The major cells involved in bone growth and maintenance are osteoblasts,
osteoclasts and osteocytes. Osteoblasts are responsible for production of major
constituents of bone matrix, thereby commonly referred to as bone forming cells. They
originate from multipotent mesenchymal stem cells that later differentiate to
preosteoblasts and terminally differentiate into functional mature osteoblasts (Aubin et
al., 1995). The transition from osteoprogenitors to mature osteoblasts is induced by
several growth factors including insulin-like growth factor (IGF), platelet derived growth
factor (PDGF), fibroblast growth factor (FGF) and transforming growth factor-β (TGF-β)
(Aronow et al., 1990). A mature osteoblast synthesizes a collagen rich matrix (osteoid)
which later mineralizes to form the mature bone. During mineralization, some of the
osteoblasts get entrapped within the bony matrix and differentiate into osteocytes. On
the contrary, some of the osteoblasts remain on the bone surface to form flat lining cells.
Osteocytes are essentially osteoblasts that are trapped within the bony matrix. These

12
osteocytes undergo a change in morphology and develop numerous long cytoplasmic
processes that occupy the canaliculi and facilitate the exchange of nutrients and waste.
The functional activity of osteocytes is similar to the osteoblasts but has limited capacity
of protein synthesis (Nefussi et al., 1991).
Another major cell involved during bone remodeling is the osteoclast which is
responsible for bone resorption. Unlike osteoblasts, osteoclasts originate from
hematopoetic monocyte-macrophage cell lineage (Gothlin and Ericsson, 1976).
Osteoclasts are found in contact with a bone surface and enclosed within a resorption
lacuna (Howship’s lacuna). They are characterized by a giant size (up to 100 mm in
diameter), multinucleated (usually 10 to 20 nuclei), ruffled border (foldings of the plasma
membrane facing the bony matrix), sealing zone (the surrounding zone of attachment of
osteoclast to the bony matrix) and a foamy appearance due to a greater concentration of
vesicles and vacuoles (Gothlin and Ericsson, 1976).
Significance of bone related research
Over the past years, many research laboratories throughout the world including
those at the academic and industrial levels have focused on a better understanding of
the molecular mechanisms regulating bone formation and growth. A major cause for this
rise in research is explained by a steady increase in bone related diseases in humans.
For instance, osteoporosis is one such disease which is on a steady rise in the U.S.A.
and all over the world. Statistical estimates by the National Osteoporosis Foundation,
U.S.A. revealed that about 44 million people are affected by osteoporosis in the U.S.A.
and it is expected to increase to 52 and 62 million by 2010 and 2020, respectively
(National Osteoporosis Foundation, 2010). In addition, osteoporosis related fractures

13
were estimated to cost 19 billion dollars in 2005 and are expected to rise to 25 billion
dollars by 2025 (National Osteoporosis Foundation, 2010).
Primary osteoporosis is the most common metabolic disorder of the skeleton and
has been extensively studied (Raisz and Prestwood, 2000). This disease has been
broadly classified into type1 (postmenopausal osteoporosis) and type 2 (senile
osteoporosis) osteoporosis (Ralston, 1997). Osteoporosis is a disease characterized by
reduced bone mineral density (BMD) and fragile bones leading to increased risk of
fracture. The reduced BMD occurs due to an imbalance between bone formation and
bone resorption. In a normal individual there exists a balance between bone formation
and resorption to maintain bone mass. During osteoporosis, there is an increase in bone
resorption without a compensatory increase in bone formation (Raisz and Rodan,
2003). The potential methods to improve the BMD in osteoporotic patients are either to
increase the bone formation or to reduce the bone resorption (Ralston, 1997). To date,
most research has focused on different methods to inhibit the bone resorption. Very
recently, interest has been directed in understanding the process of bone formation
during bone remodeling. A detailed investigation of the bone formation process would
eventually help in developing potential methods to prevent or delay the onset of
osteoporosis as well as other bone related diseases.
The process of bone formation depends on the number and activity of osteoblast
cells. The number of osteoblasts present at the site of bone formation in turn depends on
the lifespan and proliferation potential of osteoblasts (Manolagas, 2000). Bone formation
is a complex process and is an integral part of bone remodeling. To identify and
understand the regulation of the bone formation process, it is essential to know the
different stages and complex processes involved during bone remodeling.

14
Bone remodeling
Bone remodeling is a very complex process involving a series of highly regulated
steps. The overall cascade of bone remodeling depends on the interactions of two cell
lineages; osteoblastic and osteocalstic cell lineages (Eriksen, 1986). In a normal
individual, there exists a balance between the amount of bone resorbed and the amount
of bone formed. Bone remodeling occurs primarily on the inner or endosteal surfaces of
bone and much less on the periosteal surfaces (Orwoll, 2003). Bone remodeling occurs
in small packets of cells known as basic multicellular unit (BMUs) at focally discrete
points on the inner surfaces of bone. Each BMU is geographically and chronologically
separated from other packets of cells. At a particular point of time, remodeling at each
BMU will be asynchronous; one site may be at the phase of resorption while the other at
reversal or formation phases (Parfitt, 2002). This suggests that cellular and molecular
events in bone remodeling are controlled by either autocrine or paracrine factors.
Stages of bone remodeling include 1) resorptive phase, 2) reversal phase, 3)
formative phase and 4) resting phase.
Resorptive phase
The bone resorption cascade includes a series of steps targeting the removal of
bone by oseoclasts. Osteoclasts, also known as bone eating cells, have a
haematopoetic origin and are derived from the monocyte macrophage cell lineage
(Roodman, 1996). The structure and function of osteoclasts in bone resorption have
been well characterized (Roodman, 1996). The first step involves the recruitment of
osteoclast progenitors from haematopoetic tissues, such as bone marrow, to the site of

15
bone resorption. They then proliferate and differentiate to form mature osteoclasts
through a cell-cell interaction with osteoblast stromal cells. Differentiation into mature
osteoclasts is regulated by receptor activator for nuclear factor κ B receptor ligand
(RANK-RANKL) binding. RANKL produced by cells of osteoblast lineage binds to its
receptor present on the haematopoetic progenitors to initate osteoclast differentiation
(Martin and Sims, 2005). Once a mature osteoclast is formed, it is followed by removal
of osteoid layer on the surface of bone by lining osteoblasts. These osteoblasts secrete
several proteolytic enzymes including matrix metalloproteinases (MMPs), collagenase
and gelatinase (Meikle et al., 1992). This allows easy access for osteoclasts to the
underlying mineralized matrix. Osteoclasts adhere to the bone surface through a
receptor–ligand recognition mechanism. Amongst the integrin family of adhesion
receptors, a specific type of vitronectin receptor (Lakkakorpi et al., 1991) binds to
extracellular matrix (ECM) proteins inducing the polarization of osteoclasts. These
processes lead to a ruffled border and clear or sealing zone formation in osteoclasts.
The clear zone is an organelle free region of cytoplasm with thick bands of actin rings
that serves for tight attachment of osteoclasts, formation of a resorption lacuna
commonly known as ‘Howship’s lacuna’ and thus restricting the resorptive surfaces on
the bone (Vaananen and Horton, 1995). The next step comprises the activation of
adhered osteoclasts and resorbing the bone surfaces within the lacunae. This is
mediated by the H+ - ATPase pump present in the ruffeld border of osteoclasts (Blair et
al., 1989; Nakamura et al., 1994). The pump transports protons into the Howship’s
lacunae, providing an acidic environment for the dissolution of bone minerals.
Proteolytic enzymes, primarily cathepsin K (Drake et al., 1996) and MMPs including
gelatinase B and collagenase (Hill et al., 1994), and lysosomal enzymes are also
released from the ruffled border to degrade and dissolve the organic matrix in bone. The

16
degraded products are endocytosed through the center of the ruffled border, packaged
as transcytotic vesicles, transported to the functional secretory domain of the osteoclasts
facing the bone marrow and exocytosed (Nesbitt and Horton, 1997). Osteoclasts have a
limited life span of 12 to 13 days and therefore, recruitment of osteoclast precursors into
the site of bone resorption has to continually take place until desired bone resorption has
occurred.
Reversal phase
After a desired amount of bone resorption has occurred, it is followed by a phase
of reversal which lasts for approximately 9 days (Hill et al., 1997). During this phase the
osteoclastic activity is arrested and thus bone resorption is put to an end. To date, the
regulatory mechanisms that occur during this phase have not been well understood.
Many researchers have suggested possibilities leading to the end of bone resorption.
Firstly, apoptosis or programmed cell death of osteoclasts can be a major cause for the
arrest of osteoclastic activity (Wakeyama et al., 2007). Zaidi (1990) provided alternate
hypotheses that there is a large increase in the concentration of calcium within
Howship’s lacunae during bone resorption. The rise in calcium concentration causes
rapid cell retraction, inhibiton of proteolytic and lysosomal enzyme release into the
lacunae, and finally inhibit bone resorption (Zaidi, 1990). A third suggestion put forward
is the release of TGF-β or other peptides from the bony matrix during bone resorption
which will inactivate osteoclasts and chemotactically attract osteoblasts to the site of
bone resorption (Pfeilschifter and Mundy, 1990). Thus, the inactivation of osteoclasts
marks the end of reversal phase and the beginning of phase of bone formation.

17
Formative phase
The process of bone formation includes a series of events beginning from
chemotactic attraction of osteoblast precursors to the site of bone formation, proliferation
and differentiation of osteoblast progenitors into mature osteoblasts, formation of organic
matrix and finally mineralization of bone. The chemotactic attraction of osteoblasts or
their precursors onto the site of bone resorption marks the beginning of the process of
bone formation. As discussed above, chemotaxis of osteoblast progenitors is mediated
by local factors produced during the resorption process. One such factor, TGF-β is
chemotactic for bone cells and has been shown to be released by resorbing bone
cultures (Pfeilschifter and Mundy, 1987). Similarly, structural proteins like collagen have
also been demonstrtated to be chemotactic for osteoblast and/or osteoblast progenitors
(Mundy et al., 1982).
The second major step in the formative phase is the proliferation and
differentiation of osteoblast precursors into mature osteoblasts. The process of bone
formation involves a cascade of events starting from recruitment of mesenchymal cells
to osteoblastic lineage, differentiation into pre-osteoblasts and then to osteoblasts and
maturation of functional osteoblasts that secrete bony matrix (Aubin et al., 1995).
Specifically, the mesenchymal stem cells are pluripotent in nature and can give rise to
many cell lineages including the osteogenic line. These mesenchymal stem cells have
unlimited self renewal capacity implying an extensive proliferative potential. Once these
stem cells are recruited to osteogenic line, they are referrred to as
osteochondroprogenitor cells (Aubin et al., 1995). They are very similar to mesechymal
stem cells but with limited self renewal capacity. The osteochondroprogenitors cells can

18
either be directed to the osteogenic lineage forming preosteoblasts or directed to the
chondrocyte lineage forming prechondroblasts. Although the preosteoblasts are similar
to osteoblasts histologically and ultrastructurally, they do not acquire many of the
differentiated characteristics of a fully mature osteoblast. The preosteoblasts have
limited proliferative capacity and begin to differentiate to functional osteoblasts. A fully
mature osteoblast is characterized by the ability to synthesize alkaline phosphatase
(ALP), bone marix proteins including collagen type-I (Coll-I), and several non
collagenous proteins including osteocalcin (OCN), bone sialoprotein (BSP), and
osteopontin (Aubin et al., 1995). Since the identification of these characteristic proteins,
they have been used as markers of osteoblast differentiation. Several studies in mice
and rats demonstrate that these differentiation markers are not readily expressed in
preosteoblasts (Helder et al., 1993). For instance, BSP is not readily detectable in
preosteoblasts but is highly expressed in osteoblasts (Bianco et al., 1993). Furthermore,
markers like Coll-I and OCN are weakly expressed in rat preosteoblasts but highly
expressed in the mature osteoblasts (Mark et al., 1988; Helder et al., 1993). These
functional osteoblasts are the bone froming cells, which form the mineralized bone.
The osteoblastic lineage is also regulated by local growth factors such as TGF- β
(Centrella et al., 1991), IGF-I and IGF-II (Schmid et al., 1992), acidic and basic FGF,
bone morphogenetic proteins (BMPs) -2, -3, -4, -6, -7 and PDGF (Rydziel et al., 1992),
as well as homones including parathyroid hormone (PTH), growth hormone (GH) and
sex hormones, transcription factors including runt-related transcription factor 2 (Runx2),
osterix (Osx), activating transcription factor 4 (ATF4), activator protein 1 (AP1) and many
others (Nakashima et al., 2002; Xiao et al., 2005; Karsenty, 2008). These transcription
factors and their regulation in bone formation are discussed in detail in the following
sections.

19
Finally, mature osteoblasts begin to lay down osteoid from the bottom of the
resorption cavity and continue to form until the cavity is filled. Meanwhile the osteoid
begins to mineralize at a rate of 1µm/day (Aubin et al., 1995). The osteoblasts at the
bottom of the cavity are robust in shape and vigorous, forming a thick layer of osteoid.
Termination of the osteoblastic activity occurs through a negative feedback inhibition.
This has been demonstrated by the actions of osteoclast inhibitory lectin (OCIL) protein
that inhibits both osteoblast and osteoclast differentiation (Nakamura et al., 2007).
Alternatively, cessation of osteoblastic activity is regulated by the apoptosis of
osteoblasts. Hill et al., (1997) reported that tumor necrosis factors released from the
neighboring bone marrow cells could induce apoptosis in osteoblasts (Hill et al., 1997).
Sclerostin, a protein secreted from the osteocytes, has also been shown to inhibit bone
formation (Sutherland et al., 2004). In vitro studies have demonstrated that sclerostin
inhibits proliferation, impairs mineralization and stimulates apoptosis of osteoblasts by
interfering the Wnt and BMP signaling pathways (Sutherland et al., 2004).
Resting phase
The mineralization of newly formed bone marks the beginning of resting phase
(Hill et al., 1997). During mineralization, some of the osteoblasts get trapped in the
mineralized bony matrix to form osteocytes. These osteocytes later develop processes
and form connections with adjacent osteocytes. Osteoblasts on the outer surface
differentiate to form lining cells. A complete bone surface is restablished and maintained
until the next wave of remodeling begins.
20
Regulation of bone remodeling
The process of bone remodeling is tightly regulated by several factors including
hormones, growth factors and transcription factors at both systemic and local levels.
They exert their effect on recruitment, proliferation and differentiation of both osteoblastic
and osteoclastic lineage cells. These factors aid in the maintenance of normal bone
mass (Canalis, 1983). The major hormones that regulate bone remodeling include
polypeptide hormones (PTH, calcitonin, and GH), steroid hormones [1, 25-
dihydroxyvitamin D3 (Vit D3), glucocorticoids and, sex steroids] and thyroid hormones
(TH). This review will briefly discuss the role of the major hormones in regulating bone
homoeostasis and development.
Parathyroid hormone (PTH)
PTH functions as the mediator of bone remodeling and important regulator of
calcium homeostasis. It increases the serum calcium concentrations by direct actions on
bone and kidney (Swarthout et al., 2002). PTH acts on the kidney to increase the renal
tubular calcium reabsorption. Action of PTH on the intestine stimulates the synthesis of
Vit D3 increasing the intestinal absorption of calcium (Potts et al., 1997). Besides the
role of PTH on calcium homeostasis, recent studies demonstrate the effect of PTH on
osteoclast and osteoblast activity. PTH, along with PTH-related peptide (PTHrP)
interacts with receptors on osteoblasts to produce osteoclastogenic factor RANKL which
initiates osteoclast differentiation. Thus, PTH indirectly activates osteoclasts resulting in
increased bone resorption (Teitelbaum, 2000). On the other hand, PTH has been
demonstrated to be an anabolic factor in vitro and in vivo. It is known to stimulate the
expression of IGF-I, IGF-II, and IGF binding proteins (IGFBPs) thereby demonstrating
anabolic effects of PTH on bone formation (Canalis et al., 1988). Since the intermittent

21
administration of PTH stimulates the bone formation, PTH has potential medical
application for the treatment of osteoporosis (Lindsay et al., 1997; Cosman and Lindsay,
1998).
Sex steroids
Estrogen and testosterone play an important role in bone and mineral
metabolism. For instance, reduced estrogen concentrations lead to a marked reduction
in BMD, thus describing the major rationale for post-menopausal osteoporosis (Syed
and Khosla, 2005). Normal concentrations of estrogen in the body reduce the
osteoclast formation by decreasing the receptiveness of osteoclast progenitor cells to
RANKL (Srivastava et al., 2001). Estrogen has also been shown to protect bone mass
through induction of osteoclast apoptosis (Kameda et al., 1997). Similar to estrogens,
androgens also play an essential function in bone growth. They exert their action
through androgen receptors present on all types of bone cells (Sato et al., 2002). Normal
amount of androgen receptors are required for the suppressive effects of androgens on
osteoclastogenesis (Kawano et al., 2003). This explains the reduced risk of
osteoporosis, greater mineral density and stronger bones in males.
Growth Hormone (GH) and insulin-like growth factors (IGF)
GH is a polypeptide hormone produced from the anterior pituitary gland.The
synthesis and release of GH is regulated by growth hormone releasing hormone
(GHRH) and somatostatin (Giustina and Veldhuis, 1998). GHRH promotes while
somatostatin inhibit the release of GH from the anterior pituitary gland. One of the most
important functions of GH is that it is essential for normal bone development. It has both
direct effect and indirect effects on bone. The direct effect of GH on bone is explained by

22
the presence of GH receptors on osteoblasts and chondrocytes (Barnard et al., 1988).
Furthermore, in vitro studies have demonstrated that GH stimulates the proliferation rate
of cells of osteoblastic lineage (Kassem et al., 1993) and expression of BMPs that are
important for osteoblast differentiation (Li et al., 1998; Canalis et al., 2003), thus
emphasizing the direct effect of GH on osteoblasts. The indirect effects of GH are
mediated by IGF. GH stimulates the release of IGF-I from the liver, which then circulates
through blood and exerts its endocrine actions on target tissues such as bone.
Additionally, IGF-I is also produced locally from bone and exerts autocrine or paracrine
effect on bone (Le Roith et al., 2001). IGF-I and IGF-II are the most abundant growth
factors present in the skeletal tissue and the bioavailability of these factors are regulated
by IGFBPs. These IGFBPs are often found bound to the circulating IGF-I or complexed
with IGF-I produced locally in tissues. To date, six IGFBPs have been identified. Of
these, IGFBP-3 and -5 stimulate whereas IGFBP-2, -4 and -6 primarily inhibit the actions
of IGF-I on bone (Jones and Clemmons, 1995). In vivo studies in mice further confirm
the direct and indirect roles of GH and IGF on longitudinal bone growth. Specifically,
mutated mice lacking GH and IGF-I had a severe reduction in tibial length and width
than either mutant alone (Giustina et al., 2008) . These skeletal effects occur as a result
of complex interactions between GH, circulating and locally produced IGF and IGFBPs
(Giustina et al., 2008).
Growth factors
Besides IGF-I and -II, there are many other growth factors including FGF, PDGF,
BMPs and Wnt family of proteins that regulate bone formation and remodeling.
Functionally, FGF and PDGF are osteoblast mitogens. One among several types of FGF
is FGF-2. In vitro studies report that it stimulates DNA synthesis and proliferation of

23
osteoblast precursors that later mature to form functional osteoblasts (Canalis et al.,
1988). However, FGF-2 does not have any action on the differentiation and function of
osteoblasts. Infact, it inhibits the expression of markers of osteoblast function such as
ALP (marker of early osteoblast diferentiation), OCN (marker of late osteoblast
differentiation) and osteopontin (Canalis et al., 1988). This inhibitory effect of FGF-2 on
differentiation of osteoblasts is mediated by induction of transcription factor Sox2 and
inhibition of Wnt signaling. Similar to FGF-2, PDGF also increases the number of
osteoblasts and does not stimulate the differentiation and function of osteoblasts
(Canalis et al., 1992).
BMP, a member of the TGF-β super family, is comprised of proteins that are
expressed primarily in bone and other extraskeletal tissues (Daluiski et al., 2001). Of the
many different forms, BMP-2,-4 and -6 are the primary BMPs expressed in bone and
regulate osteoblast cell differentiation and function via Smad (Sma and Mad related
family of proteins) or MAP (mitogen activated protein) kinase signaling pathways
(Miyazono, 1999). BMPs induce endochondral ossification and chondrogenesis. They
stimulate the maturation and function of chondrocytes with an increase in expression of
type II and type X collagens (Canalis et al., 2003). Several BMP antagonists have
recently been identified that inhibit BMP mediated signaling pathways by binding BMPs,
including noggin, follistatin, chordin and dan family of proteins (Zimmerman et al., 1996;
Gazzerro et al., 2007). Activin, a BMP related protein stimulates osteoblast proliferation,
collagen synthesis, endochondral formation and enhances fracture healing (Centrella et
al., 1991).
Another growth factor that regulates osteoblast differentiation and bone formation
is the Wnt (wingless-int) family of proteins. In skeletal tissue, Wnt uses canonical Wnt/β-

24
catenin signaling pathway (Westendorf et al., 2004). Wnt receptor mutations lead to
severe impairment of bone mass suggesting a critical role in skeletal tissue (Westendorf
et al., 2004). Interference of this pathway at different stages leads to many clinical
manifestations. Wnt or β-catenin deletion results in decreased osteoblastogenesis and
increased osteoclastogenesis, whereas overe expressing the same leads to enhanced
osteogenesis and impaired bone resorption (Glass et al., 2005; Holmen et al., 2005),
suggesting the importance of Wnt in normal bone growth.
Transcriptional control of osteoblast function
Aside from hormones and growth factors, the process of bone formation is tightly
regulated by different transcription factors. Several transcription factors have been
identified that play important roles during skeletal development (Komori et al., 1997;
Karsenty, 2008; Karsenty et al., 2009). Recent advances in mouse and human genetics
have led to identification of these factors. Based on different stages of bone
development, these transcription factors primarily function either in chondrocyte or
osteoblast differentiation. Within a lineage (osteoblastic or chondrocytic), these
transcription factors regulate different stages of differentiation. For a better
understanding, transcriptional regulation during skeletal development has broadly been
categorized by researchers into two categories: 1) transcription factors that regulate
chondrogenesis and 2) transcription factors that regulate osteoblastogenesis. This
review will primarily focus on transcriptional regulation of osteoblasts.
As previously discussed, the process of bone formation involves a cascade of
events starting from recruitment of mesenchymal cells to osteoblastic lineage,
differentiation into pre-osteoblasts and then to osteoblasts and maturation of functional
osteoblasts that secrete bony matrix. These different steps are governed by different

25
transcription factors. Some of the most important transcription factors are discussed
below.
Figure 1
Transcriptional control of osteoblast and chondrocyte differentiation
Runt-related transcription factor 2 (Runx2)
Runx2, a member of the runt family of transcription factors is known as the
master gene of bone formation (Karsenty, 2008). All members of this family contain a
highly conserved domain called the runt domain. It is through this domain whereby
Runx2 interacts with nuclear proteins. Runx2 is the earliest and most important
determinant of osteoblast differentiation (Ducy et al., 1997; Komori et al., 1997).
Molecular and genetic studies revealed that it is involved in the recruitment of
mesenchymal cells into osteoblastic lineage. Runx2 also regulates the differentiation of
Adapted from Karsenty, 2008

26
mesenchymal cells to osteoprogenitor cells and then to mature osteoblasts. The
expression of Runx2 occurs at very early stages of mesenchymal cell lineage and is
observed in the developing embryo by E9.5 prior to bone formation (Lengner et al.,
2002; Romero-Prado et al., 2006). The forced expression of Runx2 causes
mesenchymal cells of other lineages to express osteoblast specific genes that are
directly regulated by Runx2 (Ducy et al., 1997). Similar to the findings observed in vitro,
studies in mice lacking Runx2 resulted in skeleton completely deprived of osteoblasts
(Komori et al., 1997). These studies demonstrate that Runx2 is one of the most
important transcription factors for osteoblast differentation. Recent studies have shown
that an optimal expression of Runx2 is favorable to bone growth (Liu et al., 2001).
Transgenic mice over expressing Runx2 in osteoblasts developed osteopenia with
multiple fractures. These bones showed impaired bone mineralization with significant
reduction in mature osteoblasts (Liu et al., 2001). This suggests that Runx2 negatively
controls osteoblast terminal differentiation. The significance of Runx2 in
osteoblastogenesis indicates a tight regulation of its activity and expression by many
other transcription factors or protein-protein interactions or protein-DNA interactions
(Karsenty, 2008).
Osterix (Osx)
Osx, a zinc finger-containing transcription factor, is specifically expressed by
osteoblasts and required for osteoblast differentiation. The first evidence of Osx’s role in
osteoblasts was revealed by Nakashima and coworkers in 2002 (Nakashima et al.,
2002). They observed that Osx deficient mice resulted in perinatal lethality and impaired
matrix mineralization only in bones that underwent intramembraneous ossification
(Nakashima et al., 2002). The endochondral ossified bone showed some matrix

27
mineralization stating that Osx, unlike Runx2, is not required for chondrocyte
hypertrophy. They also observed that Osx is not expressed in Runx2 deficient mice
whereas Runx2 is expressed in Osx deficient mice, suggesting that Osx is a
downstream target for Runx2 (Nakashima et al., 2002). Osx transcription is positively
regulated by Runx2 and it acts by directing pre-osteoblasts to immature osteoblasts
(Celil et al., 2005). Unlike Runx2, the mechanism of action and the molecular pathways
that regulate Osx expression is poorly understood.
Activating transcription factor 4 (ATF4)
ATF4 is an osteoblast enriched transcription factor belonging to cAMP reponse
elements binding (CREB) family of proteins (Xiao et al., 2005). The gene that encodes
for ATF4 is expressed in many cell types but accumulation of protein takes place in
osteoblasts cells. ATF4 is required primarily for late osteoblast differentiation. The
major action of ATF4 on osteoblast differentiation takes place by its interaction with
Runx2 to regulate the transcriptional activity of OCN, a late osteoblast differentiation
marker (Xiao et al., 2005). ATF4 also controls amino acid import into the osteoblasts.
This function of ATF4 is significant for cells like osteoblasts that secrete large amounts
of protein (Harding et al., 2003). Besides these functions in osteoblasts, ATF4 also
favors osteoclast differentiation and bone resorption (Elefteriou et al., 2005).
Activator protein1 (AP1)
AP1 is a family of transcription factors comprised predominantly of proteins in the
Fos and Jun families (Wagner, 2002). Generating mouse models with loss- or gain-of-
function of these families of proteins demonstrated AP1 proteins to be important
regulators of bone formation (Wagner, 2002). Of these many proteins, c-Fos was the

28
first transcription factor identified to control osteoblast proliferation and gene expression.
Specifically, overexpression of c-Fos in mice resulted in osteosarcoma and deletion of c-
Fos in mice led to osteopetrosis signifying the importance of AP1 family of transcription
factors (Grigoriadis et al., 1993). Similarly, other members of this family like Fra-1 and
JunB also promote bone formation and bone mass with increased number of osteoblasts
(Eferl et al., 2004; Kenner et al., 2004) .
Other transcription factors involved in osteoblast function
There are many other transcription factors that regulate osteoblast proliferation,
differentiation and apoptosis. They either act directly on osteoblasts or indirectly by
interacting with the above described classical transcription factors to control bone
formation and bone growth. Some of the key transcription factors involved inbone
formation and osteoblast function are discussed in more detail below.
Genetic and molecular studies demonstrated that several transcription factors
belonging to the family of homeobox proteins [Msx1, Msx2, distal-less homeobox (Dlx)3,
Dlx5 and Dlx6] may play a role in osteoblast differentiation (Shirakabe et al., 2001;
Hassan et al., 2004). These proteins act either as a transcriptional activator or repressor
to regulate bone growth. Mice deficient in Msx2 demonstrated delayed skull ossification
and reduced expression of Runx2 (Shirakabe et al., 2001). Consistent with the above
findings, in vitro studies demonstrate that Msx2 regulates osteoblast proliferation and
apoptosis (Lynch et al., 1998). Similarly, Dlx 3 and Dlx5 are expressed at all stages of
osteoblast differentiation, with an increase in expression as osteoblasts mature. They
also function indirectly by enhancing the expression of Runx2 and OCN (Holleville et al.,
2007). Another group of transcription factors are helix-loop-helix proteins that regulate
osteoblast maturation. Of these, Twists (Twist-1 and Twist-2) are the major proteins that

29
negatively regulate early osteoblast differentiation (Guenou et al., 2005). Twist-2
interacts with Runx2 to reduce the expression of Runx2 in osteoblasts, thereby
regulating osteoblast proliferation and differentiation (Guenou et al., 2005). Besides
Runx2, there are other transcription factors that play a role in lineage determination. One
among them is proliferation–activated receptor γ2 (PPAR γ2), which is involved in the
differentiation of mesenchymal cells into osteoblasts. In addition, PPAR γ2 binds to
Runx2 and inhibits its transcriptional activity (Akune et al., 2004). This function of PPAR
γ2 has been validated by both in vitro and in vivo studies in transgenic mice (Akune et
al., 2004).
In addition to all these transcription factors, recent advances in mouse and
human genetic studies have led to the identification of novel transcription factors in
osteoblasts (Gutierrez et al., 2002; Jeon et al., 2003; Govoni et al., 2009). To date, very
little information is known about the action of these factors on osteoblast function
including proliferation, differentiation and apoptosis. As described earlier, the bone
formation cascade involves a complex series of events that are tightly regulated by
growth factors, hormones, and, transcription factors during different stages of osteoblast
lineage. A novelfamily of transcription factors involved in early limb development and
osteoblast function is described in more detail.
T-box (Tbx) family
One among the novel transcription factors that plays an important role in
development of various animal species is Tbx family. The Tbx family of transcriptional
factors is very primordial and highly conserved among most species of animals
(Papaioannou and Silver, 1998). Tbx family has gained a recent significance in
molecular research due to its association with many human diseases including genetic

30
disorders and various types of cancers. Since then, there has been much interest in
understanding the molecular roles of Tbx genes during development.
Evolutionary history and significance of Tbx family
Tbx family was first described in 1927 with the discovery of Brachury (T locus)
that plays an important role in early vertebrate development (Dobrovolskaia-Zavadskaia,
1927). Mutational studies in mice led to the identification of this gene. Mice,
heterozygous for Brachyury mutation had a truncated tail and homozygote mutants
showed embryonic lethality due to improper notochord and allantois formation
(Dobrovolskaia-Zavadskaia, 1927). The short tail in heterozygotes was the hallmark of
this study and consequently led to the designation of T (tail) for the Tbx family. Following
this discovery of Brachyury, the embryological defects caused by T mutation were
studied until the gene was cloned (Herrmann et al., 1990) and found to be a transcription
factor (Kispert et al., 1995). This research was a significant breakthrough and since then,
many laboratories have reported Tbx genes in species varying from C.elegans,
Drosophila, sea urchins, chick, zebrafish, mouse and humans (Papaioannou, 2001). To
date, over 18 T-box transcription factors have been identified in the human genome and
have been grouped into five subfamilies: Brachyury, T-brain1, Tbx1, Tbx2 and Tbx6
subfamilies (Papaioannou, 2001; Wilson and Conlon, 2002).
Another attribute of Tbx family to gain much recent medical importance is the
linkage of Tbx genes to several human disorders. They include Holt-Oram syndrome
(Tbx5), Ulnar-mammary syndrome (UMS; Tbx3), DiGeorge syndrome (DGS; Tbx1),
ACTH deficiency (Tbx19) and cleft palate with ankyloglossia (Tbx22). UMS is caused by
haploinsufficiency of Tbx3 gene (Bamshad et al., 1997). This syndrome is characterized
by posterior limb deficiency or duplication, hypoplasia and dysfunction of mammary

31
gland, genitals, teeth and hair (Bamshad et al., 1997; Bamshad et al., 1999). Mutations
in Tbx5 have been identified as the cause of Holt-Oram Syndrome (Basson et al., 1997).
This syndrome is characterized by cardiac and skeletal congenital abnormalities
(Basson et al., 1997). Abnormalities in the heart include ventricular and atrial septal
defects and impaired conduction system. Skeletal defects primarily affect upper
forelimbs (Basson et al., 1997; Li et al., 1997). Another member of this family, Tbx19
(Tpit) was recently identified to activate expression of pro-opiomelanocortin (POMC)
leading to reduced ACTH production and ultimately adrenal insufficiency. The DGS is
associated with deletion of a small segment, designated as q11, in chromosome 22. The
features of this syndrome vary widely from congenital heart defects, palate defects,
hypoplastic thymus and parathyroids, facial dysmorphism and learning disabilities (Ryan
et al., 1997). Very recent studies show that Tbx1-/- mice can recreate many aspects of
Digeorge syndrome phenotype in mice (Jerome and Papaioannou, 2001; Lindsay et al.,
2001). Further studies are needed to confirm the specific role of Tbx1 in DGS.
The five Tbx genes discussed above play significant roles in inherited human
disorders. In addition, recent evidence suggests a possible role of Tbx genes, including
Tbx2 and Tbx3, in cell cycle regulation in various tissues and thus contributing to the
recent medical importance of Tbx family.
T-box structure (general)
All members of this family are transcription factors (DNA binding proteins) that
are either activators or repressors of transcription. Tbx proteins generally range in size
from 50 to 78 kDa. From many reports on the structure of Tbx proteins, it can be
concluded that Tbx proteins are comprised of two functional and structural domains, a

32
sequence specific DNA–binding domain and a transcriptional regulatory domain (Smith,
1999; Papaioannou, 2001).
The sequence specific DNA binding domain is referred to as T-box (Kispert and
Hermann, 1993; Conlon et al., 2001). The T-box is a comparatively large domain making
up to one third of the protein. There are varying degrees of homology across this T-box
domain within a Tbx subfamily. However, there are specific residues within the T-box
that are 100% conserved (Wilson and Conlon, 2002). This observation ultimately
promoted the classification of Tbx family into 6 subfamilies. The positions of these
domains vary between different members of this family but are regularly placed closer to
amino terminus of the protein. The second domain present in these proteins is a
transcriptional regulatory domain that functions either as a transcriptional activator or
repressor. In most of the Tbx protein studies, these domains are located at the carboxy-
terminal portion of the protein.
T-box functions
The different members of Tbx family are expressed during different stages of
development and in several tissues including the skeleton, kidney, lungs, liver,
mammary gland, muscle and nervous system (Papaioannou and Silver, 1998).The
functions of Tbx genes have been best studied through genetics and phenotypes of
mice and human mutated for different Tbx genes. Amongst the various tissues studied
for the role of Tbx transcription factors, cardiac and skeletal systems attain the prime
importance.

33
Role of Tbx genes in cardiac system
Identification of Tbx5 gene, the responsible candidate for congenital heart
defects (Basson et al., 1999), introduced a lot of interest in determining the role of other
Tbx genes in cardiac development. The Tbx genes that play an essential role in cardiac
development primarily include Tbx1, Tbx2, Tbx3, Tbx5, Tbx18 and Tbx20 (Plageman
and Yutzey, 2005). All these factors put together regulate cardiac lineage recruitment,
chamber specification, valve formation, epicardial development and specialization of the
conduction system. A few of these Tbx factors regulate cardiac gene expression.
Specifically, atrial natriuretic factor (ANF; required for water and Na+/K+ homeostasis)
and connexin 40 (Cx40; a gap junction protein), have been identified as Tbx target
genes. To date, they are the most extensively studied Tbx target genes in the heart. In
vitro studies have shown that Tbx5 acts as an activator of ANF and Cx40 while Tbx2 and
Tbx3 represses their expression (Habets et al., 2002; Christoffels et al., 2004; Hoogaars
et al., 2004). These studies suggest the fact that Tbx genes play an essential role in the
embryonic development of heart.
Role of Tbx genes in skeletal system
Another major system tightly regulated by Tbx genes is the skeletal system.
Since the identification of Tbx genes, Tbx3 and Tbx5, as the responsible candidates for
ulnar-mammary syndrome and Holt-oram syndrome, respectively in 1997, research has
focused on the role of Tbx genes on limb bud development (Bamshad et al., 1997).
Another Tbx gene, Tbx4 has recently been attributed for small patella syndrome. This is
caused by hemizygous mutations in Tbx4 leading to aplasia or hypoplasia of patella and
anomalies of pelvis and feet (Bongers et al., 2004). To date, seven Tbx genes, namely
T, Tbx2, Tbx3, Tbx4, Tbx5, Tbx15 and Tbx18, have been identified that are highly

34
expressed in the limb buds. Of these, Tbx4, Tbx5 Tbx2 and Tbx3 have been most
extensively studied to understand their specific regulation during embryonic and
postnatal skeletal development.
Tbx4 and Tbx5 are two closely related Tbx genes that are essential for normal
limb bud development (Chapman et al., 1996a; Gibson-Brown et al., 1996a). The major
functions of these Tbx genes include initiation of limb bud outgrowth and specification of
forelimb and hindlimb identities. Most of the genes that are involved in limb development
are expressed similarly in forelimb and hindlimb, but Tbx5 is only expressed in the
forelimb and Tbx4 is only expressed in the hindlimb (Chapman et al., 1996a; Gibson-
Brown et al., 1996a). Due to the differential expression of Tbx4 and Tbx5 during limb
bud growth, they are supposedly involved in specifying the structural differences
between forelimb and hindlimb.
Tbx15 and Tbx18 are two closely related Tbx genes with 93% sequence
homology (Singh et al., 2005). Tbx15 is expressed in the murine mesenchyme,
pharyngeal apparatus and the craniofacial region (Candille et al., 2004). Genetic models
of transgenic mice were created to determine the function of Tbx15 on skeletal
development. Homozygous null mutation of Tbx15 led to many skeletal defects in mouse
embryos (Singh et al., 2005). These embryos showed a reduced bone size and altered
bone shape including limbs. On the other hand, mice carrying only one functional copy
of Tbx15 were normal and survived to adulthood (Singh et al., 2005). Similar to Tbx15,
Tbx18 is also greatly expressed during early embryonic development in mouse. It is
expressed in the somites, resulting sclerotome (vertebrae) and also in the limb bud
mesenchyme. Inactivation of one allele of Tbx18 did not result in any malformations,
while inactivation of both alleles of Tbx18 resulted in early postnatal death and were

35
characterized by severe skeletal malformations of vertebrae and ribs (Bussen et al.,
2004; Singh et al., 2005).
Tbx3 is another member of T-box family playing essential role during bone
development both embryonically and postnatally. As explained earlier, UMS
demonstrated the significance of Tbx3 during embryonic limb bud development
(Bamshad et al., 1997). Further studies on Tbx3 have shown that it may play an
important role during postnatal bone development (Govoni et al., 2006). It has been
demonstrated that Tbx3 is expressed in adult mouse bone and is regulated by many
growth factors (GH, BMP-7 and Wnt3a) and regulates osteoblast function (Govoni et al.,
2006; 2009). Specifically, knocking down the expression of Tbx3 using siRNA inhibited
osteoblast proliferation (Govoni et al., 2006). Further studies showed that over
expression of Tbx3 suppresses the differentiation of osteoblasts and is involved in
regulating the expression of key transcription factors involved in osteoblast differentiation
(Govoni et al., 2009).
Tbx2
Structure
Tbx2 belongs to the Tbx2 subfamily of Tbx transcription factors that includes
Tbx3, Tbx4 and Tbx5. Tbx2 is located on chromosome 11 in humans and has been
mapped to chromosome17q23 in mice (Bollag et al., 1994; Campbell et al., 1995). Tbx2
is comprised of 3,562 bp and 3,378 bp in mouse and human respectively with seven
exons. Similar to other Tbx genes, Tbx2 has a T-box DNA binding domain and a
transcriptional repressor domain. The human T-box domain shows 90%DNA and 96%
peptide sequence homology to the mouse (Law et al., 1995). The T-box domain is

36
located at amino acid postion 106-289 within the T-box protein both in humans (712
amino acids) and mouse (711 amino acids).
Similar to Tbx3, Tbx2 also function as a transcriptional repressor (Carreira et al.,
1998; Sinha et al., 2000). Recent advances in proteomics have identified two separate
repression domains for Tbx2 (Paxton et al., 2002). Along with a carboxy terminal
repression domain located between amino acids 529 and 573, a novel amino-terminal
repression domain between amino acids 1 and 53 have been identified (Paxton et al.,
2002). Further studies by Paxton and coworkers found that the carboxy terminal
repression domain by itself was not sufficient to produce the repressor activity of Tbx2
(Paxton et al., 2002). Deletion of both the repression domains completely abolished the
repressor activity of Tbx2, suggesting that amino terminal repression domain play an
important role in mediating the repressor activity of Tbx2 on target genes (Paxton et al.,
2002). Besides these, a weak activation domain has also been identified in Tbx2.
Because of the presence of both activation and repressor domains, Tbx2 protein is
suggested to play multiple specific roles based on the species and cell lines. For
instance, over expression of Tbx2 increased the expression of type 1 collagen in NIH
3T3 fibroblasts but decreased col-1expression in rat ROS 17/2.8 osteoblast cell line
(Chen et al., 2001). In most research carried out to date, Tbx2 primarily acts as a
transcriptional repressor. Further studies will help to elucidate the specific role of the
activation and repression domains of Tbx2 protein.
Functions of Tbx2
Most studies demonstrate that Tbx2 is expressed primarily during embryonic
development both in mouse and humans. It is expressed in mouse and human heart,
lung, kidney, ovary, and bone (Campbell et al., 1995; Law et al., 1995). Transgenic

37
mouse models were created to investigate the specific role of Tbx2 during embryonic
development. A homozygous mutant for Tbx2 is embryonically lethal in mice due to
cardiac insufficiency whereas heterozygous mutants are normal (Plageman and Yutzey,
2005).
Role of Tbx2 in cardiac development
To date, the function of Tbx2 has only been identified in a few tissues, although it
is expressed in a wide variety of tissues. In particular, the role of Tbx2 has been
extensively studied during heart development. It is involved in the proliferation and
compartmentalization of the developing heart (Harrelson et al., 2004). Tbx2 is
expressed as early as 8 days post coitum in the myocardium of the developing mouse
heart. Many studies demonstrate that Tbx2 may be a downstream target of BMP
signaling pathways that are important during the development of non chamber
myocardium (Zhang and Bradley, 1996). Recent studies demonstrate that Tbx2 along
with Tbx3 represses the differentiation and formation of cardiac chambers (Christoffels
et al., 2004) where as Tbx5 and Tbx20 positively regulate the formation of chamber
myocardium (Cai et al., 2005). This in fact suggests that Tbx2 and Tbx3 may have
similar function in cardiac tissue and other tissues.
Role of Tbx2 in mammary development
Furthermore, recent studies suggest a role of Tbx2 along with Tbx3 during
mammary gland development both in humans and mice (Rowley et al., 2004). Tbx3 is
specifically expressed in the epithelial cells, while Tbx2 is expressed in the underlying
mesodermal cells of a mammary placode (Rowley et al., 2004). The importance of Tbx3
on mammary gland was demonstrated by developing a Tbx3 knockout mouse.
Heterozygous mice showed mammary hypoplasia and abnormalities of nipples, whereas

38
homozygous mice did not develop mammary glands (Davenport et al., 2003a). However,
the role of Tbx2 during the development of mammary glands is poorly understood with
comparison to Tbx3. The role of Tbx2 along with Tbx3 was supposedly brought into
attention when double heterozygous mice for Tbx2 and Tbx3 showed severe
deficiencies in the formation of mammary placodes than Tbx3 single heterozygote mice
(Jerome-Majewska et al., 2005).
Role of Tbx2 in brain, eye and melanocyte development
In vitro and in vivo studies suggest a role of Tbx2 during brain development,
specifically the hypothalamus. The evidence for this suggestion arises from the
interaction of Tbx2 with sonic hedgehog (Shh) in ventral tubero-mammillary cells (a
subset of hypothalamic cells) (Manning et al., 2006). Besides hypothalamus, Tbx2 is
also involved in embryonic development of eye and skin. Tbx2 along with other Tbx
members (Tbx3 and Tbx5) are differentially expressed in the neural retina (Behesti et al.,
2006). Many studies using mouse embryo cultures reveal that these Tbx genes (Tbx2,
Tbx3 and Tbx5) regulate the embryonic development of eye via BMP4 signaling (Behesti
et al., 2006). They also reported that homozygous mutant mouse embryos show a
reduced retinal volume, delayed optic vesicle invagination ultimately leading to small and
abnormal optic cups. Tbx2 is also expressed in several melanocyte and melanoma cell
lines but not in pre-melanoblasts (Carreira et al., 1998; Carreira et al., 2000). The role of
Tbx2 in melanocyte was demonstrated by the interaction of MITF (microphthalamia
associated transcription factor) with Tbx2. MITF is a key regulator of melanocyte
proliferation, differentiation and apoptosis (Levy et al., 2006). MITF binds to the Tbx2
promoter and activates the expression of Tbx2 suggesting a specific role of Tbx2 in
melanocytes (Carreira et al., 2000).

39
Role of Tbx2 in cell cycle regulation
Besides the role of Tbx2 during embryonic development in different tissues
described above, recent advances in molecular biology and genetics reveal a potential
role for Tbx2 in cell cycle regulation and cancer. The expression of Tbx2 along with a
closely related factor, Tbx3, was upregulated in several cancers including breast (Fan et
al., 2004), pancreatic (Mahlamaki et al., 2002), melanoma (Vance et al., 2005), liver
(Renard et al., 2007) and bladder (Ito et al., 2005). The upregulation of Tbx2 in these
cancers is explained by the fact that it functions as an immortalizing gene and enables
the cells to bypass senescence (Dobrzycka et al., 2006). Tbx2 along with Tbx3
suppresses the expression of p19ARF, a tumor suppressor, and promotes the bypass of
senescence through inactivation of p53 pathway (Dobrzycka et al., 2006). Another
explanation for the tumorigenic potential of Tbx2 was put forward by Davis and
coworkers in 2008 (Davis et al., 2008). They proposed that Tbx2 may contribute to
oncogenesis through bypassing cell cycle check points (Davis et al., 2008). Similarity in
the functions of Tbx2 and Tbx3 in cell cycle regulation suggests that Tbx2 and Tbx3 may
have overlapping functions in different tissues.
Role of Tbx2 in skeletal development
Tbx2 along with other Tbx genes (Tbx3, Tbx4 and Tbx5) is expressed in mouse
embryonic limb buds. Besides mice, the expression of Tbx2 has been extensively
studied in chicks (Isaac et al., 1998). The spatial and temporal expression of Tbx2 along
with Tbx3 is very similar in the forelimb and hindlimb buds of mouse and chicks (Gibson-
Brown et al., 1996b; Gibson-Brown et al., 1998). Tbx2 and Tbx3 are required for the
identity of digit III and IV. Recent advances in the identification of different signaling
pathways further strengthen the potential role of Tbx2 during limb development. For

40
instance, Shh pathway, involved in the determination of cell fate determination,
embryonic patterning and organogenesis during early vertebrate development, is
regulated by the expression of Tbx2 and Tbx3 within the posterior limb bud (Suzuki et
al., 2004; Nissim et al., 2007).
Besides the role of Tbx2 during early embryonic limb bud development, recent
studies in vitro suggest a potential role of Tbx2 during bone development. It was
demonstrated that Tbx2 is expressed in mouse hypertrophic chondrocytes, periosteal
osteocytes and osteoblasts (Chen et al., 2001). Furthermore, microarray analysis of
Tbx2 directed gene expression in NIH3T3 cells, a fibroblast cell line, showed that among
8734 genes, 107 genes were upregulated and 66 genes were down-regulated by two
fold or greater. The over expression of Tbx2 in NIH3T3 cells increased the expression of
several genes [pleiotrophin (osf-1), osteoblast-specific factor-2(osf-2) and collagen type
1α] that are involved in osteoblastic or chondrocytic lineage (Chen et al., 2001). They
also carried out transfection experiments with sense and anti-senseTbx2 in a rat
osteosarcoma cell line (ROS 17/2.8) further suggesting that Tbx2 could potentially be
involved during bone development (Chen et al., 2001). Specifically, osteoblast specific
factor 2 (osf-2) was downregulated in ROS 17/2.8 cells transfected with antisense Tbx2
whereas osf-2 was upregulted in cells transfected with sense Tbx2. In addition, recent
studies demonstrate that Tbx2 regulates the expression of Connexin 43 (Cx43) in
osteoblast-like cells (Chen et al., 2004). Cx43 is a gap junction protein found in neural
crest cells, myocytes, osteoblasts and many other tissues. Cx43 plays an essential role
in cell-cell communication and is the predominant gap junction protein found in bone and
plays critical role in normal ossification and osteoblast function (Lecanda et al., 2000).

41
These studies described above prove that Tbx2 is closely related to Tbx3 with
90% homology in sequence and is functionally similar to Tbx3 in cardiac development
(Christoffels et al., 2004) and cell cycle regulation (Dobrzycka et al., 2006). Both Tbx2
and Tbx3 are transcriptional repressors and regulate various stages during
development. Recent studies have proved the important roles of Tbx3 during postnatal
bone development (Govoni et al., 2006; Govoni et al., 2009). Identification of such novel
transcription factors and their role in osteoblast function will provide a better
understanding of the bone formation process which would further aid in the development
of potential medical therapeutics for the prevention or treatment of osteoporosis or other
bone related diseases. To date, there has been neither in vitro nor in vivo data on the
role of Tbx2 during post natal bone development. Based on the close homology of Tbx2
and Tbx3, functional similarity of Tbx3 and Tbx2 in different tissues, regulation of
osteoblast function by Tbx3, and the role of Tbx3 and Tbx2 in embryonic limb bud
development, we have developed the following hypothesis.
HYPOTHESIS
We hypothesize that Tbx2 is an important transcriptional regulator of osteoblast
function (proliferation and differentiation).
AIMS
1. To transfect and knockdown the expression of Tbx2 in MC3T3-E1 (a mouse
preosteoblast cell line) using small interference RNA (siRNA).
2. To evaluate the role of Tbx2 in osteoblast proliferation determined by changes in
cell number and DNA synthesis.

42
3. To evaluate the role of Tbx2 in osteoblast differentiation determined by changes
in alkaline phosphatase (ALP) activity.

43
MATERIALS AND METHODS
Cell culture
The murine preosteoblast-like cell line (MC3T3-E1) was purchased from
American Type Culture Association (ATCC), Manassas, VA. The media used for the cell
culture was α-minimal essential medium (α-MEM; invitrogen, cat. no.12571-049)
containing 10% calf serum (CS; Thermo Scientific, cat. no. SH30072.03) and 1%
penicillin–streptomycin (PS). The murine bone marrow stromal cells (BMSC) were
maintained in α-minimal essential medium (α-MEM) containing 10% fetal bovine serum
(FBS; Thermo Scientific, cat. no. SH30910.03) and 1% PS. The cell culture media
containing α-MEM + 10% CS without antibiotics were used to plate the cells the day
before transfection. The cells were maintained at 37⁰C in a humidified atmosphere of 5%
CO2 and 95% air with media being changed in every 2 to 3 days. Cultures at
approximately at 70% to 80% confluence were harvested with diluted trypsin-EDTA (0.5
% trypsin-EDTA). The cells were passaged at least once after thawing and then used for
each experiment mentioned below (Appendix Section I).
Isolation of mouse bone marrow stromal cells
The mouse BMSC were isolated from 4 to 6 week old mice as previously
described (Govoni et al., 2006) and plated at a density of 20 X 106 cells per 120 mm petri
dish. The media used for the maintenance of the mouse BMSC contained α-MEM with
10% FBS and 1% PS. The cells were allowed to adhere to the plate for 5 to 7 days
during which 3 mL of the media was added to each plate. Once most of the BMSC
adhered to the bottom of the plate (approximately 6 days), media was changed every
three days until the cells reached 70% confluent. The confluent plates were then used

44
for protein extraction. The details of protein extraction are described in the following
sections.
siRNA transfection
The MC3T3-E1 cells were transfected with siRNA for mouse Tbx2 and
scrambled negative control (NC siRNA) purchased from Dharmacon (Tbx2 siRNA:
siGENOME SMART pool, cat. no. M-048790-01; NC siRNA: siGENOME Non-Targeting
siRNA Pool #2, cat. no. D-001206-14-05). The cells were transfected using
Lipofectamine 2000 (invitrogen, cat. no. 11668-019) according to the manufacturer’s
instructions. The transfection conditions were optimized by using a siGLO Red
transfection indicator (Dharmacon, cat. no. D-001630-02-05). Different concentrations of
siGLO red/well (16.5, 33, and 66 nM) and Lipofectamine 2000/well (0.5, 1, and 1.5 µL)
were selected to optimize the transfection efficiency. 24 hr after the transfection, the
number of fluorescent cells versus non-fluorescent cells were examined. After the
transfection conditions were optimized, the transfections were performed using Tbx2
siRNA and NC siRNA. Appropriate controls were used for these experiments. The
MC3T3-E1 cells with Lipofectamine 2000 was used as a control to substract any
cytotoxic effect of Lipofectamine 2000. MC3T3-E1 cells transfected with Lipofectamine
2000 and NC siRNA was another control to substract any effect of siRNA on cell
proliferation. All data presented are compared with the NC siRNA control samples.
Briefly, the cells were plated at a density of 2,000 cells/well for osteoblast proliferation,
5,000 cells/well for osteoblast differentiation in 96-well plates and 70,000 cells/well for
RNA extraction in 6-well plates. After 24 hrs, the cells were transfected with 66 nM
siRNA and Lipofectamine 2000 (0.25 µL/well for 96-well plate, 1 µL/well for 24-well plate,
and 5 µL/well for 6-well plate). The cells were either transfected with Tbx2 siRNA or NC

45
siRNA that served as the negative control. The amount of siRNA and the lipofectamine
were diluted in Opti-MEM I Reduced Serum Medium (invitrogen, cat. no. 31985-062).
After the 5 min of incubation, the diluted siRNA was combined with the diluted
Lipofectamine 2000, mixed gently and incubated for 25 min at room temperature. Then,
the siRNA-Lipofectamine 2000 complexes were added to each well containing the cells
and incubated at 37⁰C for 24 hr (Appendix Section II).
RNA extraction
The cells were plated at a density of 70,000 cells/well in a 96 well plate.The
following day, the cells were transfected with siRNA (Tbx2 siRNA or NCsiRNA). 24 hr
after transfection, the media was removed from the wells, the cells were rinsed with PBS
twice, and 1 mL of TRI reagent (Sigma Aldrich, cat. no. T9424-200) was added. The
cells were scraped and transferred to a microcentrifuge tube, vortexed and incubated for
5 min at room temperature. This was followed by the addition of one-fifth volume of
>99% chloroform (Sigma Aldrich, cat. no. C2432-500) mixed, and incubated for 2 to 3
min at room temperature. After the incubation, the tubes were centrifuged at 12,000 X g
for 15 min at room temperature. The aqueous clear supernatent phase was carefully
transferred to a new microcentrifuge tube. Thereafter, RNA was extracted using Rneasy
Mini Kit (Qiagen, cat.no. 74104) according to the manufacturer’s instructions. The total
RNA was quantified by using a NanoDrop spectrophotometer (Thermo Scientific,
Wilmington, DE). Following extraction, the residual DNA was removed from RNA
samples by a 30 min digestion at 37⁰C with DNase using a DNA-free kit (TURBO DNA-
free, Ambion, cat. no. AM1907). The RNA quality was determined using Experion
Automated Electrophoresis Station (Bio-Rad, Hercules, CA). (Appendix Section III)

46
Reverse transcription (RT)-PCR
Each RNA sample was diluted to 300 ng/10 µL for the RT-PCR. The reverse
transcription was performed under standard conditions with SuperScript II reverse
transcriptase (Invitrogen, cat. no. 18064-014) and Oligo (dT) primers (Ambion, cat.no.
5730G) in a 20 µL final volume. Briefly, 1 µL of Oligo (dT) primers was incubated with 10
µL of the 300 ng RNA sample at 70⁰C for 10 min in the S1000 Thermo Cycler (Bio-Rad,
Hercules, CA) followed by the addition of the master mix containing the dNTP, DTT and
SuperScript II (Invitrogen, cat. no. 18064-014). Thereafter the reaction conditions were
37⁰C for 3 min, 42⁰C for 60 min, 4⁰C for 3 min, and 90⁰C for 2 and ½ min. Once the
reactions were complete, 80 µL of nuclease free water was added to the samples.
(Appendix Section IV, V and VI)
Real-time RT-PCR
Quantitative real-time RT-PCR analysis was used to determine the expression
levels of Tbx2, Tbx3, and PPIA (peptidylprolyl isomerase A; endogeneous control). Real-
time RT-PCR was performed using Power SYBR Green Master Mix (Applied
Biosystems, cat. no. 4367659) and 7500 Fast Real-Time PCR system (Applied
Biosystems, Foster city, CA). Specifically, 20 µL of the reaction was loaded onto a Fast
Optical 96 well reaction plate (Applied Biosystems, cat. no. 4346906). Each reaction
contained 10 µL of 2X Power SYBR Green Master Mix, 1 µL each of 10mM of forward
and reverse primer, 3 µL of nuclease free water, and 5 µL of cDNA. The PCR conditions
were 50⁰C for 20 s, 95⁰C for 10 min, 95⁰C for 15 s, 60⁰C for 1 min, 95⁰C for 15 s, 60⁰C
for 1 min, 95⁰C for 30 s, and 60⁰C for 15 s. The ∆CT values were determined by
subtracting the CT value for the control gene from the CT value for the gene of interest.
Once the ∆CT was determined for the control and the treatment group, ∆∆CT was

47
calculated to express the relative quanitificationof gene expression (Govoni et al., 2006).
The primers used to amplify mouse Tbx2 were forward: 5’ -TGA AGC TCC CAT ACA
GCA CCT T -3’, reverse: 5’ –TTG TCG ATC TTC AGC TGT GTA ATC T -3’, PPIA;
forward: 5’ –TCC TGG ACC CAA AAC GCT CC -3’, reverse: 5’ –CCA TGG CAA ATG
CTG GAC CA -3’, Tbx3; forward 5’ –TTC CTA CCT CAC CGG GCG -3’, reverse: 5’ –
CCG TTG GGA GGC AGC GT -3’. (Appendix Section VIII)
Western Blot
Preparation of whole cell lysate
Cells were seeded at a density of 70,000 cells/well in a 6-well plate. After 24 hr,
the cells were transfected with siRNA. Forty eight hr after transfection, they were
scraped into ice-cold phosphate-buffered saline (PBS, pH7.4) and centrifuged at 12,000
X RPM for 5 min. The pellet was lysed with 25 µL of modified RIPA lysis buffer
(TEKnova, cat. no. R3792). The modified RIPA buffer was prepared by the adding 10 µL
of the 100 X Halt protease inhibitor cocktail (PIC; Sigma Aldrich, cat. no. 1862209).Then
the lysate was incubated on ice for 30 min followed by centrifugation at 12,000 X RPM
for 5 min at 4⁰C. The supernatent was transferred to a pre-cooled microcentrifuge tube
and stored at -80⁰C until used.
Preparation of whole tissue lysate
The bone, lung and heart were isolated from a 3 to 4 week old mouse and snap
frozen in liquid nitrogen. A mortar and pestle was used to grind the tissues in the liquid
nitrogen. This was followed by the addition of 3 mL RIPA lysis buffer, mixed properly and
transferred to a microcentrifuge tube. The lysate was then incubated on ice for 1 hr

48
followed by centrifugation at 12,000 X RPM for 5 min at 4⁰C. The supernatent was
transferred to a pre-cooled microcentrifuge tube and stored at -80⁰C until used.
Protein estimation
The protein concentration was estimated using DC protein assay (Bio-Rad,
cat.no. 500-0114). Bovine serum albumin (BSA; Sigma Aldrich, cat no. A7888-100G)
was used as the standard. Specifically, different dilutions of BSA standards ranging from
0.125 mg/mL to 2 mg/mL were prepared. RIPA buffer with PIC was used as the diluent
to prepare these BSA standards. Additionally, the protein samples for the estimation
were also diluted in a ratio of 1:5 using the same diluent. Then 5 µl of the standards and
the samples were pipetted into a clean 96-well plate followed by the addition of reagent
A and reagent B. After 15 min of incubation at room temperature, the absorbances were
read at 750 nm in the plate reader (Synergy 2, BioTek, VT, USA).
SDS-PAGE and immunoblotting
Equal amounts of protein (40 µg) were placed in sample buffer (63 mM Tris HCl,
pH 6.8, 2 mM EDTA, 10 mM β-mercaptoethanol, 10% glcerol, 2% SDS, and 0.0025%
Bromophenol blue) and heated to 65⁰C for 10 min. The denatured proteins were
vortexed, briefly centrifuged and loaded onto a 10% sodium dodecyl sulphate-
polyarylamide gel (SDS-PAGE) along with a SDS-PAGE protein standard (Precision
plus protein standards kaleidoscope, Bio-Rad, cat.no.161-0375). For a better separation
of proteins, the gel was run at 100 volts for 170 min at room temperature. After this, the
proteins were transferred to a nitrocellulose membrane at 100 volts for 150 min. To
confirm the complete transfer of proteins from the gel onto the membrane, the gel was
stained with Coomasie blue solution (0.5%; Fisher scientific, cat. no. D203010) for 30

49
minutes at room temperature and the blot was stained with Ponceau S solution (0.1%;
Fischer Scientific, cat. no. BP103-10). The blot was destained by a thorough rinsing with
Tris-buffered saline tween-20 (TBST). The membrane was blocked in 5% non fat milk in
TBST for 2 hr at room temperature. After washing with TBST, the membrane was
probed with rabbit anti-Tbx2 antibody (1:500; abcam, cat. no. ab33298) overnight at 4⁰C.
The following day, the membrane was washed thrice with TBST and incubated with a
horseradish peroxidase conjugated anti-rabbit antibody (Sigma Aldrich, ca. no. A0545)
for 60 min at room temperature. The excess antibody was rinsed off by washing with
TBST three times. The Tbx2 protein was then visualized using Super Signal West Pico
Chemiluminescent Substrate (Thermo scientific, cat. no. 34077). For reblotting, the
membrane was stripped at 55⁰C for 30 min in stripping buffer [62.5 mM tris HCl (pH 6.8),
2% SDS, and 0.7% β-mercaptoethanol]. The blot was then washed thrice in TBST with
10 min interval followed by blocking with 5% non fat milk in TBST for 60 min at room
temperature. After blocking, the membrane was reprobed with rabbit anti- β-actin
antibody (1:500, Sigma Aldrich cat. no. A2066) overnight at 4⁰C and served as the
loading control. On the next day, the membrane was washed with TBST, followed by
incubation with horseradish peroxidase conjugated anti-rabbit antibody (Sigma Aldrich,
ca. no. A0545) for 60 min at room temperature, and visualized as described above.
(Appendix Section IX)
Cell proliferation assay
alamarBlue assay
The alamarBlue assay is used to determine the cell number. MC3T3-E1 cells
were plated at a density of 2,000 cells/well in a 96-well plate in culture media (α-MEM
containing 10 % CS). A day after, the cells were transfected with siRNA (negative control

50
siRNA or Tbx2siRNA). 24 hr after transfection, the cells were deprived of serum for
another 24 hr, and then treated with either 0.1% BSA or 1% CS. The alamarBlue assay
was used to determine the cell number 48 hr after treatment. In particular, the cells were
rinsed twice with 100 µL of PBS followed by the addition of diluted alamarBlue indicator
(invitrogen, cat. no. DAL1025). The alamarBlue indiactor was diluted in a ratio of 1:10
using α-MEM. After 4 hr of incubation at 37°C, the fluorescence was determined using a
fluorescent plate reader (Synergy 2, BioTek) at 540/35 X 600/40 nm with sensitivity set
at 54. (Appendix Section X)
5-bromo-2’deoxyuridine (BrdU) assay
BrdU assay is a chemiluminescent assay for the quantification of cell
proliferation, based on the measurement of BrdU incorporation during DNA synthesis
(Roche Applied Science, cat. no. 11669915001). Similar to the alamarBlue assay, the
cells were plated at a density of 2,000 cells/well in a 96-well plate. After 24 hr of
incubation, the cells were transfected with siRNA. 24 hr after transfection, the cells were
deprived of serum for another 24 hr, and then treated with either BSA or 1% CS. The
BrdU assay was performed to determine the DNA synthesis 48 hr after treatment.
Specifically, the cells were incubated with BrdU labelling solution at a concentration of
10 µL/well for 2hrs at 37°C. After the incubation, the labelling solution was
removed.Then the cells were fixed and DNA was denatured. This was followed by the
addition of anti-BrdU-POD antibody (100uL/well) which binds to the BrdU incorporated in
the newly synthesized DNA. The excess antibody was removed. 100 µL/well of the
substrate solution was added to each well and incubated for 5 min at room temperature.
The chemiluminescence was detected using the plate reader (Synergy 2, BioTek, VT,
USA). (Appendix Section XI)

51
Cell differentiation assay
Alkaline Phosphatase (ALP) activity
The cells were plated at a density of 5,000 cells/well in a 96-well plate. On the
next day, the cells were transfected with siRNA (NCsiRNA or Tbx2siRNA). After 24 hr of
incubation at 37⁰C, the cells were deprived of serum. The media used for serum
deprivation was α-MEM containing 0.1% BSA, 1% PS, 50 µg/mL ascorbic acid (Sigma
Aldrich, cat. no. A8960), and 10mM of β-glycerophophate (Sigma Aldrich, cat. no.
G9891). Twenty four hr later, the cells were treated with either 0.1% BSA or human
bone morphogenetic protein 2 (hBMP-2) at a concentration of 30 ng/mL and incubated
for 72 hr at 37⁰C. The ALP activity was measured as previously described (Govoni et al.,
2008). Briefly, the cells were washed with PBS two times, permealized with 100 µL of
0.1% triton followed by a freeze thaw procedure. Of the 100 µL, 40 µL and 20 µL of the
lysate was transferred to a new 96-well plate for determining the ALP activity and protein
concentration, repsectively. 200 µL of the ALP substrate, p-Nitrophenyl phosphate
(pNPP; Sigma Aldrich, cat. no. P7998-100), was added to each well. The absorbance
was read immediately (0 hr) and after 5 hr of substrate addition at 405 nm using the
plate reader (Synergy 2, BioTek, VT, USA). The protein concentration was measured by
usingthe Quick Start Bradford Protein asay (Bio-Rad, cat. no. 500-0205) and bovine
serum albumin (BSA, Sigma Aldrich, cat no. A7888-100G) that served as the protein
standard. The ALP activity was standardized to the cellular protein content. (Appendix
Section XII).

52
Statistical analysis
Data were analyzed by analysis of variance (ANOVA) and/or student’s t-test
where appropriate. Data were analyzed by using SAS 9.2 software (SAS Institute Inc.,
Cary, NC, U.S.A.). Data are presented as mean + SE and a significant difference was
determined at P ≤ 0.05.

53
RESULTS
Efficiency of siRNA transfection
To determine the efficiency of transfection, MC3T3-E1 cells were transfected with
siGLO red transfection indicator, a negative control (NC) siRNA at 16.5, 33, and 66 nM
and Lipofectamine 2000 transfection reagent at 0.5, 1.0, and 1.5 µL, followed by the
quantification of fluorescent cells (Figure 2). Overall, the cells transfected with 16.5 nM
and 66 nM of siRNA had the lowest and greatest transfection efficiency, respectively (P
< 0.001; Figure 3). Specifically, the cells transfected with 16.5 nM of siRNA and 0.5, 1.0,
and 1.5 µL of Lipofectamine 2000 had 30, 43 and 55 % of cells transfected with siRNA,
respectively (P < 0.001). Similarly, the cells transfected with 33 nM of siRNA and 0.5,
1.0, and 1.5 µL of Lipofectamine 2000 had 38, 75 and 74 % of cells transfected with
siRNA, respectively (P < 0.001). The cells transfected with 66 nM of siRNA and 0.5 µL,
1.0 µL, and 1.5 µL of Lipofectamine 2000 had 54, 83 and 86 % of cells transfected with
siRNA, respectively (Figure 3). We determined the greatest transfection efficiency with
66 nM of siGLO red and 1.5 µL of Lipofectamine 2000. We did not detect any significant
difference (P < 0.596) in the efficieny of transfection when treated with 1.0 µL or 1.5 µL
of Lipofectamine 2000/well and 66 nM of siGLO red. Since the Lipofectamine 2000 is
slightly cytotoxic, we decided to use 1.0 µL of Lipofectamine 2000/well for transfection.
Thus, it was deduced through optimization to use 66 nM of siRNA with 1.0 µL of
Lipofectamine 2000 per well for our experiments.
Knockdown of Tbx2 expression using siRNA
The mRNA expression of Tbx2 was reduced by 81 + 2 and 78 + 2 % after 24
and 48 hr of transfection, respectively when compared to the control (P < 0.015; Figure
4). To determine if the knockdown of Tbx2 altered Tbx3 expression, the mRNA

54
expression of Tbx3 was also determined 24 and 48 hr after transfection with Tbx2
siRNA. Surprisingly, the expression of Tbx3 was reduced by 40 + 2 % at 24 and 48 hr
after transfection when compared to the control (P < 0.015; Figure 5).
Western blot analysis
To confirm the knockdown of Tbx2 protein, western blot analysis was performed
using Tbx2 specific antibody. The whole cell lysate proteins were extracted from the
MC3T3-E1 cells after transfection with siRNA (Tbx2 siRNA and NC siRNA). Surprisingly,
we did not detect significant amounts of Tbx2 protein in the NC siRNA and Tbx2 siRNA
transfected samples (data not shown). In addition, we also did not detect Tbx2 protein in
the normal nontransfected MC3T3-E1 cells (Figure 6 A). To confirm that the antibody
used for the western blot was effective, we extracted protein from mouse lung, which
has been shown to have high expression of Tbx2 (Chapman et al., 1996a). We were
able to detect Tbx2 protein in mouse lung at 75 kDa, the expected molecular size for this
protein (Figure 6 A).To determine if the lack of Tbx2 protein expression in MC3T3-E1
cells was specific to the cell line, we looked at the Tbx2 protein expression in mouse
bone tissue lysate, mouse BMSC, and human osteosarcoma cell line (Saos-2; Figure 6
A and B). We did not detect Tbx2 protein in mouse bone tissue lysate and BMSC (Figure
6 A). However, a band at approximately 100 kDa was observed in Saos-2 cells (Figure 6
B). To confirm that 75 kDa band in MC3T3-E1 cells and 100 kDa band in Saos-2 cells
were indeed Tbx2, we performed western blot with Tbx2 blocking peptide. The blocking
peptide successfully removed the 75 and 100 kDa bands (Figure 7), thus confirming that
the bands were indeeed Tbx2.

55
Role of Tbx2 in osteoblast function
We did not observe a significant effect (P > 0.29) of knockdown of Tbx2 mRNA
expression on osteoblast cell number (Figure 8) and DNA synthesis (Figure 9) in the
presence or absence of serum. Similarly we did not observe a significant change (P >
0.255) in ALP activity both in the presence or absence of BMP-2 in cells transfected
with Tbx2 siRNA (Figure 10).

56
Figure Legends
Figure 2. Optimization of siRNA transfection. Cells were transfected with various
concentrations of siGLO red transfection indicator (16.5, 33, and 66 nM) and
Lipofectamine 2000 (lipo; 0.5, 1.0, and 1.5 µL). Data are presented as mean + SE. Bars
with different letters are significantly different at P < 0.001. n = 4/treatment.
Figure 3. Transfection efficiency of MC3T3-E1 cells using 66 nM of siGLO red siRNA
and 1.0 µL of Lipofectamine 2000. The efficency was determined by the number of
fluorescent cells vs. non-fluorescent cells. Each image is a representative of an
experiment which included 4 plates/treatment and had 86 % of cells transfected with
siRNA.
Figure 4. Knockdown of Tbx2 expression. MC3T3-E1 cells were transfected with 66 nM
Tbx2 siRNA or negative control siRNA (NC siRNA; control) with n = 4/treatment and the
mRNA expression were determined by real-time RT-PCR analysis 24 and 48 hr after
transfection. Data are presented as mean + SE and expressed as % of control. *
indicates a significant difference at P < 0.015.
Figure 5. Expression of Tbx3 in cells transfected with Tbx2 siRNA. MC3T3-E1 cells were
transfected with 66 nM Tbx2 siRNA or negative control siRNA (NC siRNA; control) with n
= 4/treatment and the mRNA expression were determined by real-time RT-PCR analysis
24 and 48 hr after transfection. Data are presented as mean + SE and expressed as %
of control. * indicates a significant difference at P < 0.015.
Figure 6. Tbx2 protein expression in various tissues and cell lines. A) Western blot
analysis was used to detect Tbx2 protein in mouse lung, mouse bone marrow stromal
cells (BMSC), MC3T3-E1 cells and Saos-2 cells. B) Western blot analysis was used to
detect Tbx2 protein in mouse lung, MC3T3-E1 cells, and Saos-2 cells. β-actin served as
loading control for all the western blot analysis.
Figure 7. Confirmation of Tbx2 protein in mouse and human samples.The 100 kDa band
in Saos-2 cells and 75 kDa band in mouse lung tissue lysate were confirmed as Tbx2
protein by peptide neutralisation.

57
Figure 8. Role of Tbx2 in osteoblast cell number. Osteoblast cell number was
determined by alamarBlue assay. The MC3T3-E1 cells were transfected with 66 nM
Tbx2 siRNA and negative control siRNA (control) in the absence (0.1 % BSA) or
presence (0.1 % BSA + 1 % CS) of calf serum. Data are presented as mean + SE and
expressed as % of control. n = 4/treatment.
Figure 9. Role of Tbx2 in osteoblast DNA synthesis. DNA synthesis was determined by
BrdU assay. The MC3T3-E1 cells were transfected with 66 nM Tbx2 siRNA and negative
control siRNA (control) in the absence (0.1 % BSA) or presence (0.1 % BSA + 1 % CS)
of calf serum. Data are presented as mean + SE and expressed as % of control. n =
4/treatment.
Figure 10. Role of Tbx2 in osteoblast differentiation. Osteoblast differentiation was
determined by ALP activity and corrected for protein. The MC3T3-E1 cells were
transfected with 66 nM Tbx2 siRNA and negative control siRNA (control) in the presence
or absence of BMP-2 at a concentration of 30 ng/mL. Data are presented as mean + SE
and expressed as % of control. n = 4/treatment.
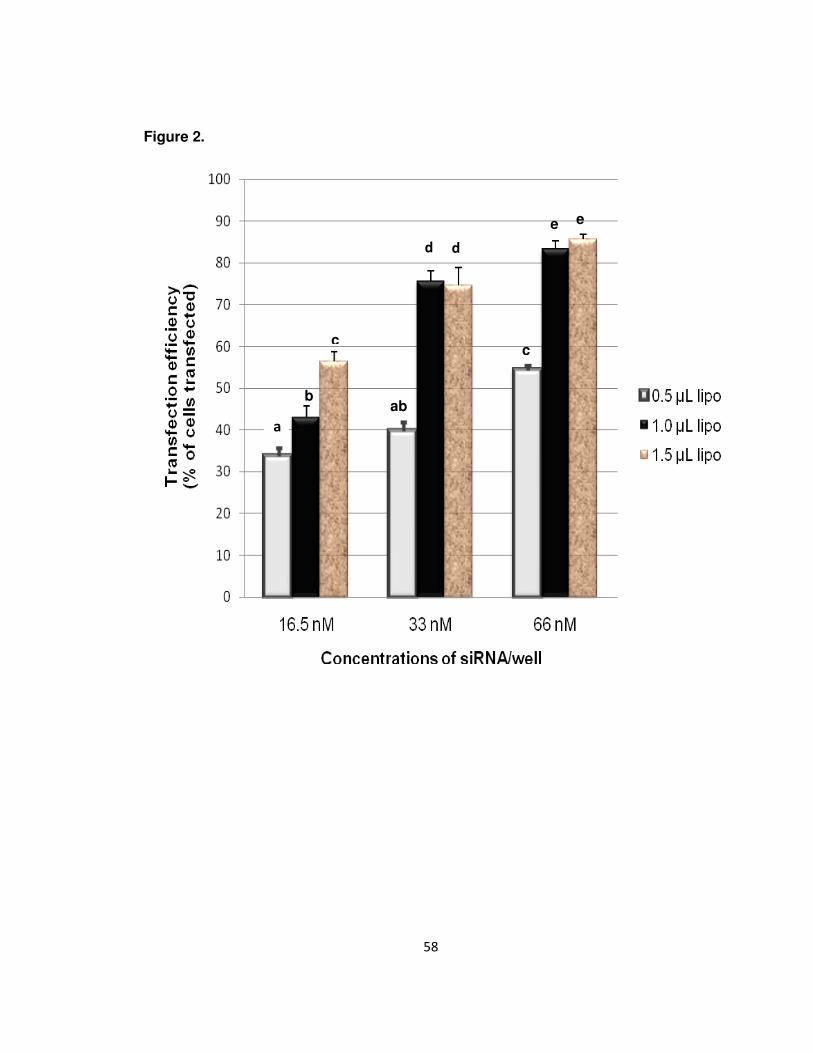
58
Figure 2.
d
b
a
c
ab
c
e e
d
a

59
Figure 3.
Non-fluorescent
Fluorescent
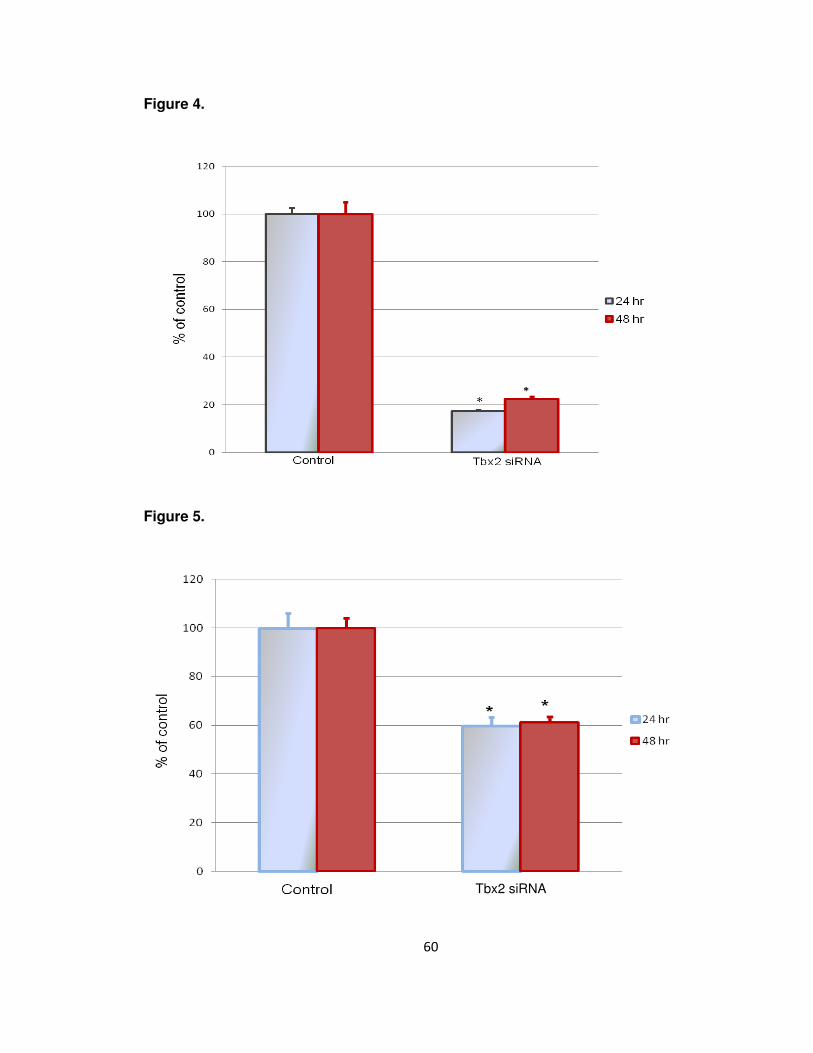
60
Figure 4.
Figure 5.
Tbx2 siRNA

61
Figure 6.
A.
B.
Figure 7
Mouse Mouse MC3T3-E1 Mouse Mouse MC3T3-E1 lung lung BMSC bone
Mouse Mouse Saos-2 Saos-2 MC3T3-E1 MC3T3-E1 lung lung
75 kDa
44 kDa
100 kDa
75 kDa
44 kDa
Saos-2 Mouse Saos-2 Mouse lung lung +peptide +peptide
100 kDa
75 kDa
Tbx2
β–actin
Tbx2
β–actin
Tbx2

62
Figure 8.
Figure 9.

63
Figure 10.

64
DISCUSSION
The process of bone formation is very complex and tightly regulated by
hormones, growth factors and transcription factors. With the recent advances in mouse
and human genetic information, studies have led to the identification of novel
transcription factors that regulate bone formation. Identification of these novel
transcription factors will provide a better understanding of the bone formation process
and will ultimately aid in the development of potential therapies for the prevention and/or
treatment of osteoporosis or other bone related diseases.
The Tbx family is one among the novel transcription factors that has very
recently been shown to regulate embryonic limb development and osteoblast function.
Specifically Tbx2, Tbx3, Tbx4, and Tbx5 are highly expressed in the limb buds and
extensively studied to understand their role during embryonic skeletal development
(Chapman et al., 1996; Candille et al., 2004). Very recent studies demonstrate that Tbx
transcription factors are also expressed postnatally. In particular, Tbx3 expressed in
adult mouse bone, is regulated by several growth factors and regulates osteoblast
function (Govoni et al., 2006). A very closely related member to Tbx3 is Tbx2 with 90%
homology in the mRNA sequence. In addition, both Tbx2 and Tbx3 are transcriptional
repressors and regulate various stages during embryonic development (Plageman and
Yutzey, 2005). They are functionally similar in different tissues including embryonic heart
development (Christoffels et al., 2004), embryonic eye development (Behesti et al.,
2006) and cell cycle regulation (Dobrzycka et al., 2006). As described above, the role of
Tbx3 in osteoblast function has been well characterized. However, to date there are no
data available on the role of Tbx2 in osteoblast function during postnatal bone
development.

65
Through the use of RNA interference we have attempted to elucidate the
function of Tbx2 in osteoblast proliferation and differentiation. Based on the knowledge
that Tbx2 is very closely related to Tbx3 in sequence homology, has overlapping
functions in embryonic heart, eye development and cell cycle regulation (Christoffels et
al., 2004; Dobrzycka et al., 2006), we hypothesized that similar to Tbx3, Tbx2 also
regulates osteoblast function. For this study, we successfully transfected a murine
preosteoblast cell line (MC3T3-E1) and knocked down the mRNA expression of Tbx2
using Tbx2 siRNA and Lipofectamine 2000. Previous studies have successfully used the
transfection reagent Lipofectamine 2000 to transfect the MC3T3-E1 cells with siRNA
(Alford et al., 2010). In particular, the concentration of Lipofectamine 2000 used by the
Alford and coworkers was similar to the concentration used for this study (Alford et al.,
2010). Similarly, Tbx2 siRNA has also been previoulsy used to knockdown the
expression of Tbx2 in breast cancer cell lines (Redmond et al., 2010). Specifically, they
knocked down the expression of Tbx2 by more than 90 % at 24 hr after transfection
(Redmond et al., 2010). This is consistent with our findings that we were able to
successfully transfect the MC3T3-E1 cell lines and knock down the expression of Tbx2
by more than 80 % at 24 hr after transfection.
As described above, Tbx2 is very closely related to Tbx3, sharing 90 %
homology in sequence and overlapping functions in many tissues. Based on these
findings, we anticipated that Tbx2 and Tbx3 may have similar expression patterns and
functions in osteoblasts. A previous study in which Tbx3 was knocked out in mouse
suggested a compensatory upregulation of Tbx2 with the loss of Tbx3 in embryonic
heart development (Plageman and Yutzey, 2005). To determine if the knockdown of
Tbx2 altered Tbx3 expression, the mRNA expression of Tbx3 was determined in
MC3T3-E1 cells treated with Tbx2 siRNA. Surprisingly, we observed a significant

66
decrease in the expression of Tbx3 by 40 % in cells transfected with Tbx2 siRNA.
Although the non-specificity of Tbx2 siRNA used for this study may be a possible
explanation for reduced Tbx3 expression in MC3T3-E1 cells treated with Tbx2 siRNA, it
is unlikely. To determine the specificity of Tbx2 siRNA, the four Tbx2 siRNA sequences
present in the mouse Tbx2 siGENOME smart pool were blasted against the mouse
genome and the results matched only to the mouse Tbx2 mRNA and were not
homologous to Tbx3. Hence, the non specificity of Tbx2 siRNA is less likely an
explanation for the reduced expression of Tbx3 with knock down of Tbx2.
A biological effect within the cells is more likely an explanation for the reduced
expression of Tbx3 mRNA in MC3T3-E1 cells transfected with siRNA. Contrary to our
findings, it has been demonstrated that transfection of a melanoma cell line with Tbx3
siRNA led to upregulation of Tbx2 suggesting that Tbx3 represses the expression of
Tbx2 in melanoma cells (Rodriguez et al., 2008). This study suggests that the change in
Tbx3 mRNA expression may be a biological effect of reduced Tbx2 and substantiates for
the variation in the expression of Tbx3 and Tbx2 when transfected with siRNA as a
biological effect. Studies involving Tbx3 deficient mice also demonstrate the variation in
the expression of Tbx2 (Davenport et al., 2003b; Bakker et al., 2008). Specifically, in situ
hybridization of the Tbx3 homozygous mutant embryos demonstrated a greatly reduced
and absence of Tbx2 expression in the posterior margin of the forelimb and hindlimb,
respectively whereas the expression of Tbx4 and Tbx5 was not altered (Davenport et al.,
2003b). This suggests that knocking down Tbx3 expression reduces the expression of
Tbx2 in embryonic limb bud. This is similar to our findings where knocking down the
expression of Tbx2 in a mouse preosteoblast cell line reduced the mRNA expression of
Tbx3. It is still not clear if the expression of Tbx2 and Tbx3 appear to be dependent on
each other, however further studies are necessary to elucidate the relative expression of

67
Tbx2 or Tbx3 within the osteoblast and determine if they are indeed dependent on each
other.
Tbx2 is expressed in mouse and human heart, lung, kidney, bone, and mammary
tissue during embryonic development (Fan et al., 2004; Ito et al., 2005). Although Tbx2
is expressed in various tissues, the functions of Tbx2 are not yet well understood in
these tissues. Based on the fact that Tbx2 is widely expressed in several tissues
including embryonic bone, it is expected that Tbx2 is also expressed in MC3T3-E1 cells,
a preosteoblast cell line. As predicted, we observed Tbx2 mRNA expression in the
MC3T3-E1 cells. To further verify the fact the Tbx2 is indeed expressed in the MC3T3-
E1 cells, the two Tbx2 primers used for this study were validated by sequencing the
PCR product and blasted against the mouse genome. Results of the blast analysis
matched only to the mouse Tbx2 mRNA. Therefore, it was confirmed that Tbx2 is
expressed in MC3T3-E1 cells at the mRNA level.
To confirm the knockdown of Tbx2 at the protein level, whole cell lysate proteins
were extracted from the siRNA transfected cells and western blot was performed.
Surprisingly, we could not detect significant amounts of Tbx2 protein in either of the
siRNA transfected MC3T3-E1 cells (NC siRNA or Tbx2 siRNA) or in non transfected
MC3T3-E1 cells. Previous studies demonstrate that Tbx2 is highly expressed in mouse
lung (Chapman et al., 1996a). To confirm that the antibody used for the western blot was
effective, we extracted mouse lung protein and used it as a positive control. The Tbx2
protein could be detected in the mouse lung at 75 kDa but not in the MC3T3-E1 cell
lysate. Furthermore, to validate the lack of Tbx2 protein expression was not specific to
the cell line, we looked at the expression of Tbx2 protein in mouse BMSC, bone tissue
lysate, and human osteosarcoma cell line (Saos-2). A previous study demonstrated the
68
presence of Tbx2 protein in many osteosarcoma cell lines including Saos-2, ROS 17/2.8,
and MG63 (Chen et al., 2001). Similar to their findings, we detected the Tbx2 protein in
Saos-2 cells but at approximately 100 kDa. The predicted molecular size of Tbx2 protein
is 75 kDa but our western blot showed an intense band at 100 kDa that was later
confirmed as Tbx2 protein by the peptide neutralization. It is unclear as to why the Tbx2
protein was detected in two molecular sizes by western blot analysis. The possible
explanations for the disparity in molecular size may be due to alternative splicing of Tbx2
mRNA. Previous studies have demonstrated that alternate splicing can occur in human
Tbx2 (generally denoted as TBX2) and lead to proteins of varying molecular sizes
(Campbell et al., 1998). Moreover, in communication with a research lab extensively
working on Tbx2 in South Africa further substantiated for the band observed at 100kDa
(Dr. Sharon Prince Lab, Department of Human Biology, University of Cape Town, South
Africa). Similar to our findings, they also detect the Tbx2 protein at approximately
100kDa (Abrahams et al., 2008). Although it is unclear as to why two different band
sizes were obtained for Tbx2, it was confirmed by peptide neutralization that the bands
observed at 75 kDa in mouse lung and approximately at 100 kDa in Saos-2 cells were
indeed Tbx2. Further studies on the structure of Tbx2 protein are necessary to address
the disparity in molecular sizes of Tbx2 protein in western blot analysis.
We failed to detect Tbx2 protein is not present in detectable amounts in MC3T3-
E1 cells, mouse BMSC, and bone tissue lysate but is detected in Saos-2 cells. This
finding is consistent with the detection of varying amounts of Tbx2 protein in
melanocytes (Vance et al., 2005). In particular, it has been demonstrated that the Tbx2
protein is poorly expressed or absent in both primary human melanocytes and mouse
melanocyte cell line whereas greatly expressed in melanoma cell lines (Vance et al.,
2005). Very similar to their findings, we could not observe significant amounts of Tbx2

69
protein in mouse BMSC and mouse osteoblast cell line but greatly expressed in Saos-2,
a human osteosarcoma cell line. Similarly, the expression of Tbx2 is upregulated in
many cancers, including breast, pancreatic, melanoma, liver, and bladder (Fan et al.,
2004; Ito et al., 2005). Tbx2 along with Tbx3 prevents senescence in these cancer cells
by a mechanism involving their ability to transcriptionally repress p14ARF, a tumor
suppressor gene (Lingbeek et al., 2002). This demonstrates that Tbx2 is involved in cell
cycle regulation suggesting that Tbx2 may be an important regulator of cancer cell
progression. A better understanding of the upstream and downstream targets for Tbx2
will provide a better understanding of the upregulation of Tbx2 in several cancerous
tissues.
The expression of Tbx2 also varies greatly within a cell type. For instance, the
expression of Tbx2 at the mRNA level and at the protein level were examined in a
variety of breast cancer cell lines and it was observed that the Tbx2 protein was
detected in only three out of eight breast cancer cell lines used for the study (Redmond
et al., 2010). Similarly, Tbx2 protein was detected in five of the twelve human melanoma
cell lines examined by Rodriguez and coworkers (Rodriguez et al., 2008). These studies
suggest that the expression of Tbx2 varies greatly within a cell type. Therefore, the
selection of a cell line that expresses Tbx2 both at the mRNA and protein level forms the
basic criterion to study the functional role of Tbx2 within a cell type.
Thus, our study revealed that there are detectable amounts of Tbx2 expression
at the mRNA level but Tbx2 protein was not detected in MC3T3-E1 cells. This suggests
that the Tbx2 mRNA expression profile does not correlate with expression profile of Tbx2
protein. Similar findings have been observed in many eukaryotic proteomic studies (Gygi
et al., 1999; Chen et al., 2002). A previous study determined the relationship between

70
mRNA and protein expression levels for 150 genes in the yeast Saccharomyces
cerevisiae (Gygi et al., 1999). They demonstrated that the quanitification of mRNA is
insufficient to predict the protein levels within the cell. In particular, they observed that
the correlation between mRNA and protein expression is greatly reduced in lesser
abundant proteins when compared to greater abundant proteins (Gygi et al., 1999). This
suggests the importance of posttranslational mechanisms regulating gene expression
especially in less abundant proteins. In this context, Tbx2 being a less abundant protein
can explain for the disparity in the mRNA and protein expression profile. Further studies
are needed to address this variation in the mRNA and protein expression profile of Tbx2
in MC3T3-E1 cells.
Surprisingly, we did not observe any effect of knockdown of Tbx2 on osteoblast
proliferation and differentiation. Specifically, knocking down the expression of Tbx2 using
siRNA did not affect the proliferation or differentiation of osteoblasts both in the presence
or absence of serum. Previous studies have demonstrated the role of Tbx2 in cell cycle
regulation (Dobrzycka et al., 2006). As described earlier, Tbx2 along with Tbx3 act as
anti senescence factors in several cancers (Fan et al., 2004; Ito et al., 2005). Bypassing
the senescence leads to uncontrolled cell proliferation thereby ultimately leading to
cancer. Additionally Tbx3, closely related to Tbx2 with 90% homology in sequence and
functional similarity in tissues, has been demonstrated to be an important mediator of
osteoblast proliferation by Govoni and coworkers in 2006 (Govoni et al., 2006). They
observed that knocking down the expression of Tbx3 in MC3T3-E1 cells reduced
osteoblast proliferation both in the presence or absence of serum (Govoni et al., 2006).
Several other studies have also demonstrated the regulatory effect of Tbx3 on cell
proliferation. For instance, the proliferation rates of rat bladder hyperplastic epitehlial and
carcinoma cells are regulated by Tbx3 (Ito et al., 2005). In addition to the role of Tbx3 on

71
osteoblast proliferation, studies have demonstrated that Tbx3 regulates osteoblast
differentiation (Govoni et al., 2006; Govoni et al., 2009). Specifically, they reported that
the expression of Tbx3 increased 2 fold during in vitro differentiation of MC3T3-E1 cells.
In addition, Tbx3 increased the expression of BMP-7 and Wnt3a (Govoni et al., 2006),
known stimulators of osteoblast differentiation further confirming the fact that Tbx3
regulates osteoblast differentiation. Based on the close homology in sequence and
functional similarity of Tbx3 to Tbx2, we hypothesized that Tbx2, like Tbx3 regulates
osteoblast proliferation and differentiation. However, we could not determine any effect
of Tbx2 on osteoblast proliferation and differentiation. But this could be due to lack of
Tbx2 protein in these cells and did not knock it down.
Our preliminary results are comparable to previous studies which demonstrate
that although Tbx2 and Tbx3 are very closely related, they may differ in their expression
and have distinct roles within a cell type (Rodriguez et al., 2008; Peres et al., 2010). In
several melanoma cell lines used for the study, no cell lines demonstrated significant
amounts of both Tbx2 and Tbx3 protein detected by western blot analysis (Rodriguez et
al., 2008). The cell lines that greatly expressed Tbx3 protein poorly expressed Tbx2
protein and vice versa suggesting a significant biological function of only one of the two
(Tbx2 or Tbx3) in melanoma cells. These factors could account for the poor expression
of Tbx2 protein in MC3T3-E1 cells, where Tbx3 protein is expressed (Govoni et al.,
2006). Very recently, a study demonstrates that Tbx3 and Tbx2 have distinct roles in the
melanoma and breast cancer cell line (Peres et al., 2010). They report that Tbx2
promotes cell proliferation and does not affect the cell migration whereas Tbx3 is
required for tumor formation and cell migration and in fact inhibits cell proliferation
(Peres et al., 2010). The differential expression and distinct role of Tbx3 and Tbx2 within

72
a cell type suggests that Tbx2 is not an important regulator of osteoblast function like
Tbx3.
To conclude, we transfected and knocked down the expression of Tbx2 in
MC3T3-E1 cells to evaluate the role of Tbx2 in osteoblast function. We did not determine
any effect of Tbx2 in osteoblast function including proliferation and differentiation. There
are two possible explanations for why we did not observe any effect of Tbx2 in
osteoblast function. Firstly, it is possible that Tbx2 is not required for the osteoblast
function which is suggested by the absence or poor Tbx2 protein expression in MC3T3-
E1 cells. Secondly, based on little to no Tbx2 protein expression in MC3T3-E1 cells,
knock down of Tbx2 was not an optimal method to evaluate its role on osteoblast
proliferation and differentiation. Further studies involving the over expression of Tbx2 in
MC3T3-E1 cells are needed to better understand the role of Tbx2 on osteoblast function.
Use of other preosteoblast cell lines that express Tbx2 both at the mRNA and at the
protein level is an alternate method to elucidate the role of Tbx2 on osteoblast function.

73
APPENDIX
Section I. Cell culture - maintenance of MC3T3-E1 cell lines
1. Warm the bottles of α-MEM + 10% CS + 1% PS media, PBS, and 50% Trypsin-
EDTA + 50% PBS in water bath at 37°C. Note: Do not place the bottle with Trypsin-
EDTA directly in water.
2. Wipe down the working area in the hood with a 70% ethanol soaked gauze sponge.
Spray or wipe the pipette gun and a 50 mL Falcon tube with 70% ethanol and place
them in the hood.
3. Wipe the bottles from the water bath with 70% ethanol gauze and place them into the
hood.
4. Once all above steps are done remove the cell culture dishes from the incubator and
place them into the hood.
5. Tilt the plate of cells. Using a glass Pasteur pipette and the vacuum pump, remove
the media from the plate without touching the bottom of plate with the pipette tip.
6. Tilt the plate and use a transfer pipette to gently add PBS to the plate, from the side
wall. Then swirl the PBS over the plate to rinse the cells.
7. Tilt the plate and using a glass Pasteur pipette and the vacuum pump remove the
PBS from the plate.
8. Add 50% trypsin-EDTA + 50% PBS directly onto the cells.
9. Incubate the plate for 3 min at 37°C.
10. Remove the plate from incubator and place it in the hood. Tilt the plate and with a
transfer pipette draw up some of the 50% trypsin-EDTA + 50% PBS. Using the liquid
in the pipette rinse the bottom of plate. When the cells are detached, use a transfer
pipette to add α-MEM + 10% CS + 1% PS media to inactivate the trypsin-EDTA.
11. Keep rinsing the plate with 50% trypsin-EDTA + 50% PBS and α-MEM + 10% CS +
1% PS media until bottom of the plate has no visible residue.
12. Transfer the 50% trypsin-EDTA + 50% PBS and α-MEM + 10% CS + 1% PS media
solution from the plate to a 50 mL Falcon tube.
13. Centrifuge the 50mL Falcon tube at 1000 rpm for 3 min at room temperature (22°C
to 26°C). Note: remember to balance the centrifuge with a water blank.
14. Once the centrifuge is complete move the Falcon tube back into the hood. Use a
glass Pasture pipette and the vacuum pump to remove the supernatant from cell
pellet that remains at the bottom of the tube.
15. Add at least 10mL of α-MEM + 10% CS + 1% PS media to the cell pellet in the
Falcon tube (Note: amount of media to use to re-suspend the pellet varies according
to the number of plates available and type of experiment). Add the media slowly, and
then pipette up and down until the pellet is broken up.
16. Once cells are re-constituted in the α-MEM + 10% CS + 1% PS media add more
media as needed for the number of new plates that the cells are being expanded to.

74
17. Add about 7 to 8 mL of α-MEM + 10% CS + 1% PS media to new plates, and then
add your pre-determined amount of the α-MEM + 10% CS + 1% PS containing the
cells to each plate. Note: add the cells in small drops all around the plate so that the
cells do not clump.
18. Swirl the plates to ensure that the cells are evenly distributed.
19. Label each plate with cell type and origin, passage number, initials, date, and plate
number.
20. Check plates under the microscope to ensure cells are evenly distributed in an
appropriate confluency.
21. Incubate the plates, clean up, and wipe down the hood with 70% ethanol.

75
Section II. siRNA transfection with Lipofectamine 2000
1. The MC3T3-E1 cells (2,000 cells/well in a 96-well plate, 14,000 cells/well in a 24-well
plate, and 70,000 cells/well in a 6-well plate) are plated in α-MEM +10% CS (100 µL
of media/well for 96-well plate, 500 µL of media/well for 24-well plate and 2 mL of
media/well for 6-well plate).
2. Dilute the siRNA (10 pmols/well for 96-well plate, 40 pmols/well for 24-well plate, and
200 pmols/well for 6-well plate) in Opti-MEM I Reduced Serum Media (25 µL/well for
96-well plate, 50 µL/well for 24-well plate, and 250 µL/well for 6-well plate) and mixed
gently.
3. Mix the lipofectamine 2000 gently before use.
4. Dilute the Lipofectamine 2000 (0.25 µL/well for 96-well plate, 1 µL/well for 24-well
plate, and 5 µL/well for 6-well plate) in Opti-MEM I Reduced Serum Media (25 µL/well
for 96-well plate, 50 µL/well for 24-well plate, and 250 µL/well for 6-well plate) and
incubated for 5 min at room temperature.
5. Combine the diluted siRNA and diluted Lipofectamine 2000 (to form the siRNA-
Liporectamine 2000 complex) as soon as possible and incubate for 25 min at room
temperature.
6. Add siRNA-Lipofectamine 2000 complex to each well (50 µL/well for 96-well plate,
100 µL/well for 24-well plate, and 500 µL/well for 6-well plate).
7. Incubate the plates for 24 hours at 37⁰C.

76
Section III. RNA extraction—Qiagen Kit
1. The transfected cells are grown in 6-well plates (70,000 cells/well).
2. Tilt the plate of cells. Using a glass Pasteur pipette and the vacuum pump, remove
the media from the plate without touching the bottom of plate with the pipette tip.
3. Tilt the plate and use a transfer pipette to gently add PBS to the plate, from the side
wall. Then swirl the PBS over the plate to rinse the cells.
4. Tilt the plate and using a glass Pasteur pipette and the vacuum pump remove the
PBS from the plate.
5. Add 1 mL TRI Reagent (trizol) to each well and scrape with pipet tip.
6. Transfer it to a 1.5 mL microcentrifuge tube, vortex, and homogenize.
7. Incubate for 5 min at room temperature.
8. Add 200 µL chloroform to each tube and mix by inverting 5 to 7 times.
9. Incubate for 2 to 3 min at room temperature.
10. Centrifuge at 12,000 x g for 15 min.
11. Transfer the aqueous phase (transparent, clear top layer) into a new micro centrifuge
tube (approximately 500 µL).
12. Add one volume (500 µL) of 70% EtOH to each tube and vortex the tubes.
13. Transfer 700 µL of the sample into the RNA easy spin column.
14. Centrifuge at 8000 x g for 30 seconds and discard the flow through.
15. Add 700 µL Buffer RWI and centrifuge at 8000 x g for 30 seconds.
16. Discard the flow through and the collection tube, and place the filter into a new
collection tube.
17. Add 500 µL of Buffer RPE and centrifuge at 8000 x g for 30 seconds.
18. Discard the flow through and add 500 µL of RPE buffer.
19. Centrifuge at 8000 x g for 2 min and discard the flow through.
20. Centrifuge at 8000 x g for 1 minute.
21. Discard the flow through and the collection tube, and put the filter into a new capped
collection tube.
22. Add 50 µL of Rnase free water and centrifuge at 8000 x g for 1 minute.
23. Take 35 to 40 µL from the collection tube and put back on the filter. Centrifuge at
8000 x g for 1 minute.
24. Collect the eluted RNA and spec it in the Nanodrop spectrophotometer.
25. Aliquot and store in the -800C freezer

77
Section IV. Normalizing the concentration of RNA to 300 ng/10µL
Sample
1. We need 300 ng/10 µL or 30 ng/µL of RNA to be used for reverse transcription.
The final volume shoµLd be 26 µL (20 µL to be divided into two sets of reverse
transcription and 6 µL for spectrophotometer analysis).
C1V1= C2V2
C2= 30 ng/µL
V2=26 µL
C1=concentration of RNA obtained after DNA-free treatment
V1=?
This calculation shoµLd give V1, the amount of stock solution of RNA to be taken. The
volume is corrected to 26 µL using nuclease free water.
2. The RNA concentration shoµLd come to 30 ng/µL, variations are adjusted to 30 ng/µL
by adding Nuclease Free water (0.5-1.0 µL) or adding RNA (0.2 µL).
3. Transfer 10µL of normalized RNA (300 ng/10 µL) into one tube of an 8 tube strip (x 2)
for reverse transcription.

78
Section V. Reverse transcription
1. Thaw the reagents on ice (Ambion Oligo (dT), Invitrogen Superscript kit II containing
DTT, 5X buffer and reverse transcriptase)
2. Add 1 µL of Oligo (dT) to each 10 µL of normalized RNA sample (300 ng/10 µL) in 8
tube strips. This makes it a total of 11 µL.NOTE: Include a Positive control too.
3. Identify, or set the program on the PCR machine to run:
70˚C for 10 min
4˚C for 20 min
37˚C for 3 min
42˚C for 1hr
4 ˚C for 3 min
90˚C for 2.30 min
10˚C forever
4. Run the tubes in the PCR machine and start step1, 70˚C for 10min.
5. During step1, make the master mix (amounts are per sample, mµLtiply by the number
of samples plus two for pipetting errors).
Master Mix
5X Buffer- 5.5 µL
dNTP- 1.0 µL
DTT- 2.0 µL
Superscript II 0.5 µL
NOTE: Add SS II last.
6. Hit pause on the PCR machine when the temperature is dropping to 4˚C.
7. Take the samples with RNA and Oligo (dT) out of the machine and keep on ice.
8. Add SSII to the master mix, and mix gently.
9. Add 9 µL of master mix to each sample, making it a total of 20 µL (keep samples on
ice while adding the master mix).
10. Place the samples back into the machine, hit “proceed” and hit “proceed” again to
move to step # 3. The step #2 is skipped.
11. When reverse transcription is complete add 80 µL of Nuclease free water to
samples and store in -20˚C freezer.

79
Section VI. Polymerase Chain Reaction (PCR)
1. Thaw reagents on ice (Promega Green Master mix, Tbx2 114 forward and reverse
primer working aliquots, cDNA sample).
2. Make Master mix (amounts are per sample, mµLtiply by the number of samples plus
two for pipetting errors)
Nuclease free water 5.5 µL
Green master mix 12.5 µL
Forward Primer 1.0 µL
Reverse Primer 1.0 µL
3. Into 8-tube strips transfer 20 µL of the master mix per tube.
4. Into the same 8-tube strips add 5 µL of the cDNA per tube, making it a total of 25
µL/tube. This shoµLd be done just before it is ready to go into the PCR machine.
5. Place the tubes into PCR machine and run the program with the steps below:
94˚C for 3min
94˚C for 30s
60˚C for 1min
72˚C for1min
72˚C for 5 min
10˚C forever
6. Once the PCR is complete (about 2 and 1/2 hr), the sample is stored at 4˚C in the 8-
tube strips.
X 40cycles

80
Section VII. Agarose gel electrophoresis
Preparation of a 2% agarose gel (mini gel)
1. Weigh out 1 g of agarose.
2. Add it to a conical flask containing 50 mL of Tris-acetate-EDTA (TAE) buffer.
3. To dissolve, heat the mixture in a microwave for about 1.5 min (solution starts boiling
by this time). NOTE: take the flask out and swirl it every 30 seconds to avoid spillage
and to aid proper dissolution.
4. Allow the flask it to cool to about 50˚C to 60˚C (i.e. cool to touch).
5. Add 3 µL of ethidium bromide stock solution (10 mg/mL) to the liquid gel. Gently swirl
to mix. NOTE: WEAR GLOVES! Ethidium bromide is TOXIC MUTAGEN. Proper
care is to be taken in disposal.
6. Pour the liquid gel into the gel forming cassette.
7. Place the combs at one end to form the wells, allow it to solidify (about 20 min).
Loading the wells
1. Load ladder to the first well: 1 µL of loading dye + 5 µL of DNA ladder (100bp ladder,
Promega). The mixing can be done over a small piece of parafilm.
2. 10 µL of sample (PCR products) are loaded into the rest of the wells. There is no
need to add the loading dye to it, since the PCR product by itself contains the dye
(green master mix).
3. Fill the mingle apparatus with TAE Buffer.
4. Close the lid, making sure that the electric field is generated as desired (Run to Red).
5. Connect the electrodes to the battery and turn it on. Look for bubbles rising up on
either side of the electrodes.
6. Run it at 115 volts for about 45 min (i.e. until the dye front reaches almost bottom of
the gel).
7. Visualize the gel.

81
Section VIII. Real time RT-PCR
1. Thaw the reagents (Syber green wrapped in foil, forward and reverse primers of
Tbx2, PPIA, and any other targets, and cDNA) on ice.
2. Turn the lights off before you begin the experiment.
3. Make Master Mix (depending on the number of target genes). If Tbx2 and PPIA, then
prepare two Master mixes (Eg. If 6 samples of cDNA, then two master mixes of each
Tbx2 and PPIA for 8 reactions, 2 extra reactions for pipetting error)
4. Amount per reaction:
2X Syber Green 10 µL
Forward Primer 1 µL
Reverse primer 1 µL
NFree water 3 µL
5. Add 15 µL of master mix to each well that you will be using in a 96 PCR optical plate.
6. Add 5 µL of cDNA (diluted 1:5, 20 µL of cDNA + 80 µL of nuclease free water) to the
previously identified tubes. Make sure to pipette to the bottom of the tube.
7. Seal the plate with a PCR adhesive film tightly to prevent evaporation.
8. Centrifuge the plate at 1,000 rpm for 1 to 2 min.
9. Run it in Q-PCR Machine.

82
Section IX. Western Blot
SDS-PAGE
1. Take the casting stand and place the rubber bases (gray color) on them.
2. Place the 1.5 mm glass spacer plates with the green holder on to a casting stand.
(large plate facing the casting stand and small plate facing you). (Use black clips to
secure both sides of the plates carefully).
3. Prepare resolving gel (12%) and use a 10 mL pipette to pour the solution between the
1.5 mm spacer plates up to the mark (make sure you leave a 1 TO 2 cm gap). Pour
300 µL of isobutanol to remove bubbles and to level the gel by dragging the pipette
tip across (the isobutanol is more dense so it will float on top of the resolving gel
solution).
4. Allow the gel to solidify for 1 hour. Carefully remove the glass plates with the resolving
gel from the green holder. Wash the plates with deionized water without separating
plates. Take syringe and remove the isobutanol and wash thoroughly with water.
Return the plates to the casting stand.
5. Now place the glass plates with gel in to the electrode stand (Large plate facing you
and the small plate facing the stand). Now use the blotting paper (3 mm
chromatography paper) to remove the remaining water off the top of the resolving gel.
6. Prepare stacking gel (4%) solution and pour on top of the resolving gel. Fill with this
solution up to the top. Carefully insert a 10 well comb (1.5mm) (smooth side facing
the large plate) and allow it to solidify for 30 min. Make sure there are no air bubbles.
(comb-BioRad should be facing you after you turn apparatus)
7. Turn on the hot water bath to 650C.
8. Meanwhile, calculate the amount of sample required for loading the gel. The sample
will be loaded at 20 µL per well and the ladder will be loaded at 5µL of sample per
well. Each sample contains 3.3 µL of 6X loading dye, 20 µg of protein sample. The
total volume will be adjusted with water.
8. Vortex the sample tubes with the dye for 15 seconds. Place the samples in the hot
water bath for 10 min.
9. Remove comb carefully from the gel. Add ladder (5 µL) and samples (20 µL each)
using sequencing pipette tips.
10. Pour the running buffer into the apparatus. Close the unit and connect it to the power
supply. Electrophoreses the samples at 100 volts for 150 min at 300 amps.

83
Transfer
1. Carefully, take the gel out of the electrode assembly.
2. Cut the top of the (stacking) gel using a blade.
3. For each gel, cut two 3 mm chromatography paper (filter paper) and 1 PVDF or
nitrocellulose membrane (cut according to the size of the gel). Make a small cut for
the membrane on the right hand top corner.
4. Wet the filter paper and the PVDF membrane in Milli-Q water for 5 seconds followed
by soaking in transfer buffer (Tris/Glycine/Methanol) for 15 to 20 min.
5. Wet the scotch pads (white pad that comes with the apparatus) in water and then in
transfer buffer for 5 min.
6. Make a sandwich:
-Open transfer cartridge (plastic case with white and black sides) -Place the scotch pad, then filter paper, then gel on the black side of the catridge - Carefully place membrane on the gel such that the right hand cut matches with right side of the gel and roll out air bubbles with a glass pipette.
-Place the other filter paper and scotch pad on top. - Roll air bubbles again with glass pipette. - Close and seal cartridge. NOTE: The gel and the membrane were stacked into a sandwich with scotch
pads, presoaked filter paper membrane in such a way that the transfer of proteins
occurs from the negative to the positive electrode.
7. Place cartridge in transfer apparatus or Mini Transblot Electrophoretic Cell (Bio-
Rad Laboratories) (make sure that the black side of cartridge faces black side of
the apparatus).
8. Fill the apparatus with transfer buffer until the gel or membrane is covered.
9. Add stir bar to the transfer apparatus and place the apparatus in a cold room on
a stir plate. Turn on the stir plate and connect the apparatus to power.
10. Transfer overnight at 25 volts in 40C or at 100 volts for 2 ½ hrs at room
temperature. The membrane thus obtained was either used immediately or
stored at 40C.
Western Immunoblotting
1. After transfer, take out the membrane from the cassette.
2. Place the membrane with proteins in a container (usually lid of a pipette box) and
blocking buffer (~ 10 mL) such that the membrane is fullly immersed in the buffer.
Incubate the membrane in blocking buffer for 1 hour at 40C on a rocking platform.
3. Wash the membranes three times for 5 min each wash with TBS/T.

84
4. After washing, add primary antibody (Tbx2 1: 500, abcam) to the blocking buffer (~10
mL) with respective dilutions in a container. Incubate membrane in the primary
antibody dilution overnight.
5. Wash membrane three times for 5 min each wash with TBS/T.
6. After washing, add secondary antibody (Anti Tbx2 1: 2000, abcam) to the blocking
buffer (~10 mL) with respective dilutions in a container and incubate for 1 hour.
7. Again wash the membrane three times for 5 min each wash in TBS/T prior to
developing.
Stripping the membrane:
Stripping the membrane enables the removal of the antibodies from the
membrane without losing proteins and reprobing the same membrane with a different
antibody. Each membrane can be stripped and reused 3 to 4 times. For example:
stripping allows checking of the expression of the protein of interest as well as housing
keeping gene on the same membrane.
1. Wash the membrane for 5 times for 5 min each wash in TBS/T.
2. Incubate the membrane in a plastic container with 10 mL of stripping buffer at 500C
to 550C.
3. Wash again in TBS/T twice with each wash lasting 5 min.
4. Block the membrane with 5% non fat milk.
5. Follow the same protocol for the regular western blotting from this step onwards.
Buffers used for western blot
10X TRIS/GLYCINE STOCK SOLUTION
For 1000 mL of 10X Tris/Glycine: 30 g Tris base 144 g Glycine 1000 mL Milli-Q H2O Need not autoclave/sterilize RUNNING BUFFER
For 1000 mL 1X solution: 100 mL 10X Tris/Glycine stock solution 900 mL Milli-Q H2O Add 1g SDS Need not autoclave/sterilize TRANSFER BUFFER
For 1000 mL 1X solution: 80 mL of 10X Tris/Glycine stock solution 720 mL of Milli-Q H20 200 mL MeOH Need not autoclave/sterilize TRIS BUFFERED SALINE (TBS)

85
For 1000 mL 10X stock solution: 24 g Tris base 80 g NaCl 1000 mL Milli-Q H2O Need not autoclave/sterilize TBS/T
For 1000 mL 1X solution: 100 mL 10X TBS 1 mL Tween-20 900 mL Milli-Q H20 Need not autoclave/sterilize 100mM Ammonium Per Sulfate (APS)
54.9 mg APS 549 µL of Milli-Q H20 Dissolve and aliquot 100 µL into each MCF tube Store at -200C Do not use more than once after thawing. 1.5 M TrisHCl pH 8.8
For 500 mL 1.5M solution: Tris base 90.76 gm
Add 450 mL Milli-Q water
Adjust to pH 8.8 with HCl.
Adjust volume to 500 mL with Milli-Q water
Store at 4°C
1 M TrisHCl pH 6.8
For 500 mL 1 M solution:
Tris base 60.57 gm
Add 450 mL Milli-Q water
Adjust to pH 6.8 with HCl.
Adjust volume to 500 mL with Milli-Q water
Store at 4°C
0.5 M TrisHCl pH 6.8
For 500 mL 0.5M solution:
Tris base 30.5 gm
Add 450 mL Milli-Q water
Adjust to pH 6.8 with HCl.
Adjust volume to 500 mL with Milli-Q water
Store at 4°C.
Sodium Dodecyl Sulfate (SDS )
For 100 mL 10% SDS stock solution:
10 g electrophoresis grade SDS
Add the powder carefully to 90 mL Milli-Q H2O
Place the container in a 65°C water bath (with frequent stirring) or a hot plate stirrer to
dissolve the SDS.
When SDS has dissolved, bring volume to 100 mL Milli-Q H2O.

86
Do not autoclave/sterilize. Store at room temperature (At room temperature SDS
solidifies. Before use, reheat to dissolve).
30% Acrylamide/ 0.8 % Bis-acrylamideFor 100 mL solution:
Acrylamide 30 gm
N'N'-bis-methylene-acrylamide 0.8 gm
Adjust volume to 100 mL with Milli-Q water
Sterilize the solution by filtration through a filter (0.45 micron pore size)
Store in amber bottle at 4°C in the dark (30 days max)
Blocking Buffer:
To a 50 mL tube add
5 mL 10XTBS
45 mL Milli-Q water
2.5 gm skim milk
50 µL Tween
Stripping Solution:
For 100 mL of stripping solution:
12.5 mL of 0.5M Tris-HCl
20 mL of 10% SDS
700 µL of b-mercaptoethanol
Adjust the volume to 100 mL with dH2O
Reagents Resolving Gel Stacking Gel
20 mL 10 mL 20 mL 10 mL
1.5 M TrisHCl pH 8.8 5 mL 2.5 mL -------- ---------
0.5 M TrisHCl pH 6.8 -------- -------- 5 mL 2.5 mL
Distilled water 6.7 mL 3.35 mL 10 mL 5 mL
10% SDS 200 µL
100 µL
100 µL 50 µL
30% Acrylamide/Bis-
acrylamide
8 mL 4 mL 2.4 mL 1.7 mL
100mM APS
(Ammonium
Persulfate)
(freshly prepared)
100 µL 50 µL 100 µL 50 µL
TEMED 10 µL 5 µL 10 µL 5 µL

87
Coomassie Brilliant Blue Staining on PVDF/Nitrocellulose Membrane:
For 1L staining solution add the following:
0.5% Coomassie brilliant blue ( 0.5 g )
40% methanol (400 mL)
10% acetic acid (100 mL)
Q/S with milli-Q H2O to 1000 mL
Destaining Solution
For 1L destaining solution add the following
30% methanol (300 mL)
10% acetic acid (100 mL)
Q/S with milli-Q H2O to 1000 mL
Gel Staining/Destaining Protocol
Stain gel/membrane in CBB solution for 30 min on shaking platform
Destain until background is transparent and bands are visible
Wash gel 3 to 5 times with H2O

88
Section XI. alamarBlue assay
Day 0 (Plating cells in 10% calf serum)
1. The cells are passed once (as per the Cell passage protocol) before plating.
2. Cells are collected from the plates, centrifuged at 1,000 rpm for 2 to 3 min,
resuspended in 10 mL of media and finally counted using a haemocytometer.
3. A 96 well plate is plated at a concentration of 2,000 cells/well in 50 µL/well of media.
Day 1 (Cells in serum free environment)
1. Stock Media (α-Minimal Essential Medium, MEM + 0.1% Bovine serum albumin, BSA
+ 1% Pencillinstreptomycin ) is thawed in water bath at 37⁰C.
2. Dump off the media in 96-well plate on to a paper towel placed in fume hood.
3. Load 50 µL of media to all the wells, mix gently, and dump it off.
4. Load 50 µL of media to all the wells and mixe.
5. Place the plate in a 5% CO2 incubator at 37⁰C.
Day 2 (Treatment of cells)
1. Layout a design for the control and different treatment wells (stock media with 0.1%
BSA-control, 0.1% CS, 0.5% CS, 1.0% CS, 5.0% CS, 10% CS etc. – treatment
wells).
2. Prepare treatment groups with different concentrations of calf serum and stock
media in 15 mL tubes. (Be sure to make double the volume required for each
treatment group).
3. Dump off the media in 96 well plate on to a paper towel placed in fume hood.
4. Load 50 µL of control and treatment media to the designated wells using a
multipette.
5. Mix gently and kept in CO2 incubator.
Day 4 (alamarBlue assay)
1. Set Synergy 2 to read plate to allow for warm up.
2. Dump off the media (control and treatment) in 96 well plates.
3. Rinse all the wells with 100 µL of PBS.
4. Dump off the PBS, and re-wash with another 100 µL of PBS.
5. Add alamarBlue indicator to plain α-MEM medium in 1:10 dilution ( 9 mL of α-MEM +
1mL of alamarBlue for 96 wells) NOTE : Take care not to expose alamarBlue to
sunlight. Add alamarBlue indicator just before wells are loaded, keeping it in
fumehood for a long time greatly reduces activity.
6. Dump off the PBS from the 96 well plates.
7. Load 100 µL of solution (α- MEM + alamarBlue) to all wells and mix gently.
8. Wrap the plate with aluminum foil and placed in CO2 incubator.
9. After 4 hours, fluorescence is detected by Biotek plate reader 540/35 x 600/40 nm,
Sensitivity 54.

89
Section XII. BrdU assay
Day 0 (Plating cells in 10% calf serum)
1. The cells are passed once (as per the Cell passage protocol) before plating
2. Cells are collected from the plates, centrifuged at 1,000 rpm for 2 to 3 min,
resuspended in 10 mL of media and finally counted using a haemocytometer.
3. A 96 well plate is plated at a concentration of 2,000 cells/well, 50 µL media/well.
Day 1 (Cells in serum free environment)
1. Stock Media (α-Minimal Essential Medium, MEM + 0.1% Bovine serum albumin,
BSA + 1% Pencillin-streptomycin ) is thawed in water bath at 37⁰C.
2. Dump off the media from the 96-well plate on to a paper towel placed in fume hood.
3. Load 50 µL of media to all the wells, mix gently and dump it off.
4. Load 50 µL of media to all the wells and mixed.
5. Place the plate in 5% CO2 incubator at 37⁰C.
Day 2 (Treatment of cells)
1. Layout a design for the control and different treatment wells (stock media with 0.1%
BSA-control, 0.1% CS, 0.5% CS, 1.0% CS, 5.0% CS, 10% CS etc. – treatment
wells).
2. Prepare treatment groups with different concentrations of calf serum and stock
media in 15 mL tubes. (Be sure to make double the volume required for each
treatment group).
3. Dump off the media in 96well plate on to a paper towel placed in fume hood.
4. Load 50 µL of control and treatment media to the designated wells using a
multipette.
5. Mix gently and return to the CO2 incubator.
Day 4 (alamarBlue assay)
1. Add 10 µL/well BrdU labeling solutions to the plate and incubate for 2 hrs at 37⁰C.
2. The labeling solution is removed.
3. Add 200 µL/well FixDenat to the cells and incubate for 30 min at room temperature.
4. Remove the FixDenat soution.
5. Add 100 µL/well Anti-BrdU-POD working solution and incubate for 90 min at room
temperature.
6. Excess antibodies are removed by dumping off the solution and rinse the wells three
times with 200 µL/well of washing solution.
7. The washing solution is dumped off.
8. The bottom of the plate is sealed with a black adhesive film.
9. Add 100 µL/well of the substrate solution to each well.
10. The plate is incubated for 5 min at room temperature.
11. The luminescence is read at BioTek plate reader with auto sensitivity

90
Section XIII. Alkaline phosphatase (ALP) assay
Day 1: Plate cells
1. Plate cells at 5,000 cells/well in 96 well plate in α-MEM + 10% CS + 1% PS at 100
µL/well.
2. Incubate for 24 hours at 37⁰C.
Day 2: Change to serum free media
1. Rinse with 100 µL of α-MEM + 0.1% BSA + 1% PS two times.
2. Make a stock media with 10 mL of α-MEM + 0.1% BSA + 1% PS, 100 µL Vit C
(AA2P), and 100 µL β-glycerophosphate.
3. Add 100 µL/well of the above solution and incubate for 24 hours.
Day 3: Add Appropriate Growth Factors
1. Make a stock media of 5 mL of α-MEM + 0.1% BSA + 1% PS, 50 µL Vit C (AA2P),
and 50 µL β-gal (or make 10 mL as needed).
2. Used the above media and to make your treatments.
3. Remove old media from wells without rinsing.
4. Add 100 µL/well for control and treatments and incubate for 72 hours.
Day 6: Permealize the cells and perform ALP assay
1. The procedures for this day can be performed under non-sterile conditions.
2. Dump off the media from the cells.
3. Rinse two times with warm PBS using 100 µL/well.
4. Add 100 µL of 0.1% triton to each well.
5. Shake at medium speed at room temperature for 15 to 20 min.
6. Wrap in a parafilm.
7. Freeze at -80°C for at least 15 min (optional – after shaking the cells can be stored
at -80°C until future use).
8. Obtain two 96 well plates.
9. Thaw the ALP substrate by placing the tube in the water bath and also thaw out the
96-well plate at room temperature.
10. Scrape the cells using the tips on a multipipettor and pipette mix the cell lysates.
Make sure that no bubbles are contained in the pipette tip when the lysate is
transferred to the new 96-well plate: Set multipipettor to 40 µL, hold the button on
the pipettor down then begin scrapping the wells; once well is sufficiently scrapped
release the button and remove the lysate from the well.
11. Transfer 40 µL of the cell lysate (for ALP) into one 96-well plate.
12. For protein analysis add 80 µL Distilled H2O then add 20 µL of the cell lysate (for
protein concentration) into one 96-well plate.

91
ALP activity
1. Prepare two Blank wells with 40 µL of 0.1% Titron/well.
2. Add 200 µL of the ALP Substrate to all of the wells (including blank).
3. Immediately read (0 hour) absorbance at 405 nm, and then incubate at 37°C and
read after 5 hours of incubation.
Protein estimation
BLANK- in the next available column, make two blank wells. First well: 20 µL of
0.1%Triton and 80 µL of Distilled H2O. Second well: 100 µL of Distilled H2O
SAMPLE- 20 µL lysate and 80 µL Distilled H2O. (H2O added first)
DYE- 2 mL Bio-Rad Protein Assay Reagent and 8 mL H2O (1:5 dilution)
STANDARDS-
Stock: 100 µg BSA/ 1 mL dH20 = for example: 30 mg BSA/300mL dH2O
1. Of the 300mL stock take 150 µL and add 150 µL dH2O
{final concentration is 50 µg/mL}
2. Of the resulting solution take 150 µL and add 150 µL dH2O
{final concentration is 25 µg/mL}
3. Of the resulting solution take 150 µL and add 150 µL dH2O
{final concentration is 12.5 µg/mL}
4. Of the resulting solution take 150 µL and add 150 µL dH2O
{final concentration is 6.25 µg/mL}
5. Of the resulting solution take 150 µL and add 150 µL dH2O
{final concentration is 3.125 µg/mL}
1. Into the next available column add 100 µL of each standard/well (7 wells total;
include 100 µg/mL(from stock) and 0 µg/mL(distilled H2O))
2. Add 200 µL of the dye to all wells on the plate.
3. Incubate the plate for 5 min and read the plate absorbance at 595 nm.
92
REFERENCES
Abrahams, A., S. Mowla, M. I. Parker, C. R. Goding, and S. Prince. 2008. UV-mediated regulation of the anti-senescence factor Tbx2. J. Biol. Chem. 283(4): 2223-2230.
Akune, T., S. Ohba, S. Kamekura, M. Yamaguchi, U. I. Chung, N. Kubota et al. 2004. PPARgamma insufficiency enhances osteogenesis through osteoblast formation from bone marrow progenitors. J. Clin. Invest. 113(6): 846-855.
Alford, A. I., S. P. Terkhorn, A. B. Reddy, and K. D. Hankenson. 2010. Thrombospondin-2 regulates matrix mineralization in MC3T3-E1 pre-osteoblasts. Bone. 46(2): 464-471.
Aronow, M. A., L. C. Gerstenfeld, T. A. Owen, M. S. Tassinari, G. S. Stein, and J. B. Lian. 1990. Factors that promote progressive development of the osteoblast phenotype in cultured fetal rat calvaria cells. J. Cell. Physiol. 143(2): 213-221.
Aubin, J. E., F. Liu, L. Malaval, and A. K. Gupta. 1995. Osteoblast and chondroblast differentiation. Bone. 17(2 Suppl): 77S-83S.
Bakker, M. L., B. J. Boukens, M. T. Mommersteeg, J. F. Brons, V. Wakker, A. F. Moorman et al. 2008. Transcription factor Tbx3 is required for the specification of the atrioventricular conduction system. Circ. Res. 102(11): 1340-1349.
Bamshad, M., T. Le, W. S. Watkins, M. E. Dixon, B. E. Kramer, A. D. Roeder et al. 1999. The spectrum of mutations in TBX3: Genotype/Phenotype relationship in ulnar-mammary syndrome. Am. J. Hum. Genet. 64(6): 1550-1562.
Bamshad, M., R. C. Lin, D. J. Law, W. C. Watkins, P. A. Krakowiak, M. E. Moore et al. 1997. Mutations in human TBX3 alter limb, apocrine and genital development in ulnar-mammary syndrome. Nat. Genet. 16(3): 311-315.
Barnard, R., K. M. Haynes, G. A. Werther, and M. J. Waters. 1988. The ontogeny of growth hormone receptors in the rabbit tibia. Endocrinology. 122(6): 2562-2569.
Basson, C. T., D. R. Bachinsky, R. C. Lin, T. Levi, J. A. Elkins, J. Soults et al. 1997. Mutations in human TBX5 [corrected] cause limb and cardiac malformation in holt-oram syndrome. Nat. Genet. 15(1): 30-35.
Basson, C. T., T. Huang, R. C. Lin, D. R. Bachinsky, S. Weremowicz, A. Vaglio et al. 1999. Different TBX5 interactions in heart and limb defined by holt-oram syndrome mutations. Proc. Natl. Acad. Sci. U. S. A. 96(6): 2919-2924.
Behesti, H., J. K. Holt, and J. C. Sowden. 2006. The level of BMP4 signaling is critical for the regulation of distinct T-box gene expression domains and growth along the dorso-ventral axis of the optic cup. BMC Dev. Biol. 6: 62.

93
Bianco, P., M. Riminucci, E. Bonucci, J. D. Termine, and P. G. Robey. 1993. Bone sialoprotein (BSP) secretion and osteoblast differentiation: Relationship to bromodeoxyuridine incorporation, alkaline phosphatase, and matrix deposition. J. Histochem. Cytochem. 41(2): 183-191.
Blair, H. C., S. L. Teitelbaum, R. Ghiselli, and S. Gluck. 1989. Osteoclastic bone resorption by a polarized vacuolar proton pump. Science. 245(4920): 855-857.
Bollag, R. J., Z. Siegfried, J. A. Cebra-Thomas, N. Garvey, E. M. Davison, and L. M. Silver. 1994. An ancient family of embryonically expressed mouse genes sharing a conserved protein motif with the T locus. Nat. Genet. 7(3): 383-389.
Bongers, E. M., P. H. Duijf, S. E. van Beersum, J. Schoots, A. Van Kampen, A. Burckhardt et al. 2004. Mutations in the human TBX4 gene cause small patella syndrome. Am. J. Hum. Genet. 74(6): 1239-1248.
Buckwalter, J. A., M. J. Glimcher, and Cooper R.R. and Rocker, R. 1995. Part I. structure; blood supply, cells, matrix and mineralization. J. Bone Joint Surg. 77-A: 1256-1275.
Bussen, M., M. Petry, K. Schuster-Gossler, M. Leitges, A. Gossler, and A. Kispert. 2004. The T-box transcription factor Tbx18 maintains the separation of anterior and posterior somite compartments. Genes Dev. 18(10): 1209-1221.
Cai, C. L., W. Zhou, L. Yang, L. Bu, Y. Qyang, X. Zhang et al. 2005. T-box genes coordinate regional rates of proliferation and regional specification during cardiogenesis. Development. 132(10): 2475-2487.
Campbell, C., K. Goodrich, G. Casey, and B. Beatty. 1995. Cloning and mapping of a human gene (TBX2) sharing a highly conserved protein motif with the drosophila omb gene. Genomics. 28(2): 255-260.
Campbell, C. E., G. Casey, and K. Goodrich. 1998. Genomic structure of TBX2 indicates conservation with distantly related T-box genes. Mamm. Genome. 9(1): 70-73.
Canalis, E. 1983. The hormonal and local regulation of bone formation. Endocr. Rev. 4(1): 62-77.
Canalis, E., A. N. Economides, and E. Gazzerro. 2003. Bone morphogenetic proteins, their antagonists, and the skeleton. Endocr. Rev. 24(2): 218-235.
Canalis, E., T. McCarthy, and M. Centrella. 1988. Isolation of growth factors from adult bovine bone. Calcif. Tissue Int. 43(6): 346-351.
Canalis, E., S. Varghese, T. L. McCarthy, and M. Centrella. 1992. Role of platelet derived growth factor in bone cell function. Growth Regul. 2(4): 151-155.

94
Candille, S. I., C. D. Van Raamsdonk, C. Chen, S. Kuijper, Y. Chen-Tsai, A. Russ et al. 2004. Dorsoventral patterning of the mouse coat by Tbx15. PLoS Biol. 2(1): E3.
Carreira, S., T. J. Dexter, U. Yavuzer, D. J. Easty, and C. R. Goding. 1998. Brachyury-related transcription factor Tbx2 and repression of the melanocyte-specific TRP-1 promoter. Mol. Cell. Biol. 18(9): 5099-5108.
Carreira, S., B. Liu, and C. R. Goding. 2000. The gene encoding the T-box factor Tbx2 is a target for the microphthalmia-associated transcription factor in melanocytes. J. Biol. Chem. 275(29): 21920-21927.
Celil, A. B., J. O. Hollinger, and P. G. Campbell. 2005. Osx transcriptional regulation is mediated by additional pathways to BMP2/Smad signaling. J. Cell. Biochem. 95(3): 518-528.
Centrella, M., T. L. McCarthy, and E. Canalis. 1991. Transforming growth factor-beta and remodeling of bone. J. Bone Joint Surg. Am. 73(9): 1418-1428.
Chapman, D. L., N. Garvey, S. Hancock, M. Alexiou, S. I. Agulnik, J. J. Gibson-Brown et al. 1996a. Expression of the T-box family genes, Tbx1-Tbx5, during early mouse development. Dev. Dyn. 206(4): 379-390.
Chen, G., T. G. Gharib, C. C. Huang, J. M. Taylor, D. E. Misek, S. L. Kardia et al. 2002. Discordant protein and mRNA expression in lung adenocarcinomas. Mol. Cell. Proteomics. 1(4): 304-313.
Chen, J., Q. Zhong, J. Wang, R. S. Cameron, J. L. Borke, C. M. Isales et al. 2001. Microarray analysis of Tbx2-directed gene expression: A possible role in osteogenesis. Mol. Cell. Endocrinol. 177(1-2): 43-54.
Chen, J. R., B. Chatterjee, R. Meyer, J. C. Yu, J. L. Borke, C. M. Isales et al. 2004. Tbx2 represses expression of Connexin43 in osteoblastic-like cells. Calcif. Tissue Int. 74(6): 561-573.
Christoffels, V. M., W. M. Hoogaars, A. Tessari, D. E. Clout, A. F. Moorman, and M. Campione. 2004. T-box transcription factor Tbx2 represses differentiation and formation of the cardiac chambers. Dev. Dyn. 229(4): 763-770.
Conlon, F. L., L. Fairclough, B. M. Price, E. S. Casey, and J. C. Smith. 2001. Determinants of T box protein specificity. Development. 128(19): 3749-3758.
Cosman, F., and R. Lindsay. 1998. Is parathyroid hormone a therapeutic option for osteoporosis? A review of the clinical evidence. Calcif. Tissue Int. 62(6): 475-480.
Daluiski, A., T. Engstrand, M. E. Bahamonde, L. W. Gamer, E. Agius, S. L. Stevenson et al. 2001. Bone morphogenetic protein-3 is a negative regulator of bone density. Nat. Genet. 27(1): 84-88.

95
Davenport, T. G., L. A. Jerome-Majewska, and V. E. Papaioannou. 2003a. Mammary gland, limb and yolk sac defects in mice lacking Tbx3, the gene mutated in human ulnar mammary syndrome. Development. 130(10): 2263-2273.
Davenport, T. G., L. A. Jerome-Majewska, and V. E. Papaioannou. 2003b. Mammary gland, limb and yolk sac defects in mice lacking Tbx3, the gene mutated in human ulnar mammary syndrome. Development. 130(10): 2263-2273.
Davis, E., H. Teng, B. Bilican, M. I. Parker, B. Liu, S. Carriera et al. 2008. Ectopic Tbx2 expression results in polyploidy and cisplatin resistance. Oncogene. 27(7): 976-984.
Dobrovolskaia-Zavadskaia, N. 1927. Sur la mortification spontanee de la queue chez la souris nouveau-nee et sur l' existence d' un caractere heriditaire 'non-viable'. Crit. Rev. Soc. Biol. 97: 114-116.
Dobrzycka, K. M., K. Kang, S. Jiang, R. Meyer, P. H. Rao, A. V. Lee et al. 2006. Disruption of scaffold attachment factor B1 leads to TBX2 up-regulation, lack of p19ARF induction, lack of senescence, and cell immortalization. Cancer Res. 66(16): 7859-7863.
Drake, F. H., R. A. Dodds, I. E. James, J. R. Connor, C. Debouck, S. Richardson et al. 1996. Cathepsin K, but not cathepsins B, L, or S, is abundantly expressed in human osteoclasts. J. Biol. Chem. 271(21): 12511-12516.
Ducy, P., R. Zhang, V. Geoffroy, A. L. Ridall, and G. Karsenty. 1997. Osf2/Cbfa1: A transcriptional activator of osteoblast differentiation. Cell. 89(5): 747-754.
Eferl, R., A. Hoebertz, A. F. Schilling, M. Rath, F. Karreth, L. Kenner et al. 2004. The fos-related antigen fra-1 is an activator of bone matrix formation. EMBO J. 23(14): 2789-2799.
Elefteriou, F., J. D. Ahn, S. Takeda, M. Starbuck, X. Yang, X. Liu et al. 2005. Leptin regulation of bone resorption by the sympathetic nervous system and CART. Nature. 434(7032): 514-520.
Eriksen, E. F. 1986. Normal and pathological remodeling of human trabecular bone: Three dimensional reconstruction of the remodeling sequence in normals and in metabolic bone disease. Endocr. Rev. 7(4): 379-408.
Fan, W., X. Huang, C. Chen, J. Gray, and T. Huang. 2004. TBX3 and its isoform TBX3+2a are functionally distinctive in inhibition of senescence and are overexpressed in a subset of breast cancer cell lines. Cancer Res. 64(15): 5132-5139.
Galante, J., W. Rostoker, and R. D. Ray. 1970. Physical properties of trabecular bone. Calcif. Tissue Res. 5(3): 236-246.

96
Gazzerro, E., A. Smerdel-Ramoya, S. Zanotti, L. Stadmeyer, D. Durant, A. N. Economides et al. 2007. Conditional deletion of gremlin causes a transient increase in bone formation and bone mass. J. Biol. Chem. 282(43): 31549-31557.
Gibson-Brown, J. J., S. I. Agulnik, D. L. Chapman, M. Alexiou, N. Garvey, L. M. Silver et al. 1996b. Evidence of a role for T-box genes in the evolution of limb morphogenesis and the specification of forelimb/hindlimb identity. Mech. Dev. 56(1-2): 93-101.
Gibson-Brown, J. J., S. I. Agulnik, L. M. Silver, L. Niswander, and V. E. Papaioannou. 1998. Involvement of T-box genes Tbx2-Tbx5 in vertebrate limb specification and development. Development. 125(13): 2499-2509.
Giustina, A., G. Mazziotti, and E. Canalis. 2008. Growth hormone, insulin-like growth factors, and the skeleton. Endocr. Rev. 29(5): 535-559.
Giustina, A., and J. D. Veldhuis. 1998. Pathophysiology of the neuroregulation of growth hormone secretion in experimental animals and the human. Endocr. Rev. 19(6): 717-797.
Glass, D. A.,2nd, P. Bialek, J. D. Ahn, M. Starbuck, M. S. Patel, H. Clevers et al. 2005. Canonical wnt signaling in differentiated osteoblasts controls osteoclast differentiation. Dev. Cell. 8(5): 751-764.
Gothlin, G., and J. L. Ericsson. 1976. The osteoclast: Review of ultrastructure, origin, and structure-function relationship. Clin. Orthop. Relat. Res. (120)(120): 201-231.
Govoni, K. E., S. K. Lee, R. B. Chadwick, H. Yu, Y. Kasukawa, D. J. Baylink et al. 2006. Whole genome microarray analysis of growth hormone-induced gene expression in bone: T-box3, a novel transcription factor, regulates osteoblast proliferation. Am. J. Physiol. Endocrinol. Metab. 291(1): E128-36.
Govoni, K. E., G. R. Linares, S. T. Chen, S. Pourteymoor, and S. Mohan. 2009. T-box 3 negatively regulates osteoblast differentiation by inhibiting expression of osterix and runx2. J. Cell. Biochem. 106(3): 482-490.
Grigoriadis, A. E., K. Schellander, Z. Q. Wang, and E. F. Wagner. 1993. Osteoblasts are target cells for transformation in c-fos transgenic mice. J. Cell Biol. 122(3): 685-701.
Guenou, H., K. Kaabeche, S. L. Mee, and P. J. Marie. 2005. A role for fibroblast growth factor receptor-2 in the altered osteoblast phenotype induced by twist haploinsufficiency in the saethre-chotzen syndrome. Hum. Mol. Genet. 14(11): 1429-1439.
Gutierrez, S., A. Javed, D. K. Tennant, M. van Rees, M. Montecino, G. S. Stein et al. 2002. CCAAT/enhancer-binding proteins (C/EBP) beta and delta activate osteocalcin gene transcription and synergize with Runx2 at the C/EBP element to regulate bone-specific expression. J. Biol. Chem. 277(2): 1316-1323.

97
Gygi, S. P., Y. Rochon, B. R. Franza, and R. Aebersold. 1999. Correlation between protein and mRNA abundance in yeast. Mol. Cell. Biol. 19(3): 1720-1730.
Habets, P. E., A. F. Moorman, D. E. Clout, M. A. van Roon, M. Lingbeek, M. van Lohuizen et al. 2002. Cooperative action of Tbx2 and Nkx2.5 inhibits ANF expression in the atrioventricular canal: Implications for cardiac chamber formation. Genes Dev. 16(10): 1234-1246.
Harding, H. P., Y. Zhang, H. Zeng, I. Novoa, P. D. Lu, M. Calfon et al. 2003. An integrated stress response regulates amino acid metabolism and resistance to oxidative stress. Mol. Cell. 11(3): 619-633.
Harrelson, Z., R. G. Kelly, S. N. Goldin, J. J. Gibson-Brown, R. J. Bollag, L. M. Silver et al. 2004. Tbx2 is essential for patterning the atrioventricular canal and for morphogenesis of the outflow tract during heart development. Development. 131(20): 5041-5052.
Hassan, M. Q., A. Javed, M. I. Morasso, J. Karlin, M. Montecino, A. J. van Wijnen et al. 2004. Dlx3 transcriptional regulation of osteoblast differentiation: Temporal recruitment of Msx2, Dlx3, and Dlx5 homeodomain proteins to chromatin of the osteocalcin gene. Mol. Cell. Biol. 24(20): 9248-9261.
Helder, M. N., A. L. Bronckers, and J. H. Woltgens. 1993. Dissimilar expression patterns for the extracellular matrix proteins osteopontin (OPN) and collagen type I in dental tissues and alveolar bone of the neonatal rat. Matrix. 13(5): 415-425.
Herrmann, B. G., S. Labeit, A. Poustka, T. R. King, and H. Lehrach. 1990. Cloning of the T gene required in mesoderm formation in the mouse. Nature. 343(6259): 617-622.
Hill, P. A., D. J. Buttle, S. J. Jones, A. Boyde, M. Murata, J. J. Reynolds et al. 1994. Inhibition of bone resorption by selective inactivators of cysteine proteinases. J. Cell. Biochem. 56(1): 118-130.
Hill, P. A., A. Tumber, and M. C. Meikle. 1997. Multiple extracellular signals promote osteoblast survival and apoptosis. Endocrinology. 138(9): 3849-3858.
Holleville, N., S. Mateos, M. Bontoux, K. Bollerot, and A. H. Monsoro-Burq. 2007. Dlx5 drives Runx2 expression and osteogenic differentiation in developing cranial suture mesenchyme. Dev. Biol. 304(2): 860-874.
Holmen, S. L., C. R. Zylstra, A. Mukherjee, R. E. Sigler, M. C. Faugere, M. L. Bouxsein et al. 2005. Essential role of beta-catenin in postnatal bone acquisition. J. Biol. Chem. 280(22): 21162-21168.
Hoogaars, W. M., A. Tessari, A. F. Moorman, P. A. de Boer, J. Hagoort, A. T. Soufan et al. 2004. The transcriptional repressor Tbx3 delineates the developing central conduction system of the heart. Cardiovasc. Res. 62(3): 489-499.

98
Isaac, A., C. Rodriguez-Esteban, A. Ryan, M. Altabef, T. Tsukui, K. Patel et al. 1998. Tbx genes and limb identity in chick embryo development. Development. 125(10): 1867-1875.
Ito, A., M. Asamoto, N. Hokaiwado, S. Takahashi, and T. Shirai. 2005. Tbx3 expression is related to apoptosis and cell proliferation in rat bladder both hyperplastic epithelial cells and carcinoma cells. Cancer Lett. 219(1): 105-112.
Jeon, M. J., J. A. Kim, S. H. Kwon, S. W. Kim, K. S. Park, S. W. Park et al. 2003. Activation of peroxisome proliferator-activated receptor-gamma inhibits the Runx2-mediated transcription of osteocalcin in osteoblasts. J. Biol. Chem. 278(26): 23270-23277.
Jerome, L. A., and V. E. Papaioannou. 2001. DiGeorge syndrome phenotype in mice mutant for the T-box gene, Tbx1. Nat. Genet. 27(3): 286-291.
Jerome-Majewska, L. A., G. P. Jenkins, E. Ernstoff, F. Zindy, C. J. Sherr, and V. E. Papaioannou. 2005. Tbx3, the ulnar-mammary syndrome gene, and Tbx2 interact in mammary gland development through a p19Arf/p53-independent pathway. Dev. Dyn. 234(4): 922-933.
Jones, J. I., and D. R. Clemmons. 1995. Insulin-like growth factors and their binding proteins: Biological actions. Endocr. Rev. 16(1): 3-34.
Kameda, T., H. Mano, T. Yuasa, Y. Mori, K. Miyazawa, M. Shiokawa et al. 1997. Estrogen inhibits bone resorption by directly inducing apoptosis of the bone-resorbing osteoclasts. J. Exp. Med. 186(4): 489-495.
Karsenty, G. 2008. Transcriptional control of skeletogenesis. Annu. Rev. Genomics Hum. Genet. 9: 183-196.
Karsenty, G., H. M. Kronenberg, and C. Settembre. 2009. Genetic control of bone formation. Annu. Rev. Cell Dev. Biol. 25: 629-648.
Kassem, M., W. Blum, J. Ristelli, L. Mosekilde, and E. F. Eriksen. 1993. Growth hormone stimulates proliferation and differentiation of normal human osteoblast-like cells in vitro. Calcif. Tissue Int. 52(3): 222-226.
Kawano, H., T. Sato, T. Yamada, T. Matsumoto, K. Sekine, T. Watanabe et al. 2003. Suppressive function of androgen receptor in bone resorption. Proc. Natl. Acad. Sci. U. S. A. 100(16): 9416-9421.
Kenner, L., A. Hoebertz, T. Beil, N. Keon, F. Karreth, R. Eferl et al. 2004. Mice lacking JunB are osteopenic due to cell-autonomous osteoblast and osteoclast defects. J. Cell Biol. 164(4): 613-623.
Kispert, A., and B. G. Hermann. 1993. The brachyury gene encodes a novel DNA binding protein. EMBO J. 12(12): 4898-4899.

99
Kispert, A., B. Koschorz, and B. G. Herrmann. 1995. The T protein encoded by brachyury is a tissue-specific transcription factor. EMBO J. 14(19): 4763-4772.
Komori, T., H. Yagi, S. Nomura, A. Yamaguchi, K. Sasaki, K. Deguchi et al. 1997. Targeted disruption of Cbfa1 results in a complete lack of bone formation owing to maturational arrest of osteoblasts. Cell. 89(5): 755-764.
Lakkakorpi, P. T., M. A. Horton, M. H. Helfrich, E. K. Karhukorpi, and H. K. Vaananen. 1991. Vitronectin receptor has a role in bone resorption but does not mediate tight sealing zone attachment of osteoclasts to the bone surface. J. Cell Biol. 115(4): 1179-1186.
Law, D. J., T. Gebuhr, N. Garvey, S. I. Agulnik, and L. M. Silver. 1995. Identification, characterization, and localization to chromosome 17q21-22 of the human TBX2 homolog, member of a conserved developmental gene family. Mamm. Genome. 6(11): 793-797.
Le Roith, D., C. Bondy, S. Yakar, J. L. Liu, and A. Butler. 2001. The somatomedin hypothesis: 2001. Endocr. Rev. 22(1): 53-74.
Lecanda, F., P. M. Warlow, S. Sheikh, F. Furlan, T. H. Steinberg, and R. Civitelli. 2000. Connexin43 deficiency causes delayed ossification, craniofacial abnormalities, and osteoblast dysfunction. J. Cell Biol. 151(4): 931-944.
Lengner, C. J., H. Drissi, J. Y. Choi, A. J. van Wijnen, J. L. Stein, G. S. Stein et al. 2002. Activation of the bone-related Runx2/Cbfa1 promoter in mesenchymal condensations and developing chondrocytes of the axial skeleton. Mech. Dev. 114(1-2): 167-170.
Levy, C., M. Khaled, and D. E. Fisher. 2006. MITF: Master regulator of melanocyte development and melanoma oncogene. Trends Mol. Med. 12(9): 406-414.
Li, H., P. M. Bartold, C. Z. Zhang, R. W. Clarkson, W. G. Young, and M. J. Waters. 1998. Growth hormone and insulin-like growth factor I induce bone morphogenetic proteins 2 and 4: A mediator role in bone and tooth formation? Endocrinology. 139(9): 3855-3862.
Li, Q. Y., R. A. Newbury-Ecob, J. A. Terrett, D. I. Wilson, A. R. Curtis, C. H. Yi et al. 1997. Holt-oram syndrome is caused by mutations in TBX5, a member of the brachyury (T) gene family. Nat. Genet. 15(1): 21-29.
Lindsay, E. A., F. Vitelli, H. Su, M. Morishima, T. Huynh, T. Pramparo et al. 2001. Tbx1 haploinsufficieny in the DiGeorge syndrome region causes aortic arch defects in mice. Nature. 410(6824): 97-101.
Lindsay, R., J. Nieves, C. Formica, E. Henneman, L. Woelfert, V. Shen et al. 1997. Randomised controlled study of effect of parathyroid hormone on vertebral-bone

100
mass and fracture incidence among postmenopausal women on oestrogen with osteoporosis. Lancet. 350(9077): 550-555.
Lingbeek, M. E., J. J. Jacobs, and M. van Lohuizen. 2002. The T-box repressors TBX2 and TBX3 specifically regulate the tumor suppressor gene p14ARF via a variant T-site in the initiator. J. Biol. Chem. 277(29): 26120-26127.
Liu, W., S. Toyosawa, T. Furuichi, N. Kanatani, C. Yoshida, Y. Liu et al. 2001. Overexpression of Cbfa1 in osteoblasts inhibits osteoblast maturation and causes osteopenia with multiple fractures. J. Cell Biol. 155(1): 157-166.
Lynch, M. P., C. Capparelli, J. L. Stein, G. S. Stein, and J. B. Lian. 1998. Apoptosis during bone-like tissue development in vitro. J. Cell. Biochem. 68(1): 31-49.
Mahlamaki, E. H., M. Barlund, M. Tanner, L. Gorunova, M. Hoglund, R. Karhu et al. 2002. Frequent amplification of 8q24, 11q, 17q, and 20q-specific genes in pancreatic cancer. Genes Chromosomes Cancer. 35(4): 353-358.
Manning, L., K. Ohyama, B. Saeger, O. Hatano, S. A. Wilson, M. Logan et al. 2006. Regional morphogenesis in the hypothalamus: A BMP-Tbx2 pathway coordinates fate and proliferation through shh downregulation. Dev. Cell. 11(6): 873-885.
Manolagas, S. C. 2000. Birth and death of bone cells: Basic regulatory mechanisms and implications for the pathogenesis and treatment of osteoporosis. Endocr. Rev. 21(2): 115-137.
Mark, M. P., C. W. Prince, S. Gay, R. L. Austin, and W. T. Butler. 1988. 44-kDal bone phosphoprotein (osteopontin) antigenicity at ectopic sites in newborn rats: Kidney and nervous tissues. Cell Tissue Res. 251(1): 23-30.
Martin, T. J., and N. A. Sims. 2005. Osteoclast-derived activity in the coupling of bone formation to resorption. Trends Mol. Med. 11(2): 76-81.
Meikle, M. C., S. Bord, R. M. Hembry, J. Compston, P. I. Croucher, and J. J. Reynolds. 1992. Human osteoblasts in culture synthesize collagenase and other matrix metalloproteinases in response to osteotropic hormones and cytokines. J. Cell. Sci. 103 ( Pt 4)(Pt 4): 1093-1099.
Miyazono, K. 1999. Signal transduction by bone morphogenetic protein receptors: Functional roles of smad proteins. Bone. 25(1): 91-93.
Mundy, G. R., S. B. Rodan, R. J. Majeska, S. DeMartino, C. Trimmier, T. J. Martin et al. 1982. Unidirectional migration of osteosarcoma cells with osteoblast characteristics in response to products of bone resorption. Calcif. Tissue Int. 34(6): 542-546.
Nakamura, A., C. Ly, M. Cipetic, N. A. Sims, J. Vieusseux, V. Kartsogiannis et al. 2007. Osteoclast inhibitory lectin (OCIL) inhibits osteoblast differentiation and function in vitro. Bone. 40(2): 305-315.

101
Nakamura, H., Y. Moriyama, M. Futai, and H. Ozawa. 1994. Immunohistochemical localization of vacuolar H(+)-ATPase in osteoclasts of rat tibiae. Arch. Histol. Cytol. 57(5): 535-539.
Nakashima, K., X. Zhou, G. Kunkel, Z. Zhang, J. M. Deng, R. R. Behringer et al. 2002. The novel zinc finger-containing transcription factor osterix is required for osteoblast differentiation and bone formation. Cell. 108(1): 17-29.
National Osteoporosis Foundation. 2010. Http://www.nof.org/home.
Nefussi, J. R., J. M. Sautier, V. Nicolas, and N. Forest. 1991. How osteoblasts become osteocytes: A decreasing matrix forming process. J. Biol. Buccale. 19(1): 75-82.
Nesbitt, S. A., and M. A. Horton. 1997. Trafficking of matrix collagens through bone-resorbing osteoclasts. Science. 276(5310): 266-269.
Nissim, S., P. Allard, A. Bandyopadhyay, B. D. Harfe, and C. J. Tabin. 2007. Characterization of a novel ectodermal signaling center regulating Tbx2 and shh in the vertebrate limb. Dev. Biol. 304(1): 9-21.
Orwoll, E. S. 2003. Toward an expanded understanding of the role of the periosteum in skeletal health. J. Bone Miner. Res. 18(6): 949-954.
Papaioannou, V. E. 2001. T-box genes in development: From hydra to humans. Int. Rev. Cytol. 207: 1-70.
Papaioannou, V. E., and L. M. Silver. 1998. The T-box gene family. Bioessays. 20(1): 9-19.
Parfitt, A. M. 2002. Targeted and nontargeted bone remodeling: Relationship to basic multicellular unit origination and progression. Bone. 30(1): 5-7.
Paxton, C., H. Zhao, Y. Chin, K. Langner, and J. Reecy. 2002. Murine Tbx2 contains domains that activate and repress gene transcription. Gene. 283(1-2): 117-124.
Peres, J., E. Davis, S. Mowla, D. C. Bennett, J. A. Li, and Wansleben, S. and Prince S. 2010. The highly homologous T-box transcription factors, TBX2 and TBX3, have distinct roles in the oncogenic process. Genes and Cancer. 1The(3): 272-282.
Pfeilschifter, J., and G. R. Mundy. 1987. Modulation of type beta transforming growth factor activity in bone cultures by osteotropic hormones. Proc. Natl. Acad. Sci. U. S. A. 84(7): 2024-2028.
Plageman, T. F.,Jr, and K. E. Yutzey. 2005. T-box genes and heart development: Putting the "T" in heart. Dev. Dyn. 232(1): 11-20.
Potts, J. T.,Jr, T. J. Gardella, H. Juppner, and H. M. Kronenberg. 1997. Structure based design of parathyroid hormone analogs. J. Endocrinol. 154 Suppl: S15-21.

102
Raisz, L. G., and K. M. Prestwood. 2000. Epidemiology and pathogenesis of osteoporosis. Clin. Cornerstone. 2(6): 1-10.
Raisz, L. G., and G. A. Rodan. 2003. Pathogenesis of osteoporosis. Endocrinol. Metab. Clin. North Am. 32(1): 15-24.
Ralston, S. H. 1997. Osteoporosis. BMJ. 315(7106): 469-472.
Redmond, K. L., N. T. Crawford, H. Farmer, Z. C. D'Costa, G. J. O'Brien, N. E. Buckley et al. 2010. T-box 2 represses NDRG1 through an EGR1-dependent mechanism to drive the proliferation of breast cancer cells. Oncogene. 29(22): 3252-3262.
Renard, C. A., C. Labalette, C. Armengol, D. Cougot, Y. Wei, S. Cairo et al. 2007. Tbx3 is a downstream target of the Wnt/beta-catenin pathway and a critical mediator of beta-catenin survival functions in liver cancer. Cancer Res. 67(3): 901-910.
Rodriguez, M., E. Aladowicz, L. Lanfrancone, and C. R. Goding. 2008. Tbx3 represses E-cadherin expression and enhances melanoma invasiveness. Cancer Res. 68(19): 7872-7881.
Romero-Prado, M., C. Blazquez, C. Rodriguez-Navas, J. Munoz, I. Guerrero, E. Delgado-Baeza et al. 2006. Functional characterization of human mesenchymal stem cells that maintain osteochondral fates. J. Cell. Biochem. 98(6): 1457-1470.
Roodman, G. D. 1996. Advances in bone biology: The osteoclast. Endocr. Rev. 17(4): 308-332.
Rowley, M., E. Grothey, and F. J. Couch. 2004. The role of Tbx2 and Tbx3 in mammary development and tumorigenesis. J. Mammary Gland Biol. Neoplasia. 9(2): 109-118.
Ryan, A. K., J. A. Goodship, D. I. Wilson, N. Philip, A. Levy, H. Seidel et al. 1997. Spectrum of clinical features associated with interstitial chromosome 22q11 deletions: A european collaborative study. J. Med. Genet. 34(10): 798-804.
Rydziel, S., C. Ladd, T. L. McCarthy, M. Centrella, and E. Canalis. 1992. Determination and expression of platelet-derived growth factor-AA in bone cell cultures. Endocrinology. 130(4): 1916-1922.
Sato, T., H. Kawano, and S. Kato. 2002. Study of androgen action in bone by analysis of androgen-receptor deficient mice. J. Bone Miner. Metab. 20(6): 326-330.
Schmid, C., I. Schlapfer, E. Futo, M. Waldvogel, J. Schwander, J. Zapf et al. 1992. Triiodothyronine (T3) stimulates insulin-like growth factor (IGF)-1 and IGF binding protein (IGFBP)-2 production by rat osteoblasts in vitro. Acta Endocrinol. (Copenh). 126(5): 467-473.

103
Shirakabe, K., K. Terasawa, K. Miyama, H. Shibuya, and E. Nishida. 2001. Regulation of the activity of the transcription factor Runx2 by two homeobox proteins, Msx2 and Dlx5. Genes Cells. 6(10): 851-856.
Singh, M. K., M. Petry, B. Haenig, B. Lescher, M. Leitges, and A. Kispert. 2005. The T-box transcription factor Tbx15 is required for skeletal development. Mech. Dev. 122(2): 131-144.
Sinha, S., S. Abraham, R. M. Gronostajski, and C. E. Campbell. 2000. Differential DNA binding and transcription modulation by three T-box proteins, T, TBX1 and TBX2. Gene. 258(1-2): 15-29.
Smith, J. 1999. T-box genes: What they do and how they do it. Trends Genet. 15(4): 154-158.
Srivastava, S., G. Toraldo, M. N. Weitzmann, S. Cenci, F. P. Ross, and R. Pacifici. 2001. Estrogen decreases osteoclast formation by down-regulating receptor activator of NF-kappa B ligand (RANKL)-induced JNK activation. J. Biol. Chem. 276(12): 8836-8840.
Sutherland, M. K., J. C. Geoghegan, C. Yu, E. Turcott, J. E. Skonier, D. G. Winkler et al. 2004. Sclerostin promotes the apoptosis of human osteoblastic cells: A novel regulation of bone formation. Bone. 35(4): 828-835.
Suzuki, T., J. Takeuchi, K. Koshiba-Takeuchi, and T. Ogura. 2004. Tbx genes specify posterior digit identity through shh and BMP signaling. Dev. Cell. 6(1): 43-53.
Swarthout, J. T., R. C. D'Alonzo, N. Selvamurugan, and N. C. Partridge. 2002. Parathyroid hormone-dependent signaling pathways regulating genes in bone cells. Gene. 282(1-2): 1-17.
Syed, F., and S. Khosla. 2005. Mechanisms of sex steroid effects on bone. Biochem. Biophys. Res. Commun. 328(3): 688-696.
Teitelbaum, S. L. 2000. Bone resorption by osteoclasts. Science. 289(5484): 1504-1508.
Vaananen, H. K., and M. Horton. 1995. The osteoclast clear zone is a specialized cell-extracellular matrix adhesion structure. J. Cell. Sci. 108 ( Pt 8)(Pt 8): 2729-2732.
Vance, K. W., S. Carreira, G. Brosch, and C. R. Goding. 2005. Tbx2 is overexpressed and plays an important role in maintaining proliferation and suppression of senescence in melanomas. Cancer Res. 65(6): 2260-2268.
Wagner, E. F. 2002. Functions of AP1 (Fos/Jun) in bone development. Ann. Rheum. Dis. 61 Suppl 2: ii40-2.

104
Wakeyama, H., T. Akiyama, K. Takahashi, H. Amano, Y. Kadono, M. Nakamura et al. 2007. Negative feedback loop in the bim-caspase-3 axis regulating apoptosis and activity of osteoclasts. J. Bone Miner. Res. 22(10): 1631-1639.
Westendorf, J. J., R. A. Kahler, and T. M. Schroeder. 2004. Wnt signaling in osteoblasts and bone diseases. Gene. 341: 19-39.
Wilson, V., and F. L. Conlon. 2002. The T-box family. Genome Biol. 3(6): REVIEWS3008.
Xiao, G., D. Jiang, C. Ge, Z. Zhao, Y. Lai, H. Boules et al. 2005. Cooperative interactions between activating transcription factor 4 and Runx2/Cbfa1 stimulate osteoblast-specific osteocalcin gene expression. J. Biol. Chem. 280(35): 30689-30696.
Zaidi, M. 1990. "Calcium receptors" on eukaryotic cells with special reference to the osteoclast. Biosci. Rep. 10(6): 493-507.
Zhang, H., and A. Bradley. 1996. Mice deficient for BMP2 are nonviable and have defects in amnion/chorion and cardiac development. Development. 122(10): 2977-2986.
Zhao, C., N. Irie, Y. Takada, K. Shimoda, T. Miyamoto, T. Nishiwaki et al. 2006. Bidirectional ephrinB2-EphB4 signaling controls bone homeostasis. Cell. Metab. 4(2): 111-121.
Zimmerman, L. B., J. M. De Jesus-Escobar, and R. M. Harland. 1996. The spemann organizer signal noggin binds and inactivates bone morphogenetic protein 4. Cell. 86(4): 599-606.

105