the relationship between manager tenure and corporate bond
TRANSCRIPT
University at Albany, State University of New York University at Albany, State University of New York
Scholars Archive Scholars Archive
Financial Analyst Honors College
Spring 5-2019
The Relationship Between Manager Tenure and Corporate Bond The Relationship Between Manager Tenure and Corporate Bond
Mutual Fund Performance Mutual Fund Performance
Matthew Mottes University at Albany, State University of New York, [email protected]
Follow this and additional works at: https://scholarsarchive.library.albany.edu/honorscollege_finance
Part of the Finance and Financial Management Commons
Recommended Citation Recommended Citation Mottes, Matthew, "The Relationship Between Manager Tenure and Corporate Bond Mutual Fund Performance" (2019). Financial Analyst. 13. https://scholarsarchive.library.albany.edu/honorscollege_finance/13
This Honors Thesis is brought to you for free and open access by the Honors College at Scholars Archive. It has been accepted for inclusion in Financial Analyst by an authorized administrator of Scholars Archive. For more information, please contact [email protected].

The Relationship Between Manager Tenure and Corporate Bond Mutual Fund
Performance
An honors thesis presented to the
Department of Finance,
University at Albany, State University of New York
in partial fulfillment of requirements
for Graduation with honors in Financial Analysis
and
Graduation from The Honors College
Matthew Mottes
Research Advisor: Ying Wang, Ph.D.
December 2018

ii
Abstract
This paper analyzes the relationship between manager tenure and performance in corporate bond
mutual funds, using a sample from Morningstar of 665 funds from 2002-2017. Based on a
univariate portfolio analysis and panel regressions, the results show a significant positive
relationship between average manager tenure and corporate bond performance generally,
regardless of whether performance is measured by raw monthly returns or Fama and French’s
(1993) five-factor alpha. However, in the crisis periods, this paper documents a significant
negative relationship between average manager tenure and fund performance.
Keywords: Manager tenure, corporate bond funds, experience, fund performance

iii
Acknowledgements
Many people have helped me throughout the process of writing my thesis. I would first like to
thank my faculty advisor Professor Wang. She helped keep the whole process of writing and
completing this thesis extremely smooth. I would also like to thank all of the other professors in
the University’s finance department and elsewhere for giving me the skills necessary to complete
this project. Lastly I would like to thank my parents for giving me the work ethic and dedication
needed to finish a thesis like this.

iv
List of Figures
Figure 1 ........................................................................................................................................... 1
Figure 2 ......................................................................................................................................... 12

v
List of Tables
Table 1 ...........................................................................................................................................10
Table 2 ...........................................................................................................................................17
Table 3 ...........................................................................................................................................17
Table 4 ...........................................................................................................................................17
Table 5 ...........................................................................................................................................18
Table 6 ...........................................................................................................................................20
Table 7 ...........................................................................................................................................21
Table 8 ...........................................................................................................................................21
Table 9 ...........................................................................................................................................23
vi
Table of Contents
Abstract ........................................................................................................................................... ii
Acknowledgements ........................................................................................................................ iii
List of Figures ................................................................................................................................ iv
List of Tables .................................................................................................................................. v
1. Introduction ................................................................................................................................. 1
2. Literature Review........................................................................................................................ 4
2.1 Active versus Passive Management ...................................................................................... 4
2.2 Relationship Between Tenure and Performance ................................................................... 5
3. Hypothesis................................................................................................................................... 8
4. Data ............................................................................................................................................. 9
4.1 Corporate Bond Sample ........................................................................................................ 9
4.2 Summary Statistics.............................................................................................................. 10
5. Methodology ............................................................................................................................. 12
5.1 Variable Definitions ............................................................................................................ 12
5.2 Portfolio Analysis ............................................................................................................... 13
5.3 Panel Regressions ............................................................................................................... 15
6. Empirical Results ...................................................................................................................... 16
6.1 Univariate Analysis ............................................................................................................. 16
6.1.1 Full-Time Period 2002-2017............................................................................................ 16
6.1.2 Crisis Time Period July 2007 – February 2009 ............................................................... 19
6.1.3 Pre-Crisis January and Post-Crisis Periods ...................................................................... 19
6.2 Panel Regressions ............................................................................................................... 20
6.2.1 Full-Time Period 2002-2017............................................................................................ 21
6.2.2 Crisis Time Period July 2007 – February 2009 ............................................................... 22
6.2.3 Pre-Crisis January and Post-Crisis Periods ...................................................................... 23
7. Conclusion ................................................................................................................................ 25
References ..................................................................................................................................... 27
1
1. Introduction
While there is a large amount of literature on the performance of mutual funds, the
amount of literature based solely on corporate bond mutual funds is limited. With the current
market environment and demographics of the population, this may be a mistake. According to
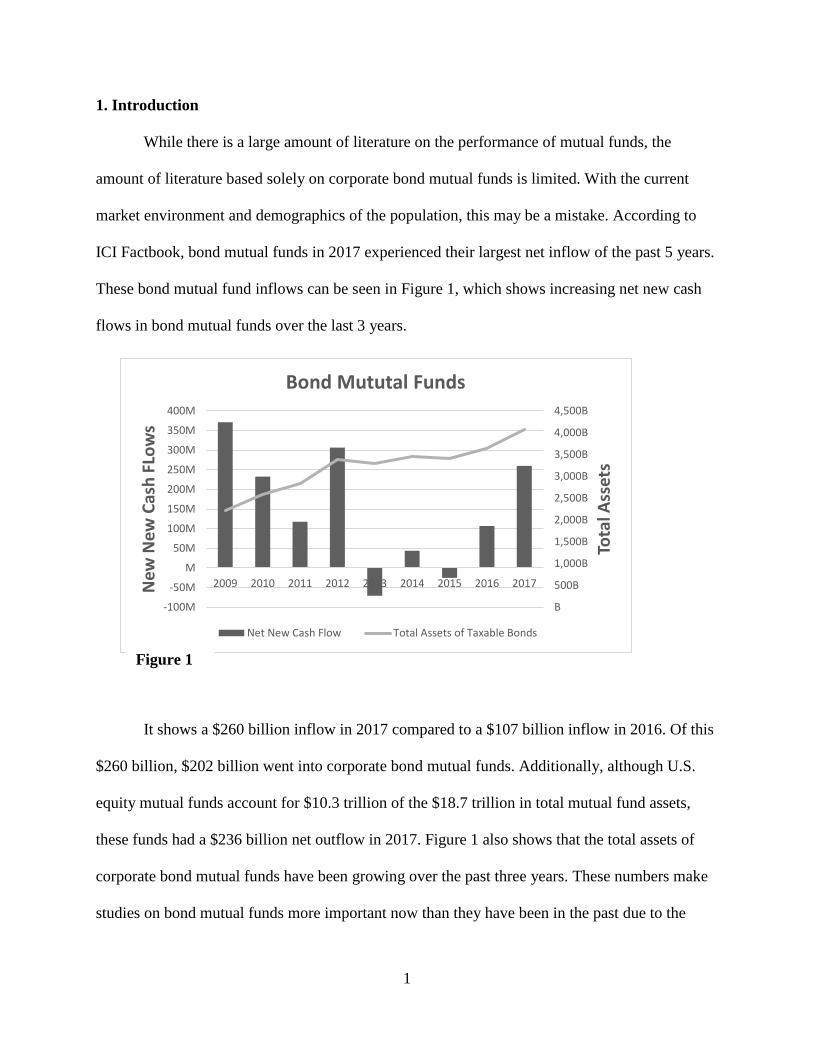
ICI Factbook, bond mutual funds in 2017 experienced their largest net inflow of the past 5 years.
These bond mutual fund inflows can be seen in Figure 1, which shows increasing net new cash
flows in bond mutual funds over the last 3 years.
It shows a $260 billion inflow in 2017 compared to a $107 billion inflow in 2016. Of this
$260 billion, $202 billion went into corporate bond mutual funds. Additionally, although U.S.
equity mutual funds account for $10.3 trillion of the $18.7 trillion in total mutual fund assets,
these funds had a $236 billion net outflow in 2017. Figure 1 also shows that the total assets of
corporate bond mutual funds have been growing over the past three years. These numbers make
studies on bond mutual funds more important now than they have been in the past due to the
B
500B
1,000B
1,500B
2,000B
2,500B
3,000B
3,500B
4,000B
4,500B
-100M
-50M
M
50M
100M
150M
200M
250M
300M
350M
400M
2009 2010 2011 2012 2013 2014 2015 2016 2017
Tota
l Ass
ets
New
New
Cas
h F
Low
s
Bond Mututal Funds
Net New Cash Flow Total Assets of Taxable Bonds
Figure 1
2
recent growth. The last number to note is that active management accounted for 65% of U.S.
mutual funds outstanding in 2017. This shows that while many believe that there is no value in
active management, investors still have a high percentage of their assets in active funds. For this
reason, active management in both the equity market and bond markets should be studied, even
if it may not actually be beneficial to the investor.
Many studies have been done on different aspects of active management in the mutual
fund industry regarding how different variables affect performance. For example, one study
(Bliss et al., 2008 ) found that mutual funds managed by teams had no difference in performance
than mutual funds managed by individuals. Other studies have been conducted based on the
merit of the manager. For example, Chevalier and Edison (1999) found that managers that went
to high-SAT undergraduate schools experienced better risk-adjusted returns than their peers, and
Yuhong and Mazumder (2017) found that managers with either a CFA or MBA performed better
than managers without either. These studies were both performed on active mutual funds,
regardless of classification. This paper’s aim will be to examine only corporate bond mutual
funds and whether the average tenure of the manager, or managers, running a mutual fund affects
the performance of that fund. This is important because as detailed above, investors still have an
interest in active mutual funds, and they should have all the information possible regarding what
factors can influence a mutual fund’s return. This study will focus on corporate bond mutual
funds for two reasons. The first reason, mentioned above, is due to the increasing inflows
corporate bond mutual funds have received over the past three years, and also as a result of the
possible growth in the bond market in the near future. This growth may stem from the fact that
baby boomers are reaching retirement age and will likely be moving more of their retirement into
bond mutual funds. Another driver of possible increased assets in bond mutual funds is the fact
3
that interest rates may continue to be raised over the next few years with the economy showing
strong growth and analysts predicting two rate hikes in 2019. As interest rates go up, more
investors will look to active bond mutual funds to invest their money and get the best yield
possible. These points make it interesting to analyze whether funds with longer average manager
tenure have outperformed funds with shorter average manager tenure in the past, which may
indicate that investors in the future may want to consider a bond mutual fund’s average manager
tenure before deciding which fund to invest in.
The results of this paper show a significant positive relationship between average
manager tenure and performance in most cases. The only case where this differs is during the
crisis period where longer tenured funds’ performance actually had a statistically significant
negative relationship with average manager tenure. The pre and post-crisis periods, however,
show a stronger positive relationship between tenure and performance than the full-time period.
In general, the relationships between average manager tenure and performance is stronger in
investment-grade funds. This may be due to a smaller number of funds in the high yield sample.
Still, the relationship is statistically significant in most cases, specifically when looking at the
regression for solely investment grade funds, compared to solely high yield funds, where the
regression shows no statistically significant relationship.
This paper has some contribution to past literature. It is one of the first papers to strictly
look at manager tenure and performance using multiple techniques and looking at multiple time
periods. It also documents convincing evidence that a fund’s average manager tenure has a
positive relationship with performance in corporate bond mutual funds, and specifically
investment grade corporate bond mutual funds.
4
The rest of the paper proceeds as follows. Section 2 highlights past research on the topic
of persistence in mutual funds, and on the topic of manager tenure and how it affects mutual fund
performance. Section 3 outlines the formation of the hypothesis and what different results would
imply about it. Section 4 outlines the data and key variables that will be used in the empirical
analysis to test the hypothesis. Section 5 details the methods of analysis that will be used to study
the relationship between tenure and performance. In Section 6, the main empirical results of the
paper regarding manager tenure and expected corporate bond returns are presented. Section 7 is
the conclusion of the paper.
2. Literature Review
This section talks about the research that is relevant to the topic of manager tenure and
corporate bond mutual funds. Section 2.1 talks about studies that have been done on the topic of
persistence. It also talks about studies that research the difference in performance of active and
passive on mutual fund performance. The characteristic in focus in this section is manager tenure
funds. Section 2.2 discusses research related to manager characteristics and their effects.
2.1 Active versus Passive Management
The first research that should be acknowledged is in the area of persistence, which
investigates whether specific mutual funds or managers are able to achieve positive performance
over a long period of time. It is also important to note research on persistence specifically in
bond mutual funds. Several papers agree that active management is not beneficial, and
persistence does not exist. One paper (French, 2008), finds that active management costs
investors 67 basis points a year relative to passive management, as an argument against
persistence. French looked at the period from 1980 to 2006. Another paper (Cici & Gibson,
2012), finds no evidence that bond fund managers are able to select bonds that outperform other

5
bonds with similar characteristics, concluding that there is not persistence, and investors should
avoid active management. While acknowledging this research, it seems that academics are more
likely to believe that there is persistence in bond mutual funds compared to equity mutual funds.
Timmermann and Wermers (2006) find that, contrary to most studies, a sizable minority of
managers are able to pick securities well enough to cover their costs and have positive alpha in
all mutual funds. This study uses a bootstrap analysis to arrive at this conclusion. They find this
necessary to make a proper conclusion because it helps combat the fact that individual funds
exhibit normally distributed returns at times. This analysis evaluates the cross-sectional
distribution of alphas in mutual funds, incorporating an analysis of a complicated mixture of
fund alpha distributions in individual funds. Additionally, both Huang and Blanchfield (2009)
and Moneta (2015) find that there is definitely evidence of short-term persistence in bond mutual
funds, and Moneta even found that bond mutual funds from 1997-2006 were able to outperform
their benchmarks before costs and fees by an average of 1%. Moneta was able to find this by
studying U.S. bond mutual funds using a method that revolves around a novel data set of
portfolio weights. This result is important to this paper because it shows that there may be some
benefit to active management in bond mutual funds, which makes the topic of manager tenure
and performance in active bond mutual funds more interesting.
2.2 Relationship Between Tenure and Performance
The literature regarding whether manager tenure has any effect on performance is split,
and no studies have been done solely on corporate bond mutual funds. Golec (1996) shows
evidence that manager tenure is the most significant predictor of performance, and that for each
year tenure goes up, performance goes up by 5 basis points per year. He finds this using a three-
stage least squares regression in which he simultaneously studies a mutual fund’s risk and fees.

6
This study analyzes all mutual funds, including equity and bond mutual funds, during the period
of 1988-1990. A similar study by Kaushik (2010) finds that tenure positively affects performance
by 6 basis points per year. This study looks at a bigger dataset of monthly returns by also
analyzing monthly returns from active mutual funds during the period 1999-2007. Quiang (2011)
finds that tenure could both positively and negatively affect mutual funds returns. He found that
during down markets with higher volatility longer-tenured managers have better performance,
but that during boom markets with lower volatility this advantage becomes weaker and even
negative in some markets. His study looked at mutual fund returns from 2000 to 2009. Another
study found that tenure positively influences risk and fee-adjusted returns using panel regressions
(Payne et. al., 1999). While these are adjusted returns, they certainly are a measure of a
manager’s performance which makes the results of this paper support the hypothesis that longer-
tenured managers have higher performance.
Some studies find that tenure has no effect on performance. Fortin et. al. (1999) finds no
relationship, but he does find that as tenure goes up, a fund is expected to have lower turnover,
lower expenses, and higher assets under management. In his analysis he splits up the funds into
two baskets, one made up of funds with managers that have over 10 years of experience, and one
made up of funds that have managers with less than 5 years of experience. He removes the
sample in the middle to avoid confounding the data. Studies by Redman and Gullet (2006) and
Yuhong and Long (2012) find that manager tenure has no effect on taxable or municipal bond
mutual funds, or U.S. based international funds, respectively. Redman and Gullet look at
monthly fund returns from 1997 to 2001. They then perform a regression analysis of the data
controlling for things like fund size and expense ratios. Yuhond and Long also use a regression
and control for many of the same factors but using monthly return data during the period 2005-

7
2009. Kjetsaa and Kieff (2016) did a similar study on blend only mutual funds and find no
significant relationship between tenure and performance. The main analysis on tenure in Kieff’s
study is conducted looking at the difference in means of separate portfolios made up of managers
with different lengths of tenure, while also controlling for expense ratios.
Porter and Trifts performed two studies (2012 and 2014) on how experience affects
mutual fund performance. The 2012 study uses a regression and focuses more on absolute
performance, while the 2014 study uses multiple methods, all focused on relative performance
against funds of the same style. Both studies have similar conclusions. The 2012 study finds that
managers of ten years or greater perform above the market at a higher percentage than managers
in their first three years. The 2014 study finds that managers of ten or more years have stronger
monthly-adjusted performance when compared to managers of one, two, and three years. This
2014 study also found that when comparing a manager of four, five, six, seven, eight, or nine
years of tenure against managers with over ten years of tenure there is no difference in returns.
This study also finds that in managers’ last year at a fund, they perform significantly worse than
the managers that have over ten years of experience. Another study (Kempf et al., 2009) finds
that a fund's relative performance against its peers had a much more significant effect on
managers achieving longevity than anything else. This means that for managers to have
longevity in their career, they had to not underperform their peers, rather than outperform their
peers. Kempf concluded that this causes many managers to herd up into similar assets and adjust
their risk to match other funds. For comparison to another industry, Brown et al. (2001) finds
evidence of this same herding behavior in hedge funds and commodity trading advisors,
concluding that managers were much more concerned with how other comparable managers

8
perform, rather than the performance of the market because they realized that they only have to
keep up with these comparable managers’ performance in order to keep their jobs.
3. Hypothesis
When forming the hypothesis for this paper it is important to take into account all of the
previous studies and data that have been found. For this reason, both absolute performance and
relative performance against other managers will be assessed. Performance against other
managers will be looked at because, as Porter and Trifts (2012 & 2014), Kempf (2009), and
Brown et al. (2001) found, managers like to gauge themselves against other managers. The null
hypothesis in this paper, H0, is that there is not a positive relationship between managerial tenure
and fund returns. Previous papers have found this to be true in all mutual funds which makes it a
good starting point. Other papers have also found that tenure does have a relationship with
performance in mutual funds, in addition to this, common sense says that if there was any
relationship to be expected, it would be a positive relationship between manager tenure and
returns. This is because as tenure increases it is assumed that experience increases which may
give longer-tenured managers a better chance of outperforming. This positive relationship will be
considered H1. An interesting result to also consider is that there is a negative relationship
between manager tenure and performance. After analyzing H0 we will be able to see if this is a
possibility. This would be a surprising relationship, but could maybe have some explanations.
The alternative hypothesis is show below.
H1: There is a positive relationship between managerial tenure and corporate bond mutual
fund returns.
A rejection of H0 would imply that manager tenure does have a positive relationship with
corporate bond mutual fund performance. This could imply that the bond market is too efficient
9
for a manager, regardless of his experience, to outperform other managers. This could also imply
that managers are able to keep their jobs for reasons other than outperformance. A rejection of
the null hypothesis may support H1, which implies that as managerial tenure goes up, a
manager’s expected performance also goes up. This means that a manager with 4 years of
experience is more likely to have a higher return than a manager with 1 year of experience. A
rejection of H0 could also have the surprising result of implying the opposite, that as managerial
tenure increases expected return decreases. One explanation for this could be that as a manager’s
tenure increases, their job security increases as well, which may cause them to work less.
Another explanation could be that as a manager’s tenure increases, their confidence increases
causing them to possibly become overconfident leading to a decline in performance.
4. Data
This section outlines a description of the data and variables used in the paper. Section 4.1
outlines the sample of funds that are studied. Section 4.2 discusses some of the statistics of the
sample when it is broken down into different pieces. Section 4.3 lays out some of the variables
that will be important to better understand the results of the empirical analysis in section 5.
4.1 Corporate Bond Sample
The dataset used in this analysis was provided by Morningstar. It contains corporate bond
mutual funds, excluding all other mutual funds such as equity, blend or government mutual
funds. For each fund, monthly net returns from the period of 2002-2017 are used. To avoid
survivorship bias, this includes funds that opened or closed inside of those dates. To avoid
having a fund that has an overly high or low average monthly return due to a small sample size,
and to allow the calculation of a funds alpha, funds with less than 12 months of monthly returns
have been taking out of the sample. This period is a good period to look at because it contains a

10
recession in 2008 and 2009, making the sample more dynamic. To control for the variety of fund
configurations that could refer to the same fund, only the oldest share class for each fund was
used. Also, all funds that did not have a manager name and an average tenure were excluded.
The sample does contain funds that are team managed. For this reason, the main independent
variable being looked at is average manager tenure. It seemed appropriate not to exclude team
managed funds because over 70% of corporate bond mutual funds are run by multiple managers,
which makes this group of funds important to include. The sample contains six Morningstar
categories for taxable bonds, but in this analysis, the funds are separated into two categories,
High-Yield and Investment Grade. In total there are 665 funds the sample.
4.2 Summary Statistics
Table 1, Panel A:
Fund Type: High Yield: Inv. Grade: Total:
Number of Funds: 179 486 665
Average Monthly Return: 0.53% 0.25% 0.33%
Average Assets: 229,622 471,996 406,203
Average Assets (2017): 248,426 669,653 552,870
Average Turnover: 93.76% 168.11% 148.04%
Average Expense Ratio: 1.72% 3.09% 2.70%
Table 1, Panel B:
Fund Type: Less than 4 4 to 8 8 and Over
Number of Funds: 185 262 218
Average Monthly Return: 0.29% 0.33% 0.36%
Average Assets: 434,064 402,243 395,868
Average Assets (2017): 498,991 553,822 612,260
Average Turnover: 125.37% 165.75% 145.55%
Average Expense Ratio: 2.27% 4.23% 118.00%
Summary statistics of the sample can be seen in Table 1. Panel A shows the statistics on
the sample sorted into high yield funds and investment grade funds. It shows there are over twice

11
as many investment-grade funds as high-yield funds. The statistics for average assets are broken
down into two types. The first type, Average Assets, is an average of the monthly time series
data of assets for each fund over the period from 2002-2017. The second type, Average Assets
(2017), is the average assets in 2017 for the funds that were still in operation that year. These
rows in Panel A show that investment grade funds are, on average, more than double the size of
high yield funds. The panel also shows that investment grade funds have higher turnover and
higher expenses, on average, than high yield funds. Lastly, the table shows that high yield funds
have a higher average monthly return than investment grade funds, which makes sense because
high-yield bonds are inherently riskier. Panel B shows the same descriptive statistics as Panel A,
but the sample is broken down by a fund’s average manager tenure. The first group consists of
funds with an average manager tenure of fewer than four years. The second group consists of
funds with average manager tenure of four to eight years, not including eight. The third group
consists of funds with an average manager tenure of eight years and over. One interesting
statistic that the panel shows is that the average 2017 assets for funds go up as average manager
tenure goes up. Another interesting point that this table shows is that the average expense ratio
and average turnover is highest for the middle group of managers. The last intriguing observation
is that the average monthly return goes up as the groups increase in managerial tenure. This is the
positive relationship between managerial tenure and performance that one might expect, but of
course, this result alone does not prove that there is a significant positive relationship. The
standard deviation of the monthly returns for the entire sample is .22%. Using this number to
calculate the standard error of the sample, and then calculating a t-statistic of the 8 and over
group versus the two other groups, it is found that the difference between these returns is
statistically significant at the 1% level. This may support the inference that managers with longer

12
tenure perform better, but it does not control for any variables and is only a cross-sectional
analysis which means that it may not have any significance. Figure 2 shows a histogram of the
average manager tenure of these 665 funds. It shows that the distribution for average manager
tenure is skew right with the most observations lying from 2.8 to 4.6 years of average manager
tenure.
5. Methodology
This section will clearly outline the two methods of analysis that will be used to
determine whether manager tenure has a relationship with corporate bond mutual fund
performance. Section 5.1 explains some the performance measures and variables that are used.
Section 5.2 explains how the univariate portfolio analysis is conducted. Section 5.3 explains how
the panel regressions are performed.
5.1 Variable Definitions
The methodologies used in this analysis will be based on net monthly returns of the
mutual funds in the sample. Using monthly returns will provide a much larger sample than using
Figure 2

13
yearly returns, allowing the analyses to be stronger. Also, the net returns are looked at because
this analysis is not concerned with the expenses that a particular mutual fund chooses to have,
and by using net returns as opposed to gross returns, this factor is stripped out. In the univariate
analysis, these monthly returns form the “Raw Return,” which is the net monthly return with no
adjustments. In addition to this return, an alternative to evaluating corporate bond returns is also
used. This is Fama and French’s (1992) five-factor model:
𝑅𝑖 ,𝑡− 𝑅𝑓 ,𝑡 = 𝛼𝑖 + 𝛽𝑖,𝑀𝐾𝑇 𝑀𝐾𝑇𝑡 + 𝛽𝑖,𝑆𝑀𝐵 𝑆𝑀𝐵 + 𝛽𝑖,𝐻𝑀𝐿 𝐻𝑀𝐿𝑡 + 𝛽𝑖,𝑡𝑒𝑟𝑚 𝑇𝐸𝑅𝑀
+ 𝐵𝑖,𝐷𝐸𝐹 𝐷𝐸𝐹𝑡 + 𝐸𝑖,𝑡,
where MKT, SMB, and HML are the Fama-French three factors, Term is the term spread factor
that shows the interest rate risk of bonds, and DEF is a default spread factor that shows the
default risk premium. This five-factor alpha will be the dependent variable in both the univariate
and regression analyses in this paper. The other dependent variable that will be seen in the
regression analyses is “Excess Return.” This is the monthly return minus the risk-free rate. The
other variables in the regression results are as follows.
5.2 Portfolio Analysis
In the portfolio analysis, the sample of funds is split into 3 groups (portfolios) each month
based on average manager tenure. Although tenure is a snapshot variable, funds can be in
different groups at different times due to the sample size in each month changing. The portfolios
are rebalanced to equal weight each month. This is then used to find the raw monthly returns, as
well as the Fama-French (1993) five-factor alphas of each portfolio. The difference between
portfolio 3, comprised of the highest tenured funds, and portfolio 1, comprised of the shortest
tenured funds is then looked at. The t-statistics for the three portfolios, and also the difference
between portfolio 3 and portfolio 1 (3-1), are all looked at to check for significance. This
14
analysis is similar to Fortin’s (1999) analysis, which also created “portfolios” in a similar way
and looked at the difference between the top and bottom group. Fortin also noted that it was
important to take out the middle portfolio, portfolio 2, because of how it may confound the data.
In addition to this 3-portfolio analysis, a portfolio analysis that splits the sample into two
groups is also looked at. These results may be useful because each portfolio is made up of more
funds, and they also will allow for another look into the data. This method may also shine a light
on whether or not removing a middle section of funds has an effect on the results. Both the 3-
portfolio and 2-portfolio analyses, and all the following univariate analyses, will also contain
results for when the sample is split up into investment grade and high yield funds.
The sample will also be looked at when split up into time periods. This study will look at
three different time periods, the first is the time period from July 2007 until February 2009. This
time period was chosen to include the months of the recession caused by the financial crisis of
2007-2009. This was a time of heightened volatility and could show interesting results regarding
manager tenure’s affect, specifically when the markets are experiencing a multitude of ups and
downs. The next time period is the “pre-crisis” period from January 2002 until June 2007. This
time period includes data from a strong market and economy leading up to the crisis. The last
time period is the “post-crisis” period from March 2009 until December 2017. This is similar to
the pre-crisis time period due to them both having relatively low volatility. Each of these time
periods also breaks down the sample into investment grade bond funds and high yield bond
funds. This is important because investment grade funds and high yield funds have different
characteristics, expected returns, and possibly attract different types of managers and investors,
making the similarities and differences between the results of the two groups along with the
results from the full sample of funds interesting.
15
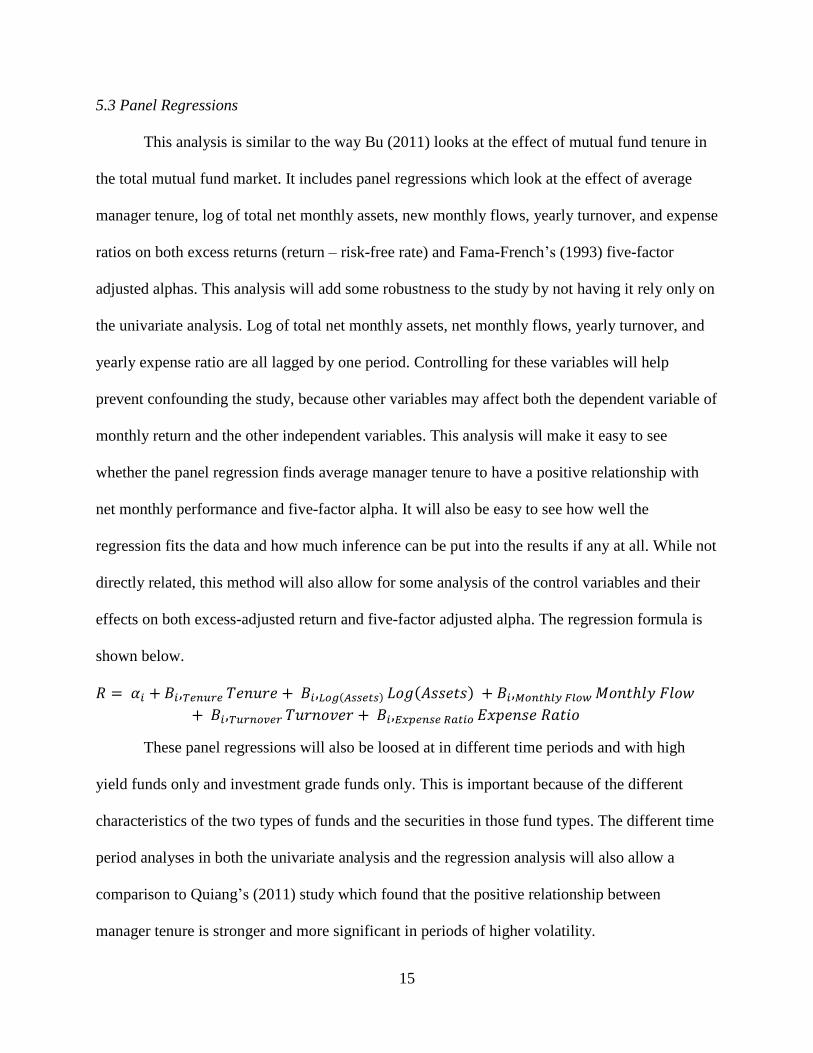
5.3 Panel Regressions
This analysis is similar to the way Bu (2011) looks at the effect of mutual fund tenure in
the total mutual fund market. It includes panel regressions which look at the effect of average
manager tenure, log of total net monthly assets, new monthly flows, yearly turnover, and expense
ratios on both excess returns (return – risk-free rate) and Fama-French’s (1993) five-factor
adjusted alphas. This analysis will add some robustness to the study by not having it rely only on
the univariate analysis. Log of total net monthly assets, net monthly flows, yearly turnover, and
yearly expense ratio are all lagged by one period. Controlling for these variables will help
prevent confounding the study, because other variables may affect both the dependent variable of
monthly return and the other independent variables. This analysis will make it easy to see
whether the panel regression finds average manager tenure to have a positive relationship with
net monthly performance and five-factor alpha. It will also be easy to see how well the
regression fits the data and how much inference can be put into the results if any at all. While not
directly related, this method will also allow for some analysis of the control variables and their
effects on both excess-adjusted return and five-factor adjusted alpha. The regression formula is
shown below.
𝑅 = 𝛼𝑖 + 𝐵𝑖,𝑇𝑒𝑛𝑢𝑟𝑒 𝑇𝑒𝑛𝑢𝑟𝑒 + 𝐵𝑖,𝐿𝑜𝑔(𝐴𝑠𝑠𝑒𝑡𝑠) 𝐿𝑜𝑔(𝐴𝑠𝑠𝑒𝑡𝑠) + 𝐵𝑖,𝑀𝑜𝑛𝑡ℎ𝑙𝑦 𝐹𝑙𝑜𝑤 𝑀𝑜𝑛𝑡ℎ𝑙𝑦 𝐹𝑙𝑜𝑤
+ 𝐵𝑖,𝑇𝑢𝑟𝑛𝑜𝑣𝑒𝑟 𝑇𝑢𝑟𝑛𝑜𝑣𝑒𝑟 + 𝐵𝑖,𝐸𝑥𝑝𝑒𝑛𝑠𝑒 𝑅𝑎𝑡𝑖𝑜 𝐸𝑥𝑝𝑒𝑛𝑠𝑒 𝑅𝑎𝑡𝑖𝑜
These panel regressions will also be loosed at in different time periods and with high
yield funds only and investment grade funds only. This is important because of the different
characteristics of the two types of funds and the securities in those fund types. The different time
period analyses in both the univariate analysis and the regression analysis will also allow a
comparison to Quiang’s (2011) study which found that the positive relationship between
manager tenure is stronger and more significant in periods of higher volatility.
16
6. Empirical Results
This section presents the findings from both the univariate portfolio analysis and the
panel regressions analyses. Subsection 1 includes the univariate results with its subsections each
representing a specific time period. Subsection 1 then wraps up with a more consolidated
conclusion from the univariate analysis. Subsection 2 includes the panel regressions results, with
the subsections each representing a specific time period. This section also wraps up with a
consolidated conclusion from the portfolio analysis.
6.1 Univariate Analysis
This subsection talks about the univariate portfolio analyses. The methodology for these
analyses are described in section 5.2. The subsections break down the results based upon time
periods in order to make the results more easily located. These results are shown in Table 2,
Table 3 and Table 4, which show the univariate analysis results when looking at three groups,
and Table 5, which shows the results from the portfolio analysis when looking at two groups.
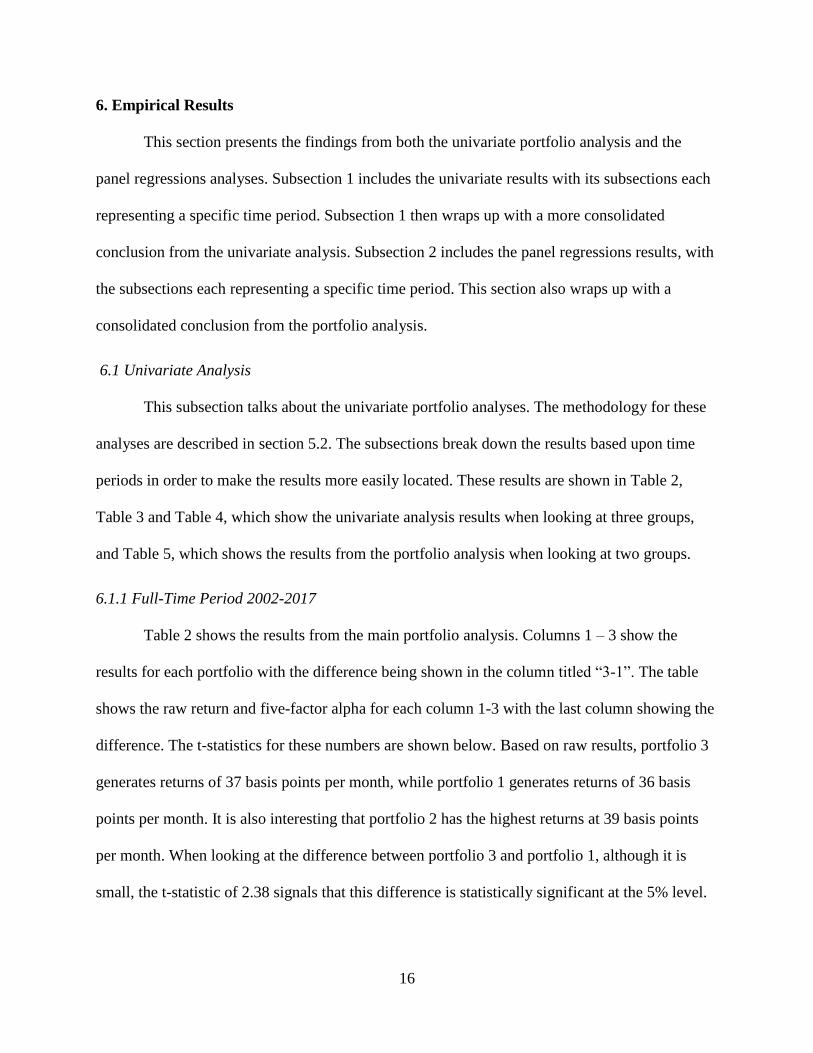
6.1.1 Full-Time Period 2002-2017
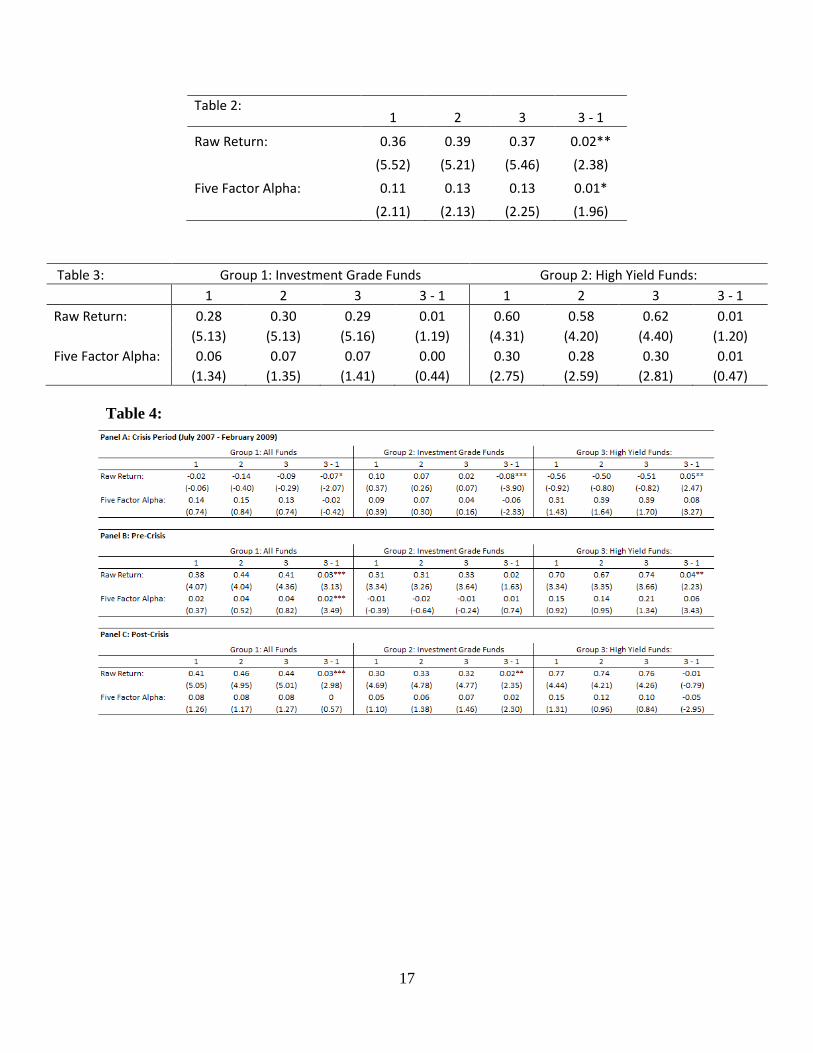
Table 2 shows the results from the main portfolio analysis. Columns 1 – 3 show the
results for each portfolio with the difference being shown in the column titled “3-1”. The table
shows the raw return and five-factor alpha for each column 1-3 with the last column showing the
difference. The t-statistics for these numbers are shown below. Based on raw results, portfolio 3
generates returns of 37 basis points per month, while portfolio 1 generates returns of 36 basis
points per month. It is also interesting that portfolio 2 has the highest returns at 39 basis points
per month. When looking at the difference between portfolio 3 and portfolio 1, although it is
small, the t-statistic of 2.38 signals that this difference is statistically significant at the 5% level.
17
Table 2: 1 2 3 3 - 1
Raw Return: 0.36 0.39 0.37 0.02**
(5.52) (5.21) (5.46) (2.38)
Five Factor Alpha: 0.11 0.13 0.13 0.01*
(2.11) (2.13) (2.25) (1.96)
Table 3: Group 1: Investment Grade Funds Group 2: High Yield Funds:
1 2 3 3 - 1 1 2 3 3 - 1
Raw Return: 0.28 0.30 0.29 0.01 0.60 0.58 0.62 0.01
(5.13) (5.13) (5.16) (1.19) (4.31) (4.20) (4.40) (1.20)
Five Factor Alpha: 0.06 0.07 0.07 0.00 0.30 0.28 0.30 0.01
(1.34) (1.35) (1.41) (0.44) (2.75) (2.59) (2.81) (0.47)
Table 4:

18
Looking at the five-factor alpha, it shows that portfolio 3 also has a higher number than portfolio
1, with the t-statistic of the difference resulting in a value of 1.96, which signals a statistically
significant difference at the 10% level. Table 3 shows the results of the univariate analysis when
the sample is split into high yield and investment grade. The results are split into Group 1 and
Group 2 and each group has the results from Table 2. These groups show that in both investment
grade and high yield funds individually there is not statistically significant differences between
raw returns or five-factor alpha. Table 5 Panel A Group 1 shows the results from the two-group
analysis. It reports similar, but weaker, results showing the difference between portfolio 2 and
portfolio 1 to be statically significant for both performance metrics at the 10% level.
Table 5:

19
6.1.2 Crisis Time Period July 2007 – February 2009
Table 4 Panel A shows the results from the portfolio analysis during recession time. It
contains three groups, each with the same format as Table 2. The results contrast Quiang’s
(2011) research. Table 4 shows that, while the five-factor alpha difference is not statistically
significant in any of the groups, the raw return difference is statistically significant in each
group. For Group 1 containing all funds, the table shows that the highest tenured portfolio
actually performs 7 basis points worse than the lowest tenured portfolio. The t-statistic for this
difference is -2.07, which is significant at the 10% level. Group 2, containing investment grade
funds, displayed a raw return difference of -8 basis points. This difference is significant at the
1% level. What is interesting is that when only looking at high yield funds, Group 3, longer-
tenured funds still perform better than shorter tenured funds by 5 basis points, with the difference
being significant at the 5% level. Table 5 Panel B shows the results when only using two groups,
the results show the same negative relationship in Groups 1 and 2, and a positive relationship in
Group 3.
6.1.3 Pre-Crisis January and Post-Crisis Periods
Table 4 Panel A and Panel B show the results from the portfolio analyses with 3 groups
in the pre-crisis and post-crisis periods respectively. The results from these panels are similar to
each other and to the results from the full-time period analysis. Group 1 of both Panel B and
Panel C show a 3-basis point difference in monthly raw returns between the longest-tenured
funds and shortest tenured funds. These differences are significant at the 1% level. The raw
return difference in the investment grade group is 2 basis points and it is also significant at the
5% level. Table 7 Panel C and Panel D show the univariate portfolio analysis during the pre and
post-crisis time periods, and the results support the univariate analysis using 3 groups.

20
When looking at all the results, they show that average manager tenure is significantly
positively associated with raw returns. This is shown by a positive different in the majority of the
“3-1” columns of the tables. Many of these differences are also statistically significant. This
being said, in relatively shorter periods of high volatility this positive relationship may not hold
true and even become negative, specifically in investment grade funds. This relationship is seen
in Table 4 panel A.
6.2 Panel Regressions
This subsection talks about the univariate portfolio analyses. The methodology for these
analyses is described in section 5.3. The subsections break down the results based upon time
periods in order to make the results more easily located. The results of these regression analyses
are shown in Table 6, Table 7, Table 8, and Table 9.
Table 6: Panel A: All Funds Panel B: Investment Grade Panel C: High Yield
Risk -
Adjusted: Factor
Adjusted: Raw
Returns: Factor
Adjusted: Raw
Returns: Factor
Adjusted:
Intercept: -
1.712*** -2.329*** -0.528*** -1.052*** -0.255 -1.14***
(-25.86) (-35.22) (-10.14) (-20.24) (-2.91) (-13.00)
Tenure: 0.036*** 0.036*** 0.023*** 0.023*** 0.006 0.006
(5.52) (5.48) (4.67) (4.61) (0.63) (0.61)
Log Assets: 0.011*** 0.011*** 0.003** 0.004*** 0.001 0.001
(6.70) (7.06) (2.10) (3.26) (0.46) (0.15)
Monthly Flow: 1.61*** 1.61*** 0.598*** 0.594*** 0.598*** 0.6***
(43.36) (43.30) (19.86) (19.76) (12.82) (12.88)
Turnover: 0.015*** -0.015*** 0.006*** 0.006*** -0.008** 0.008***
(-7.41) (-7.48) (4.17) (4.09) (-2.02) (-2.11)
Expense Ratio: 4.21*** 2.233*** -1.82*** -1.867*** 3.355*** -3.282***
(7.02) (7.01) (-3.76) (-3.87) (-4.06) (-3.98)
R-Squared: 0.491 0.289 0.596 0.372 0.885 0.73
Adj. R-Squared: 0.489 0.289 0.595 0.369 0.884 0.727
Observations: 62,166 62,166 44,925 44,925 17,241 17,421
21
Table 7: Panel A: All Funds Panel B: Investment Grade Panel C: High Yield
Risk -
Adjusted: Factor
Adjusted: Raw
Returns: Factor
Adjusted: Raw
Returns: Factor
Adjusted:
Intercept: -0.138 -2.04*** 0.972*** -0.885*** 2.569*** 0.779**
(-0.57) (-8.47) (4.52) (-4.13) (8.33) (2.54)
Tenure: -0.06** -0.06** -0.039 -0.042 -0.02 -0.014
(-2.00) (-2.00) (-1.47) (-1.62) (-0.53) (-0.38)
Log Assets: -0.016** -0.007*** -0.01* -0.002 -0.025** -0.025**
(-2.27) (-1.00) (-1.70) (-0.34) (-2.53) (-2.52)
Monthly Flow: 3.19*** 3.188*** 1.62*** 1.612*** 1.376*** 1.41***
(20.96) (21.02) (11.23) (11.21) (8.21) (8.46)
Turnover: 0.03*** 0.03*** 0.015 0.016* -0.005 -0.008
(2.78) (2.82) (1.55) (1.68) (-0.38) (-0.55)
Expense Ratio: -14.9*** -15.194*** 6.818*** -7.661*** -5.478 -6.65*
(-5.21) (-5.32) (-2.62) (-2.96) (-1.52) (-1.85)
R-Squared: 0.491 0.244 0.523 0.319 0.905 0.606
Adj. R-Squared: 0.489 0.241 0.521 0.315 0.904 0.6
Observations: 6,082 6,082 4,471 4,471 1,611 1,611
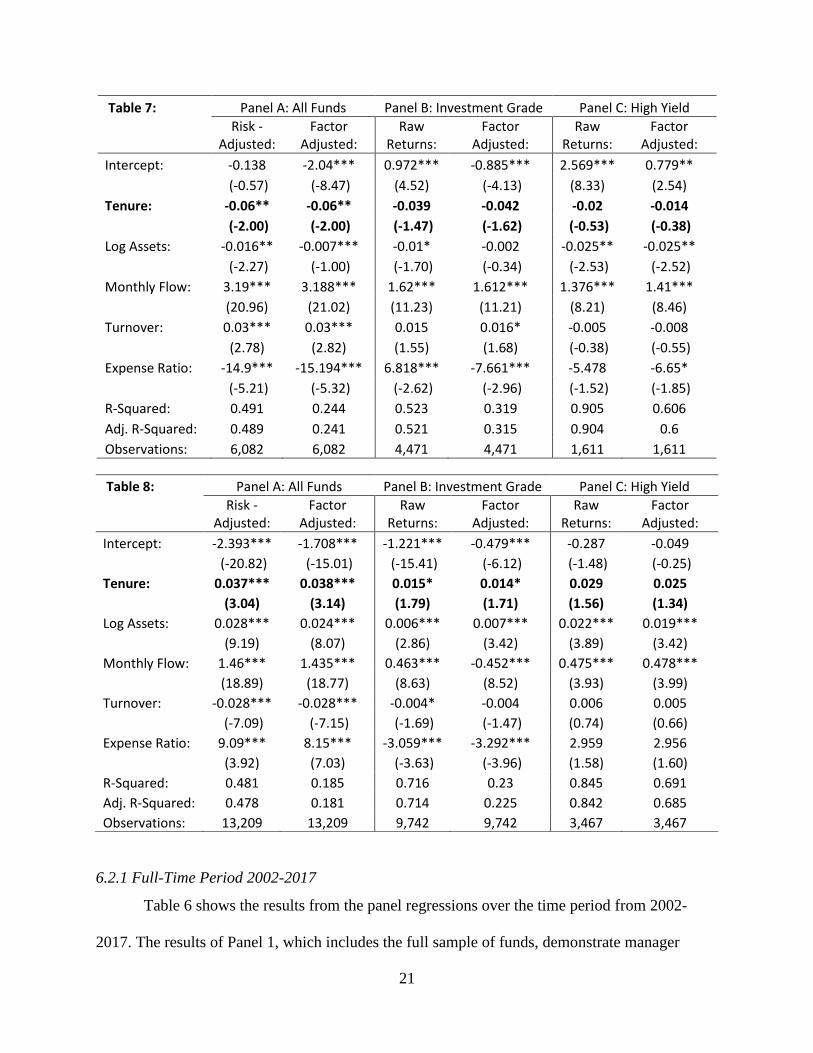
6.2.1 Full-Time Period 2002-2017
Table 6 shows the results from the panel regressions over the time period from 2002-
2017. The results of Panel 1, which includes the full sample of funds, demonstrate manager
Table 8: Panel A: All Funds Panel B: Investment Grade Panel C: High Yield
Risk -
Adjusted: Factor
Adjusted: Raw
Returns: Factor
Adjusted: Raw
Returns: Factor
Adjusted:
Intercept: -2.393*** -1.708*** -1.221*** -0.479*** -0.287 -0.049
(-20.82) (-15.01) (-15.41) (-6.12) (-1.48) (-0.25)
Tenure: 0.037*** 0.038*** 0.015* 0.014* 0.029 0.025
(3.04) (3.14) (1.79) (1.71) (1.56) (1.34)
Log Assets: 0.028*** 0.024*** 0.006*** 0.007*** 0.022*** 0.019***
(9.19) (8.07) (2.86) (3.42) (3.89) (3.42)
Monthly Flow: 1.46*** 1.435*** 0.463*** -0.452*** 0.475*** 0.478***
(18.89) (18.77) (8.63) (8.52) (3.93) (3.99)
Turnover: -0.028*** -0.028*** -0.004* -0.004 0.006 0.005
(-7.09) (-7.15) (-1.69) (-1.47) (0.74) (0.66)
Expense Ratio: 9.09*** 8.15*** -3.059*** -3.292*** 2.959 2.956
(3.92) (7.03) (-3.63) (-3.96) (1.58) (1.60)
R-Squared: 0.481 0.185 0.716 0.23 0.845 0.691
Adj. R-Squared: 0.478 0.181 0.714 0.225 0.842 0.685
Observations: 13,209 13,209 9,742 9,742 3,467 3,467
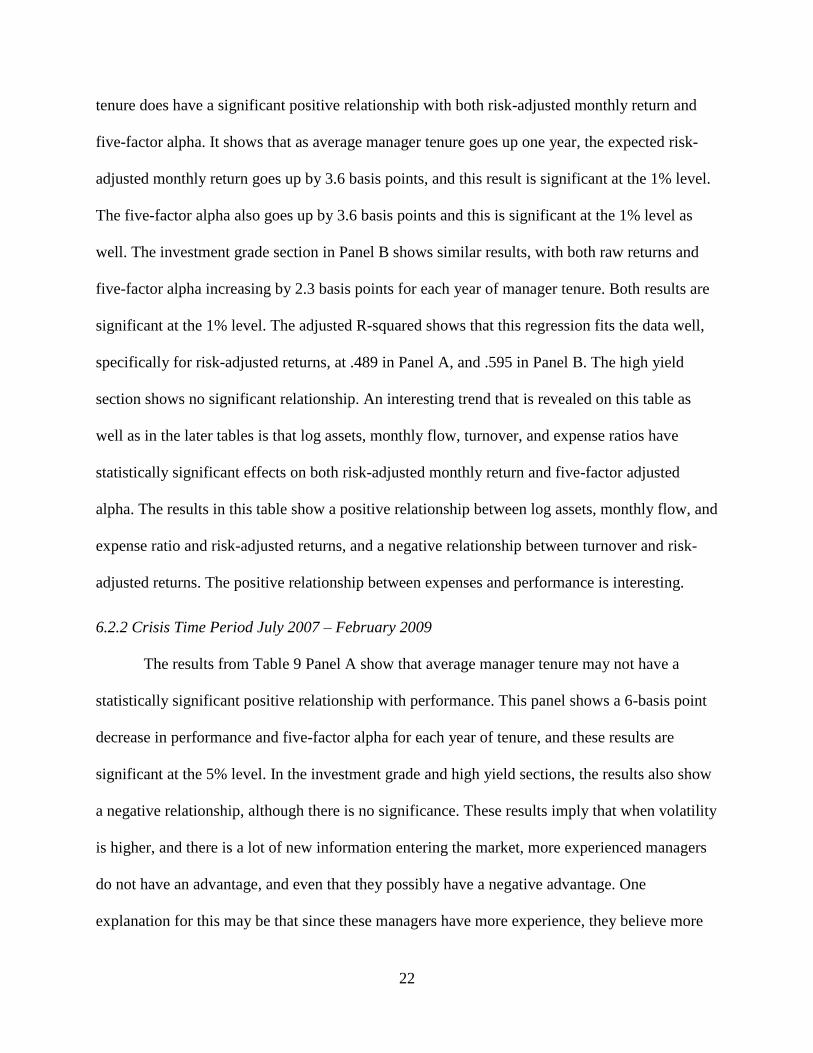
22
tenure does have a significant positive relationship with both risk-adjusted monthly return and
five-factor alpha. It shows that as average manager tenure goes up one year, the expected risk-
adjusted monthly return goes up by 3.6 basis points, and this result is significant at the 1% level.
The five-factor alpha also goes up by 3.6 basis points and this is significant at the 1% level as
well. The investment grade section in Panel B shows similar results, with both raw returns and
five-factor alpha increasing by 2.3 basis points for each year of manager tenure. Both results are
significant at the 1% level. The adjusted R-squared shows that this regression fits the data well,
specifically for risk-adjusted returns, at .489 in Panel A, and .595 in Panel B. The high yield
section shows no significant relationship. An interesting trend that is revealed on this table as
well as in the later tables is that log assets, monthly flow, turnover, and expense ratios have
statistically significant effects on both risk-adjusted monthly return and five-factor adjusted
alpha. The results in this table show a positive relationship between log assets, monthly flow, and
expense ratio and risk-adjusted returns, and a negative relationship between turnover and risk-
adjusted returns. The positive relationship between expenses and performance is interesting.
6.2.2 Crisis Time Period July 2007 – February 2009
The results from Table 9 Panel A show that average manager tenure may not have a
statistically significant positive relationship with performance. This panel shows a 6-basis point
decrease in performance and five-factor alpha for each year of tenure, and these results are
significant at the 5% level. In the investment grade and high yield sections, the results also show
a negative relationship, although there is no significance. These results imply that when volatility
is higher, and there is a lot of new information entering the market, more experienced managers
do not have an advantage, and even that they possibly have a negative advantage. One
explanation for this may be that since these managers have more experience, they believe more

23
strongly in their opinions and are stubborn in their management, possibly causing their returns to
suffer. This contrasts to a less experienced manager who may be more conservative during times
of high volatility due to them acknowledging that they may not have little experience. Panel A
also shows a relatively high Adjusted R-squared at .489 for risk-adjusted returns. The number of
observations, however, is much smaller than the full sample due to this time period including
less than two years of monthly returns. The other thing to note from the table that is different
from the full-time period is that log assets, turnover, and expense ratio all have a negative
relationship with performance in this time period.
6.2.3 Pre-Crisis January and Post-Crisis Periods
The pre and post-crisis results are similar to each other and also similar to the full-time
period sample. Each of the variables in Panel A of both Table 8, showing pre-crisis results, and
Table 9: Panel A: All Funds Panel B: Investment Grade Panel C: High Yield
Risk -
Adjusted: Factor
Adjusted: Raw
Returns: Factor
Adjusted: Raw
Returns: Factor
Adjusted:
Intercept: -1.501*** -2.226*** -0.462*** -1.032*** -0.084 -1.147***
(-21.26) (-31.59) (-8.54) (-19.14) (-0.91) (-12.32)
Tenure: 0.051*** 0.049*** 0.036*** 0.034*** -0.001 -0.001
(3.69) (6.44) (6.41) (6.18) (-0.10) (-0.13)
Log Assets: 0.012*** 0.014*** 0.005*** 0.007*** 0 -0.003
(6.58) (7.87) (4.03) (5.48) (-0.05) (-1.16)
Monthly Flow: 1.33*** 1.324*** 0.438*** 0.438*** 0.481*** -0.479***
(31.43) (31.36) (13.11) (13.14) (9.16) (9.14)
Turnover: -0.016*** -0.016*** 0.008*** 0.007*** 0.013*** -0.013***
(-7.42) (-7.50) (5.17) (5.00) (-2.80) (-2.79)
Expense Ratio: 6.06*** 5.76*** -0.337 -4.98 4.329*** -4.333***
(8.87) (8.44) (-0.63) (-0.93) (-4.62) (-4.63)
R-Squared: 0.48 0.25 0.571 0.322 0.881 0.681
Adj. R-Squared: 0.478 0.248 0.57 0.32 0.879 0.678
Observations: 42,875 75,875 30,712 30,712 12,163 12,163
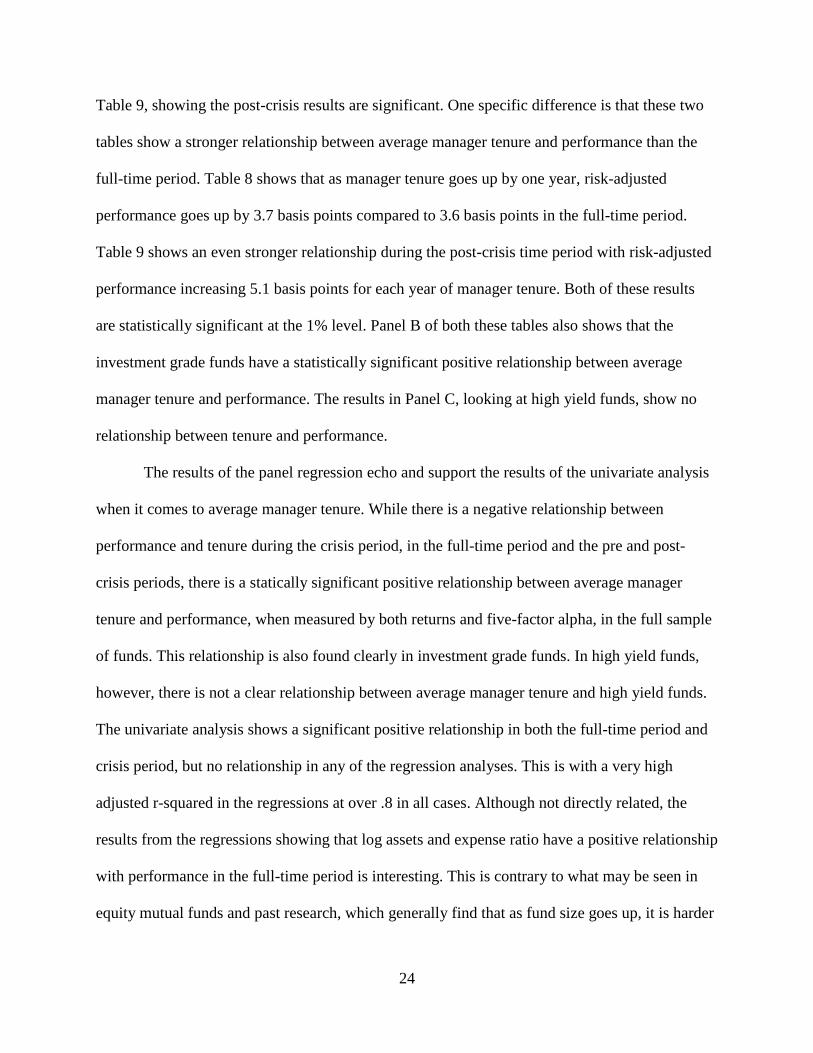
24
Table 9, showing the post-crisis results are significant. One specific difference is that these two
tables show a stronger relationship between average manager tenure and performance than the
full-time period. Table 8 shows that as manager tenure goes up by one year, risk-adjusted
performance goes up by 3.7 basis points compared to 3.6 basis points in the full-time period.
Table 9 shows an even stronger relationship during the post-crisis time period with risk-adjusted
performance increasing 5.1 basis points for each year of manager tenure. Both of these results
are statistically significant at the 1% level. Panel B of both these tables also shows that the
investment grade funds have a statistically significant positive relationship between average
manager tenure and performance. The results in Panel C, looking at high yield funds, show no
relationship between tenure and performance.
The results of the panel regression echo and support the results of the univariate analysis
when it comes to average manager tenure. While there is a negative relationship between
performance and tenure during the crisis period, in the full-time period and the pre and post-
crisis periods, there is a statically significant positive relationship between average manager
tenure and performance, when measured by both returns and five-factor alpha, in the full sample
of funds. This relationship is also found clearly in investment grade funds. In high yield funds,
however, there is not a clear relationship between average manager tenure and high yield funds.
The univariate analysis shows a significant positive relationship in both the full-time period and
crisis period, but no relationship in any of the regression analyses. This is with a very high
adjusted r-squared in the regressions at over .8 in all cases. Although not directly related, the
results from the regressions showing that log assets and expense ratio have a positive relationship
with performance in the full-time period is interesting. This is contrary to what may be seen in
equity mutual funds and past research, which generally find that as fund size goes up, it is harder

25
to increase return, and that as expenses go up, returns decrease. What this also implies, is that
tenure is positively related to fund assets, monthly flow, and expense ratio, and negatively
related to turnover. These results along with the results from the univariate analysis lead to a
rejection of the null hypothesis which states that there is not a positive relationship, and an
acceptance of H1 which says that there is a positive relationship.
7. Conclusion
Golic (1996) finds that manager tenure is the most significant predictor of performance
and that as manager tenure goes up by 1 year, performance goes up by 5 basis points per year.
Other studies (Kaushik, 2010 and Quiang, 2011) find similar results in equity mutual funds.
Fortin (1999) however, finds relationships using a very similar analysis as this paper’s univariate
portfolio analysis. Porter and Trifts (2012 and 2014) also study the topic extensively in equity
mutual funds and find mixed results. The results of this paper align with the first group of papers
that find a positive relationship. This is also the first paper to look at the relationship between
manager tenure and performance specifically in corporate bond mutual funds. The analyses in
this paper also use a larger dataset when compared to many of these other studies. This means
that the analysis is able to analyze the relationship between tenure and performance over a long
period of time which is how long many investors will hold a mutual fund for.
Over the period of 2002-2017 this paper documents a positive relationship between
average manager tenure and fund performance when measured both by monthly return and five-
factor alpha. The univariate analysis shows a statically significant 2 basis points difference
between raw returns of funds with the top third of tenure versus funds with the bottom third of
tenure. The results in specific time periods are similar, however negative in the shortened time
period of the financial crisis. Still, an extra 2 basis point monthly return can add up over time,
26
and recessions do not last for a relatively long period of time. This relationship is seen stronger
in investment grade funds. The regression analysis shows similar results. Over the full-time
period, as average manager tenure goes up by 1 year, the expected risk-adjusted return goes up
by 3.6 basis points. These results once again show a negative relationship during the crisis, but a
stronger relationship in the pre and post-crisis time periods, these results are significant in all the
time periods. This relationship sticks in investment grade funds, while it is not found to be
statistically significant in high yield funds.
This study sheds light on the fact that if investors are looking to buy a bond mutual fund
and hold it for a long period of time, they should consider average manager tenure. While the
difference may be small, over time the difference in performance that average manager tenure is
associated with can add up over time, and potentially allow a person saving for retirement to be
better off.

27
References
Bliss, R. T., Potter, M. E., & Schwarz, C. (2008). Performance characteristics of individually-
managed versus team-managed mutual funds. Journal of Portfolio Management, 34, 110-
119.
Brown, S. J., Goetzmann, W. N., & Park, J. (2001). Careers and survival: Competition and risk
in the hedge fund and CTA industry. Journal of Finance, 56, 1869-1886.
Chevalier, J., & Ellison, G. (1999). Are some mutual fund managers better than others? Cross-
sectional patterns in behavior and performance. Journal of Finance, 54(3), 875-899.
Cici, G., & Gibson, S. (2012). The performance of corporate bond mutual funds: Evidence based
on security-level holdings. Journal of Financial & Quantitative Analysis, 47.
Du, D., Huang, Z., & Blanchfield, P. J. (2009). Do fixed income mutual fund managers have
managerial skills?. Quarterly Review of Economics & Finance, 49, 378-397
Fama, E. F., & French, K. R. (1993), Common risk factors in the returns on stocks and bonds.,
Journal of Financial Economics, 33, 3-56.
Fortin, R., & Michelson, S. (1999). Does mutual fund manager tenure matter? Journal Of
Financial Planning, 12, 72-79.
French, K. R. (2008). Presidential address: The cost of active investing. Journal of Finance, 63,
1537-1573.
Golec, J. H. (1996). The effects of mutual fund managers' characteristics on their portfolio
performance, risk and fees. Financial Services Review, 5, 133.
Investment Company Factbook (2018). A review of trends and activities in the investment
company industry. Investment Company Factbook, 58, Investment Company.
Kaushik, A. (2010). Managerial tenure and other determinants of mutual fund performance:
correlations and implications. Proceedings of the northeast business & economics
association, 303-307.
Kempf, A., Ruenzi, S., & Thiele, T. (2009). Employment risk, compensation incentives, and
managerial risk taking: evidence from the mutual fund industry. Journal of Financial
Economics, 92, 92-108.
Kjetsaa, R., & Kieff, M. (2016). Impact of expenses, turnover and manager tenure on blend fund
performance. Journal of Business & Accounting, 9, 99-115.
28
Kosowski, R., Timmermann, A., Wermers, R., & White, H. (2006). Can mutual fund “stars”
really pick stocks? New evidence from a bootstrap analysis. Journal of Finance, 61,
2551-2595.
Moneta, F. (2015). Measuring bond mutual fund performance with portfolio
characteristics. Journal of Empirical Finance, 33, 223-242.
Payne, T. H., Prather, L., & Bertin, W. (1999). Value creation and determinants of equity fund
performance. Journal of Business Research, 45, 69-74.
Porter, G. E., & Trifts, J. W. (1998). Performance persistence of experienced mutual fund
managers. Financial Services Review, 7, 57.
Porter, G. E., & Trifts, J. W. (2012). The best mutual fund managers: Testing the impact of
experience esing a survivorship bias free dataset. Journal of Applied Finance, 22, 105-
117.
Porter, G. E., & Trifts, J. W. (2014). The career paths of mutual fund managers: The role of
merit. Financial Analysts Journal, 70, 55-71
Redman, A. L., & Gullett, N. S. (2007). Impact of fund, management and market characteristics
on bond mutual fund performance. Journal of Asset Management, 7, 429-442.
Qiang, B. (2011). Exposing management characteristics in mutual fund
performance. Proceedings of The Northeast Business & Economics Association, 54-58.
Yuhong, F., & Addams, H. L. (2012). United States-based international mutual funds:
Performance and persistence. Financial Services Review, 21, 51-61
Yuhong, F., & Mazumder, M. I. (2017). CFA, MBA or both: further evidence on mutual fund
performance. Journal of Accounting & Finance (2158-3625), 17, 140-158.

29