the quantitative impact study for operational risk: overview of
TRANSCRIPT

1
Risk Management Group January 2002
The Quantitative Impact Study for Operational Risk: Overview of Individual Loss Data and Lessons Learned
I. Introduction and Overview
During 2001, the Risk Management Group (RMG) of the Basel Committee on Banking Supervision conducted two major data collection exercises intended to gather information about banks’ internal capital allocations for operational risk and their overall operational risk loss experience. The first of these exercises, termed the Quantitative Impact Survey, or QIS2–Tranche 1, focused on internal capital allocation figures for operational risk, both in the aggregate and across business lines, as well as information about overall internal capital allocations, gross income, and other potential exposure indicators. The second exercise (QIS2-Tranche 2) focused on information concerning individual operational risk loss events, the banks’ quarterly aggregate operational risk loss experience, and a wider range of potential exposure indicators tied to specific business lines.
This paper provides a tabulation and overview of the individual loss event data collected as part of this second data exercise, the QIS2–Tranche 2 for operational risk.1 In particular, the focus is on describing the range of individual loss data submitted by the banks participating in the survey, understanding the range of individual gross loss amounts contained in the data sample, and examining information provided on insurance and other recoveries associated with individual loss events.
The goals of this overview are to illustrate the nature of the data the RMG was able to collect through the QIS2–Tranche 2 exercise, provide some insight into the types of issues that can (and cannot) be addressed with the data and suggest some areas of further refinement that might be considered for any future QIS data collection exercises by the RMG or by others who may be contemplating similar data collection efforts. To this end, the final section of the paper reports on some “lessons learned” through the QIS2 exercises, both involving the process of collecting and analysing the data and concerning the actual data items requested. The purpose of this last section, in particular, is to stimulate discussion with the banking industry and other interested parties that could help the RMG identify improvements for any future QIS exercises for operational risk.
It is important to note that the data discussed in this overview reflect developing methodologies and approaches for data collection at the participating banks. This factor, combined with the relatively short window – just three years – spanned by the data, suggests that it is necessary to be cautious in using these data to draw any conclusions about the
1 A description of the information collected in the QIS2-Tranche 1 exercise for operational risk is contained in
“Working Paper on the Regulatory Treatment of Operational Risk” released by the Risk Management Group in September 2001. This paper is available on the BIS website, www.bis.org.

2
extent of operational risk exposures, either for individual banks or for the industry as a whole. The short horizon, for instance, suggests that the number of rare, but potentially severe, “tail events” represented in the data set may be limited. This paper should be seen primarily as a description of the individual loss event data received through the QIS2-Tranche 2 exercise, rather than an attempt to assess the extent of operational risk at a more general level or to calibrate aspects of the proposed capital charge for operational risk using the data collected in the QIS2–Tranche 1.
Review of the QIS2–Tranche 2 Exercise For the QIS2–Tranche 2 exercise, participating banks were asked to supply several types of information concerning their operational risk loss experience. Banks were asked for information about individual operational risk loss events over the years 1998 to 2000, categorised into eight business lines and seven event types specified by the RMG, for a total of 56 business line/event type combinations. For each loss event, banks were asked to supply information on the calendar quarter in which the event occurred, data on gross loss amounts, insurance recoveries, and other recoveries, and, as optional data items, information about the nature of the loss effect type (eg loss of recourse or write-downs). Each bank was asked to report all individual losses above a minimum cutoff threshold of 10,000 USD/euro. In practice, banks used a variety of minimum cutoffs in their data submissions.2
In addition to the individual loss data, banks were asked to report aggregate quarterly loss data for the 12 quarters of 1998 to 2000. These data could be the simple aggregates of the individual loss data or could reflect additional loss amounts that the banks were unable to break out into individual loss events. The quarterly aggregate loss data were reported in the 56 business line/event type categories. Banks were also asked to report quarterly information on a range of possible exposure indicators (including gross income, number of employees, total compensation, and assets) according to business line.
The summary presented in this paper focuses primarily on the individual loss data, rather than the quarterly aggregate data or the exposure indicator data. In part, this focus reflects that the individual loss data are at the core of the overall data collection exercise and thus there is the most to be gained from understanding the nature of the data obtained. It also reflects the actual responses received, which tended to be more complete and consistent across banks for the individual loss data than the quarterly aggregate or exposure indicator data. However, these other data are being used for internal data analysis and calibration exercises being conducted by the RMG.
The summary in this paper is based on individual operational risk loss data supplied by 30 banks from 11 countries in Europe, North America, Asia and Africa. The original data submitted by these banks were put through a process of clean-up and standardisation by members of the RMG. In particular, the data were checked for internal consistency, any errors were identified and corrected and the data were converted into common units and currency (thousands of euros). While in some cases, there are some outstanding questions
2 The QIS documentation was not specific as to whether the 10,000 US dollar/euro cutoff should reflect gross or
net loss amounts (that is, loss amounts before or after any insurance or other recoveries). In practice, most banks seem to have interpreted the minimum cutoff as applying to gross loss amounts.

3
concerning the interpretation of the data3, in all cases we are reasonably certain that the data used in the analysis below do not have significant reporting errors or inconsistencies.
II. Overview of Individual Operational Risk Loss Data
Individual Loss Events by Bank Table 1 summarises the distribution of the number of individual loss events reported by each of the 30 banks in the sample. As is evident in the table, the range of individual loss events reported by the banks was quite large, ranging from zero events to more than 3,500. Slightly over half the banks (16 out of 30) reported 500 or fewer individual loss events, with the bulk of those (nine) reporting fewer than 100 events. At the other extreme, six banks reported more than 2,000 individual loss events.
Aside from giving a sense of the distribution of individual loss events across the banks in the sample, Table 1 also provides a sense of how comprehensive the banks believed these individual loss events to be. In a follow up “fact sheet” to the QIS2-Tranche 2 data collection exercise, banks were asked to indicate the extent to which the reported loss events represented all loss events above the minimum cutoff level and, if possible, a sense of what portion of overall losses the reported events represented.
The right-hand columns of Table 1 summarise this information, to the extent it was available. As the bottom row of the table indicates, of the 30 banks in the sample, just six felt that their reported loss events were fully comprehensive for all business lines, event types, and years. Another five banks reported that their loss events were comprehensive for at least some business lines or event types (“partially comprehensive” data). Nearly two-thirds of the banks (19 out of 30) reported that the data were not comprehensive for any business line or event type or were unable to provide information about the degree of comprehensiveness.
The banks reporting either fully or partially comprehensive data tended to cluster among those reporting 500 or more individual observations. In contrast, those banks reporting that their data was not comprehensive span nearly the full range of individual loss events. In fact, three banks reporting as many as 2,000 to 3,000 individual loss events indicated that their data was not comprehensive. These findings suggest that number of observations alone may not always be a reliable indicator of the degree of comprehensiveness of the loss data.
3 For instance, questions concerning the comprehensiveness of the data, the exact minimum cutoffs used, or
whether the standard business line and event type definitions supplied by the RMG were used.

4
Table 1 Number of Individual Loss Events Reported by Banks in the QIS2-Tranche 2
Of Which: Comprehensiveness of Loss Data
Number of Loss Events Number of Banks
Fully Comprehensive
Partially Comprehensive
Not Comprehensive or No Information
Provided
0 to 50 5 0 0 5
51 to 100 4 0 1 3
101 to 200 4 1 0 3
201 to 500 3 0 2 1
501 to 1,000 5 4 0 1
1,001 to 2,000 3 0 1 2
2,001 to 3,000 3 0 0 3
3,001 to 4,000 3 1 1 1
Total 30 6 5 19
Table 2 provides information about the minimum cutoff level reflected in the loss data reported by the sample banks. For purposes of this table, the banks were categorised according to whether their minimum cutoff levels were above, below, or equal to the €10,000 suggested in the QIS documentation.4 In some cases, banks used different cutoff levels for different business lines and/or years, so the table also indicates these cases. Differences in cutoffs across banks are potentially significant when estimating operational risk loss distributions, since data based on different minimum cutoff levels will cause both frequency and severity estimates to differ across institutions.
Table 2 Minimum Cutoff Levels Used by QIS2–Tranche 2 Reporting Banks
Minimum Cutoff Number of Banks
Less than €10,000: 13
For all business lines 12 For some business lines and more for others 1
€10,000: 9
For all business lines 7 For some business lines and less for others 1 For some business lines and both less and more for others 1
More than €10,000 3
No Information Reported 5
Total 30
4 For these purposes, euros and US dollars are treated as equivalent.

5
The majority of banks in the sample (22 of 30) used minimum cutoff levels at or below €10,000. Four of these employed cutoffs that differed across business lines including, in some cases, cutoffs that were higher than €10,000. Only three banks used a uniform minimum cutoff exceeding €10,000.
Aggregate Individual Loss Data This section aggregates the individual loss data reported by the 30 banks in the sample to form a single data set.5 The basic characteristics of this aggregate data set are reported in Tables 3 and 4. Table 3 summarises the total number of individual loss events reported in each business line/event type combination, while Table 4 tabulates the total gross loss amounts of the events in each cell.
The combined data totalled over 27,000 individual loss events. However, as seen in Table 3, these events were not spread evenly across business lines and event types. In particular, the data are clustered in two of the eight business lines: Retail Banking accounted for over two-thirds of the individual observations, while Commercial Banking accounted for another 13 percent. Corporate Finance, in contrast, accounted for less than one percent of total events (just 80 individual events). A similar clustering is apparent when looking across event types. Over 40 percent of the individual loss events were categorised in the Execution, Delivery and Process Management event type, with another 35 percent categorised as External Fraud. Employment Practices and Workplace Safety and Internal Fraud had the fewest number of events, with approximately 750 each.
Looking at individual business line/event type cells of the matrix, just two cells – External Fraud and Execution, Delivery and Process Management in the Retail Banking business line – account for over half of the individual loss events. In contrast, about 40 percent of the cells in the matrix (22 out of 56) have fewer than 20 events each. One cell – Damage to Physical Assets in the Asset Management business line – contains no individual loss events.
Table 4, which reports the aggregate gross loss amounts reflected in the data set, shows the total amount of gross losses is just over €2.6 billion. The largest losses in the sample ranged between €50 and 100 million. Aggregate gross loss amounts are distributed somewhat more evenly across business lines than the individual events, though there is still evidence of clustering. In particular, Retail Banking accounts for the largest share of gross loss amounts, about 40 percent of the total. The lower percentage of loss amounts as compared to loss numbers reflects the prevalence of smaller-than-average losses in this business line. Following Retail Banking are Commercial Banking, with 23 percent of gross loss amounts, and Trading and Sales, with 19 percent.
In terms of event types, gross loss amounts are concentrated in three event type categories: Execution, Delivery and Process Management (35 percent); Clients, Products, and Business Services (28 percent); and External Fraud (20 percent). The comparatively smaller share of gross losses for Execution, Delivery, and Process Management as compared to its share of the number of loss events suggests that gross loss amounts tend to be smaller-than-average for this event type. Similarly, the larger share for Clients, Products, and Business Services as
5 These data omit approximately 35,000 individual loss events reported by one bank in a single business
line/event type combination: External Fraud in Retail Banking. These individual loss events were for small value amounts, though in total their value was over €80 million for the twelve quarters covered by the survey. Given the extremely large number of individual events and some question as to their interpretation, we chose to omit them from the summary discussed in this section.

6
compared to the number of loss events suggests that individual losses tend to be larger-than-average for this category.
Turning to individual cells of the matrix, three account for about 40 percent of the total gross loss amounts reflected in the aggregate sample. These cells are Execution, Delivery and Process Management in the Trading and Sales business line; Clients, Products, and Business Services in the Retail Banking business line; and External Fraud in the Commercial Banking business line.
In considering the findings reported in Tables 3 and 4, it would be inappropriate to conclude that business line and/or event types with a comparatively greater number or value of reported loss events are those representing the greatest sources of operational risk. To assess the extent of risk, it would be necessary to assess the extent of variability of both number and value of loss events around their expected, or mean, values. Business lines or event types with large numbers of individual losses or with large cumulative loss values could exhibit large or small amounts of this variability over time, and therefore correspondingly large or small degrees of risk. Simple tabulation of the data – as reported above – does not supply significant insight in this regard. To gain such insight, it would be necessary to model this variation, an exercise that is beyond the scope of this paper.6
Perhaps more fundamentally, the data reported in Tables 3 and 4 reflect only the operational risk loss information that the contributing banks were able to supply, which in many cases did not represent a comprehensive and consistent view of the institutions’ full operational risk loss experience (see Tables 1 and 2). Since the sample reflects information pooled across banks with varying completeness of reporting for loss amounts, the pooled data do not necessarily reflect the aggregate loss experience of the banking industry, or even of the full set of 30 participating banks, for any particular business lines or event types. Moreover, it is not clear to what extent the sample of banks in the QIS2–Tranche 2 is representative of the banking industry as a whole. These are additional reasons not to draw strong inferences about the relative degree of risk arising from various business lines or event types based on this summary analysis.
6 The RMG is attempting to undertake internal analysis to address these sorts of issues.

Table 3 Number of Individual Loss Events Per Business Line and Event Type
30 Banks Reporting Data
Internal Fraud
External Fraud
Employment Practices and
Workplace Safety
Clients, Products and
Business Services
Damage to Physical Assets
Business Disruption
and System Failures
Execution, Delivery, and
Process Management
Total Across Event Types
Corporate Finance 4 3 16 15 8 1 33 80 0.0% 0.01% 0.06% 0.05% 0.03% 0.00% 0.12% 0.29% Trading and Sales 16 6 37 112 10 39 1,114 1,334 0.06% 0.02% 0.14% 0.41% 0.04% 0.14% 4.07% 4.87% Retail Banking 593 7,798 579 1,273 837 570 6,807 18,457 2.17% 28.49% 2.12% 4.65% 3.06% 2.08% 24.87% 67.43% Commercial Banking 93 1,180 55 66 285 474 1,463 3,616 0.34% 4.31% 0.20% 0.24% 1.04% 1.73% 5.35% 13.21% Payment and 22 961 9 57 40 64 752 1,905 Settlement 0.08% 3.51% 0.03% 0.21% 0.15% 0.23% 2.75% 6.96% Agency and Custody 6 7 12 69 17 11 356 478 Services 0.02% 0.03% 0.04% 0.25% 0.06% 0.04% 1.30% 1.75% Asset Management 4 4 21 35 6 360 430 0.01% 0.01% 0.08% 0.13% 0.02% 1.32% 1.57% Retail Brokerage 7 2 12 122 28 291 609 1,071 0.03% 0.01% 0.04% 0.45% 0.10% 1.06% 2.22% 3.91% Total Across 745 9,961 741 1,749 1,225 1,456 11,494 27,371 Business Lines 2.72% 36.39% 2.71% 6.39% 4.48% 5.32% 41.99% 100.00%

Table 4
Total Gross Loss Amounts by Business Line and Event Type Thousands of Euros
30 Banks Reporting Data
Internal Fraud
External Fraud
Employment Practices and
Workplace Safety
Clients, Products
and Business Services
Damage to Physical Assets
Business Disruption
and System Failures
Execution, Delivery, and
Process Management
Total Across Event Types
For Each Business
Line
Corporate Finance 3,293 25,231 6,114 131,012 18 28,432 194,100 0.13% 0.97% 0.23% 5.01% 0.00% 1.09% 7.43% Trading and Sales 68,819 826 7,845 89,054 138 6,237 326,563 499,481 2.63% 0.03% 0.30% 3.41% 0.01% 0.24% 12.50% 19.11% Retail Banking 115,578 210,026 54,600 387,447 61,176 2,110 198,820 1,029,757 4.42% 8.04% 2.09% 14.83% 2.34% 0.08% 7.61% 39.41% Commercial Banking 78,869 287,855 3,662 76,217 14,033 1,424 136,659 598,717 3.02% 11.02% 0.14% 2.92% 0.54% 0.05% 5.23% 22.91% Payment and 750 5,447 719 1,144 2,061 2,705 112,468 125,295 Settlement 0.03% 0.21% 0.03% 0.04% 0.08% 0.10% 4.30% 4.79% Agency and Custody 2,265 281 374 7,635 860 1,718 43,310 56,443 Services 0.09% 0.01% 0.01% 0.29% 0.03% 0.07% 1.66% 2.16% Asset Management 8,566 603 1,075 8,978 664 34,841 54,728 0.33% 0.02% 0.04% 0.34% 0.03% 1.33% 2.09% Retail Brokerage 445 596 1,845 17,485 575 6,471 27,127 54,545 0.02% 0.02% 0.07% 0.67% 0.02% 0.25% 1.04% 2.09% Total Across 278,586 530,866 76,235 71,8971 78,860 21,329 908,219 2,613,066 Business Lines 10.66% 20.32% 2.92% 27.51% 3.02% 0.82% 34.76% 100.00%

9
Table 5 presents further information about the number and total value of individual loss events by gross loss amount. As the first row of the table indicates, about 60 percent – just over 16,000 – of the individual loss events have gross loss amounts less than €10,000, though these account for just 1 percent of the total value of events in the sample. Another 30 percent of the events have gross loss amounts that fall between €10,000 and 50,000, while the remaining 10 percent of the sample have gross loss amount above €50,000. Just over 1 percent of the sample (284 events) have gross loss amount above €1 million. In terms of number of events, the sample is dominated by small losses. However, in terms of the value of events, the small number of comparatively large losses – those exceeding €1 million – account for nearly three-quarters of the aggregate value of losses.

Table 5
Distribution of Individual Loss Events by Gross Loss Amounts
Number of Loss Events Value of Loss Events
Gross Loss Amounts
(Thousands of Euros)
Number Percent of Total for all Loss
Events
Percent of Total for Loss Events
>= €10,000
Total (Thousands of
Euros)
Percent of Total of all Loss
Events
Percent of Total for Loss Events
>= €10,000
0 – 10 16,039 59% -- 31.2 1% --
10 – 50 8,156 30% 72% 174.1 7% 7%
50 – 100 1,428 5% 13% 100.6 4% 4%
100 – 500 1,250 4% 11% 263.3 10% 10%
500 – 1,000 213 1% 2% 148.3 6% 6%
1,000 – 10,000 245 1% 2% 715.2 27% 28%
More than 10,000 39 0.1% 0.3% 1,180.4 45% 45%
11
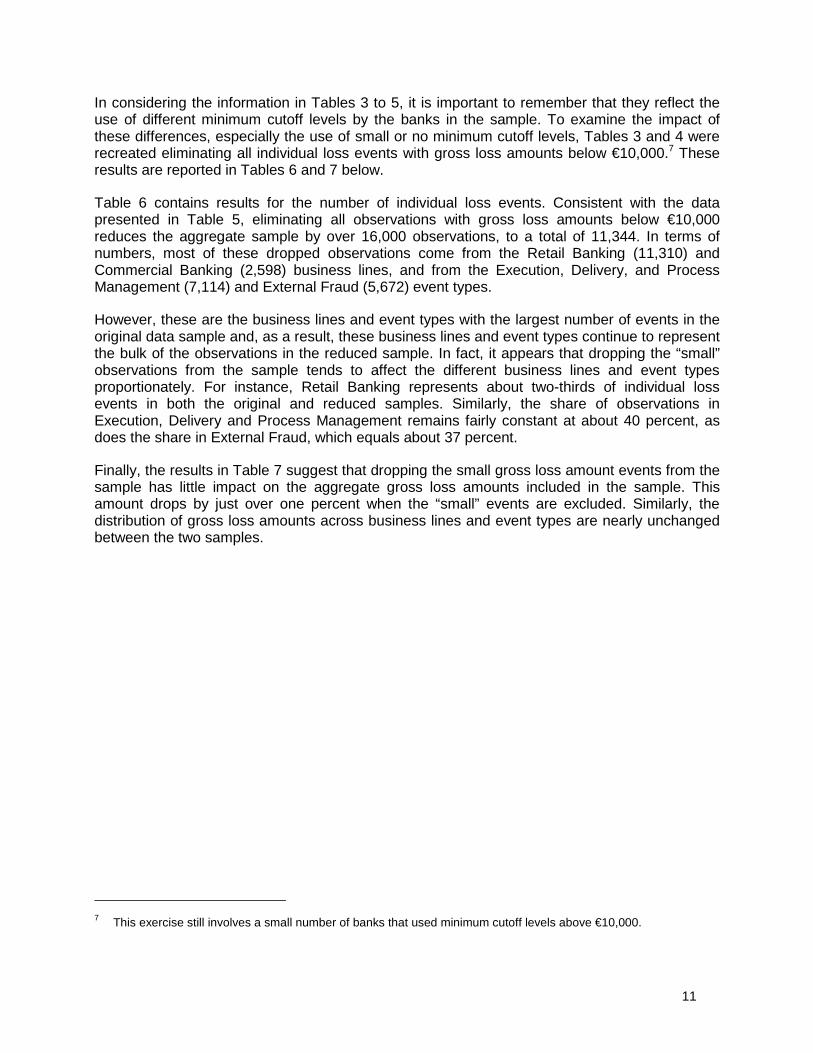
In considering the information in Tables 3 to 5, it is important to remember that they reflect the use of different minimum cutoff levels by the banks in the sample. To examine the impact of these differences, especially the use of small or no minimum cutoff levels, Tables 3 and 4 were recreated eliminating all individual loss events with gross loss amounts below €10,000.7 These results are reported in Tables 6 and 7 below.
Table 6 contains results for the number of individual loss events. Consistent with the data presented in Table 5, eliminating all observations with gross loss amounts below €10,000 reduces the aggregate sample by over 16,000 observations, to a total of 11,344. In terms of numbers, most of these dropped observations come from the Retail Banking (11,310) and Commercial Banking (2,598) business lines, and from the Execution, Delivery, and Process Management (7,114) and External Fraud (5,672) event types.
However, these are the business lines and event types with the largest number of events in the original data sample and, as a result, these business lines and event types continue to represent the bulk of the observations in the reduced sample. In fact, it appears that dropping the “small” observations from the sample tends to affect the different business lines and event types proportionately. For instance, Retail Banking represents about two-thirds of individual loss events in both the original and reduced samples. Similarly, the share of observations in Execution, Delivery and Process Management remains fairly constant at about 40 percent, as does the share in External Fraud, which equals about 37 percent.
Finally, the results in Table 7 suggest that dropping the small gross loss amount events from the sample has little impact on the aggregate gross loss amounts included in the sample. This amount drops by just over one percent when the “small” events are excluded. Similarly, the distribution of gross loss amounts across business lines and event types are nearly unchanged between the two samples.
7 This exercise still involves a small number of banks that used minimum cutoff levels above €10,000.

Table 6 Number of Individual Loss Events Per Business Line and Event Type
Only Events Exceeding €10,000 30 Banks Reporting Data
Internal Fraud
External Fraud
Employment Practices and
Workplace Safety
Clients, Products and
Business Services
Damage to Physical Assets
Business Disruption and
System Failures
Execution, Delivery, and
Process Management
Total Across Event Types
Corporate Finance 4 3 15 15 1 33 71 0.04% 0.03% 0.13% 0.13% 0.01% 0.29% 0.63% Trading and Sales 16 6 36 107 3 34 708 910 0.14% 0.05% 0.32% 0.94% 0.03% 0.30% 6.24% 8.02% Retail Banking 419 3,693 267 641 350 19 1,758 7,147 3.69% 32.55% 2.35% 5.65% 3.09% 0.17% 15.50% 63.00% Commercial Banking 68 519 23 44 63 13 288 1,018 0.60% 4.58% 0.20% 0.39% 0.56% 0.11% 2.54% 8.97% Payment and 12 60 8 21 28 48 593 770 Settlement 0.11% 0.53% 0.07% 0.19% 0.25% 0.42% 5.23% 6.79% Agency and Custody 6 2 12 31 10 8 347 416 Services 0.05% 0.02% 0.11% 0.27% 0.09% 0.07% 3.06% 3.67% Asset Management 4 4 10 32 2 233 285 0.04% 0.04% 0.09% 0.28% 0.02% 2.05% 2.51% Retail Brokerage 4 2 11 94 9 187 420 727 0.04% 0.02% 0.10% 0.83% 0.08% 1.65% 3.70% 6.41% Total Across Business 533 4,289 382 985 464 311 4,380 11,344 Lines 4.70% 37.81% 3.37% 8.68% 4.09% 2.74% 38.61% 100.00%

Table 7 Total Gross Loss Amounts by Business Line and Event Type
Only Events Exceeding €10,000 30 Banks Reporting Data
Internal Fraud
External Fraud
Employment Practices and
Workplace Safety
Clients, Products and
Business Services
Damage to Physical Assets
Business Disruption
and System Failures
Execution, Delivery, and
Process Management
Total Across Event Types
Corporate Finance 3,293 25,231 6,109 131,012 16 28,432 194,093 0.13% 0.98% 0.24% 5.07% 0.00% 1.10% 7.52% Trading and Sales 68,819 826 7,837 89,038 100 6,221 325,593 498,435 2.67% 0.03% 0.30% 3.45% 0.00% 0.24% 12.61% 19.30% Retail Banking 114,937 198,575 53,836 385,722 60,174 1,7967 191,617 1,006,658 4.45% 7.69% 2.09% 14.94% 2.33% 0.07% 7.42% 38.99% Commercial Banking 78,765 287,275 3,569 76,159 13,534 1,359 135,346 596,008 3.05% 11.13% 0.14% 2.95% 0.52% 0.05% 5.24% 23.08% Payment and 732 4,767 718 1,058 2,045 2,638 111,993 123,951 Settlement 0.03% 0.18% 0.03% 0.04% 0.08% 0.10% 4.34% 4.80% Agency and Custody 2,265 267 374 7,517 859 1,707 43,244 56,233 Services 0.09% 0.01% 0.01% 0.29% 0.03% 0.07% 1.67% 2.18% Asset Management 8,566 603 1,037 8,968 644 34,302 54,120 0.33% 0.02% 0.04% 0.35% 0.02% 1.33% 2.10% Retail Brokerage 426 596 1,845 17,387 561 5,646 26,029 52,490 0.02% 0.02% 0.07% 0.67% 0.02% 0.22% 1.01% 2.03% Total Across 277,803 518,140 75,325 716,861 77,288 20,013 896,557 2,581,987 Business Lines 10.76% 20.07% 2.92% 27.76% 2.99% 0.78% 34.72% 100.00%
14
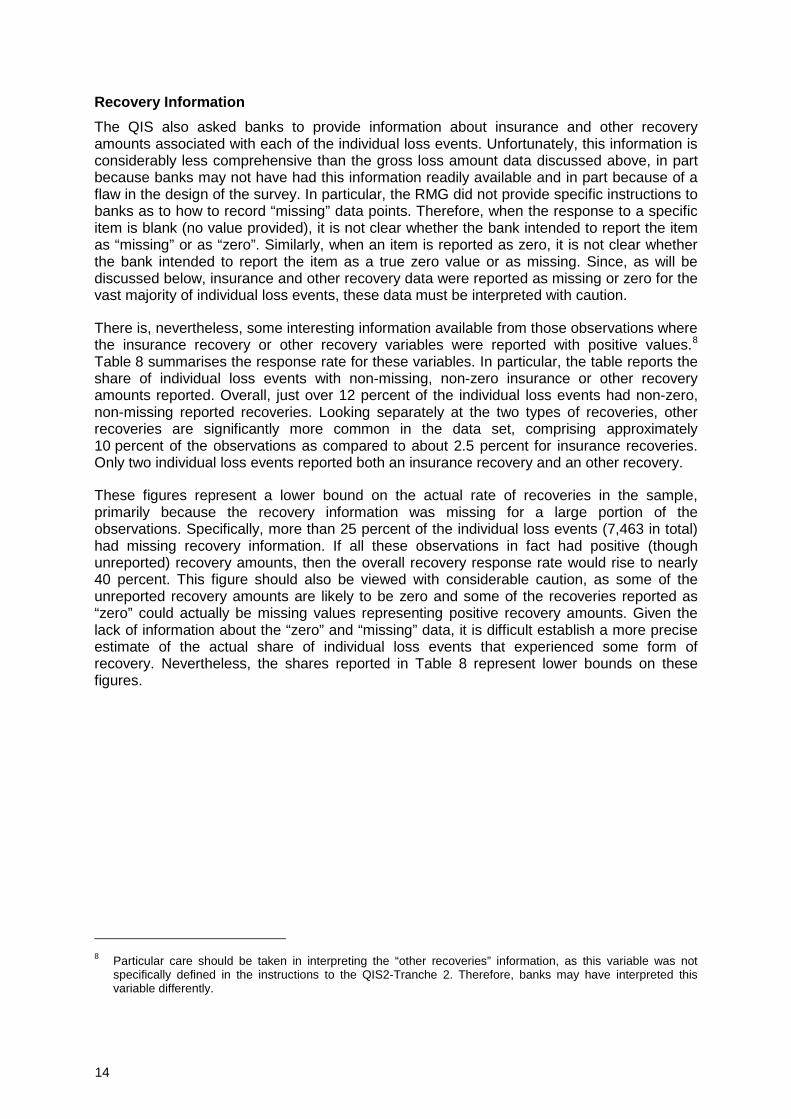
Recovery Information The QIS also asked banks to provide information about insurance and other recovery amounts associated with each of the individual loss events. Unfortunately, this information is considerably less comprehensive than the gross loss amount data discussed above, in part because banks may not have had this information readily available and in part because of a flaw in the design of the survey. In particular, the RMG did not provide specific instructions to banks as to how to record “missing” data points. Therefore, when the response to a specific item is blank (no value provided), it is not clear whether the bank intended to report the item as “missing” or as “zero”. Similarly, when an item is reported as zero, it is not clear whether the bank intended to report the item as a true zero value or as missing. Since, as will be discussed below, insurance and other recovery data were reported as missing or zero for the vast majority of individual loss events, these data must be interpreted with caution.
There is, nevertheless, some interesting information available from those observations where the insurance recovery or other recovery variables were reported with positive values.8 Table 8 summarises the response rate for these variables. In particular, the table reports the share of individual loss events with non-missing, non-zero insurance or other recovery amounts reported. Overall, just over 12 percent of the individual loss events had non-zero, non-missing reported recoveries. Looking separately at the two types of recoveries, other recoveries are significantly more common in the data set, comprising approximately 10 percent of the observations as compared to about 2.5 percent for insurance recoveries. Only two individual loss events reported both an insurance recovery and an other recovery.
These figures represent a lower bound on the actual rate of recoveries in the sample, primarily because the recovery information was missing for a large portion of the observations. Specifically, more than 25 percent of the individual loss events (7,463 in total) had missing recovery information. If all these observations in fact had positive (though unreported) recovery amounts, then the overall recovery response rate would rise to nearly 40 percent. This figure should also be viewed with considerable caution, as some of the unreported recovery amounts are likely to be zero and some of the recoveries reported as “zero” could actually be missing values representing positive recovery amounts. Given the lack of information about the “zero” and “missing” data, it is difficult establish a more precise estimate of the actual share of individual loss events that experienced some form of recovery. Nevertheless, the shares reported in Table 8 represent lower bounds on these figures.
8 Particular care should be taken in interpreting the “other recoveries” information, as this variable was not
specifically defined in the instructions to the QIS2-Tranche 2. Therefore, banks may have interpreted this variable differently.

15
Table 8 Percentage of Individual Loss Events With Non-Zero Reported Recoveries
Total Recoveries
Insurance Recoveries Other Recoveries
All Loss Events 12.2% 2.4% 9.9%
Loss Events by Gross Loss Amount (Thousands of Euros):
0 – 10 9.3% 2.1% 7.2%
10 – 50 14.7% 2.5% 12.2%
50 – 100 16.7% 2.7% 14.1%
100 – 500 20.2% 3.3% 17.0%
500 – 1,000 22.3% 2.8% 19.4%
Greater Than 1,000 36.1% 6.3% 29.9%
Note: The percentages equal the number of loss events with non-zero reported insurance recoveries or other recoveries divided by the total number of individual loss events.
Table 8 reports the recovery response rates by the size of the gross loss amount. The share of observations reporting non-zero, non-missing total recoveries increases as the size of the loss event grows, rising from 9.3 percent for gross loss amounts of less than €10,000 to just over 36 percent for gross loss amounts greater than €1 million. Looking across at the two columns illustrating response rates separately for insurance and other recoveries, most of this increase comes from an increase in the rate of other recoveries as gross loss amounts rise (though the rate of insurance recoveries climbs as well, especially for the largest gross loss amounts).
While the data in the QIS do not address this issue, it would be interesting to know whether the high reported rate for other, unspecified recoveries reflects greater efforts by banks to make recoveries on large individual losses, or whether some other factors are at play. For instance, some banks may keep better records of recoveries for large losses or smaller gross loss amounts may be treated as “pooled” losses under insurance contracts, making the assignment of recoveries to specific loss events difficult. The possibility that these types of “record-keeping” forces may be at play in the data means that the finding of higher recovery rates for larger gross loss amounts should be considered with caution. In future QIS efforts, it might therefore be worthwhile to attempt to address this issue, as well as collecting additional information about the nature of other recoveries.
Aside from looking at recovery rates by gross loss amount, it is also instructive to examine them across business lines and event types. Table 9 presents this information. The top panel of the table presents the share of observations reporting non-zero, non-missing insurance and other recoveries by business line, while the bottom panel presents this information for the seven different event types specified in the RMG’s framework. The distribution across business lines shows some amount of variation in recovery response rates. The total recovery response rate ranges from 2.8 percent for Asset Management to 17.3 percent for Commercial Banking.

16
Table 9 Percentage of Individual Loss Events With Non-Zero Reported Recoveries
Distribution Across Business Lines and Event Types
Total Recoveries
Insurance Recoveries
Other Recoveries
Average Gross Loss Amount (Euro 1000s)
Business Lines
Corporate Finance 11.3% 5.0% 6.3% 2,426
Trading & Sales 6.5% 0.8% 5.8% 374
Retail Banking 13.5% 2.4% 11.1% 56
Commercial Banking 17.3% 4.6% 12.7% 166
Payment & Settlement 3.8% 0.2% 3.7% 66
Agency & Custody 6.4% 4.7% 1.7% 120
Asset Management 2.8% 1.2% 1.6% 127
Retail Brokerage 1.6% 0.5% 1.1% 51
Event Types
Internal Fraud 28.8% 1.4% 27.4% 375
External Fraud 10.3% 1.3% 9.0% 53
Employment Practices & Workplace Safety
34.3% 33.7% 0.5% 103
Clients, Products, & Business Services
6.3% 0.1% 6.2% 412
Damage to Physical Assets 22.5% 20.1% 2.4% 65
Business Disruption & System Failure
4.5% 0.0% 4.5% 15
Execution, Delivery & Process Management
12.2% 0.2% 12.1% 79
Note: The percentages equal the number of loss events with non-zero reported insurance recoveries or other recoveries divided by the total number of individual loss events.
17
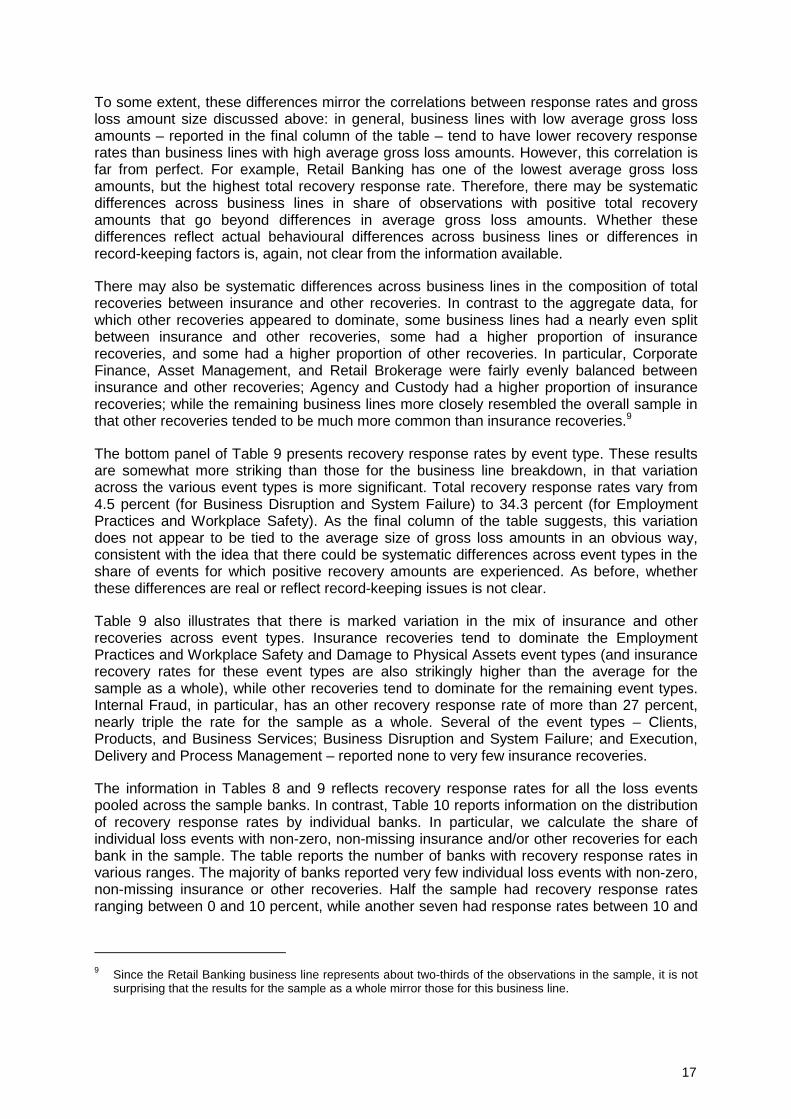
To some extent, these differences mirror the correlations between response rates and gross loss amount size discussed above: in general, business lines with low average gross loss amounts – reported in the final column of the table – tend to have lower recovery response rates than business lines with high average gross loss amounts. However, this correlation is far from perfect. For example, Retail Banking has one of the lowest average gross loss amounts, but the highest total recovery response rate. Therefore, there may be systematic differences across business lines in share of observations with positive total recovery amounts that go beyond differences in average gross loss amounts. Whether these differences reflect actual behavioural differences across business lines or differences in record-keeping factors is, again, not clear from the information available.
There may also be systematic differences across business lines in the composition of total recoveries between insurance and other recoveries. In contrast to the aggregate data, for which other recoveries appeared to dominate, some business lines had a nearly even split between insurance and other recoveries, some had a higher proportion of insurance recoveries, and some had a higher proportion of other recoveries. In particular, Corporate Finance, Asset Management, and Retail Brokerage were fairly evenly balanced between insurance and other recoveries; Agency and Custody had a higher proportion of insurance recoveries; while the remaining business lines more closely resembled the overall sample in that other recoveries tended to be much more common than insurance recoveries.9
The bottom panel of Table 9 presents recovery response rates by event type. These results are somewhat more striking than those for the business line breakdown, in that variation across the various event types is more significant. Total recovery response rates vary from 4.5 percent (for Business Disruption and System Failure) to 34.3 percent (for Employment Practices and Workplace Safety). As the final column of the table suggests, this variation does not appear to be tied to the average size of gross loss amounts in an obvious way, consistent with the idea that there could be systematic differences across event types in the share of events for which positive recovery amounts are experienced. As before, whether these differences are real or reflect record-keeping issues is not clear.
Table 9 also illustrates that there is marked variation in the mix of insurance and other recoveries across event types. Insurance recoveries tend to dominate the Employment Practices and Workplace Safety and Damage to Physical Assets event types (and insurance recovery rates for these event types are also strikingly higher than the average for the sample as a whole), while other recoveries tend to dominate for the remaining event types. Internal Fraud, in particular, has an other recovery response rate of more than 27 percent, nearly triple the rate for the sample as a whole. Several of the event types – Clients, Products, and Business Services; Business Disruption and System Failure; and Execution, Delivery and Process Management – reported none to very few insurance recoveries.
The information in Tables 8 and 9 reflects recovery response rates for all the loss events pooled across the sample banks. In contrast, Table 10 reports information on the distribution of recovery response rates by individual banks. In particular, we calculate the share of individual loss events with non-zero, non-missing insurance and/or other recoveries for each bank in the sample. The table reports the number of banks with recovery response rates in various ranges. The majority of banks reported very few individual loss events with non-zero, non-missing insurance or other recoveries. Half the sample had recovery response rates ranging between 0 and 10 percent, while another seven had response rates between 10 and
9 Since the Retail Banking business line represents about two-thirds of the observations in the sample, it is not
surprising that the results for the sample as a whole mirror those for this business line.

18
30 percent. Again, it is difficult to determine whether the variation in response rates across banks reflects true differences in recovery experience or differences in the availability of recovery data.
Table 10 Percentage of Individual Loss Events With Non-Zero Reported Recoveries
Distribution Across the Sample Banks
Percentage of Individual Loss Events with Non-Zero Total Recoveries
Number of Sample Banks
0% – 10% 15
10% - 20% 4
20% - 30% 3
30% - 40% 4
More then 40% 2
Note: The percentages equal the number of loss events with non-zero reported insurance recoveries or other recoveries divided by the total number of individual loss events.
The data presented in Tables 8 to 10 involve the number of individual loss events for which the bank reported non-zero, non-missing recovery information. Focusing on the loss events where positive recovery amounts were reported, Table 11 presents information concerning the share of gross loss amounts recovered. That is, conditional on a loss event having a non-zero, non-missing insurance or other recovery amount, Table 11 reports the average ratio of recoveries to gross loss amount (the “conditional recovery rate”). These figures should not be interpreted as the average recovery rate for the sample of loss events as a whole because they omit those loss events where no recovery occurred (as discussed above, the flaw in the QIS sample design makes it nearly impossible to calculate such figures due to the inability to interpret “zero” versus “missing” responses). Instead, these figures should be interpreted as the average amount recovered given that some amount was recovered.10
As the first row of Table 11 illustrates, the average conditional recovery rate for the individual losses in the QIS2–Tranche 2 sample was just over 80 percent. That is, given that a recovery occurred, the bank recovered €80 for every €100 in gross loss amount. This recovery rate does not vary significantly between insurance and other recoveries.
10 For a very few observations in the sample, the conditional recovery rate exceeded 100 percent, suggesting
that the bank collected more in recoveries than was initially lost. These observations could represent coding errors, or could reflect some particular circumstances associated with given loss events. In one case, the reported recovery amount was more than 100 times the initial gross loss amount. Since this observation tended to distort the averages, it was omitted from the tables discussed in the text.

19
Table 11
Conditional Recovery Rates by Gross Loss Amount
Gross Loss Amount Total Recovery Rate Insurance Recovery Rate
Other Recovery Rate
All Loss Events 81.6% 82.2% 81.4% Loss Events by Year of Occurrence
1998 84.3% 86.1% 86.2% 1999 77.4% 82.2% 74.2% 2000 83.8% 78.9% 84.8% Loss Events by Gross Loss Amount (Thousands of Euros)
0 – 10 89.8% 85.8% 91.0% 10 – 50 80.2% 83.0% 79.5% 50 – 100 64.3% 79.0% 61.5% 100 – 500 67.5% 64.6% 67.8% 500 – 1,000 62.4% 67.5% 61.7% Greater than 1,000 63.3% 55.8% 64.8%
Note: The total recovery rate is calculated as the sum of insurance and other recoveries for each loss event divided by the gross loss amount for that event, given that the event had a non-zero recovery. The insurance and other recovery rates are calculated as the amount of insurance or other recovery divided by the gross loss amount for each event, given that the event had a non-zero insurance or other recovery. Thus, the figures should be interpreted as the share of gross loss recovered given that some recovery occurred. The overall and gross loss size category figures are unweighted averages of the individual loss events in each category.
As the second panel of Table 11 illustrates, there is somewhat mixed evidence concerning the variation in conditional recovery rate according to the year of the loss event. One might have expected a decline in conditional recovery rates over time if, for instance, there was a significant time lag between the date the loss event was recognised by the bank and the time that the bank collected the recovery amount, either from insurance or through other means. In that event, the recovery rates for 2000 might have been expected to be lower than those for 1998 and 1999. Insurance recovery rates do exhibit this pattern to some degree, with conditional recovery rates falling from 86.1 percent in 1998 to 78.9 percent in 2000. However, there is little evidence of this pattern for other recoveries or for recoveries in total.
This finding could either be because there is not a significant time lag involved in realising recovery amounts, or because banks reported recovery amounts only for those loss events where the recovery was (relatively) complete. Differences over time in the share of loss events with non-zero, non-missing recovery information provide some limited support for the latter interpretation. The total recovery response rate falls from 13.4 percent for 1998 loss events to 11.0 percent for 2000 loss events, with the decline resulting both from falls in the rate of insurance and other recoveries. The response rate for insurance recoveries falls from 2.9 percent in 1998 to 1.8 percent in 2000, while the response rate for other recoveries falls from 10.5 percent to 9.2 percent over the same period.
The bottom panel of Table 11 reports recovery rates by gross loss amount. Interestingly, conditional recovery rates tend to fall as gross loss amounts rise, with rates in the range of 90 percent for gross loss amounts under €10,000 falling to about 60 percent for gross loss amounts above €1 million. Conditional recovery rates for both insurance and other recoveries fall into this pattern, with lower conditional recovery rates for higher gross loss amounts.

20
Taken together with the results reported in Table 8, these figures suggest that although the likelihood of a loss event experiencing a positive recovery rises as the gross loss amount increases, the portion of losses recovered is lower.
Table 12 presents conditional recovery rates across business lines and event types. As with the results for recovery response rates, there is some variation in the share of gross loss amounts recovered across these different categories, particularly when insurance recoveries and other recoveries are considered separately. For instance, in the business line breakdown, total conditional recovery rates range from 60 percent (for Asset Management and Payment and Settlement) to over 95 percent (for Corporate Finance). The variation in other recovery rates is particularly pronounced, from 97 percent in Corporate Finance to less than 40 percent for Agency and Custody. As with the recovery response rates, these differences do not appear to be explained solely by variation in average gross loss amounts (the final column of the table), suggesting that there could be some meaningful differences in recovery experience across business lines (subject to all the caveats discussed above).
In contrast to the results for recovery response rates, differences across event types do not appear to be significantly more marked than differences across business lines. Total recovery rates range between 55 percent (for Clients, Products, and Business Services) to more than 90 percent for Internal Fraud, Business Disruption and System Failure, and Execution, Delivery and Process Management. Variation across event types for insurance recoveries is somewhat stronger, however, ranging between a low of 43 percent for Internal Fraud to a high of more than 95 percent for Execution, Delivery and Process Management.

21
Table 12 Conditional Recovery Rates
Distribution Across Business Lines and Event Types
Total Recoveries
Insurance Recoveries
Other Recoveries
Average Gross Loss Amount
(€1000s)
Business Lines Corporate Finance 96.3% 95.4% 97.1% 2,426
Trading & Sales 67.5% 83.5% 65.4% 374
Retail Banking 81.8% 80.2% 82.2% 56 Commercial
Banking 85.8% 86.0% 85.5% 166
Payment & Settlement 60.5% 100.0% 58.8% 66
Agency & Custody 73.5% 86.5% 38.1% 120
Asset Management 60.9% 78.0% 48.6% 127
Retail Brokerage 76.7% 92.7% 70.0% 51
Event Types Internal Fraud 94.4% 43.4% 97.1% 375 External Fraud 67.3% 87.2% 64.4% 53 Employment Practices & Workplace
Safety 83.2% 83.3% 78.5% 103
Clients, Products, &
Business Services
55.5% 60.0% 55.4% 412
Damage to Physical Assets 76.1% 79.4% 48.8% 65
Business Disruption &
System Failure 93.5% N/A 93.5% 15
Execution, Delivery & Process
Management 92.4% 95.8% 92.3% 79
Note: The total recovery rate is calculated as the sum of insurance and other recoveries for each loss event divided by the gross loss amount for that event, given that the event had a non-zero recovery. The insurance and other recovery rates are calculated as the amount of insurance or other recovery divided by the gross loss amount for each event, given that the event had a non-zero insurance or other recovery.

22
III. Lessons Learned from the Quantitative Impact Survey Exercises
Based on the results described above and the experience of the RMG in working on both tranches of the QIS2 exercise for operational risk, this section contains some thoughts on the lessons learned during these exercises. The focus is on how any future QIS exercises might be improved, both to make them less burdensome for the participating banks and for the RMG in working with the submitted data, and to enhance the value of the information received through the exercise. In this regard, this section reviews both the process of collecting these data and the actual data collected with the hope of identifying improvements that could be made in structuring any future rounds of QIS data requests on operational risk. The RMG welcomes feedback from the banking industry and other interested parties on any of the issues described below.
In considering the issues raised in this section, it is important to note that the focus of any future QIS exercises for operational risk has not yet been determined, nor has the scope of data to be requested – which might, for instance, include some or all of internal capital allocation information, exposure indicators, or loss event information – been decided upon. Thus, depending upon the objectives established by the RMG for any future QIS data requests, the particular data items requested may not encompass the full range of data items discussed below. Indeed, a key motivation for including this section of the paper is to generate feedback and discussion with industry participants on the best way to approach any future QIS requests for operational risk. Therefore, it would be inappropriate to draw firm conclusions concerning the likely structure and scope of future QIS exercises based on the issues raised below.
Process Issues A. Standardise Format The two tranches of the QIS2 exercise for operational risk asked banks to submit data using somewhat different formats. For QIS2-Tranche 1, banks were asked to submit data in a standardised Excel spreadsheet. In practice, most of the banks submitting data used the standardised spreadsheet, though some made additions or alterations to the format. For QIS2–Tranche 2, banks were provided with an Access database for submitting the requested information. Use of this database proved to be difficult for many institutions, and the data submitted were divided between the standardised Access database, customised Access databases, and customised Excel spreadsheets. The response format seemed to be dictated in large part by internal system considerations, and to some extent by the need to improvise when the data available were not consistent with the format assumed in the standardised Access database. For both parts of the survey, the RMG spent considerable time and effort simply compiling the submitted data into a consistent format across institutions.
Based on the RMG’s experience in the two surveys, the benefits of using a standardised format for collecting the data seem clear. A standardised Excel spreadsheet seemed the more successful format – both in terms of banks’ ability to work with the spreadsheet and the RMG’s ability to work with the resulting submissions – and should probably be used in any future data collection efforts. That said, the ease of use would be greatly enhanced if the spreadsheet were designed in a structured way and banks were instructed not to alter the format. The RMG’s experience was that even minor alterations made automated compilation of the data impossible and greatly increased the need for time-consuming hand input of data.

23
B. More Direction on Standardised Inputs A significant part of the data clean-up and reconciliation process for both tranches of the QIS2 exercise involved first determining the units and measures in which various data items were reported and then converting them to a common set of standards. This process was both time-consuming and error-prone. Thus, in future QIS exercises, banks could be given much more explicit instructions about the form in which the data should be submitted. For instance:
�� Units: In both tranches of QIS2 submissions, there was often significant ambiguity about the units in which the reported data were being expressed (thousands, millions, or billions of the reporting currency). In future surveys, the RMG will consider instructing banks to report all data in standardised units specified as part of the survey (eg thousands of the reporting currency) that, ideally, would not vary across different parts of the survey. The RMG will also consider specifying the units for non-monetary variables, such as number of accounts and number of employees. This would significantly shorten data clean-up efforts and remove uncertainty about the interpretation of the data.
�� Flow data: On a related issue, the RMG will consider providing explicit instructions to participating banks about how to report quarterly “flow” data such as gross income, number of trades, compensation paid, etc. Specifically, the RMG could provide specific instructions as to whether these amounts should be reported at a quarterly or annual rate and whether they should be quarter-by-quarter or cumulative over the year. Banks could be asked to indicate whether they are reporting on the basis of calendar or fiscal quarters, and, if the latter, the date of their fiscal year-end. At the same time, instructions could be provided to the banks about what to do if they cannot provide these data in precisely the format requested. For instance, if banks have annual gross income data, but cannot break them up quarter-by-quarter, should they report a single figure in the fourth quarter (and, if so, should they fill the remaining quarters with zeros, blanks, or N/A?), break the data up into four equal shares and report one in each quarter, or use some other alternative? Consistent treatment would greatly simplify data clean-up efforts.
�� Zeros and missing data: The RMG will consider providing banks with specific instructions about how to deal with missing data. That is, should missing data items be left blank, coded as “0”, coded as “N/A” or “.”, or receive some other treatment? Particularly in the QIS2–Tranche 2, the lack of standardisation in the treatment of missing data rendered some parts of the data submission – specifically, those dealing with insurance and other recoveries – very difficult to interpret. One approach would be to instruct banks to code missing data as blank and to enter a “0” only if the data value is really zero (for instance, in the insurance recovery case, if the bank does not know whether or not there was an insurance recovery, then the cell should be left blank; only if the bank knows that there was no recovery should it be coded as “0”).
�� Other data input issues: The RMG will consider giving the banks precise instructions on how to report data that could potentially be interpreted as having negative values. For instance, some banks entered losses as negative numbers and recoveries as positive ones, while others did the opposite. Since the context for these numbers is clear, both should be entered as positive values. Similarly, the RMG will consider specifying how percentage values are to be reported: as percentages (eg 10% or 17.2%) or decimals (0.10 or 0.172).

24
C. Fact Sheets In the QIS2–Tranche 2, the RMG data clean-up teams completed “fact sheets” concerning each bank’s submission, trying to document information such as the reporting currency, units of the data, whether it was comprehensive, whether the RMG’s standard business line/event type definitions were used, and other facts that were needed to help interpret the data. Although these facts sheets were extremely helpful, it was difficult and time-consuming to prepare them ex post. In the next round of the QIS, the RMG will consider asking the banks to complete these fact sheets along with their data submissions. Having banks fill out the fact sheets would be more efficient overall, and is likely to lead to more accurate qualitative information about the data.
D. Consistency Checks The data clean-up process also involved consistency checks. These checks consisted of tests such as comparing the sum of gross income by business line to the aggregate figures reported by the bank; matching risk weighted assets against minimum regulatory capital; comparing tier 1 & tier 2 capital with minimum regulatory capital; checking economic capital data for internal consistency; comparing the sum of individual losses in a given quarter to the quarterly aggregate figures reported; and checking whether recoveries exceeded gross loss amounts for any individual loss events. In the next round of the QIS, the RMG will consider including macros for some of these consistency checks as part of the standardised spreadsheets given to banks, and asking them to run them and report the results, along with an explanation. This would likely save both the banks and the RMG time in subsequent clean up efforts by allowing banks to catch mistakes in entering the data. It would also provide the RMG with information about the data submission (for instance, the reasons why business line-level gross income differs from the aggregate or quarterly losses differ from the sum of individual losses). However, the RMG will have to examine the cost/benefit of such an approach in terms of whether reliable macros could be developed and how complicated they would be for the banks to use. Alternatively, the RMG could include questions on the fact sheet about these issues, which would allow us to gather information about the data submission (although not prevent mistakes in data entry).
Data Issues A. Economic Capital One of the key criticisms of the work done with the economic capital data collected in the QIS2–Tranche 1 was that the figures were not consistent across banks. While some variation across banks is almost certainly inevitable, the RMG will consider whether there are ways of posing any future data requests for internal economic capital figures that would reduce this variation. One potential approach would be to ask the banks to submit economic capital figures based on a common supervisory standard (eg one-year, 99.9th percentile). If a bank is unable to do so, then it could be asked to provide information concerning what soundness standard the figures are designed to meet (if any).
B. Thresholds In requesting loss data (especially individual losses), the RMG will be clearer about the minimum reporting threshold to be used. This is not so much a question as to what particular value for the threshold(s) should be used, but rather providing some clarity about exactly how the threshold should be interpreted. The instructions should be clearer, for instance, about the currency associated with the threshold as well as the value amount (eg that the threshold is €10,000 or $10,000, or whatever is eventually selected). Further, the instructions should

25
clarify whether the threshold applies to gross loss amounts or to some other value (eg net loss amount after recoveries).
C Insurance and Other Recoveries An important issue in the analysis above concerns the completeness of the insurance and other recovery data in terms of whether all anticipated recoveries have been received at the time of the data collection process. Because of these factors, in addition to asking about insurance and other recovery amounts, the RMG is considering adding a data field asking whether all possible recoveries have yet been received. That is, if a bank were in the process of trying to recover under an insurance contract, it might be anticipating recoveries that are not reflected in the recovery information provided. On a related matter, the RMG will also clarify whether the recovery amounts reported should be actual recoveries already received, or whether they can/should include any anticipated future recoveries. Similarly, some guidance will be provided on how to report loss information if the recovery is nearly simultaneous with the loss (some banks may choose to omit these losses as “non-events” when the RMG would probably like to have them included).
Finally, in the event that the bank has not yet received the full recovery amount, the RMG will provide guidance concerning how future recoveries are to be reported (if at all). For example, suppose a bank experienced a loss in the second half of a year (say, 2001). Presumably that loss event would be included in the data collected for 2001. However, now suppose that it did not receive recoveries on that loss event until the end of 2002. How should the bank report that information? Should it report just the information available as of the end of 2001 in the 2001 data submission and ignore the recovery in the information provided in the 2002 submission? Repeat the 2001 loss event observation in the 2002 data, now with full recovery information? Or just provide the marginal recovery information for 2002, without reference to the underlying 2001 loss event? The same questions apply to the quarterly aggregate loss information: should those data reflect recoveries associated with losses that occurred in that quarter, or all recoveries received in that quarter, regardless of when the loss occurred? Consultation with the banking industry and other interested parties will be particularly helpful in establishing the best approach to this issue.
D. Double Counting The QIS2–Tranche 2 exercise asked banks to identify those individual loss events that were also included as losses in databases concerning credit or market risk, along with an indication of the percent of the gross loss amount that was double-counted. There was an extremely low, almost negligible, response rate on these data items, suggesting that the RMG should reconsider how the question is being asked to see if it can be structured to generate more information in future surveys. Such information would be particularly useful since a number of banks expressed concerns about double-counting in their comment letters on the September 2001 “Working Paper on the Regulatory Treatment of Operational Risk”, but the QIS2–Tranche 2 data shed little light on the extent to which this is problematic. Once again, consultation with the banking industry and other interested parties would be helpful.
E Review Data Requested The RMG will review the two QIS2 survey tranches to see if there are any data items that could be dropped in future surveys. Possible candidates include information on loss effect types (which was optional in QIS2–Tranche 2, but which added significant complexity and bulk to the data survey). The RMG will also review the various exposure indicators requested to see if there are any that could be dropped or any that should be added.

26
F. Clarifications of Definitions The RMG will re-examine the definitions of the eight standardised business lines in light of feedback received from the participating banks and other interested parties. It might also consider providing additional guidance concerning centralised operations and profit centres that do not map neatly into specific business lines.
G. Other Information The RMG will consider whether it would be worthwhile expanding the questions asked on the fact sheet to cover information about the institution itself (eg significant mergers, de-mergers, shifts in business focus, more data about the institution’s overall asset size) or about the methodology used to collect loss data and/or to calculate economic capital. In the latter case, for instance, the RMG might consider asking more structured questions concerning economic capital methodologies, rather than the open-ended question contained in the QIS2–Tranche 1 exercise.
H. More Detail on Loss Events Another refinement to the survey that might enhance the usefulness of the data, depending on the ultimate goals of the exercise, would be to consider asking banks to provide more detail about the nature of the individual loss events reported. Some of this information could be relatively factual, such as the country in which the loss event occurred or a more precise date of occurrence (rather than just the quarter). In addition, instead of a brief optional description of the event, would it be worthwhile to require this information, at least for events with relatively large gross loss amounts? What would the likely response rate to such a request be and how difficult would it be to work with information that, by its nature, could not really be standardised? Clearly, a cost/benefit analysis of such an approach would be necessary, as would further discussions with the banking industry.