the power of design - designskolen kolding · the power of design-contents 03 058-063-my cartooni...
TRANSCRIPT

THE PO
WER
OF D
ESIGN
Kolding School of D
esign

01
boeksketch-03.indd 1 9/6/12 10:37 AM

004
010
034
046
058
076
084
090
@
02 THE POWER OF DESIGN-CONTENTS
004-005- Introduction by Elsebeth Gerner Nielsen006-008- Power of Data Visualisation by PhD Pia Pedersen
010-015- The Bill app - The Feel BillPernille Frost Andersen-Nanna Rosalia Sigaard-Christina Charlotte
Rasmussen
016-021- Your Foot PrintLine Marcussen Simonsen
022-027- The TRE-FOR TreeMarilyn Sonneveld
028-033- In Your Face Line Monthiers
034-039- STRØM (Electricity)Anne-Mette Wind Jeppesen - Rune Magelund Alexandersen - Signe-Lil
Valkvæ - Lasse van den Bosch Christensen - Nynne Nadja Boje Sander
040-045- My TRE-FORSøren Siebuhr - Carl Fredrik Angell - Sveinung Sudbø
046-051- The Three CashiersStine Rasmussen
052-057- The Club / The TestMaria Louise Osipowska - Silas Amdi - Sebastian Askari Schmidt
Martin Meincke Pedersen
preface
projects / web
projects / print
projects / film
boeksketch-03.indd 2 9/6/12 10:37 AM

004
010
034
046
058
076
084
090
@
03THE POWER OF DESIGN-CONTENTS
058-063- My Cartooni Smart HomeDenise Dyrvig C.Jørgensen - Birgitte Malling Eriksen -
Rolf Blume Jensen
064-069- 3D Holographic board gameDitte Ravn - Mette Fredsted Gram
070-075- The 10 Percent CampaignCamilla Rasmussen - Trine Løgstrup Sorensen - Maria Osk Jonsdottir
Maja Bæk Christoffersen - Alba Castelltort Vinallonga
084-089- Visual ConclusionLéon Kranenburg
090-091 - Acknowledgements092 Colophon
projects / mixed media
projects / ólafur haraldsson
visual conclusion
epilogue
076-083- We were asked for one solution, and came up with anotherÓlafur Haraldsson
boeksketch-03.indd 3 9/6/12 10:37 AM

INTRODUCTION
004
0504
Elsebeth Gerner NielsenRector,
Kolding School of Design
THE POWER OF DESIGN-ELSEBETH GERNER NIELSEN05
boeksketch-03.indd 4 9/6/12 10:37 AM

05
INTRODUCTION
004
05
05
The Power of Design
How do we make people think seriously about their energy consumption? How is it possible to enhance consumer understanding of personal data and consumption in an exciting and engaging man-ner? How can TRE-FOR use data visualisation to communicate energy waste in a tangible way and thus create a stronger relationship to its customers? How can we communicate with the residents of the affordable housing unit Skovparken across language and cultural barriers and foster sustainable behaviour with regard to the use of electricity? These are just a fraction of many questions that have not only been asked but also answered by a group of 30 young communication designers and design managers. What triggered the questions was a request from TRE-FOR for a more appealing energy bill. The Department of Communication Design at Kolding School of Design decided to ask its students to show TRE-FOR the power of design; to ask questions, and to see if they were able to redefine the request thinking that perhaps the energy bill was not the real issue. Visiting faculty, researchers and employees from TRE-FOR stood by the students and offered advice and inspiration. Subsequently, Teacher and Interaction Designer Olafur Haraldsson reused the outcome of the student projects as a basis for creating artistic development workshops together with TRE-FOR. The outcome of these workshops together with a selection of student projects is dis-played in the present publication.
Kolding School of Design’s collaboration with TRE-FOR suggests a different path. TRE-FOR is committed to making our future energy supply a joint affair using design as a tool; TRE-FOR takes the lead by formulating energy models that inspire the consumers. Hopefully, design will play a signifi-cant role in successfully implementing the Danish government’s ambitious climate plan. Denmark has what it takes to become a pioneer country in the development of intelligent energy systems; of simple, comprehensible energy bills and electricity metres that involve and motivate the con sumer; of business models that give the consumer a whole new role as energy producer. Denmark can lead the way in designing solar cell panels and wind turbines that are functional and nice to look at. Let’s show you the power through powerful design!
It is an art to get the full effect from the words. In the same way it is an art to get the full effect from pictures. To make a picture is a more responsible work than to make a statement, because pictures make a greater effect and have a longer existence.
Otto Neurath, 1936
THE POWER OF DESIGN-ELSEBETH GERNER NIELSEN
boeksketch-03.indd 5 9/6/12 10:37 AM

THE POWEROF DATAVISUALISATION
006
06 THE POWER OF DATA VISUALISATION-PIA PEDERSEN
Pia PedersenPhD Candidate & Graphic Designer
05
boeksketch-03.indd 6 9/6/12 10:37 AM

THE POWEROF DATAVISUALISATION
006
05
07THE POWER OF DATA VISUALISATION-PIA PEDERSEN
Pia Pedersen, October 2011
Marie Neurath, 1974
“A rule should not be broken unless there is a good rea-son for it. And of course, often there is a good reason”
In 2011 a national multi-energy company TRE-FOR contacted Kolding School of Design (DSKD) requesting the creation of a more attractive design of the energy bill it sends to its customers. But was that really what the company needed?
The bill is the chief one-way communication between TRE-FOR and the consumer contai-ning information about each customer’s energy consumption. The conclusion of the collaboration between DSKD and TRE-FOR was that this is not just about changing colours or typefaces on a piece of paper – it’s about changing the relationship between TRE-FOR and the consumer, and also changing the consumer’s relationship and behavi-our towards energy and consumption of energy.
The way to approach this challenging task was through data visualisation, a powerful tool to clarify relationships and patterns; in this case data visua-lisation was supposed to enhance the consumer’s awareness and understanding of energy consump-tion. The project had numerous challenges for both partners: DSKD had to understand energy and the data behind it as well as TRE-FOR needed to understand the power of design and design at it’s best: making complex information comprehensible.
Data VisualisationData Visualisation, as the name implies, is the visual representation or presentation of data. Data can basically be everything given – facts or statis-tics collected for analysis or reference in the form of numbers, words or pictures. Visualising data is important because at its best it can motivate our reasoning about the displayed data and change our way of thinking and our behaviour. Visualising data can be compared to a photographer taking a picture. The photographer takes a picture of a precise moment in time. It is a picture of reality, but he chooses the angle and the content – who, where, how and so forth; he slightly retouches reality and reframes it. Data, likewise,
is a picture of reality, a measurement, but we can pick and choose from that reality. We can visualise the message we want to convey. It is visual com-munication. When you look at a picture, it seems simple and obvious: just press the shutter release button on the camera and take the picture – that can’t be that difficult! But the photographer has been through all kinds of considerations to actually take the picture that communicates what he wants it to communicate in an intelligible manner. When a picture seems obvious it is a good picture, but that doesn’t mean it was simple or obvious to take. And that is what is both so amazing and delicate about a good picture. The same applies to data visuali-sation. A key notion is you can only design your picture by understanding its content –”If you don’t understand it, don’t design it” – and you can only communicate in an effective way visually through an intense process of sketching and tracing the elements of the picture.
Isotype’s Notion of TransformationStudying the history of Data Visualisation provides knowledge and inspiration for the process of trans-forming data into an understandable picture. Otto Neurath (1882 – 1945) is one of the most impor-tant figures in this field. He understood the neces-sity of humanising statistics so that ordinary people had access to knowledge about, for example, society. In the 1920s Otto Neurath invented Isotype, a graphic language with pictograms, who-se purpose was to communicate in a universal and easily understandable manner. The design of the charts was completed through teamwork with very specific roles, one of which was transformation. The transformer was a person who functioned as a link between the expert and the artist by selecting, arranging and simplifying data into visual form. For more than 40 years Otto’s wife, Marie Neurath (1898 – 1986), was the principal transformer. Transformation should be in the vocabulary of graphic design today. The importance of presenting data, mainly statistics, in Isotype charts was that ordinary people could grasp and comprehend it. Irrelevant subjects were not hidden behind a
decorative façade, because the subject itself had to be interesting. Today the field of data visualisation is rapidly expanding. More and more data is produced and made accessible, and visualisation tools are democratized. New trends in data sharing and computing technology encourage more and more designers to take up the challenge of visualising data – although it is not a simple task, especially when it comes to making data visually accessible for the public. Here lies a danger, as the famous statistician Edward Tufte claims, of over-compres-sing and decorating data.
PreparationTo overcome the challenges of the TRE-FOR pro-ject the students received research-based keyno-tes on data visualisation and power, and keynotes on TRE-FOR and design. They were introduced to Marie Neurath’s transformations through a workshop with small transformation tasks, followed by a talk showing pictures of original unpublished sketches. This provided the students with tools for understanding and visualising data. Furthermore, a project at DSKD named DesignCamp2011 dealt with the “Use, Consumption and Visualisation of Electricity.” This Designcamp taught us, in brief, that we cannot expect to change our behaviour towards energy consumption when we do not have a feeling for or a relationship to energy. We simply do not have a “picture” of energy.
boeksketch-03.indd 7 9/6/12 10:37 AM

05
This is quite significant for this specific project. TRE-FOR helped us by giving several talks both at DSKD and at TRE-FOR, which was of great importance for our understanding and getting a feel for the company TRE-FOR. Finally the splendid works of interaction designer Ólafur Haraldsson, the Rotterdam-based design studio Léon & Loes, and graphic designer René Christoffer inspired the students to think outside the box, not only in 2D but also in 3D, and to be original and innovative by applying visualisation.
Thirteen Versatile OutputsThirteen very different and original outputs proved that the students actually used the preparative tools. The proof lies both in their design process where they conducted thorough surveys and ana-lyses, and in their concept developments. It showed in their way of cooperating across fields, between design managers and designers, and also in their way of being unafraid of asking questions, con-tacting consumers and digging into the hard-core data. Lastly, it showed in the versatile outputs: data visualisations in the form of sound; a campaign containing the one important number – 10%; strong visual metaphors based on our face and body; games and movies with play and narrative-based learning … all of which is presented in this publi-cation. The students’ designs did indeed go further than changing the colour and lengths of a bar chart. By choosing an approach involving an analysis of both the data and the receiver of this data, and wor-king together in mixed teams of design managers and designers, they shed new light on the company TRE-FOR through the power of data visualisation. Today, thanks to these projects, we actually have a picture of energy.
Literature references:Kinross, Robin & Neurath, Marie (2009) The Transformer: Principles of Making Isotype Charts, Hyphen Press. Klanten, R. (2010) Data Flow 2: Visualizing Infor-mation in Graphic Design, Die Gestalten Verlag. Neurath, Marie (1974) Isotype, Instructional Science 3, pp. 127-150. Neurath,Marie (1960) The Origin and Theory of Isotype, Year Book of Education, pp. 112-120.Neurath, Otto (1936) International Picture Language, London.Tufte, Edward R. (1997) Visual Explanations, Graphics Press USA.
Details should only be added where they
convey meaning.
Marie Neurath, 1960
THE POWER OF DATA VISUALISATION-PIA PEDERSEN08
PROJECTS
05
boeksketch-03.indd 8 9/6/12 10:37 AM

05THE POWER OF DATA VISUALISATION-PIA PEDERSEN
PROJECTS
05THE PROJECTS 09
boeksketch-03.indd 9 9/6/12 10:37 AM

The BILL APP/The Feel BIll
010@
10
We have chosen to present the data by means of an application, a (unisex) figure we call Bill.
Bill has a body, and his various organs act as me-taphors which each symbolizes the different parts of the organism and what that organism consumes.
The reason we have chosen to use the human body as an image of energy consumption is that we want to create a parallel between the user and his or her energy consumption and the energy used in the purification system in the body. We find it easier to connect with the body because it is the closest
we can get to ourselves and hence get energy consumption “under the skin” and feel it.Our intent is to visualise this system for the indivi-dual consumer so he/she can see the effect as it is happening. For instance, when you use the faucet or the toilet the application registers the actions and immediately shows the consumption of water.
The consumer has the opportunity to investigate the application more thoroughly and seek informa-tion about energy consumption and other relevant facts by touching different parts of Bill´s body.
How can we use data visualisation to design an application that shows the consumer´s energy consumption within the household in a more comprehensible way?
Pernille Frost AndersenNanna Rosalia SigaardChristina Charlotte Rasmussen
THE BILL APP-THE FEEL BILL
boeksketch-03.indd 10 9/6/12 10:37 AM

11THE BILL APP-THE FEEL BILL
The BILL APP/The Feel BIll
010@
THE BILL APP-THE FEEL BILL
boeksketch-03.indd 11 9/6/12 10:37 AM

12 THE BILL APP-THE FEEL BILL-PROCESS
boeksketch-03.indd 12 9/6/12 10:38 AM

THE BILL APP-THE FEEL BILL-CONCEPT
Subject and description – The Bill app – Feel Bill
The subject is about visualising data in different forms, from different points of view and representing the final visualisations for TRE-FOR and thereby giving TRE-FOR the opportunity to see data transformed and visualised through other media than an electric bill.
We have chosen to make an application for smartphone users but it could also be used as a private profile on the www.trefor.dk that you can log in to. The application is connected to the meter in the house and registers the household’s consumption of electricity, heat and water.
The meter sends data to the Bill application so the users can monitor their usage of energy. We have chosen to present data through an application figure Bill (unisex figure). Bill represents the body and the organs which we have redesigned into different metaphors which each symbolise the organs and the consumption.
We have chosen to use the human body because we want to create a connection between the user and his/her energy consumption by projecting the energy usage to the purification system in the body. We find it easier to connect with the body because it is the closest we can get to ourselves and really get the energy consumption under the skin and feel it. We want to make this system visible for the consumers so they can see the effect when it takes place.
For instance when you use the faucet or the toilet, the application registers the actions and immediately shows the consumption. The consumer has the opportunity to investigate the application more thoroughly and seek information about his/her consumption and other relevant facts by touching different parts on Bill’s body. This application could be linked together with TRE-FOR’s smart home system and be the character or figure in the smart grid/ TRE-FOR universe.
Further on this application can be customised by or to the consumer so Bill could change looks or name in many different themes.
Problem statementUsing data visualisation how are we able to design an application that shows the consumer’s energy consumption in a more understandable way when it takes place in the household?
PurposeThe overall purpose with this project is to transform data into visualisations that can provide TRE-FOR with new opportunities, ideas and tools within the field of communication design.Our main purpose with the Bill application is to create awareness about energy usage and get the consumer to interact using this application that could serve as a replacement for the current electrical bill.
GoalWe have designed a concept for the application and want to show the application in an analogue design installation by making small movies showing the touch points in the application as metaphors. By using film in the installation we want to show the movements and how we think that the application should work in reality on your phone.
Knowledge-related basisCompany trip to TRE-FOR, Power-days seminars and historical seminars about data visualisation.
Time schedule for the project and methodThe project took place during a period of four weeks at the Kolding School of Design. The project was divided into four phases:- Research: Brainstorming and sketching (2D)- Experiments: Concept development and mock-ups. -Visualisations: Testing, mock-ups and further development of the design installation and application.- Working on the final result: Final finishes of the installation, application and presentation
Reference listTRE-FOR’s homepage www.trefor.dk, material from TRE-FOR seminar and “The human body, image and emotion” by Philippe Comar, “Videnskabens verden, mennesket” by Dr. Bernard Dizon and “The body, life science library” by Alan E. Nourse.
Reflections- Process: In retrospect, this predefined assignment by TRE-FOR was challenging, because it was a wide or open subject. Therefore, we could not delineate our approach to the subject and define a problem we could solve through design and data visualisation. The start of the process had its difficulties; forinstance, which data should we use and also which
were relevant for TRE-FOR to communicate to their consumers? We had a lot of ideas but no concrete concept though we knew that we wanted to show consumption and we wanted to integrate the human body.
Designer vs. Design manager: The relationship between the designers and the design manager was characterised by many contrasts like different approaches to how to solve the problem of data visualisation and the problem of communicating through design in the way that TRE-FOR is represented in the final solution. In the start of the process the designers think out-side-in by starting with thinking out of the box, abstract and broad, versus the design manager who thinks more on behalf of the company with an in-side-out approach.Another contrast is the practical versus the theoretical approaches. By having these different approaches we experienced that throughout the process we challenged each other on different levels. By teaming up in different groups comprising both designers and design manager, synergy occurs in an interdisciplinary cooperation which embraces different design approaches and thereby insures that the problem/subject will be closely studied from different angles.
13
boeksketch-03.indd 13 9/6/12 10:38 AM

14 THE BILL APP-THE FEEL BILL
boeksketch-03.indd 14 9/6/12 10:38 AM

15THE BILL APP-THE FEEL BILL
boeksketch-03.indd 15 9/6/12 10:38 AM

16
YoUR FOOTPRINT
016@
YOUR FOOT PRINT16
I want people to be more personally involved in their consumption of electricity. Hence I have chosen to use the foot print as a metaphor for taking a stand in relation to electricity. There is a lot of personal data associated with a foot print, and all consumers will leave their own indivi-dual foot print based on their consumption.
We must consider our consumption of electri-city for the sake of the environment and ultima-tely our continued existence on this planet. If we all decided to make even a small effort to save electricity it would have a huge impact on the environment and on carbon emissions.
People need not lower their standard of living and sit in dark rooms in order to save electricity, but by making a few important modifications to our life style we can all effect a tremendous change!
How do I make people think seriously about their energy consumption?
Line Marcussen Simonsen
boeksketch-03.indd 16 9/6/12 10:38 AM

17YOUR FOOT PRINT
YoUR FOOTPRINT
016@
boeksketch-03.indd 17 9/6/12 10:38 AM

18 YOUR FOOT PRINT18
boeksketch-03.indd 18 9/6/12 10:38 AM

19YOUR FOOT PRINT 19
boeksketch-03.indd 19 9/6/12 10:38 AM

20 YOUR FOOT PRINT
boeksketch-03.indd 20 9/6/12 10:38 AM

21YOUR FOOT PRINT
DIT AFTRYK
1 3 5 8 77
4 ,
Dag Uge Måned
Abonnoment EL-NetTransportbetalingOffentlige forpligtelserElafgiftDistributionsbidragEnergispareafgiftMoms 25% af 433,66I alt TRE-FOR El-net A/S
Abonomment El-forsyningBasis elBalancegebyr til Energinet.dkMoms 25% af 178,25Ialt TRE-FOR Energi A/S
Aconto i alt el
1 stk á 79,6493 kr.375 kWh á 0,1380 kr.375 kWh á 0,0850 kr.375 kWh á 0,6190 kr.375 kWh á 0,0400 kr.375 kWh á 0,0620 kr.
1 stk. á 25,2055 kr.375 kWh á 0,4074 kr. 375 kWh á 0,0007 kr.
79,65 kr.51,75 kr.31,88 kr.232,13 kr.15,00 kr23,25 kr.108,42 kr.542,08 kr.
25,21 kr.152,78 kr.0,26 kr.44,56 kr.222,81 kr.
754,89 kr.
Sådan er acontoraten beregnet for perioden 01.07.2010 - 30.09.2010
Du kan følge dit personlige aftryk online og på smartphone ved at gå ind på dette link: www.tre-for.dk/ditaftryk
1 4 5 8 6,
DIT AFTRYK
boeksketch-03.indd 21 9/6/12 10:38 AM

22
the TRE-FORtREE
022@
22
One of the most important factors affecting the environment is energy consumption. People use far too much energy, and they are unaware of the consequences of their energy behaviour.
My idea is to create a mechanism, a symbol through which consumers can check their energy consumption and its effect on the environment.
I have chosen a tree to symbolize and react to energy behaviour. If you use a lot of energy the three will look withered and unhealthy; if you use less energy the tree is thriving, full of fruits or colour. Additional symbols are represented by a heater, a tap and a plug point. If you use a lot of
water then more taps will appear on in the tree, and if you use a lot of electricity then there will be more plug points in the tree. You can see the tree in the four seasons and compare how much more energy you use in the winter than in the spring.
If you wish, you can check your tree every day and see the differences on a daily basis.The programme will save all of your trees, from each single day. For example, you can go back and check your tree in February 2009 and see if you have become a better consumer (i.e. consume less energy). Or if you want, you can see how much energy you consumed on a Saturday in 2010.The date is given under the tree.
My basic premise is that people have to take better care of the environment.
Marilyn Sonneveld
THE TRE-FOR TREE
boeksketch-03.indd 22 9/6/12 10:38 AM

23THE TRE-FOR TREE
the TRE-FORtREE
022@
boeksketch-03.indd 23 9/6/12 10:38 AM

24 THE TRE-FOR TREE24
boeksketch-03.indd 24 9/6/12 10:39 AM

25THE TRE-FOR TREE
boeksketch-03.indd 25 9/6/12 10:39 AM

26 THE TRE-FOR TREE
boeksketch-03.indd 26 9/6/12 10:39 AM

27THE TRE-FOR TREE
boeksketch-03.indd 27 9/6/12 10:39 AM

28
IN YOUR FACE
028@
28
People use energy excessively, but they don’t really pay much attention. One bill, one big number, they have no idea what they are paying for.
How can we make those numbers speak? How can we make people listen to them? The point here is to create a strong link, a dialogue between people and their own consumption, make them aware, to make them want to change their behaviour.
What if the data could be directly reflected in your face? The more you consume, the more contorted your face would be. Just upload your picture i.d. and get your face pimped. I was interested in making
a more experimental project, to ask the question: scary or funny? To see how far I could go, how closely I could make it work with the data.
Would you change your behaviour after seeing how monstrous you look?
How do you make people care about their energy consumption?
Line Monthiers
IN YOUR FACE
boeksketch-03.indd 28 9/6/12 10:39 AM

29IN YOUR FACE 29
IN YOUR FACE
028@
boeksketch-03.indd 29 9/6/12 10:39 AM

IN YOUR FACE
Visualisation of Data
How to upset people about their own consumption ?People make excess, but they can’t feel it. One bill, one large figure, no idea of what the total corresponds to. How to make those numbers speak? How to make people listen to them? The point is to create a strong link, a dialogue between people and their own consumption; to make them aware and to make them able to change. TRE-FOR offers everybody the possibility to follow their consumption on a daily basis thanks to the “smart-meter”. It enables you to control each machine in your house, to see how much electricity it uses, in real time.
One of the considerations was to enhance this new idea of data always evolving, day by day, at human scale, encouraging immediate-action. Another consideration was to find a real way to reach people, to concretise electricity, water, warm, always there, so “fixed”, so easy to turn on and off, but ignoring the invisible consequences.
What if the data would directly affect your face? The more consumption, the more distortion. Just upload your id picture and get your face pimped. I was interested in making a more experimental project; to ask the question: scary or funny? To see how far I could go to make it work with the data.
The whole reflection is based on the strong example of a photo booth, which I myself never become tired of, with its different possibilities and the power to make people laugh by deciding a new face for them. Bill Viola, Alain Fleischer and Nam June Paik also made interesting works involving face and distortion. It was important to do a lot of research to come up with the strongest ways to visualise data on the face: photo montage, collage, scanner, slit-scan, 3D, and creating bugs on faceresearch.org. Then link the different deformations with data.
The system had to be upsetting but also very clear and understandable for everybody. So, the face is simply cut in seven slices, one for each day of the week, and the excesses affect the picture in different ways so you do not get bored. Flat or 3D, slices, stairs, “pie graphic”, ... Then the face becomes a map, showing different criteria, spreading, evolving, making data concrete. This would be used for an application or a personal page on the website.
30
boeksketch-03.indd 30 9/6/12 10:39 AM

31IN YOUR FACE
To keep this idea of personal space, everybody would be invited to customise the colours of graphics elements. Th en explanations would help you to save electricity, showing which objects consume the most and how you can reduce it.
“Words make divi-sion, pictures make connection”.
Otto Neurath, 1936
boeksketch-03.indd 31 9/6/12 10:39 AM

32 IN YOUR FACE
we
ek
31
mon. 28
mon. 28
tues. 29
tues. 29
wed. 30
wed. 30
thur. 31
thur. 31
fri. 01
fri. 01
sun. 03
sun. 03
we
ek
30
we
ek
30
sat. 02
sat. 02
fri. 25
fri. 25
fri. 25
sat. 26
sat. 26
sat. 26
sat. 26
sat. 26
sat. 26
sun. 27
sun. 27
sun. 27
sun. 27
sun. 27
sun. 27
mon. 28
mon. 28
mon. 28
mon. 28
mon. 28
mon. 28
mon. 28
mon. 28
tues. 29
tues. 29
tues. 29
tues. 29
tues. 29
tues. 29
tues. 29
tues. 29
wed. 30
wed. 30
wed. 30
wed. 30
wed. 30
wed. 30
wed. 30
wed. 30
thur. 31
thur. 31
thur. 31
thur. 31
thur. 31
thur. 31
thur. 31
thur. 31fri. 01
fri. 01
fri. 01
fri. 01
fri. 01
fri. 01
fri. 01
fri. 01
sat. 02
sat. 02
sat. 02
sat. 02
sat. 02
sat. 02
sat. 02
sat. 02
sun. 03
sun. 03
sun. 03
sun. 03
sun. 03
sun. 03
sun. 03
sun. 03
we
ek
27
we
ek
27
we
ek
27
we
ek
27
we
ek
27
we
ek
27
we
ek
27
we
ek
27
sat. 26
sat. 26
sat. 26
sat. 26
sat. 26
sat. 26
sun. 27
sun. 27
sun. 27
sun. 27
sun. 27
sun. 27
we
ek
31
we
ek
31
we
ek
31
mon. 21
mon. 21
mon. 21
mon. 21
mon. 21
mon. 21
tues. 22
tues. 22
tues. 22
tues. 22
tues. 22
tues. 22
wed. 23
wed. 23
wed. 23
wed. 23
wed. 23
wed. 23
thur. 24
thur. 24
thur. 24
thur. 24
thur. 24
thur. 24
fri. 25
fri. 25
fri. 25
fri. 25
fri. 25
fri. 25
mon. 21
mon. 21
mon. 21
mon. 21
mon. 21
mon. 21
tues. 22
tues. 22
tues. 22
tues. 22
tues. 22
tues. 22
wed. 23
wed. 23
wed. 23
wed. 23
wed. 23
wed. 23
thur. 24
thur. 24
thur. 24
thur. 24
thur. 24
thur. 24
fri. 25
fri. 25
fri. 25
fri. 25
fri. 25
fri. 25
sat. 26
sat. 26
sat. 26
sat. 26
sat. 26
sat. 26
sun. 27
sun. 27
sun. 27
sun. 27
sun. 27
sun. 27
we
ek
32
we
ek
32
we
ek
32
we
ek
32
we
ek
32
we
ek
32
sat. 26
sat. 26
sat. 26
sat. 26
sat. 26
sat. 26
sat. 26
sat. 26
sun. 27
sun. 27
sun. 27
sun. 27
sun. 27
sun. 27
sun. 27
sun. 27
wed. 23
wed. 23
wed. 23
wed. 23
thur. 24
thur. 24
thur. 24
thur. 24
thur. 24
thur. 24
thur. 24
thur. 24
fri. 25
fri. 25
fri. 25
fri. 25
fri. 25
fri. 25
fri. 25
fri. 25
mon. 21
mon. 21
mon. 21
mon. 21
mon. 21
mon. 21
mon. 21
mon. 21
tues. 22
tues. 22
tues. 22
tues. 22
tues. 22
tues. 22
tues. 22
tues. 22
wed. 23
wed. 23
wed. 23
wed. 23
wed. 23
wed. 23
wed. 23
wed. 23
we
ek
29
we
ek
29
we
ek
29
we
ek
29
we
ek
29
we
ek
29
we
ek
29
we
ek
29
we
ek
28
we
ek
28
we
ek
28
we
ek
28
we
ek
28
we
ek
28
we
ek
28
we
ek
28
mon. 21
mon. 21
mon. 21
mon. 21
mon. 21
mon. 21
mon. 21
mon. 21
tues. 22
tues. 22
tues. 22
tues. 22
tues. 22
tues. 22
tues. 22
tues. 22
wed. 23
wed. 23
wed. 23
wed. 23
wed. 23
wed. 23
wed. 23
wed. 23
sun. 03
sun. 03
sun. 03
sun. 03
sun. 03
sun. 03
sun. 03
sun. 03
People make excesses, but they can't feel it so much.One bill, one big number, no idea of what this totalcorresponds to.
How to make those numbers speak?How to make people listen to them?
The point here is to create a strong link, a dialogue between people and their own consumption.To make them aware, to make them able to change.
And if the data would directly affect your face ?The more consumption, the more distortion.
Just upload your i.d. picture & get your face pimped.
Then the face becomes a map, showing differentscriteriums, spreading, evolving, making data concretize.
boeksketch-03.indd 32 9/6/12 10:39 AM

33IN YOUR FACE
sat. 26
sun. 27
we
ek
21
mon. 21
tues. 22
wed. 23
thur. 24
fri. 25
sat. 26
sun. 27
we
ek
28
mon. 21
tues. 22
wed. 23
thur. 24
fri. 25
sat. 26
sun. 27
we
ek
25
mon. 21
tues. 22
wed. 23
thur. 24
fri. 25
sat. 26
sun. 27
we
ek
31
mon. 21
tues. 22
wed. 23
thur. 24
fri. 25
mon. 21
mon. 21
mon. 21
mon. 21
mon. 21
mon. 21
tues. 22
tues. 22
tues. 22
tues. 22
tues. 22
tues. 22
wed. 23
wed. 23
wed. 23
wed. 23
wed. 23
wed. 23
thur. 24
thur. 24
thur. 24
thur. 24
thur. 24
thur. 24
fri. 25
fri. 25
fri. 25
fri. 25
fri. 25
fri. 25
sat. 26
sat. 26
sat. 26
sat. 26
sat. 26
sat. 26
we
ek
29
we
ek
29
we
ek
29
we
ek
29
we
ek
29
we
ek
29
mon. 21
mon. 21
mon. 21
mon. 21
mon. 21
mon. 21
tues. 22
tues. 22
tues. 22
tues. 22
tues. 22
tues. 22
wed. 23
wed. 23
wed. 23
wed. 23
wed. 23
wed. 23
thur. 24
thur. 24
thur. 24
thur. 24
thur. 24
thur. 24
fri. 25
fri. 25
fri. 25
fri. 25
fri. 25
fri. 25
sat. 26
sat. 26
sat. 26
sat. 26
sat. 26
sat. 26
sun. 27
sun. 27
sun. 27
sun. 27
sun. 27
sun. 27
sun. 27
sun. 27
sun. 27
sun. 27
sun. 27
sun. 27
we
ek
24
we
ek
24
we
ek
24
we
ek
24
we
ek
24
we
ek
24
we
ek
33
we
ek
33
we
ek
33
we
ek
33
we
ek
33
we
ek
33
mon. 21
mon. 21
tues. 22
tues. 22
wed. 23
wed. 23
thur. 24
thur. 24
fri. 25
fri. 25
sat. 26
sat. 26
sun. 27
sun. 27
we
ek
21
mon. 21
mon. 21
mon. 21
mon. 21
mon. 21
mon. 21
tues. 22
tues. 22
tues. 22
tues. 22
tues. 22
tues. 22
wed. 23
wed. 23
wed. 23
wed. 23
wed. 23
wed. 23
we
ek
26
we
ek
26
we
ek
26
we
ek
26
we
ek
26
we
ek
26
mon. 21
mon. 21
mon. 21
mon. 21
mon. 21
mon. 21
tues. 22
tues. 22
tues. 22
tues. 22
tues. 22
tues. 22
wed. 23
wed. 23
wed. 23
wed. 23
wed. 23
wed. 23
thur. 24
thur. 24
thur. 24
thur. 24
thur. 24
thur. 24
fri. 25
fri. 25
fri. 25
fri. 25
fri. 25
fri. 25
sat. 26
sat. 26
sat. 26
sat. 26
sat. 26
sat. 26
sun. 27
sun. 27
sun. 27
sun. 27
sun. 27
sun. 27
we
ek
32
we
ek
32
we
ek
32
we
ek
32
we
ek
32
we
ek
32
mon. 28
mon. 28
tues. 29
tues. 29
wed. 30
wed. 30
thur. 31
thur. 31fri. 01
fri. 01
sat. 02
sat. 02
sun. 03
sun. 03
we
ek
22
we
ek
22
mon. 28
mon. 28
mon. 28
mon. 28
mon. 28
mon. 28
tues. 29
tues. 29
tues. 29
tues. 29
tues. 29
tues. 29
wed. 30
wed. 30
wed. 30
wed. 30
wed. 30
wed. 30
thur. 31
thur. 31
thur. 31
thur. 31
thur. 31
thur. 31fri. 01
fri. 01
fri. 01
fri. 01
fri. 01
fri. 01
sat. 02
sat. 02
sat. 02
sat. 02
sat. 02
sat. 02
sun. 03
sun. 03
sun. 03
sun. 03
sun. 03
sun. 03
we
ek
27
we
ek
27
we
ek
27
we
ek
27
we
ek
27
we
ek
27
mon. 28
mon. 28
tues. 29
tues. 29
wed. 30
wed. 30
thur. 31
thur. 31
fri. 01
fri. 01
sun. 03
sun. 03
we
ek
23
we
ek
23
sat. 02
sat. 02
mon. 28
mon. 28
mon. 28
tues. 29
tues. 29
tues. 29
tues. 29
tues. 29
tues. 29
wed. 30
wed. 30
wed. 30
wed. 30
wed. 30
wed. 30
thur. 31
thur. 31
thur. 31
thur. 31
thur. 31
thur. 31
fri. 01
fri. 01
fri. 01
fri. 01
fri. 01
fri. 01
sun. 03
sun. 03
sun. 03
sun. 03
sun. 03
sun. 03
sat. 02
sat. 02
sat. 02
sat. 02
sat. 02
sat. 02
b r o w s e . . .
boeksketch-03.indd 33 9/6/12 10:40 AM

34
STROM/ ELECTRICITY
034
34
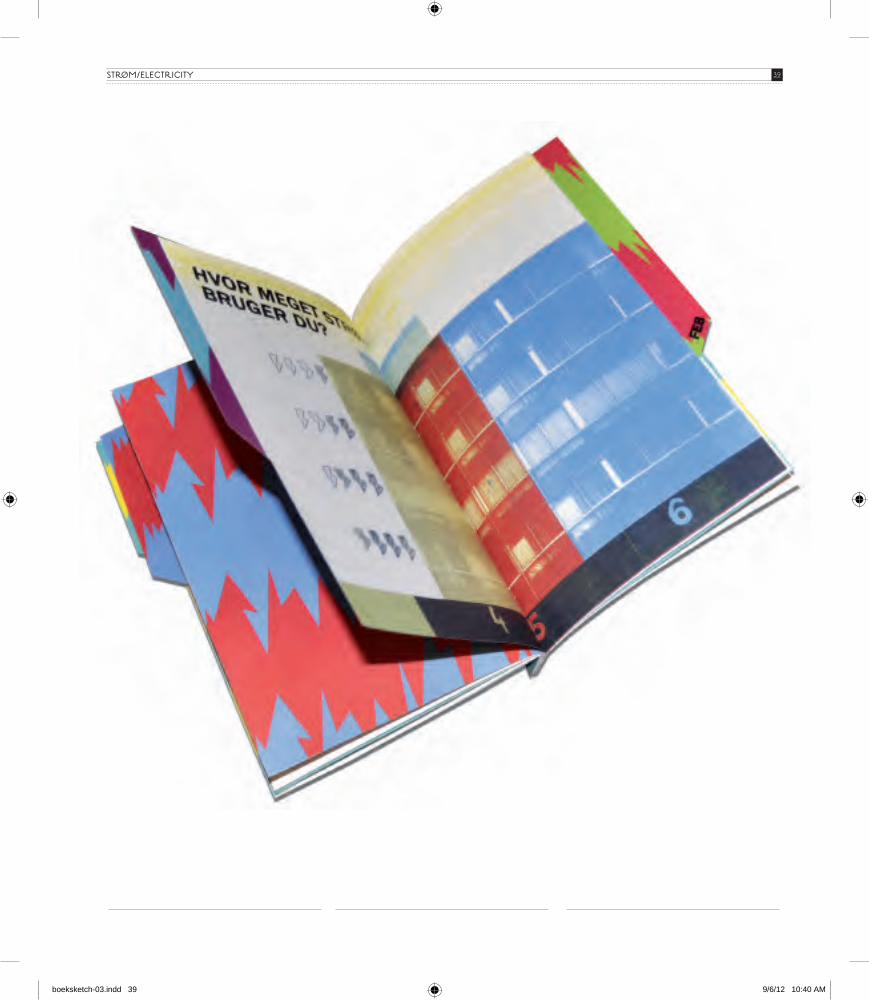
STRØM (Electricity) is a campaign to com-municate with the residents of Skovparken in Kolding, across language and cultural barriers, about electricity and ways to save it.
The campaign is planned in three stages: first a visual campaign, then an active scrapbook, and finally an interpretation and reward system as motivation for a continuing positive behaviour.
How can we communicate with the residents of Skovparken across language and cultural barriers and instil in them a sustainable behaviour in regard to use of electricity?
Anne-Mette Wind JeppesenRune Magelund AlexandersenSigne-Lill ValkvæLasse van den Bosch ChristensenNynne Nadja Boje Sander
STRØM/ELECTRICITY
boeksketch-03.indd 34 9/6/12 10:40 AM

35STRØM/ELECTRICITY
STROM/ ELECTRICITY
034
boeksketch-03.indd 35 9/6/12 10:40 AM

36 STRØM/ELECTRICITY
PROBLEM:How can we communicate across language- and cultural barriers wich will result in a sustainable behaviour for the
residents in Skovparken?
RESEARCH:The children in Skovparken are being used as inter-
preters for their parents.
The children in Skovparken can teach their parents valuable skills such as waste separation.
boeksketch-03.indd 36 9/6/12 10:40 AM

37STRØM/ELECTRICITY
Step 1:
The children of Skovparken will all re-cieve a book and starterkit for the con-cept. The book contains mainly visual information about electricity and ex-plains the concept of STRØM.
Step 2:
Depending on how much you save in electricity as a family you will be re-warded a number of lightning-tokens each month. The tokens will come along a ‘childrens-bill’ attatched to the regular electricity bill. Further more you will recieve a new page/spread for your STRØM book.
Step 3:
The lightning-token system works as following: Each token is of a certain ‘value’. When saved to x-amount of lightnings you have the posibility to trade theese in for STRØM-badges, T-shirts, or other merchandise.
Chilrens Bill:
Hvad er strøm?Congratulations you been rewarded:
Save them and swab them for a badge.
boeksketch-03.indd 37 9/6/12 10:40 AM

38 STRØM/ELECTRICITY
ILLUSTRATION - RUNE
46%kommer fra kul.
2%kommer fra olie.
14%kommer fra biobrændsel.1%
kommer fra atomkraft.
13%kommer fra vind, vand og sol.
boeksketch-03.indd 38 9/6/12 10:40 AM
39STRØM/ELECTRICITY
boeksketch-03.indd 39 9/6/12 10:40 AM

40
MYTRE-FOR
040
40
What do we need?
A daily reminder. The ability to explore our own consumption. Make our own conclusions about our utility use.
We need a solution that works for a large variety of people. A physical poster (E-Ink) that informs you of your current balance.
Lets you explore. Simple.
How do we change TRE-FOR’s relationship to its customers? And how do we make the public save electricity and be active users on their own incentive?
Søren SiebuhrCarl Fredrik AngellSveinung Sudbø
MY TRE-FOR
boeksketch-03.indd 40 9/6/12 10:40 AM

41MY TRE-FOR
MYTRE-FOR
040
boeksketch-03.indd 41 9/6/12 10:40 AM

42 MY TRE-FOR
Product.
A physical poster. (E-Ink)
Informs you of your current balance.
Lets you explore.
Easy.
Concept.
Shift to subscriptions with a max limit, almost instantly rewarding low utility use.
An immediate, visual response to your usage.
Ability to customize, or personalize.
Communicating with arts and culture.
Gadget culture.
boeksketch-03.indd 42 9/6/12 10:40 AM

43MY TRE-FOR
Product.
Visual language.
boeksketch-03.indd 43 9/6/12 10:40 AM

44 MY TRE-FOR
boeksketch-03.indd 44 9/6/12 10:40 AM

45MY TRE-FOR
boeksketch-03.indd 45 9/6/12 10:40 AM

46
THE THREECASHIERS
046
THE THREE CASHIERS46
A short film about contemporary trends, excessive consumption, and the conflicts this can cause in a marriage.
My point of departure is the individual and his or her consumption, but also our entire society’s attitude to consumption. From my perspective, our society reflects a trend to take something as basic as electricity for granted. Exactly because it is so basic, it may be hard to notice and hence it feels intangible. It’s just there. I want to focus on over consumption – a trend that is not restricted to electricity alone. In order to understand human beings, including myself, I decided to focus on my
own energy consumption during the first week of the project. And I made some shocking discoveries which drew my attention to my own habits. Or rather vices. I realized that, unconsciously, I turn a switch on and off 43 times a day. I belong to the very group of people to whom this film is directed. In fact, I believe that my entire generation and the generation before us belong to that category, “the over consumer. ”In addition to this study featuring myself as the main character, I chose to conduct a limited consumer survey on the streets of Kolding. Carrying my video camera I went in search of the ordinary citizen of Kolding and his or her prevailing attitude to TREFOR and to electricity consumption.
The result of my survey made me realize that TREFOR was by and large absent from the consciousness of ordinary citizens of Kolding..
The project resulting from this film is meant as a social commentary, the kind of commentary which will hopefully make the viewers consider and reflect about their own consumption. These are my criteria of success. I have no intention of forcing my opinion on the viewer, with raised fingers and scare tactics. I am convinced that change requires action—action, which comes from within, from the viewers who embrace my message.
A short film about contemporary trends, excessive consumption, and the conflicts this can cause in a marriage.
Stine Rasmussen
boeksketch-03.indd 46 9/6/12 10:40 AM

47THE THREE CASHIERS
THE THREECASHIERS
046
boeksketch-03.indd 47 9/6/12 10:40 AM

48 THE THREE CASHIERS
boeksketch-03.indd 48 9/6/12 10:41 AM

49THE THREE CASHIERS
boeksketch-03.indd 49 9/6/12 10:41 AM

50 THE THREE CASHIERS
boeksketch-03.indd 50 9/6/12 10:41 AM

51THE THREE CASHIERS
boeksketch-03.indd 51 9/6/12 10:41 AM

52
THE CLUB/THE TEST
052
THE CLUB / THE TEST52
Campaign film for Tre-For, which generates the consumers’ personal data and adjust them to the framework of the film.
We primarily address the private consumer who wants to see and understand his consumption in a more visual manner.
But, since it is virtual, the design is applicable to all Tre-For’s customers, including businesses.
How is it possible to further the consumer’s understanding of personal data and consumption in an eventful and engaging manner?
Maria Louise OsipowskaSilas AmdiSebastian Askari SchmidtMartin Meincke Pedersen
boeksketch-03.indd 52 9/6/12 10:41 AM

53THE CLUB / THE TEST
0,1405:000,1406:000,3907:000,2808:000,1409:000,1410:000,14
9,824ml. 485
ml. 485
ml. 485
ml. 485
ml. 485
ml. 485
ml. 485
ml. 485
ml. 485
ml. 485
ml. 485
ml. 485
ml. 485
ml. 485
ml. 485
ml. 485
ml. 485
ml. 485
ml. 485
ml. 485
THE CLUB/THE TEST
052
boeksketch-03.indd 53 9/6/12 10:41 AM

54 THE CLUB / THE TEST
boeksketch-03.indd 54 9/6/12 10:41 AM

55THE CLUB / THE TEST
boeksketch-03.indd 55 9/6/12 10:41 AM

56 THE CLUB / THE TEST
boeksketch-03.indd 56 9/6/12 10:41 AM

57THE CLUB / THE TEST
boeksketch-03.indd 57 9/6/12 10:41 AM

58
MY CARTOONISMART HOme
058
MY CARTOONI SMART HOME58
This is an augmented reality game called ‘My Cartooni Smart Home’, where children can upload their self-made drawings of electric appliances and electronic devices and investigate the electricity in their own house and its impact on the environment.
Knowledge of the TRE-FOR Company:Older people are satisfied with the current appearance of the electricity bill.Younger people don’t read the bill —they only dwell on the price of consumption— they pay via payment service.
Our approach:TRE-FOR ought to focus on and strengthen its tangible products that have an immediate and meaningful value. There is no immediate need for redesigning the electricity bill. – The teaching programme for childrenThe communication between customer and energy supplier is characterized by topics on: factual errors in the bill, complaints about faulty reports, commercials etc.Conclusion:Currently there is no positive communication. When communication is needed it’s always on negative topics: “there are things that don’t work!” What is the reason for that?
How can we help TRE-FOR generate more positive communication with its customers?
Denise Dyrvig C. JørgensenBirgitte Malling EriksenRolf Blume-Jensen
boeksketch-03.indd 58 9/6/12 10:41 AM

59MY CARTOONI SMART HOME
MY CARTOONISMART HOme
058
boeksketch-03.indd 59 9/6/12 10:41 AM

60 MY CARTOONI SMART HOME
boeksketch-03.indd 60 9/6/12 10:41 AM

61MY CARTOONI SMART HOME
boeksketch-03.indd 61 9/6/12 10:41 AM

62 MY CARTOONI SMART HOME
boeksketch-03.indd 62 9/6/12 10:41 AM

63MY CARTOONI SMART HOME
Group 10 has been especially interested in exploring the relationship between the company and its customers, and, based on interviews, we have identified a specific set of problems related to “negative communication.” Most customers do not acknowledge the products TRE-FOR offers (water, heat, electricity, Internet etc.) as inherently value adding services, but tend to focus on the material demands the products fulfil: computer, mobile phone, Internet, refrigerator, television etc. From that perspective, TRE-FOR provides “invisible products,” which only grab the customers’ attention once there are errors in the delivery of these products. We see “visible products,” which the customer perceives as desirable for their own sake, as a special prerequisite for being able to reach the consumers and hence generate a different, positive line of communication.
We propose that the existing educational program for 7-11-year olds be extended with an app for smart phone, iPad and regular webpage, which acts as an augmented reality game. Here children can upload their own drawings of electric appliances and electronic devices and learn about their personal consumption of energy and also communicate with their parents. They can scan their home with e.g. an iPad camera, and their
drawings will be part of a live view that dresses the physical objects, like clothes on a cut-out doll. As the child is uploading the drawings My Cartooni Smart Home will go from a live look to becoming a cartoon. Children and parents can collect information about the various electrical appliances in their own home through My Cartooni Smart Home and also become aware of the effect of these appliances on the environment through the character “Mr. Powers.”
The objective of the project is to take advantage of the special aesthetic value of a child’s drawing in terms of spontaneity, humour, simplicity, familiarity, and feeling of safety to create a different type of data visualization for TRE-FOR. My Cartooni Smart Home could be included in a preliminary program to arrange visits to TRE-FOR and follow-up studies back in school. The project will focus on combining play and learning providing the students with a sense of ownership related to the contents of the class, since their own drawings and their own home are part of the educational material.
boeksketch-03.indd 63 9/6/12 10:41 AM

64
0643D
3D HOLOGRAPHIC BOARD GAME64
Our project is a 3D holographic board game that enhances the customer’s awareness about energy use.
Taking the energy company TRE-FOR as its starting point, the project attempts to widen the perception and appreciation of energy consumption through play and games.
Our project combines board games and computer games using the latest technology within 3D projection in order to appeal to a wide audience.
How can board games and computer games be combined and through data visualization teach both children and adults about energy consumption in an exciting manner?
Ditte RavnMette Fredsted Gram
boeksketch-03.indd 64 9/6/12 10:41 AM

653D HOLOGRAPHIC BOARD GAME
0643D
boeksketch-03.indd 65 9/6/12 10:41 AM

66 3D HOLOGRAPHIC BOARD GAME
boeksketch-03.indd 66 9/6/12 10:41 AM

673D HOLOGRAPHIC BOARD GAME
boeksketch-03.indd 67 9/6/12 10:41 AM

68 3D HOLOGRAPHIC BOARD GAME
boeksketch-03.indd 68 9/6/12 10:41 AM

693D HOLOGRAPHIC BOARD GAME
boeksketch-03.indd 69 9/6/12 10:42 AM

70
070
THE 10 PERCENT CAMPAIGN70
We want to create a campaign that informs our target group—people in the Triangle Area, and more specifically households with children living at home—about standby consumption.
Ten percent of electricity consumption is pure standby, on average it equals 850 DKK per year.
How can TRE-FOR, through data visualisation, communicate energy waste in a tangible way and thereby create a stronger relationship to its customers?
Camilla RasmussenTrine Løgstrup SørensenMaria Osk JonsdottirMaja Bæk ChristoffersenAlba Castelltort Vinallonga
boeksketch-03.indd 70 9/6/12 10:42 AM

71THE 10 PERCENT CAMPAIGN
Do you konw that the 10 % of the electricityis wasted on standby?
www.trefor.dk
070
boeksketch-03.indd 71 9/6/12 10:42 AM

72 THE 10 PERCENT CAMPAIGN
boeksketch-03.indd 72 9/6/12 10:42 AM

73THE 10 PERCENT CAMPAIGN
boeksketch-03.indd 73 9/6/12 10:42 AM

74 THE 10 PERCENT CAMPAIGN
Vidste du at 10% af dit el-forbrug
er standby?
www.trefor.dk
boeksketch-03.indd 74 9/6/12 10:42 AM

75THE 10 PERCENT CAMPAIGN
Vidste du at 10% af dit el-forbrug
er standby?
www.trefor.dk
boeksketch-03.indd 75 9/6/12 10:42 AM

076We weRe askeD foR oNe solUtIoN aND Came UP wIth aNotheR
Ólafur Haraldsson
OLAFUR HARALDSSON´76
boeksketch-03.indd 76 9/6/12 10:42 AM

7777
Th e task TRE-FOR asked of the students at Kolding School of design was to design a bill the consumers would understand. What they got was a smartphone app.
Th e task TRE-FOR asked of the students at Kolding School of design was to design a bill the consumers would understand. What they got was a smartphone app.
TRE-FOR is content, the students and I – their teacher – are content, and I am sure, the consu-mers will appreciate that TRE-FOR gave us the chance to think and work much broader than originally intended.
Because that is the task you should give de-signers: Th ink broad. Th ink of the users’ needs. Th ink of solutions that will make their lives easier and better. In this case the consumers will get a smart app where they can choose between various mini apps and design their own screens in terms of “widgets” and accessible apps and features.
Th e outcomeTh e app contains diff erent widgets for power, hea-ting and water consumption. It is possible to follow the consumption per hour, day, week, month, and year and compare usage of one year with another year and to see a forecast of consumption for the current year based on data from the previous year(s), at least for electricity consumption. Information can be accessed as raw numbers as they are today, graphs and comparison charts, as well as a more creative visual interpretation of the customer usage along with over-use warning sent by the application on the device or using other types of media like text message or e-mail.
Widgets will off er the possibility for the application to grow and new, better features to be added to it as it develops. In the beginning – along with the consumption widgets – there will be possibilities to contact and locate TRE-FOR and connect to
self-service where you have overview of your instalments and package plans and see the most frequently asked questions and power stories for saving energy.
Two-way communicationTh e outcome from the workshop at Kolding School of Design which started the project lead to an idea of an open platform for TRE-FOR to communicate two ways with their customers, off ering faster and better service and feedback back and forth.
Th e ideas we developed: Make sure to involve the customers in some of the upcoming projects on their way into production, as well as already completed projects and what the users think about them.
Improve the self-service so customers can manage better on their own, without the help from customer relations, or they can prepare the problem/case before they get in touch with TRE-FOR. Th e platform would be a growing le-arning tool that would improve with input from the users and the corporate side of TRE-FOR.
Th ere must be focus on a healthy relation between TRE-FOR and the customers. Make sure they want to use the platform for more than just complaining. Make sure TRE-FOR listens.
TRE-FOR should manage to use the input into the platform as crowd sourcing of feedback, ideas, and suggestions.
Establish “Contact history” with use of case numbers where the client and TRE-FOR can back-track previous history of communication between the customer and TRE-FOR.
An open platform should be used as an internal tool in TRE-FOR. Develop the open platform in a way for TRE-FOR to improve communication in-house. Th e open platform idea was incorporated
into a project TRE-FOR wanted to do: An applica-tion for tablets/smartphones.
Make sure the application can grow. Make sure it is built/designed in a way for future updates to be possible and make sure it will grow. Off er the users to be involved in giving feedback to ask for their personal features for the application.
Still working on the projectWe are still working on the project, but are already confi dent it will become a success; particularly because, in the ultimate phase, we coope-rated with the Aarhus-based app company Kiloo, which has contributed with many good solutions.
Ólafur Haraldsson E: [email protected] http://www.olihar.com
Education:2011: Kolding School of Design, Master’s Degree in Interaction Design2009: Kolding School of Design, Bachelor’s Degree in Interaction Design2008-2009: University of Sydney – UG, Photo-graphy2005-2006: NoMA, IP – Multimedia Design2002-2005: Flensborgarskólinn í Hafnarfi rði, HS - Radio and Television Technician2003-2004: Nelson Collage, Y13 – Photography, Arts, Trade Building, Woodworking, Metalwork
Experience:2003-present: OliHar.com – Photographer and Interaction Designer, freelance designer, photo-grapher, image retoucher and teacher2010: xRez Studios – Los Angeles, got a taste of the work done in the movie industry and other related fi elds in California2010: University of Harvard, Consultant to PhD Student and Professor at the Engineering and Ap-plied Sciences Department.
OLAFUR HARALDSSON´
076We weRe askeD foR oNe solUtIoN aND Came UP wIth aNotheR
boeksketch-03.indd 77 9/6/12 10:42 AM

78 OLAFUR HARALDSSON
boeksketch-03.indd 78 9/6/12 10:42 AM

79OLAFUR HARALDSSON
boeksketch-03.indd 79 9/6/12 10:42 AM

OLAFUR HARALDSSON
ideas to fit TRE-FOR. This directed attention to how design thinking can be used within the company to ensure a user-driven, multi-disciplinary and future-oriented development and implementation of new ideas internally as well.
The evaluation of the workshop showed that the participants from TRE-FOR – representing a number of different departments and holding diverse competencies – believe that design thinking should be integrated in TRE-FOR’s development process.
Statements from the evaluation:• We should not allow ourselves to be confined by what is possible but rather focus on the customer from a helicopter view. • We must put the customer at the centre – in a creative and real way.• We must break with what we think we know about the customer. Do we know the customer?• We will focus long-term and on how to sustain interest in energy. • We must learn how to create social aspects.• We must use prototyping.• We must devote time to contemplative practices.• We must develop elements from another – visual and virtual – way of presenting consumption combined with what is used today. • We must reach for younger segments, e.g. through educational programmes such as ”Miljøstrup”.• We must dare to gamble.
“TRE-FOR and Kol-ding School of De-sign fulfilled their agreement to col-laborate in autumn of 2011 and spring of 2012. The collaboration was a mutual experi-ment to explore ways
“In relation to the collaboration between TRE-FOR and Kolding School of Design it is our experience as de-sign managers that design can contri-bute in changing a business’ perception of the way new busi-ness initiatives are developed”.
The results from the data-visualisation course, achieved by the design students and design management students, have created a foundation for Design Thinking at TRE-FOR which shows the existence of multifarious opportunities that go be-yond finish and redesigning of something concrete.
A study made by the Danish Enterprise and Construction Authority (2008) concludes that businesses employing design and design competencies as a central and integrated part of their deve-lopment and business processes make better profits than businesses that do not integrate design at a strategic level, but only apply it at a more operational level or as a finish”.Maja Bæk Christophersen and Camilla Rasmus-sen, Master of Arts in Design management
”Collaborating with Kolding School of Design was exciting
and innovative. We were able to produce concrete suggested solutions to how to get energy consump-tion at eye level”. Brian Jonasson, Chief Consultant, TRE-FOR
Different ways of thinkingEveryone gets a chance to think like a designerOne element of the collaborative agreement between Kolding School of Design and TRE-FOR was a workshop about design thinking directed at the employees. That is, an introduction on how to use design methods to ensure a holistic, user-driven, multi-disciplinary and future-focused development and implementation of new ideas in the company.
The workshop followed two classes; the class at the Department of Communication Design pre-sented in this publication and the DesignCamp 2011 which focused on making electricity tangi-ble and wonderful. The DesignCamp outcome is described in the publication DesignCamp 2011 which you can order by sending an email to [email protected]
The specific subject of the workshop was how design thinking and design processes can shift energy awareness of the Danes and energy sup-pliers. The event was planned as a guided tour of how energy and design interact. Also, the workshop investigated whether TRE-FOR has a clear image of its clients and users; and whether it makes sense to separate the two concepts.
The workshop took the student ideas as its starting point, and applying the same methods and tech-niques that were used during class, the employees were asked to “mature” the ideas by identifying which elements required alteration in order for the
80
boeksketch-03.indd 80 9/6/12 10:42 AM

OLAFUR HARALDSSON
of merging design and energy. Mette Mikkelsen, Project Manager, etrans
The formal collaboration agreement states:
The future market for energy and electricity is experiencing a rapid development in terms of technology and market with an increasing focus on environment and sustainability, etc.
This development can potentially involve the role and significance of electricity in the everyday lives of people to change radically. Therefore, TRE-FOR and Kolding School of Design want to collaborate closely on the subject of how to develop the Danes’ relationship with electricity.
The objective is to support Kolding School of Design’s teaching and artistic development work in relation to this development and to contribute to TRE-FOR’s understanding of design’s potential in relation to the field of energy.
At the same time, TRE-FOR will contribute significantly to the talent development aspect of educating designers that are capable of handling user-driven innovation, complex systems, service design and design related to energy. Collaborating with TRE-FOR has given us a uni-que opportunity to combine the design students’ ability for innovative thinking and an “out of the box” approach with the challenges that face a modern energy supplier.
At the same time, we have been able to integrate research-based knowledge and development into the project on an on-going basis making it easy to ”tame” the wild ideas and translate them into a concept which is implementable and makes sense to TRE-FOR.
The positive result is contingent on the open, active and contributing effort of the company. TRE-FOR has put a lot of energy and man-hours into introducing the company and the problems it is currently facing.
The TRE-FOR employees have contributed signi-ficantly to the process of generating the initial, wild ideas and subsequently creating a new platform for understanding energy.”
Mette Mikkelsen, Project Manager, etrans
81
boeksketch-03.indd 81 9/6/12 10:42 AM

82 OLAFUR HARALDSSON
boeksketch-03.indd 82 9/6/12 10:43 AM

83OLAFUR HARALDSSON
boeksketch-03.indd 83 9/6/12 10:43 AM

084VISUALCONCLUSION
VISUAL CONCLUSION - LEON KRANENBURG84
Léon Kranenburg / We.Ourselves.And Us.
boeksketch-03.indd 84 9/6/12 10:43 AM

VISUAL CONCLUSION - LEON KRANENBURG 85
084VISUALCONCLUSION
boeksketch-03.indd 85 9/6/12 10:43 AM

VISUAL CONCLUSION - LEON KRANENBURG86
boeksketch-03.indd 86 9/6/12 10:43 AM

VISUAL CONCLUSION - LEON KRANENBURG 87
boeksketch-03.indd 87 9/6/12 10:43 AM

VISUAL CONCLUSION - LEON KRANENBURG88
boeksketch-03.indd 88 9/6/12 10:43 AM

VISUAL CONCLUSION - LEON KRANENBURG 89
Otto Neurath, 1936
By: Léon Kranenburg / WOAU!/ We.Ourselves.And Us.
boeksketch-03.indd 89 9/6/12 10:43 AM

090ACKNOWLEDGEMENTS
ACKNOWLEDGEMENTS 90
boeksketch-03.indd 90 9/6/12 10:43 AM

ACKNOWLEDGEMENTS
The Department of Communication Design would like to give many thanks to TRE-FOR, especially to Director Knud Petersen for believing in our colla-boration, and for co-funding the present publica-tion. We would like to give special thanks to Helle Damm-Henrichsen, Henrik Ejsing Andreasen and Peter Ellemose for their talks to inform the students about TRE-FOR and energy.
We would also like to express our deepest gratitude to Chief Consultant Brian Jonasson without whom neither the workshop nor the artistic development project would have been possible. Also, we would like to thank etrans Project Manager Mette Mikkel-sen for playing a significant role with her knowledge on large projects on energy and positive energy.
We would like to thank the students for their contri-butions and their inspiring design teachers: Ólafur Haraldsson, the Rotterdam-based design Studio Léon & Loes, René Christoffer, and Pia Pedersen. Among the teachers, the department is particularly indebted to Ólafur Haraldsson for his project con-tribution in terms of words and pictures and to Léon Kranenburg for the amazing design of the present publication, and lastly to Pia Pedersen for coordi-nating the publication. Thanks to Helle Raheem and Marianne Baggesen Hilger for translation and proofreading and to Bo Severin Bilde Bruun for making arrangements with the printer.
Finally, Kolding School of Design is happy to col-laborate with the Innovation Network for Market, Communication, and Consumption, which aims to qualify the understanding of postmodern consu-mers, markets and branding and to expand the tool box of marketers and designers through the dissemination and implementation of cutting edge international academic insights in the industry. A very important part of their mission is to develop arenas where practitioners and researchers intro-duce, exchange, and develop new insights. (Contact: Associate Professor Per Østergaard, Department of Marketing & Management, The University of Southern Denmark, Tel: +45 65 50 32 35, e-mail: [email protected] ).
“The visual inter-pretation should aim at bringing out what is most exciting in the facts selected.
Marie Neurath, 1960
.
91
090ACKNOWLEDGEMENTS
boeksketch-03.indd 91 9/6/12 10:43 AM

092COLOPHON
COLOPHON92
Kolding School of Design © 2012
DesignLéon Kranenburgwww.woau.nl
CoordinationPia Pedersen
PrintZeuner Grafisk as
Edition1250 copies
Kolding School of DesignÅgade 10DK-6000 Koldingwww.dskd.dkTlf. 76 30 11 [email protected]
boeksketch-03.indd 92 9/6/12 10:43 AM