the paris agreement: an assessment - reason …...the paris agreement: an assessment | 1...
TRANSCRIPT

by Julian Morris
Reason FoundationPolicy Brief No. 133
April 2016
The Paris Agreement: An Assessment

Reason FoundationReason Foundation’s mission is to advance a free society by developing, applying
and promoting libertarian principles, including individual liberty, free markets and
the rule of law. We use journalism and public policy research to influence the frame-
works and actions of policymakers, journalists and opinion leaders.
Reason Foundation’s nonpartisan public policy research promotes choice, compe-
tition and a dynamic market economy as the foundation for human dignity and
progress. Reason produces rigorous, peer-reviewed research and directly engages the
policy process, seeking strategies that emphasize cooperation, flexibility, local knowl-
edge and results. Through practical and innovative approaches to complex problems,
Reason seeks to change the way people think about issues, and promote policies that
allow and encourage individuals and voluntary institutions to flourish.
Reason Foundation is a tax-exempt research and education organization as defined
under IRS code 501(c)(3). Reason Foundation is supported by voluntary contribu-
tions from individuals, foundations and corporations. The views are those of the
author, not necessarily those of Reason Foundation or its trustees.
Copyright © 2016, Reason Foundation. All rights reserved.

R e a s o n F o u n d a t i o n
The Paris Agreement: An Assessment by Julian Morris
Executive Summary
The Paris Agreement seeks to limit the increase in global mean temperatures to “well below 2°C above pre-industrial levels.” The Agreement asserts that this goal is undertaken in order to enhance the implementation of the objective of the UN Framework Convention on Climate Change (FCCC), which is to prevent “dangerous anthropogenic interference with the climate system.”
There is considerable disagreement over what increase in global mean temperature might be considered “dangerous.” For example, economic analyses suggest that warming of 3°C above pre-industrial levels may generate net benefits. In the very scenarios in which climate change is presumed to be greatest, its impact will be distributed most evenly and the harms will be most readily mitigated by adaptive responses. Merely asserting that an increase of 2°C above pre-industrial levels will be “dangerous” does not make it so.
Recent analysis indicates that the sensitivity of the climate to rising levels of carbon dioxide is lower than previously assumed. This is consistent with the finding that forecasts of warming by the Intergovernmental Panel on Climate Change have substantially over-estimated the likely extent of warming. If these new analyses of sensitivity are correct, average global temperatures might rise to less than 2°C above preindustrial levels without any restrictions on greenhouse gas emissions.
Regardless of whether the new analyses of climate sensitivity are correct or not, the voluntary commitments to reduce emissions made by governments in their Intended Nationally Determined Contributions (INDCs) would have little impact on the rate of warming.
Thus, the Paris Agreement likely does not enhance the objective of the FCCC, either because the 2°C target is not desirable, or because restrictions on greenhouse gas emissions are not necessary (or, if necessary, not sufficient) to achieve that target. As such, the Paris Agreement must be considered a new and separate treaty. Indeed, it implicitly acknowledges its status as a separate treaty, noting that it will only enter into force once it has been ratified by signatories representing 55% or more of global greenhouse gas emissions.
Innovation and associated economic development will likely be the most effective means by which humans address climate change. But the commitments made under the Paris Agreement would divert trillions of dollars into low-carbon technologies and government-funded schemes for mitigation and adaptation, thereby undermining the bottom-up processes that drive more widespread innovation and, as a result, impeding the ability of people to adapt to climate change and other threats.
Given the potential for the Paris Agreement to result in harmful and even counterproductive restrictions on economic activity, it would appear that ratification is not in the interests of the majority of signatory nations.

R e a s o n F o u n d a t i o n
Table of Contents
Introduction .................................................................................................................................... 1
A Concise History of Climate Change Concern .................................................................................. 2
The Science of Climate Change: A Status Report ............................................................................. 4
The Effects of Climate Change ......................................................................................................... 8
Evaluating the Effects of Climate Change ........................................................................................ 10
The Paris Agreement ...................................................................................................................... 12
Mitigation, Adaptation and Resilience ............................................................................................ 14
Will Climate Aid Work? ................................................................................................................... 22
Better Policies .............................................................................................................................. 24
Summary and Conclusions ............................................................................................................ 25
About the Author .......................................................................................................................... 26

The Paris Agreement: An Assessment | 1
Introduction
On December 12, 2015, government officials from 195 nations meeting in Paris, France, finalized a new agreement on climate change. This brief assesses the merits of the Paris Agreement in order to encourage informed debate about its ratification by signatory nations. It examines the nature and extent of the threat posed by climate change, the effectiveness of solutions adopted in Paris, and considers other, better solutions. The brief begins with a concise history of the emergence of concern over climate change. This is followed by a status report on, first, the science of climate change and, second, economic analyses of the problem of climate change. It then assesses the Paris Agreement in light of the scientific and economic evidence. Finally, it explores some other policy options that would better address the problem of climate change.

2 | Reason Foundation
P a r t 1
A Concise History of Climate Change Concern
On June 23, 1988, NASA scientist Dr. James Hansen delivered a shocking message to the U.S. Senate Committee on Energy and Natural Resources: The world is warming, heatwaves will become more common, and we are to blame.1 His timing was impeccable. The temperature in D.C. on that day reached 36.7°C (98°F)—6.7°C (12°F) above the historical mean.2 And to ensure that the assembled senators and TV crews had a visceral appreciation of Hansen’s warning, Senator Tim Wirth had opened the committee room’s windows the previous evening, letting in the outside heat and shutting off the air conditioning.3 Hansen’s clarion call helped motivate political support for the establishment, six months later, of the Intergovernmental Panel on Climate Change (IPCC), which was given a remit “...to assess on a comprehensive, objective, open and transparent basis the scientific, technical and socio-economic information relevant to understanding the scientific basis of risk of human-induced climate change, its potential impacts and options for adaptation and mitigation.” The IPCC released its first assessment report in 1990. The Policymakers Summary of that report warned that continued, unabated emissions of greenhouse gases might warm the atmosphere by as much as 5°C (9°F) by 2100, stating that “this [warming] is greater than that seen over the past 10,000 years.”4 Two years later at the “Earth Summit” in Rio de Janeiro, leaders from around the world, including George H. W. Bush and Margaret Thatcher, signed the UN Framework Convention on Climate Change, which seeks “to achieve … stabilization of greenhouse gas concentrations in the atmosphere at a level that would prevent dangerous anthropogenic interference with the climate system.”5
1 Hansen’s Senate testimony is available here: http://www.skepticalscience.com/pics/ClimateChangeHearing1988.pdf, accessed 4/1/2016. 2 The temperature record for DC on that day is available here:
http://www.wunderground.com/history/airport/KDCA/1988/6/23/DailyHistory.html?req_city=&req_state=&req_statename=, accessed 4/1/2016. 3 Worth made this admission in a PBS interview, which is available here: http://www.pbs.org/wgbh/pages/frontline/hotpolitics/interviews/wirth.html, accessed
4/1/2016. 4 The Policymakers Summary of Working Group 1 the IPCC’s First Assessment Report is available here:
https://www.ipcc.ch/ipccreports/far/wg_I/ipcc_far_wg_I_spm.pdf, accessed 4/1/2016. 5 The text of the Framework Convention on Climate Change is available here:
http://unfccc.int/files/essential_background/background_publications_htmlpdf/application/pdf/conveng.pdf, accessed 4/1/2016.
The Paris Agreement: An Assessment | 3
Many governments have subsequently taken actions, both individually and in concert, ostensibly to reduce emissions of greenhouse gases. Nonetheless, atmospheric concentrations of these gases have continued to grow, with carbon dioxide concentrations rising from about 354 parts per million in 1990 to 400 parts per million today.6 Meanwhile, the “global mean” near-surface temperature is estimated to have risen by between 0.27°C (0.49°F) and 0.31°C (0.56°F).7 Given the inexorable rise in atmospheric concentrations of greenhouse gases and the seemingly associated rise in temperatures, one can understand why many highly regarded scientists, politicians and others have continued to call for limits on emissions of these gases. But are such calls justified?
6 According to NOAA’s ESRL data, which are available here: ftp://aftp.cmdl.noaa.gov/products/trends/co2/co2_mm_mlo.txt, accessed 4/1/2016. 7 The 0.27°C figure comes from the Hadley Centre for Climate Research at the University of East Anglia in Britain, whose HADCRUT4 globally averaged
annual temperature anomalies are based on ground and sea thermometers. See: http://www.metoffice.gov.uk/hadobs/hadcrut4/data/current/time_series/HadCRUT.4.4.0.0.annual_ns_avg.tx, accessed 4/1/2016. (These data are periodically adjusted. If that URL does not work, you should be able to find the newly adjusted series at http://www.metoffice.gov.uk/hadobs/hadcrut4/data/current/download.html). The higher figure comes from temperature records kept by the University of Alabama at Huntsville (http://vortex.nsstc.uah.edu) and by NASA (http://data.giss.nasa.gov/gistemp/), both of which use satellite data.

4 | Reason Foundation
P a r t 2
The Science of Climate Change: A Status Report The scientific theory underpinning concerns over human-induced climate change is the “greenhouse effect.” This theory predicts that the presence of certain gases in the atmosphere will slow down the rate at which energy from the sun is radiated back into space, causing the atmosphere to heat up.8 The extent of this greenhouse effect can be described with some precision, leading to predictions that have been verified by observations. The greenhouse effect is thus a good theory and, unsurprisingly, one that is accepted by essentially all climate scientists.
In the case of Earth, the greenhouse effect predicts that the presence of water vapor, the most significant of the greenhouse gases in our atmosphere, will increase the temperature of the lower atmosphere. However, this greenhouse effect is moderated by convection, which cools the surface by transporting heat to the upper atmosphere. As a result of these two countervailing effects, the average temperature at Earth’s surface is about 15°C (59°F). Without the greenhouse effect, Earth would have a surface temperature of about -18°C (-0.4°F), the planet would be covered in ice and there would be little or no life.9
There is far less agreement, however, regarding the effect of increasing the atmospheric concentration of trace greenhouse gases such as methane and carbon dioxide. The reason is that the earth’s atmosphere, oceans and living organisms interact in complex ways that cannot easily be captured in a simple formula.
In spite of this complexity, climate scientists have developed a standard measure for evaluating the impact of increasing the concentrations of greenhouse gases: “equilibrium climate sensitivity” (ECS), which is the change in global mean surface temperature over the very long term—more than a century—in response to doubling the atmospheric concentration of CO2. (The effect of increasing CO2 concentrations is logarithmic, which means that each time concentrations double, the temperature rises by the same amount. So, if a doubling of CO2 led to a 2°C rise in temperature, a quadrupling of concentrations would lead to a 4°C rise in temperature, all else being equal.)
In its first assessment report (1990), the IPCC gave an ECS of 1.5°C to 4.5°C (2.7°F to 8.1°F), with a “best guess” of 2.5°C (4.5°F).10 The second assessment report (1995)11 and third assessment report (2001)12 both 8 Planets absorb radiation at all wavelengths and emit infra-red radiation. Some molecules in a planet’s atmosphere absorb this infra-red radiation and re-emit it,
partly back toward the planet, partly up into space. It is the radiation re-emitted down to the planet that warms the atmosphere. 9 One of the best explanations of this effect is by Dr. Roy Spencer. See: http://www.drroyspencer.com/2015/06/what-causes-the-greenhouse-effect/, accessed
4/1/2016. 10 See Chapter 5 of Working Group 1 the IPCC’s First Assessment Report (available here:
https://www.ipcc.ch/ipccreports/far/wg_I/ipcc_far_wg_I_chapter_05.pdf, accessed 4/1/2016), at p. 139.

The Paris Agreement: An Assessment | 5
used the same numbers. But the fourth assessment report (2007) asserted that ECS, “is likely to lie in the range 2°C to 4.5°C, with a most likely value of about 3°C.”13 Explaining their choice of a narrower range and new “most likely” estimate, the authors of the fourth assessment report asserted that since the third assessment report, “the levels of scientific understanding and confidence in quantitative estimates of equilibrium climate sensitivity have increased substantially.”14 In its fifth assessment report (2013), the IPCC again revised its estimates of ECS, this time reverting to the previous range of 1.5°C to 4.5°C—but omitting either a “best guess” or “most likely” estimate.15 These various ECS ranges and “best guesses”/“most likely” estimates are summarized in Table 1.
Table 1: Equilibrium Climate Sensitivity in the IPCC Reports
IPCC Assessment Report Date ECS Range “Best Guess”/”Most Likely” First 1990 1.5°C – 4.5°C 2.5°C Second 1995 1.5°C – 4.5°C 2.5°C Third 2001 1.5°C – 4.5°C 2.5°C Fourth 2007 2.0°C – 4.5°C 3°C Fifth 2013 1.5°C – 4.5°C None given
By lowering the bottom of the range for ECS estimates in its 2013 report, the IPCC plainly contradicts the claim made in its 2007 report that “scientific understanding and confidence in quantitative estimates” of ECS had at that time increased. To see what was going on, a bit more history is helpful. In 1979, the National Academy of Sciences convened a panel to look at the status of climate science. The chair of that panel, Jule Charney, asked James Hansen of NASA and Syukuru Manabe of Princeton to give estimates of ECS. Veteran Science correspondent Richard Kerr describes the result:
On the first day of deliberations, Manabe told the committee that his model warmed 2°C when CO2 was doubled. The next day Hansen said his model had recently gotten 4°C for a doubling. According to Manabe, Charney chose 0.5°C as a not-unreasonable margin of error, subtracted it from Manabe's number, and added it to Hansen’s. Thus was born the 1.5°C-to-4.5°C range of likely climate sensitivity that has appeared in every greenhouse assessment since, including the three by the Intergovernmental Panel on Climate Change (IPCC). More than one researcher at the workshop called Charney’s now-enshrined range and its attached best estimate of 3°C so much hand waving.16
11 See IPCC Second Assessment Report Working Group 1 Technical Summary (available here:
https://www.ipcc.ch/ipccreports/sar/wg_I/ipcc_sar_wg_I_full_report.pdf, accessed 4/1/2106), at p. 34. 12 See IPCC Third Assessment Report Working Group 1 Technical Summary (available here: http://www.grida.no/climate/ipcc_tar/wg1/pdf/wg1_tar-front.pdf,
accessed 4/1/2016), at p. 67. 13 See IPCC Fourth Assessment Report, working Group 1, Chapter 10.5 (available here: http://www.ipcc.ch/publications_and_data/ar4/wg1/en/ch10s10-
5.html#box-10-2, accessed 4/1/2016). 14 Ibid. 15 See IPCC Fifth Assessment Report, Summary for Policymakers (available here: https://www.ipcc.ch/pdf/assessment-
report/ar5/wg1/WGIAR5_SPM_brochure_en.pdf, accessed 4/1/2016), at p. 14. 16 Richard A. Kerr, “Three Degrees of Consensus” Science, 13 August 2004: Vol. 305, no. 5686, pp. 932–934, available
at http://science.sciencemag.org/content/305/5686/932, accessed 4/1/2016.

6 | Reason Foundation
In other words, all the IPCC’s estimates of ECS up to and including those used in the third assessment report (2001) were based not on empirical data but on assumptions built into two models from the 1970s. While these models had been fitted to replicate (more or less) past changes in temperature, they had not been evaluated on the basis of their predictive ability. In its fourth assessment report, the IPCC authors included some estimates of ECS that had been derived from empirical work, but those more or less agreed with the earlier model-derived estimates. The reason the fourth assessment raised the lower bound of estimates of ECS is that newer climate models assumed higher ECS, with a minimum bound of 2°C.17 But assumptions are not evidence. Since 2010, a slew of new estimates of ECS have been developed, this time better representing the impact of aerosols, which tend to cool the atmosphere by reflecting incoming solar energy. The new estimates are mostly lower than those utilized in previous IPCC reports. The publication of these new estimates essentially forced the IPCC to reduce the lower bound of its ECS range. But it kept the upper bound. Meanwhile, the downward trend in estimates has continued: In 2014, work by Nicholas Lewis and Judith Curry identified a “best estimate” ECS of 1.45°C, with 95% confidence limits of between 1.02°C and 2.2°C.18 In the past few years, many of the models used in IPCC reports have been evaluated by comparing their forecasts with actual changes in temperature. A study published in Nature Climate Change by John Fyfe and Nathan Gillett of the Canadian Center for Climate Modelling and Analysis, and Francis Zwiers of the Pacific Climate Impacts Consortium, compared actual global mean temperature to a set of 117 simulations using 37 of the models used by the IPCC and found that over the period 1993–2012 the change in observed temperatures (from the UK Hadley Center’s HADCRUT4 dataset) was less than half that of the simulations.19 Similarly, Professor John Christy of the University of Alabama Huntsville, one of the world’s foremost experts on temperature data, has compared temperatures in the tropical troposphere—a part of the climate that is assumed to be particularly susceptible to warming from greenhouse gases—with simulations from 102 runs of 24 IPCC models over the period 1979–2013.20 Figure 1, taken from Christy’s December 2013 testimony to the House Committee on Science, Space and Technology, shows that the models wildly overestimate warming in the tropical troposphere: After the year 2000, observations are below the lowest model run; by 2013, the models on average over-predict warming by a factor of three.
17 See IPCC Fourth Assessment Report, Working Group 1, Chapter 10.5, box 10-2, available here:
http://www.ipcc.ch/publications_and_data/ar4/wg1/en/ch10s10-5.html#box-10-2, accessed 4/1/2016 18 Nicholas Lewis and Judith Curry, “The implications for climate sensitivity of AR5 forcing and heat uptake estimates,” Climate Dynamics, September 2014
(http://link.springer.com/article/10.1007/s00382-014-2342-y); a pre-print version is here: https://niclewis.files.wordpress.com/2014/09/lewiscurry_ar5-energy-budget-climate-sensitivity_clim-dyn2014_accepted-reformatted-edited.pdf, accessed 4/1/2016.
19 John C. Fyfe, Nathan P. Gillett and Francis W Zwiers, “Overestimated global warming over the past 20 years,” Nature Climate Change, Vol. 3, September 2013, pp. 767–769.
20 “A Factual Look at the Relationship Between Climate and Weather,” Subcommittee on Environment, Committee on Science, Space and Technology, 11 December 2013, Testimony of John R. Christy, University of Alabama in Huntsville. Available online at http://nsstc.uah.edu/users/john.christy/docs/ChristyJR_Written_131211_01.pdf

The Paris Agreement: An Assessment | 7
Figure 1: Christy’s Comparison of Actual Temperature at the Tropical Troposphere with IPCC Models
In a paper published in Geophysical Research Letters in 2013, Professor Kyle Swanson of the University of Wisconsin compared both older generation IPCC model ensembles and more recent IPCC ensembles with observed trends at various latitudes for the period 2002 to 2011.21 Swanson concludes that while the earlier generation of models had sufficient internal variability to account for the changes that occurred, the narrower variability of the new models highlights an apparent upward bias. So, where does that put us? The greenhouse effect is a good theory. Increases in atmospheric concentrations of carbon dioxide, methane and other greenhouse gases are likely to warm the atmosphere. There is also good evidence that the earth’s atmosphere has warmed over the past 150 years and that some of that warming is likely due to human emissions of various gases. But on present knowledge, and contrary to the claims made by the IPCC, it seems unlikely that future warming will be dramatic—or dangerous.
21 Kyle Swanson, “Emerging Selection Bias in Large Scale Climate Change Simulations,” Geophysical Research Letters, Vol. 40 (12), 2013, pp. 3184-3188.
Abstract available here: http://onlinelibrary.wiley.com/doi/10.1002/grl.50562/abstract, accessed 4/1/2016.
1.5
1.2
0.9
0.6
0.3
0.0
-0.3
°C
1975 1980 1985 1990 1995 2000 2005 2010 2015 2020
102 rcp4.5 model runs in 24 groupsTropical mid-tropospheric temperature5-year averages, trend line crosses zero at 1979 for all time series
ObservationsCircles - Avg 4 balloon datasetsSquares - Avg 2 satellite datasets
JR Christy. Univ. Alabama in HuntsvilleModel output: KNMI Climate Explorer
ACCESS1CanESM2CMCC-CMEC_EARTHGFDL-CM3CISS-ER-2IPSL-CMSMPI-ESM-MR24 Group Mean
bcc-csm1CCSM4CNRM-CNSFGOALSGFDL-ESM2HadGEM2MIROCSMRI-CGCM3Avg Sat
BNU-ESMCESM1CSIRO-Mk3-6-0FIO-ESMGISS-E2-HInmcm4MPI-ESM-LRNorESM1Avg Balloon

8 | Reason Foundation
P a r t 3
The Effects of Climate Change
If the recent lower estimates of ECS are correct, warming from continued human emissions of GHGs will likely be modest and its effects mild: At higher latitudes, winters will likely become a little warmer, less extreme, and the temperature range will decrease;22 precipitation will likely increase, but not everywhere, and some places will probably become drier;23 and sea levels will to continue to rise, as the oceans expand and land-based glaciers melt.24 Unfortunately, in spite of the confident pronouncements of the IPCC, more precise forecasts simply are not possible. Nonetheless, some generalizations concerning the likely consequences of these changes may plausibly be made: First, warmer summers will extend the growing season at high latitudes (i.e. much of North America, Europe, Russia, China, South Africa, Australia, New Zealand, Argentina and Chile)—indeed there is evidence that this is already occurring.25 And longer growing seasons, other things being equal, are likely to result in higher crop output. However, it is also possible that in some places warmer summers will cause unfavorable growing conditions for the crops currently being grown.26 Second, warmer summers will also likely result in additional expenditure on cooling and may cause some additional morbidity and mortality among those who are less able to cope with higher temperatures. For example, in places where diarrhea is already a serious problem, higher temperatures might cause more widespread outbreaks.27 22 Research led by Tapio Schneider of ETH Zurich and published in the Journal of Climate in 2015, finds that climate change does not lead to more extreme
winters (as some have claimed)—rather the opposite. The research is summarized here: http://phys.org/news/2015-03-climate-extreme-winters.html, accessed 4/1/2016.
23 Research by Kate Marvel and Celine Bonfils of Lawrence Livermore National Laboratory provides some tentative evidence of changes in precipitation. See: Kate Marvel and Celine Bonfils, “Identifying External Influences on Global Precipitation,” Proceedings of the National Academy of Sciences, Vol. 110 (48), pp. 19301–19306. Abstract available here: http://www.pnas.org/content/110/48/19301, accessed 4/1/2016.
24 Since the early 1990s, average sea level has risen by about 3.3mm/yr (see e.g. the research by the University of Colorado Sea Level Research group, here: http://sealevel.colorado.edu/content/2016rel1-global-mean-sea-level-time-series-seasonal-signals-retained, accessed 4/1/2016). If that trend continues—which seems likely under modest warming—by 2100, global average sea level would rise by 28cm (about 11 inches). A recent paper claimed that sea level might rise much faster—but that presumes much more rapid warming; see the observations by Pat Michaels and Chip Knappenberger here: http://wattsupwiththat.com/2016/03/31/deconto-and-pollard-an-antarctic-science-fiction-disaster-2/, accessed 4/1/2016.
25 https://www.climate.gov/news-features/featured-images/high-latitude-growing-season-getting-longer 26 For a recent analysis see: Jerry Hatfield and John Prueger, “Temperature Extremes: Effect on Plant Growth and Development,” Weather and Climate Extremes,
2015, Vol. 10 (A), pp. 4–10, available at: http://www.sciencedirect.com/science/article/pii/S2212094715300116, accessed 4/10/2016. 27 For example, a study published in 2013 found that in Botswana an increase in the length and intensity of the dry season might, all other things being equal,
result in an increase in diarrheal diseases. See: Kathleen Alexander, Marcos Carzolio, Douglas Goodin and Eric Vance, “Climate Change is Likely to Worsen the Public Health Threat of Diarrheal Disease in Botswana,” International Journal of Environmental Research and Public Health, 2013, Vol. 10, pp. 1202–1230. Available at: http://www.mdpi.com/1660-4601/10/4/1202, accessed 4/1/2016.

The Paris Agreement: An Assessment | 9
Third, warmer winters at high latitudes will likely reduce heating costs.28 They are also likely to reduce total mortality associated with temperature, since the vast majority of temperature-related deaths are due to cold weather.29 Fourth, increased precipitation may improve the productivity of existing crops.30 However, it could also increase the potential for flooding, with adverse consequences for crop production, disease and other harmful effects.31 Fifth, there is some evidence to suggest that tropical cyclones (hurricanes and typhoons) may increase in intensity (by up to 11% by 2100, at higher levels of warming) but decrease in number.32 Combined with higher sea levels, these cyclones have the potential to do more damage. To date, however, the evidence suggests that the increase in economic damage from weather-related natural disasters is almost entirely a consequence of the fact that more buildings of greater value have been located in areas affected by extreme weather events.33 Finally, additional atmospheric carbon dioxide will also directly increase yields of most crops. Indeed, this is already happening.34 Moreover, as a recent study published in Nature shows, in the context of forests, at higher carbon dioxide levels, plants tend to use water more efficiently (by reducing the size of stomata), which may at least partly off-set any reduction in precipitation.35
28 Sebastian Petrick, Katrin Rehdanz and Richard S. J. Tol, The Impact of Temperature Changes on Residential Energy Consumption, Kiel Working Paper No.
1618, April 2010. 29 A recent, very extensive analysis of the impact of temperature extremes on mortality was undertaken by a large team led by Antonio Gasparini of the London
School of Hygiene and Tropical Medicine. The team analyzed the cause of over 74 million deaths over the period 1985–2012 in 384 locations in Australia, Brazil, Canada, China, Italy, Japan, South Korea, Spain, Sweden, Taiwan, Thailand, UK, and USA. They found that cold weather caused nearly 20 times more deaths than hot weather. See: Antonio Gasparini et al. “Mortality associated with high and low ambient temperature: a multicountry observational study,” The Lancet, Vol. 386, No. 9991, pp. 369–375, July 2015. Available at: http://www.thelancet.com/journals/lancet/article/PIIS0140-6736(14)62114-0/fulltext, accessed 4/1/2016.
30 Yinhong Kang, Shahbaz Khan, and Xiaoyi Ma, “Climate change impacts on crop yield, crop water productivity and food security—A review,” Progress in Natural Science, Vol. 19, pp. 1665–1674, 2009.
31 Isaac Held and Brian Soden, “Robust Responses of the Hydrological Cycle to Global Warming,” Journal of Climate, Vol. 19, pp. 5686–5702, 2006. Available at: http://journals.ametsoc.org/doi/pdf/10.1175/JCLI3990.1, accessed 4/4/2016.
32 Thomas Knutson et al. “Tropical cyclones and climate change,” Nature Geoscience, published online: 21 February 2010. Available at: http://www.aoml.noaa.gov/hrd/Landsea/knutson-et-al-nat-geo.pdf, accessed 4/4/2016.
33 Laurens Bauer, “Have Disaster Losses Increased due to Anthropogenic Climate Change?” Bulletin of the American Meteorological Society, January 2011, pp. 39–46. http://journals.ametsoc.org/doi/abs/10.1175/2010BAMS3092.1
34 Randall J. Donohue, Michael L. Roderick, Tim R. McVicar and Graham D. Farquhar, “Impact of CO2 fertilization on maximum foliage cover across the globe's warm, arid environments,” Geophysical Research Letters, Vol. 40 (12), pp. 3031–3035, 2013. See also: L. Hartwell Allen, Jr., Jeff T. Baker, and Ken J. Boote, “The CO2 fertilization effect: higher carbohydrate production and retention as biomass and seed yield,” Rome: Food and Agriculture Organization of the United Nations. Available at: http://www.fao.org/docrep/w5183e/w5183e06.htm, accessed 4/4/2016.
35 Keenan et al, “Increase in forest water-use efficiency as atmospheric carbon dioxide concentrations rise,” Nature 499, 2013, pp. 324–327.

10 | Reason Foundation
P a r t 4
Evaluating the Effects of Climate Change In a 2009 study commissioned by the UK Commission for Economic Growth and funded by various government aid agencies along with the Hewlett Foundation and the World Bank,36 Yale University economist Robert Mendelsohn concluded that “These impacts are simply not large enough to affect economic growth this century.”37 In the same year, Richard Tol, probably the world’s leading climate economist, concluded that warming of up to 3°C compared to pre-industrial levels (i.e. about 2°C warmer than today) is likely to have net benefits for humanity.38 (This conclusion was reaffirmed in a recent working paper by Tol.39) An important feature of both Tol’s and Mendelsohn’s analyses is that humans will develop and disseminate new technologies that enable us to adapt more effectively to changes in climate. In other words, our “adaptive capacity” will increase. However, the costs and benefits are unlikely to be distributed evenly. In particular, it is likely that people in poor countries will suffer more for various reasons. First, many poor countries are in locations closer to the equator that will not experience much benefit from longer growing seasons or shorter winters but will suffer from hotter summers. Second, many poor countries—including Bangladesh and many small island states—are low-lying and thus more likely to be adversely impacted by sea-level rise. Third, poor countries are poor because they lack the conditions necessary for economic development: the institutions and culture that foster trade and innovation. As such, people in countries that remain poor are likely on net to suffer as a result of climate change. But conditions can and do change. In 1972, the year the UN held its Stockholm conference on environment and development, annual average income per capita in India and China was $130 and both were in the poorest 15% of the world’s countries. Forty years later, India’s annual per capita income had risen to $1420, a 10-fold rise, while China’s had risen to $4940, a near-40-fold increase (both figures are in “real” terms—i.e. discounting for inflation).40 Many other countries have experienced rapid growth and about three quarters 36 The Australian Agency for International Development (AusAID), the Dutch Ministry of Foreign Affairs, the Swedish International Development Cooperation
Agency (SIDA), the U.K. Department of International Development (DFID), The William and Flora Hewlett Foundation, and The World Bank Group. 37 Rober Mendelsohn, Climate Change and Economic Growth, London/Washington, D.C.: Commission on Growth and Development, available at:
https://environment.yale.edu/files/biblio/YaleFES-00000397.pdf, accessed 4/4/2016. 38 Richard S. J. Tol, “The Economic Effects of Climate Change,” Journal of Economic Perspectives, 23(2): 29–51, 2009. 39 Richard S. J. Tol, “Economic Impacts of Climate Change,” University of Sussex Working Paper No. 75-2015, 2015. Available from:
https://ideas.repec.org/p/sus/susewp/7515.html, accessed 4/4/2016. 40 World Bank, World Development Indicators (http://data.worldbank.org/data-catalog/world-development-indicators). Analysis by author.
The Paris Agreement: An Assessment | 11
grew at least five fold. On average, real per capita income in the 96 countries for which the World Bank has complete data for that period grew about 10 fold. Only three of those 96 countries experienced a less than doubling in real per capita income: Congo (which experienced a decline in average income), Liberia and Zimbabwe. The delinquent performance of those countries is largely due to persistent civil wars and other violent internal struggles that have inhibited economic activity. Ironically, the scenarios used by the IPCC to forecast future emissions presume that conditions will change. And they will change most in the scenarios associated with the largest emissions of greenhouse gases. This is because those scenarios are associated with the largest increases in economic activity and the most rapid convergence in rates of economic activity between rich and poor countries. So, in the very scenarios in which climate change is presumed to have the greatest impact, that impact will be distributed most evenly and the harms will be most readily mitigated by adaptive responses.41
41 However, while the scenarios presume that conditions will change, they offer no account as to how this will occur. As Lee Lane and David Montgomery point
out in a paper in the same special issue of the journal Climatic Change in which the IPCC scenarios are described, the scenarios provide no account of the requisite changes in culture and institutions that would underpin changes in rates of economic development, or indeed other changes that are presumed in several scenarios (such as shifts in societal values). See: Lee Lane and W. David Montgomery, “An Institutional Critique of New Climate Scenarios,” Climatic Change, Special Issue on “A Framework for the Development of New Socio-economic Scenarios for Climate Change Research” edited by Nebojsa Nakicenovic, Robert Lempert, and Anthony Janetos. 2013. Available at: https://ncar.ucar.edu/sites/default/files/isp/l-lane-an-institutional-critique.pdf

12 | Reason Foundation
P a r t 5
The Paris Agreement The Paris Agreement was negotiated under the auspices of the UN Framework Convention on Climate Change (FCCC). The preamble to the Agreement asserts that it is undertaken, “In pursuit of the objective of the Convention” (i.e. the FCCC). Article 2, which defines the Agreement’s goals, reasserts that basis:
This Agreement, in enhancing the implementation of the Convention, including its objective, aims to strengthen the global response to the threat of climate change, in the context of sustainable development and efforts to eradicate poverty, including by:
(a) Holding the increase in the global average temperature to well below 2°C above pre-industrial levels and to pursue efforts to limit the temperature increase to 1.5°C above pre-industrial levels, recognizing that this would significantly reduce the risks and impacts of climate change; (b) Increasing the ability to adapt to the adverse impacts of climate change and foster climate resilience and low greenhouse gas emissions development, in a manner that does not threaten food production; (c) Making finance flows consistent with a pathway towards low greenhouse gas emissions and climate-resilient development.
But are these goals of the Paris Agreement legitimate means of implementing the FCCC? Recall that under the UNFCCC, the injunction to limit emissions of greenhouse gases is triggered by the need to prevent “dangerous anthropogenic interference with the climate system.” If, as seems likely, human-induced warming is mild (i.e. perhaps 1°C to 1.5°C over the course of the next century) and if, as the economic analyses described above indicate, such warming is benign or even beneficial on net, then it would be incorrect to classify it as “dangerous.” As such, the Paris Agreement’s goals would seem to be inconsistent with the legal basis for limiting emissions under the FCCC. And for this reason, the Paris Agreement must either be void or must constitute a new treaty. Merely asserting that global warming of 2°C is “dangerous” does not make it so. There is no empirical evidence that a temperature increase of 2°C would result in a “tipping point” with catastrophic results, for

The Paris Agreement: An Assessment | 13
example. Its adoption as a target was a political decision driven largely by a desire to justify ratification of the Kyoto Protocol in the mid-2000s, though the idea has a long history.42 Even if limiting warming to 2°C were a desirable goal, it is not clear that express restrictions on greenhouse gas emissions will be necessary. As demonstrated in the next section, U.S. greenhouse gas emissions have declined over the past decade even as economic output has increased. The decline is largely a result of a shift from burning high-carbon coal to lower-carbon natural gas. And even if limiting the temperature rise to 2°C were desirable and cutting greenhouse gas emissions were necessary to achieve that, the cuts agreed in Paris are unlikely to be an effective means of achieving that goal. Using models developed for the Intergovernmental Panel on Climate Change (IPCC), Bjorn Lomborg calculates that “if every nation fulfills every promise by 2030, and continues to fulfill these promises faithfully until the end of the century, and there is no “CO₂ leakage” to non-committed nations, the entirety of the Paris promises will reduce temperature rises by just 0.17°C (0.306°F) by 2100.”43 And that’s being optimistic. Taking only the commitments made by nations prior to Paris (known as Intended Nationally Determined Contributions, or INDCs), which expire in 2030, the impact would be a reduction of 0.05°C.44 In addition, Lomborg’s analysis also assumes that IPCC models are accurate, which is dubious. As noted above, several studies published in respected peer-reviewed journals over the past few years have shown that on average the IPCC models estimate about twice as much warming as has occurred since 1990, so the reduction in temperature rise due to the emissions restrictions is likely to be commensurately less. Moreover, the goal of “holding the increase in global average temperatures to well below 2°C above pre-industrial levels” is likely inconsistent with the goals of “increasing the ability to adapt to adverse impacts of climate change” and “climate-resilient development.” Even minimal restrictions on emissions will divert resources into the development and use of lower-carbon technologies; that is their purpose. As a result, fewer resources will be available for the development and use of other technologies. While investments in lower-carbon technologies will probably yield some improvements in efficiency and productivity, with attendant economic growth, it is highly likely that the foregone investments in other areas would have yielded greater improvements in both productivity and efficiency—and so higher growth. We now investigate this conundrum in more detail.
42 The Carbon Brief: Two degrees: The history of climate change’s speed limit, published online at: http://www.carbonbrief.org/two-degrees-the-history-of-
climate-changes-speed-limit, accessed 4/4/2016. 43 Bjorn Lomborg, Paris climate promises will reduce temperatures by just 0.05°C in 2100, available at: http://www.lomborg.com/press-release-research-reveals-
negligible-impact-of-paris-climate-promises, accessed 4/4/2016. 44 Ibid.

14 | Reason Foundation
P a r t 6
Mitigation, Adaptation and Resilience When market participants make consumption or investment decisions that result in transactions, they do so using information that is decentralized—information that is held by those participants but is not widely known and is not accessible to central planners. As Nobel Prize winning economist Friedrich Hayek explained in his 1945 essay, The Use of Knowledge in Society, the prices that emerge from those transactions embody that decentralized information and thereby act as signals to other market participants.45 So, for example, when the price of a good widely traded on public markets, such as oil, rises, it signals that demand has risen or supply has fallen (or both). Some market participants with knowledge of the costs of supply and with access to capital and technology that might enable them to produce additional oil at a profit then make investments in oil production. If, as a result of those investments, oil production increases and if demand remains constant, the price of oil will then fall. But there is another, longer-term, effect: Competition in the supply of any good motivates investment in the development of new technologies that increase the quality of the good and/or reduce the cost of production. Thus, over the past few decades, innovative companies have developed several new technologies that have enabled them dramatically to increase production of oil and gas from reserves previously considered inaccessible. Of particular significance has been the development of hydraulic fracturing, horizontal drilling and 3D seismic imaging, which in combination have enabled the extraction of oil and natural gas from shale formations in much greater quantities and at lower cost than was previously possible.46 The expansion of production of natural gas from shale has substantially reduced its price, making it competitive with coal as a means of producing electricity.47 And because gas-fired turbines may be spun up and down much more rapidly than coal-fired turbines, gas has become an important fuel for delivering electricity during peak usage periods.48 In all, U.S. electricity generation using natural gas rose from about 20% in 2008 to over 30% in 2015, while coal’s share fell from around 50% to less than 40%.
45 Friedrich Hayek, “The Use of Knowledge in Society,” American Economic Review, Vol. 35 (4), pp. 519–30, 1945. Available at:
http://oll.libertyfund.org/titles/2486, accessed 4/4/2016. 46 Michael Quentin Morton, “Unlocking the Earth—A Short History of Hydraulic Fracturing,” GeoExpro, Vol. 10 (6), 2013. Available at:
http://www.geoexpro.com/articles/2014/02/unlocking-the-earth-a-short-history-of-hydraulic-fracturing, accessed 4/4/2016. 47 Energy Information Administration, Electricity Monthly Update. Available at: http://www.eia.gov/electricity/monthly/update/resource_use.cfm, accessed
4/4/2016. 48 Energy Information Administration, Natural gas-fired combustion turbines are generally used to meet peak electricity load, October 1, 2013. Available at:
http://www.eia.gov/todayinenergy/detail.cfm?id=13191, accessed 4/4/2016.
The Paris Agreement: An Assessment | 15
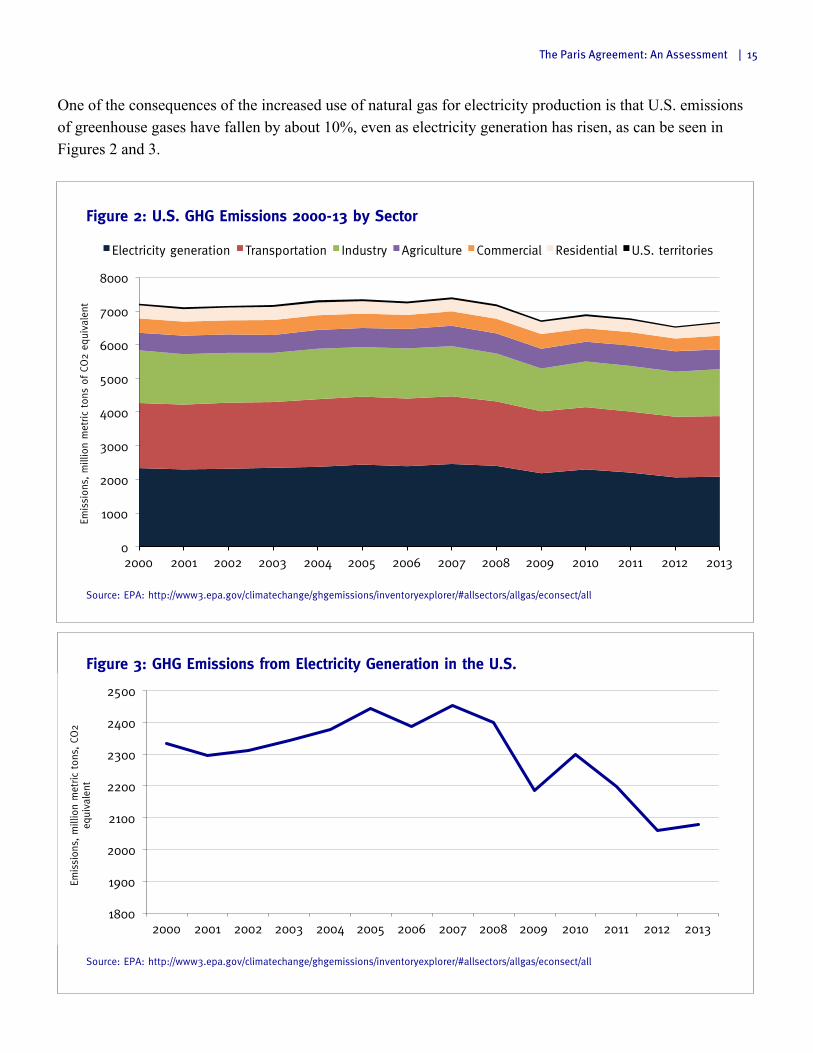
One of the consequences of the increased use of natural gas for electricity production is that U.S. emissions of greenhouse gases have fallen by about 10%, even as electricity generation has risen, as can be seen in Figures 2 and 3.
Figure 2: U.S. GHG Emissions 2000-13 by Sector
Source: EPA: http://www3.epa.gov/climatechange/ghgemissions/inventoryexplorer/#allsectors/allgas/econsect/all
Figure 3: GHG Emissions from Electricity Generation in the U.S.
Source: EPA: http://www3.epa.gov/climatechange/ghgemissions/inventoryexplorer/#allsectors/allgas/econsect/all
0
1000
2000
3000
4000
5000
6000
7000
8000
2000 2001 2002 2003 2004 2005 2006 2007 2008 2009 2010 2011 2012 2013
Emis
sion
s, m
illio
n m
etric
ton
s of
CO2
equi
vale
nt
Electricity generation Transportation Industry Agriculture Commercial Residential U.S. territories
1800
1900
2000
2100
2200
2300
2400
2500
2000 2001 2002 2003 2004 2005 2006 2007 2008 2009 2010 2011 2012 2013
Emis
sion
s, m
illio
n m
etric
ton
s, C
O2
equi
vale
nt

16 | Reason Foundation
But when governments subsidize or mandate the use of specific technologies, they distort prices, altering consumption and investment decisions. Consider, for example, the renewable fuel standard (RFS) in the U.S., which among other things requires the producers of gasoline to blend in a minimum amount of ethanol. The RFS has been primarily responsible for increasing the amount of fuel ethanol produced in the U.S. from 3.4 billion gallons in 2004 to 14.3 billion gallons in 2014. This massive increase in fuel ethanol production resulted in a tripling of the proportion of corn used for ethanol production: This year, 44% of corn grown in the U.S. will be converted to fuel ethanol, up from 15% in 2004.49 But production of corn has risen only 30%,50 while there is no evidence that underlying demand for the other uses of corn has changed. The average price of corn has doubled since 2004,51 as has the price of (wheat) flour.52 While several factors contributed to the increase in prices of food staples over the past decade, especially higher oil prices for much of that period, recent studies estimate that the RFS caused food prices globally to rise by between 20% and 30%.53 This was exacerbated during 2007 and 2008 by the imposition of restrictions on exports of food products by 32 countries,54 causing food prices to double in the space of a year, resulting in widespread increases in hunger and malnutrition—a dramatic, if temporary, reversal of a decades-long trend.55 In many places, hungry people rioted.56 There were also environmental impacts. Although corn yields have increased since 2004, the additional production still resulted in about 13% more acres being planted with corn in the U.S. In part this was achieved by converting marginal land, mainly mixed prairie grass, which has had adverse ecological consequences, including a reduction in the diversity of bird species in the Western Corn Belt.57 Moreover, by requiring the production of over one billion gallons per year of diesel from organic matter, the RFS has likely resulted in a net increase in emissions of nitrogen oxides, an important precursor of ozone,58 with potentially
49 Data from the U.S. Department of Agriculture, available at: http://www.ers.usda.gov/media/866543/cornusetable.html, accessed 4/4/2016. 50 U.S. Corn production in the period 2005–2014 was approximately 30% higher than in 1995–2004. (Data from USDA: www.nass.usda.gov) 51 Corn prices 2005–2014 averaged $4.34/bushel, up from $2.16/bushel in 1995–2004. (Data from USDA: www.nass.usda.gov) 52 See the chart produced by the U.S. Department of Agriculture, available here: http://www.ers.usda.gov/data-products/price-spreads-from-farm-to-
consumer/interactive-chart-price-spreads-and-food-markets.aspx, accessed 4/4/2016. 53 Colin Carter, Gordon Rausser and Aaron Smith, “The Effect of the US Ethanol Mandate on Corn Prices.” UC Davis monograph, 2015, available at:
http://www.ourenergypolicy.org/wp-content/uploads/2013/07/The-Effect-oftheUS-Ethanol-Mandate-on-Corn-Prices-.pdf, accessed 4/4/2016. 54 Giovanni Anania, “Agricultural Export Restrictions and the WTO,” International Centre for Trade and Sustainable Development Issue Paper 50, 2013. 55 Julia Compton, Steve Wiggins and Sharada Keats, “Impact of the Global Food Crisis on the Poor: What Is the Evidence?” London, Overseas Development Institute, 2010. 56 United Nations, “The global food crises,” Chapter 4 of The Global Social Crises, New York: United Nations, 2011, available at:
http://www.un.org/esa/socdev/rwss/docs/2011/chapter4.pdf, accessed 4/4/2016. 57 Christopher Wright and Michael Wimberly, Recent land use change in the Western Corn Belt threatens grasslands and wetlands, Proceedings of the National
Academy of Sciences, Vol. 110 (10) pp. 4134–4139, 2013, available at: http://www.ncbi.nlm.nih.gov/pmc/articles/PMC3593829/, accessed 4/4/2016. See also more generally: Joseph Fargione, Richard Plevin and Jason Hill, “The Ecological Impact of Biofuels,” Annual Reviews of Ecological and Evolutionary Systems, Vol. 41, pp. 351–77, 2010. Available at: http://rael.berkeley.edu/old_drupal/sites/default/files/Fargione,%20Plevin-%202010-%20The%20Ecological%20Impact%20of%20Biofuels.pdf, accessed 4/4/2016.
58 S. Kent Hoekman and Curtis Robbins, “Review of the effects of biodiesel on NOx emissions,” Fuel Processing Technology, Vol. 96, pp. 237–249, 2012. Available at: http://www.sciencedirect.com/science/article/pii/S0378382012000021, accessed 4/4/2016.

The Paris Agreement: An Assessment | 17
adverse health consequences.59 Last but by no means least, studies suggest that the RFS has not reduced GHG emissions—and may have increased them.60 The RFS debacle highlights the dangers of interfering in markets by mandating the production of certain goods. Yet, in spite of widespread concern over its impact, there appears to be little interest among politicians to overturn this hideous mandate. A major reason is that the RFS has created billions of dollars in benefits for a very concentrated group of individuals, land owners and ethanol producers, who have spent considerable sums lobbying to maintain it. Meanwhile, opposition to the RFS tends to be weak. One reason is that its effects are dispersed: While each of us suffers from the resultant higher food prices and many of us suffer from damage to our vehicle engines,61 not to mention concern about the reduction in species habitat resulting from increased use of marginal land, individually most of us lack the means to challenge the mandate. Another reason is that most people are unaware of the impact of the RFS. So, for now, we are stuck with it. But the RFS is far from the only government program that mandates the production of certain goods. Many states have introduced renewable portfolio standards (RPSs), which require a certain proportion of electricity to be generated using “renewable” technologies. In most cases, RPSs include specific minimum amounts of power to be generated by the renewable technologies du jour—solar and wind. But neither solar nor wind can supply power continuously, so backup power must be available as soon as the wind drops (or blows too fast) or the sun sets (or disappears behind a cloud). And in most cases, the most cost-effective backup source is small natural gas turbines that can be spun up or down very quickly. But these are not the most efficient type of gas turbine, so RPS mandates effectively result in inefficient use of natural gas. And, while small amounts of such intermittent “renewable” sources can be integrated into an electricity grid without too much difficulty, as the proportion of power from such sources grows, the problem of integration rises. The reason is simple: In any particular area, small increases or decreases in power supplied from one source can be relatively easily balanced by drawing from other sources, but the higher the proportion of intermittent sources, the larger the swings in power supply resulting from changes in wind speed and/or sunshine. To accommodate these larger swings in generation, grid operators must invest in very expensive equipment. The alternative is brown- or blackouts, which impair productivity and damage consumers’ equipment. These and many other policies—including subsidies to all forms of energy production—result in resources being diverted to the mandated and subsidized activities and away from other investments. While the intention may in part be to motivate innovation in those chosen technologies (wind, solar, etc.), the effect is to undermine other innovations. Unfortunately, we don’t know precisely which innovations won’t happen. 59 See the comments submitted by the National Association of Clean Air Agencies on the EPA’s proposed 2014 Standards for the Renewable Fuel Standard
Program, available at: http://4cleanair.org/Documents/NACAA-RFS_2014_Final_Comments-01-28-14.pdf, accessed 4/4/2016. 60 Environmental Working Group, Ethanol’s Broken Promise: Using Less Corn Ethanol Reduces Greenhouse Gas Emissions, Washington, DC: Environmental
Working Group, May 2014. Available at: http://static.ewg.org/reports/2014/ethanol_broken_promise/pdf/ethanol_broken_promise_ewg_2014.pdf, accessed 4/4/2016.
61 Older engines and smaller engines, such as those in motorbikes, boats, lawn mowers and snow blowers are not designed to run on high levels of ethanol. Moreover, when gas containing ethanol is left unused for weeks or months, as is often the case for engines used only seasonally (snow blowers, lawn mowers, etc.) the ethanol fraction separates out, leading to very high concentrations in some parts that can be extremely damaging.

18 | Reason Foundation
But we can see how past innovations—some of which might not have happened had government diverted resources away from them—have benefited society. Over the course of the past hundred years, innovators have developed new technologies that increase crop yields, reduce the incidence of waterborne and vector-borne diseases, and increase the strength of buildings. Societies in which these technologies have been adopted have become better adapted to their current climate. As the examples in the box show, the ability to adapt through technological innovation is a major source of resiliency in the face of often-hostile conditions. So, to the extent that climate change creates or exacerbates such hostile conditions, technological innovation is likely to offer a means of avoiding harm—and may even turn a threat into an opportunity.
Innovations That Have Increased Humanity’s Resilience to Climate Over the course of the past half century, new crop varieties, better and cheaper fertilizers and pesticides, more effective tilling and harvesting machines, and other innovations have resulted in average cereal yields nearly tripling since 1961, from around 0.6 tons/acre in 1961 to about 1.7 tons/acre in 2013.62 As a result of these yield increases, per capita food availability has risen dramatically, especially in Africa and Asia, and the number of people suffering from malnutrition has fallen, in spite of a doubling of the world population63—see Figure 4.
Figure 4: Food Availability, kcal per capita per day
Source: FAOstat: http://faostat.fao.org/site/609/DesktopDefault.aspx?PageID=609#ancor
62 Source: FAOSTAT, available at: http://faostat3.fao.org/browse/Q/*/E, accessed 4/4/2016. 63 FAO, The State of Food Insecurity in the World 2015, Rome: Food and Agriculture Organization of the United Nations, 2015.
1500
1700
1900
2100
2300
2500
2700
2900
3100
3300
3500
1961 1965 1969 1973 1977 1981 1985 1989 1993 1997 2001 2005 2009
World Africa Americas Asia Europe Oceania

The Paris Agreement: An Assessment | 19
The development and adoption of better water purification systems have helped to prevent a range of water-borne diseases—including diarrhea, cholera and typhoid—that tend to be worse during hot weather. Figure 5 shows the decline in typhoid fever in the United States between 1920 and 1960—a direct result of improvements in sanitation and the availability of clean water.
Figure 5: Decline in Typhoid Fever in the United States, 1920–1960
Source: Centers for Disease Control and Prevention
The development of more efficient and cost-effective cooling systems, especially air conditioning, has dramatically reduced heat-related harm to human health. In a 2014 paper published in the Journal of Environmental Health Perspectives, Jennifer Bobb et al. found that the death rate in the U.S. during heat waves (a 10°F (5.5°C) increase in same-day temperature) fell from 50 per 1,000 deaths in 1987 to 19 per 1,000 deaths in 2005, in part as a result of the increased adoption of central air conditioning.64 (The authors note that other factors, such as better treatment for heart attacks and other ailments associated with heatwaves, also likely played a significant role.)
Perhaps more important than these individual technologies is the wider impact of innovation. Suppliers of goods and services, motivated by opportunity and the threat of competition, develop new technologies that satisfy the felt needs of customers. In many cases, these technologies meet those felt needs by delivering services to consumers in ways that reduce the use of inputs compared to earlier technologies or in ways that reduce waste, or both. Widespread adoption of such technologies results in higher levels of output per unit of input, which translates into economic growth.
64 Jennifer F. Bobb, Roger D. Peng, Michelle L. Bell and Francesca Dominici, “Heat-Related Mortality and Adaptation to Heat in the United States,”
Environmental Health Perspectives, Vol. 122(8), pp. 811–816, 2014. Available at: http://ehp.niehs.nih.gov/wp-content/uploads/122/8/ehp.1307392.pdf
1920 1930 1940 1950 1960
Year
50
40
30
20
10
0
Inci
denc
e
20 | Reason Foundation
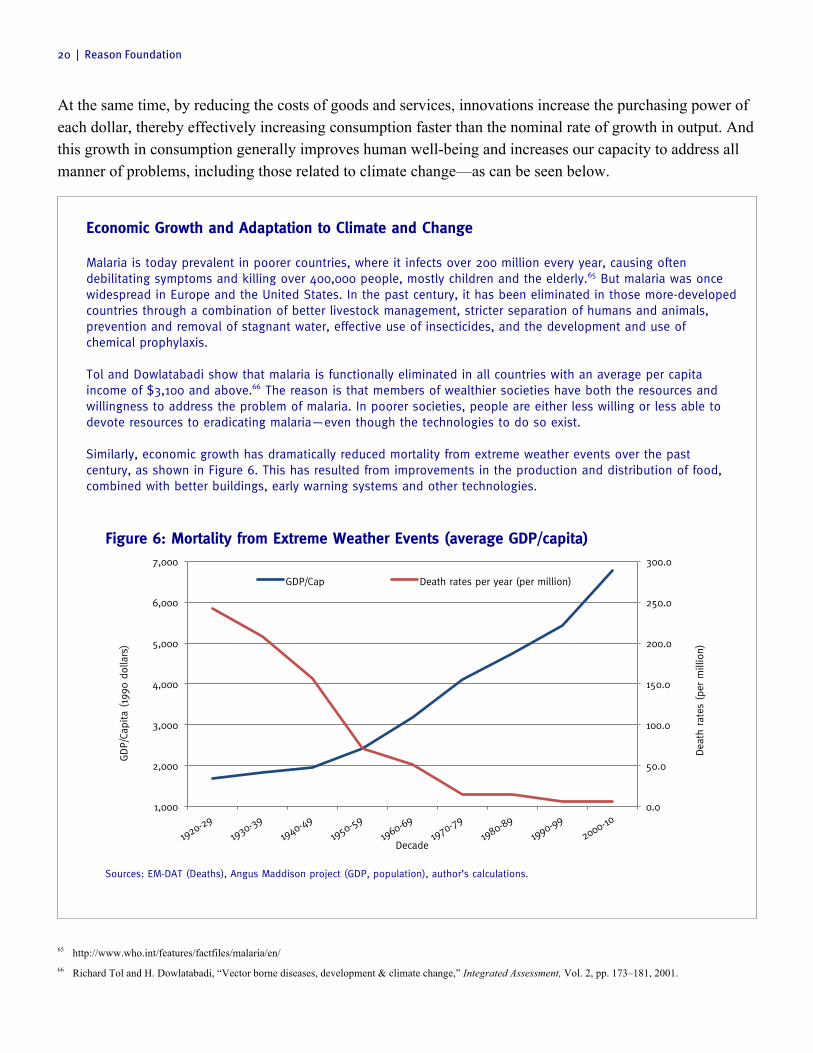
At the same time, by reducing the costs of goods and services, innovations increase the purchasing power of each dollar, thereby effectively increasing consumption faster than the nominal rate of growth in output. And this growth in consumption generally improves human well-being and increases our capacity to address all manner of problems, including those related to climate change—as can be seen below.
Economic Growth and Adaptation to Climate and Change Malaria is today prevalent in poorer countries, where it infects over 200 million every year, causing often debilitating symptoms and killing over 400,000 people, mostly children and the elderly.65 But malaria was once widespread in Europe and the United States. In the past century, it has been eliminated in those more-developed countries through a combination of better livestock management, stricter separation of humans and animals, prevention and removal of stagnant water, effective use of insecticides, and the development and use of chemical prophylaxis. Tol and Dowlatabadi show that malaria is functionally eliminated in all countries with an average per capita income of $3,100 and above.66 The reason is that members of wealthier societies have both the resources and willingness to address the problem of malaria. In poorer societies, people are either less willing or less able to devote resources to eradicating malaria—even though the technologies to do so exist. Similarly, economic growth has dramatically reduced mortality from extreme weather events over the past century, as shown in Figure 6. This has resulted from improvements in the production and distribution of food, combined with better buildings, early warning systems and other technologies.
Figure 6: Mortality from Extreme Weather Events (average GDP/capita)
Sources: EM-DAT (Deaths), Angus Maddison project (GDP, population), author’s calculations.
65 http://www.who.int/features/factfiles/malaria/en/ 66 Richard Tol and H. Dowlatabadi, “Vector borne diseases, development & climate change,” Integrated Assessment, Vol. 2, pp. 173–181, 2001.
0.0
50.0
100.0
150.0
200.0
250.0
300.0
1,000
2,000
3,000
4,000
5,000
6,000
7,000
Dea
th rat
es (pe
r m
illio
n)
GDP/
Capi
ta (19
90 d
olla
rs)
Decade
GDP/Cap Death rates per year (per million)
The Paris Agreement: An Assessment | 21
Given that new technologies and associated increases in income tend to make people less susceptible to all manner of climate-related phenomena, and given the near certainty that such technological improvements will continue well into the future with widespread benefits in terms of human well-being, it seems most likely that adaptive capacity will continue to increase over time. Implicitly, in most places people will adapt quickly and relatively painlessly to a changing climate.67 As if to confirm the continuation of such trends, in just the past few years new crop varieties have been developed that offer the potential to increase production in more extreme environments. For example, the Drought Tolerant Maize for Africa project has developed 153 new varieties of drought-tolerant maize (corn) that have the potential—now—dramatically to increase yields and reduce poverty throughout Africa.68 If people in poor countries were better able to utilize these beneficial technologies and to participate in economic activities that result in innovation and economic growth, they would be far less likely to be adversely affected by climate change.
67 As an aside, it is worth noting that many of the more pessimistic assessments of future climate change are founded on a contradiction: They assume that
economic growth will occur at a rapid pace, which (in part at least) explains the increase in emissions of carbon dioxide, while at the same time assuming that adaptation will be slow and expensive. Yet, if past economic growth has resulted from technological innovations that have generated enhancements in adaptive capacity, it seems illogical to presume that the innovations driving future economic growth won’t also result in similar enhancements, so that in the future people will adapt more quickly and thus be less—not more—susceptible to all manner of climate-related problems.
68 Natasha Gilbert, “Cross-bred crops get fit faster: Genetic engineering lags behind conventional breeding in efforts to create drought-resistant maize,” Nature, Vol. 513, p. 292, 18 September 2014. Available at: http://www.nature.com/news/cross-bred-crops-get-fit-faster-1.15940.
22 | Reason Foundation
P a r t 7
Will Climate Aid Work? The Paris Agreement rightly focuses considerable attention on the importance of adaptation and climate-resilient development. Unfortunately, the main actions proposed within the Agreement would not be conducive to either. Most obviously, mandatory restrictions on greenhouse gas emissions, such as those included in the INDCs of the U.S. and E.U. would—as noted above—divert resources into low-carbon investments rather than investments that have better prospects for leading to resilient growth or new adaptive technologies. But other elements of the Agreement are also problematic. For example, the commitment to transfer financial resources from governments of developed countries to the governments of less-developed countries raises concerns about the effectiveness of such “aid” to promote its intended ends. Extensive research over the course of the past half century shows that economic development is the result of bottom-up processes that rely upon a combination of cultural and institutional factors. Property rights, markets, freedom of contract and the rule of law are considered the key institutional factors,69 while thrift, hard work, tenacity, honesty and tolerance seem to be among the most important cultural factors.70 Societies with such institutions and cultures create an environment in which innovators and other entrepreneurs can thrive, resulting in the kinds of developments discussed above. While the broad cultural and institutional framework for development is now well understood, there is little evidence that large-scale external interventions are capable of materially improving that framework. In other words, it seems that bottom-up development processes cannot readily be manipulated from the top down. Worse, attempts to intervene to promote economic development have often backfired. There are many reasons for this. Where aid has been spent on projects intended to advance development, significant proportions of the money have often gone to companies from the donor country.71 Grandiose aid-financed projects have often crowded out local entrepreneurial activities. And where aid funding has gone toward worthwhile projects, it has often crowded out private finance, thereby undermining the development of local financial institutions.72
69 See e.g. Timothy Besley and Maitreesh Ghatak, “Property Rights and Economic Development,” in Dani Rodrik and Mark Rozenzweig, Handbook of
Development Economics, 2010; Daron Acemoglu, Pol Antras and Alhanan Helpman, “Contracts and Technology Adoption,” American Economic Review, 2007, Vol. 97 (3), pp. 917–943. Available at: http://economics.mit.edu/files/4476, accessed 4/4/2016.
70 See e.g. David Landes, The Wealth and Poverty of Nations, New York: Norton and Co., 1999. 71 For a definition of such “tied aid,” see: https://en.wikipedia.org/wiki/Tied_aid 72 Shekhar Aiyar and Ummul Ruthbah, Where did all the aid go? An empirical analysis of absorption and spending, Washington, DC: International Monetary
Fund, Working Paper, February 2008, available at: https://www.imf.org/external/pubs/ft/wp/2008/wp0834.pdf, accessed 4/4/2016.
The Paris Agreement: An Assessment | 23
But perhaps more important than all these direct effects on poor countries has been the indirect negative effect of aid on the quality of institutions. Instead of incentivizing the emergence of institutions that are supportive of innovation and economic progress, aid tends to have the opposite effect.73 There are several possible explanations for this, each of which has probably played a role. First, aid promotes political patronage: politically connected individuals and businesses expend resources to ensure that aid is channeled to them, which in turn incentivizes politicians to allocate resources in a non-transparent, non-democratic way. Second, aid tends to supplant taxes as a source of government finance, so governments that receive aid have less incentive to undertake reforms that would generate additional tax revenues by expanding the formal economy. Third, aid has often been provided not for development purposes but to support “friendly” regimes; since the purpose of such aid is explicitly to reward incumbent political elites, it is hardly surprising that those elites would utilize the aid in ways that are anti-democratic. The problem is particularly acute in countries that are less democratic, since aid tends to reinforce or amplify existing political institutional structures.74 Thus, transfers from the taxpayers of rich countries to the governments of poor countries may actually hinder the adoption of policies—especially adoption of the rule of law—that would enable people in those countries better to adapt to climate change. In other words, the proposed “solution”—resource transfers—may actually cause or worsen the problem.
73 Simeon Djankov, Jose G. Montalvo and Marta Reynal-Querol, The Curse of Aid, Washington, D.C.: The World Bank. Available at: http://www-
wds.worldbank.org/external/default/WDSContentServer/WDSP/IB/2008/09/09/000333037_20080909022045/Rendered/PDF/452540WP0Box331urse1of1aid01PUBLIC1.pdf, accessed 4/4/2016.
74 Nabamita Dutta, Peter T. Leeson and Claudia R. Williamson, “The Amplification Effect: Foreign Aid’s Impact on Political Institutions,” 2013, Kyklos, Vol. 66(2), pp. 208–228.
24 | Reason Foundation
P a r t 8
Better Policies Unfortunately, there is no simple prescription for improving a society’s culture and institutions. Moreover, any agreement that could be negotiated in the context of the FCCC is most unlikely substantially to improve the culture and institutions of societies that currently are most susceptible to climate change. Perhaps the one policy that might usefully have been pursued in Paris would have been a commitment to eliminate domestic policies that have negative impacts—such as subsidies. In Paris, there was some discussion of the importance of reducing subsidies to fossil fuels. This is encouraging, as such subsidies inflict huge economic and environmental damage on the countries that provide them. But for all the talk, there was little action. Of the governments that provide significant subsidies to fossil fuels, only India included explicit and substantive commitment to reducing those subsidies in their INDCs.75 Meanwhile, the U.S., which has touted its ambitious emission reduction goal, continues to subsidize fossil fuels to the tune of nearly $5 billion per year—and said nothing about reducing those subsidies in its INDC.76 But as noted earlier, fossil fuels are not the only energy technology being subsidized at the expense of the economy and the environment. Increasingly, subsidies are going to “renewable” energy technologies, such as ethanol, biodiesel, wind and solar. These subsidies, like those to fossil fuels, inflict both economic and ecological damage, ranging from habitat destruction (biofuels) to killing birds (windmills and thermal solar generators).77 They should be terminated forthwith. Yet, the Paris Agreement and INDCs indicate that such subsidies will actually be expanded—in the name of combatting climate change.
75 India’s INDC is here: http://www4.unfccc.int/submissions/INDC/Published%20Documents/India/1/INDIA%20INDC%20TO%20UNFCCC.pdf 76 Current U.S. subsidies to fossil fuels are estimated by the Department of the Treasury at $4.7 billion:
https://www.treasury.gov/open/Documents/USA%20FFSR%20progress%20report%20to%20G20%202014%20Final.pdf; the U.S. INDC is here: http://www4.unfccc.int/submissions/INDC/Published%20Documents/United%20States%20of%20America/1/U.S.%20Cover%20Note%20INDC%20and%20Accompanying%20Information.pdf
77 Brian Seasholes, “Cronyism Threatens the California Condor,” Orange County Register, July 22, 2013, available here: http://www.ocregister.com/articles/wind-517652-condor-government.html, accessed 4/4/2016; Brian Stallard, “How a Solar Farm Set Hundreds of Birds Ablaze,” Nature World News, Feb 23, 2015, available at: http://www.natureworldnews.com/articles/12918/20150223/solar-farm-set-hundreds-birds-ablaze.htm, accessed 4/4/2016.
The Paris Agreement: An Assessment | 25
P a r t 9
Summary and Conclusions
The Paris Agreement is predicated on the assumption that human emissions of greenhouse gases are causing the atmosphere to warm, with widespread—and possibly catastrophic—adverse consequences. The threat of climate change is portrayed as dire, necessitating urgent action to reduce emissions of greenhouse gases, as well as large-scale investments in “adaptation.” While there is good reason to believe that human emissions of greenhouse gases are warming the atmosphere, the effects of this warming may well be more benign than the Paris Agreement presumes. As such, the Agreement is likely unnecessary. But even if the climate is more sensitive to greenhouse gases than recent estimates suggest, the commitments made by governments in the form of voluntary, non-binding INDCs and adopted under the Paris Agreement will do little to reduce the rate of warming but will divert trillions of dollars into low-carbon technologies, thereby reducing innovation in other areas, slowing economic growth and hindering adaptation and resiliency. If in future commitment periods governments were to commit to more severe restrictions on greenhouse gas emissions, in the name of keeping temperatures below the arbitrary 2°C threshold, the economic impact could be catastrophic. Other (non-binding) elements of the Paris Agreement include commitments to improve resiliency and enhance adaptive capacity. But most actions that would lead to improved resiliency and adaptive capacity will come from bottom-up innovations, not top-down impositions, so there is considerable potential not only for mischief but for actions that are counterproductive. Such problems would likely be magnified if funding for top-down schemes comes in the form of government-to-government transfers. The Paris Agreement would only come into force if ratified by nations representing at least 55% of global greenhouse gas emissions. Even if it were to come into force, the Agreement currently contains no mechanism for enforcing the non-binding, voluntary commitments made under its auspices (Article 15 notwithstanding).78 Since the Paris Agreement is effectively a new treaty, in most cases ratification would require action by legislatures. The above analysis suggests that this would not be a wise course of action. 78 Article 15 alludes to the creation of a mechanism for implementing the Agreement, but this mechanism would be “non-adversarial” and “non-punitive.”

26 | Reason Foundation
About the Author
Julian Morris is vice president for research at Reason Foundation. Julian graduated from Edinburgh University in 1992 with an MA in economics. He has an MSc in environment and resource economics from University College London, an MPhil in land economics from Cambridge University, and a law degree from the University of Westminster. Julian is the author of dozens of scholarly articles on the relationship between institutions, development and environmental protection, and the editor of several books, including Sustainable Development: Promoting Progress or Perpetuating Poverty (Profile Books, 2002). Julian’s undergraduate thesis examined the costs of controlling carbon dioxide emissions and he has continued to research and write on the economics of climate change ever since, including co-authoring Global Warming: Apocalypse or Hot Air (IEA, 1994) and editing Climate Change: Challenging the Conventional Wisdom (IEA, 1997) and the Civil Society Report on Climate Change (International Policy Press, 2007). Prior to joining Reason, Julian was executive director of International Policy Network, which he co-founded. Before that, he ran the environment and technology program at the Institute of Economic Affairs.

5737 Mesmer Ave.Los Angeles, CA 90230310-391-2245reason.org