the outlook for housing in 2015 - arizona · pdf filethe outlook for housing in 2015 jonathan...
TRANSCRIPT

© 2015 Move, Inc. All rights reserved. Do not copy or distribute. 1
THE OUTLOOK FOR HOUSING IN 2015 Jonathan Smoke Chief Economist
Arizona State Association of REALTORS® | March 25, 2015

© 2015 Move, Inc. All rights reserved. Do not copy or distribute. 2
NATIONAL CONTEXT
© 2015 Move, Inc. All rights reserved. Do not copy or distribute.
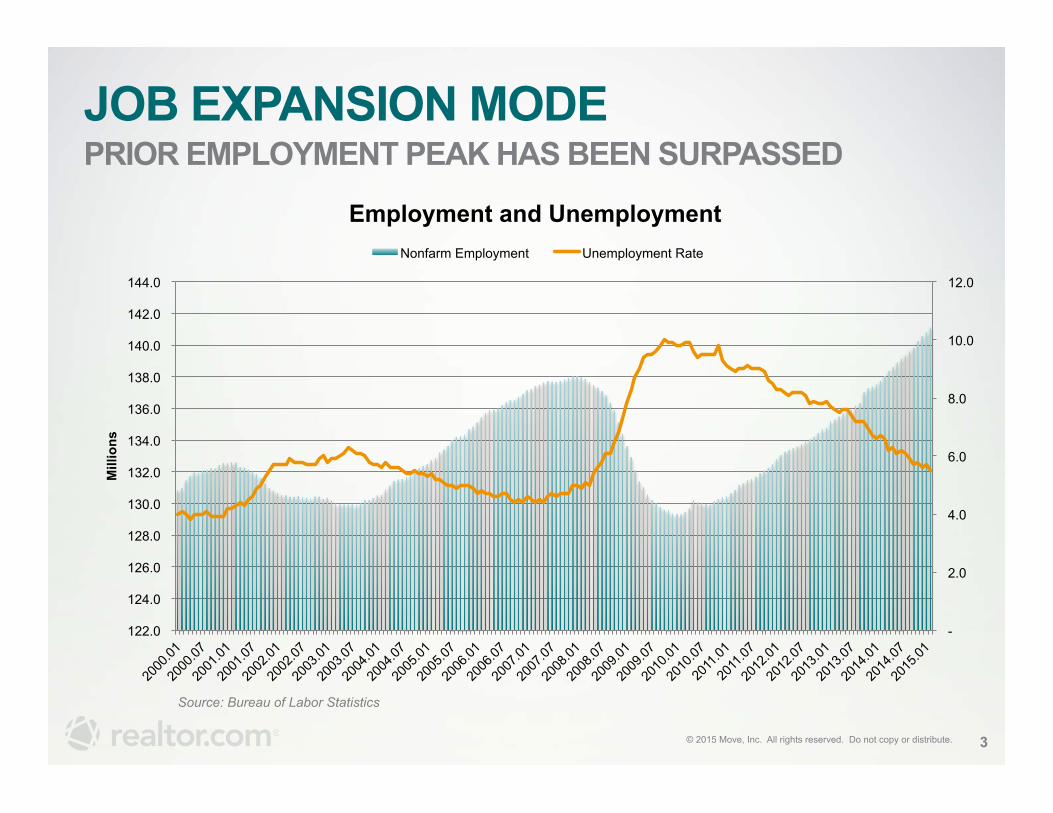
JOB EXPANSION MODE PRIOR EMPLOYMENT PEAK HAS BEEN SURPASSED
3
Source: Bureau of Labor Statistics
-
2.0
4.0
6.0
8.0
10.0
12.0
122.0
124.0
126.0
128.0
130.0
132.0
134.0
136.0
138.0
140.0
142.0
144.0
Mill
ions
Employment and Unemployment Nonfarm Employment Unemployment Rate
© 2015 Move, Inc. All rights reserved. Do not copy or distribute.
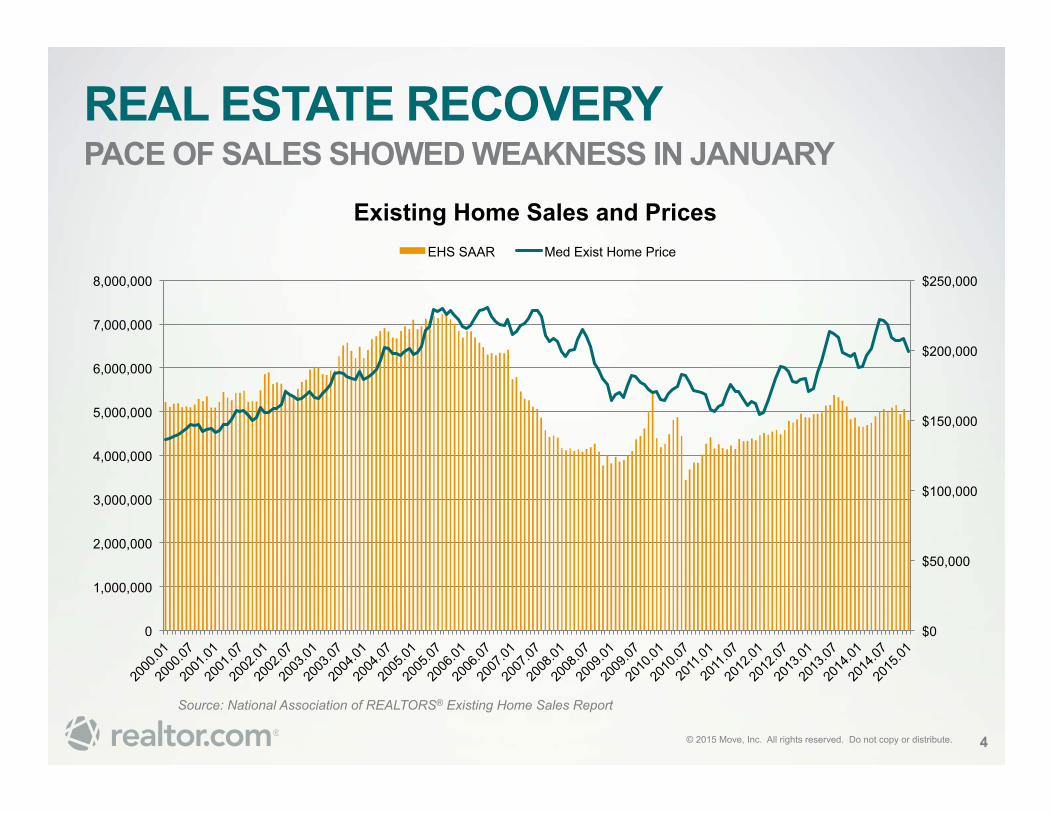
REAL ESTATE RECOVERY PACE OF SALES SHOWED WEAKNESS IN JANUARY
4
Source: National Association of REALTORS® Existing Home Sales Report
$0
$50,000
$100,000
$150,000
$200,000
$250,000
0
1,000,000
2,000,000
3,000,000
4,000,000
5,000,000
6,000,000
7,000,000
8,000,000
Existing Home Sales and Prices EHS SAAR Med Exist Home Price
© 2015 Move, Inc. All rights reserved. Do not copy or distribute.
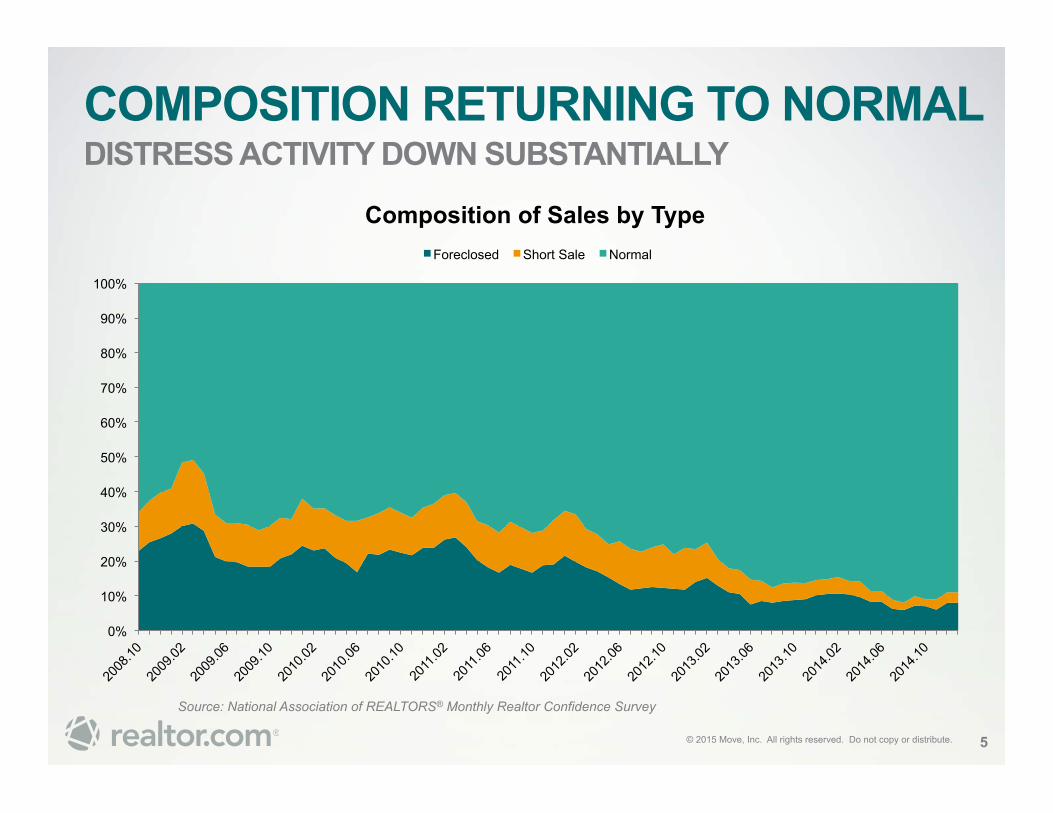
COMPOSITION RETURNING TO NORMAL DISTRESS ACTIVITY DOWN SUBSTANTIALLY
5
Source: National Association of REALTORS® Monthly Realtor Confidence Survey
0%
10%
20%
30%
40%
50%
60%
70%
80%
90%
100%
Composition of Sales by Type Foreclosed Short Sale Normal
© 2015 Move, Inc. All rights reserved. Do not copy or distribute.
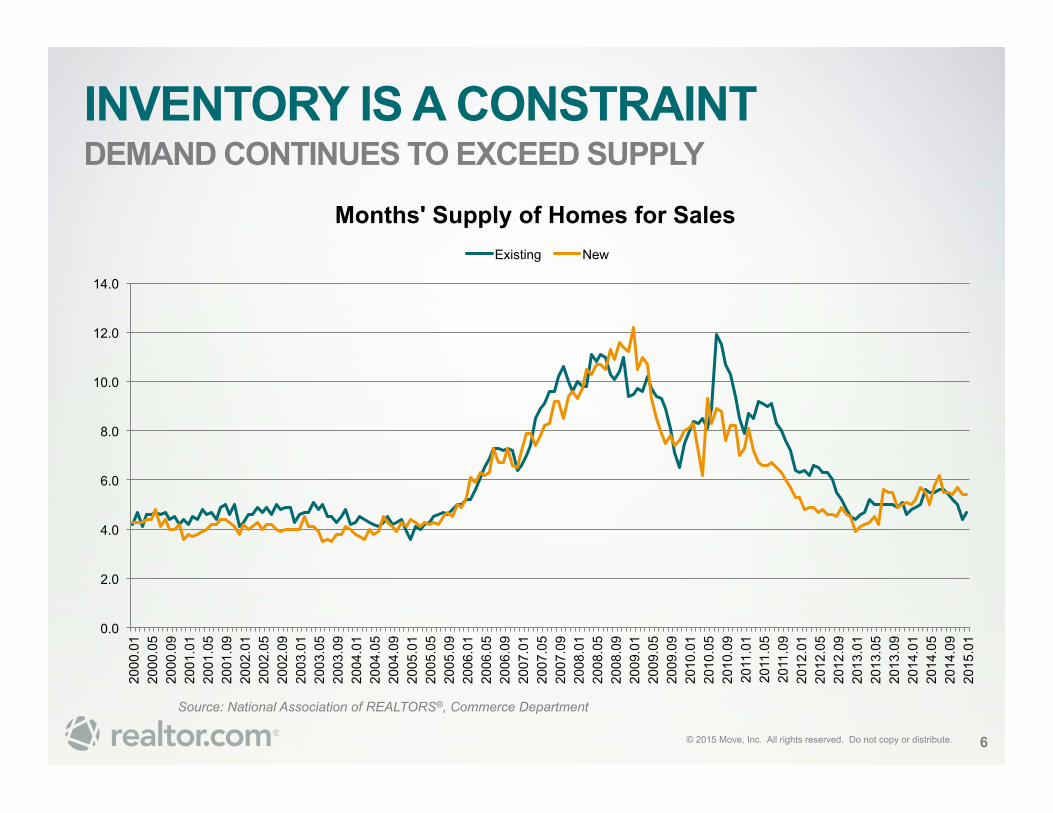
INVENTORY IS A CONSTRAINT DEMAND CONTINUES TO EXCEED SUPPLY
6
Source: National Association of REALTORS®, Commerce Department
0.0
2.0
4.0
6.0
8.0
10.0
12.0
14.0
2000
.01
2000
.05
2000
.09
2001
.01
2001
.05
2001
.09
2002
.01
2002
.05
2002
.09
2003
.01
2003
.05
2003
.09
2004
.01
2004
.05
2004
.09
2005
.01
2005
.05
2005
.09
2006
.01
2006
.05
2006
.09
2007
.01
2007
.05
2007
.09
2008
.01
2008
.05
2008
.09
2009
.01
2009
.05
2009
.09
2010
.01
2010
.05
2010
.09
2011
.01
2011
.05
2011
.09
2012
.01
2012
.05
2012
.09
2013
.01
2013
.05
2013
.09
2014
.01
2014
.05
2014
.09
2015
.01
Months' Supply of Homes for Sales Existing New
© 2015 Move, Inc. All rights reserved. Do not copy or distribute.
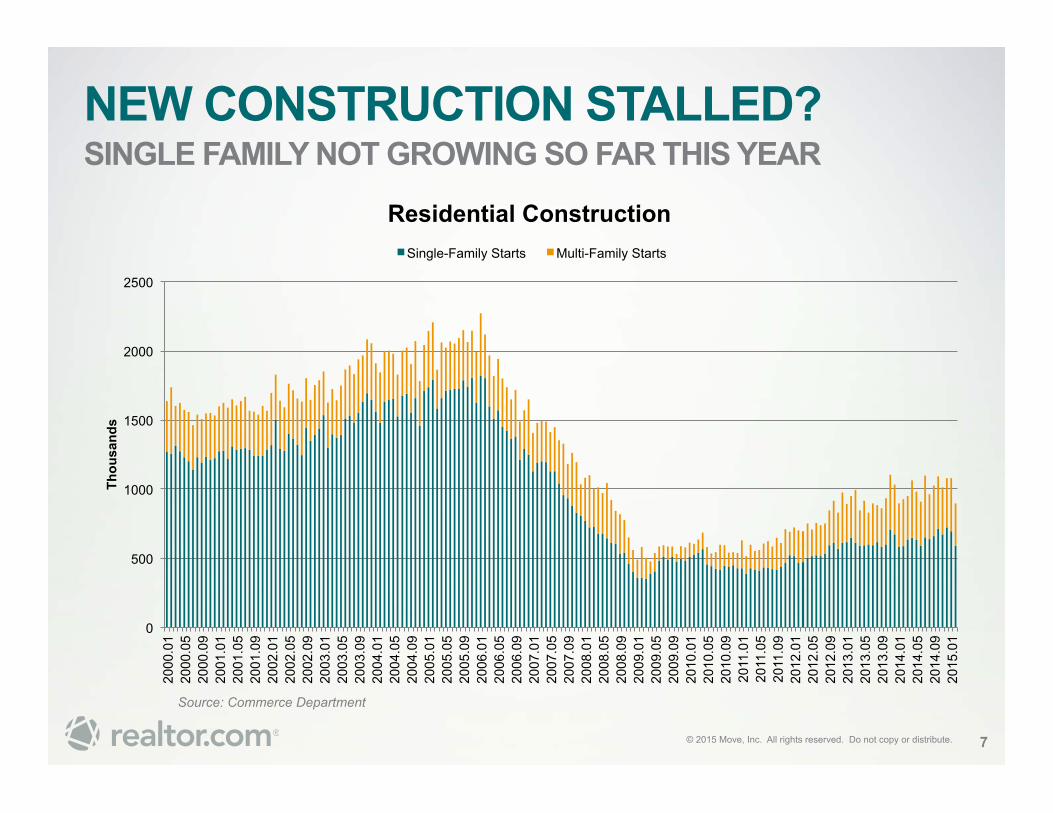
NEW CONSTRUCTION STALLED? SINGLE FAMILY NOT GROWING SO FAR THIS YEAR
7
Source: Commerce Department
0
500
1000
1500
2000
2500
2000
.01
2000
.05
2000
.09
2001
.01
2001
.05
2001
.09
2002
.01
2002
.05
2002
.09
2003
.01
2003
.05
2003
.09
2004
.01
2004
.05
2004
.09
2005
.01
2005
.05
2005
.09
2006
.01
2006
.05
2006
.09
2007
.01
2007
.05
2007
.09
2008
.01
2008
.05
2008
.09
2009
.01
2009
.05
2009
.09
2010
.01
2010
.05
2010
.09
2011
.01
2011
.05
2011
.09
2012
.01
2012
.05
2012
.09
2013
.01
2013
.05
2013
.09
2014
.01
2014
.05
2014
.09
2015
.01
Thou
sand
s
Residential Construction Single-Family Starts Multi-Family Starts
© 2015 Move, Inc. All rights reserved. Do not copy or distribute.
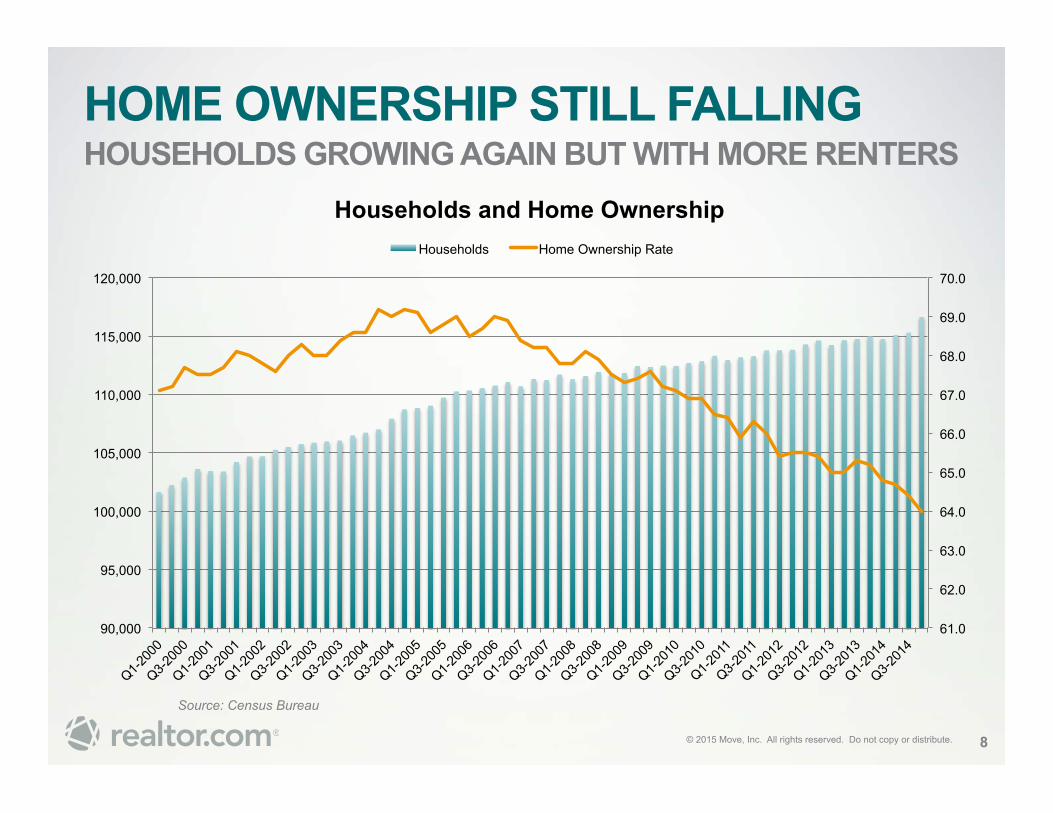
HOME OWNERSHIP STILL FALLING HOUSEHOLDS GROWING AGAIN BUT WITH MORE RENTERS
8
Source: Census Bureau
61.0
62.0
63.0
64.0
65.0
66.0
67.0
68.0
69.0
70.0
90,000
95,000
100,000
105,000
110,000
115,000
120,000
Households and Home Ownership Households Home Ownership Rate
© 2015 Move, Inc. All rights reserved. Do not copy or distribute.
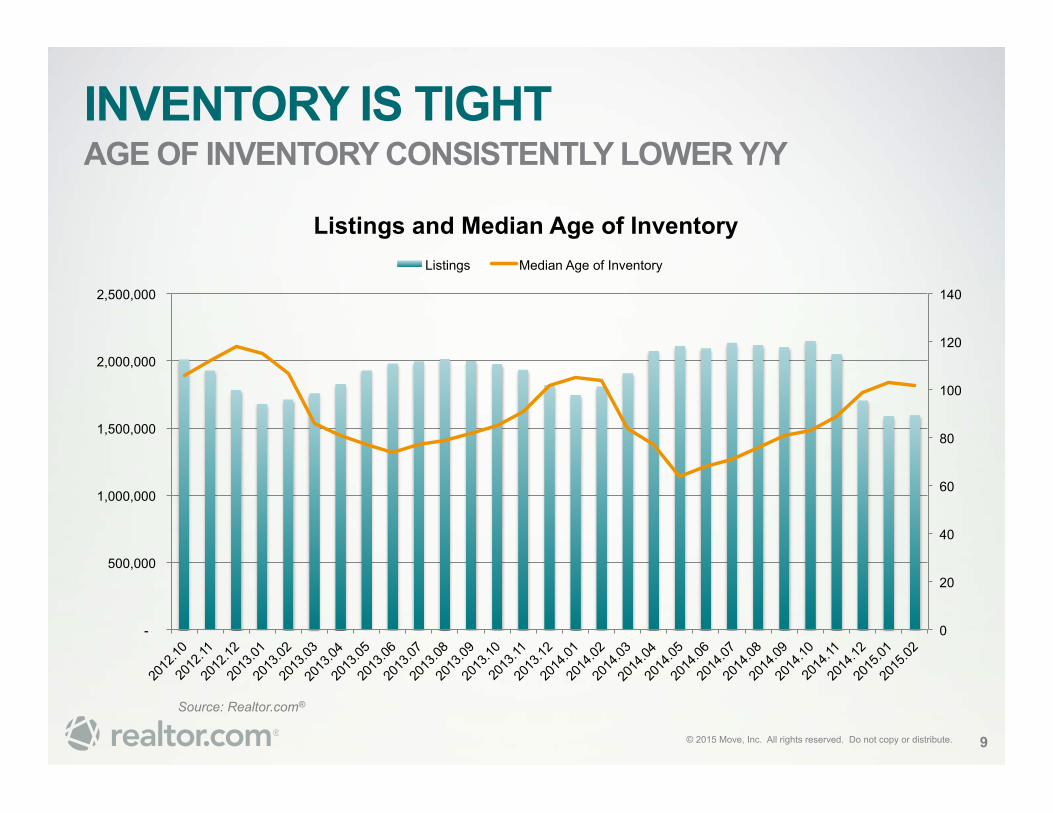
INVENTORY IS TIGHT AGE OF INVENTORY CONSISTENTLY LOWER Y/Y
9
Source: Realtor.com®
0
20
40
60
80
100
120
140
-
500,000
1,000,000
1,500,000
2,000,000
2,500,000
Listings and Median Age of Inventory Listings Median Age of Inventory
© 2015 Move, Inc. All rights reserved. Do not copy or distribute.
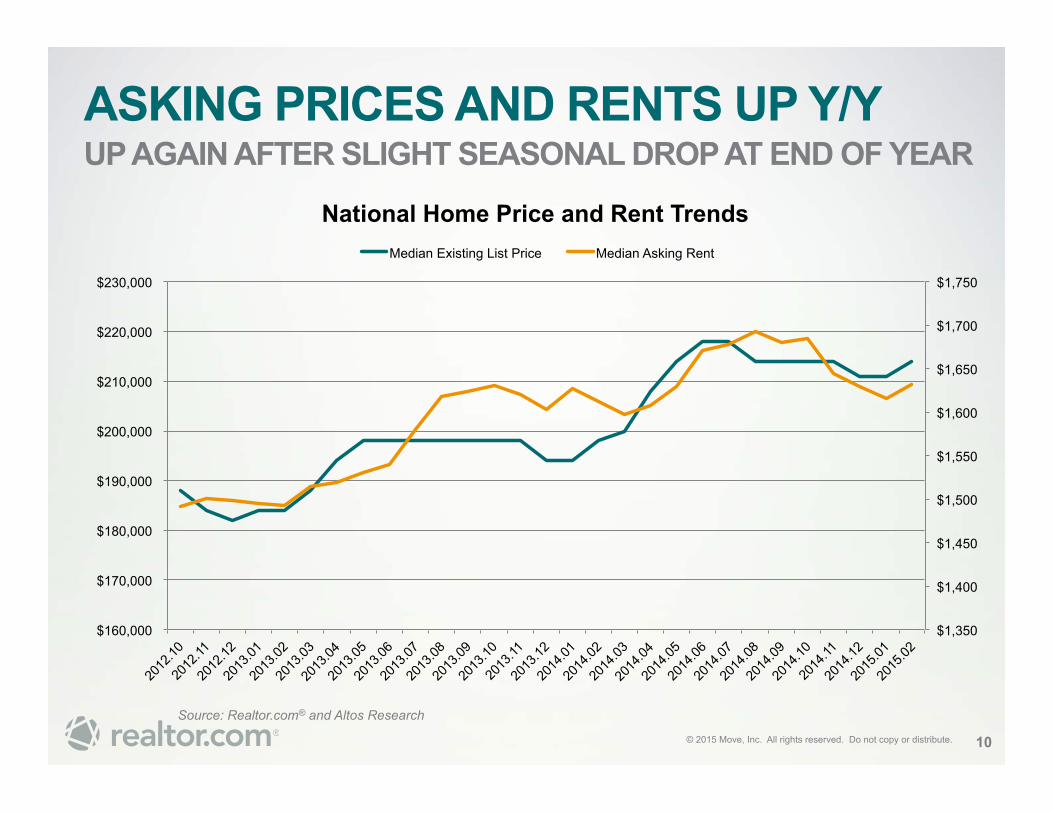
ASKING PRICES AND RENTS UP Y/Y UP AGAIN AFTER SLIGHT SEASONAL DROP AT END OF YEAR
10
Source: Realtor.com® and Altos Research
$1,350
$1,400
$1,450
$1,500
$1,550
$1,600
$1,650
$1,700
$1,750
$160,000
$170,000
$180,000
$190,000
$200,000
$210,000
$220,000
$230,000
National Home Price and Rent Trends Median Existing List Price Median Asking Rent
© 2015 Move, Inc. All rights reserved. Do not copy or distribute.
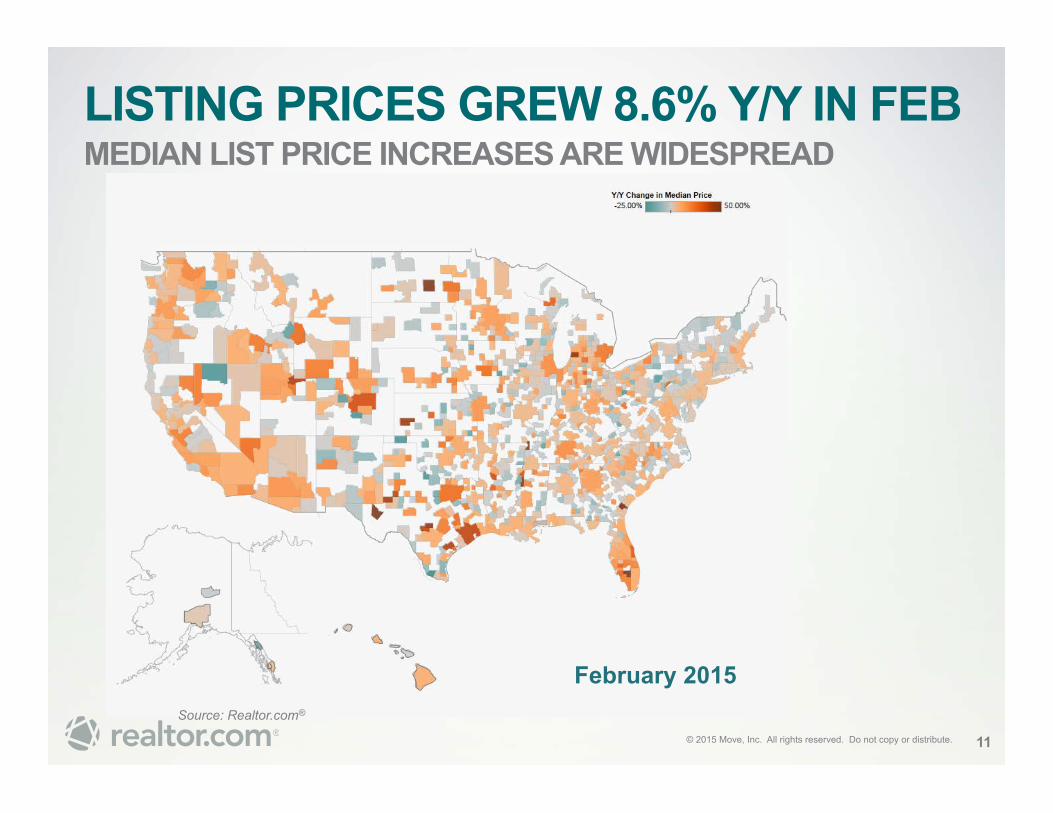
LISTING PRICES GREW 8.6% Y/Y IN FEB MEDIAN LIST PRICE INCREASES ARE WIDESPREAD
11
February 2015 Source: Realtor.com®
© 2015 Move, Inc. All rights reserved. Do not copy or distribute.
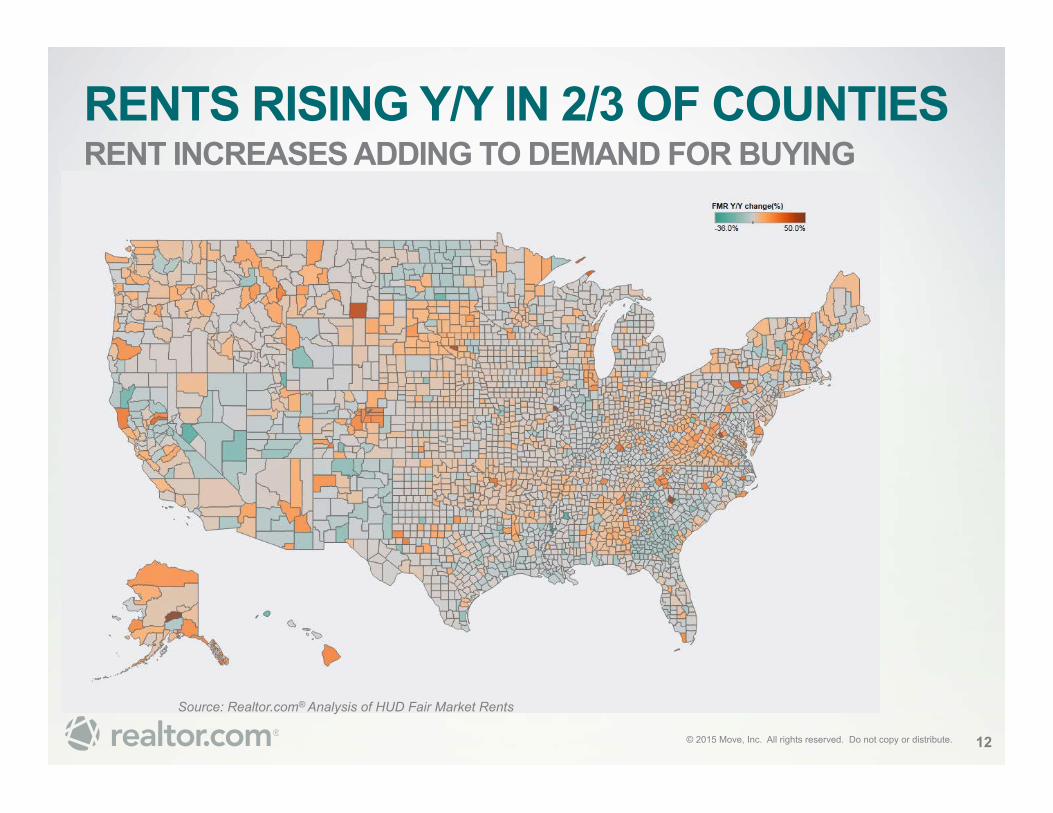
RENTS RISING Y/Y IN 2/3 OF COUNTIES RENT INCREASES ADDING TO DEMAND FOR BUYING
Source: Realtor.com® Analysis of HUD Fair Market Rents
12
© 2015 Move, Inc. All rights reserved. Do not copy or distribute.
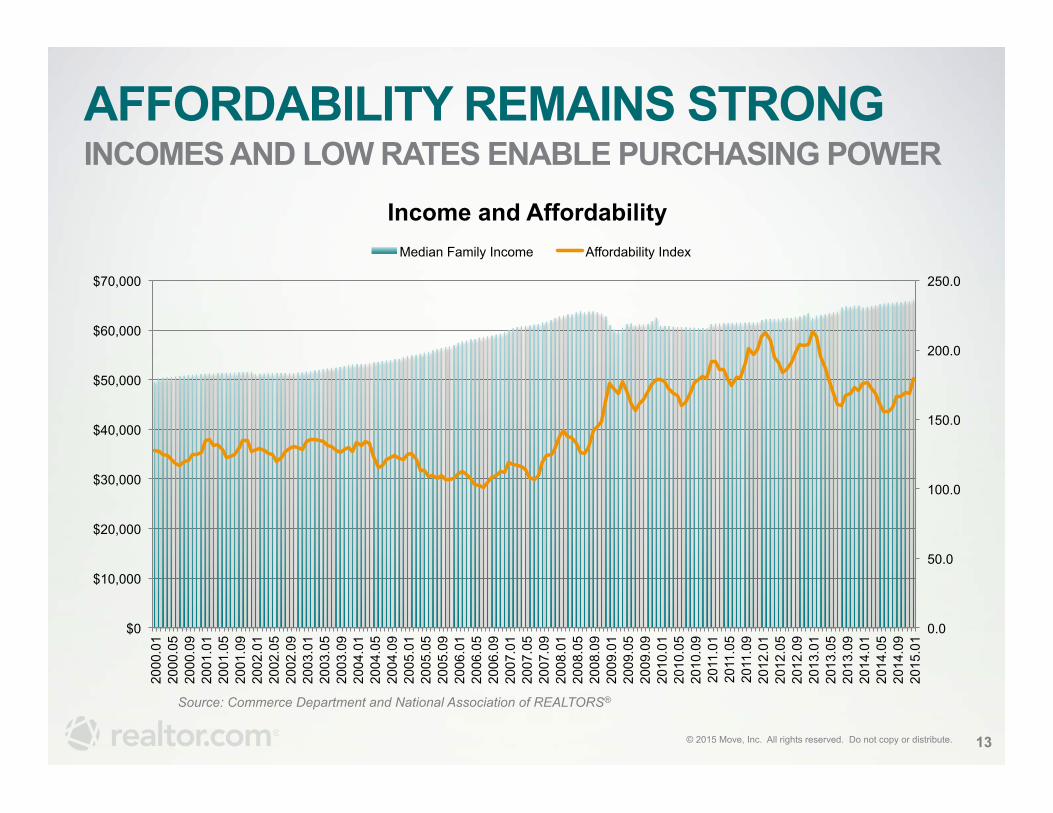
AFFORDABILITY REMAINS STRONG INCOMES AND LOW RATES ENABLE PURCHASING POWER
13
Source: Commerce Department and National Association of REALTORS®
0.0
50.0
100.0
150.0
200.0
250.0
$0
$10,000
$20,000
$30,000
$40,000
$50,000
$60,000
$70,000
2000
.01
2000
.05
2000
.09
2001
.01
2001
.05
2001
.09
2002
.01
2002
.05
2002
.09
2003
.01
2003
.05
2003
.09
2004
.01
2004
.05
2004
.09
2005
.01
2005
.05
2005
.09
2006
.01
2006
.05
2006
.09
2007
.01
2007
.05
2007
.09
2008
.01
2008
.05
2008
.09
2009
.01
2009
.05
2009
.09
2010
.01
2010
.05
2010
.09
2011
.01
2011
.05
2011
.09
2012
.01
2012
.05
2012
.09
2013
.01
2013
.05
2013
.09
2014
.01
2014
.05
2014
.09
2015
.01
Income and Affordability Median Family Income Affordability Index
© 2015 Move, Inc. All rights reserved. Do not copy or distribute.
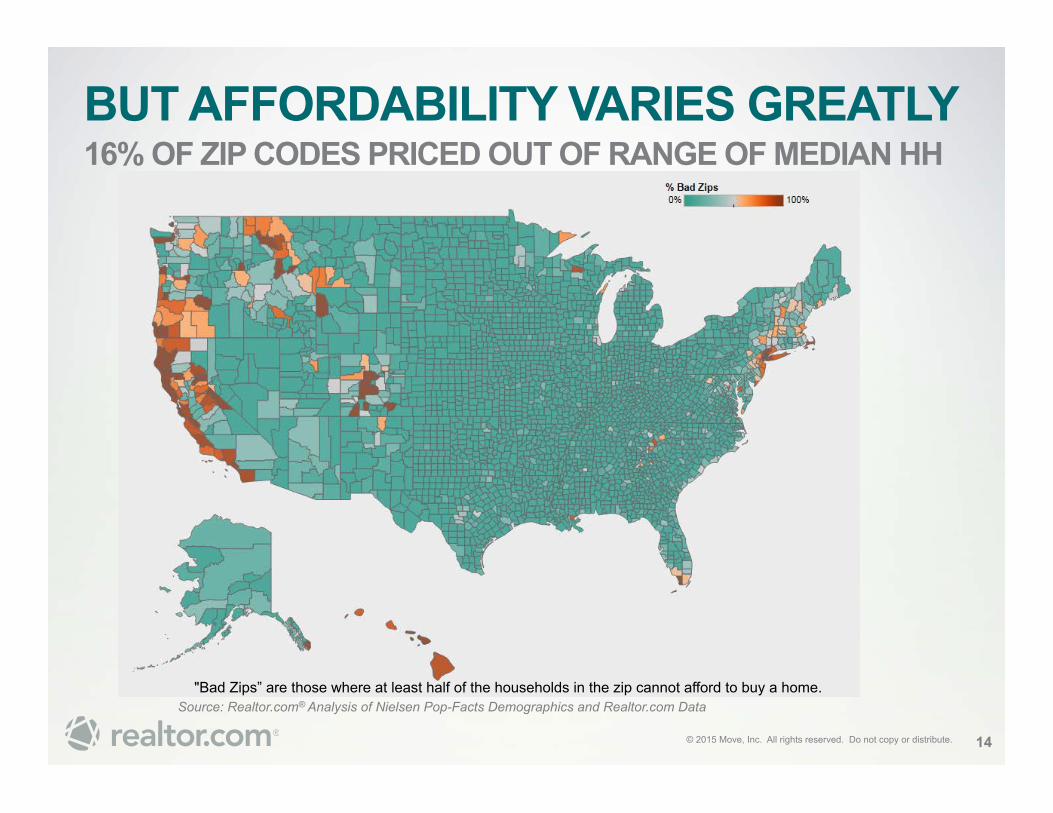
BUT AFFORDABILITY VARIES GREATLY 16% OF ZIP CODES PRICED OUT OF RANGE OF MEDIAN HH
Source: Realtor.com® Analysis of Nielsen Pop-Facts Demographics and Realtor.com Data
14
"Bad Zips” are those where at least half of the households in the zip cannot afford to buy a home.
© 2015 Move, Inc. All rights reserved. Do not copy or distribute.
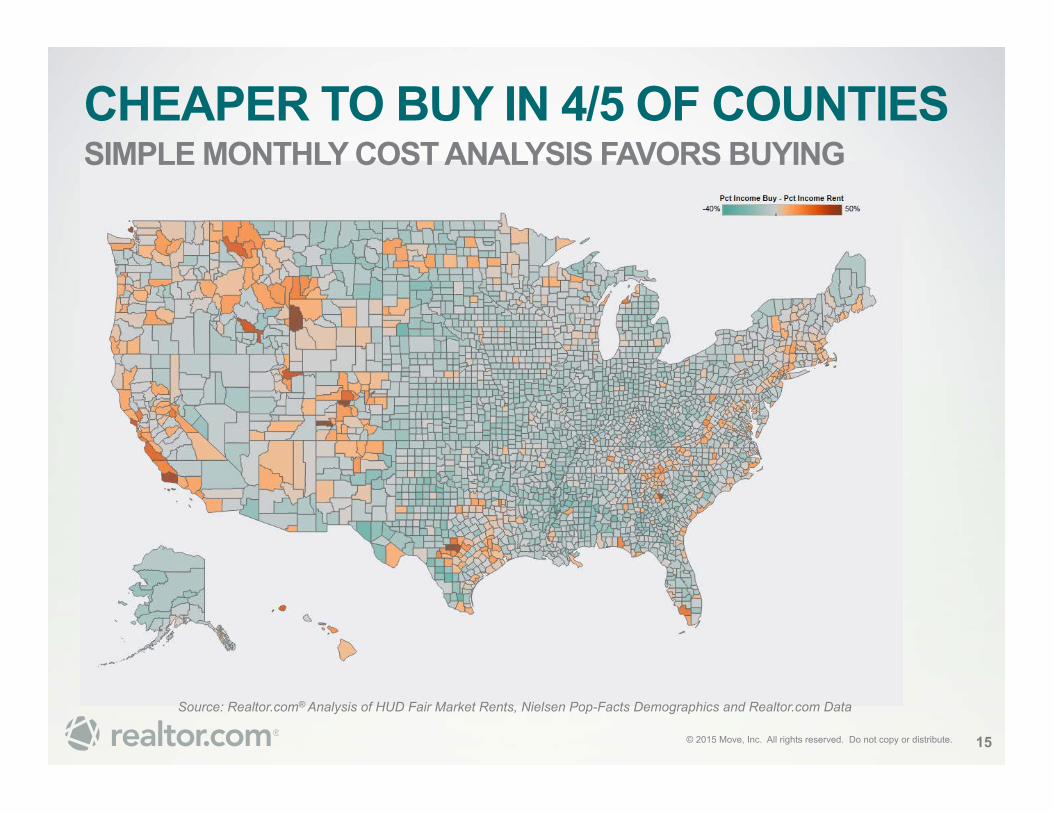
CHEAPER TO BUY IN 4/5 OF COUNTIES SIMPLE MONTHLY COST ANALYSIS FAVORS BUYING
Source: Realtor.com® Analysis of HUD Fair Market Rents, Nielsen Pop-Facts Demographics and Realtor.com Data
15
© 2015 Move, Inc. All rights reserved. Do not copy or distribute.
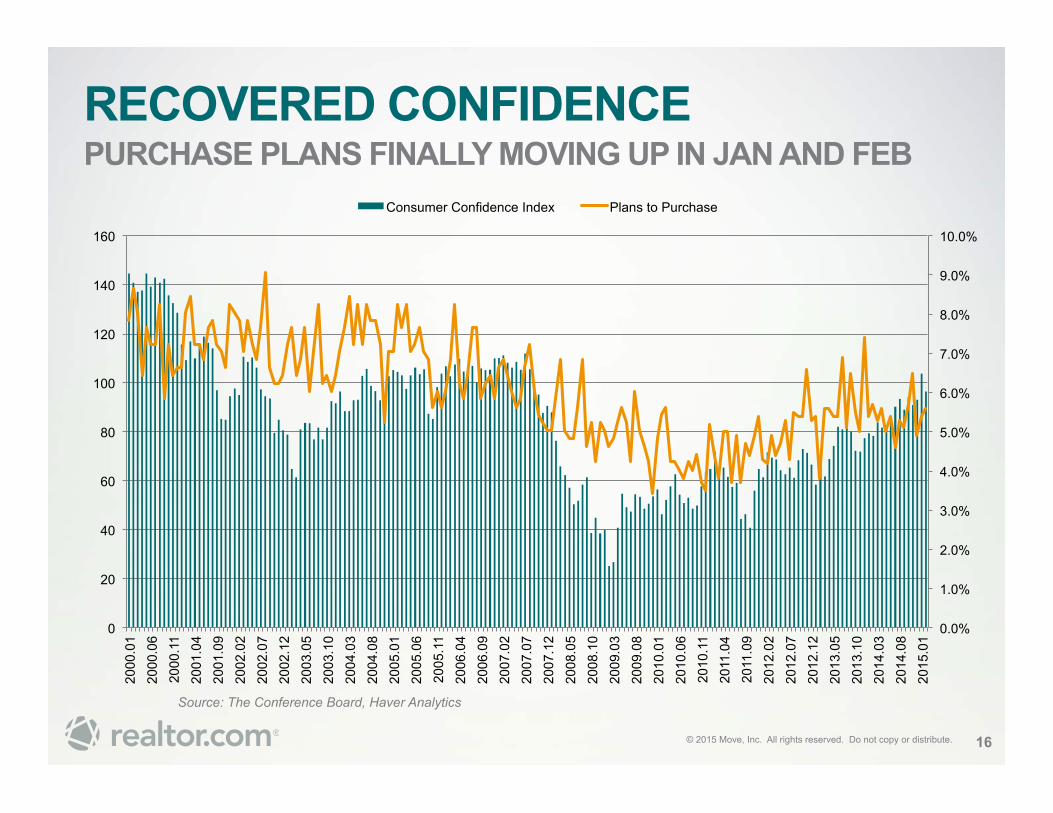
RECOVERED CONFIDENCE PURCHASE PLANS FINALLY MOVING UP IN JAN AND FEB
16
Source: The Conference Board, Haver Analytics
0.0%
1.0%
2.0%
3.0%
4.0%
5.0%
6.0%
7.0%
8.0%
9.0%
10.0%
0
20
40
60
80
100
120
140
160
2000
.01
2000
.06
2000
.11
2001
.04
2001
.09
2002
.02
2002
.07
2002
.12
2003
.05
2003
.10
2004
.03
2004
.08
2005
.01
2005
.06
2005
.11
2006
.04
2006
.09
2007
.02
2007
.07
2007
.12
2008
.05
2008
.10
2009
.03
2009
.08
2010
.01
2010
.06
2010
.11
2011
.04
2011
.09
2012
.02
2012
.07
2012
.12
2013
.05
2013
.10
2014
.03
2014
.08
2015
.01
Consumer Confidence Index Plans to Purchase
© 2015 Move, Inc. All rights reserved. Do not copy or distribute.
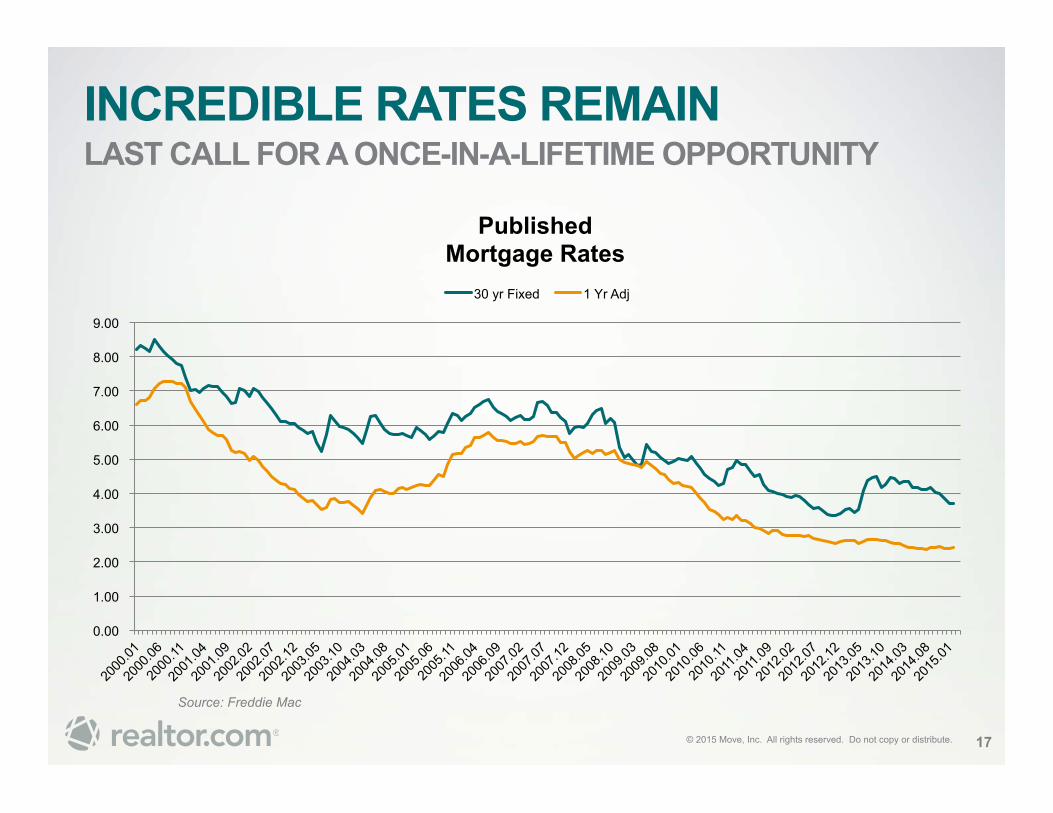
INCREDIBLE RATES REMAIN LAST CALL FOR A ONCE-IN-A-LIFETIME OPPORTUNITY
17
Source: Freddie Mac
0.00
1.00
2.00
3.00
4.00
5.00
6.00
7.00
8.00
9.00
Published Mortgage Rates
30 yr Fixed 1 Yr Adj

© 2015 Move, Inc. All rights reserved. Do not copy or distribute. 18
DEMAND DRIVERS
© 2015 Move, Inc. All rights reserved. Do not copy or distribute.
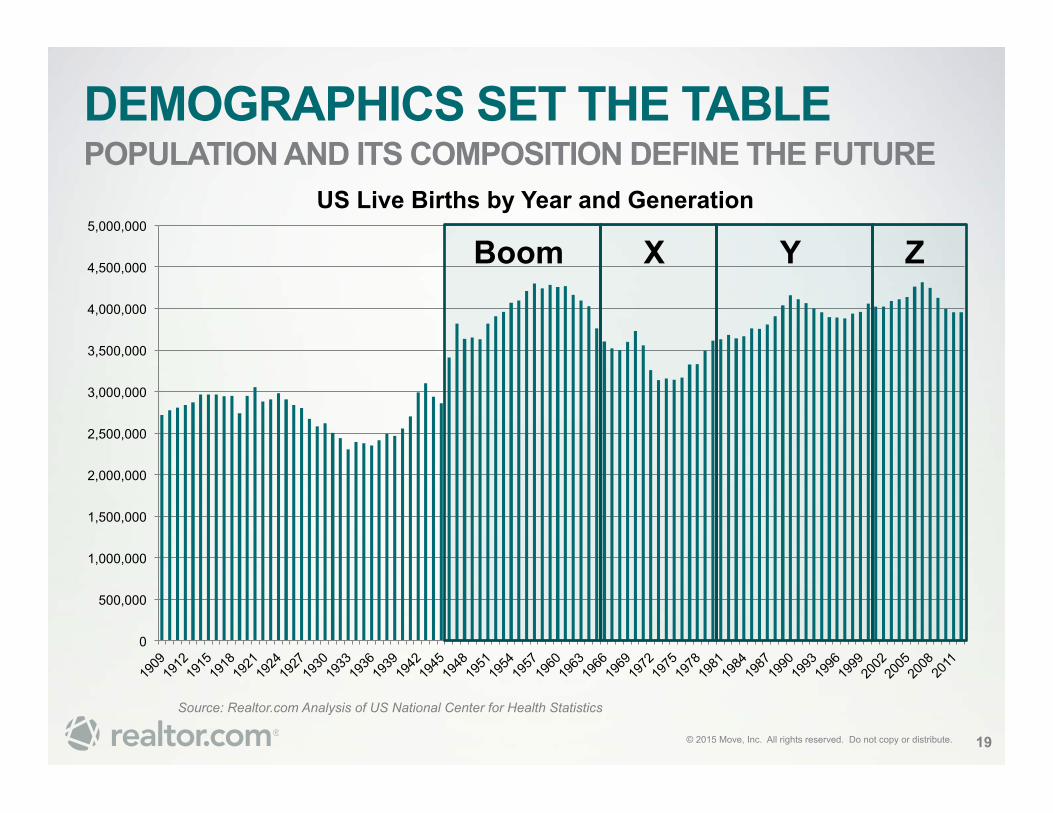
DEMOGRAPHICS SET THE TABLE POPULATION AND ITS COMPOSITION DEFINE THE FUTURE
19
Source: Realtor.com Analysis of US National Center for Health Statistics
0
500,000
1,000,000
1,500,000
2,000,000
2,500,000
3,000,000
3,500,000
4,000,000
4,500,000
5,000,000
US Live Births by Year and Generation
Boom X Y Z
© 2015 Move, Inc. All rights reserved. Do not copy or distribute.
0
50,000,000
100,000,000
150,000,000
200,000,000
250,000,000
300,000,000
350,000,000
2015 2020
Population by Age (United States) Under 25 25-34 35-54 55+
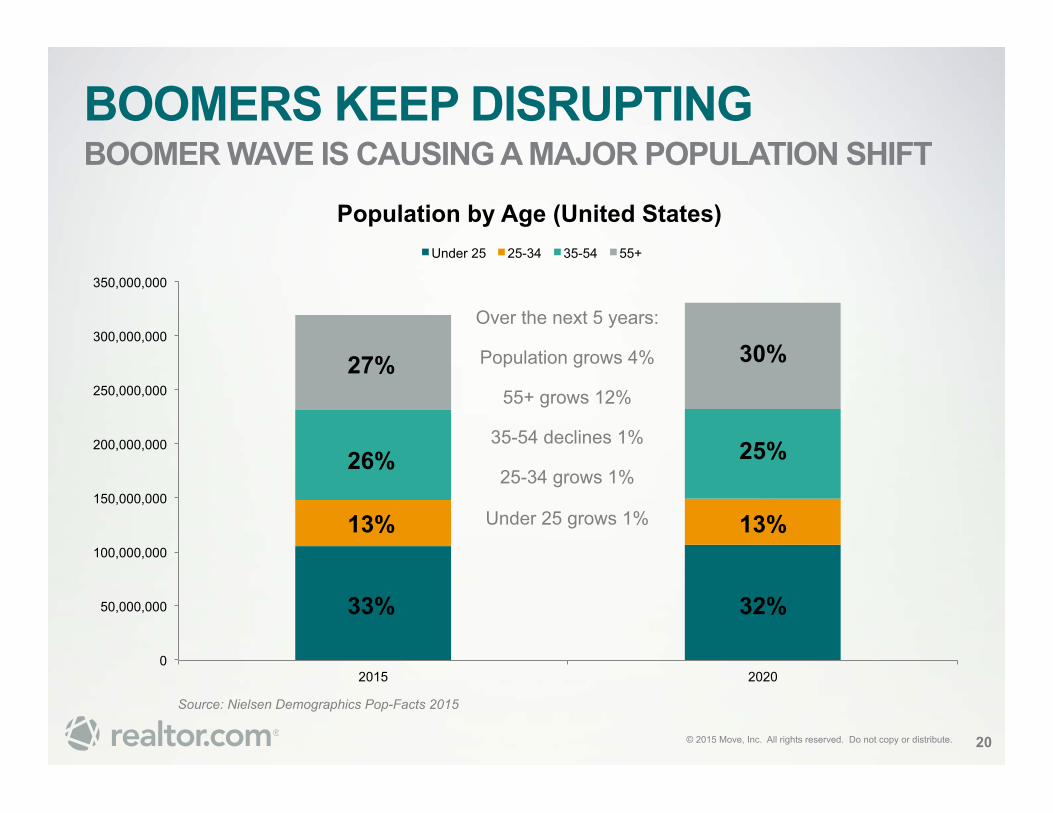
BOOMERS KEEP DISRUPTING BOOMER WAVE IS CAUSING A MAJOR POPULATION SHIFT
20
Source: Nielsen Demographics Pop-Facts 2015
Over the next 5 years:
Population grows 4%
55+ grows 12%
35-54 declines 1%
25-34 grows 1%
Under 25 grows 1%
27%
26%
13%
33%
30%
25%
13%
32%
© 2015 Move, Inc. All rights reserved. Do not copy or distribute.
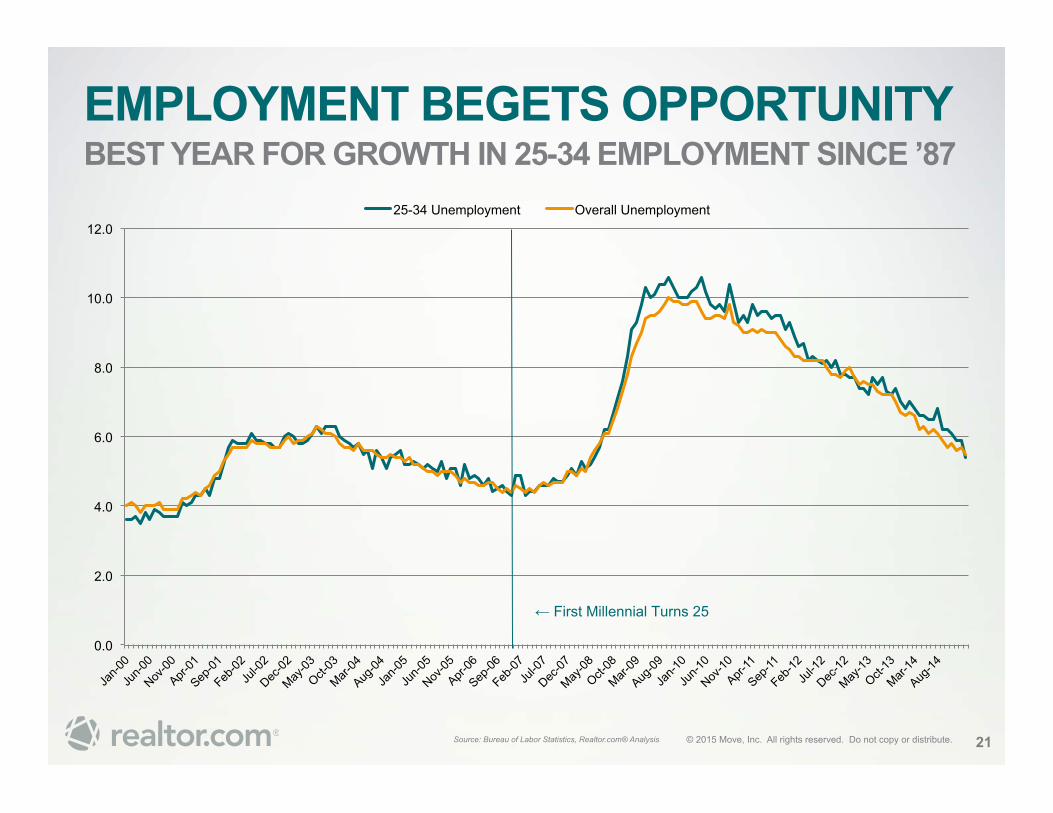
EMPLOYMENT BEGETS OPPORTUNITY BEST YEAR FOR GROWTH IN 25-34 EMPLOYMENT SINCE ’87
21 Source: Bureau of Labor Statistics, Realtor.com® Analysis
0.0
2.0
4.0
6.0
8.0
10.0
12.0 25-34 Unemployment Overall Unemployment
← First Millennial Turns 25
© 2015 Move, Inc. All rights reserved. Do not copy or distribute.
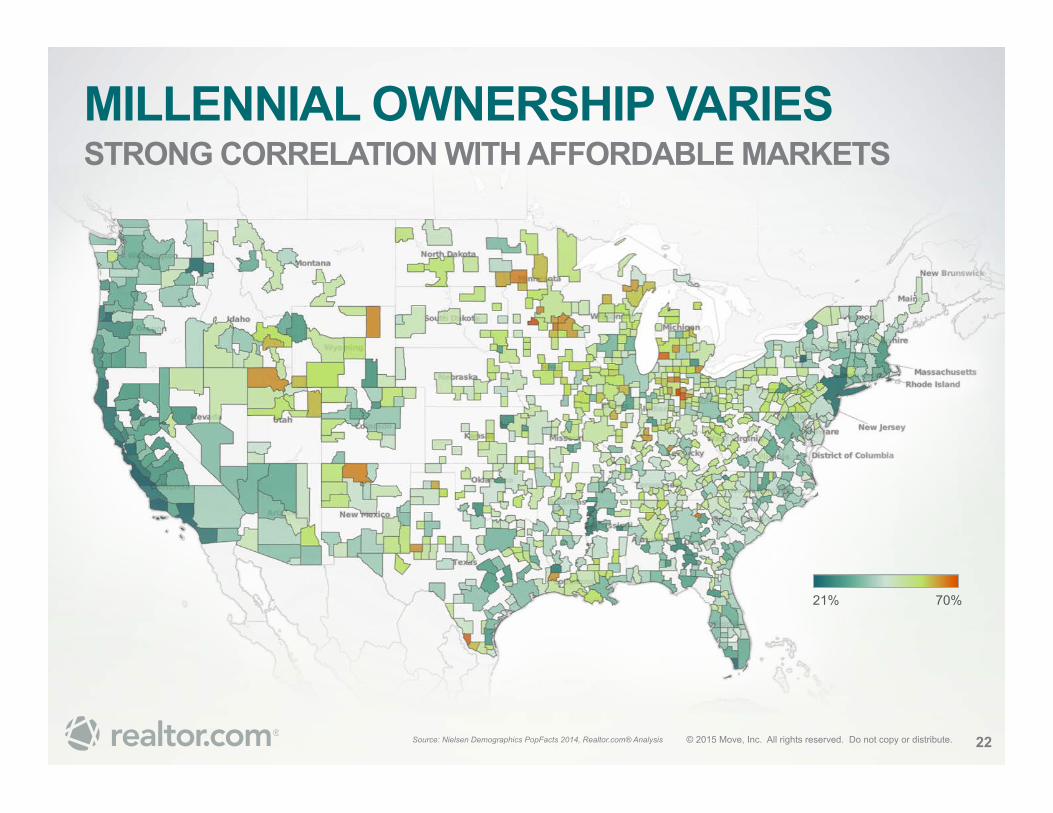
MILLENNIAL OWNERSHIP VARIES STRONG CORRELATION WITH AFFORDABLE MARKETS
22 Source: Nielsen Demographics PopFacts 2014, Realtor.com® Analysis
21% 70%
© 2015 Move, Inc. All rights reserved. Do not copy or distribute.
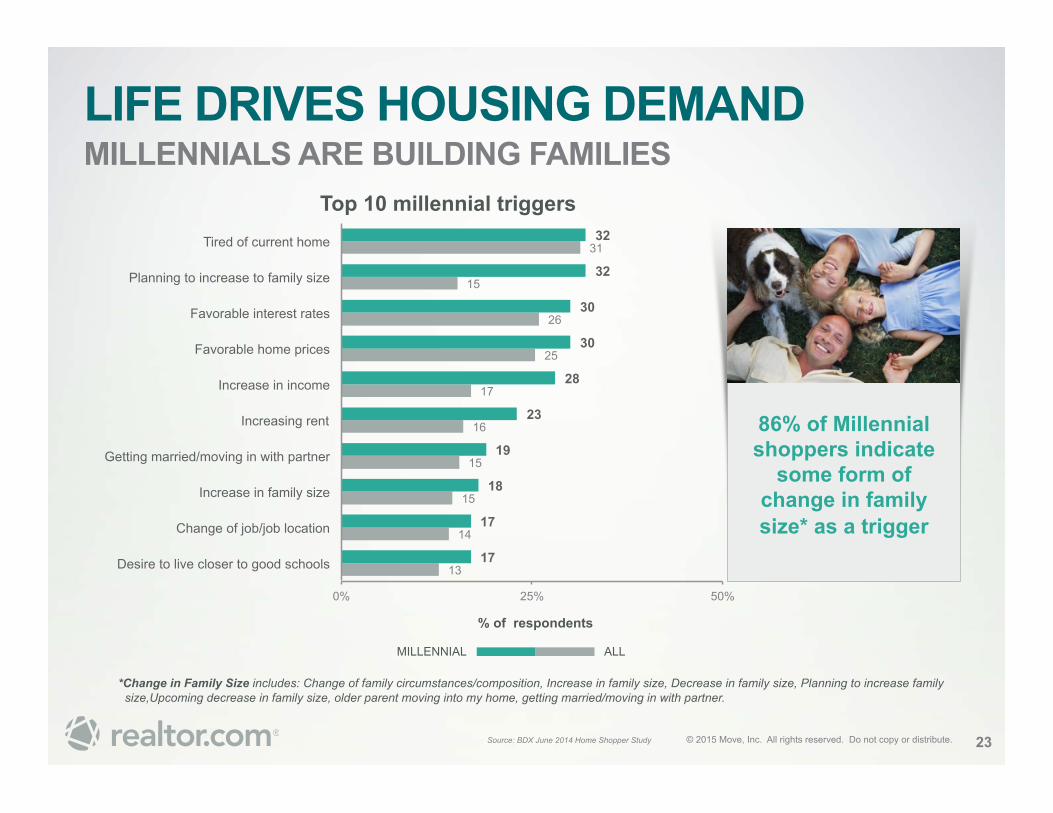
13
14
15
15
16
17
25
26
15
31
17
17
18
19
23
28
30
30
32
32
0% 25% 50%
Desire to live closer to good schools
Change of job/job location
Increase in family size
Getting married/moving in with partner
Increasing rent
Increase in income
Favorable home prices
Favorable interest rates
Planning to increase to family size
Tired of current home
% of respondents
Top 10 millennial triggers
LIFE DRIVES HOUSING DEMAND MILLENNIALS ARE BUILDING FAMILIES
86% of Millennial shoppers indicate
some form of change in family size* as a trigger
*Change in Family Size includes: Change of family circumstances/composition, Increase in family size, Decrease in family size, Planning to increase family size,Upcoming decrease in family size, older parent moving into my home, getting married/moving in with partner.
Source: BDX June 2014 Home Shopper Study 23
ALL MILLENNIAL
© 2015 Move, Inc. All rights reserved. Do not copy or distribute.
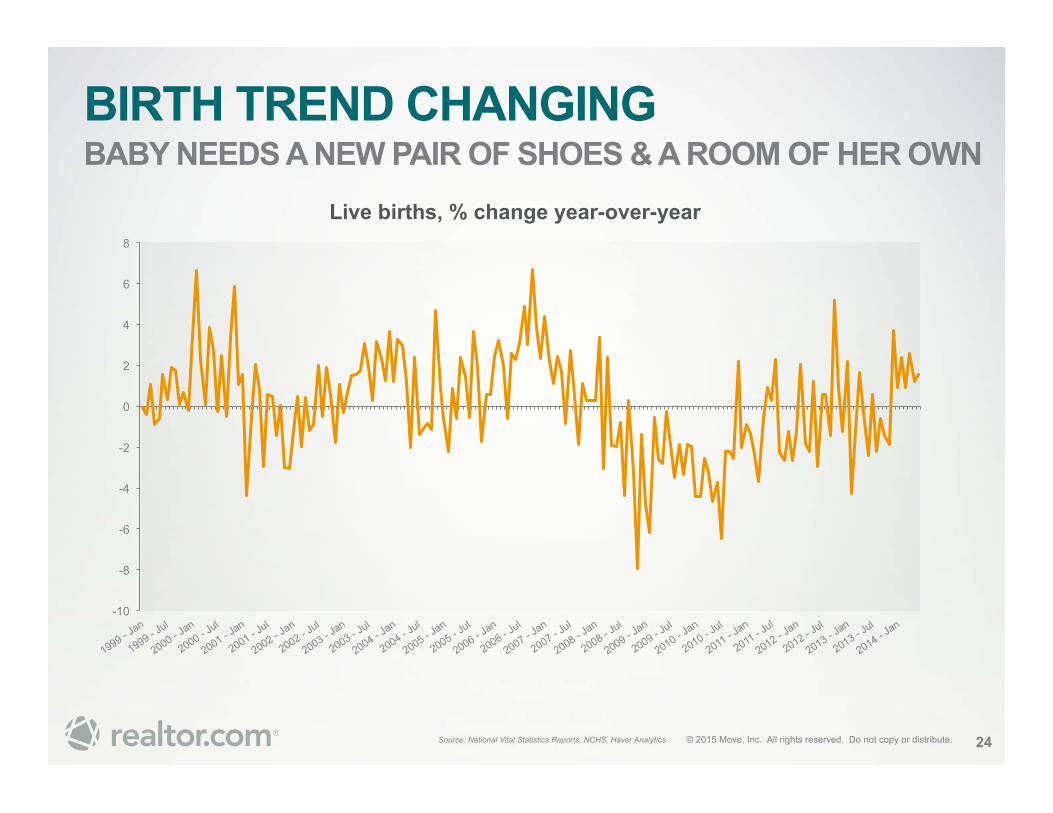
BIRTH TREND CHANGING BABY NEEDS A NEW PAIR OF SHOES & A ROOM OF HER OWN
24
-10
-8
-6
-4
-2
0
2
4
6
8
Live births, % change year-over-year
Source: National Vital Statistics Reports, NCHS, Haver Analytics

© 2015 Move, Inc. All rights reserved. Do not copy or distribute. 25
WE COULD DO MORE
© 2015 Move, Inc. All rights reserved. Do not copy or distribute.
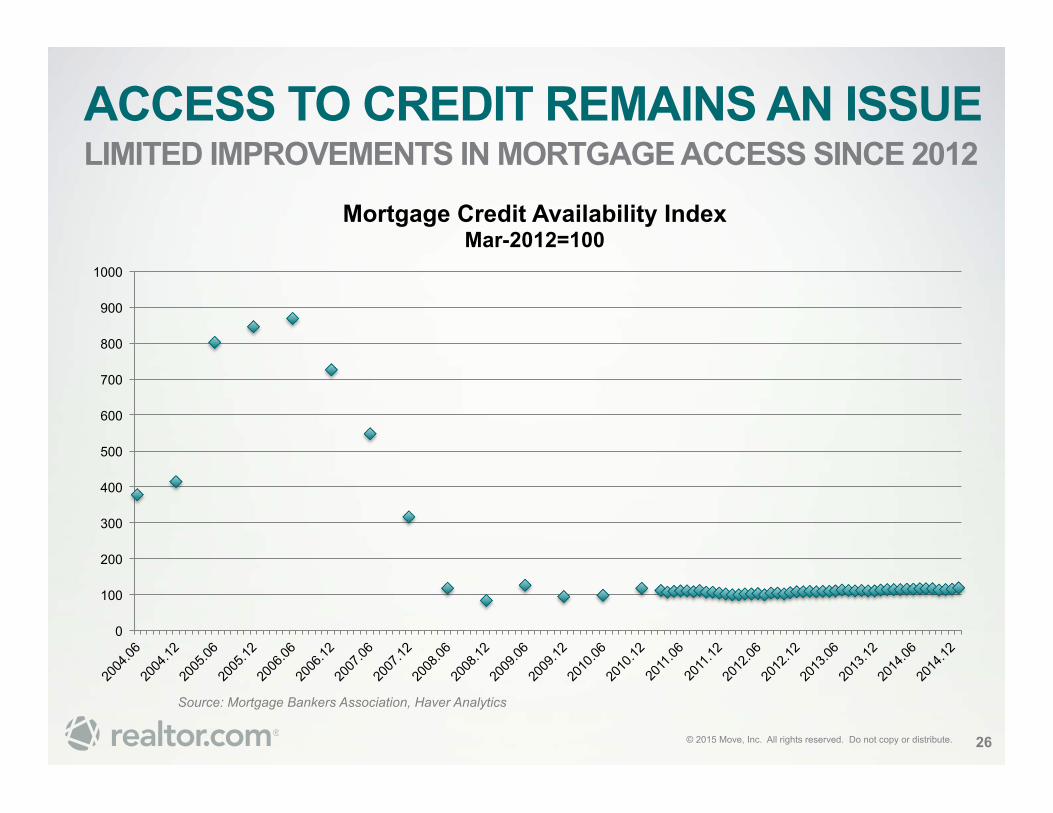
ACCESS TO CREDIT REMAINS AN ISSUE LIMITED IMPROVEMENTS IN MORTGAGE ACCESS SINCE 2012
26
Source: Mortgage Bankers Association, Haver Analytics
0
100
200
300
400
500
600
700
800
900
1000
Mortgage Credit Availability Index Mar-2012=100
© 2015 Move, Inc. All rights reserved. Do not copy or distribute.
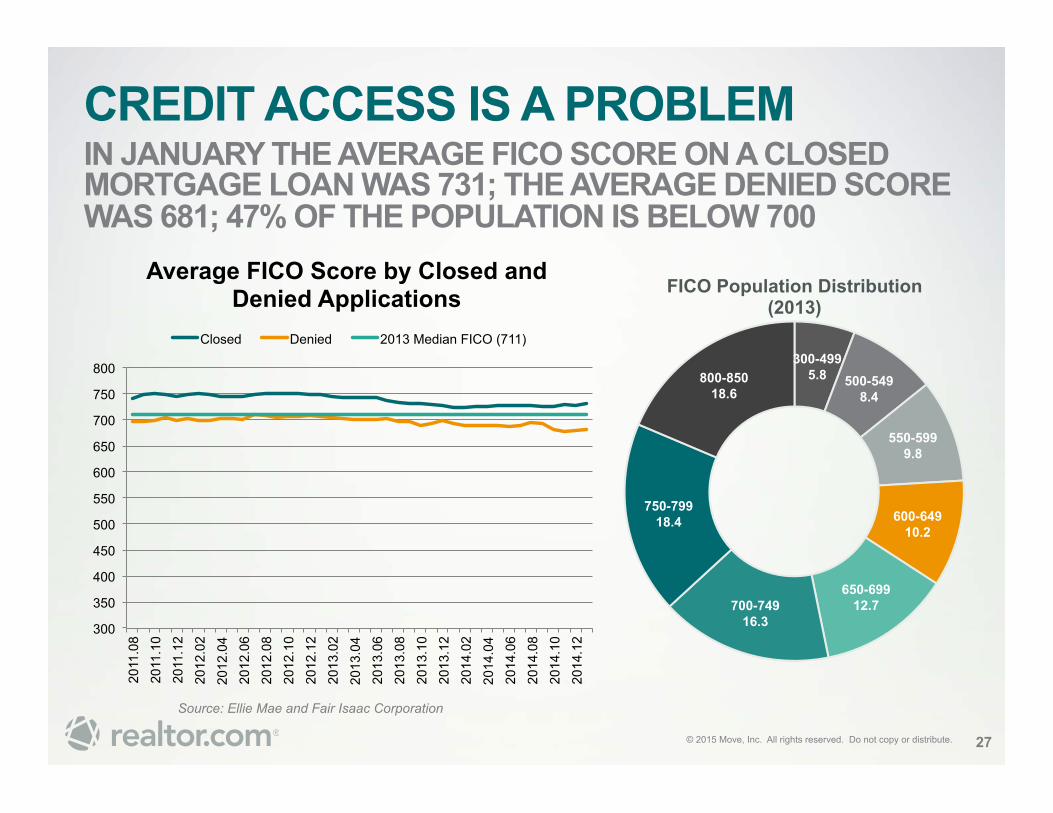
CREDIT ACCESS IS A PROBLEM IN JANUARY THE AVERAGE FICO SCORE ON A CLOSED MORTGAGE LOAN WAS 731; THE AVERAGE DENIED SCORE WAS 681; 47% OF THE POPULATION IS BELOW 700
27
Source: Ellie Mae and Fair Isaac Corporation
300-499 5.8 500-549
8.4
550-599 9.8
600-649 10.2
650-699 12.7 700-749
16.3
750-799 18.4
800-850 18.6
FICO Population Distribution (2013)
300
350
400
450
500
550
600
650
700
750
800
2011
.08
2011
.10
2011
.12
2012
.02
2012
.04
2012
.06
2012
.08
2012
.10
2012
.12
2013
.02
2013
.04
2013
.06
2013
.08
2013
.10
2013
.12
2014
.02
2014
.04
2014
.06
2014
.08
2014
.10
2014
.12
Average FICO Score by Closed and Denied Applications
Closed Denied 2013 Median FICO (711)
© 2015 Move, Inc. All rights reserved. Do not copy or distribute. 28
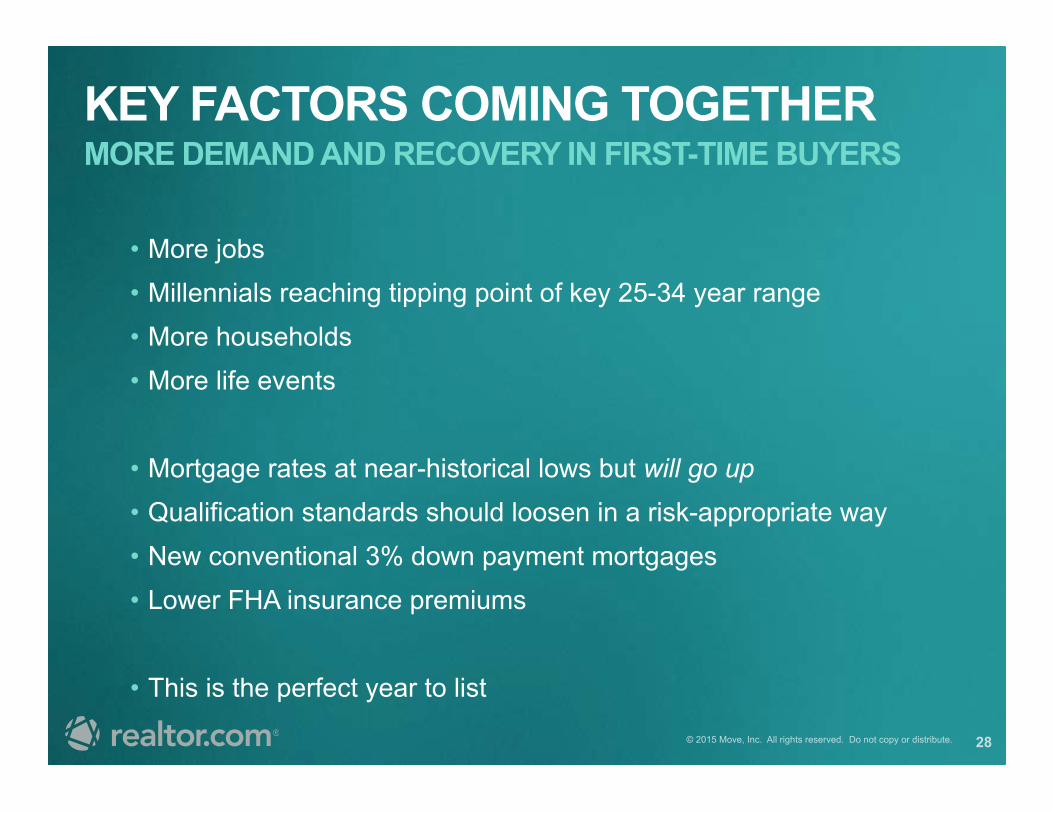
KEY FACTORS COMING TOGETHER MORE DEMAND AND RECOVERY IN FIRST-TIME BUYERS
• More jobs • Millennials reaching tipping point of key 25-34 year range • More households • More life events
• Mortgage rates at near-historical lows but will go up • Qualification standards should loosen in a risk-appropriate way • New conventional 3% down payment mortgages • Lower FHA insurance premiums
• This is the perfect year to list
© 2015 Move, Inc. All rights reserved. Do not copy or distribute.
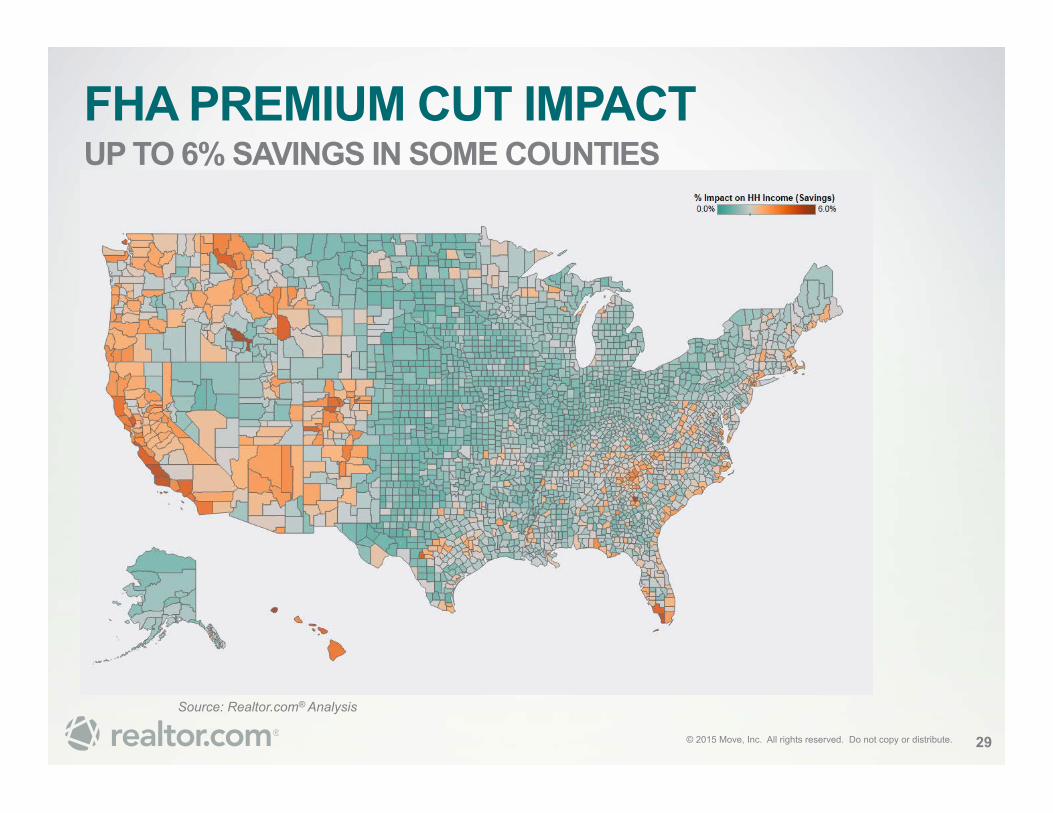
FHA PREMIUM CUT IMPACT UP TO 6% SAVINGS IN SOME COUNTIES
Source: Realtor.com® Analysis
29
© 2015 Move, Inc. All rights reserved. Do not copy or distribute.
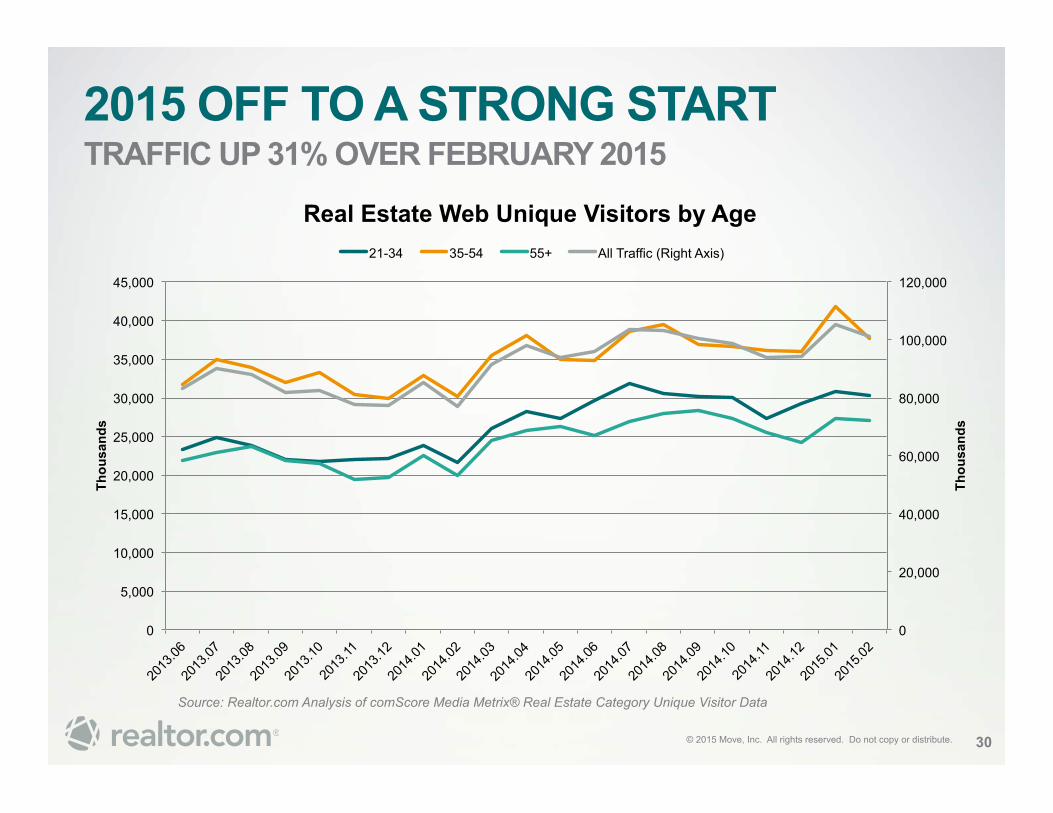
2015 OFF TO A STRONG START TRAFFIC UP 31% OVER FEBRUARY 2015
30
Source: Realtor.com Analysis of comScore Media Metrix® Real Estate Category Unique Visitor Data
0
20,000
40,000
60,000
80,000
100,000
120,000
0
5,000
10,000
15,000
20,000
25,000
30,000
35,000
40,000
45,000
Thou
sand
s
Thou
sand
s
Real Estate Web Unique Visitors by Age 21-34 35-54 55+ All Traffic (Right Axis)
© 2015 Move, Inc. All rights reserved. Do not copy or distribute.
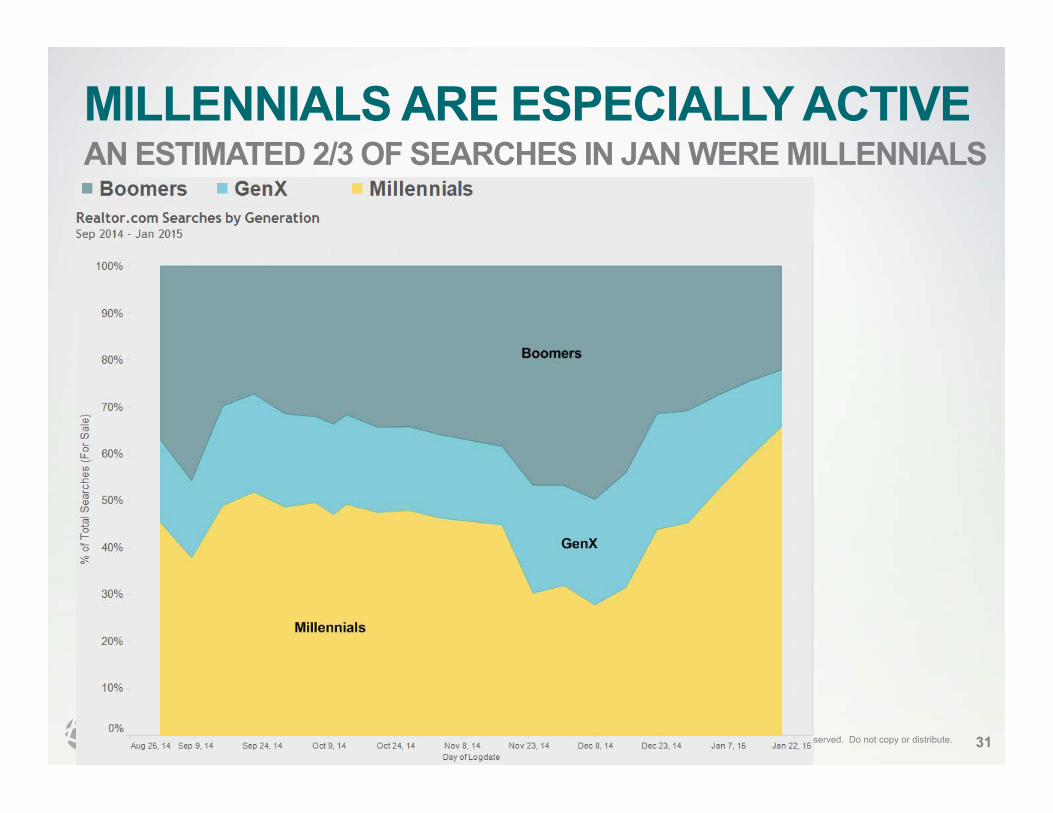
MILLENNIALS ARE ESPECIALLY ACTIVE AN ESTIMATED 2/3 OF SEARCHES IN JAN WERE MILLENNIALS
31
© 2015 Move, Inc. All rights reserved. Do not copy or distribute.
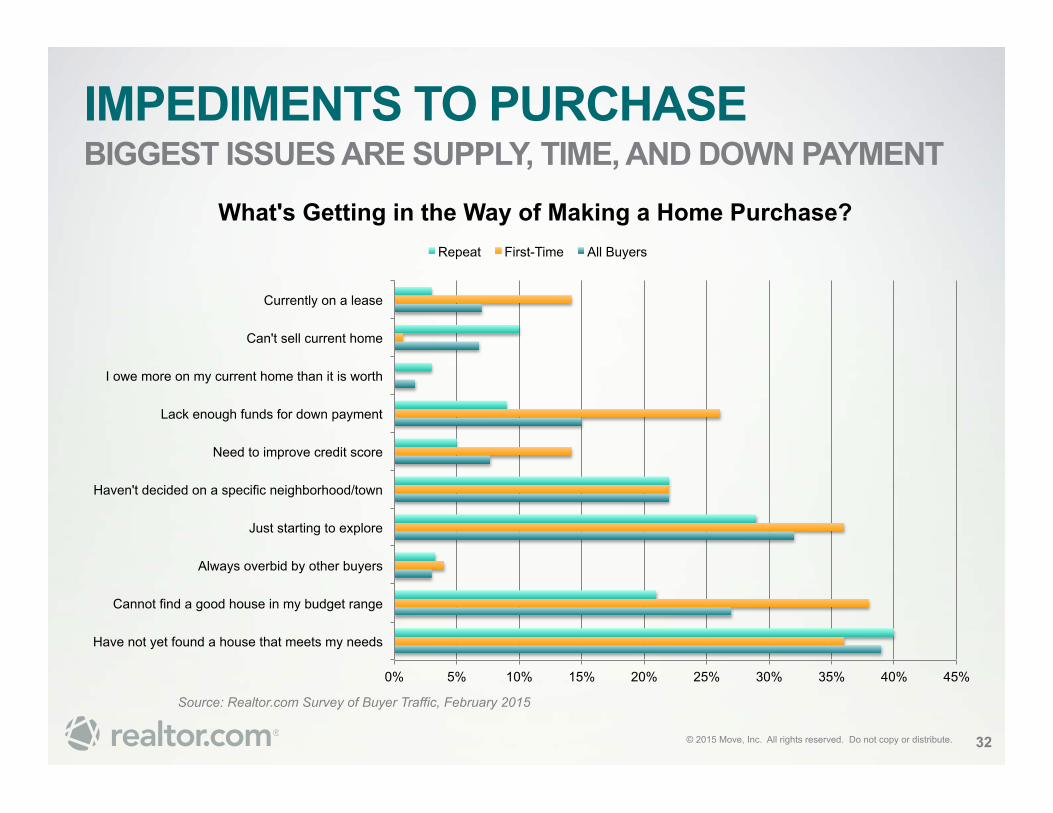
IMPEDIMENTS TO PURCHASE BIGGEST ISSUES ARE SUPPLY, TIME, AND DOWN PAYMENT
32
Source: Realtor.com Survey of Buyer Traffic, February 2015
0% 5% 10% 15% 20% 25% 30% 35% 40% 45%
Have not yet found a house that meets my needs
Cannot find a good house in my budget range
Always overbid by other buyers
Just starting to explore
Haven't decided on a specific neighborhood/town
Need to improve credit score
Lack enough funds for down payment
I owe more on my current home than it is worth
Can't sell current home
Currently on a lease
What's Getting in the Way of Making a Home Purchase? Repeat First-Time All Buyers
© 2015 Move, Inc. All rights reserved. Do not copy or distribute.
1. Mortgage rates and home prices are solidly on an upward trajectory
2. Affordability and impact of mortgage options will greatly influence demand
3. Behold the enormous impact of Millennials and Boomers and what that means for demand
4. The real estate market is returning to a normal rhythm—life drives demand but supply impacts the results
REMEMBER THESE THEMES
33

© 2015 Move, Inc. All rights reserved. Do not copy or distribute. 34
THERE IS NO US HOUSING SUCH THING AS A
MARKET
© 2015 Move, Inc. All rights reserved. Do not copy or distribute.
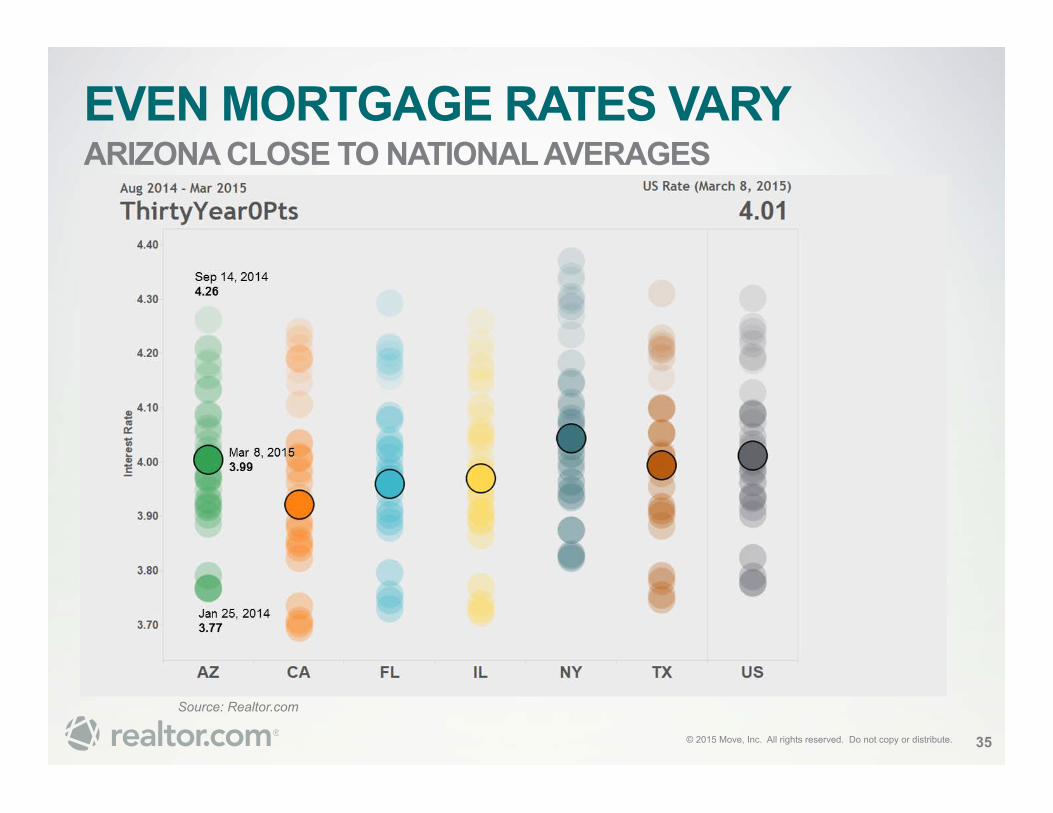
EVEN MORTGAGE RATES VARY ARIZONA CLOSE TO NATIONAL AVERAGES
35
Source: Realtor.com
© 2015 Move, Inc. All rights reserved. Do not copy or distribute.
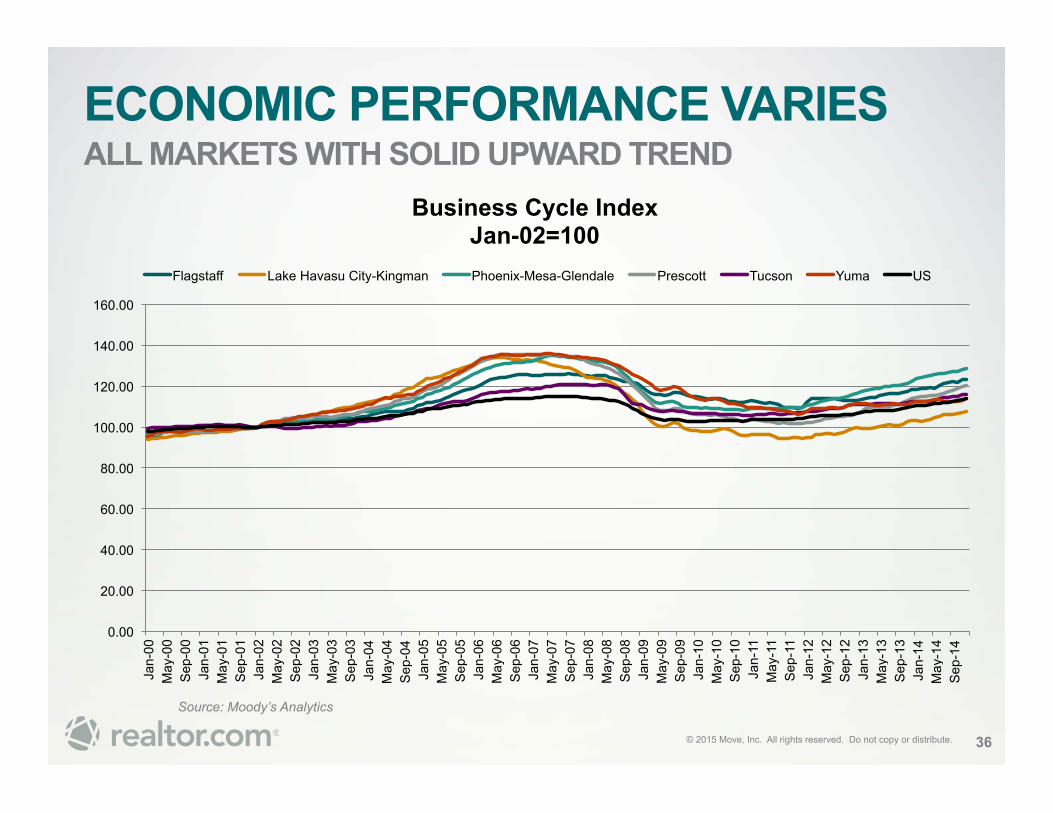
ECONOMIC PERFORMANCE VARIES ALL MARKETS WITH SOLID UPWARD TREND
36
Source: Moody’s Analytics
0.00
20.00
40.00
60.00
80.00
100.00
120.00
140.00
160.00
Jan-
00
May
-00
Sep
-00
Jan-
01
May
-01
Sep
-01
Jan-
02
May
-02
Sep
-02
Jan-
03
May
-03
Sep
-03
Jan-
04
May
-04
Sep
-04
Jan-
05
May
-05
Sep
-05
Jan-
06
May
-06
Sep
-06
Jan-
07
May
-07
Sep
-07
Jan-
08
May
-08
Sep
-08
Jan-
09
May
-09
Sep
-09
Jan-
10
May
-10
Sep
-10
Jan-
11
May
-11
Sep
-11
Jan-
12
May
-12
Sep
-12
Jan-
13
May
-13
Sep
-13
Jan-
14
May
-14
Sep
-14
Business Cycle Index Jan-02=100
Flagstaff Lake Havasu City-Kingman Phoenix-Mesa-Glendale Prescott Tucson Yuma US
© 2015 Move, Inc. All rights reserved. Do not copy or distribute.
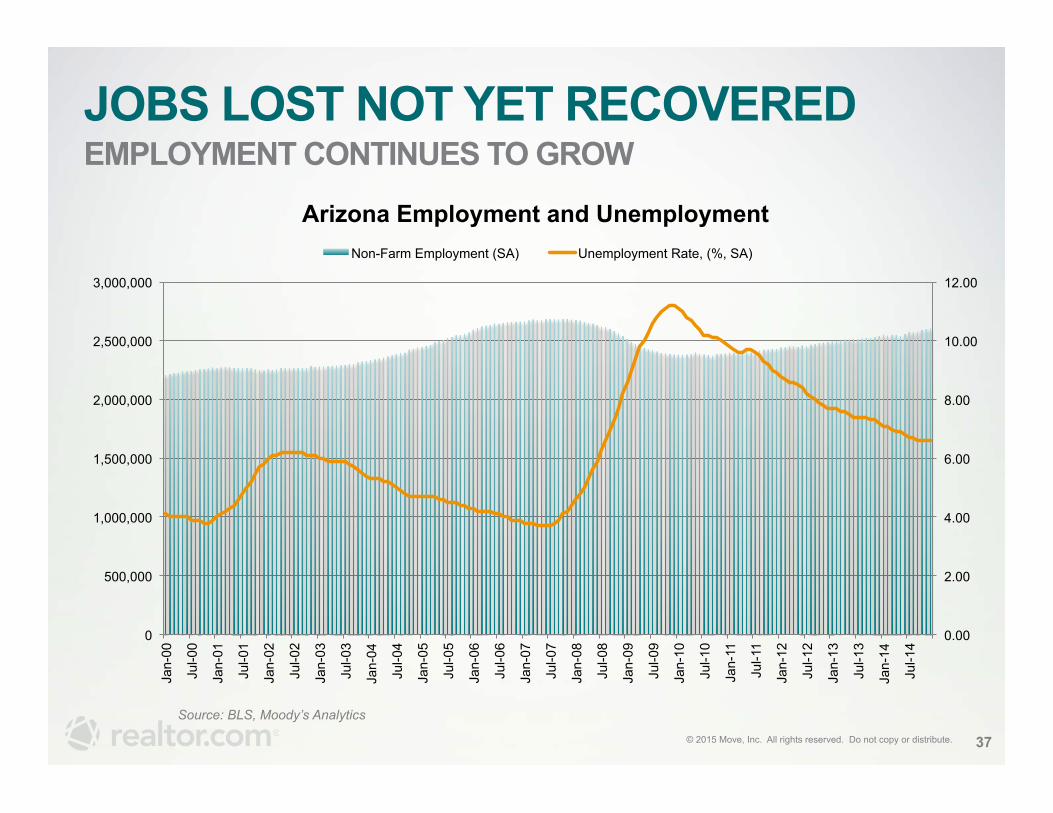
JOBS LOST NOT YET RECOVERED EMPLOYMENT CONTINUES TO GROW
37
Source: BLS, Moody’s Analytics
0.00
2.00
4.00
6.00
8.00
10.00
12.00
0
500,000
1,000,000
1,500,000
2,000,000
2,500,000
3,000,000
Jan-
00
Jul-0
0
Jan-
01
Jul-0
1
Jan-
02
Jul-0
2
Jan-
03
Jul-0
3
Jan-
04
Jul-0
4
Jan-
05
Jul-0
5
Jan-
06
Jul-0
6
Jan-
07
Jul-0
7
Jan-
08
Jul-0
8
Jan-
09
Jul-0
9
Jan-
10
Jul-1
0
Jan-
11
Jul-1
1
Jan-
12
Jul-1
2
Jan-
13
Jul-1
3
Jan-
14
Jul-1
4
Arizona Employment and Unemployment Non-Farm Employment (SA) Unemployment Rate, (%, SA)
© 2015 Move, Inc. All rights reserved. Do not copy or distribute.
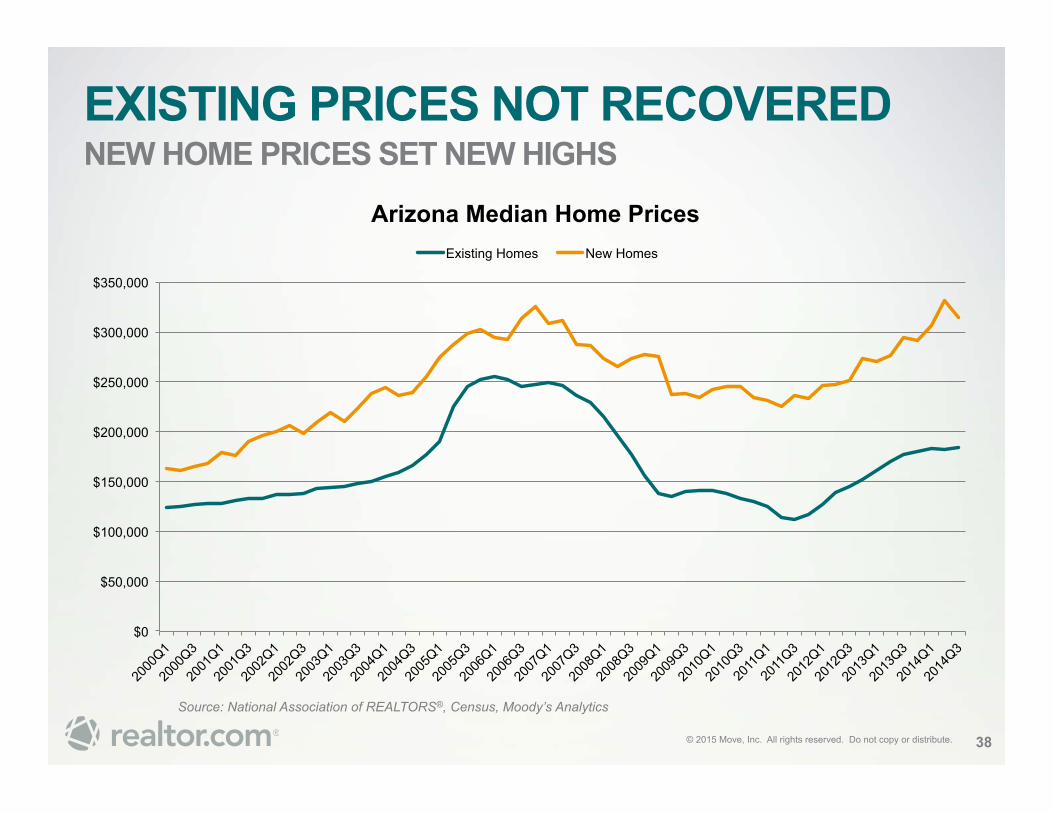
EXISTING PRICES NOT RECOVERED NEW HOME PRICES SET NEW HIGHS
38
Source: National Association of REALTORS®, Census, Moody’s Analytics
$0
$50,000
$100,000
$150,000
$200,000
$250,000
$300,000
$350,000
Arizona Median Home Prices Existing Homes New Homes
© 2015 Move, Inc. All rights reserved. Do not copy or distribute.
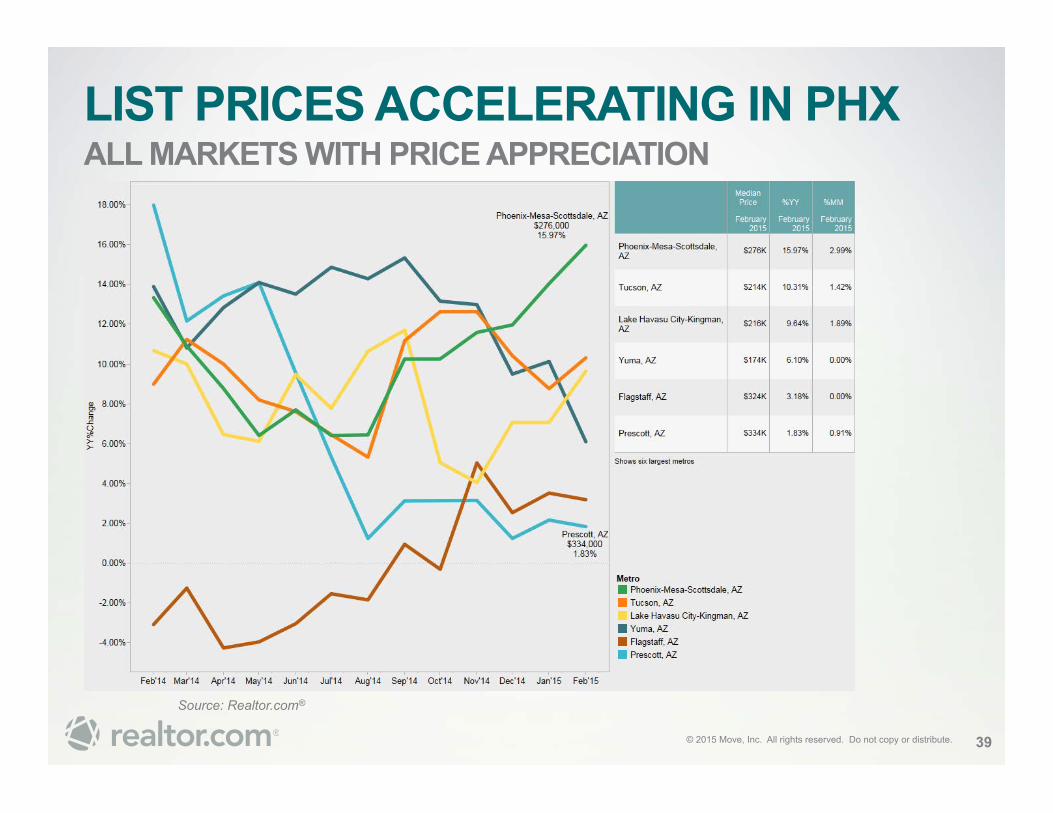
LIST PRICES ACCELERATING IN PHX ALL MARKETS WITH PRICE APPRECIATION
39
Source: Realtor.com®
© 2015 Move, Inc. All rights reserved. Do not copy or distribute.
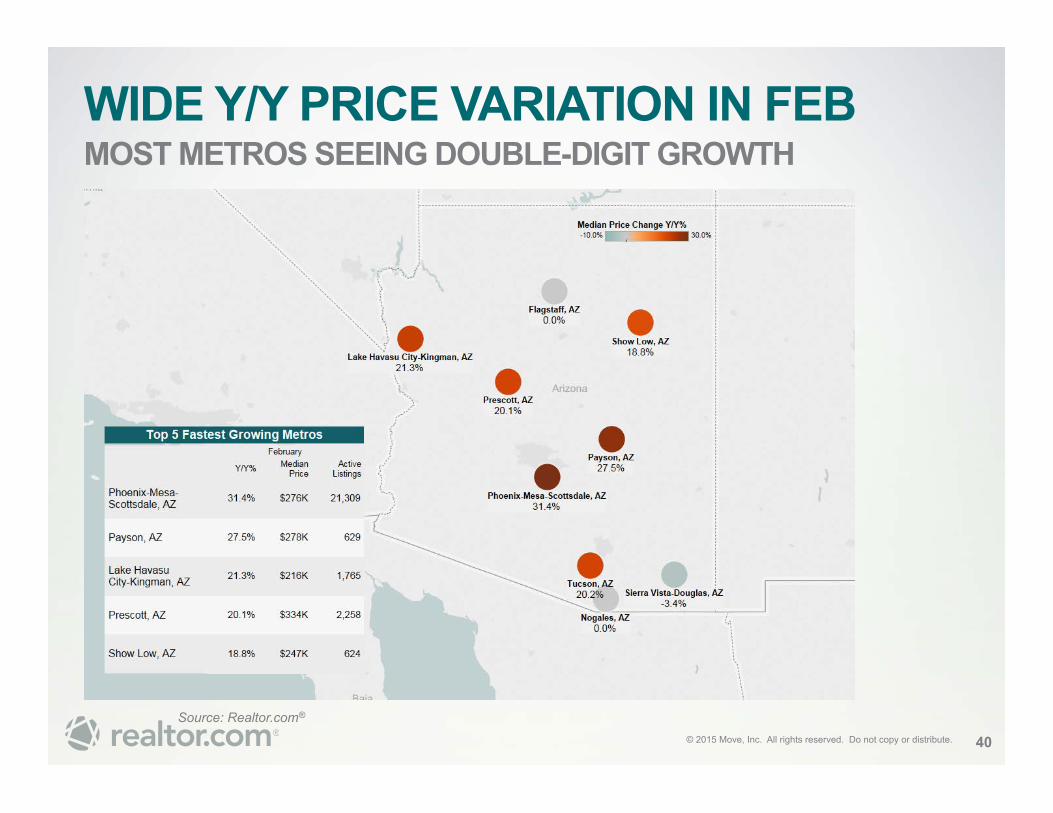
WIDE Y/Y PRICE VARIATION IN FEB MOST METROS SEEING DOUBLE-DIGIT GROWTH
Source: Realtor.com®
40
© 2015 Move, Inc. All rights reserved. Do not copy or distribute.
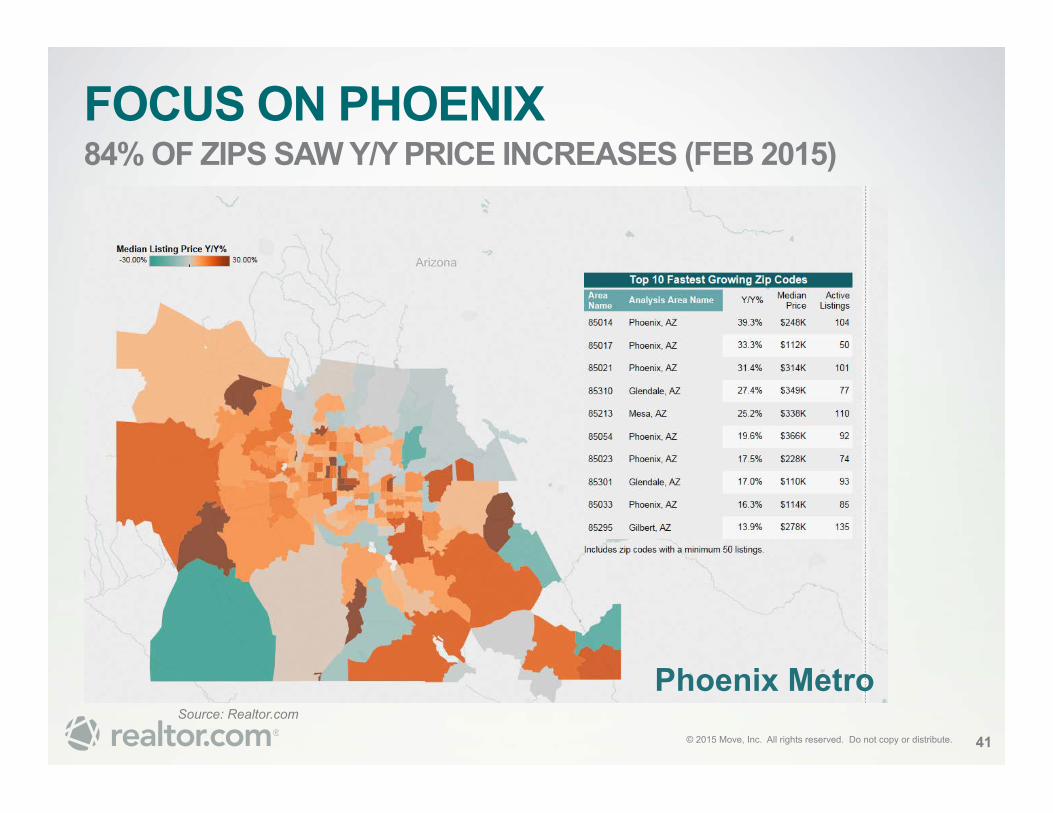
FOCUS ON PHOENIX 84% OF ZIPS SAW Y/Y PRICE INCREASES (FEB 2015)
Source: Realtor.com
41
Phoenix Metro
© 2015 Move, Inc. All rights reserved. Do not copy or distribute.
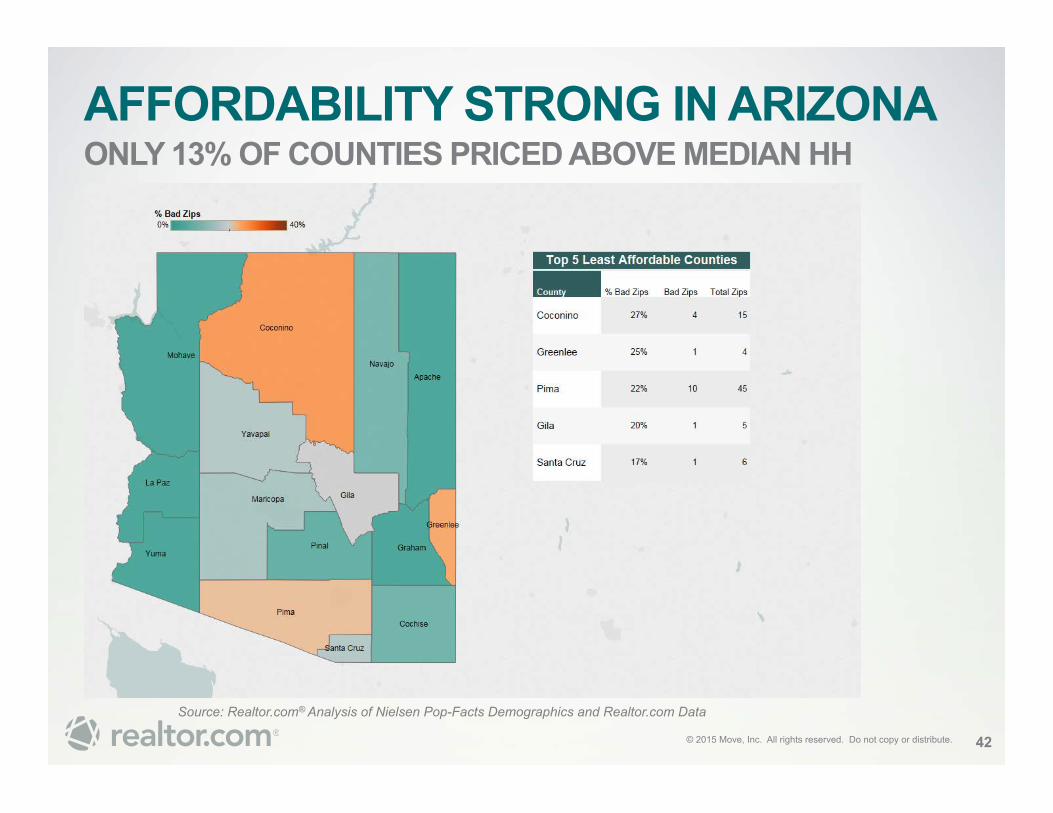
AFFORDABILITY STRONG IN ARIZONA ONLY 13% OF COUNTIES PRICED ABOVE MEDIAN HH
Source: Realtor.com® Analysis of Nielsen Pop-Facts Demographics and Realtor.com Data
42
"Bad Zips” are those where at least half of the households in the zip cannot afford to buy a home.
© 2015 Move, Inc. All rights reserved. Do not copy or distribute.
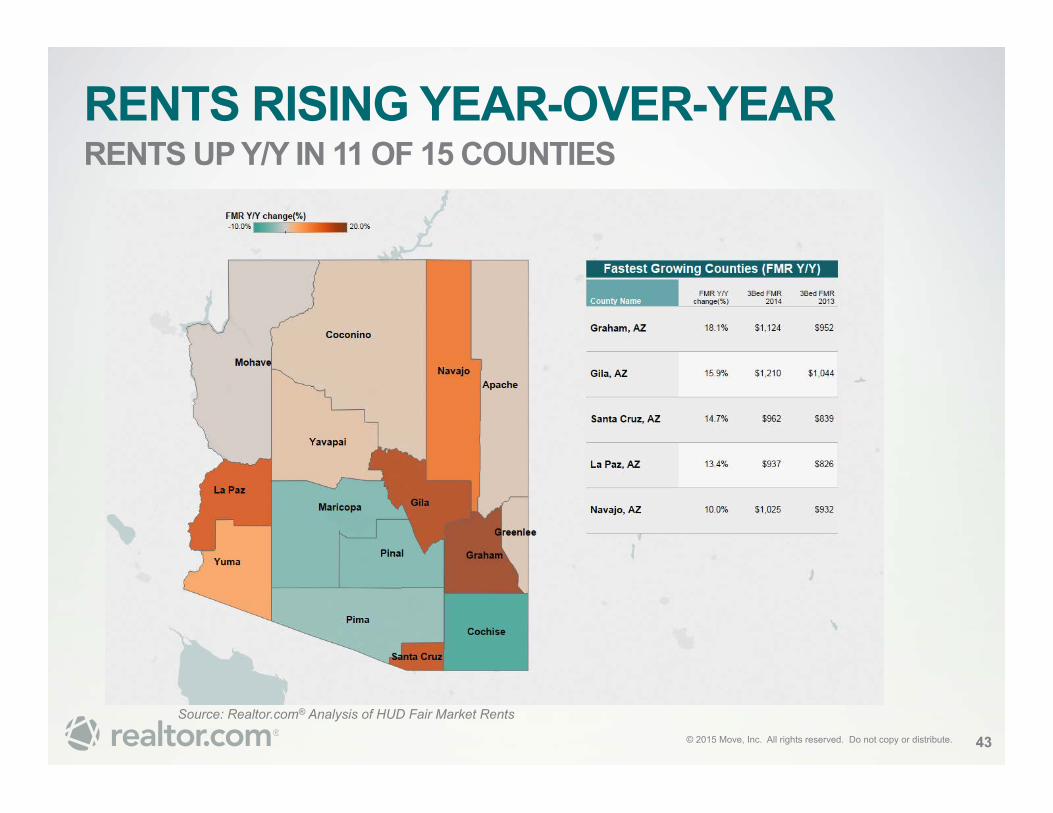
RENTS RISING YEAR-OVER-YEAR RENTS UP Y/Y IN 11 OF 15 COUNTIES
Source: Realtor.com® Analysis of HUD Fair Market Rents
43
© 2015 Move, Inc. All rights reserved. Do not copy or distribute.
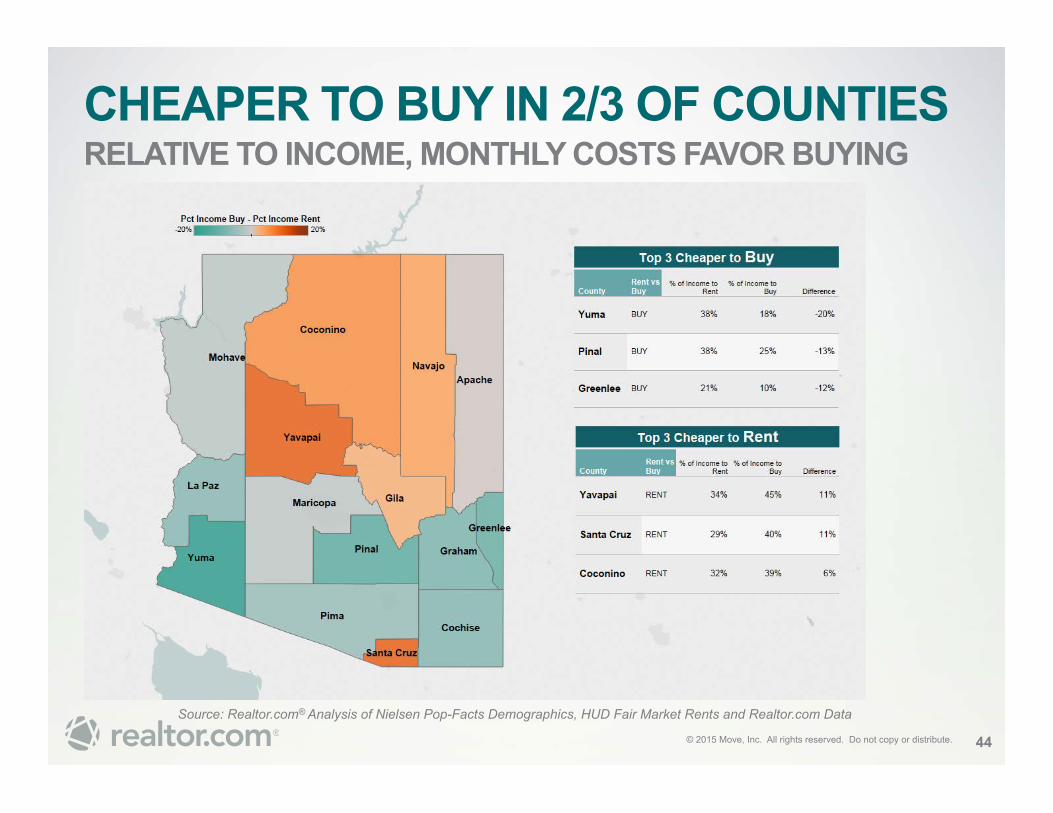
CHEAPER TO BUY IN 2/3 OF COUNTIES RELATIVE TO INCOME, MONTHLY COSTS FAVOR BUYING
Source: Realtor.com® Analysis of Nielsen Pop-Facts Demographics, HUD Fair Market Rents and Realtor.com Data
44
© 2015 Move, Inc. All rights reserved. Do not copy or distribute.
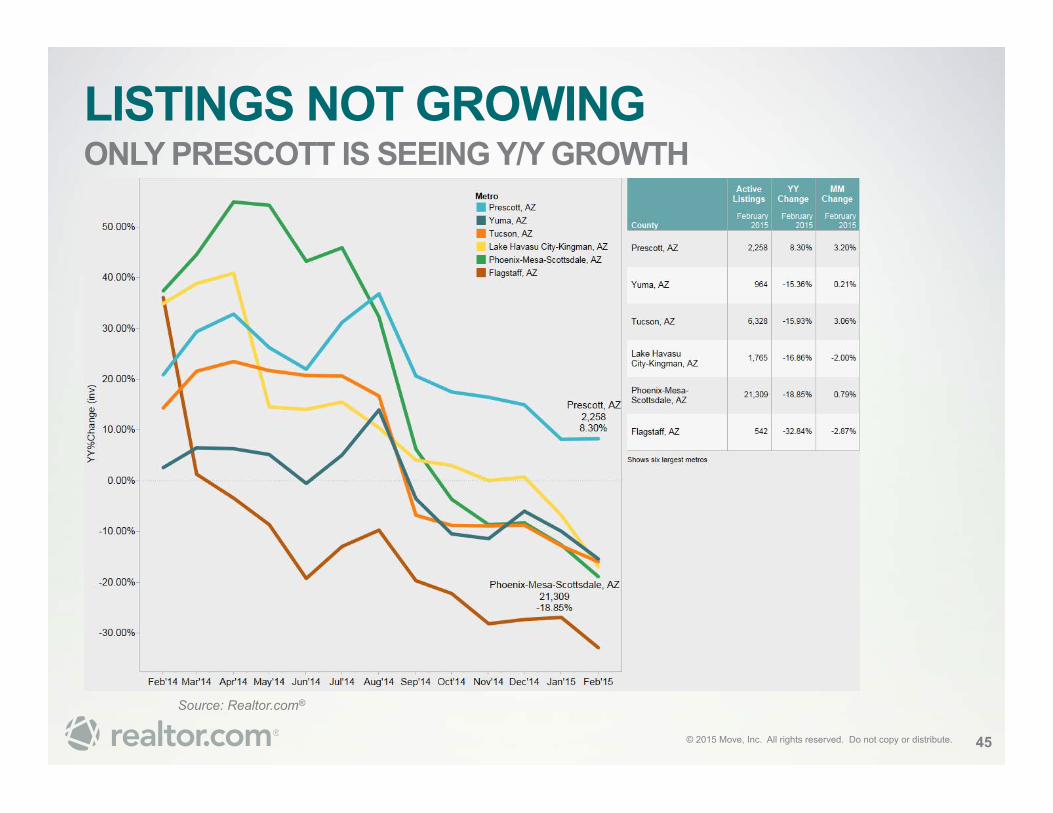
LISTINGS NOT GROWING ONLY PRESCOTT IS SEEING Y/Y GROWTH
45
Source: Realtor.com®
© 2015 Move, Inc. All rights reserved. Do not copy or distribute.
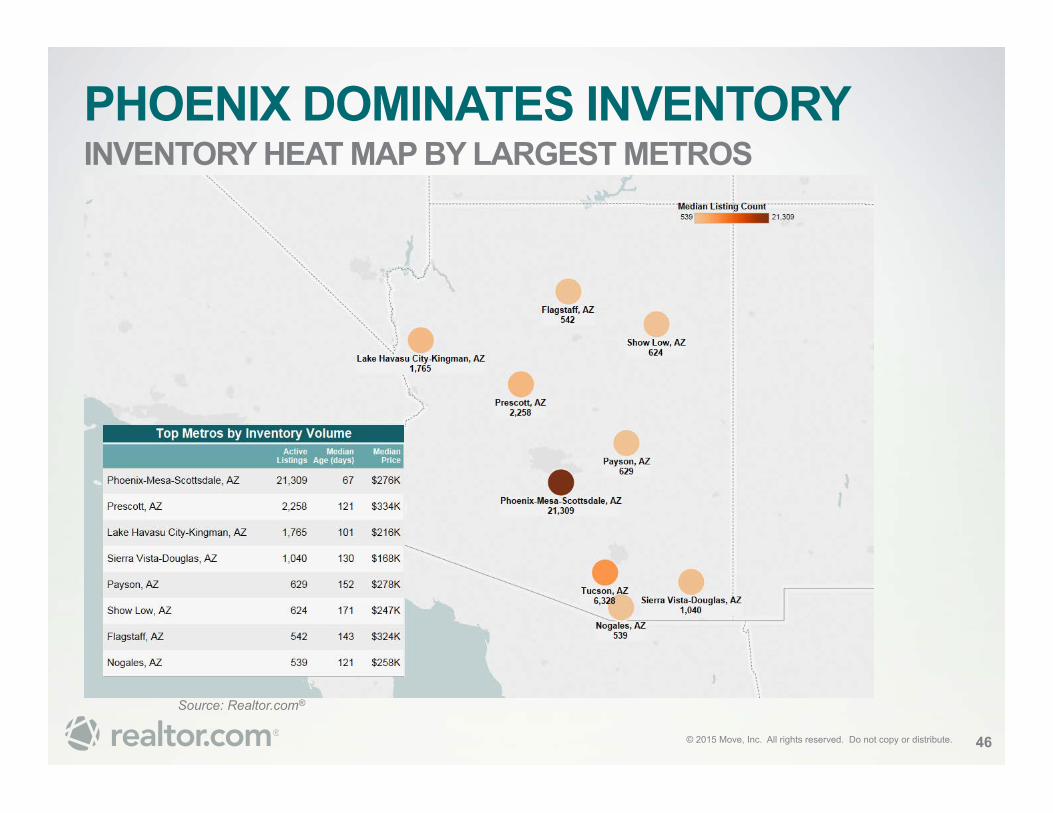
PHOENIX DOMINATES INVENTORY INVENTORY HEAT MAP BY LARGEST METROS
Source: Realtor.com®
46
© 2015 Move, Inc. All rights reserved. Do not copy or distribute.
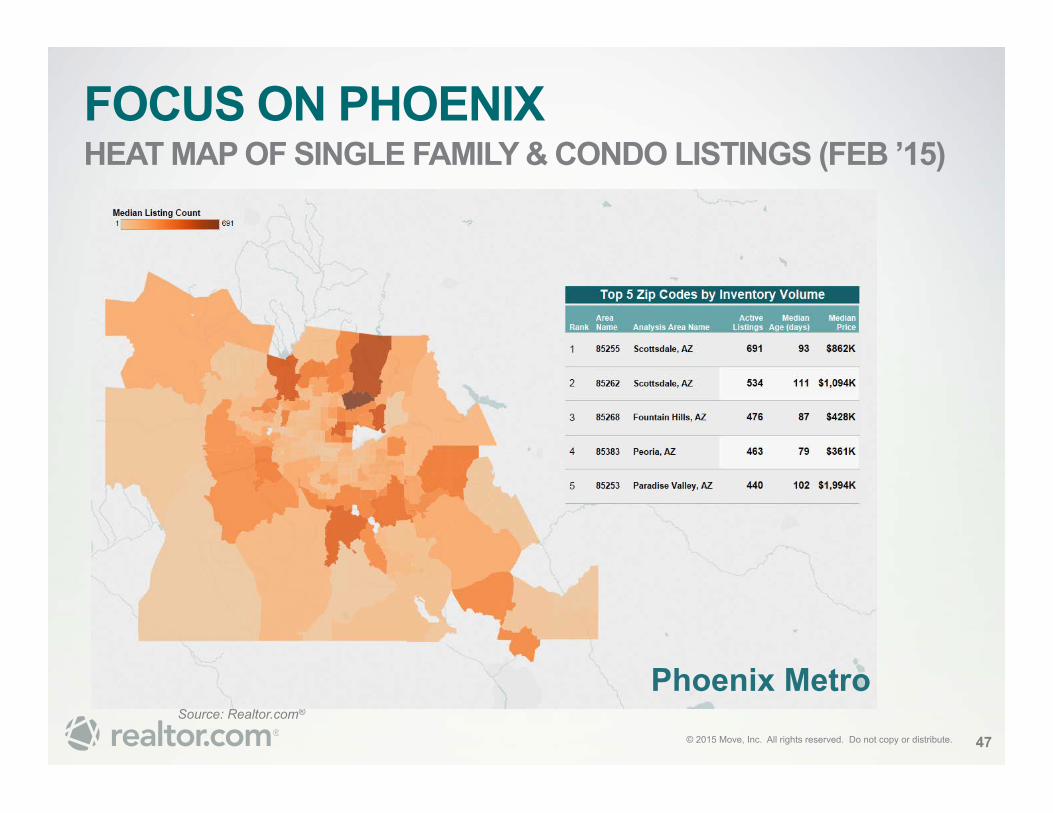
FOCUS ON PHOENIX HEAT MAP OF SINGLE FAMILY & CONDO LISTINGS (FEB ’15)
Source: Realtor.com®
47
Phoenix Metro
© 2015 Move, Inc. All rights reserved. Do not copy or distribute.
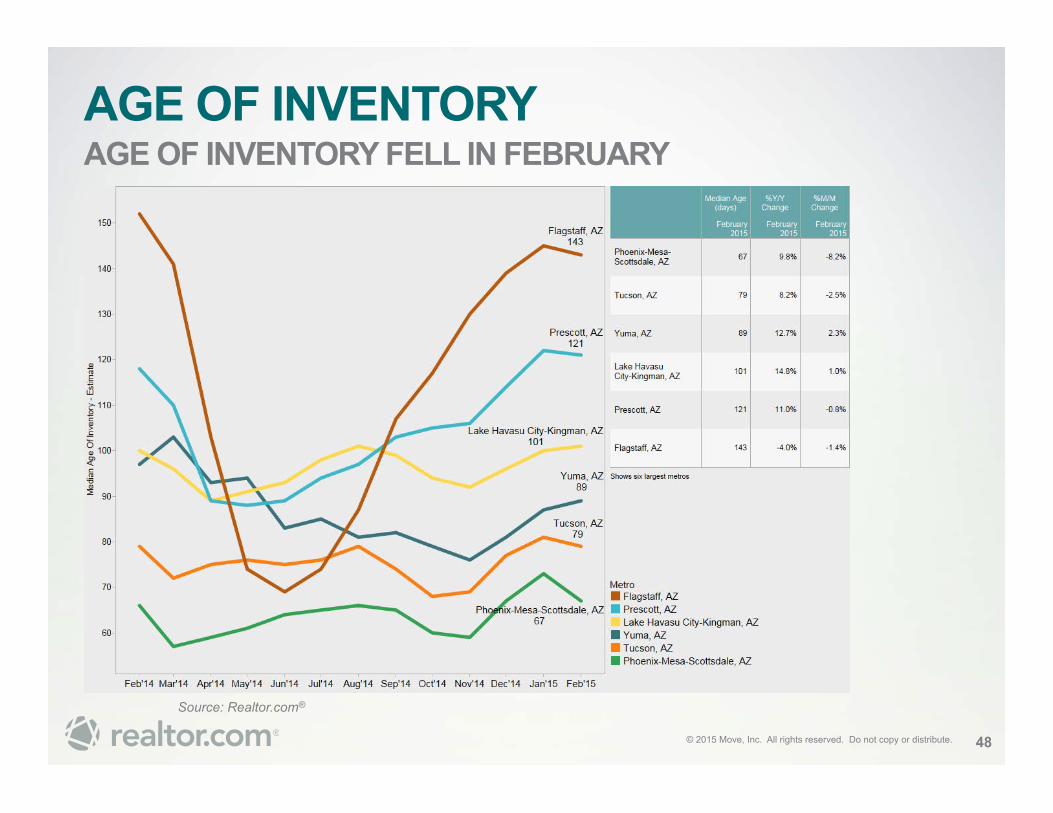
AGE OF INVENTORY AGE OF INVENTORY FELL IN FEBRUARY
48
Source: Realtor.com®
© 2015 Move, Inc. All rights reserved. Do not copy or distribute.
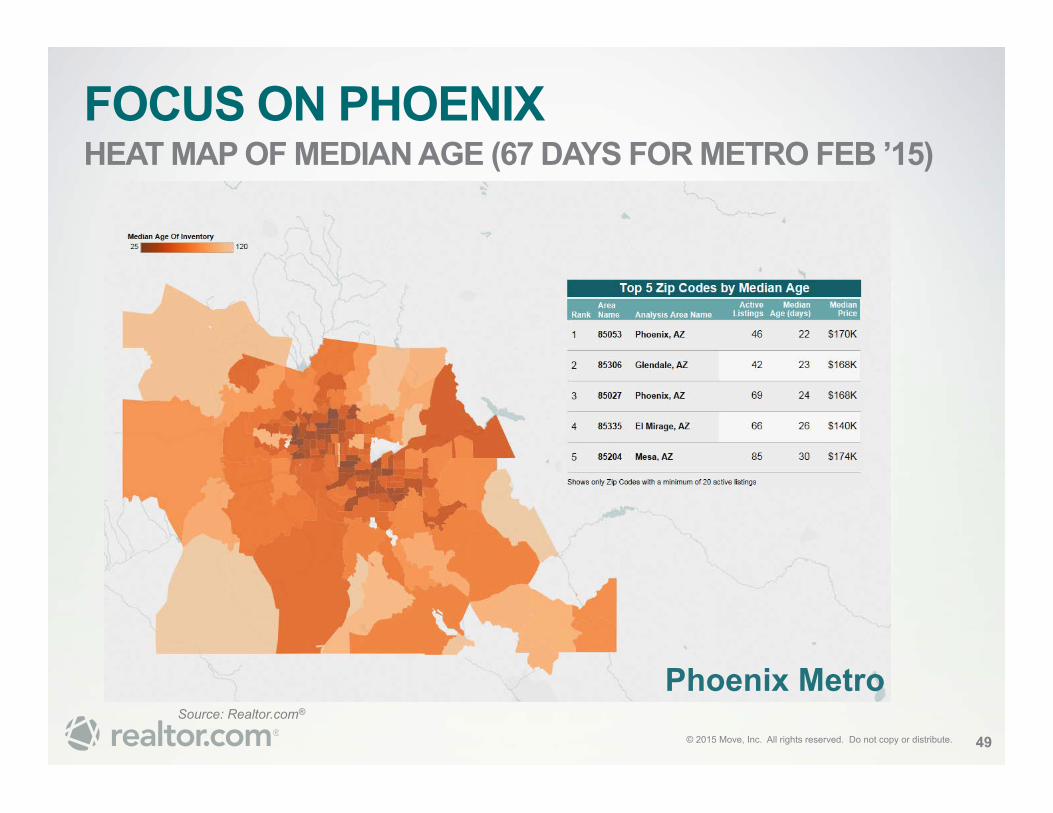
FOCUS ON PHOENIX HEAT MAP OF MEDIAN AGE (67 DAYS FOR METRO FEB ’15)
Source: Realtor.com®
49
Phoenix Metro
© 2015 Move, Inc. All rights reserved. Do not copy or distribute.
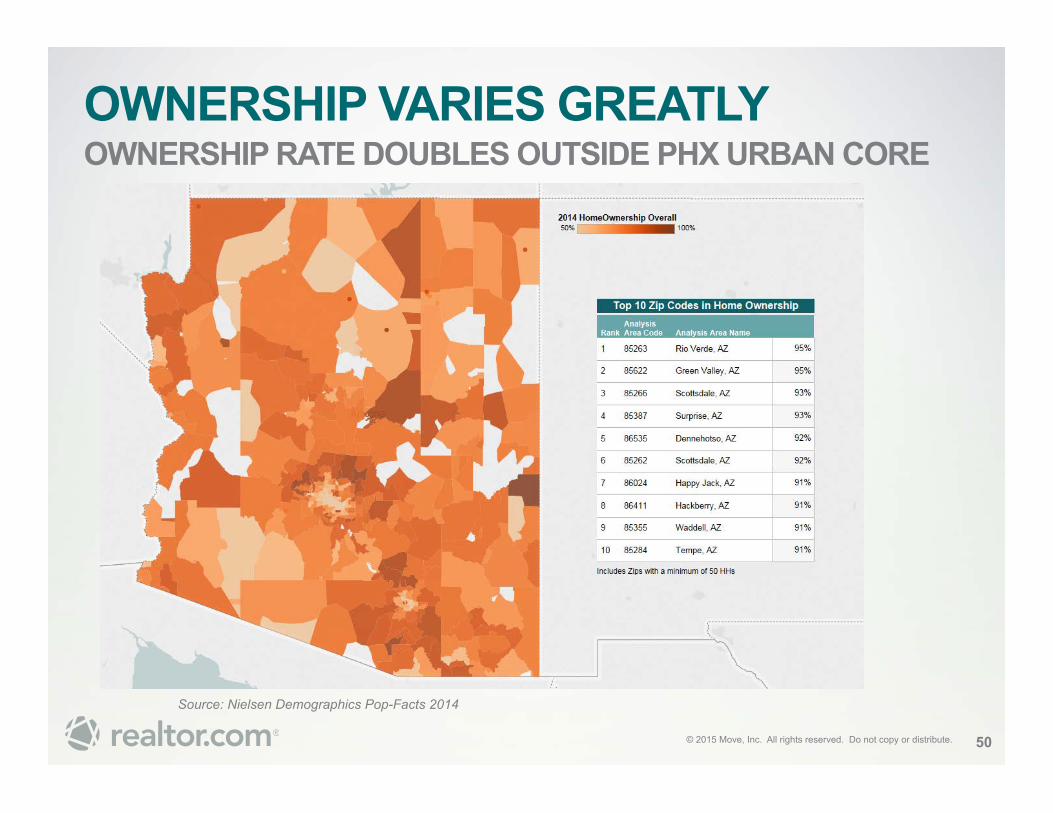
OWNERSHIP VARIES GREATLY OWNERSHIP RATE DOUBLES OUTSIDE PHX URBAN CORE
Source: Nielsen Demographics Pop-Facts 2014
50
© 2015 Move, Inc. All rights reserved. Do not copy or distribute.
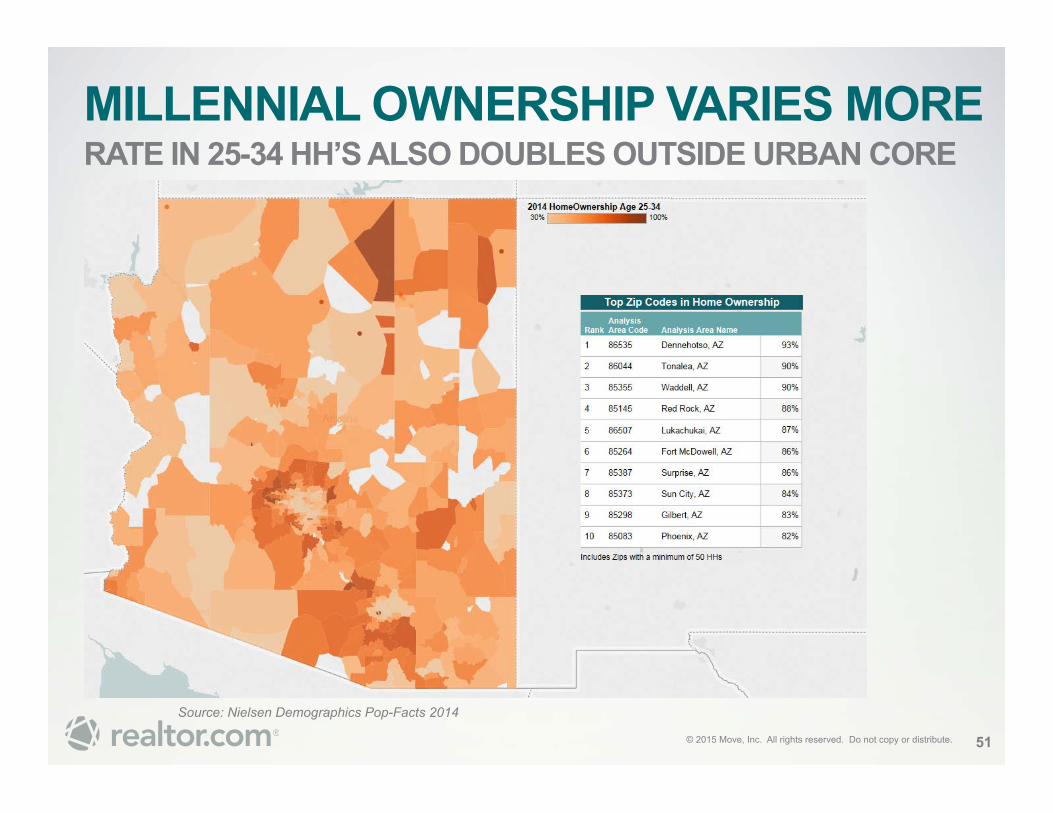
MILLENNIAL OWNERSHIP VARIES MORE RATE IN 25-34 HH’S ALSO DOUBLES OUTSIDE URBAN CORE
Source: Nielsen Demographics Pop-Facts 2014
51
© 2015 Move, Inc. All rights reserved. Do not copy or distribute.
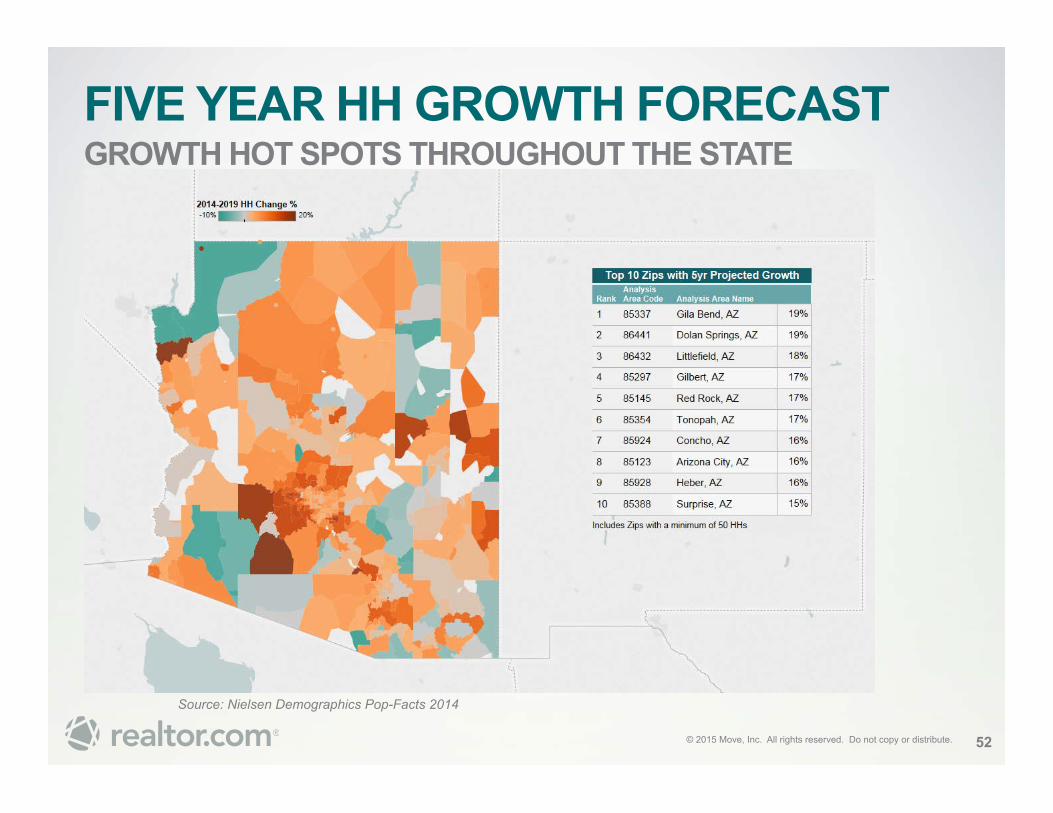
FIVE YEAR HH GROWTH FORECAST GROWTH HOT SPOTS THROUGHOUT THE STATE
Source: Nielsen Demographics Pop-Facts 2014
52
© 2015 Move, Inc. All rights reserved. Do not copy or distribute.
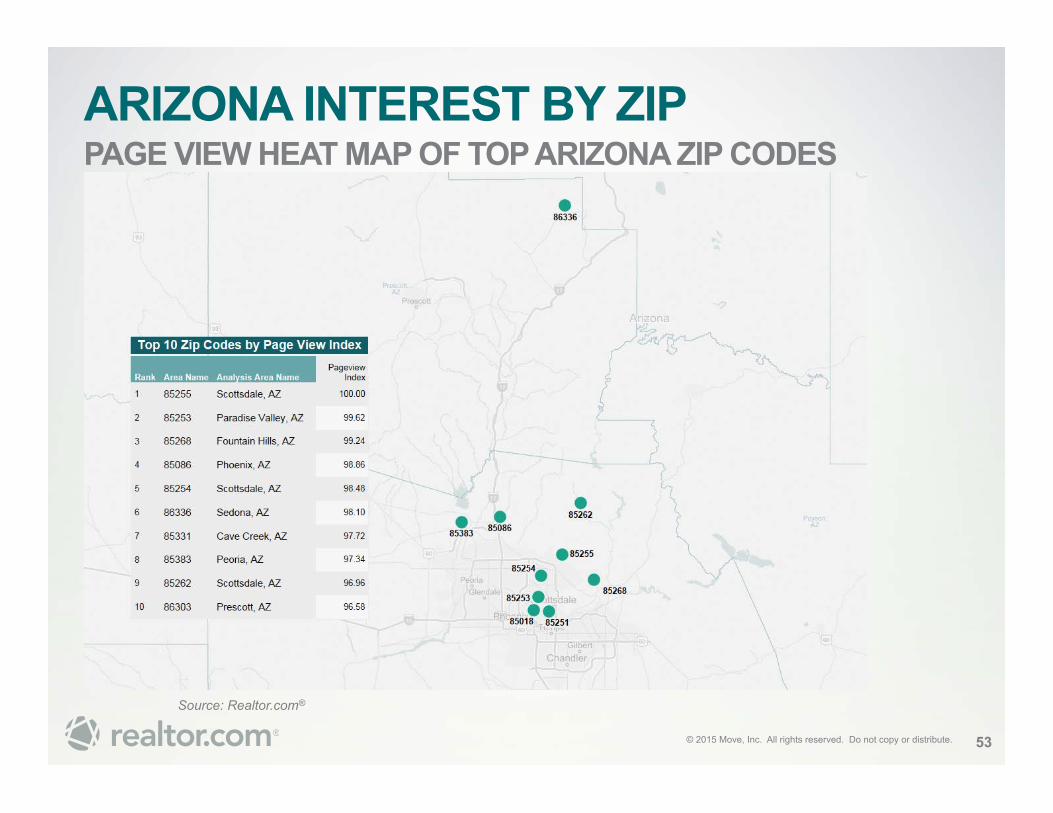
ARIZONA INTEREST BY ZIP PAGE VIEW HEAT MAP OF TOP ARIZONA ZIP CODES
Source: Realtor.com®
53
© 2015 Move, Inc. All rights reserved. Do not copy or distribute.
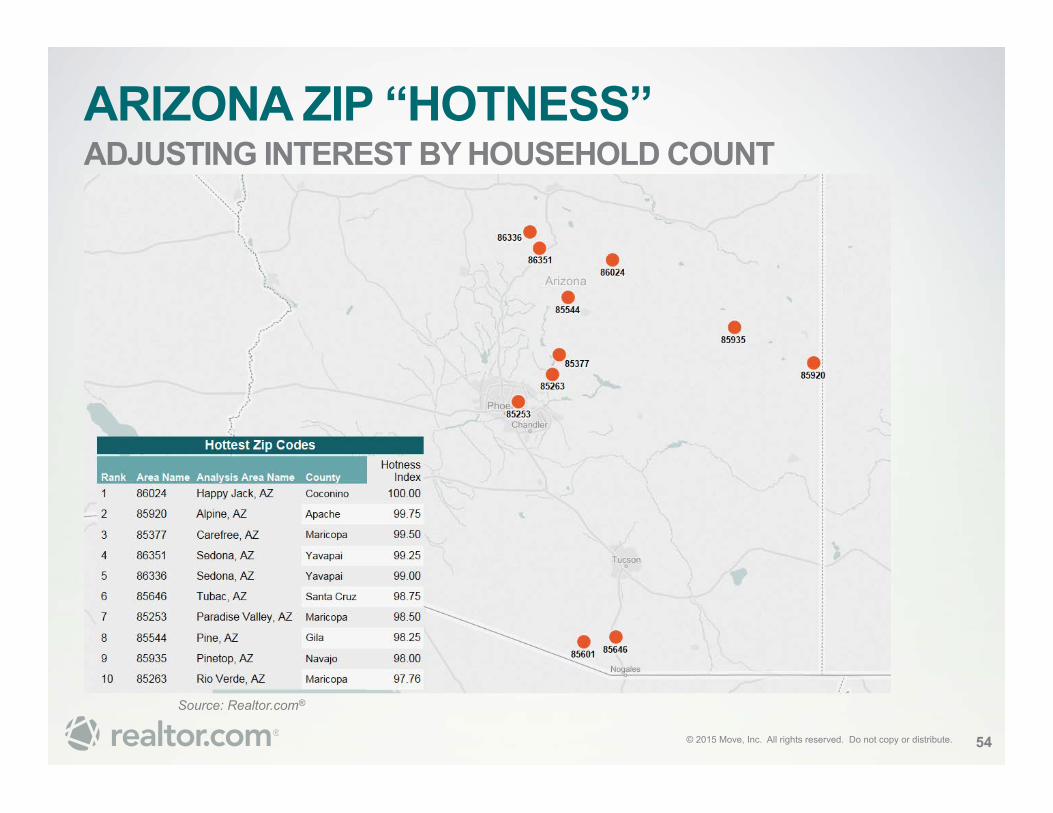
ARIZONA ZIP “HOTNESS” ADJUSTING INTEREST BY HOUSEHOLD COUNT
Source: Realtor.com®
54
© 2015 Move, Inc. All rights reserved. Do not copy or distribute.
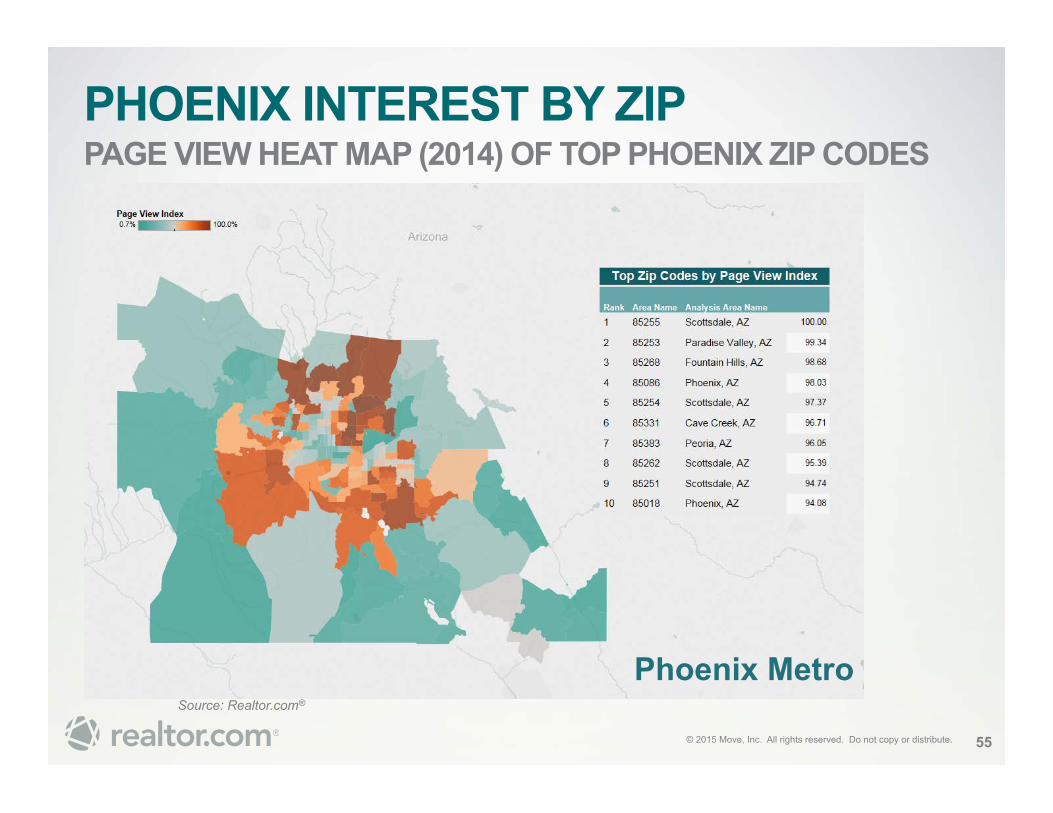
PHOENIX INTEREST BY ZIP PAGE VIEW HEAT MAP (2014) OF TOP PHOENIX ZIP CODES
Source: Realtor.com®
55
Phoenix Metro
© 2015 Move, Inc. All rights reserved. Do not copy or distribute.
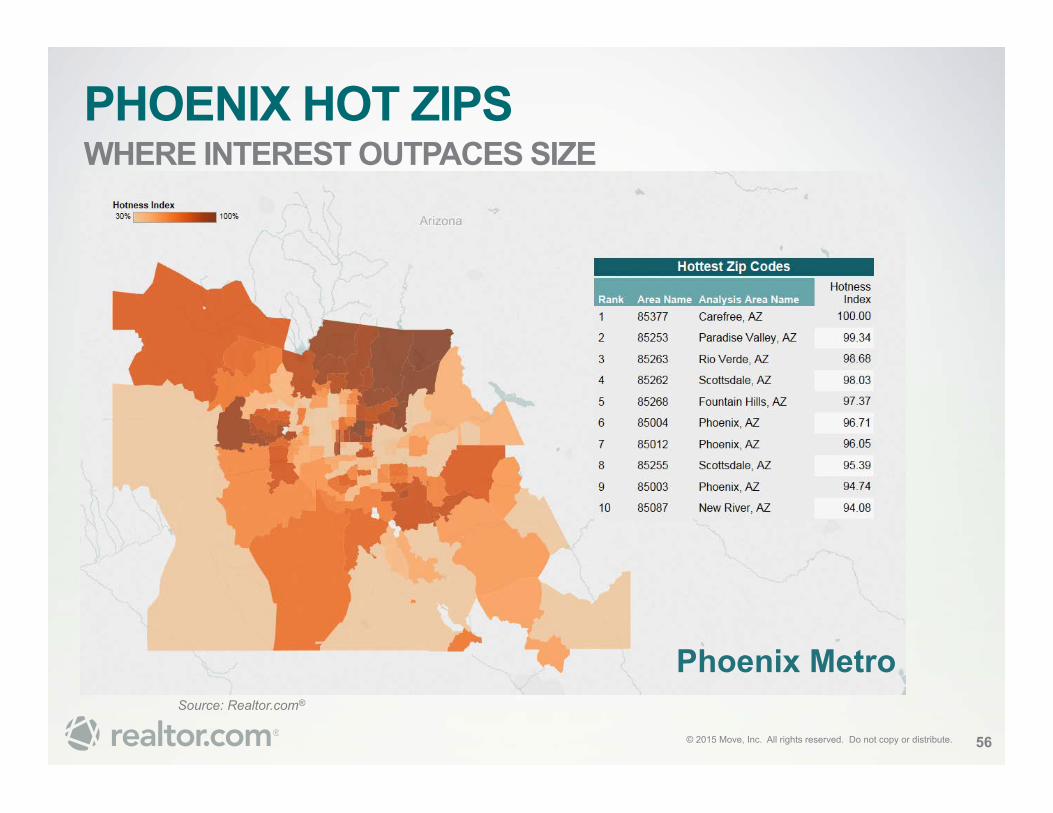
PHOENIX HOT ZIPS WHERE INTEREST OUTPACES SIZE
Source: Realtor.com®
56
Phoenix Metro
© 2015 Move, Inc. All rights reserved. Do not copy or distribute.
0
1,000,000
2,000,000
3,000,000
4,000,000
5,000,000
6,000,000
7,000,000
8,000,000
2015 2020
Population by Age (Arizona) Under 25 25-34 35-54 55+
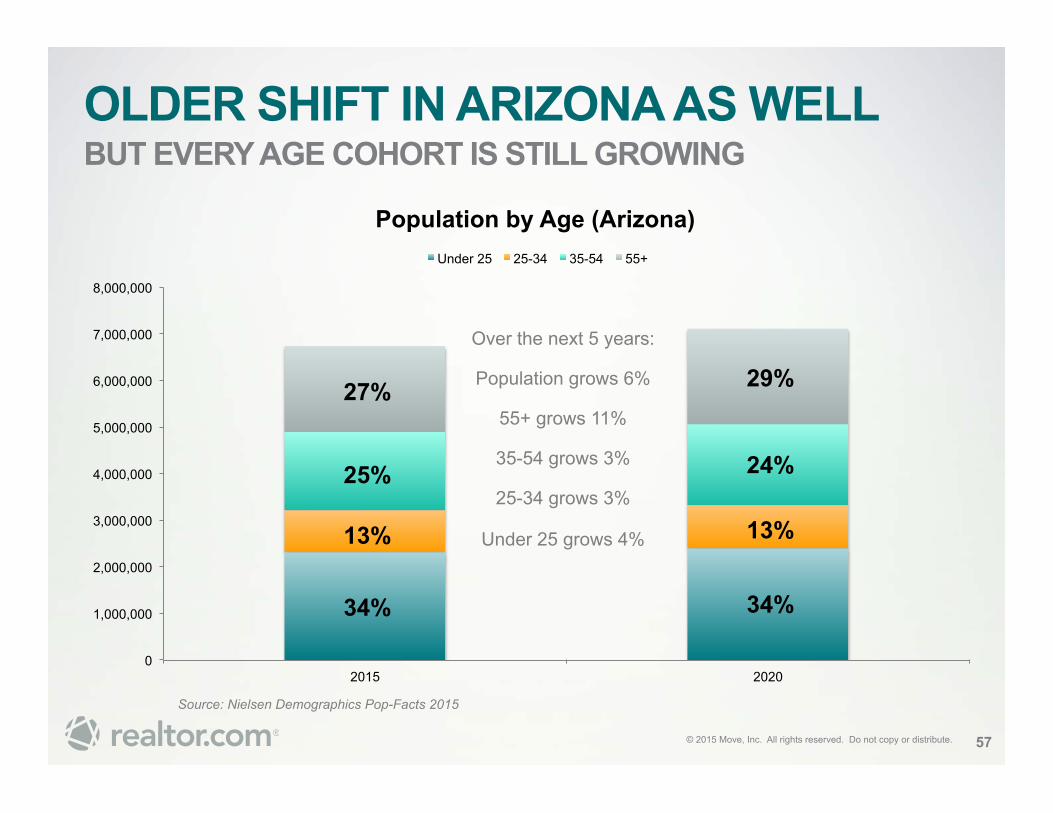
OLDER SHIFT IN ARIZONA AS WELL BUT EVERY AGE COHORT IS STILL GROWING
57
Source: Nielsen Demographics Pop-Facts 2015
27%
25%
13%
34%
29%
24%
13%
34%
Over the next 5 years:
Population grows 6%
55+ grows 11%
35-54 grows 3%
25-34 grows 3%
Under 25 grows 4%
© 2015 Move, Inc. All rights reserved. Do not copy or distribute.
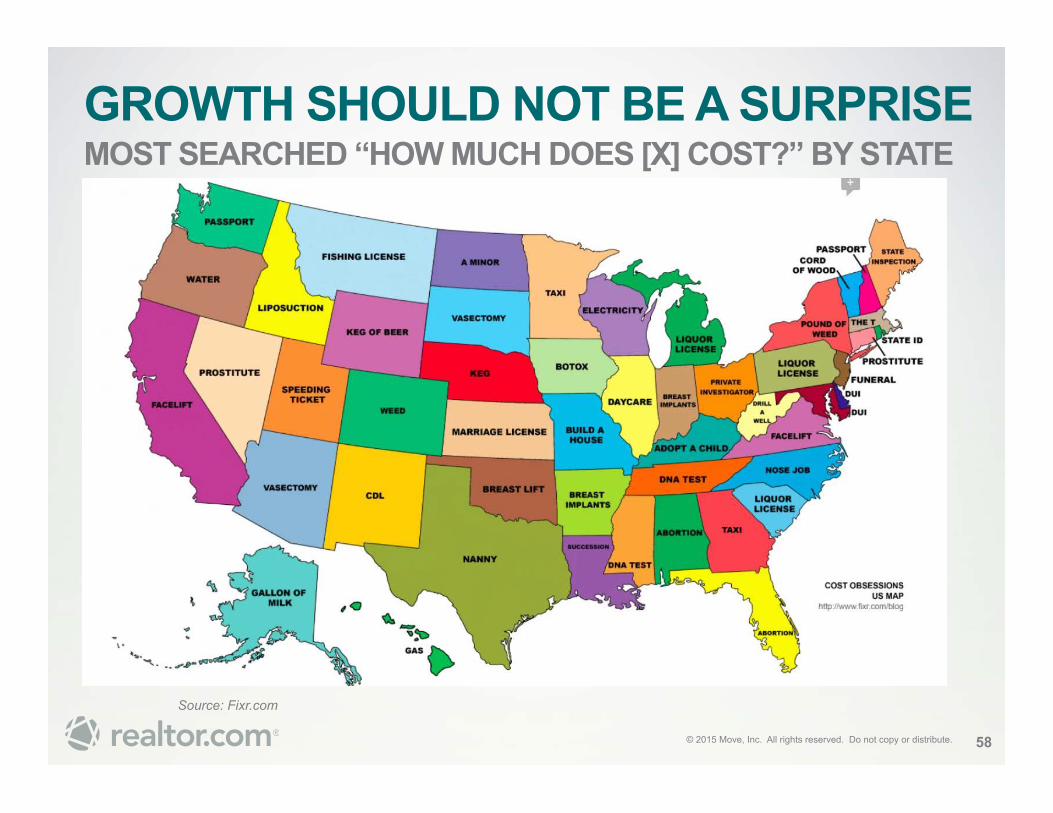
GROWTH SHOULD NOT BE A SURPRISE MOST SEARCHED “HOW MUCH DOES [X] COST?” BY STATE
Source: Fixr.com
58
© 2015 Move, Inc. All rights reserved. Do not copy or distribute.
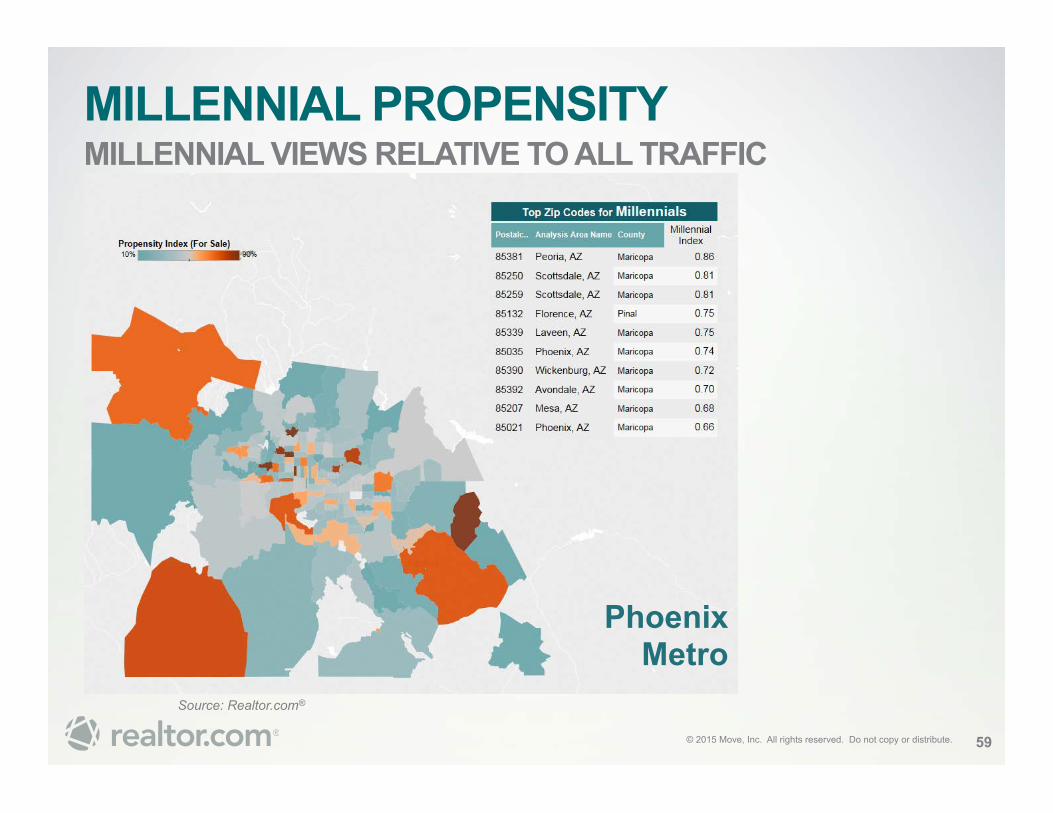
MILLENNIAL PROPENSITY MILLENNIAL VIEWS RELATIVE TO ALL TRAFFIC
Source: Realtor.com®
59
Phoenix Metro
© 2015 Move, Inc. All rights reserved. Do not copy or distribute.
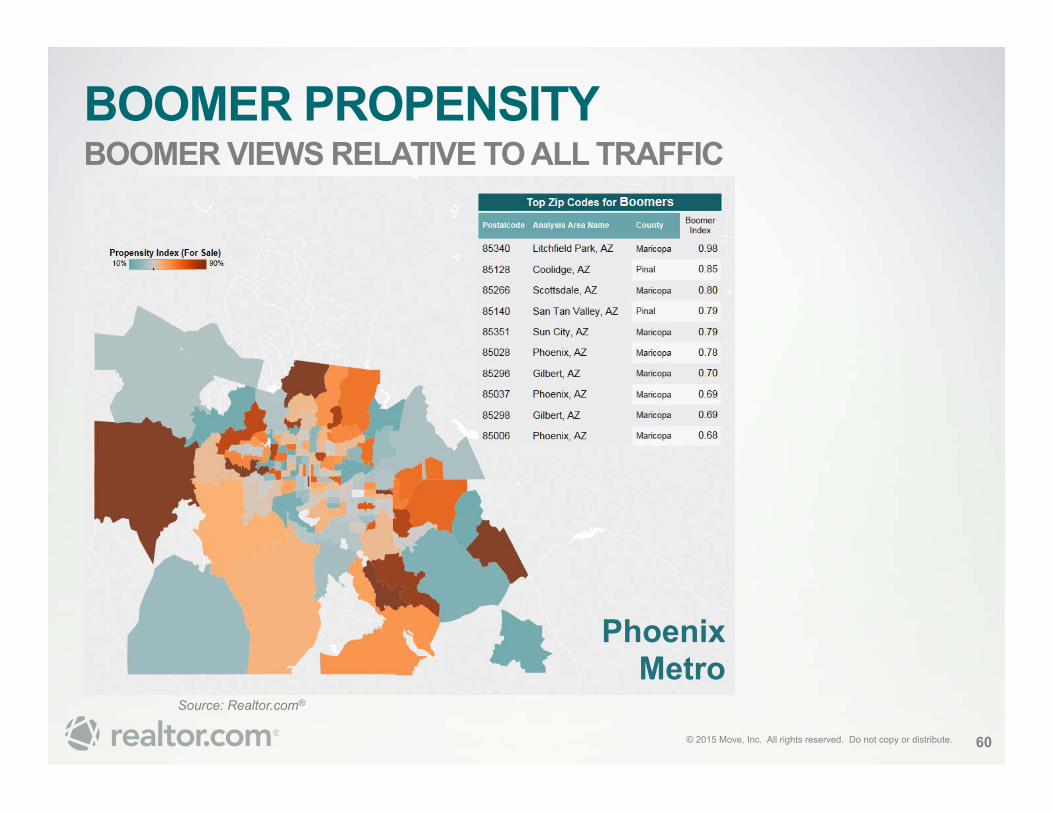
BOOMER PROPENSITY BOOMER VIEWS RELATIVE TO ALL TRAFFIC
Source: Realtor.com®
60
Phoenix Metro
© 2015 Move, Inc. All rights reserved. Do not copy or distribute. 61
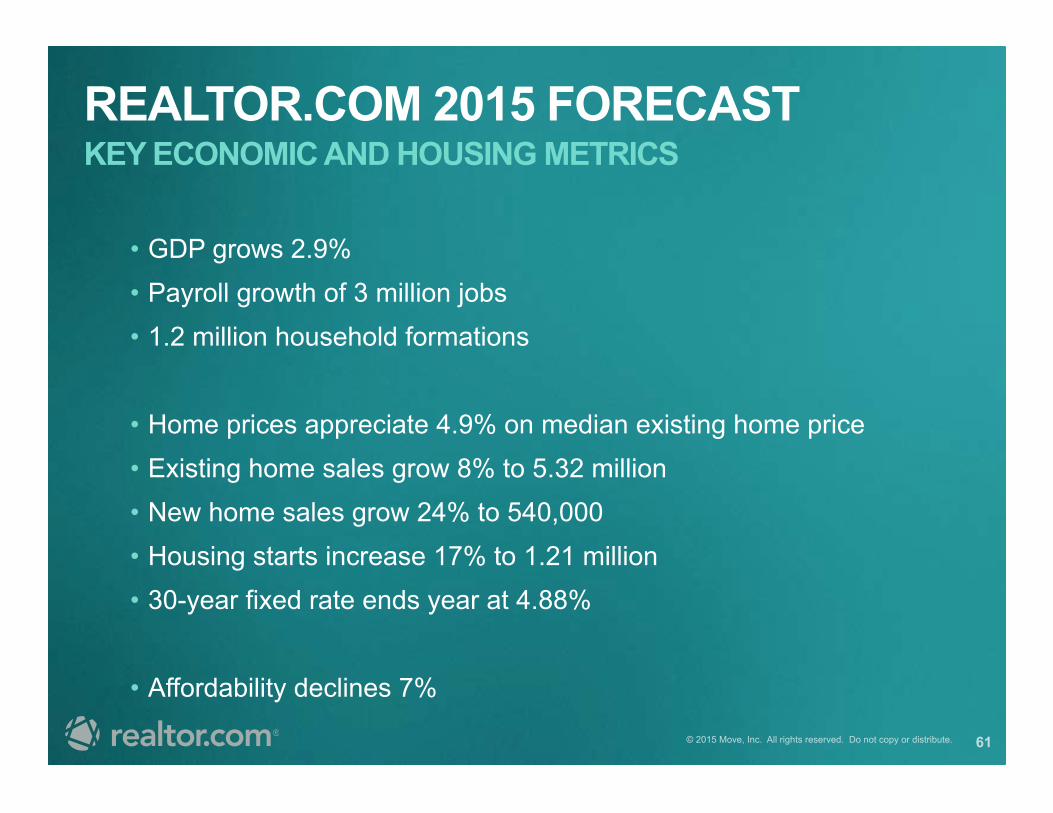
REALTOR.COM 2015 FORECAST KEY ECONOMIC AND HOUSING METRICS
• GDP grows 2.9% • Payroll growth of 3 million jobs • 1.2 million household formations
• Home prices appreciate 4.9% on median existing home price • Existing home sales grow 8% to 5.32 million • New home sales grow 24% to 540,000 • Housing starts increase 17% to 1.21 million • 30-year fixed rate ends year at 4.88%
• Affordability declines 7%

© 2015 Move, Inc. All rights reserved. Do not copy or distribute. 62
Jonathan Smoke Chief Economist
realtor.com®
[email protected] @SmokeonHousing 703.634.9193

THANK YOU
© 2015 Move, Inc. All rights reserved. Do not copy or distribute. 63