2010 housing market outlook in-depth
DESCRIPTION
An in-depth look into the housing market for the Toronto Real Estate Market and Predictions for 2011TRANSCRIPT

Proud Sponsor of the Learning Quest 2010 Seminar Series
REALTOR® QUEST 2010
From Recession to Recovery to… What?:
Charting the Housing Market’s
Course in 2010/2011
Presented by: Jason Mercer, Senior Manager of Market Analysis

Part 1: Bubbles – Some Myths
and Realities
Part 2: Market Drivers
Part 3: 2010 / 2011 Outlook
Part4: The Long-Term View
Part 5: TREB Member Resources

Average Price Continues to Rise…BIG TROUBLE???
0
50,000
100,000
150,000
200,000
250,000
300,000
350,000
400,000
450,000
500,000
Source: Toronto Real Estate Board
Average MLS® Selling Price - GTA

Average Price Continues to Rise…BIG TROUBLE???
0
50,000
100,000
150,000
200,000
250,000
300,000
350,000
400,000
450,000
500,000
Source: Toronto Real Estate Board
Average MLS® Selling Price - GTA
MLS® Average Price (Nominal)
MLS® Average Price (Inflation Adjusted)
Real price is back where it was in
1989! Must be a bubble, right?

Average Price Continues to Rise…BIG TROUBLE???
0
50,000
100,000
150,000
200,000
250,000
300,000
350,000
400,000
450,000
500,000
Source: Toronto Real Estate Board
Average MLS® Selling Price - GTA
MLS® Average Price (Nominal)
MLS® Average Price (Inflation Adjusted)
Price is back where it was in 1989!
Must be a bubble, right?
Tough to Make
this Argument
- Price on its own tells us nothing

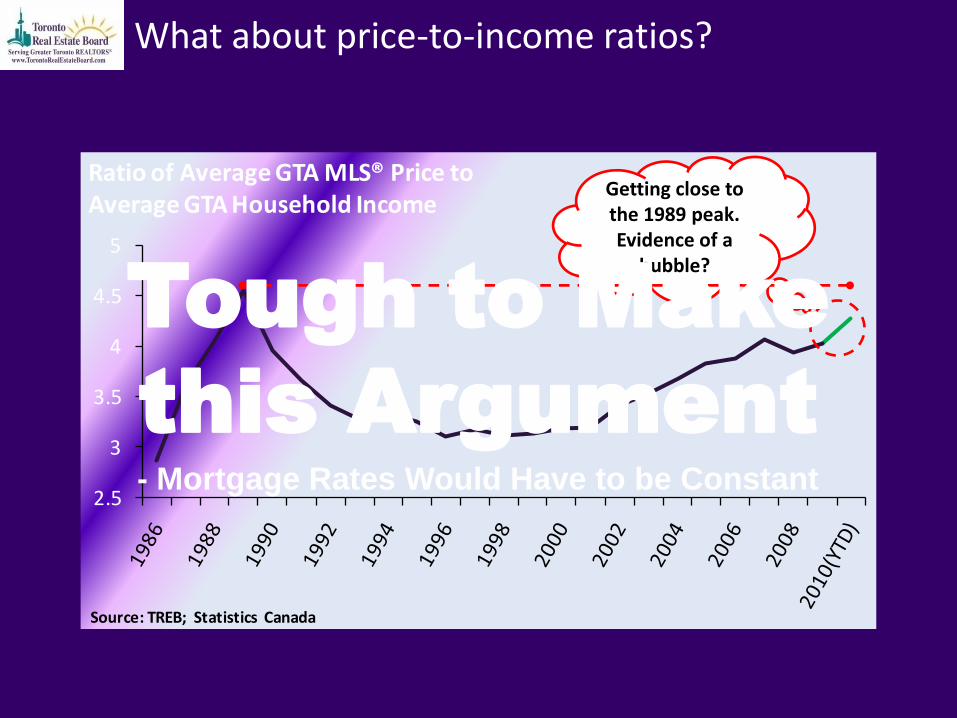
What about price-to-income ratios?
2.5
3
3.5
4
4.5
5
Source: TREB; Statistics Canada
Ratio of Average GTA MLS® Price toAverage GTA Household Income
Getting close to the 1989 peak. Evidence of a
bubble?
2.5
3
3.5
4
4.5
5
Source: TREB; Statistics Canada
Ratio of Average GTA MLS® Price toAverage GTA Household Income
Getting close to the 1989 peak. Evidence of a
bubble?
What about price-to-income ratios?
Tough to Make
this Argument
- Mortgage Rates Would Have to be Constant

By and Large We Pay for Homes Using a Mortgage
2%
7%
12%
17%
22%
Source: Statistics Canada
Average 5-Year Fixed Mortgage Rate: Historic & Forecast
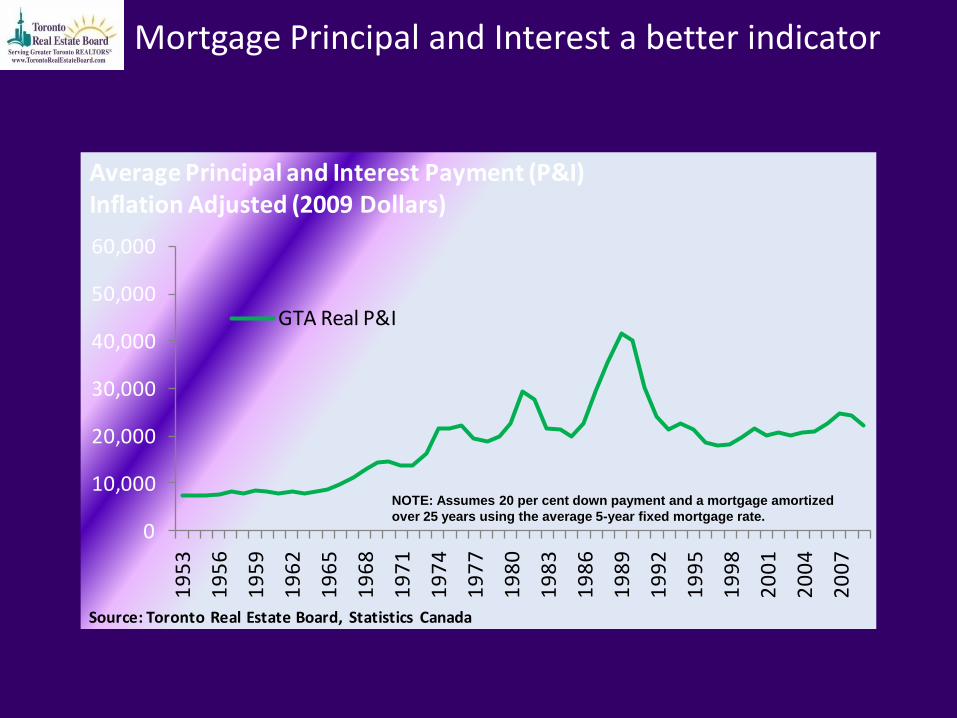
Mortgage Principal and Interest a better indicator
0
10,000
20,000
30,000
40,000
50,000
60,000
19
53
19
56
19
59
19
62
19
65
19
68
19
71
19
74
19
77
19
80
19
83
19
86
19
89
19
92
19
95
19
98
20
01
20
04
20
07
Source: Toronto Real Estate Board, Statistics Canada
Average Principal and Interest Payment (P&I)Inflation Adjusted (2009 Dollars)
GTA Real P&I
NOTE: Assumes 20 per cent down payment and a mortgage amortized
over 25 years using the average 5-year fixed mortgage rate.

Mortgage Principal and Interest a better indicator
0
10,000
20,000
30,000
40,000
50,000
60,000
19
53
19
56
19
59
19
62
19
65
19
68
19
71
19
74
19
77
19
80
19
83
19
86
19
89
19
92
19
95
19
98
20
01
20
04
20
07
Source: Toronto Real Estate Board, Statistics Canada
Average Principal and Interest Payment (P&I)Inflation Adjusted (2009 Dollars)
GTA Real P&I
Can Real P&I
GVA Real P&I
NOTE: Assumes 20 per cent down payment and a mortgage amortized
over 25 years using the average 5-year fixed mortgage rate.

Income – The Final Piece of the Puzzle
$50,000
$60,000
$70,000
$80,000
$90,000
$100,000
Source: Statistics Canada; TREB Estimates and Forecast
Toronto CMA Average Household Income

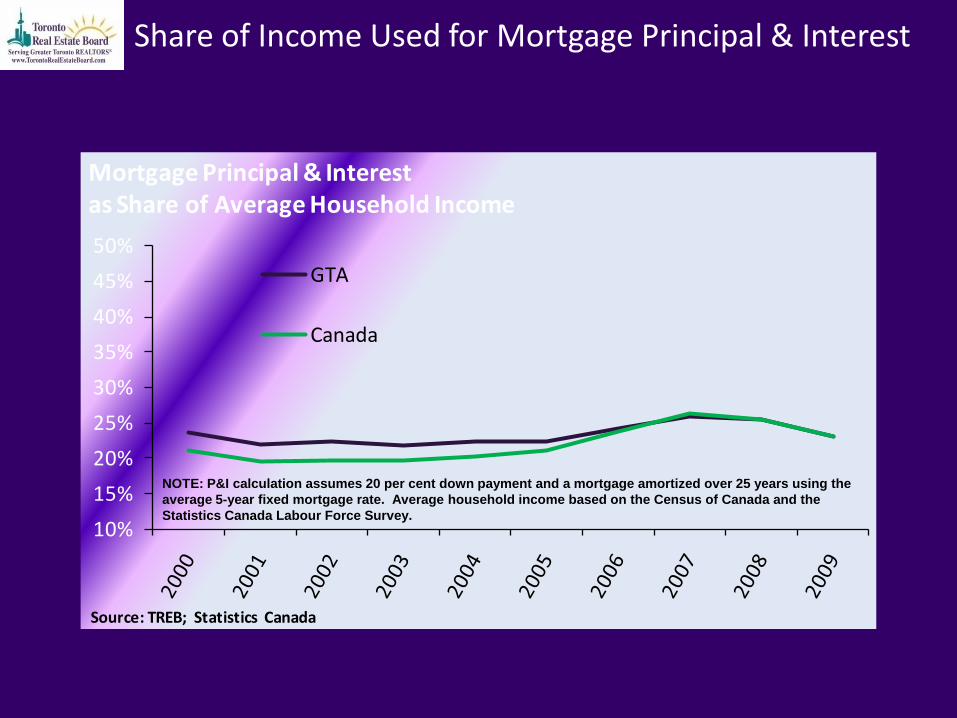
Share of Income Used for Mortgage Principal & Interest
10%
15%
20%
25%
30%
35%
40%
45%
50%
Source: TREB; Statistics Canada
Mortgage Principal & Interestas Share of Average Household Income
GTA
NOTE: P&I calculation assumes 20 per cent down payment and a mortgage amortized over 25 years using the
average 5-year fixed mortgage rate. Average household income based on the Census of Canada and the
Statistics Canada Labour Force Survey.
Share of Income Used for Mortgage Principal & Interest
10%
15%
20%
25%
30%
35%
40%
45%
50%
Source: TREB; Statistics Canada
Mortgage Principal & Interestas Share of Average Household Income
GTA
Canada
NOTE: P&I calculation assumes 20 per cent down payment and a mortgage amortized over 25 years using the
average 5-year fixed mortgage rate. Average household income based on the Census of Canada and the
Statistics Canada Labour Force Survey.

Share of Income Used for Mortgage Principal & Interest
10%
15%
20%
25%
30%
35%
40%
45%
50%
Source: TREB; Statistics Canada
Mortgage Principal & Interestas Share of Average Household Income
GTA
Vancouver
Canada
NOTE: P&I calculation assumes 20 per cent down payment and a mortgage amortized over 25 years using the
average 5-year fixed mortgage rate. Average household income based on the Census of Canada and the
Statistics Canada Labour Force Survey.

25%
30%
35%
40%
45%
50%
55%
Source: Toronto Real Estate Board Data and Calculation; Statistics Canada
TREB Affordability Indicator Share of Average Household Income Used for Mortgage Principal and Interest, Property Taxes and Utilities on the Averaged Priced GTA Resale Home
Affordability: Share of Income Used for Housing Payments
NOTE: P&I calculation assumes 20 per cent down payment and a
mortgage amortized over 25 years using the average 5-year fixed
mortgage rate. Average household income based on the Census of
Canada and the Statistics Canada Labour Force Survey.
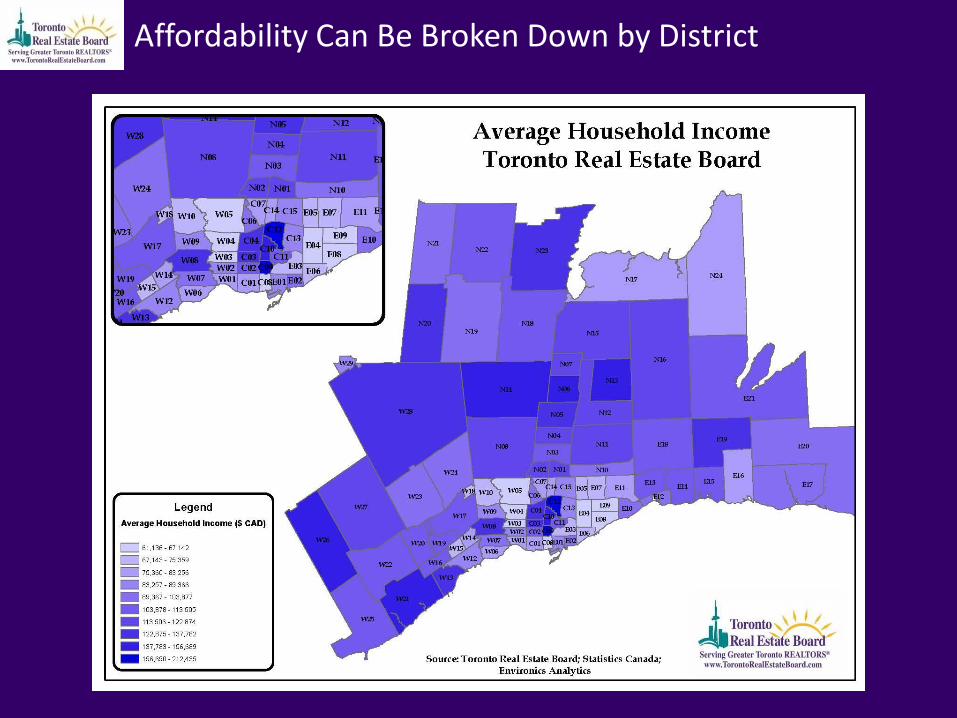
Affordability Can Be Broken Down by District

Affordability Can Be Broken Down by District
?

Affordability Can Be Broken Down by District
?

Affordability Can Be Broken Down by District
?

25%
30%
35%
40%
45%
50%
55%
Source: Toronto Real Estate Board Data and Calculation; Statistics Canada
TREB Affordability Indicator Share of Average Household Income Used for Mortgage Principal and Interest, Property Taxes and Utilities on the Averaged Priced GTA Resale Home
Affordability: Share of Income Used for Housing Payments
NOTE: P&I calculation assumes 20 per cent down payment and a
mortgage amortized over 25 years using the average 5-year fixed
mortgage rate. Average household income based on the Census of
Canada and the Statistics Canada Labour Force Survey.
What if we assumed that the GDS Ratio had to remain at 32%, with the average
home price having to adjust to make up for changes in interest rates, income etc.?

Concept of Justified Price…Suggests No Bubble Right Now
$100,000
$150,000
$200,000
$250,000
$300,000
$350,000
$400,000
$450,000
$500,000
Source: TREB, Statistics Canada
Actual GTA MLS® Price vs.Average Price Justified by Constant 32% GDS Ratio
Actual GTA Average MLS® Price

Concept of Justified Price…Suggests No Bubble Right Now
$100,000
$150,000
$200,000
$250,000
$300,000
$350,000
$400,000
$450,000
$500,000
Source: TREB, Statistics Canada
Actual GTA MLS® Price vs.Average Price Justified by Constant 32% GDS Ratio
Justified Average MLS® Price Assuming a Constant GDS Ratio of 32 Per cent
Actual GTA Average MLS® Price
Bubble
LTT

Part 1: Bubbles – Some Myths
and Realities
Part 2: Market Drivers
Part 3: 2010 / 2011 Outlook
Part4: The Long-Term View
Part 5: TREB Member Resources
Components of Affordability
Average
Price
Hhld
IncomeMortgage
Rates
Taxes &
Utilities
? ? ? ?

Economic Recovery is Underway in Canada
-1.2%
-0.8%
-0.4%
0.0%
0.4%
0.8%
Source: Statistics Canada
Canadian Real GDP, MonthlyMonth-Over-Month Per Cent Change
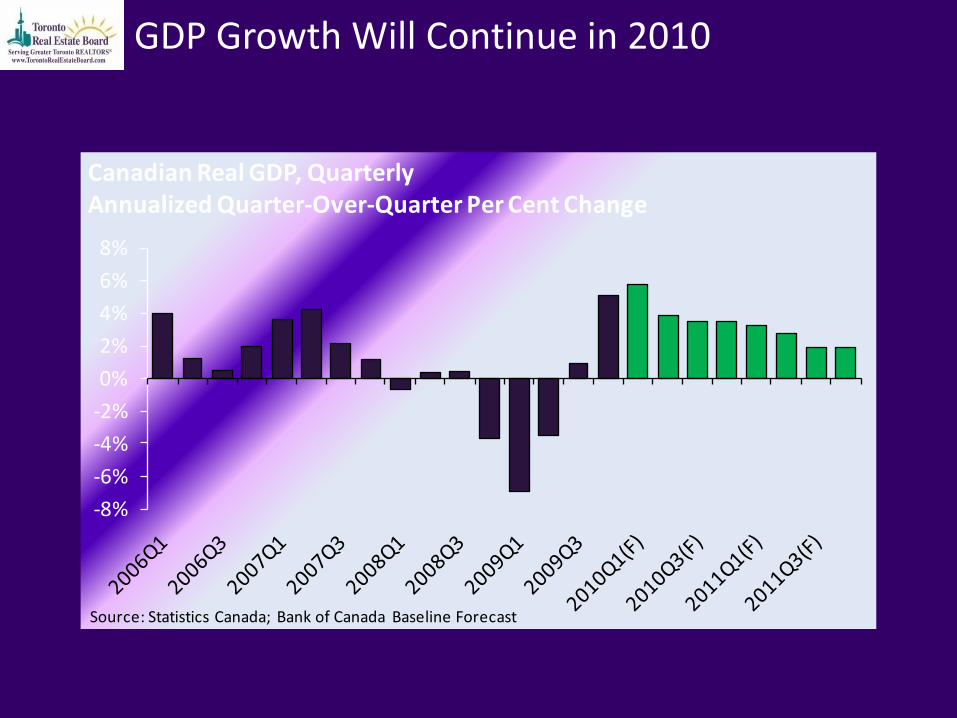
GDP Growth Will Continue in 2010
-8%
-6%
-4%
-2%
0%
2%
4%
6%
8%
Source: Statistics Canada; Bank of Canada Baseline Forecast
Canadian Real GDP, QuarterlyAnnualized Quarter-Over-Quarter Per Cent Change

Components of GDP Growth
FACT: More than 60 per cent of Canadian GDP is accounted for by personal expenditure

-2%
-1%
0%
1%
2%
3%
4%
Source: Statistics Canada
Canadian Consumer Price Index (CPI)Year-Over-Year Per Cent Change
CPI Annual Per Cent Change
Core CPI (Bank of Canada) Annual Per Cent Change
Consumer Price Growth Hovering at BoC Target
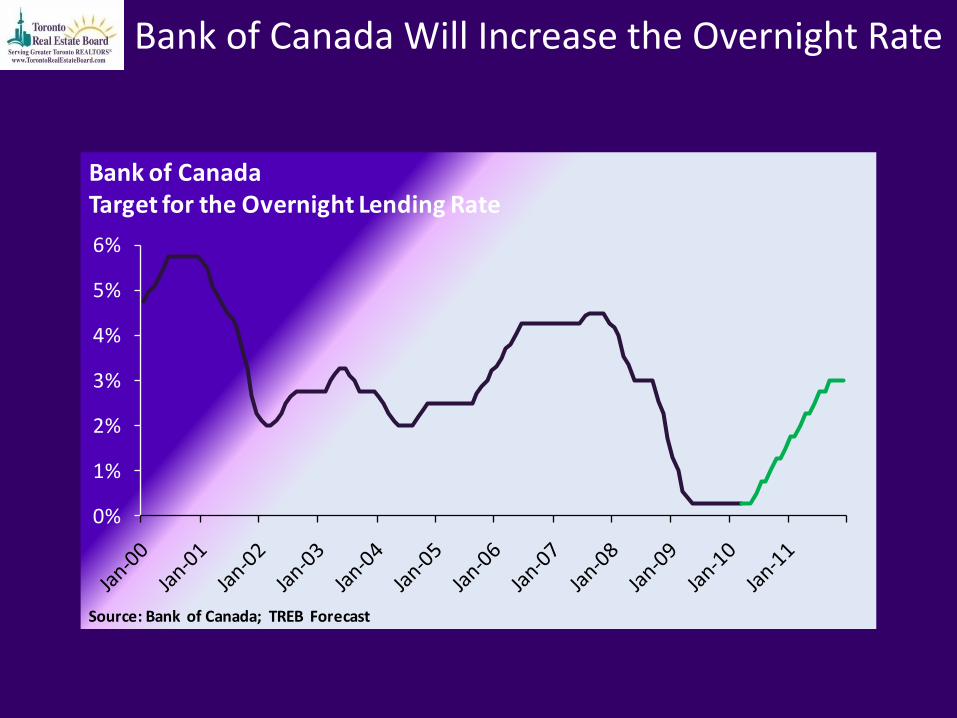
Bank of Canada Will Increase the Overnight Rate
0%
1%
2%
3%
4%
5%
6%
Source: Bank of Canada; TREB Forecast
Bank of CanadaTarget for the Overnight Lending Rate

Slope of Yield Curve Changing
0.00%
0.50%
1.00%
1.50%
2.00%
2.50%
3.00%
3.50%
4.00%
4.50%
Bill
/Bo
nd
Yie
ld
Source: Bank of Canada; TREB Forward Rate Calculations
Canadian Government of Canada Bill/Bond Yield CurveSpot and Derived Forward Rates
Spot (May 5, 2010)
December 2010 Forward Curve
December 2011 Forward Curve

Variable and Fixed Mortgage Rates Will Increase Disproportionately
0
1
2
3
4
5
6
7
8
9
Jan
-00
Jul-
00
Jan
-01
Jul-
01
Jan
-02
Jul-
02
Jan
-03
Jul-
03
Jan
-04
Jul-
04
Jan
-05
Jul-
05
Jan
-06
Jul-
06
Jan
-07
Jul-
07
Jan
-08
Jul-
08
Jan
-09
Jul-
09
Jan
-10
Jul-
10
Jan
-11
Jul-
11
Pe
r C
en
t
Source: Bank of Canada; TREB Forecast
Prime Rate and 5-Year Fixed Mortgage RateHistoric and 2010 Forecast
Average 5-Year Fixed Mortgage Rate
Prime Rate
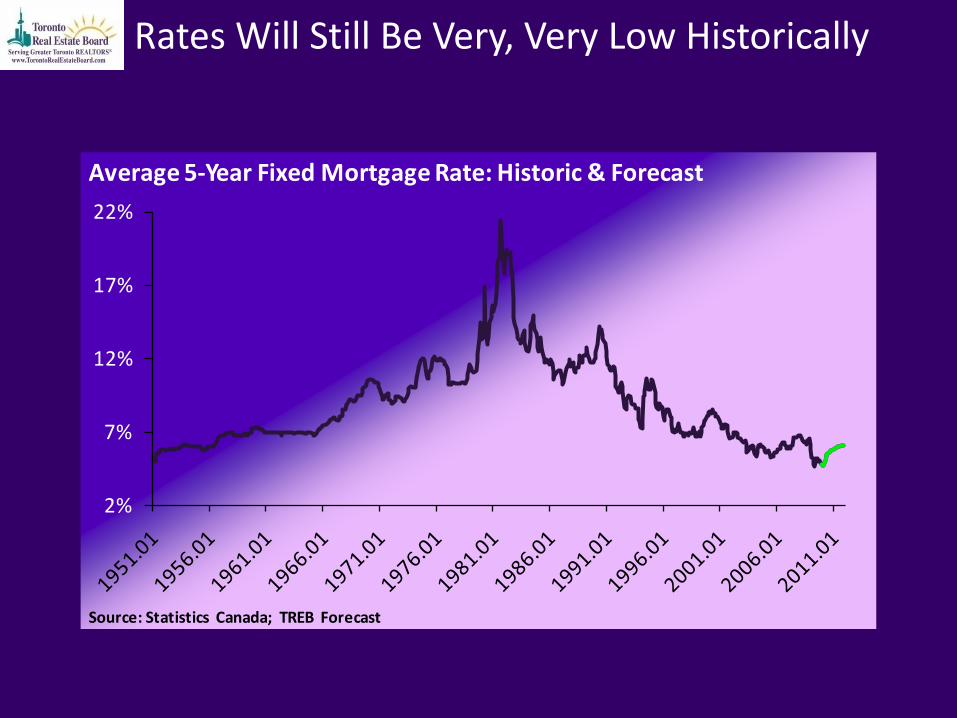
Rates Will Still Be Very, Very Low Historically
2%
7%
12%
17%
22%
Source: Statistics Canada; TREB Forecast
Average 5-Year Fixed Mortgage Rate: Historic & Forecast

Components of Affordability
Average
Price
Hhld
Income
Mortgage
Rates
Taxes &
Utilities
? ? ?

GTA Employment Will Improve in 2010 & 2011
-2%
-1%
0%
1%
2%
3%
4%
2,650
2,700
2,750
2,800
2,850
2,900
2,950
3,000
3,050 Emp
loym
en
t An
nu
al Pe
r cen
t Ch
ange
Act
ual
Em
plo
yme
nt
(,0
00
s)
Source: Statistics Canada, TREB Forecast
Toronto CMA EmploymentActual and Annual Per Cent Change
Annual Per Cent Change
GTA Average Employment

GTA Unemployment Will Be Above Average in 2010
5%
6%
7%
8%
9%
10%
11%
Source: Statistics Canada; TREB Forecast
Toronto CMA Unemployment Rate(Seasonally Adjusted)

Earnings Will Trend Upward
$740
$760
$780
$800
$820
$840
$860
$880
$900
Source: Statistics Canada; TREB Forecast
Toronto CMA Average Weekly Earnings(Seasonally Adjusted)

Household Income Growth Picking Up in 2011
$50,000
$60,000
$70,000
$80,000
$90,000
$100,000
Source: Statistics Canada; TREB Estimates and Forecast
Toronto CMA Average Household Income

Components of Affordability
Average
Price
Mortgage
Rates
Taxes &
Utilities
? ?Hhld
Income
Up
Slowly

Components of Affordability
Average
Price
Mortgage
Rates ?Hhld
Income
Up
Slowly
Taxes &
Utilities

Part 1: Bubbles – Some Myths
and Realities
Part 2: Market Drivers
Part 3: 2010 / 2011 Outlook
Part4: The Long-Term View
Part 5: TREB Member Resources

MLS® Sales Remaining Strong but Edging Lower
20%
30%
40%
50%
60%
70%
80%
90%
100%
50,000
70,000
90,000
110,000
130,000
150,000
170,000
190,000 Sales-to
-Ne
w Listin
gs Ratio
Sale
s/Li
stin
gs T
ren
d (
An
nu
aliz
ed
)
Source: Toronto Real Estate Board
TREB MLS® Annualized Sales/Listings Trend: Historic & Forecast
MLS Sales

More Home Owners Will List
20%
30%
40%
50%
60%
70%
80%
90%
100%
50,000
70,000
90,000
110,000
130,000
150,000
170,000
190,000 Sales-to
-Ne
w Listin
gs Ratio
Sale
s/Li
stin
gs T
ren
d (
An
nu
aliz
ed
)
Source: Toronto Real Estate Board
TREB MLS® Annualized Sales/Listings Trend: Historic & Forecast
MLS SalesMLS New ListingsSales-to-New Listings Ratio

Market Conditions Not as Tight in 2010
20%
30%
40%
50%
60%
70%
80%
90%
100%
50,000
70,000
90,000
110,000
130,000
150,000
170,000
190,000 Sales-to
-Ne
w Listin
gs Ratio
Sale
s/Li
stin
gs T
ren
d (
An
nu
aliz
ed
)
Source: Toronto Real Estate Board
TREB MLS® Annualized Sales/Listings Trend: Historic & Forecast
MLS SalesMLS New ListingsSales-to-New Listings Ratio

After Very Strong Price Growth in 2009 & Q1 2010
200,000
250,000
300,000
350,000
400,000
450,000
Source: Toronto Real Estate Board
TREB MLS® Average Price Trend: Historic & Forecast

…the Average Price Trend Will Flatten
200,000
250,000
300,000
350,000
400,000
450,000
Source: Toronto Real Estate Board
TREB MLS® Average Price Trend: Historic & Forecast
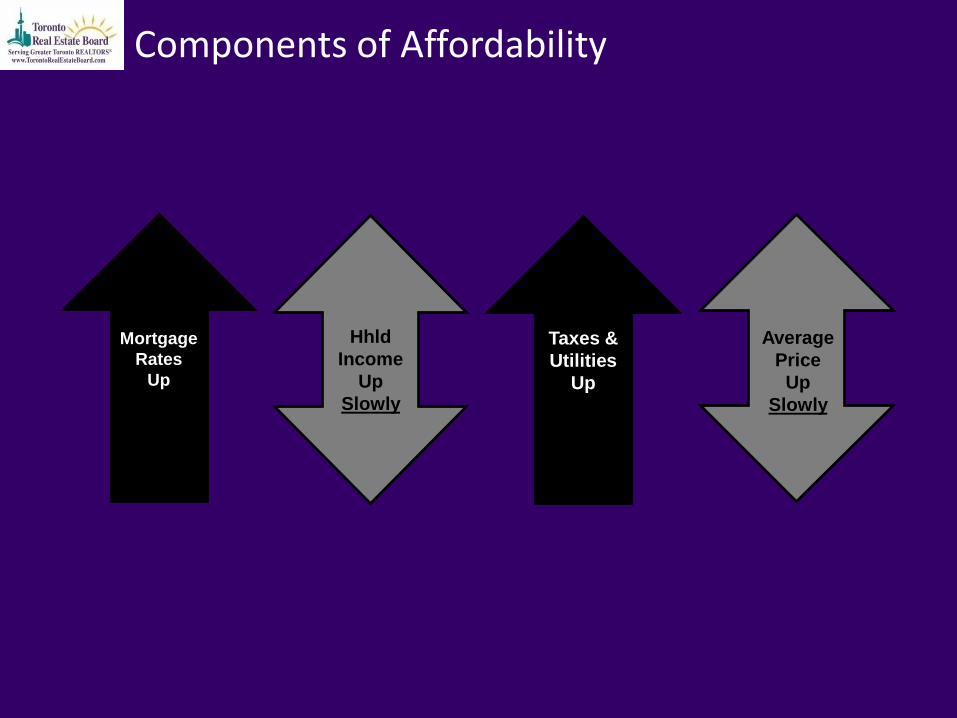
Components of Affordability
Mortgage
Rates
Up
Hhld
Income
Up
Slowly
Taxes &
Utilities
Up
Average
Price
Up
Slowly

The Cost of Home Ownership Will Rise
25%
30%
35%
40%
45%
50%
55%
Source: Toronto Real Estate Board Data and Calculation; Statistics Canada
TREB Affordability Indicator Share of Average Household Income Used for Mortgage Principal and Interest, Property Taxes and Utilities on the Averaged Priced GTA Resale Home
NOTE: P&I calculation assumes 20 per cent down payment and a
mortgage amortized over 25 years using the average 5-year fixed
mortgage rate. Average household income based on the Census of
Canada and the Statistics Canada Labour Force Survey.

Average Price and Justified Price Will Move In Line
$100,000
$150,000
$200,000
$250,000
$300,000
$350,000
$400,000
$450,000
$500,000
Source: TREB, Statistics Canada
Actual GTA MLS® Price vs.Average Price Justified by Constant 32% GDS Ratio
Justified Average MLS® Price Assuming a Constant GDS Ratio of 32 Per cent
Actual GTA Average MLS® Price

Part 1: Bubbles – Some Myths
and Realities
Part 2: Market Drivers
Part 3: 2010 / 2011 Outlook
Part4: The Long-Term View
Part 5: TREB Member Resources

Immigration Drives Population Growth
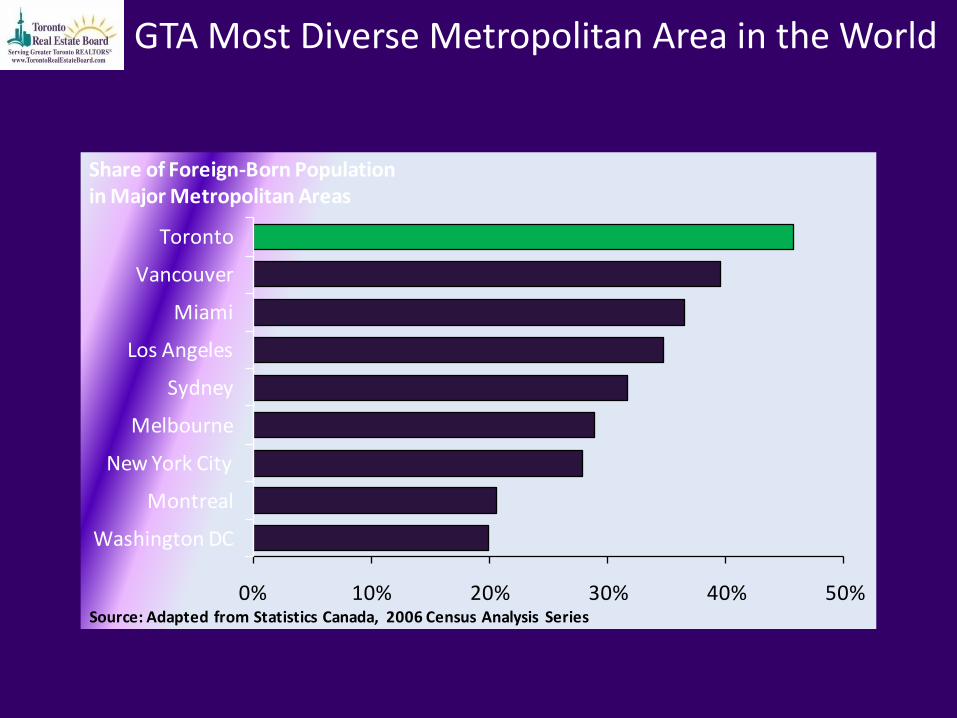
GTA Most Diverse Metropolitan Area in the World
0% 10% 20% 30% 40% 50%
Washington DC
Montreal
New York City
Melbourne
Sydney
Los Angeles
Miami
Vancouver
Toronto
Source: Adapted from Statistics Canada, 2006 Census Analysis Series
Share of Foreign-Born Populationin Major Metropolitan Areas
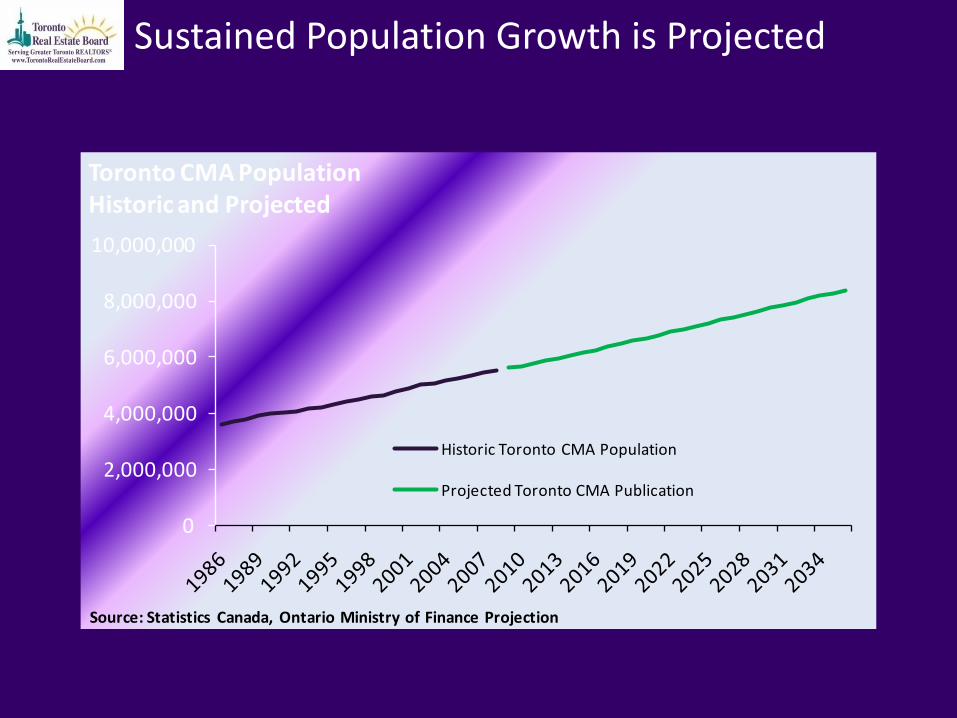
Sustained Population Growth is Projected
0
2,000,000
4,000,000
6,000,000
8,000,000
10,000,000
Source: Statistics Canada, Ontario Ministry of Finance Projection
Toronto CMA PopulationHistoric and Projected
Historic Toronto CMA Population
Projected Toronto CMA Publication
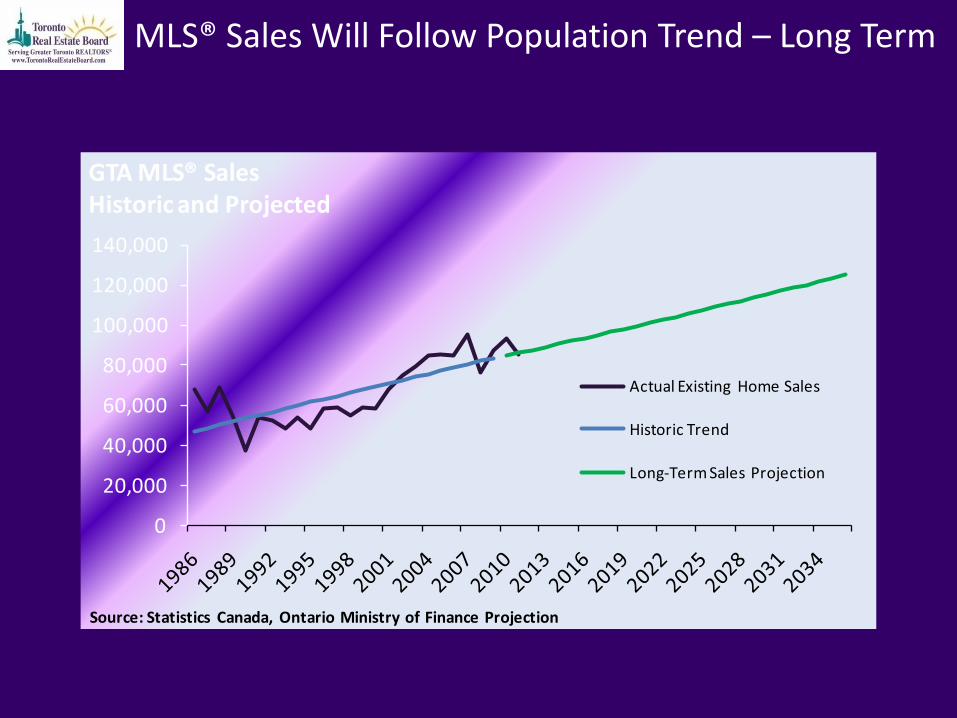
MLS® Sales Will Follow Population Trend – Long Term
0
20,000
40,000
60,000
80,000
100,000
120,000
140,000
Source: Statistics Canada, Ontario Ministry of Finance Projection
GTA MLS® SalesHistoric and Projected
Actual Existing Home Sales
Historic Trend
Long-Term Sales Projection

Part 1: Bubbles – Some Myths
and Realities
Part 2: Market Drivers
Part 3: 2010 / 2011 Outlook
Part4: The Long-Term View
Part 5: TREB Member Resources
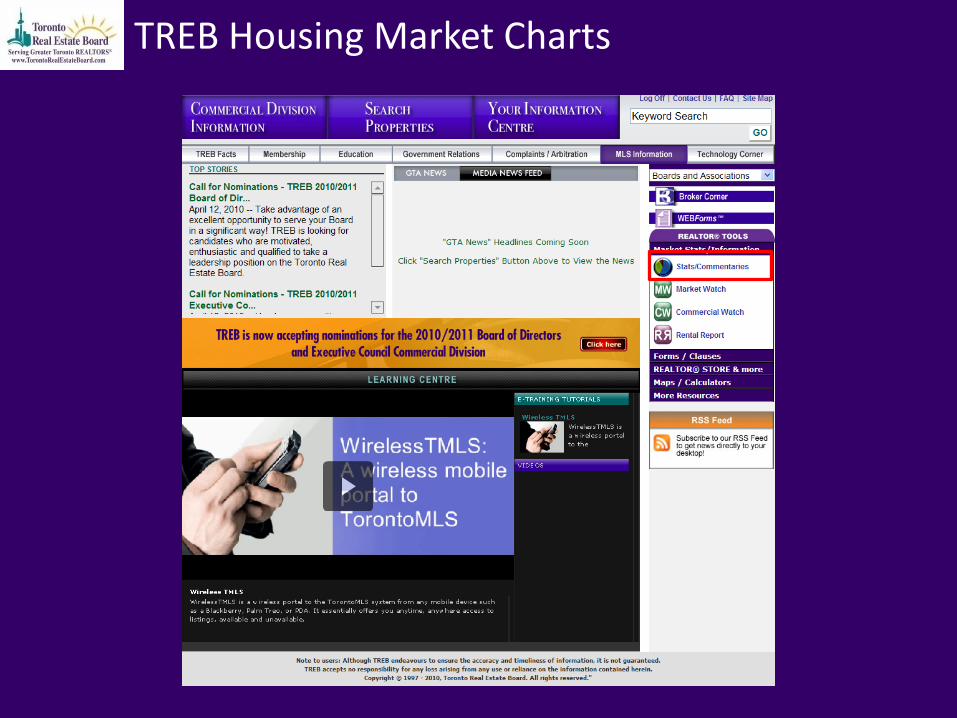
TREB Housing Market Charts

TREB Housing Market Charts
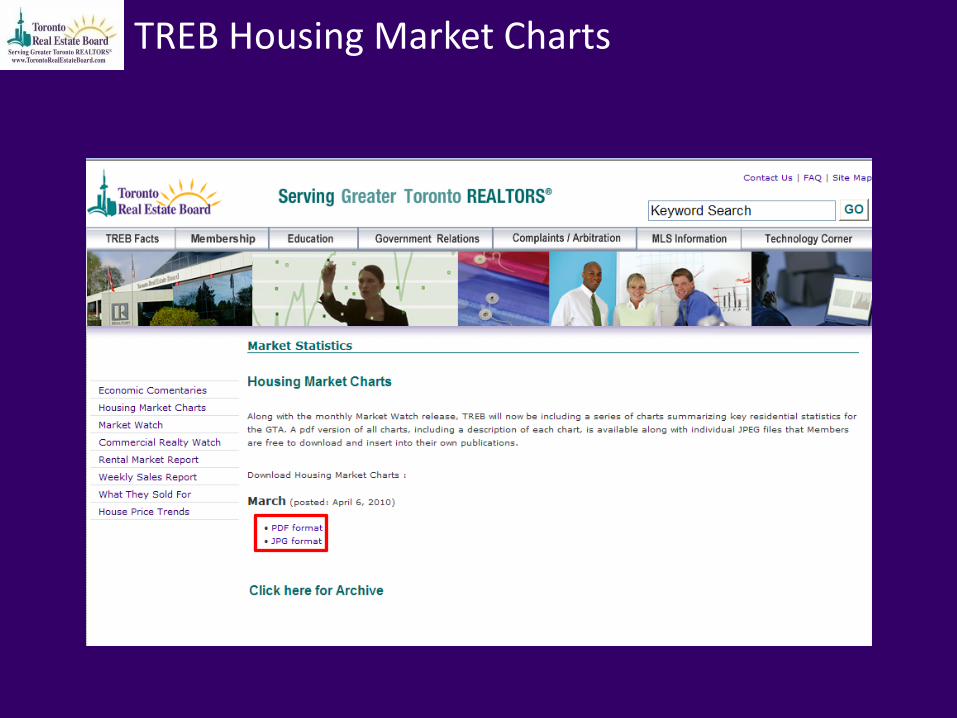
TREB Housing Market Charts

TREB Housing Market Charts

TREB Economic Commentaries
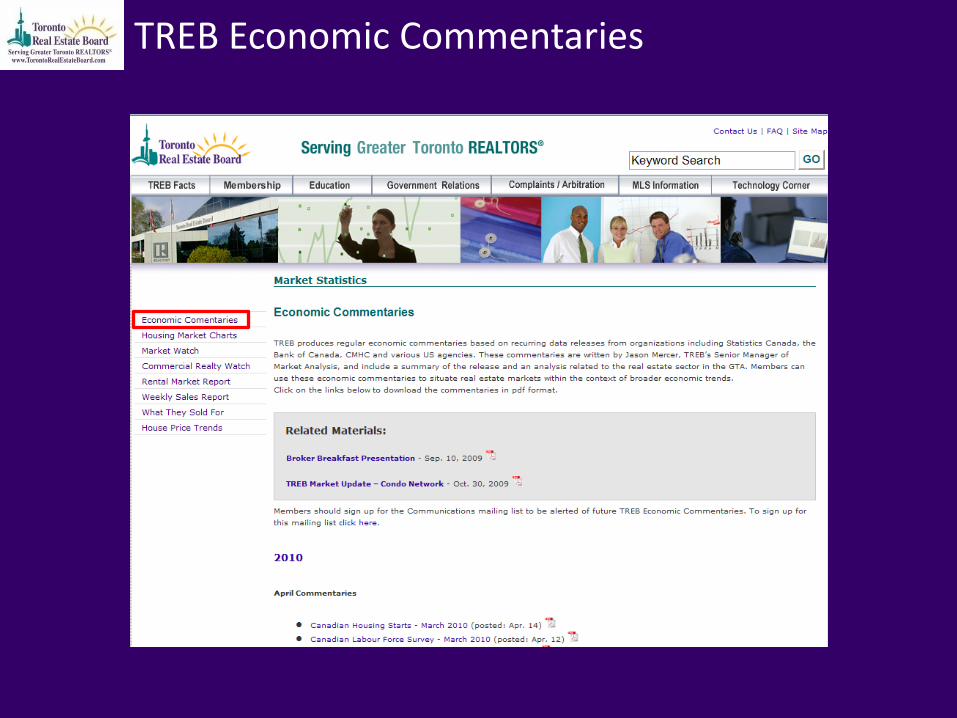
TREB Economic Commentaries
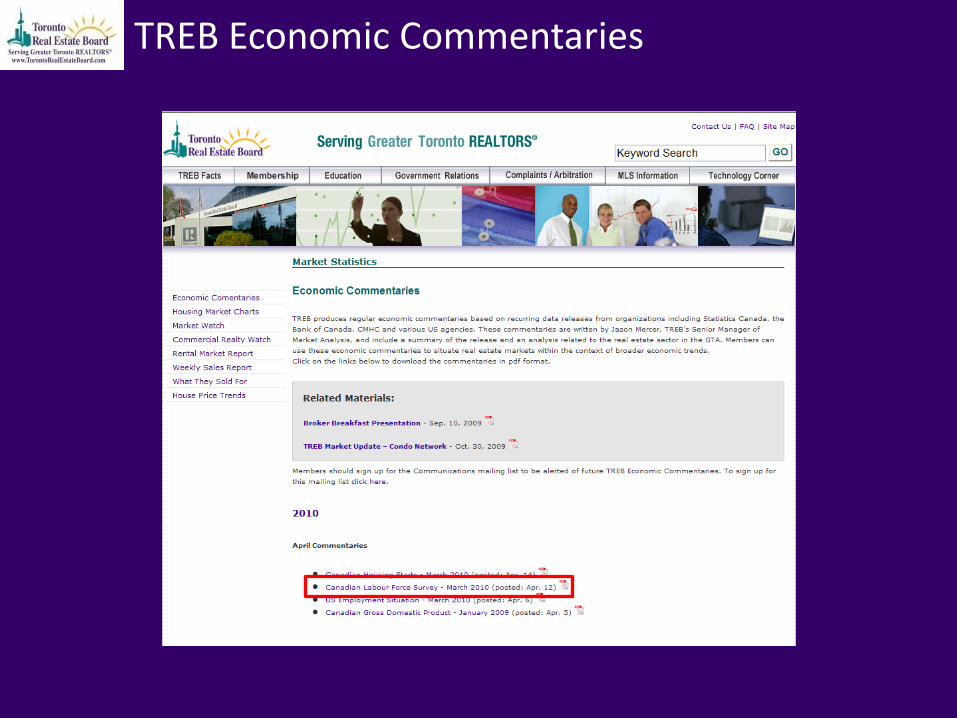
TREB Economic Commentaries
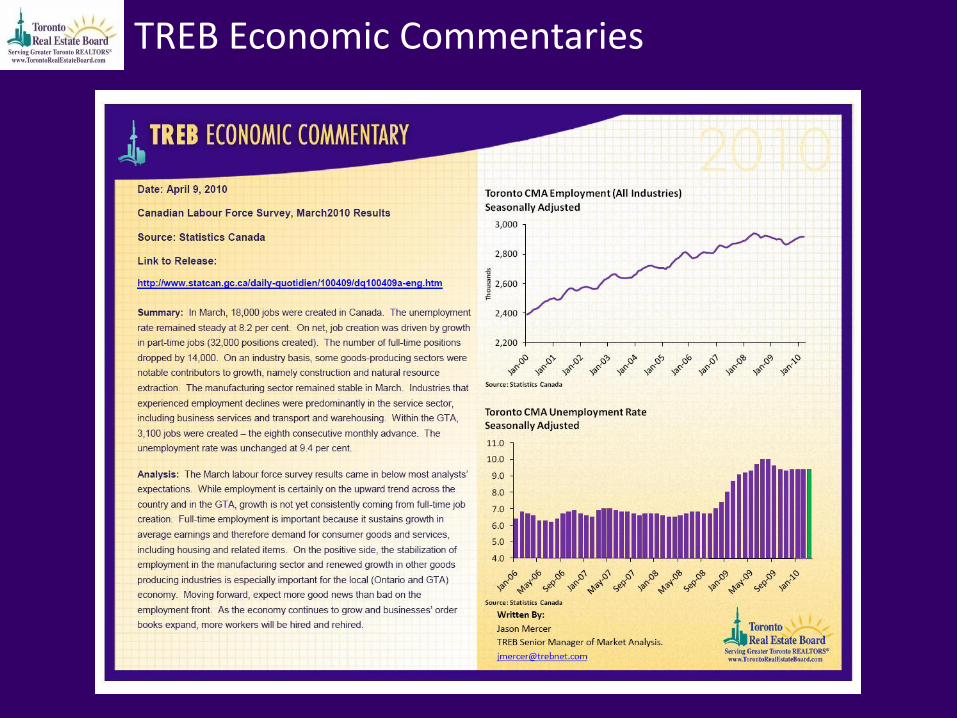
TREB Economic Commentaries

Thank You!
Any Questions?