the open civil engineering journal
TRANSCRIPT
1874-1495/21 Send Orders for Reprints to [email protected]
266
DOI: 10.2174/1874149502115010266, 2021, 15, 266-278
The Open Civil Engineering JournalContent list available at: https://opencivilengineeringjournal.com
RESEARCH ARTICLE
Permeable Pavements Hydraulic Modelling: An Experimental Study
Simone Infante1, Mirka Mobilia1,*, Antonia Longobardi1 and Mauro Albini2
1Department of Civil Engineering, University of Salerno, Fisciano, Italy2Socotec Italy, Socotec Group, Pavement Division, Ferrara, Italy
Abstract:
Introduction:
The changes in land use associated with urban development cause an increase in urban flooding. Low Impact Development (LID) systems help tomitigate this hazardous phenomenon.
Methods:
Among LIDs, Permeable Pavement (PP) proved to be a very effective technology in reducing surface runoff. In light of this, the present researchanalyzes the Retention Capacities (RC) of three different PP samples, which differ in terms of composition and percentage of bitumen andaggregates and have been realized according to Italian national regulations and technical specifications. Hydraulic laboratory tests are conductedusing a rainfall simulator to quantify the Retention Capacity (RC) of the three samples in response to rainfall events with different intensities (5,10, 20, 30 mm/h).
Results:
The values of RC range between 85% and 20%, depending on the rainfall and sample properties, confirming the high potential of PPs in reducingsurface stormwater production. The accuracy of HYDRUS-1D model in simulating the surface runoff from the PP samples has been investigated.HYDRUS-1D has been calibrated using measured data of runoff from the laboratory tests and adopting NSE as an optimization criterion.
Conclusion:
The parameters sets obtained by the calibration procedure give back Nash–Sutcliffe Efficiency (NSE) values close to 1 for each PP configuration,which means a very high accuracy in model prediction. Finally, a sensitivity analysis has allowed to identify, by means of a global sensitivity indexS, the most and the less influential parameters within the model, which respectively are the saturated hydraulic conductivity Ks (S=0.57) and thetortuosity coefficient L (S=0.015).
Keywords: Permeable pavements, Low impact development, HYDRUS -1D, Runoff coefficient, Calibration, Sensitivity analysis, ANAS,Autostrade per l’ Italia .
Article History Received: October 27, 2020 Revised: March 31, 2021 Accepted: May 6, 2021
1. INTRODUCTION
In recent decades, the population growth and the urbansettlments expansion caused a significant increase in thepercentage of impervious areas in the form of roads, car parks,driveways, sidewalks, and building roofs which have replacedforested land, crops, agricultural land, and other vegetatedareas. The reduction of pervious areas produces an increase instormwater production, peak rate, and overland flow velocity,resulting in time distribution of the runoff different from the
* Address correspondence to this author at the Department of Civil Engineering,Università degli Studi di Salerno - Via Giovanni Paolo II, 132 - 84084 Fisciano(SA), Italy; Tel: +39 089963409; E-mail: [email protected]
natural pattern [1 - 3]. The variation in the hydrological cyclecauses an increase in both the likelihood and severity of floodsin urban areas [4]. Floods have relevant social consequencesfor communities and individuals, including damage tobuildings and other structures and, in the most extreme cases,losses of human lives. In light of this, it is crucial that action istaken to attenuate the effects of damaging events in urban areas[5]. Over recent decades, Low Impact Development (LID)practices have become one of the most popular and effectivemethods used for managing stormwater and mitigating urbanfloods. These practices are engineering approaches that mimicnatural processes like infiltration, evapotranspiration, andgroundwater recharge in order to restore the watershed
Permeable Pavements Hydraulic Modelling The Open Civil Engineering Journal, 2021, Volume 15 267
hydrology before urbanization [6]. LID employs a wide rangeof devices such as green roofs, bio-retention cells, rain gardens,permeable pavements [7 - 11]. The Permeable Pavements (PPs)are porous surfaces made up of open-pore pavers which allowthe water to pass through the structure rather than running off.They represent an alternative to traditional imperviouspavements compared to which they have proved to be moreeffective, especially from the hydrological point of view;indeed, studies in the scientific literature have demonstratedthat porous pavements allow to capture up to 75% of the waterfalling on their surfaces [12] and retain nearly 100% ofrainwater from rainfall events lower than 6mm in depth,without runoff occurrences [13].
Anyway, the retention capacity of the PP systems stronglydepends on their composition; indeed, different types of porousmedia of cementitious materials exist, like cementitiouscomposites reinforced with natural plant fibers [14], reinforcedconcrete with high porosity [15, 16], fiberglass-reinforcedasphalt concrete [17], mortars with recycling of Constructionand Demolition Waste (CDW) [18], pervious concrete with theincorporation of a rheology-modifying admixture [19], andpervious concrete with single-size crushed rock [20]. The waterretention ranges from maximum values higher than 95% formatrices in açaí fiber-reinforced [14] to minimum valuesbetween 15% and 18% for mortar mixed with CDW [18]. Theretention capacity also depends on structural factors like thetop layer thickness [21] and the layers setting, including thenumber of sub-base layers [22]; indeed, the higher the depth ofthe top layer, the larger the runoff retention. Generally, thehydrological performance of a monolithic permeable pavementis higher than the one provided by PP modular form [23].Regardless of the type of the selected PPs, a successful choice,in order to restore the hydrology of an urban catchment, couldbe the replacement of the impervious pavements with thesesystems, since the percent coverage of paved surfaces,excluding roofs, in urban areas, exceeds the 50% [24, 25] andthis offers the opportunity of a wide application of LIDs inresidential zones with an effective storm flooding reduction. Inaddition, PPs are very versatile, and they are suitable fordifferent conditions that include less-travelled areas, parkinglots, sidewalks, low-traffic areas, driveways, pedestrian areas,low-medium speed areas, alleys, patios, low-water bridges, andmuch more [26]. Due to the great potential of PermeablePavements in attenuating storm events, accurate modelling oftheir hydrological behavior becomes necessary to plan actionsin a punctual and focused way for risky areas. Despite thisneed, PPs, compared to other LID systems, mostly lackextensively tested tools for modeling their hydraulicperformances; however, still few models have been proposedin previous researchers for this purpose. Among these, Illgen etal. and Turco et al. [27, 28] used HYDRUS-2D for thenumerical analysis of PPs. Palla and Gnecco and, Zhu et al.[29, 30] simulated the runoff production from permeablepavements using Storm Water Management Model (SWMM).Carbone et al. and Brunetti et al. [31, 32] investigated theaccuracy of HYDRUS-1D in predicting the hydraulicperformance of permeable pavement. Huang et al. [33]introduced a numerical model for simulating the behavior ofpermeable pavements in stormwater runoff management.
Cortier et al. [34] presented a physically-based model built onpartial differential equations able to describe the hydrologicalresponse of porous pavements. Mahmoud et al. [35] proposedthe Windows Source Loading and Management Model(WinSLAMM) method to simulate the stormwater runoffvolume produced by a permeable pavement system. It followsthat the development and the use of models to reproduce thehydrological behavior of PPs are still limited. The littlemodels’ exploration is a limiting factor in the adoption of thesepractices [31, 34], so more research is needed in this direction.In light of this, the aim of the present work is to study theresponse of three kinds of permeable pavement to differentrainfall events, in terms of runoff retention, usingHYDRUS-1D.
This model has been selected since it has proved to returnhigh fitting between numerical simulations and experimentalmeasurements relating to PP systems. It has been preferred toother models since it requires less computational effort andinput data, so even the less experienced users can approach thesimulation tasks. In addition, it is readily available to thescientific community since it can be downloaded for freecontrary to the same software but for two-dimensionalapplications (HYDRUS-2D) indeed, the purchase price reflectsthe complexity of the computational domain [28, 32, 36, 37]. Inthe end, due to the small size of the samples, the water dynamicis one-dimensional hence the use of HYDRUS-1D whichreproduces the one-dimensional flow appeared particularlysuitable in the reported study.
Although other works used HYDRUS-1D to reproduce thePP hydrological behaviour, they differ from the presentresearch in the types of investigated PP systems. Indeed thethree samples here used have been realized according to thesuggestions of “ANAS” (National Autonomous RoadsCorporation) and “Autostrade per l’Italia” (leading ItalianConcessionaire for toll motorway, management and for relatedtransport services) which are the Italian national competentauthorities while the PP analyzed in similar studies have beenproduced following the technical international specifications ofInterlocking Concrete Pavement Institute (ICPI). The lattersuggests a layer mainly composed of a mixture of sand, glasssand and zeolite while the Italian standards require acomposition including binder and aggregates like sand, basalt,porphyry and filler [31, 32]. In addition, while other worksdiscuss the long-term hydrological performances of the PPunder investigation, here, the event scale response has beenexplored [32]. Furthermore, in contrast to similar event-scaleanalysis, in the present study, the range of the investigatedrainfall intensities is different and wider [31].
In detail, the present research investigates the hydrologicalresponse of three PP samples to ordinary, moderate, severe andextremely severe rainfall events with intensities respectively of5, 10, 20, 30 mm/h. The samples have been realized atSOCOTEC (Society for the Control of Technology) laboratory,in the section of Ferrara, according to the Italian Nationalstandard and they differ for the percentage of bitumen andaggregates used during the production phase. At first, for anexhaustive description of the work samples, a mechaniccharacterization has been performed through the determination
268 The Open Civil Engineering Journal, 2021, Volume 15 Infante et al.
of their indirect tensile strength and complex dynamicmodulus. As a continuation of the analysis, the hydrologicalbehavior of the three samples, when subjected to storm eventswith different intensities, has been observed. The hydraulictests have been conducted in the Maritime and EnvironmentalHydraulic Laboratory of the University of Salerno using arainfall simulator. Subsequently, the ability of the physically-based model HYDRUS-1D in correctly reproducing the PPshydrological response has been investigated. The model hasbeen calibrated coupling the modelling results to measured datacollected from the three test pieces during the lab tests. TheNash-Sutcliffe Efficiency (NSE) index has been used as theobjective function. Indeed, the calibration parameters set hasbeen iteratively changed until model simulations matchedmeasured calibration data with the highest NSE. In conclusion,a sensitivity analysis has been performed to identify the mostsignificant parameters. The effect of the variance of theparameters on results has been measured by a global sensitivityindex.
2. MATERIALS AND METHODS
2.1. The Experimental Setup and Laboratory Tests
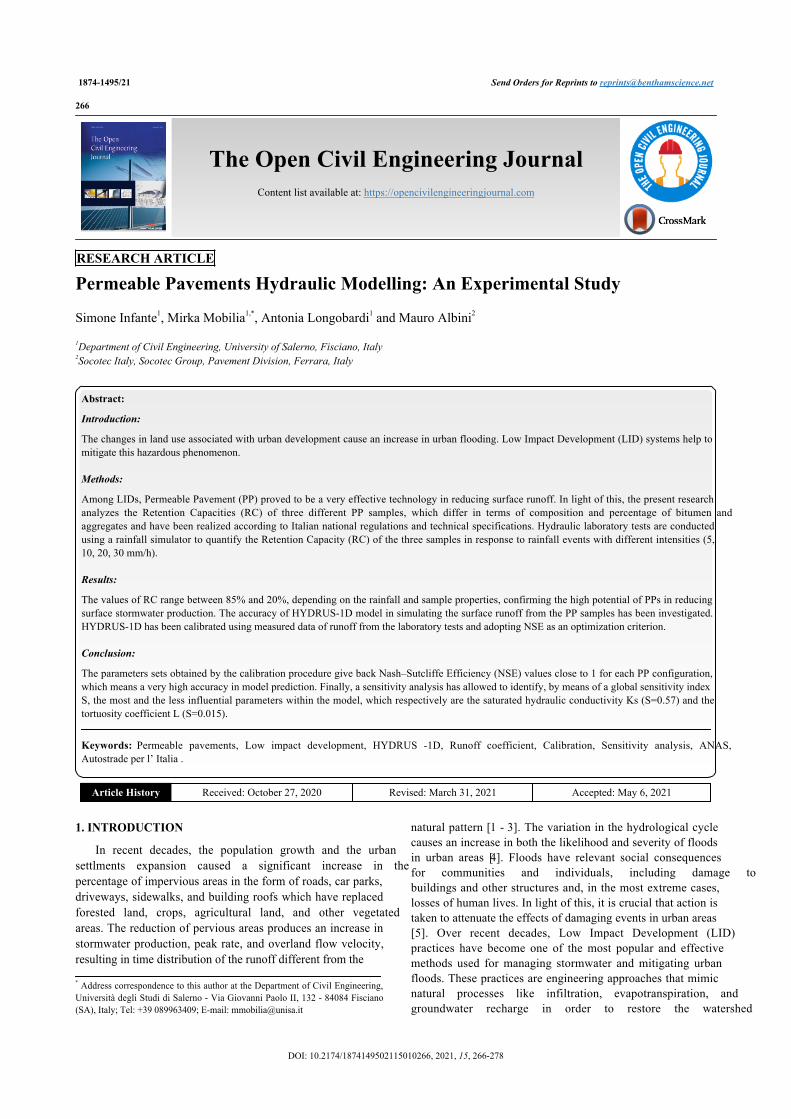
Three PP samples (A, B, C) (Fig. 1) have been used withina test programme framwork with the goal of evaluating theirrunoff response to different rainfall events and verifying thesuitability of HYDRUS-1D to accurately reproduce the
hydrological behavior.
Fig. (1). The three PP samples.
The three work samples have been produced and tested atthe Asphalt concrete laboratory of SOCOTEC Italia S.r.l., inFerrara. They have been realized according to the technicalspecifications of “ANAS” (National Autonomous RoadsCorporation) and “Autostrade per l’Italia” (leading Italianconcessionaire for toll motorway, management and for relatedtransport services). The cylindrical samples with a thickness of6 cm and a diameter of 10 cm, are made up of a mixture ofbinder and aggregates including sand, basalt, porphyry andfiller. The three samples differ in the percentage of the usedconstituents (Table 1).
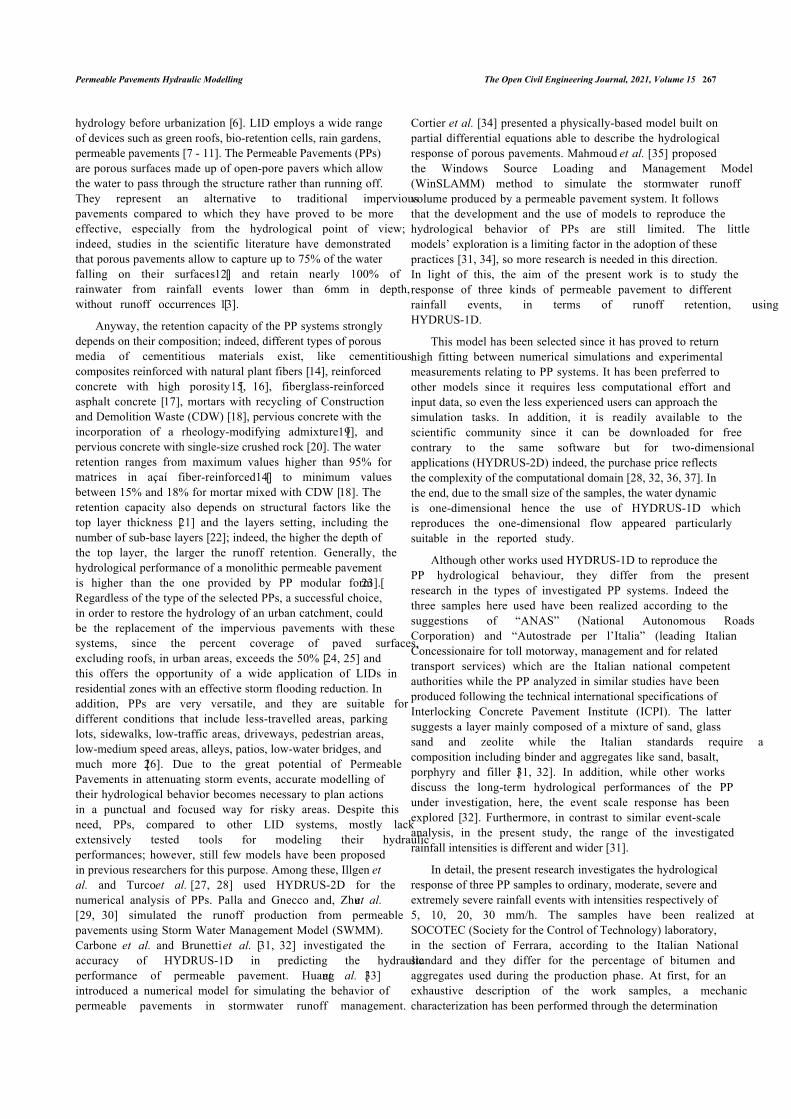
The particle size distribution of the used sediments, foreach sample, is shown in Fig. (2)
Table 1. Percentage of aggregates and bitumen for each sample. Please note that for each aggregate the indication of d/D isgiven where d and D are respectively the minimum and maximum aggregate sizes (mm)
Samples Filler Sand 0/5 Basalt 4/8 Basalt 10/16 Porphyry 10/16 BitumenA 6,0% 5,0% 18,0% 12,0% 59,0% 5,4%B 6,0% 0,0% 22,0% 22,0% 50,0% 5,4%C 8,0% 21,0% 13,0% 30,0% 28,0% 5,1%
Fig. (2). Particle size distribution.
0%
20%
40%
60%
80%
100%
0.01 0.1 1 10 100
Sample A
Particle size (mm)
% P
assi
ng
0%
20%
40%
60%
80%
100%
0.01 0.1 1 10 100
Sample B
Particle size(mm)
% P
assi
ng
0%
20%
40%
60%
80%
100%
0.01 0.1 1 10 100
Sample C
Particle size (mm)
% P
assi
ng
Permeable Pavements Hydraulic Modelling The Open Civil Engineering Journal, 2021, Volume 15 269
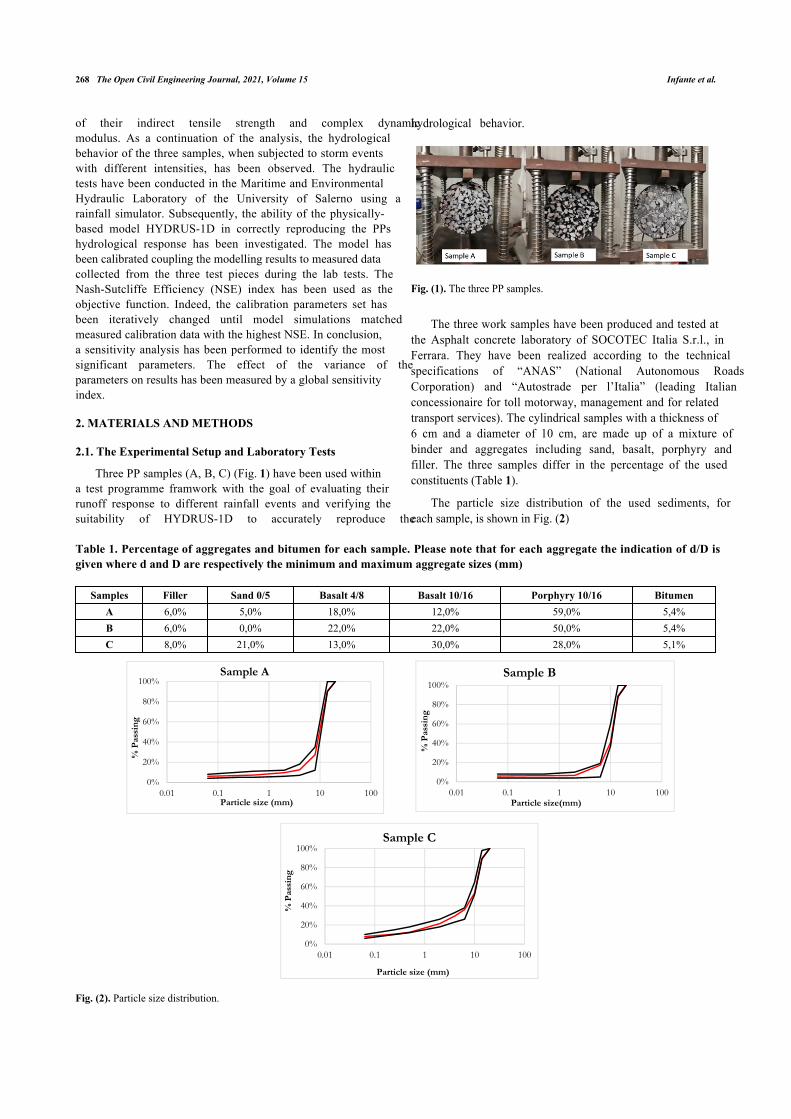
The binder consists of a 50/70 bitumen modified with 5%of SBS (styrene-butadiene-styrene) polymers. It has beensubjected to basic characterization tests for the determinationof penetration at 25°C (according to standards UNI EN 1426),softening point (UNI EN 1427), fraass breaking point (UNI EN12593), elastic recovery at 25°C (UNI EN 13398) and dynamicviscosity at 160°C (UNI EN 13702-2). Results are reported inTable 2.
Table 2. The characterization tests for the used bitumen.
Characteristics Standards Value Unit ofmeasure
Range ofvalues
Penetration at 25 °C UNI EN 1426 60 dmm 50-70Softening point UNI EN 1427 71,5 °C ≥ 70
Fraass breaking point UNI EN 12593 -15 °C ≤ -12Elastic recovery at
25°C UNI EN 13398 89 % ≥ 80
Dynamic viscosity at160 °C
UNI EN13702-2
0,38 Pa x s ≥ 15 - ≤40
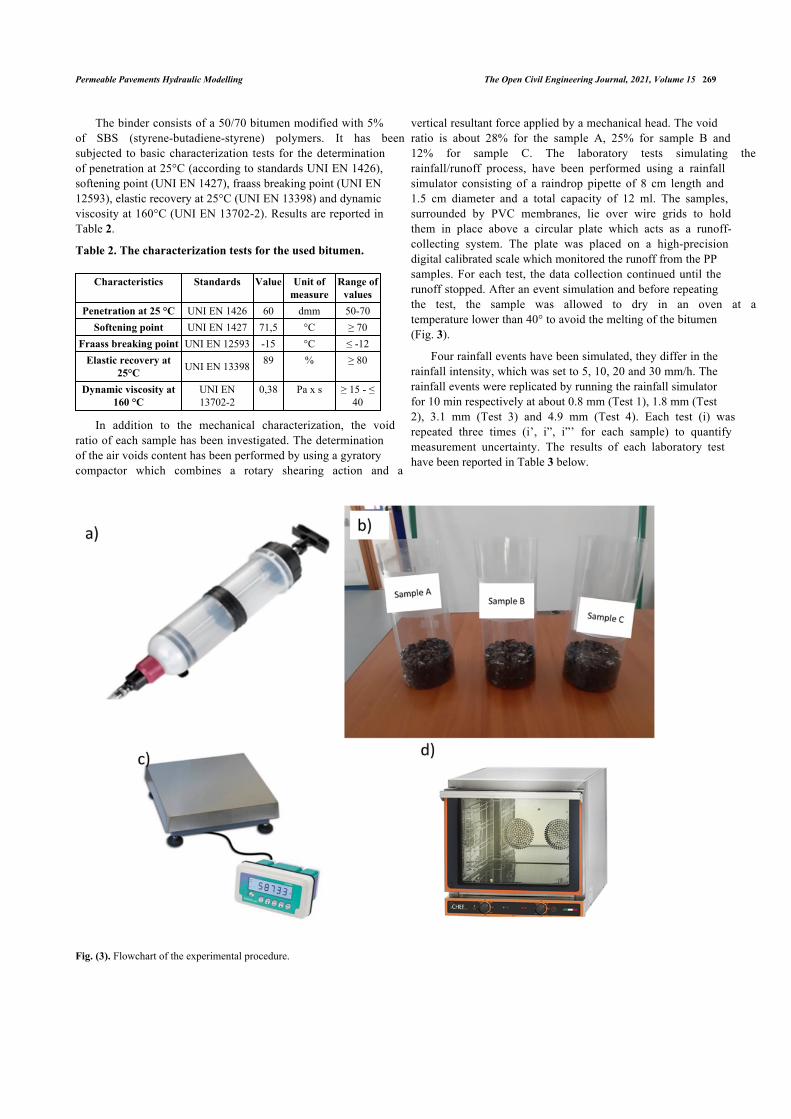
In addition to the mechanical characterization, the voidratio of each sample has been investigated. The determinationof the air voids content has been performed by using a gyratorycompactor which combines a rotary shearing action and a
vertical resultant force applied by a mechanical head. The voidratio is about 28% for the sample A, 25% for sample B and12% for sample C. The laboratory tests simulating therainfall/runoff process, have been performed using a rainfallsimulator consisting of a raindrop pipette of 8 cm length and1.5 cm diameter and a total capacity of 12 ml. The samples,surrounded by PVC membranes, lie over wire grids to holdthem in place above a circular plate which acts as a runoff-collecting system. The plate was placed on a high-precisiondigital calibrated scale which monitored the runoff from the PPsamples. For each test, the data collection continued until therunoff stopped. After an event simulation and before repeatingthe test, the sample was allowed to dry in an oven at atemperature lower than 40° to avoid the melting of the bitumen(Fig. 3).
Four rainfall events have been simulated, they differ in therainfall intensity, which was set to 5, 10, 20 and 30 mm/h. Therainfall events were replicated by running the rainfall simulatorfor 10 min respectively at about 0.8 mm (Test 1), 1.8 mm (Test2), 3.1 mm (Test 3) and 4.9 mm (Test 4). Each test (i) wasrepeated three times (i’, i”, i”’ for each sample) to quantifymeasurement uncertainty. The results of each laboratory testhave been reported in Table 3 below.
Fig. (3). Flowchart of the experimental procedure.
270 The Open Civil Engineering Journal, 2021, Volume 15 Infante et al.
Table 3. The laboratory tests.
Samples ID Test Rainfall Intensity (mm/h) Duration (min) Rainfall Volume (mm) Runoff Volume (mm)
A
1'5
10
0.80.1
1” 0.11”' 0.12'
10 1.80.8
2” 0.82”' 0.83'
20 3.12.2
3” 1.73”' 1.94'
30 4.93.4
4” 3.24”' 3.2
B
1'5 0.8
0.11” 0.11”' 0.12'
10 1.80.8
2” 0.82”' 0.83'
20 3.12.2
3” 1.73”' 1.84'
30 4.93.4
4” 3.24”' 3.2
C
1'5 0.8
0.21” 0.31”' 0.12'
10 1.81.0
2” 1.02”' 0.83'
20 3.12.4
3” 2.03”' 2.24'
30 4.93.7
4” 3.84”' 3.8
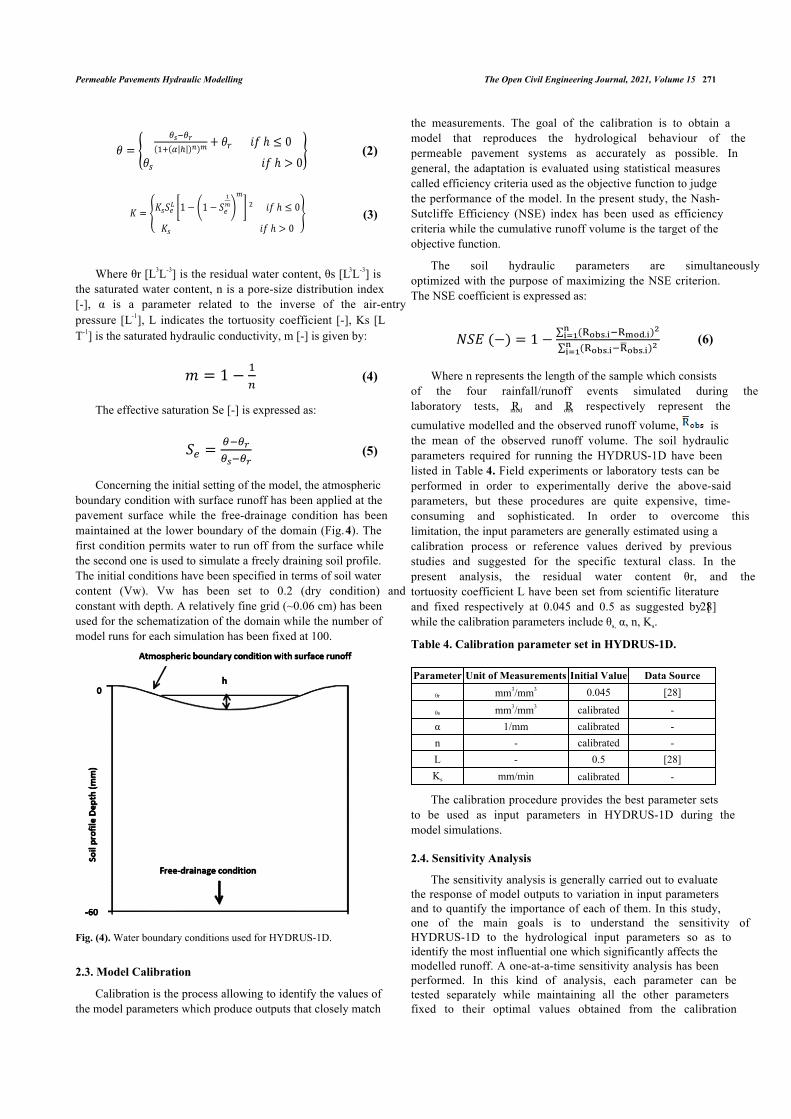
2.2. HYDRUS-1D and Initial Setting
HYDRUS-1D [38] model has been used in the presentwork to model the runoff from the considered permeablepavement systems. HYDRUS-1D is a commercial soil physicsmodel for simulating water movement and solute/heat transportin one-dimensional variably saturated media. Its applicationhas provided good results to several types of porous media[32]. Indeed, it has been effectively used in recent studies forthe description of the hydraulic behaviour of some LIDsystems such as green roofs and permeable pavements [31, 32,39]. The program can be used to reproduce the flow andtransport occurring in the vertical, horizontal or slopeddirection. HYDRUS-1D is equipped with an interactivegraphics-based interface for data-preprocessing/generation anda structured finite element grid system. In addition, thesimulation output can be displayed graphically. That is why the
model appears very easy and intuitive and immediatelyintelligible to the users. HYDRUS-1D uses the one-dimensional Richards equation, in the following form, todescribe the unsaturated water flow within the media:
(1)
Where θ is the volumetric water content [L3L-3], h is thesoil water pressure head [L], K(h) is the unsaturated hydraulicconductivity [LT-1], t is time [T], and z is the soil depth [L].
The soil hydraulic properties are described by the vanGenuchten-Mualem relation [40]:
𝜕𝜃
𝜕𝑧=
𝜕
𝜕𝑧[𝐾(ℎ) (
𝜕ℎ
𝜕𝑧+ 1)]
Permeable Pavements Hydraulic Modelling The Open Civil Engineering Journal, 2021, Volume 15 271
(2)
(3)
Where θr [L3L-3] is the residual water content, θs [L3L-3] isthe saturated water content, n is a pore-size distribution index[-], α is a parameter related to the inverse of the air-entrypressure [L-1], L indicates the tortuosity coefficient [-], Ks [LT-1] is the saturated hydraulic conductivity, m [-] is given by:
(4)
The effective saturation Se [-] is expressed as:
(5)
Concerning the initial setting of the model, the atmosphericboundary condition with surface runoff has been applied at thepavement surface while the free-drainage condition has beenmaintained at the lower boundary of the domain (Fig. 4). Thefirst condition permits water to run off from the surface whilethe second one is used to simulate a freely draining soil profile.The initial conditions have been specified in terms of soil watercontent (Vw). Vw has been set to 0.2 (dry condition) andconstant with depth. A relatively fine grid (~0.06 cm) has beenused for the schematization of the domain while the number ofmodel runs for each simulation has been fixed at 100.
Fig. (4). Water boundary conditions used for HYDRUS-1D.
2.3. Model Calibration
Calibration is the process allowing to identify the values ofthe model parameters which produce outputs that closely match
the measurements. The goal of the calibration is to obtain amodel that reproduces the hydrological behaviour of thepermeable pavement systems as accurately as possible. Ingeneral, the adaptation is evaluated using statistical measurescalled efficiency criteria used as the objective function to judgethe performance of the model. In the present study, the Nash-Sutcliffe Efficiency (NSE) index has been used as efficiencycriteria while the cumulative runoff volume is the target of theobjective function.
The soil hydraulic parameters are simultaneouslyoptimized with the purpose of maximizing the NSE criterion.The NSE coefficient is expressed as:
(6)
Where n represents the length of the sample which consistsof the four rainfall/runoff events simulated during thelaboratory tests, Rmod and Robs respectively represent thecumulative modelled and the observed runoff volume, isthe mean of the observed runoff volume. The soil hydraulicparameters required for running the HYDRUS-1D have beenlisted in Table 4. Field experiments or laboratory tests can beperformed in order to experimentally derive the above-saidparameters, but these procedures are quite expensive, time-consuming and sophisticated. In order to overcome thislimitation, the input parameters are generally estimated using acalibration process or reference values derived by previousstudies and suggested for the specific textural class. In thepresent analysis, the residual water content θr, and thetortuosity coefficient L have been set from scientific literatureand fixed respectively at 0.045 and 0.5 as suggested by [28]while the calibration parameters include θs, α, n, Ks.
Table 4. Calibration parameter set in HYDRUS-1D.
Parameter Unit of Measurements Initial Value Data Source
θr mm3/mm3 0.045 [28]
θs mm3/mm3 calibrated -α 1/mm calibrated -n - calibrated -L - 0.5 [28]Ks mm/min calibrated -
The calibration procedure provides the best parameter setsto be used as input parameters in HYDRUS-1D during themodel simulations.
2.4. Sensitivity Analysis
The sensitivity analysis is generally carried out to evaluatethe response of model outputs to variation in input parametersand to quantify the importance of each of them. In this study,one of the main goals is to understand the sensitivity ofHYDRUS-1D to the hydrological input parameters so as toidentify the most influential one which significantly affects themodelled runoff. A one-at-a-time sensitivity analysis has beenperformed. In this kind of analysis, each parameter can betested separately while maintaining all the other parametersfixed to their optimal values obtained from the calibration
𝜃 = {
𝜃𝑠−𝜃𝑟
(1+(𝛼|ℎ|)𝑛)𝑚+ 𝜃𝑟 𝑖𝑓 ℎ ≤ 0
𝜃𝑠 𝑖𝑓 ℎ > 0}
𝐾 = {𝐾𝑠𝑆𝑒
𝐿 [1 − (1 − 𝑆𝑒
1
𝑚)
𝑚
] 2 𝑖𝑓 ℎ ≤ 0
𝐾𝑠 𝑖𝑓 ℎ > 0
}
𝑚 = 1 −1
𝑛
𝑆𝑒 =𝜃−𝜃𝑟
𝜃𝑠−𝜃𝑟
𝑁𝑆𝐸 (−) = 1 −∑ (Robs.i
ni=1 −Rmod.i)2
∑ (Robs.ini=1 −R̅obs.i)2

272 The Open Civil Engineering Journal, 2021, Volume 15 Infante et al.
procedure, so the effect of the single parameter variations canbe isolated and identified. The key characteristics of thesensitivity analysis are the selected range of variation for eachparameter and the number nj of tested values that segment thevariation interval. The extremes of the range of change havebeen identified according to two criteria. The lower boundarycorresponds to the value of the selected parameter which wasentered as input within the model, returns no runoff whensimulating the event with 5 mm/h intensity. The upperboundary is the value of the considered parameter immediatelypreceding the one which gives back a non-convergent modelsolution for the event with the lowest intensity. The number ofnj has been established according to the width of the variationinterval so that the effect of every value assumed by the testedparameter could be explored (Table 5).
Table 5. Range of variation and the number of tested valuenj.
SamplesID Parameter Minimum Input
ValueMaximum Input
Value nj
A, B
θr 0.0001 0.15 6θs 0.25 0.5 6α 0.05 1 20n 1.5 10 18L 0.1 1 10Ks 0.001 0.8 11
C
θr 0.0001 0.15 6θs 0.25 0.5 6α 0.02 2 19n 1.5 13 21L 0.1 1 10Ks 0.0001 0.6 11
The effects of the physical soil parameters on the modeloutcomes have been evaluated by their impacts on the value ofthe global sensitivity index suggested by Saraiva et al. [41] andexpressed by:
(7)
Where n is the total number of the observed rainfall/runoffevents that, in this case, are the four events with rainfallintensities of 5, 10, 20, 30 mm/h. Si is the local sensitivityindex of the model concerning the single event [42] calculatedas:
(8)
In the previous equation, i represents the index of the eventor test (Table 3), Dmax and Dmin are the maximum and minimumvalues of the output runoff resulting from the change of theconsidered parameter within the range of variation for thespecific event. The total sensitivity index has been selected toestimate the total effect of the input factors because it gives aclear interpretation and a quantitative measure of the relativedeviation of the model output distribution.
3. RESULTS AND DISCUSSION
The tests conducted on the three samples allow definingfor each configuration and rainfall intensity, the capacity of thePP systems in retaining stormwater. Retention capacity (RCTest)is calculated for each test as:
(9)
Where RTEST is the runoff (mm) produced during the testand P is the total volume of the rainfall input (mm).
Each event simulation has been reproduced three times, sothree values of the retention capacity have been calculated butdue to their high degree of consistency, only the mean value(RC) has been considered. The mean value is given as:
(10)
Where n is the number of the tests set at 3 (Table 3).
Confidence boundaries at α= 5% have also been assessed.The RC curves derived from the performed analysis for thedifferent combinations of events and PP surfaces are shown inthe figure below (Fig. 5). The results show that the capacity inrunoff retention decreases with increasing intensities of therainfall events. Rainfall events up to 2 mm/h have been totallyretained by all the samples (RC = 100%). Events with lowintensity (5 mm/h) reach values of RC up to 85%, while thepercentage of stored rainwater never falls below 20% even forthe storms with higher intensities. The curves can be describedby an exponential function where RC decreases very rapidlyfor high intensities, then gradually approaches a plateau whichmeans no significant decrease in runoff retention for eventswith rainfall intensities higher than 20 mm/h. Indeed, movingfrom events with the intensity of 5 mm/h to 10 mm/h, RCdecreases drastically by about 30%. For higher intensities, ithas not been found large variability in the hydrologicalperformances, indeed, RC ranges between 40% and 20%.
These findings have been confirmed by Carbone et al. [31]where it was found out that moving from a rainfall event withan intensity of 12 mm/h to a rainfall event with an intensity of36 mm/h, the volume reduction decreases from 68% to 60%.The best performing porous pavement in terms of retention isthe type A while the less effective one is the type C. Thedifference in their hydrological behaviour at most reaches 30%.The samples A and B respond similarly to the rainfall inputs,indeed, the corresponding performances, at most, differ ofabout 4%.
These findings are closely correlated with the values of thevoid ratio indeed, the samples A and B exhibit similar values ofthis index, respectively of 28% and 25%, which results in quitecomparable RC. The sample C has a lower void ratio (about12%) impacting its retention performances which areinevitably worse. All seems to confirm the literature outcomes[43, 44] according to which the change in the void ratioinfluences the Soil Water Content (SWC) and, specifically, thehigher the void ratio, the higher the SWC.
S =∑ Si
ni=1
n
Si =Dmax−Dmin
Dmax
𝑅𝐶𝑇𝑒𝑠𝑡 = (1 −𝑅𝑇𝐸𝑆𝑇
𝑃) · 100
𝑅𝐶 = ∑ 𝑅𝐶𝑇𝑒𝑠𝑡
3𝑇𝑒𝑠𝑡=1
𝑛

Permeable Pavements Hydraulic Modelling The Open Civil Engineering Journal, 2021, Volume 15 273
Fig. (5). Retention capacity for different rainfall intensities and PP systems (a) and prediction intervals at 5% confidence level for each sample (b).
The Hydrus calibration allowed to adjust the inputparameters value until reaching the highest possible NSE. Inthis way, the best set of hydrological parameters for thespecific PP system has been obtained. The optimal calibrationparameters set has been reported in Table 6. The values foundduring the procedure correspond to very high NSE which arerespectively of about 0.9 for samples A and B and about 1 forsamples C. This result suggests that the model is very accuratein predicting the hydrological behaviour of the three samplesand especially of the sample C, therefore, it could beeffectively used in subsequent simulations. The type A-pavement exhibits a response very similar to the type B-pavement, indeed, the values of the calibration parameters arethe same. The ability of this model in reproducing thehydrological performance of a PP system has been proved byother studies which tested different types of PP systems [32]and reported NSE values higher than 80%.
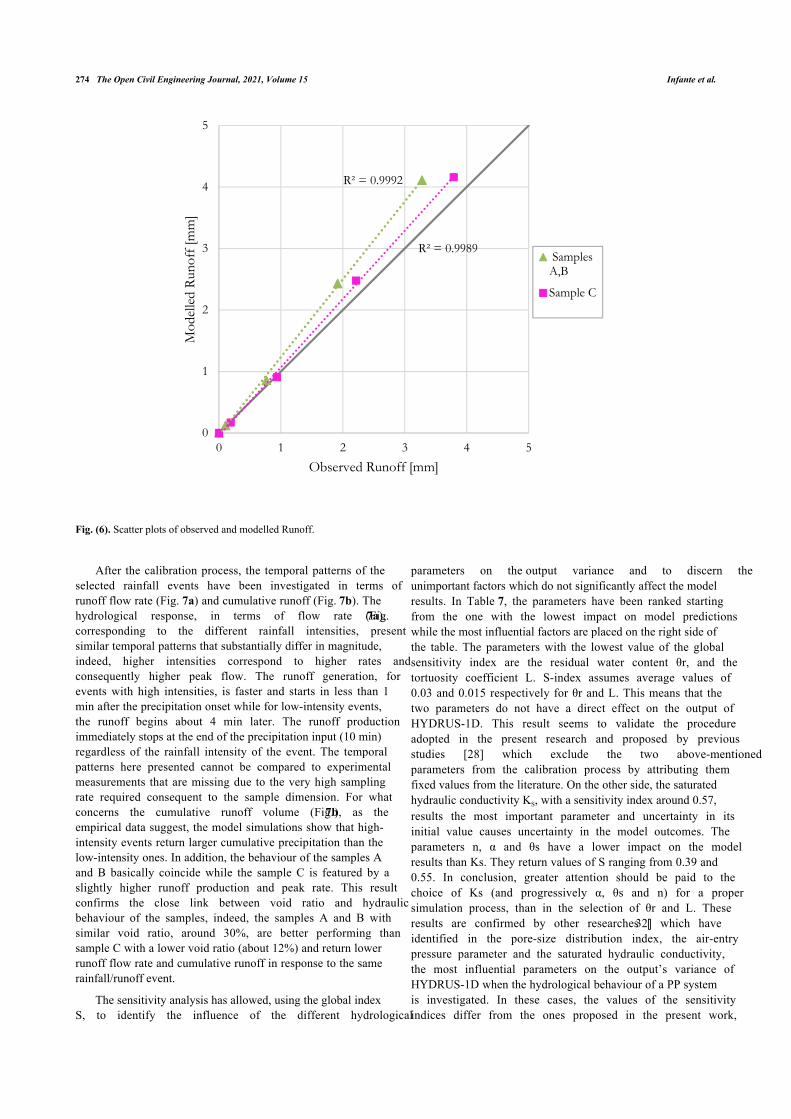
The scatter plot in Fig. (6) confirms that, as a result of the
calibration procedure, the observed cumulative runoff valuesclosely match the modelled ones, the fitting is higher for theSamples A and B with a correlation coefficient of 0.9992 andslightly lower for the sample C with R2=0.9989. Anyway, thesimulations results will benefit from a very good modelefficiency.
Table 6. Best parameters set and the corresponding NSEvalues.
ParameterSample A
(NSE=0.874)Sample B
(NSE=0.866)Sample C
(NSE=0.980)
θr [mm3/mm3] 0.045 0.045
θs [mm3/mm3] 0.3 0.3α [1/mm] 0.2 0.07
n [-] 3 2.5L [-] 0.5 0.5
Ks [mm/min] 0.5 0.3
0
10
20
30
40
50
60
70
80
90
100
0 30
RC
[%]
10 20Rainfall intensity [mm/h]
RC curvesSample A Sample B Sample C
b)
020406080
100
0 0210 30
RC
[%
]
Rainfall intensity [mm/h]
Confidence interval- Sample ALower Upper
020406080
100
0 10 02 30
RC
[%
]Rainfall intensity [mm/h]
Confidence interval-Sample BLower Upper
020406080
100
0 20
RC
[%
]
Rainfall intensity [mm/h]
Confidence interval- Sample C
Lower Upper
a)
274 The Open Civil Engineering Journal, 2021, Volume 15 Infante et al.
Fig. (6). Scatter plots of observed and modelled Runoff.
After the calibration process, the temporal patterns of theselected rainfall events have been investigated in terms ofrunoff flow rate (Fig. 7a) and cumulative runoff (Fig. 7b). Thehydrological response, in terms of flow rate (Fig. 7a),corresponding to the different rainfall intensities, presentsimilar temporal patterns that substantially differ in magnitude,indeed, higher intensities correspond to higher rates andconsequently higher peak flow. The runoff generation, forevents with high intensities, is faster and starts in less than 1min after the precipitation onset while for low-intensity events,the runoff begins about 4 min later. The runoff productionimmediately stops at the end of the precipitation input (10 min)regardless of the rainfall intensity of the event. The temporalpatterns here presented cannot be compared to experimentalmeasurements that are missing due to the very high samplingrate required consequent to the sample dimension. For whatconcerns the cumulative runoff volume (Fig. 7b), as theempirical data suggest, the model simulations show that high-intensity events return larger cumulative precipitation than thelow-intensity ones. In addition, the behaviour of the samples Aand B basically coincide while the sample C is featured by aslightly higher runoff production and peak rate. This resultconfirms the close link between void ratio and hydraulicbehaviour of the samples, indeed, the samples A and B withsimilar void ratio, around 30%, are better performing thansample C with a lower void ratio (about 12%) and return lowerrunoff flow rate and cumulative runoff in response to the samerainfall/runoff event.
The sensitivity analysis has allowed, using the global indexS, to identify the influence of the different hydrological
parameters on the output variance and to discern theunimportant factors which do not significantly affect the modelresults. In Table 7, the parameters have been ranked startingfrom the one with the lowest impact on model predictionswhile the most influential factors are placed on the right side ofthe table. The parameters with the lowest value of the globalsensitivity index are the residual water content θr, and thetortuosity coefficient L. S-index assumes average values of0.03 and 0.015 respectively for θr and L. This means that thetwo parameters do not have a direct effect on the output ofHYDRUS-1D. This result seems to validate the procedureadopted in the present research and proposed by previousstudies [28] which exclude the two above-mentionedparameters from the calibration process by attributing themfixed values from the literature. On the other side, the saturatedhydraulic conductivity KS, with a sensitivity index around 0.57,results the most important parameter and uncertainty in itsinitial value causes uncertainty in the model outcomes. Theparameters n, α and θs have a lower impact on the modelresults than Ks. They return values of S ranging from 0.39 and0.55. In conclusion, greater attention should be paid to thechoice of Ks (and progressively α, θs and n) for a propersimulation process, than in the selection of θr and L. Theseresults are confirmed by other researches [32] which haveidentified in the pore-size distribution index, the air-entrypressure parameter and the saturated hydraulic conductivity,the most influential parameters on the output’s variance ofHYDRUS-1D when the hydrological behaviour of a PP systemis investigated. In these cases, the values of the sensitivityindices differ from the ones proposed in the present work,
R² = 0.9992
R² = 0.9989
0
1
2
3
4
5
0 1 4 5
Mod
elle
d R
unof
f [m
m]
2 3
Observed Runoff [mm]
SamplesA,B
Sample C

Permeable Pavements Hydraulic Modelling The Open Civil Engineering Journal, 2021, Volume 15 275
indeed they reach maximum values of about 0.30 against 0.57of this research, but the order of magnitude is comparable.
Concerning the local sensitivity index Si, it appears tostrongly depend on the value of the rainfall intensity of theselected events indeed, the lower the rainfall intensity, thehigher the parameter influence on the outcomes of HYDRUS1D. This implies that the model results are more sensitive tochanges in the hydrological parameters for rainfall events with
5 mm/h intensity than for more severe storms (i.e. 30 mm/h),so, the selection of appropriate input values is of higherimportance in the reproduction of moderate events. Anyway,also at the local scale, Ks is confirmed to be the most impactfulparameter while θr and L are the fewest ones.
For illustrative purpose, the sensitivity graphs for the mostand less influent parameters for the sample A have been shownin Fig. (8).
Fig. (7). Hydrological behavior of the three samples in terms of a) runoff flow rate b) runoff cumulative volume.
Table 7. Sensitivity indices of the hydrological parameters.
Samples A-Bi-test Rainfall Intensity [mm/h] Si,θr Si,l Si,n Si,θs Si,� Si,Ks
1 5 0.08 0.09 0.94 0.97 0.93 0.992 10 0.01 0.02 0.38 0.45 0.60 0.673 20 0.00 0.01 0.16 0.19 0.27 0.354 30 0.00 0.00 0.10 0.11 0.17 0.23- S 0.02 0.03 0.39 0.43 0.49 0.56
Sample Ci-test Rainfall Intensity [mm/h] Si,θr Si,l Si,n Si,θs Si,� Si,Ks
1 5 0.03 0.08 0.98 0.99 0.98 0.992 10 0.01 0.02 0.48 0.54 0.67 0.693 20 0.01 0.01 0.21 0.25 0.33 0.374 30 0.00 0.00 0.13 0.15 0.21 0.24- S 0.01 0.03 0.45 0.48 0.55 0.57
0
5
10
15
20
25
30
0000 2 10 12
Flow
[mm
/h]
Time [min]
5 mm/h (Prot. A,B)
10 mm/h (Prot. A,B)
20 mm/h (Prot. A,B)
30 mm/h (Prot. A,B)
5 mm/h (Prot. C)
10 mm/h (Prot. C)
20 mm/h (Prot. C)
30 mm/h (Prot. C)
a)
0.0
0.5
1.0
1.5
2.0
2.5
3.0
3.5
4.0
4.5
0000 2 10 12
Cum
ulat
ive
Run
off
[mm
]
Time [min]
5 mm/h (Prot. A,B)
10 mm/h (Prot. A,B)
20 mm/h (Prot. A,B)
30 mm/h (Prot. A,B)
5 mm/h (Prot. C)
10 mm/h (Prot. C)
20 mm/h (Prot. C)
30 mm/h (Prot. C)
b)

276 The Open Civil Engineering Journal, 2021, Volume 15 Infante et al.
Fig. (8). Sensitivity graphs for the sample A related to a) the residual water content θr and to b) the saturated hydraulic conductivity Ks.
Fig. (8) highlights that for the different rainfall intensities,the variation in the value of θr doesn’t affect the runoffproduction which remains stable. On the other side, whenincreasing Ks, the surface outflow consequently decreases. Itfollows that Ks strongly impacts model results while θr is non-influential within the simulation process.
CONCLUSION
The novelty of the present work lies in the quantitativeassessment of the hydrological behaviour of three PP systemswith reference to the rainfall characteristics defining how theresponse varies depending on the specific mechanical featuresand composition of the samples. The samples used in thepresent study which differ in terms of the used percentage ofaggregates and bitumen, have been selected becauserecommended by the Italian national competent authorities, andthey have never been tested to this aim indeed, previous studiesinvestigated the behaviour of PPs realized according tointernational standards which require different composition of
the porous systems. In details, the hydrological behaviour ofthe three PP samples to ordinary, moderate, severe andextremely severe rainfall events has been explored. The threesamples (A, B, C) have been produced in the laboratoryaccording to the technical specifications used by industries toensure compliance with the legislative safety requirements andthey differ in terms of composition (percentage of bitumen andaggregates) and, consequently, in the values of void ratiowhich necessary affects the hydrological properties andbehaviours of the samples. After a mechanic characterizationof the samples, attention has been focused on their hydrologicalresponse, in terms of runoff production, to rainfall events withintensities of 5, 10, 20, 30 mm/h and duration of 10 min,reproduced in a laboratory using a rainfall simulator.Subsequently, the physically-based model HYDRYS-1D hasbeen calibrated using the experimental data collected duringthe laboratory tests. The optimal calibration parameter set hasbeen found by iteratively optimizing the differences betweenobserved and modelled data until getting the highest NSE. A
0
1
2
3
4
5
6
0.00 0.05 0.10 0.15 0.20
Mod
elle
d R
unof
f [m
m]
qr [-]
5 mm/h 10 mm/h 20 mm/h 30 mm/ha)
0
1
2
3
4
5
6
0 0.2 0.4 0.6 0.8 1
Mod
elle
d R
unof
f [m
m]
Ks [mm/min]
5 mm/h 10 mm/h 20 mm/h 30 mm/hb)
Permeable Pavements Hydraulic Modelling The Open Civil Engineering Journal, 2021, Volume 15 277
sensitivity analysis of HYDRUS-1D has been performed inorder to investigate the model response to variation in thevalues of input variables. A One-factor at a time sensitivityanalysis, so called as each factor is perturbed in turn, hasallowed to identify the most influential parameters.
The results of the analysis show that the RC of the PPsamples ranges between 85% and 20% with higher values forlow-intensity events and lower percentages for more severeevents. The samples A and B exhibits similar behaviour whilesample C is less performing. This result is consistent with thevalues of the void ratio that are 28% (sample A), 25% (sampleB) and 12% (sample C) indeed, a low void ratio hasrepercussions on the retention capacity of the samples implyinga reduction of this variable. The calibration procedure returns aset of input parameters corresponding to very high NSE valuesclose to 1, which means a large model accuracy. It follows thatHYDRUS-1D can be effectively used to reproduce thehydrological response of PPs during rainfall events withdifferent intensities. The sensitivity analysis has allowedidentifying the less influential parameters on the model results.The residual water content θr, and the tortuosity coefficient Lwith a global sensitivity index S respectively of 0.03 and 0.015have proved to little impact the model outcomes while the mostimportant parameter is the saturated hydraulic conductivity Ks(S=0.57) followed by α (S=0.52), θs (S=0.46) and n (S=0.42).The local sensitivity index is highly dependent on the rainfallintensity of the events indeed, the higher the intensity, thelower the impact of the parameter on the model simulationresults. In conclusion, the high retention coefficients detectedduring the lab experiments, confirm that the PPs are aneffective tool to reduce surface runoff so as to deal with theincreasing challenge of urban flooding. In addition, thehydrological response of this kind of LID practices can beaccurately reproduced by commercial software asHYDRUS-1D. The opportunity of a correct simulation pavesthe way for a successful analysis of the proposed technology atlarger spatial and temporal scales.
CONSENT FOR PUBLICATION
Not applicable.
AVAILABILITY OF DATA AND MATERIALS
Not applicable.
FUNDING
None.
CONFLICT OF INTEREST
The authors declare no conflict of interest, financial orotherwise.
ACKNOWLEDGEMENTS
Authors will to thank SOCOTEC Italia Pavement DivisionLaboratory for providing materials and equipments necessaryto the mechanical and hydraulic characterization of thepermeable pavements samples used in the reported study.
REFERENCES
F. Califano, M. Mobilia, and A. Longobardi, "Heavy rainfall temporal[1]characterization in the peri-urban solofrana river basin. Southernitaly", Procedia Eng., vol. 119, pp. 1129-1138, 2015.[http://dx.doi.org/10.1016/j.proeng.2015.08.957]M. Mobilia, F. Califano, and A. Longobardi, "Analysis of rainfall[2]events driving MDHEs occurred in the solofrana river basin. Southernitaly", Procedia Eng., vol. 119, pp. 1139-1146, 2015.[http://dx.doi.org/10.1016/j.proeng.2015.08.960]A. Longobardi, N. Diodato, and M. Mobilia, "Historical storminess[3]and hydro-geological hazard temporal evolution in the solofrana riverbasin—Southern Italy", Water, vol. 8, no. 9, p. 398, 2016.[http://dx.doi.org/10.3390/w8090398]S.D. Brody, W.E. Highfield, and R. Blessing, "An analysis of the[4]effects of land use and land cover on flood losses along the gulf ofMexico coast from 1999 to 2009", J. Am. Water Resour. Assoc., vol.51, no. 6, pp. 1556-1567, 2015.[http://dx.doi.org/10.1111/1752-1688.12331]L.S. Coffman, and R.L. France, Low-impact development: An[5]alternative stormwater management technology. Handbook of watersensitive planning and design., Lewis Pubblishers: Cambridge, 2002,pp. 97-123.[http://dx.doi.org/10.1201/9781420032420.ch1.5]W.F. Hunt, R.G. Traver, A.P. Davis, C.H. Emerson, K.A. Collins, and[6]J.H. Stagge, Low impact development practices: designing to infiltratein urban environments[http://dx.doi.org/10.1061/9780784410783.ch12]M. Mobilia, and A. Longobardi, "Smart stormwater management in[7]urban areas by roofs greening", LNSC, vol. 10406, pp. 455-463, 2017.[http://dx.doi.org/10.1007/978-3-319-62398-6_32]A. Longobardi, R. D’Ambrosio, and M. Mobilia, "Learning from[8]experimental data the hydrological behaviour of a green roof in atypical Mediterranean environment: climate, substrate soil moistureand drainage layer properties role", Sustainability, vol. 11, no. 24, p.6956, .[http://dx.doi.org/10.3390/su11246956]J. Sartor, M. Mobilia, and A. Longobardi, "Results and findings from[9]15 years of sustainable urban storm water management", Int. J. Saf.Secur. Eng., vol. 8, no. 4, pp. 505-514, 2018.[http://dx.doi.org/10.2495/SAFE-V8-N4-505-514]N. Krasnogorskaya, A. Longobardi, M. Mobilia, L.F. Khasanova, and[10]A.I. Shchelchkova, "Hydrological modeling of green roofs runoff byNash cascade model", Open Civ. Eng. J., vol. 13, no. 1, pp. 163-171,2019.[http://dx.doi.org/10.2174/1874149501913010163]M. Mobilia, R. D’Ambrosio, and A. Longobardi, Climate, soil[11]moisture and drainage layer properties impact on green roofs in aMediterranean environment. Frontiers in Water-Energy-Nexus—Nature-Based Solutions, Advanced Technologies and BestPractices for Environmental Sustainability. Advances in Science,Technology & Innovation (IEREK Interdisciplinary Series forSustainable Development)., Springer: Cham, 2020, pp. 169-171.[http://dx.doi.org/10.1007/978-3-030-13068-8_41]E.Z. Bean, W.F. Hunt, and D.A. Bidelspach, "Evaluation of four[12]permeable pavement sites in eastern north carolina for run offreduction and water quality impacts", J. Irrig. Drain. Eng., vol. 133,no. 6, pp. 583-592, 2007.[http://dx.doi.org/10.1061/(ASCE)0733-9437(2007)133:6(583)]K.A. Collins, W.F. Hunt, and J.M. Hathaway, "Hydrologic comparison[13]of four types of permeable pavement and standard asphalt in easternNorth Carolina", J. Hydrol. Eng., vol. 13, no. 12, pp. 1146-1157, 2008.[http://dx.doi.org/10.1061/(ASCE)1084-0699(2008)13:12(1146)]A.R. de Azevedo, M.T. Marvila, B.A. Tayeh, D. Cecchin, A.C.[14]Pereira, and S.N. Monteiro, "Technological performance of açaínatural fibre reinforced cement-based mortars", J. Build. Eng., vol. 33,no. 101675, 2021.J.F. Sánchez-Pérez, and I. Alhama, "Simultaneous determination of[15]initial porosity and diffusivity of water-saturated reinforced concretesubject to chloride penetration by inverse problem", Constr. Build.Mater., vol. 259, no. 120412, 2020.L. Moretti, P. Di Mascio, and C. Fusco, "Porous concrete for[16]pedestrian pavements", Water, vol. 11, no. 10, p. 2105, 2019.[http://dx.doi.org/10.3390/w11102105]G.P. Piuzzi, H.C. Scheuermann Filho, J.A.V. Del Carpio, and N.C.[17]Consoli, "The effects of porosity, asphalt content and fiberglassincorporation on the tensile strength and resilient modulus of asphalt
278 The Open Civil Engineering Journal, 2021, Volume 15 Infante et al.
concrete blends", Geotext. Geomembr.. In pressA.R.G. Azevedo, D. Cecchin, D.F. Carmo, F.C. Silva, C.M.O.[18]Campos, T.G. Shtrucka, M.T. Marvila, and S.N. Monteiro, "Analysisof the compactness and properties of the hardened state of mortarswith recycling of Construction and Demolition Waste (CDW)", J.Mater. Res. Technol., vol. 9, no. 3, pp. 5942-5952, 2020.[http://dx.doi.org/10.1016/j.jmrt.2020.03.122]F.B.P. da Costa, L.M. Haselbach, and L.C.P. da Silva Filho, "Pervious[19]concrete for desired porosity: Influence of w/c ratio and a rheology-modifying admixture", Constr. Build. Mater., vol. 268, no. 121084,2021.Y. Qin, Y. He, J.E. Hiller, and G. Mei, "A new water-retaining paver[20]block for reducing runoff and cooling pavement", J. Clean. Prod., vol.199, pp. 948-956, 2018.[http://dx.doi.org/10.1016/j.jclepro.2018.07.250]W. Liu, Q. Feng, W. Chen, and R.C. Deo, "Stormwater runoff and[21]pollution retention performances of permeable pavements and theeffects of structural factors", Environ. Sci. Pollut. Res. Int., vol. 27, no.24, pp. 30831-30843, 2020.[http://dx.doi.org/10.1007/s11356-020-09220-2] [PMID: 32474781]U. Kuruppu, A. Rahman, and M.A. Rahman, "Permeable pavement as[22]a stormwater best management practice: a review and discussion",Environ. Earth Sci., vol. 78, no. 10, pp. 1-20, 2019.[http://dx.doi.org/10.1007/s12665-019-8312-2]J. Huang, C. Valeo, J. He, and A. Chu, "Three types of permeable[23]pavements in cold climates: hydraulic and environmentalperformance", J. Environ. Eng., vol. 142, no. 6, 2016.04016025[http://dx.doi.org/10.1061/(ASCE)EE.1943-7870.0001085]H. Furumai, H.K.P.K. Jinadasa, M. Murakami, F. Nakajima, and R.K.[24]Aryal, "Model description of storage and infiltration functions ofinfiltration facilities for urban runoff analysis by a distributed model",Water Sci. Technol., vol. 52, no. 5, pp. 53-60, 2005.[http://dx.doi.org/10.2166/wst.2005.0108] [PMID: 16248180]W. Liu, W. Chen, and C. Peng, "Assessing the effectiveness of green[25]infrastructures on urban flooding reduction: A community scalestudy", Ecol. Modell., vol. 291, pp. 6-14, 2014.[http://dx.doi.org/10.1016/j.ecolmodel.2014.07.012]P.D. Tennis, M.L. Leming, and D.J. Akers, Pervious concrete[26]pavements., Portland Cement Association: Skokie, 2004.M. Illgen, K. Harting, T.G. Schmitt, and A. Welker, "Runoff and[27]infiltration characteristics of pavement structures--review of anextensive monitoring program", Water Sci. Technol., vol. 56, no. 10,pp. 133-140, 2007.[http://dx.doi.org/10.2166/wst.2007.750] [PMID: 18048986]M. Turco, R. Kodešová, G. Brunetti, A. Nikodem, M. Fér, and P. Piro,[28]"Unsaturated hydraulic behaviour of a permeable pavement:Laboratory investigation and numerical analysis by using theHYDRUS-2D model", J. Hydrol. (Amst.), vol. 554, pp. 780-791, 2017.[http://dx.doi.org/10.1016/j.jhydrol.2017.10.005]A. Palla, and I. Gnecco, "Hydrologic modeling of Low Impact[29]Development systems at the urban catchment scale", J. Hydrol.(Amst.), vol. 528, pp. 361-368, 2015.[http://dx.doi.org/10.1016/j.jhydrol.2015.06.050]H. Zhu, M. Yu, J. Zhu, H. Lu, and R. Cao, "Simulation study on effect[30]of permeable pavement on reducing flood risk of urban runoff", Int. J.Transp. Sci. Technol, vol. 8, no. 4, pp. 373-382, 2019.[http://dx.doi.org/10.1016/j.ijtst.2018.12.001]M. Carbone, G. Brunetti, and P. Piro, “Hydrological performance of a[31]permeable pavement in Mediterranean climate”, in 14th SGEMGeoConference on Water Resources: Forest., Marine and Ocean
Ecosystems, 2014, pp. 17-26.G. Brunetti, J. Šimůnek, and P. Piro, "A comprehensive numerical[32]analysis of the hydraulic behavior of a permeable pavement", J.Hydrol. (Amst.), vol. 540, pp. 1146-1161, 2016.[http://dx.doi.org/10.1016/j.jhydrol.2016.07.030]J. Huang, J. He, C. Valeo, and A. Chu, "Temporal evolution modeling[33]of hydraulic and water quality performance of permeable pavements",J. Hydrol. (Amst.), vol. 533, pp. 15-27, 2016.[http://dx.doi.org/10.1016/j.jhydrol.2015.11.042]O. Cortier, M. Boutouil, and O. Maquaire, "Physical model of[34]hydrological behavior of permeable pavements using flexPDE", J.Hydrol. Eng., vol. 24, no. 10, 2019.04019035[http://dx.doi.org/10.1061/(ASCE)HE.1943-5584.0001833]A. Mahmoud, T. Alam, A. Sanchez, J. Guerrero, T. Oraby, E. Ibrahim,[35]and K.D. Jones, "Stormwater run off quality and quantity frompermeable and traditional pavements in semiarid south texas", J.Environ. Eng., vol. 146, no. 6, 2020.05020001[http://dx.doi.org/10.1061/(ASCE)EE.1943-7870.0001685]M. Mobilia, and A. Longobardi, Event scale modeling of experimental[36]green roofs runoff in a mediterranean environment.Frontiers in Water-Energy-Nexus—Nature-Based Solutions, Advanced Technologies andBest Practices for Environmental Sustainability. Advances in Science,Technology & Innovation (IEREK Interdisciplinary Series forSustainable Development)., Springer: Cham, 2020, pp. 153-156.[http://dx.doi.org/10.1007/978-3-030-13068-8_37]M. Mobilia, and A. Longobardi, "Impact of rainfall properties on the[37]performance of hydrological models for green roofs simulation",Water Sci. Technol., vol. 81, no. 7, pp. 1375-1387, 2020.[http://dx.doi.org/10.2166/wst.2020.210] [PMID: 32616690]J. Šimunek, M.T. Van Genuchten, and M. Šejna, "HYDRUS: Model[38]use, calibration, and validation", Trans. ASABE, vol. 55, no. 4, pp.1263-1274, 2012.[http://dx.doi.org/10.13031/2013.42239]A. Palla, and L.G. Gnecco, "Lanza, “Compared performance of a[39]conceptual and a mechanistic hydrologic models of a green roof",Hydrol. Processes, vol. 26, no. 1, pp. 73-84, 2012.[http://dx.doi.org/10.1002/hyp.8112]M.T. Van Genuchten, "A closed‐form equation for predicting the[40]hydraulic conductivity of unsaturated soils", Soil Sci. Soc. Am. J., vol.44, no. 5, pp. 892-898, 1980.[http://dx.doi.org/10.2136/sssaj1980.03615995004400050002x]J.P. Saraiva, B.S. Lima, V.M. Gomes, P.H. Flores, F.A. Gomes, and[41]A.O. Assis, "Calculation of sensitivity index using one-at-a-timemeasures based on graphical analysis", 2017 18th InternationalScientific Conference on Electric Power Engineering (EPE), 2017pp.1-6[http://dx.doi.org/10.1109/EPE.2017.7967329]F.O. Hoffman, and R.H. Gardner, Evaluation of Uncertainties in[42]Environmental Radiological Assessment Models”, RadiologicalAssessments: a Textbook on Environmental Dose Assessment, J., U.S.Nuclear Regulatory Commission: Washington, 1983.H. Simms, and E.K. Yanful, "Measurement and estimation of pore[43]shrinkage and pore distribution in a clayey till during soil-watercharacteristic curve tests", Can. Geotech. J., vol. 38, pp. 741-754,2001.[http://dx.doi.org/10.1139/t01-014]Y. Zhang, Z. Song, X. Weng, and Y. Xie, "A new soil-water[44]characteristic curve model for unsaturated loess based on wetting-induced pore deformation", Geofluids, vol. 3, pp. 1-14, 2019.[http://dx.doi.org/10.1155/2019/1672418]
© 2021 Infante et al.
This is an open access article distributed under the terms of the Creative Commons Attribution 4.0 International Public License (CC-BY 4.0), a copy of which isavailable at: https://creativecommons.org/licenses/by/4.0/legalcode. This license permits unrestricted use, distribution, and reproduction in any medium, provided theoriginal author and source are credited.