the new orleans youth index - amazon s3 · 2 the new orleans youth index ... pam stevens kate...
TRANSCRIPT

The New Orleans Youth Index — December 2015 —

The New Orleans Youth Index | December 20152
This page intentionally left blank.
DATA C E N T E R R E S E A R C H . O R G 3
PRINCIPAL AUTHOR
Vicki Mack, Senior Research Fellow
DATA ASSEMBLY, EDITORIAL ASSISTANCE, AND LAYOUT
Caroline Heffernan, Elaine Ortiz, Allison Plyer, and Nihal Shrinath
DESIGN
Southpaw Creative
Gabrielle Alicino
Stuart Andreason
Todd Baptiste
Nathan Barrett
Danielle Broussard
Joy Bruce
Deirdre Johnson Burel
Chanda Burks
Elizabeth Burpee
Alvin David
Teresa Falgoust
Samantha Francois
Ernestine S. Gray
Chris Gunther
Douglas Harris
Kyle Hucke
Sam Joel
Nicole Jolly
Karen Marshall
Sara Massey
Flint Mitchell
Colleston Morgan
Echo Olander
Alvertha Penny
Zakenya Perry
Josh Perry
Kris Pottharst
Gail Psilos
Lisa Richardson
Jennifer Roberts
Vincent Rossmeier
Melissa Sawyer
Jamie Schmill
Matthew Shwarzman
Patrick Sims
Pam Stevens
Kate Streva
Kathleen Theall
Taslim Van Hutton
Donna-Marie Winn
Gina Womack
Erika Wright
Jill Zimmerman
ACKNOWLEDGMENTS
The Data Center wishes to thank Baptist Community Ministries, GPOA Foundation, Greater New Orleans Foundation, and Institute
for Mental Hygiene for their support of The New Orleans Youth Index. Additional gratitude goes to blue moon fund, Entergy Corp.,
Foundation for Louisiana, JPMorgan Chase Foundation, Methodist Health Systems Foundation, Patrick F. Taylor Foundation, RosaMary
Foundation, United Way of Southeast Louisiana, Walton Family Foundation, and Zemurray Foundation for their support of the ongoing
work of The Data Center. We are also grateful to Dr. Andre Perry for his expert assistance in disseminating this important youth data.
ADVISORY COMMITTEE
Many people served on the advisory committee for The New Orleans Youth Index, providing valuable advice and comments on the
indicators selected and the report’s findings and implications. For their contributions, we wish to acknowledge:

The New Orleans Youth Index | December 20154
The future of any society depends on its ability to foster the health and well-being of the next
generation. In New Orleans, how successful we are in raising that next generation is a col-
lective concern. In early 2015, The Data Center published a widely cited report that brought
attention to the issue of child poverty in New Orleans. It pointed out that more than 1 in 3
children in New Orleans live in poverty. It also highlighted scientific research that concludes
that child poverty may be the single greatest threat to children’s healthy brain development.1
Subsequently, The New Orleans Index at Ten found that New Orleans’ large-scale, post-Ka-
trina school reform efforts had brought measurable improvements—with the share of
students attending failing schools dramatically reduced as compared to pre-Katrina—but
that graduation rates remain low (below 80 percent), indicating that more needs to be done
to improve youth outcomes.2
This was not news to the many agencies serving the needs of youth in New Orleans. Indeed in
2012, a group of community leaders embarked on a comprehensive initiative to improve life
outcomes for young people. Recognizing that it indeed takes a village to raise a child, they
set out to identify opportunities to work together to strengthen supports for children/youth
and their families, yielding “YouthShift”—a youth master planning effort.
An essential first step in any planning effort is the development of a baseline. The New
Orleans Youth Index 2015 provides that baseline. It is a statistical snapshot of the well-being
of New Orleans children/youth, designed to inform the development of strategies that can
improve the academic, social, and behavioral outcomes of children/youth age 0 to 24.
The indicators selected for The Youth Index are based on literature developed by the Forum
for Youth Investment. The Forum organizes youth outcomes by age level (from birth to young
adulthood) and development domains, which include:
* children/youth succeeding in school;
* children introduced to the concepts of work, youth and young adults ready for work;
* children/youth making healthy choices;
* children/youth having positive relationships with peers and adults;
* children/youth contributing to their community.
The Forum asserts that leaders should review baseline data to define their goals for chil-
dren/youth and then review indicators that measure progress against these goals over time.
To assist leaders in selecting goals, The Youth Index provides comparisons between the
city, the state, and the United States wherever possible. Because this is a baseline report,
longitudinal measures are limited. Most of the indicators are drawn from publicly available
datasets, such as the U.S. Census Bureau’s American Community Survey (ACS) and the State
of Louisiana Kids’ Dashboard, which are updated over time. Where appropriate, we indicate
the need to develop more and better data. As regional leaders select goals and strategies,
future reports will measure progress overtime.
The indicators in The Youth Index are organized into six priority areas—as identified by
YouthShift—in which children/youth experience barriers to success. Those six priority areas
are Health and Wellbeing, Economic Stability, Learning, Space and Place, Safety and Justice,
and Youth Voice.
Background
WHAT IS ORLEANS PARISH?
Orleans Parish is the city of New Orleans. New Orleans and Orleans Parish are interchangable. Their boundaries are the same and they contain the same population.
DATA C E N T E R R E S E A R C H . O R G 5
Table of ContentsHealth and Well-Being7 Immunizations
8 Obesity and Overweight
9 Physical Activity
10 Infant Mortality
11 Low Birthweight
12 Births to Teen Mothers
13 Alleged Abuse and Neglect
Economic Stability15 Child Poverty
16 Kindergarten Readiness
18 Lack of High School Diploma
19 Completed Bachelor’s Degree
or More
20 Youth Unemployment
21 Opportunity Youth
22 Parental Employment
Learning24 Third Grade English Language
Scores
26 Third-Eighth Grade English
Language and Math Scores
28 Truancy
29 Cohort Graduation
31 College Enrollment
Space and Place33 Homeless Children and Youth
Safety and Justice35 Child and Youth Homicide
36 Percent of Suspensions that
were Out-of-School
37 Percent of Suspensions by Race
Youth Voice39 Missing Data
Notes40 Endnotes
44 About the Author (Back Cover)
6
14
23
32
34
38
40

Health and Well-Being

DATA C E N T E R R E S E A R C H . O R G 7
WHY IS THIS IMPORTANT?
One of the best ways to protect children from harmful diseases is to make sure they have
all of their vaccinations so that they become immunized against diseases.1 There are 16
potentially harmful vaccine-preventable diseases that could lead to hospitalization or
even death of infants, children, or teens.2 Immunization reduces the vulnerability of all
children to catching diseases and improves the health of all children.
HOW ARE NEW ORLEANS’ CHILDREN DOING?
According to the most current data available, 76.4 percent of children in New Orleans
were immunized compared to 80.1 percent in Louisiana. The state’s target is 90 percent.3
Both New Orleans and the state as a whole were below the state’s target percentage
during the first quarter of 2014.
Source: State of Louisiana:
Children’s Cabinet. (2015). Louisiana
kids dashboard: Health care:
Immunizations: 19-35 months.
CHILD IMMUNIZATION RATES
2014 QUARTER 1
Immunizations
TECHNICAL NOTES AND DATA CONSIDERATIONS
This data was obtained from the Louisiana Kids’ Dashboard.4 The data is reported on a quarterly basis. The immunization rate is
a measure of the percent of children vaccinated with Diphtheria-Tetanus Toxoids-acellular Pertussis vaccine (DTaP) (4 or more
doses) and Measles-Mumps-Rubella vaccine (MMR) (1 or more doses). These vaccines prevent younger children from getting sick
with serious but preventable diseases such as measles, mumps, rubella, diphtheria, pertussis, tetanus and more. The Department
of Health and Hospitals has an Immunizations Program that works with health officials around the state to update and monitor
the Louisiana Immunization Network for Kids, which stores patient vaccination records in a central location.

The New Orleans Youth Index | December 20158
ECO
NO
MIC
STA
BIL
ITY
HE
ALT
H A
ND
WEL
L-B
EIN
GLE
AR
NIN
GSP
AC
E A
ND
PLA
CE
SAFE
TY
AN
D J
UST
ICE
YOU
TH
VO
ICE
WHY IS THIS IMPORTANT?
Obesity in childhood has both immediate and long-term effects on health and well-be-
ing.5 Obese children are more likely to have risk factors for cardiovascular disease, such
as high cholesterol or high blood pressure, prediabetes, bone and joint problems, sleep
apnea, and social and psychological problems such as stigmatization and poor self-es-
teem.6 They are also more likely to be obese as adults and subsequently more at risk for
adult health problems such as heart disease, type 2 diabetes, stroke, several types of
cancer, and osteoarthritis.7
HOW ARE NEW ORLEANS’ CHILDREN DOING?
In 2007, an estimated 16.7 percent of New Orleans children were obese and 17.4 percent
were overweight. In Louisiana, 15.4 percent of the children were obese and 17.5 percent
were overweight.
TECHNICAL NOTES AND DATA CONSIDERATIONS
The data reported here was collected through the Youth Risk Behavior Surveillance System (YRBSS), which monitors priority
health-risk behaviors and the prevalence of obesity and asthma among youth and young adults.8 YRBSS includes a national
school-based survey conducted by The Center for Disease Control and Prevention (CDC) and state and local school-based surveys
conducted by state and local education and health agencies.9 In 2007, as a component of YRBSS, communities participating in the
Steps Cooperative Agreement Program (Steps Program) also conducted school-based surveys of students in grades 9–12 in their
program intervention areas.10 These communities used a standard questionnaire that measured tobacco use, dietary behaviors,
and physical activity and monitored the prevalence of obesity and asthma. Unfortunately, there has not been any local data
collected for New Orleans since 2007. There is no indicator that is based on publicly available data that more accurately provides
a picture of how well kids in New Orleans are faring in this area.
HE
ALT
H A
ND
WE
LL-B
EIN
G Obesity and Overweight
PERCENT OF HIGH SCHOOL STUDENTS OBESE OR OVERWEIGHT
2007
Source: New Orleans Health
Department. (2013). Healthy lifestyle
in New Orleans.
DATA C E N T E R R E S E A R C H . O R G 9
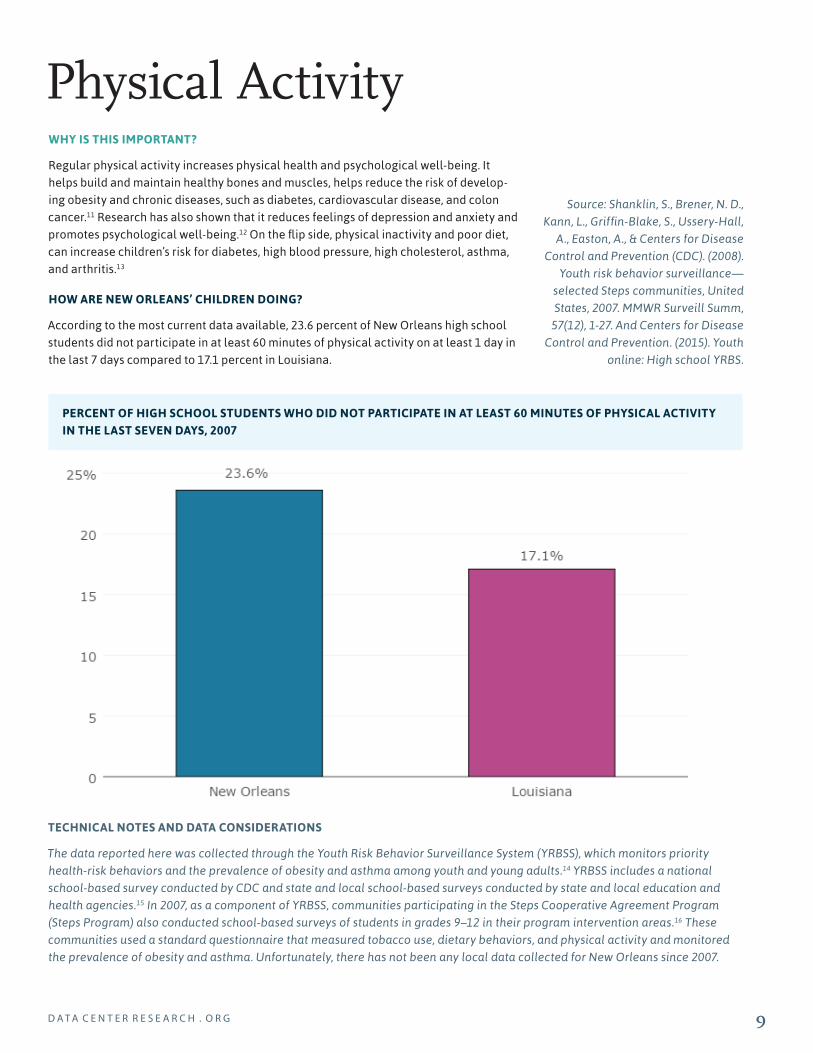
PERCENT OF HIGH SCHOOL STUDENTS WHO DID NOT PARTICIPATE IN AT LEAST 60 MINUTES OF PHYSICAL ACTIVITY
IN THE LAST SEVEN DAYS, 2007
WHY IS THIS IMPORTANT?
Regular physical activity increases physical health and psychological well-being. It
helps build and maintain healthy bones and muscles, helps reduce the risk of develop-
ing obesity and chronic diseases, such as diabetes, cardiovascular disease, and colon
cancer.11 Research has also shown that it reduces feelings of depression and anxiety and
promotes psychological well-being.12 On the flip side, physical inactivity and poor diet,
can increase children’s risk for diabetes, high blood pressure, high cholesterol, asthma,
and arthritis.13
HOW ARE NEW ORLEANS’ CHILDREN DOING?
According to the most current data available, 23.6 percent of New Orleans high school
students did not participate in at least 60 minutes of physical activity on at least 1 day in
the last 7 days compared to 17.1 percent in Louisiana.
Physical Activity
TECHNICAL NOTES AND DATA CONSIDERATIONS
The data reported here was collected through the Youth Risk Behavior Surveillance System (YRBSS), which monitors priority
health-risk behaviors and the prevalence of obesity and asthma among youth and young adults.14 YRBSS includes a national
school-based survey conducted by CDC and state and local school-based surveys conducted by state and local education and
health agencies.15 In 2007, as a component of YRBSS, communities participating in the Steps Cooperative Agreement Program
(Steps Program) also conducted school-based surveys of students in grades 9–12 in their program intervention areas.16 These
communities used a standard questionnaire that measured tobacco use, dietary behaviors, and physical activity and monitored
the prevalence of obesity and asthma. Unfortunately, there has not been any local data collected for New Orleans since 2007.
Source: Shanklin, S., Brener, N. D.,
Kann, L., Griffin-Blake, S., Ussery-Hall,
A., Easton, A., & Centers for Disease
Control and Prevention (CDC). (2008).
Youth risk behavior surveillance—
selected Steps communities, United
States, 2007. MMWR Surveill Summ,
57(12), 1-27. And Centers for Disease
Control and Prevention. (2015). Youth
online: High school YRBS.

The New Orleans Youth Index | December 201510
ECO
NO
MIC
STA
BIL
ITY
HE
ALT
H A
ND
WEL
L-B
EIN
GLE
AR
NIN
GSP
AC
E A
ND
PLA
CE
SAFE
TY
AN
D J
UST
ICE
YOU
TH
VO
ICE
WHY IS THIS IMPORTANT?
Infant mortality is commonly used as an indicator of population health and well-being.17
Growing evidence suggests that infant mortality within a population is linked to that
population’s overall health and development across the lifespan.18 Factors affecting the
health of entire populations such as maternal health, access to medical care, socioeco-
nomic status, and public health practices can also impact infant mortality rates.19
HOW ARE NEW ORLEANS’ CHILDREN DOING?
In 2013, the New Orleans infant mortality rate was 9.3 per 1,000 live births compared to
8.7 for Louisiana. Both of those rates were higher than the national rate of 6.0 per 1,000
live births in 2013.20
Infant Mortality
TECHNICAL NOTES AND DATA CONSIDERATIONS
Infant mortality refers to the death of a child within the first year of life. Center for Disease Control and Prevention Wide-ranging
OnLine Data for Epidemiologic Research (CDC WONDER) data collection provides counts and rates for deaths of children under 1
year of age, occurring within the United States, to U.S. residents. To produce the data, information from death certificates has been
linked to corresponding birth certificates.
INFANT DEATH RATES
PER 1,000 BIRTHS, 2013
Source: United States Department
of Health and Human Services (US
DHHS), Centers of Disease Control
and Prevention (CDC), National
Center for Health Statistics (NCHS),
and Division of Vital Statistics (DVS).
HE
ALT
H A
ND
WE
LL-B
EIN
G

DATA C E N T E R R E S E A R C H . O R G 11
PERCENT OF LIVE BIRTHS WITH LOW BIRTHWEIGHT
2013
WHY IS THIS IMPORTANT?
An indicator related to infant mortality is low birthweight. Infants born with low birth-
weights, weighing less than 5.5 pounds, are more likely to experience developmental and
health problems and are more likely to die in the first year of life.21 Babies born at low
birthweight are also more likely than babies at normal weight to have health conditions
later in life such as diabetes, heart disease, high blood pressure, metabolic syndrome,
and obesity.22 Preterm birth, birth before 37 weeks, is the leading cause of low birth-
weight and infant mortality in the United States.23 According to researchers at the Na-
tional Academy of Sciences, “Preterm birth is a complex cluster of problems with a set of
overlapping factors of influence. Its causes may include individual-level behavioral and
psychosocial factors, neighborhood characteristics, environmental exposures, medical
conditions, infertility treatments, biological factors, and genetics. Many of these factors
occur in combination, particularly in those who are socioeconomically disadvantaged or
who are members of racial and ethnic minority groups.”24
HOW ARE NEW ORLEANS’ CHILDREN DOING?
In 2013, New Orleans had a higher share of infants born low birthweight than the state of
Louisiana and the United States. In New Orleans, 12.5 percent of infants born were low
birthweight compared to 10.9 percent for the state and 8.0 percent for the United States.
Low Birthweight
TECHNICAL NOTES AND DATA CONSIDERATIONS
The data was obtained from the March of Dimes’ PeriStats website.25 PeriStats provides free access to maternal and infant health-
related data at the U.S., state, county, and city level.
Source: March of Dimes. (2015).
National Center for Health Statistics,
period linked birth/infant death data.
The New Orleans Youth Index | December 201512
ECO
NO
MIC
STA
BIL
ITY
HE
ALT
H A
ND
WEL
L-B
EIN
GLE
AR
NIN
GSP
AC
E A
ND
PLA
CE
SAFE
TY
AN
D J
UST
ICE
YOU
TH
VO
ICE
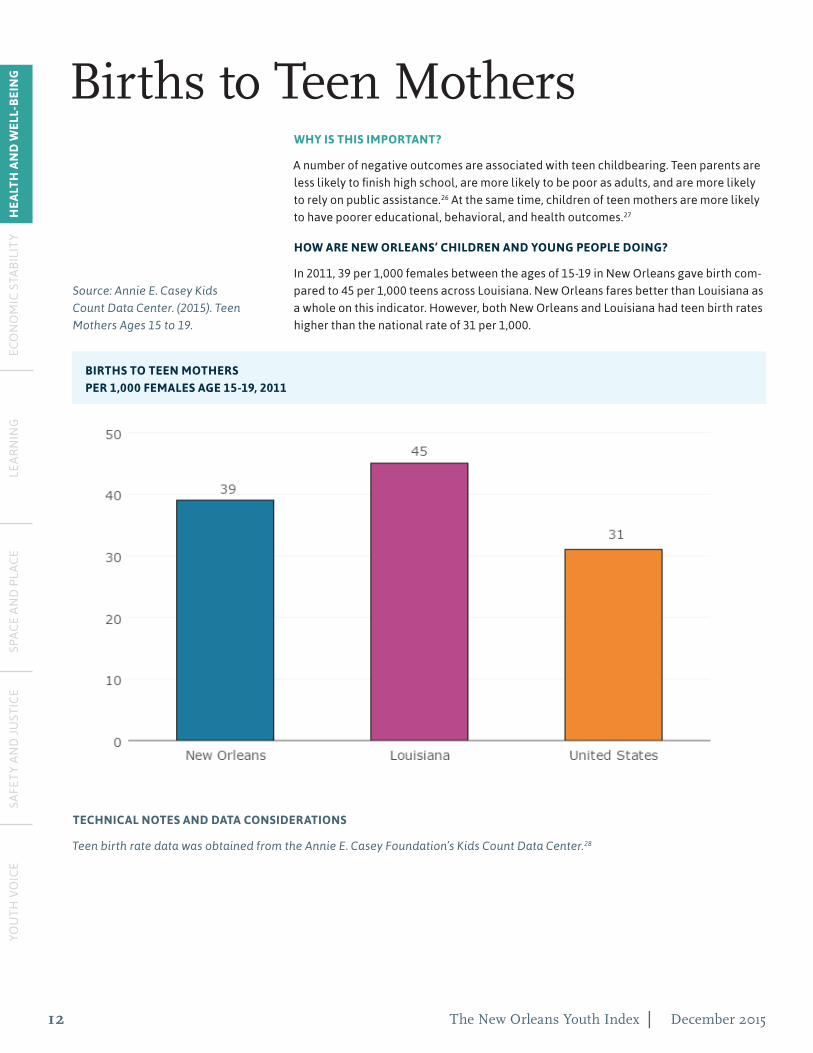
Births to Teen MothersWHY IS THIS IMPORTANT?
A number of negative outcomes are associated with teen childbearing. Teen parents are
less likely to finish high school, are more likely to be poor as adults, and are more likely
to rely on public assistance.26 At the same time, children of teen mothers are more likely
to have poorer educational, behavioral, and health outcomes.27
HOW ARE NEW ORLEANS’ CHILDREN AND YOUNG PEOPLE DOING?
In 2011, 39 per 1,000 females between the ages of 15-19 in New Orleans gave birth com-
pared to 45 per 1,000 teens across Louisiana. New Orleans fares better than Louisiana as
a whole on this indicator. However, both New Orleans and Louisiana had teen birth rates
higher than the national rate of 31 per 1,000.
TECHNICAL NOTES AND DATA CONSIDERATIONS
Teen birth rate data was obtained from the Annie E. Casey Foundation’s Kids Count Data Center.28
BIRTHS TO TEEN MOTHERS
PER 1,000 FEMALES AGE 15-19, 2011
Source: Annie E. Casey Kids
Count Data Center. (2015). Teen
Mothers Ages 15 to 19.
HE
ALT
H A
ND
WE
LL-B
EIN
G

DATA C E N T E R R E S E A R C H . O R G 13
Alleged Abuse and NeglectWHY IS THIS IMPORTANT?
Studies have shown there are a variety of long-term consequences of child abuse and
neglect.29 These long-term effects include chronic health conditions, disrupted brain
development, cognitive delay, language difficulties, behavioral problems, juvenile
delinquency, alcohol and other drug abuse, low self-esteem, depression, relationship
difficulties, anxiety, and other psychiatric disorders.30
HOW ARE NEW ORLEANS’ CHILDREN DOING?
In 2010, 13 allegations of abuse and neglect per 1,000 children were reported in New
Orleans compared to 23 per 1,000 children in Louisiana. New Orleans fares better than
the state overall on this indicator.
CHILDREN ALLEGED TO HAVE BEEN VICTIMS OF ABUSE OR NEGLECT
PER 1,000 CHILDREN, 2010
TECHNICAL NOTES AND DATA CONSIDERATIONS
The number and rates of allegations do not reflect the number or rates of abuse and neglect. Some allegations were confirmed
as valid and others were not. However, an investigation that leads to an invalid or other finding only indicates that there was
insufficient evidence to make a valid confirmation. In addition, experts argue that child abuse and neglect is underreported, and
standards for reasonable suspicion of abuse and neglect are not always clear-cut. As a result, official reports do not capture all
cases in which child abuse and neglect is suspected or even is detected or acted upon.31 A non-Child Protective Services (CPS)
study suggested that an estimated 1 in 4 U.S. children experience some form of child maltreatment in their lifetimes.32
Source: Kids Count Data Center.
(2015). Children alleged to have been
victims of abuse or neglect by type of
abuse.

Economic Stability

DATA C E N T E R R E S E A R C H . O R G 15
WHY IS THIS IMPORTANT?
Scientific research has shown that child poverty can lead to chronic, toxic stress that
disrupts the architecture of the developing brain.33 Children in poverty are much more
likely to experience exposure to violence, chronic neglect, and the accumulated bur-
dens of economic hardship. This kind of chronic stress causes prolonged activation of
the stress response system, which in turn can disrupt the development of brain architec-
ture, leading to lifelong difficulties in learning, memory, and self-regulation.34 In short,
scholars argue that poverty may be the single greatest threat to children’s healthy brain
development.35
HOW ARE NEW ORLEANS’ CHILDREN DOING?
In 2014, 43.8 percent of New Orleans children under 18 were in poverty. That percentage
is much higher than the percentages for the state of Louisiana at 27.9 percent and 21.7
percent for the United States.
TECHNICAL NOTES AND DATA CONSIDERATIONS
In 2013, the child poverty rate for New Orleans was 39 percent. Although the 2014 percent is higher than the 2013 percent, it is
not a statistically significant difference.
By definition, poverty for children is a function of their family’s household income. In other words, the wages of adult family
members determine whether children live in poverty. Poverty status is determined by comparing a family’s annual income to a
set of poverty thresholds (in dollars) that vary by family size, number of children, and age of householder.36 If a family’s pre-tax
income is less than their given poverty threshold, then that family and every individual in it are counted as living in poverty.
Child Poverty
PERCENT OF CHILDREN UNDER 18 BELOW POVERTY LEVEL
2014
Source: U.S. Census Bureau, American
Community Survey 2014.

The New Orleans Youth Index | December 201516
ECO
NO
MIC
STA
BIL
ITY
HE
ALT
H A
ND
WEL
L-B
EIN
GLE
AR
NIN
GSP
AC
E A
ND
PLA
CE
SAFE
TY
AN
D J
UST
ICE
YOU
TH
VO
ICE
WHY IS THIS IMPORTANT?
The achievements of the young adults of tomorrow can be shaped by the academic and
nonacademic skills they possess at the time they enter school. School readiness has
been shown to predict later school achievement, high school completion, and em-
ployment.37 Children that lag behind their peers at school entry may have challenges
that prevent them from reaching their full potential. It is important to remember that
children who start school lagging behind others could have been helped by early inter-
vention.38 For this reason, it is imperative to determine which children can benefit from
increased prevention and intervention efforts in all communities.
HOW ARE NEW ORLEANS’ CHILDREN DOING?
In the 2013 school year, 32 percent of all children in New Orleans were vulnerable on at
least one domain, with 18 percent vulnerable on two or more domains of school readi-
ness. Compared to the national norms, New Orleans children are more vulnerable. The
national norm rate of vulnerable on at least one domain is 26-32 percent. New Orleans
is at the high end at 32 percent. The national norm rate for vulnerable on 2 or more
domains is 13-16 percent. New Orleans is above that rate at 18 percent.
Kindergarten Readiness
EC
ON
OM
IC S
TAB
ILIT
Y
PERCENT OF KINDERGARTEN CHILDREN VULNERABLE ON 1 OR MORE DOMAINS OF SCHOOL READINESS
2013
Source: Orleans Public Education
Network. (2013). Early development
instrument: 2012-2013 New Orleans
Community profile.

DATA C E N T E R R E S E A R C H . O R G 17
TECHNICAL NOTES AND DATA CONSIDERATIONS
To help quantify the extent of school readiness in neighborhoods in New Orleans, the Orleans Public Education Network (OPEN)
coordinated the collection of comprehensive Early Development Instrument (EDI) data on 65 percent of all kindergarten age
children in both public and private schools in Orleans Parish in the 2013 school year. This data provides a comprehensive
assessment of our kindergarten children’s school readiness—both by the school they attend, and by the neighborhood in which
they live.
The EDI is a 104-item teacher checklist that measures school readiness as an indicator of children’s early development. It was
developed at the Offord Centre for Child Studies at McMaster University in Ontario, Canada, and measures children’s readiness
to learn at school in five recommended domains.39 The five domains are physical health and well-being, social competence,
emotional maturity, language and cognitive skills, and communication skills and general knowledge.
Each student receives a score based on the teacher-completed checklist and the score determines if the child is “vulnerable,”
“at-risk”, “on-track,” or “very ready” on each domain. Across all domains, performance on the EDI predicts their performance later
in elementary school. An increase in vulnerabilities across the five domains increases the likelihood that children will struggle
to meet basic competencies by third or fourth grade.40 OPEN has received funding to conduct the EDI in schools during the 2016
school year. However, funding in the future is in question. Therefore, this indicator may not appear in future reports.
The EDI data was selected as a measure of Kindergarten readiness instead of any statewide assessments because a statewide
assessment of kindergarten readiness has not been found. This may change in the future as Louisiana Legislature passed Act
3 in 2012, requiring the creation of a unified network of early childhood care and education that would establish a common
expectation for excellence among all publicly-funded providers. When fully implemented in 2016, the networks will expand
access to high quality, publicly funded early childhood programs to families across Louisiana to ensure more children enter
school kindergarten ready.41
“THERE CAN BE NO KEENER REVELATION OF A SOCIETY’S SOUL THAN THE WAY IN WHICH IT TREATS ITS CHILDREN.”
– Nelson Mandela
Former President of South Africa

The New Orleans Youth Index | December 201518
ECO
NO
MIC
STA
BIL
ITY
HE
ALT
H A
ND
WEL
L-B
EIN
GLE
AR
NIN
GSP
AC
E A
ND
PLA
CE
SAFE
TY
AN
D J
UST
ICE
YOU
TH
VO
ICE
WHY IS THIS IMPORTANT?
Research has shown that education matters for health more than ever before. Adults
without a high school diploma can expect to die sooner, have higher rates of disease, and
worse health. In addition, they risk greater disability and experience psychological stress
at higher rates than more educated adults, especially adults with college degrees.42 Fur-
ther, when compared to people who earned a diploma or more, people without a diploma
earn less and are more likely to be unemployed.43
HOW ARE NEW ORLEANS’ YOUNG PEOPLE DOING?
In 2014, the share of young people age 18-24 in New Orleans who had completed less
education than a high school diploma was 13.1 percent. New Orleans had a significantly
lower share than the state of Louisiana, which was 19.2 percent. Louisiana had a signifi-
cantly higher percent of young adults ages 18-24 who had not completed a high school
diploma than the U.S. percent which was 13.9 percent.
TECHNICAL NOTES AND DATA CONSIDERATIONS
Educational attainment data is based on U.S. Census Bureau, American Community Survey (ACS) data. Data on educational attain-
ment was derived from answers to Question 11 on the 2014 ACS, which was asked of all respondents. Respondents are classified
according to the highest degree or the highest level of school completed. The question included instructions for persons currently
enrolled in school to report the level of the previous grade attended or the highest degree received.44
Lack of High School Diploma
HIGH SCHOOL DIPLOMA OR LESS
FOR THE POPULATION 18-24 YEARS OLD, 2014
n.s.= Difference between New
Orleans and the United States is not
significant at 95% confidence interval.
Source: U.S. Census Bureau, American
Community Survey 2014.
EC
ON
OM
IC S
TAB
ILIT
Y

DATA C E N T E R R E S E A R C H . O R G 19
BACHELOR’S DEGREE OR MORE
FOR THE POPULATION 18-24 YEARS OLD, 2014
WHY IS THIS IMPORTANT?
Research has shown that earning a college education is a sound investment on one’s
future. The benefits of earning a college degree include a variety of economic well-being
and career attainment benefits.45 Today’s college graduates earn more annually, have
lower unemployment and poverty rates, and have more satisfaction with their jobs than
those with only a high school diploma.46 Further, when compared to people who earn an
associate’s degree, or some college, people who have a bachelor’s degree earn more and
are less likely to be unemployed.47
HOW ARE NEW ORLEANS’ YOUNG PEOPLE DOING?
In 2014, the share of young people age 18-24 who had completed a bachelor’s degree in
New Orleans was significantly higher than that of the state. The New Orleans share was 12.0
percent compared to the state which was only 7.2 percent.
TECHNICAL NOTES AND DATA CONSIDERATIONS
Educational attainment data is based on U.S. Census Bureau, American Community Survey (ACS) data. Data on educational attain-
ment was derived from answers to Question 11 on the 2014 ACS, which was asked of all respondents. Respondents are classified
according to the highest degree or the highest level of school completed. The question included instructions for persons currently
enrolled in school to report the level of the previous grade attended or the highest degree received.48
The state board of regents does provide a report on the degrees and certificates awarded by the home parish of the recipient.
However, it does not provide the age of the completer. It also only includes data on the state’s 34 public colleges, universities and
professional schools.
Completed Bachelor’s Degree or More
n.s.= Difference between New
Orleans and the United States is not
significant at 95% confidence interval.
Source: U.S. Census Bureau, American
Community Survey 2014.

The New Orleans Youth Index | December 201520
ECO
NO
MIC
STA
BIL
ITY
HE
ALT
H A
ND
WEL
L-B
EIN
GLE
AR
NIN
GSP
AC
E A
ND
PLA
CE
SAFE
TY
AN
D J
UST
ICE
YOU
TH
VO
ICE
TECHNICAL NOTES AND DATA CONSIDERATIONS
The data on employment status was derived from Questions 29 and 35 to 37 in the 2014 American Community Survey (ACS). All
civilians 16 years old and over are classified as unemployed if they (1) were neither “at work” nor “with a job but not at work”
during the reference week, (2) were actively looking for work during the last 4 weeks, and (3) were available to start a job. Also
included as unemployed are civilians who did not work at all during the reference week, were waiting to be called back to a job
from which they had been laid off, and were available for work except for temporary illness.50
Youth Unemployment
PERCENT UNEMPLOYED
FOR THE POPULATION 16-24 YEARS OLD, 2014
WHY IS THIS IMPORTANT?
Most young people will be working their first jobs between the ages of 16 and 24 years
old. Youths’ first jobs could be critical to establishing social and economic stability for
the rest of their lives. Youth employment can teach youth responsibility, help them de-
velop organizational and time management skills, can help them form good work habits,
gain valuable work experiences, and become financially independent.49
HOW ARE NEW ORLEANS’ YOUNG PEOPLE DOING?
In 2014, 20.0 percent of New Orleans young people age 16-24 were unemployed com-
pared to 16.6 percent in Louisiana and 15.2 percent in the United States. New Orleans
did not have a significantly higher youth unemployment rate than either the state or the
United States. In addition, Louisiana’s youth unemployment rate was not significantly
higher than the U.S. rate.
n.s.= Differences between all
geographies are not significant at
95% confidence interval.
Source: U.S. Census Bureau, American
Community Survey 2014.
EC
ON
OM
IC S
TAB
ILIT
Y

DATA C E N T E R R E S E A R C H . O R G 21
WHY IS THIS IMPORTANT?
Young people age 16-24 who are out of school and out of work are often referred to as
disconnected youth, and in recent parlance, as opportunity youth, because of the poten-
tial value they could add to their communities.51 Some of the pathways to disconnection
include the following: leaving high school without a diploma, finishing high school or
even college but still lacking the essential education or skills to obtain a decent job,
having a criminal record that prevents or reduces the chances of employment, and hav-
ing parenting/family responsibilities that impede employment or school attendance. In
low-income communities, the incidence of disconnection is much more pronounced.52
HOW ARE NEW ORLEANS’ YOUNG PEOPLE DOING?
In 2013, 18.2 percent of metro New Orleans youth were opportunity youth compared to
19.8 percent across the state of Louisiana and 13.8 percent across the United States.53
Opportunity Youth
PERCENT OPPORTUNITY YOUTH
FOR THE POPULATION 16-24 YEARS OLD, 2013
TECHNICAL NOTES AND DATA CONSIDERATIONS
The Cowen Institute released its 2015 comprehensive examination of opportunity youth at the national, state, and metropolitan
levels.54 However, data is needed to understand the prevalence of opportunity youth in New Orleans, specifically. The U.S. Census
Bureau dataset does not allow for analysis of this data at the parish level.
Source: Sims, Patrick. (2015).
Reconnecting opportunity youth:
Data reference guide.
Note: Metro New Orleans is made
up of Orleans, Jefferson, St. Bernard,
Plaquemines, St. Charles, St. John, St.
James, and St. Tammany Parishes.

The New Orleans Youth Index | December 201522
ECO
NO
MIC
STA
BIL
ITY
HE
ALT
H A
ND
WEL
L-B
EIN
GLE
AR
NIN
GSP
AC
E A
ND
PLA
CE
SAFE
TY
AN
D J
UST
ICE
YOU
TH
VO
ICE
Parental EmploymentWHY IS THIS IMPORTANT?
The financial stability of children in families is dependent on the parent’s income, usually
their income through work. Secure parental employment is associated with reduced risk
for poverty, higher family income, and access to private insurance.55 And higher family
income is associated with positive child outcomes such as better health, behavior, aca-
demic achievement, and financial well-being as adults.56
HOW ARE NEW ORLEANS’ CHILDREN DOING?
In 2014, the percent of children under 18 with at least one working parent in New
Orleans was 80.7 percent. The percent of children with at least one working parent in
Louisiana was 87.2 percent. Both rates for New Orleans and the state of Louisiana were
significantly lower than the rate for the United States, which was 90.4 percent.
PERCENT OF FAMILIES WITH CHILDREN WITH AT LEAST ONE PARENT WORKING
2014
TECHNICAL NOTES AND DATA CONSIDERATIONS
Data on employment status was derived from Questions 29 and 35 to 37 in the 2014 American Community Survey (ACS).57
Employed includes part-time employment.
Source: U.S. Census Bureau, American
Community Survey 2014.
EC
ON
OM
IC S
TAB
ILIT
Y

DATA C E N T E R R E S E A R C H . O R G 23
Learning

The New Orleans Youth Index | December 201524
ECO
NO
MIC
STA
BIL
ITY
HE
ALT
H A
ND
WEL
L-B
EIN
GLE
AR
NIN
GSP
AC
E A
ND
PLA
CE
SAFE
TY
AN
D J
UST
ICE
YOU
TH
VO
ICE
WHY IS THIS IMPORTANT?
It has been widely reported that until third grade, children learn to read; after third
grade, they read to learn.58 For that reason, reading skills in third grade is considered
an important early warning indicator of academic performance. Reading skills in third
grade is highly predictive of future academic performance.59 Third grade children with
limited reading abilities will have a harder time keeping up with other students across
multiple subjects—including math, science, and other languages.
HOW ARE NEW ORLEANS’ CHILDREN DOING?
In 2015, the percent of New Orleans third grade students scoring at basic or above on
the Partnership for Assessment of Readiness for College and Careers (PARCC) tests of
English language skills was 56 percent. The percent of Louisiana third grade students
who scored basic or above on the PARCC tests of English language skills was 63 percent.
Third Grade English Language Scores
PERCENT OF THIRD GRADE STUDENTS AT EACH ACHIEVEMENT LEVEL
SPRING 2015, ENGLISH LANGUAGE ARTS
Source: Louisiana Department of
Education. (2015). State district
achievement level summary report
2015.
LEA
RN
ING

DATA C E N T E R R E S E A R C H . O R G 25
TECHNICAL NOTES AND DATA CONSIDERATIONS
There have been major changes in how Louisiana has assessed early reading over the past 15 years. First, to comply with the 2001
No Child Left Behind Act, Louisiana developed the Integrated Louisiana Educational Assessment Program (iLEAP). The iLEAP En-
glish language arts and math tests are administered at grades 3, 5, 6, 7, and 9. The iLEAP reading subscore was the official assess-
ment of early reading. All items were specifically developed for the iLEAP according to the state content standards, benchmarks,
and Louisiana Grade-Level Expectations (GLEs).60 Then after 2011, the iLEAP reading subscore was discontinued as the official
assessment of early reading in Louisiana. Louisiana law mandates that the State Board of Elementary and Secondary Education
(SBESE) require administration of an early reading assessment by all public elementary schools enrolling K–3 students.61 The
assessment that has been approved by SBESE for this purpose beginning in the fall of 2011 is the Dynamic Indicators of Basic Early
Literacy Skills 7th Edition, (DIBELS Next). DIBELS Next is used by districts/schools to screen early literacy skills, reflect progress in
reading skills, predict a student’s likelihood of future success in reading achievement, and indicate areas in which a student needs
intervention.
For the 2016 school year, some districts have submitted waiver request applications to use other assessment tools besides DIBELS
for students in kindergarten–third grade. These districts believe these other tools are better in supporting reading assessment and
instruction.62 In order to get statewide or city wide data, a common reading assessment and consolidated data is needed to deter-
mine the reading levels of students in all schools, public and private. Currently, the Louisiana Department of Education reports this
data separately for individual schools in the Recovery School District.
Because some schools and districts choose to opt out of using the DIBELS, the Partnership for Assessment of Readiness for College
and Careers (PARCC) tests of English language skills were used as an assessment of reading skills instead. In the 2015 school year,
the PARCC tests replaced the LEAP and iLEAP exams in English and math.63
“THE POTENTIAL POSSIBILITIES OF ANY CHILD ARE THE MOST INTRIGUING AND STIMULATING IN ALL CREATION”
– Ray L. Wilbur
Third President of Stanford University

The New Orleans Youth Index | December 201526
ECO
NO
MIC
STA
BIL
ITY
HE
ALT
H A
ND
WEL
L-B
EIN
GLE
AR
NIN
GSP
AC
E A
ND
PLA
CE
SAFE
TY
AN
D J
UST
ICE
YOU
TH
VO
ICE
WHY IS THIS IMPORTANT?
Every year, many first year college students learn that they must take remedial
courses in English or mathematics, which do not earn college credits.64 The prob-
lems associated with students not being college ready also apply to 2-year colleges.
A study of 2-year college English language arts and math courses showed that many
students are not adequately prepared for those courses.65 The research showed that
the math taught at 2-year colleges was almost exclusively at a middle school level.
The researchers also found that instructors in applied math programs frequently
devise their own materials, since students are so often not taught in elementary
or secondary schools the specific skills needed to succeed in those courses. The
researchers also found that English language arts introductory courses have high
failure rates. In addition, students are asked to do very little writing; and when they
do write, the expectations for reasoning, logic, and even grammar are quite low.
Improving student performance on math and English language tests is important
in order to help more students not only enroll in college, but also to increase the
number who successfully complete college.
HOW ARE NEW ORLEANS’ CHILDREN DOING?
The percent of New Orleans third–eighth grade students scoring mastery and above
on 2015 PARCC English language and math tests was 28 percent in Spring 2015 com-
pared to 22 percent in Spring of 2014. The percent of Louisiana students who scored
mastery or above on the PARCC English language and math tests was 33 percent in
Spring 2015 compared to 26 percent in Spring 2014.
Third–Eighth Grade English Language and Math Scores
PERCENT OF THIRD–EIGHTH GRADE STUDENTS WHO SCORED AT MASTERY OR ABOVE
ENGLISH LANGUAGE ARTS AND MATH ASSESSMENTS
Source: Louisiana Department of
Education. (2015). 2015 Mastery and
above district percentile rankings.
LEA
RN
ING

DATA C E N T E R R E S E A R C H . O R G 27
TECHNICAL NOTES AND DATA CONSIDERATIONS
For the 2015 school year, Partnership for Assessment of Readiness for College and Careers (PARCC) tests replaced the LEAP and
iLEAP exams in English and math in Louisiana. Louisiana joined the 10 other states and the District of Columbia that took the
PARCC annual assessments, although not all participating states have students in all grades taking the test.66 Students in the
following states took PARCC assessments: Arkansas, Colorado, District of Columbia, Illinois, Louisiana, Maryland, Massachusetts,
Mississippi, New Jersey, New Mexico, Ohio, and Rhode Island.67 Louisiana has chosen to adopt the assessments developed by
PARCC, a group of states working together to develop high-quality assessments driven by the following priorities:
1. Determine whether students are college- and career-ready or “on track”
2. Assess the full range of the Common Core State Standards (CCSS), including standards that are difficult to measure
3. Measure the full range of student performance, including the performance of high- and low- performing students
4. Provide data during the academic year to inform instruction, interventions, and professional development
5. Provide data for accountability, including measures of growth
6. Incorporate innovative approaches throughout the assessment system.
Louisiana can now compare it’s student performance on English and math tests with other states.
There are 5 different achievement levels that students’ test scores represent: Advanced=Exceeded expectations, Mastery=Met
expectations, Basic=Approached expectations, Approaching Basic= Partially met expectations, and Unsatisfactory=Did not meet
expectations.68 The percent of students who scored at mastery and above on the PARCC tests represents the percent of students
who have the skills they need to be prepared for college.69 This data does not include achievement test scores of private school
students.
“CHILDREN ARE THE WORLD’S MOST VALUABLE RESOURCE AND ITS BEST HOPE FOR THE FUTURE.”
– John F. Kennedy
35th President of the United States

The New Orleans Youth Index | December 201528
ECO
NO
MIC
STA
BIL
ITY
HE
ALT
H A
ND
WEL
L-B
EIN
GLE
AR
NIN
GSP
AC
E A
ND
PLA
CE
SAFE
TY
AN
D J
UST
ICE
YOU
TH
VO
ICE
WHY IS THIS IMPORTANT?
School attendance is an important factor in school achievement.70 When students don’t
attend school, they miss lessons taught and risk academic failure due to falling behind
the other students in coursework completion. Chronic truancy or absenteeism is a strong
predictor of academic failure, dropping out of school, substance use, gang involvement,
and criminal activity.71
HOW ARE NEW ORLEANS’ CHILDREN DOING?
The truancy rates in New Orleans and the state of Louisiana overall have fluctuated since
2008. In 2008, 29.5 percent of New Orleans students were considered truant and 29.3
percent in 2012. Statewide, the percent of students considered truant in 2008 was 14.7
percent and 24.1 percent in 2012.
TECHNICAL NOTES AND DATA CONSIDERATIONS
Louisiana tracks truancy instead of chronic absenteeism. Chronic absenteeism is usually defined as missing ten percent or more of
school days.72 In Louisiana, truancy is defined as any student having either 5 unexcused tardies or 5 unexcused absences within a
school semester.73
Truancy
PERCENT OF PUBLIC SCHOOL STUDENTS TRUANT
Source: Louisiana Department of
Education. (2014). 2008-2013 student
truancy counts and rates site (district
state-public): OPSB and RSD-N.O.
data provided through direct request
from Jill Zimmerman of the Louisiana
Department of Education.
LEA
RN
ING

DATA C E N T E R R E S E A R C H . O R G 29
WHY IS THIS IMPORTANT?
Obtaining a high school diploma is an important milestone marking a successful tran-
sition into adulthood. High school graduates tend to be healthier, earn higher incomes,
vote more, and face fewer obstacles as they enter adulthood. High school graduation
rates are also an important indicator of school performance for parents, policymakers,
and concerned community members. According to research by the Alliance for Excellent
Education, “As a result, graduation rates must be a cornerstone of high school account-
ability and used in decisionmaking about the targeting of resources and interventions to
low-performing schools.”74 The Louisiana Department of Education (LDE) includes high
school cohort graduation rates in the calculation of high school performance scores as a
means to hold schools accountable for graduating their students on-time.75
HOW ARE NEW ORLEANS’ YOUNG PEOPLE DOING?
The available data suggests that the cohort graduation rates for New Orleans increased
from 54 percent in 2004 to 73 percent by 2014.76 Since the 2011 school year, high school
cohort graduation rates for New Orleans students have ranged from 77 percent to 73
percent in 2014. The state of Louisiana’s cohort graduation rates have ranged from 67
percent in 2010 to 75 percent in 2014.
Cohort Graduation
HIGH SCHOOL 4-YEAR COHORT GRADUATION RATES
AS OF SPRING OF YEAR FOUR
Source: National Center for Education
Statistics, and Louisiana Department
of Education (2015). High school
performance.

The New Orleans Youth Index | December 201530
ECO
NO
MIC
STA
BIL
ITY
HE
ALT
H A
ND
WEL
L-B
EIN
GLE
AR
NIN
GSP
AC
E A
ND
PLA
CE
SAFE
TY
AN
D J
UST
ICE
YOU
TH
VO
ICE
TECHNICAL NOTES AND DATA CONSIDERATIONS
The Louisiana Department of Education did not calculate the cohort graduation rate for 2005 and the 2004 cohort graduation rate
was calculated after the fact. As such, 2004 graduation rate data was not certified at the district level at the end of that year.
The adjusted cohort graduation rate (ACGR) is considered the most accurate measure available for reporting on-time graduation
rates.77 A 4-year ACGR is defined as the number of students who graduate in four years with a regular high school diploma divided
by the number of students who form the adjusted cohort for that graduating class. The term adjusted cohort means the students
who enter ninth grade plus any students who transfer into the cohort in grades 9–12 minus any students who are removed from
the cohort because they transferred out, moved out of the country, or were deceased. It was not until 2011 that all states used this
common measure of graduation rates.
Chapter 6 of Louisiana’s Department of Education Bulletin 111—The Louisiana School, District, And State Accountability System,
defines a cohort as all students who entered ninth grade for the first time in the state of Louisiana in a given academic year. Each
cohort of students will be tracked for four years, from entry as first-time ninth graders through four academic years in order to
determine cohort graduation rates.78
“SAFETY AND SECURITY DON’T JUST HAPPEN, THEY ARE THE RESULT OF COLLECTIVE CONSENSUS AND PUBLIC INVESTMENT. WE OWE OUR CHILDREN, THE MOST VULNERABLE CITIZENS IN OUR SOCIETY, A LIFE FREE OF VIOLENCE AND FEAR.”
– Nelson Mandela
Former President of South Africa
LEA
RN
ING

DATA C E N T E R R E S E A R C H . O R G 31
College EnrollmentWHY IS THIS IMPORTANT?
College enrollment is the first major step towards completing a college degree. Most
college students enroll in college immediately after finishing high school.79 Therefore,
the percentage enrolling in college immediately after high school reflects the majority
of high school graduates who will ever enroll in college and the value graduates place
on attending college compared to working, entering the military, starting families, or
pursuing other interests.80 The benefits of earning a college degree include a variety of
economic well-being and career attainment benefits.81 Today’s college graduates earn
more annually, have lower unemployment and poverty rates, and have more satisfaction
with their jobs than those with only a high school diploma.82
HOW ARE NEW ORLEANS’ YOUNG PEOPLE DOING?
The percent of New Orleans students who enrolled in a 2-year college the first fall after
graduating in the 2013 school year was 20.4 percent, while the percent who enrolled in a
4-year college was 34.7 percent. For the state of Louisiana overall, 18.6 percent of 2013
graduates enrolled in a 2-year college and 39.4 percent enrolled in a 4-year college.
The percent of New Orleans students who enrolled in a 2-year college the first fall after
graduating from high school in the 2014 school year was 22 percent, while 36.8 percent
enrolled in a 4-year college. For the state of Louisiana overall, 20.1 percent of 2014
graduates enrolled in a 2-year college and 38.9 percent enrolled in a 4-year college.
TECHNICAL NOTES AND DATA CONSIDERATIONS
This indicator provides one measure along a pathway to college completion. To get a fuller picture, data on the number of stu-
dents who enroll and subsequently graduate is needed. That data is missing.
PERCENT OF STUDENTS WHO ENROLLED IN COLLEGE
FIRST FALL AFTER HIGH SCHOOL
Source: Louisiana Department of
Education (2014). Louisiana college
enrollment reports.

Space and Place

DATA C E N T E R R E S E A R C H . O R G 33
WHY IS THIS IMPORTANT?
Homelessness has a number of negative effects on children and youth including hunger,
poor physical and mental health, and missed educational opportunities.83 Children
without stable housing compared to other children with stable homes are more likely to
repeat a school grade, be expelled or suspended, or drop out of school.84
HOW ARE NEW ORLEANS’ CHILDREN DOING?
In 2014, the count of homeless children under 18 in the New Orleans area was 220. Most
of the children, 162, were living with at least one adult, while 58 were children with no
adult present. Overall in Louisiana, 733 homeless children lived with at least one adult,
and 127 children had no adult present.
TECHNICAL NOTES AND DATA CONSIDERATIONS
Continuum of Care (CoC) Homeless Assistance Programs Homeless Populations and Subpopulations Reports provide counts for
sheltered and unsheltered homeless persons by household type and subpopulation, available at the national and state level, and
for each CoC. The reports are based on Point-in-Time (PIT) information provided to U.S. Department of Housing and Urban Devel-
opment (HUD) by CoCs in the application for CoC Homeless Assistance Programs. The PIT Count provides a count of sheltered and
unsheltered homeless persons on a single night during the last ten days in January.
UNITY does an annual Point-In-Time Count of the homeless every year on January 30th. The data is reported to HUD every year by
April 30th and is publicly available on the HUD website. Data is combined data for Orleans and Jefferson parishes.
Homeless Children and Youth
HOMELESS YOUTH
2014
Source: U.S. Department of Housing
and Urban Development. (2015).
HUD’s 2014 continuum of care
homeless assistance programs:
Homeless populations and
subpopulations.

Safety and Justice

DATA C E N T E R R E S E A R C H . O R G 35
WHY IS THIS IMPORTANT?
Child death rates in a community, regardless of cause can be an important indicator of
general health and well-being of the community.85 A high death rate can point to under-
lying causes such as such as poor access to prenatal care, violent neighborhoods, or in-
adequate child supervision.86 Child murder specifically indicates the number of children
who have died as a result of violence or abuse directly from another person.87 Therefore,
it is an important measure of child safety.
HOW ARE NEW ORLEANS’ CHILDREN AND YOUNG PEOPLE DOING?
In 2014, there were a total of 150 murders in New Orleans; 12 of those murders were of
children under the age of 18 and 43 were of young adults from 18 to 24 years of age. The
18-24 year old age group represented a disproportionate share of the homicide victims
compared to its share of the population. The 18-24 year olds represent 10.2 percent of
the population, but represented 28.7 percent of homicide victims.
TECHNICAL NOTES AND DATA CONSIDERATIONS
Homicide data was obtained from a 2014 Times-Picayune news article.88 There is no 2014 state homicide data available from the
FBI Uniform Crime Reports (UCR). The most current FBI UCR report for the state is for the year 2013. Also, the UCR report does not
include age data. The New Orleans Police Department reports data online at http://www.nola.gov/nopd/crime-data/crime-stats/.
However, age data is not included. The FBI UCR program does report homicide data by age, sex, and race of the victim for the Unit-
ed States but not for the states. The latest U.S. data is available for 2013. The 2014 data is not yet available.
Child and Youth Homicide
SHARE OF HOMICIDE VICTIMS COMPARED TO SHARE OF POPULATION
NEW ORLEANS, 2014
Source: Swenson, D. (2015). New
Orleans 2014 murders: Victims and
case status. And U.S. Census Bureau,
American Community Survey, 2014,
1-Year Estimates.

The New Orleans Youth Index | December 201536
ECO
NO
MIC
STA
BIL
ITY
HE
ALT
H A
ND
WEL
L-B
EIN
GLE
AR
NIN
GSP
AC
E A
ND
PLA
CE
SAFE
TY
AN
D J
UST
ICE
YOU
TH
VO
ICE
WHY IS THIS IMPORTANT?
Nationally, out-of-school suspension rates have escalated dramatically since the
1970’s.89 The higher use of out-of-school suspension partly reflects the growth of policies
such as zero tolerance, an approach to school discipline that imposes removal from
school for a broad array of school code violations—from violent behavior to truancy
and dress code violations.90 Research has shown that suspensions do not improve overall
school safety and are associated with lower academic performance, higher rates of
dropout, failures to graduate on time, increased academic disengagement, and subse-
quent disciplinary exclusions.91
HOW ARE NEW ORLEANS’ CHILDREN DOING?
New Orleans schools are more likely to suspend students out-of-school compared to
all other parishes in Louisiana. The higher rates of out-of-school suspensions have been
consistent for several years. In 2013, 87 percent of the suspensions were out-of-school
suspensions in New Orleans compared to 39 percent in all other parishes. Similarly
in 2012, 86 percent of suspensions were out-of-school suspensions in New Orleans
compared to 41 percent in all other parishes. It should be noted that the rates of out-of-
school suspensions in New Orleans have been lower than pre-Katrina years. From 2001
to 2005, the rates of out-of-school suspensions ranged from 93 to 99 percent. In contrast,
from 2008 to 2013, the rates ranged from 81 to 87 percent. Nevertheless, the rates ap-
pear to be increasing since 2009.
TECHNICAL NOTES AND DATA CONSIDERATIONS
Data was received by direct request from Nathan Barrett at the Education Research Alliance (ERA). Future data should be avail-
able online from the Louisiana Department of Education (DOE). However, ERA has a formal data sharing agreement with Louisi-
ana DOE and may have to be the go-to source for future data and analysis.
SAFE
TY
AN
D J
UST
ICE
Percent of Suspensions that were Out-of-School
PERCENT OF SUSPENSIONS THAT WERE OUT-OF-SCHOOL
Source: Barrett, N. & Santillo, R.
(2015). Education Research Alliance
for New Orleans. Student discipline:
Outcomes, policies, and practices.

DATA C E N T E R R E S E A R C H . O R G 37
WHY IS THIS IMPORTANT?
National data shows that racial disparities persist in school suspension rates. A recent
study showed that the problem is worse in southern states, including Louisiana.92 Black
students are suspended at rates five times higher than their representation in the student
population.93 Research has shown that suspensions do not improve overall school safety
and are associated with lower academic performance, higher rates of dropout, failures
to graduate on time, increased academic disengagement, and subsequent disciplinary
exclusions.94 Therefore, black students suffer the negative outcomes disproportionately
more than other students.
HOW ARE NEW ORLEANS’ CHILDREN DOING?
Data on suspension rates from 2001 to 2013 shows that black students consistently had
higher suspension rates than white and other students. The latest data for 2013 shows the
lowest suspension rate for black students since 2002, at 14 percent. However, the rate is
still three times the rate for white and other students, which are at 4 percent each.
Percent of Suspensions by Race
TECHNICAL NOTES AND DATA CONSIDERATIONS
Data was received by direct request from Nathan Barrett at the Education Research Alliance (ERA). Future data should be avail-
able online from the Louisiana Department of Education (DOE). However, ERA has a formal data sharing agreement with Louisi-
ana DOE and may have to be the go-to source for future data and analysis.
Source: Barrett, N. & Santillo, R.
(2015). Education Research Alliance
for New Orleans. Student discipline:
Outcomes, policies, and practices.
PERCENT OF STUDENTS RECEIVING AT LEAST ONE SUSPENSION
BY RACE, NEW ORLEANS

Youth Voice

DATA C E N T E R R E S E A R C H . O R G 39
Missing DataYouth Voice is the only one of the six priority areas defined by YouthShift where there
was no data identified. Participants in the YouthShift movement see Youth Voice as
the empowerment and support of youth to actively engage and participate in decision
making processes that affect them. Assessing Youth Voice in New Orleans would re-
quire coordinating the collection of primary data from youth across the city. In addition,
identifying and selecting measures of Youth Voice is a challenge as there are few options.
We looked at two assessment tools that were designed to measure youth participation
within youth development programs. In one, youth answer questions about their engage-
ment, participation, and interactions with adults in their specific programs or during a
youth activity.95 An alternative is a 2014 youth survey conducted in cities across Canada to
assess the youth-friendliness of the cities. The assessment tool has five indicators: Youth
Voice, Youth Space, Cultural Identity, Social Responsibility, and Education and Learning.96
Determining how to obtain the best information in order to measure the magnitude and
qualtity of youth engagement and participation will be the challenge for New Orleans

The New Orleans Youth Index | December 201540
THE NEW ORLEANS YOUTH INDEX
1. Centers for Disease Control and Prevention. (2015). Protect your baby with immunization. Retrieved from http://www.cdc.gov/features/infantim-munization/
2. Centers for Disease Control and Prevention. (2015). Protect your child at every age. Retrieved from http://www.cdc.gov/vaccines/parents/down-loads/vaccines-children.pdf
3. State of Louisiana: Children’s Cabinet. (2015). Louisiana kids dashboard: Health care: Immunizations: 19-35 months. Retrieved from http://www.kidsdashboard.la.gov/
4. State of Louisiana: Children’s Cabinet. (2015). Louisiana kids dashboard: Health care: Immunizations: 19-35 months. Retrieved from http://www.kidsdashboard.la.gov/
5. Centers for Disease Control. Childhood obesity facts. Retrieved from http://www.cdc.gov/healthyschools/obesity/facts.htm
6. Ibid.
7. Ibid.
8. Shanklin, S., Brener, N. D., Kann, L., Griffin-Blake, S., Ussery-Hall, A., Easton, A., & Centers for Disease Control and Prevention (CDC). (2008). Youth risk behavior surveillance—selected Steps communities, United States, 2007. MMWR Surveill Summ, 57(12), 1-27. Retrieved from http://www.cdc.gov/mmwr/preview/mmwrhtml/ss5712a1.htm
9. Ibid.
10. Ibid.
11. Centers for Disease Control and Prevention. Physical activity facts. Retrieved from http://www.cdc.gov/healthyschools/physicalactivity/facts.htm
12. Ibid.
13. Ibid.
14. Ibid.
15. Ibid.
16. Ibid.
17. U.S. Department of Health and Human Services. Infant mortality. Retrieved from http://mchb.hrsa.gov/infantmortality/
18. Ibid.
19. MacDorman, M.F. & Mathews, T.J.(2008). Recent trends in infant mortality in the United States. NCHS data brief, no 9. Hyattsville, MD: National Center for Health Statistics. Retrieved from http://www.cdc.gov/nchs/data/databriefs/db09.htm
20. United States Department of Health and Human Services (US DHHS), Centers of Disease Control and Prevention (CDC), National Center for Health Statistics (NCHS), Division of Vital Statistics (DVS). (n.d.). Linked birth / infant death records 2007-2013, as compiled from data provided by the 57 vital statistics jurisdictions through the Vital Statistics Cooperative Program, on CDC WONDER On-line Database. Retrieved from http://wonder.cdc.gov/lbd-current.html March of Dime Peristats. (2015). Infant mortality rates: United States, 2002-2012. Retrieved from http://www.marchofdimes.org/Peristats/ViewSubtopic.aspx?reg=99&top=6&stop=91&lev=1&slev=1&obj=1
21. U.S. Department of Health and Human Services, Health Resources and Services Administration, Maternal and Child Health Bureau. (2012). Child health USA 2012. Rockville, Maryland: U.S. Department of Health and Human Services. Retrieved from http://mchb.hrsa.gov/chusa12/hs/hsi/pages/lbwvlbw.html
22. March of Dimes. (2014). Low birthweight. Retrieved from http://www.marchofdimes.org/baby/low-birthweight.aspx
23. U.S. Department of Health and Human Services, Health Resources and Services Administration, Maternal and Child Health Bureau. (2013). Child health USA 2013. Retrieved from http://mchb.hrsa.gov/chusa13/perinatal-health-status-indicators/p/preterm-birth.html
EndnotesBACKGROUND
1. Mack, V. (2015). New Orleans kids, working parents, and poverty. The Data Center. Retrieved from http://www.datacenterresearch.org/reports_analysis/new-orleans-kids-working-parents-and-poverty/
2. Plyer, A., Shrinath, N., & Mack, V. (2015). The New Orleans index at ten: Measuring greater New Orleans’ progress towards prosperity. The Data Center. Retrieved from http://www.datacenterresearch.org/reports_analysis/new-orleans-index-at-ten/

DATA C E N T E R R E S E A R C H . O R G 41
24. Behrman, R. E., & Butler, A. S (Eds.). (2007). Preterm Birth: Causes, Consequences, and Prevention. National Academies Press. Retrieved from http://www.ncbi.nlm.nih.gov/pubmed/20669423
25. March of Dimes Peristats. (2015). Retrieved from http://www.marchofdimes.org/peristats/ViewSubtopic.aspx-?reg=22071&top=2&stop=10&lev=1&obj=8&cmp=22&slev=5&sty=9999&eny=-1&chy=
26. Wildsmith, E., Barrt, M., Manlove, J., & Vaugh, B. (2013). Adolescent health highlight: Teen pregnancy and childbearing. Retrieved from http://www.childtrends.org/wp-content/uploads/2013/11/Pregnancy-and-Childbearing-updated-12-131.pdf
27. Ibid.
28. Annie E. Casey Kids Count Data Center. (2015). Teen birth rate: Ages 15-19. Retrieved from http://datacenter.kidscount.org/data/tables/1561-teen-birth-rate-ages-15-19?loc=20&loct=5#detailed/5/3220-3283/false/867,133,38,35,18/any/3329,7826
29. Child Welfare Information Gateway. (2013). Long-term consequences of child abuse and neglect.Washington, DC: U.S. Department of Health and Human Services, Children’s Bureau. Retrieved from https://www.childwelfare.gov/pubPDFs/long_term_consequences.pdf#page=7&view=Sum-mary
30. Ibid.
31. Committee on Child Maltreatment Research, Policy, and Practice for the Next Decade: Phase II; Board on Children, Youth, and Families; Com-mittee on Law and Justice; Institute of Medicine; National Research Council. (2014). Describing the problem. In Petersen, A., Joseph, J., & Feit, M. (Eds). New directions in child abuse and neglect research (pp.1-30). National Academies Press. Retrieved from http://www.ncbi.nlm.nih.gov/books/NBK195982/
32. Centers for Disease Control and Prevention. (2014). Child maltreatment: Facts at a glance. Retrieved from http://www.cdc.gov/violencepreven-tion/pdf/childmaltreatment-facts-at-a-glance.pdf
33. National Scientific Council on the Developing Child. (2005/2014). Excessive Stress Disrupts the Architecture of the Developing Brain: Working Paper 3. Updated Edition. http://www.developingchild.harvard.edu
34. Ibid.
35. National Center for Children in Poverty, (2014). Child poverty. Retrieved from http://www.nccp.org/topics/childpoverty.html
36. U.S. Census Bureau. (2015). Poverty thresholds. Retrieved from https://www.census.gov/hhes/www/poverty/data/threshld/
37. Yazejian, N., & Bryant, D. M. (2012). Educare Implementation Study Findings—August 2012. Chapel Hill: Frank Porter Graham Child Development Institute, UNC-CH. Retrieved from, http://www.educareschools.org/about/pdfs/Demonstrating-Results.pdf.
38. Shonkoff, J. P., & Phillips, D. (Ed.). (2000). From neurons to neighborhoods: The science of early childhood development. Washington, D.C.: Nation-al Academy Press. Retrieved from http://www.nap.edu/openbook.php?record_id=9824&page=R1
39. Offord Centre for Child Studies. (2012). School readiness to learn project: EDI factsheet. Retrieved September 28, 2013 from, http://www.offord-centre.com/readiness/EDI_factsheet.html.
40. Janus, M., Brinkman, S., Duku, E., Hertzman, C., Santos, R., Sayers, M., …, Walsh, C. (2007). The Early Development Instrument: A population-based measure for communities. A handbook on development, properties, and use. Toronto, CA: Offord Centre for Child Studies. Retrieved from http://www.offordcentre.com/readiness/pubs/2007_12_FINAL.EDI.HANDBOOK.pdf; Janus, M., Harren, T., Duku, E. (2004). Neighbourhood perspective on school readiness in kindergarten, academic testing in grade 3, and affluence levels. McMaster University Psychiatry Research Day. Retrieved from http://www.offordcentre.com/readiness/files/PUB.1.2004_Janus-Harren.pdf.
41. Louisiana Department of Education. (2015). Early childhood. Retrieved from http://www.louisianabelieves.com/early-childhood
42. Virginia Commonwealth University Center on Society and Health. (2014). Education: It matters more to health than ever before. Retrieved from http://societyhealth.vcu.edu/work/the-projects/education-it-matters-more-to-health-than-ever-before.html
43. U.S. Bureau of Labor Statistics< U.S. Department of Labor. (2015). Employment projections. Earnings and unemployment rates by educa-tional attainment. Retrieved from http://www.bls.gov/emp/ep_chart_001.htm; Bureau of Labor Statistics, U.S. Department of Labor, The Economics Daily, Unemployment rates by educational attainment in April 2015. Retrieved from http://www.bls.gov/opub/ted/2015/unemploy-ment-rates-by-educational-attainment-in-april-2015.htm; Pew Research Center. (2014). The rising cost of not going to college. Retrieved from http://www.pewsocialtrends.org/2014/02/11/the-rising-cost-of-not-going-to-college/
44. U.S. Census Bureau. (2015). American community survey and Puerto Rico community survey: 2014 subject definitions. Retrieved from http://www2.census.gov/programs-surveys/acs/tech_docs/subject_definitions/2014_ACSSubjectDefinitions.pdf
45. Pew Research Center. (2014). The rising cost of not going to college. Retrieved from http://www.pewsocialtrends.org/2014/02/11/the-rising-cost-of-not-going-to-college/
46. Ibid.
47. U.S. Bureau of Labor Statistics< U.S. Department of Labor. (2015). Employment projections. Earnings and unemployment rates by educa-tional attainment. Retrieved from http://www.bls.gov/emp/ep_chart_001.htm; Bureau of Labor Statistics, U.S. Department of Labor, The Economics Daily, Unemployment rates by educational attainment in April 2015. Retrieved from http://www.bls.gov/opub/ted/2015/unemploy-ment-rates-by-educational-attainment-in-april-2015.htm; Pew Research Center. (2014). The rising cost of not going to college. Retrieved from http://www.pewsocialtrends.org/2014/02/11/the-rising-cost-of-not-going-to-college/

The New Orleans Youth Index | December 201542
48. U.S. Census Bureau. (2015). American community survey and Puerto Rico community survey: 2014 subject definitions. Retrieved from http://www2.census.gov/programs-surveys/acs/tech_docs/subject_definitions/2014_ACSSubjectDefinitions.pdf
49. Child Trends Databank. (2014). Youth employment. Retrieved from http://www.childtrends.org/?indicators=youth-employment
50. U.S. Census Bureau. (2014). American community survey and Puerto Rico community survey: 2014 subject definitions. Retrieved from http://www2.census.gov/programs-surveys/acs/tech_docs/subject_definitions/2014_ACSSubjectDefinitions.pdf
51. Bridgeland, J. & Milano, J. (2012). Opportunity road: the promise and challenge of America’s forgotten youth. Baltimore, MD: Annie E. Casey Foundation. Retrieved from http://www.aecf.org/~/media/Pubs/Topics/Education/Other/OpportunityRoadthePromiseandChallengeofAmeri-casForfottenYouth/CEopportunityroad2012.pdf
52. Edelman, P., Holzer, H.J., Offner, P. (2005). Reconnecting disadvantaged young men: improving education and employment outcomes. Retrieved September 9, 2013 from, http://www.hewlett.org/uploads/files/ReconnectingDisadvantagedYoungMen.pdf
53. Sims, Patrick. (2015). Reconnecting opportunity youth: Data reference guide. Retrieved from http://www.coweninstitute.com/wp-content/up-loads/2015/03/Cowen_OY_Data_Guide_2015.pdf
54. Ibid.
55. Federal Interagency Forum on Child and Family Statistics. (2011). America’s children: Key national indicators of well-being. Retrieved from http://www.childstats.gov/americaschildren/eco3.asp
56. Child Trends. (2013). Secure parental employment. Retrieved from http://www.childtrends.org/?indicators=secure-parental-employment
57. U.S. Census Bureau. (2014). American community survey and Puerto Rico community survey: 2014 subject definitions. Retrieved from http://www2.census.gov/programs-surveys/acs/tech_docs/subject_definitions/2014_ACSSubjectDefinitions.pdf
58. The Boston Foundation. (2014). The Boston indicators project: Third grade reading proficiency. Retrieved from http://www.bostonindicators.org/indicators/education/4-8high-academic-achievement/4-8-2third-grade-reading-proficiency; The Annie E. Casey Foundation. (2013). Early Warn-ing Confirmed: A research update on third-grade reading. Baltimore, MD: Author. Retrieved from http://www.aecf.org/resources/early-warn-ing-confirmed/; Hanover Research. (2014). Critical academic indicators: What to look for in your students to ensure future success
59. Foley, E., Mishook, J., Thompson, J., Kubiak, M., Supovitz, J., & Rhude-Faust, M. K. (2008). Beyond test scores: leading indicators for education. Retrieved November 21, 2013 from, http://annenberginstitute.org/publication/beyond-test-scores-leading-indicators-education.
60. Louisiana Department of Education. (2007). Section 1: The integrated Louisiana education assessment program. Retrieved from http://www.doe.state.la.us/lde/uploads/11494.pdf
61. Louisiana Department of Education. (2015). DIBELS next. Retrieved from http://www.louisianabelieves.com/assessment/dibels-next
62. Ibid.
63. Dreilinger, D. (2013). Louisiana overhauling teaching goals, standardized tests in effort to raise the bar for students. Retrieved from http://www.nola.com/education/index.ssf/2013/03/louisiana_overhauling_teaching.html
64. The National Center for Public Policy and Higher Education. (2010). Beyond the rhetoric: Improving college readiness through coherent state policy. Retrieved from http://www.highereducation.org/reports/college_readiness/gap.shtml
65. National Center on Education and the Economy. (2013). What does it really mean to be college and work ready. Retrieved from http://www.ncee.org/wp-content/uploads/2013/05/NCEE_ExecutiveSummary_May2013.pdf
66. Partnership for Assessment of Readiness for College and Careers (PARCC). (2015). States: Participating states. Retrieved from http://www.parc-conline.org/about/states
67. Ibid.
68. Louisiana Department of Education. (2015). Parent guide to PARCC student reports. Retrieved from http://www.louisianabelieves.com/docs/default-source/family-support-toolbox-resources/parent-guide-to-parcc-student-reports.pdf?sfvrsn=2
69. Samuels, D. & Dreilinger, D. (2015). Common Core tests: About 1/3 of Louisiana pupils make ‘mastery’. The Times Picayune. Retrieved from http://www.nola.com/education/index.ssf/2015/10/about_a_third_of_louisiana_stu.html
70. Child Trends Databank. (2014). Student absenteeism. Retrieved from http://www.childtrends.org/?indicators=student-absenteeism
71. Ibid.
72. Ibid.
73. Louisiana State Legislature. (2015). RS 17:233. Retrieved from http://legis.la.gov/Legis/law.aspx?d=80325
74. Louisiana Department of Education. (n.d.). School performance score. Retrieved from http://www.louisianabelieves.com/accountability/school-perfor mance-scores
75. Louisiana Department of Education. (2014). Louisiana cohort graduation rate continues to increase. Retrieved from http://www.louisianabe-lieves.com/newsroom/news-releases/2014/07/11/louisiana-cohort-graduation-rate-continues-to-increase
76. Louisiana Department of Education. (2015). High school performance. Retrieved from http://www.louisianabelieves.com/docs/default-source/katrina/final-louisana-believes-v5-high-school-performance.pdf?sfvrsn=2

DATA C E N T E R R E S E A R C H . O R G 43
77. National Center for Education Statistics. (2014). Public high school four-year on-time graduation rates and event dropout rates: School years 2010-11 and 2011-12. Retrieved from http://nces.ed.gov/pubs2014/2014391/
78. Louisiana Department of Education. (2015). Title 28: Part LXXXIII: Bulletin 111-The Louisiana school, district, and state accountability system. Retrieved from http://doa.louisiana.gov/osr/lac/28v83/28v83.doc
79. U.S. Department of Education, National Center for Education Statistics. (1999). Immediate transition from high school to college. Retrieved from http://nces.ed.gov/pubs99/1999006.pdf
80. Ibid.
81. Pew Research Center. (2014). The rising cost of not going to college. Retrieved from http://www.pewsocialtrends.org/2014/02/11/the-rising-cost-of-not-going-to-college/
82. Ibid.
83. American Psychological Association. (2015). Effects of poverty, hunger, and homelessness on children and youth. Retrieved from http://www.apa.org/pi/families/poverty.aspx
84. Child Trends. (2015). Homeless children and youth. Retrieved from http://www.childtrends.org/?indicators=homeless-children-and-youth
85. Child Trends Databank. (2015). Infant, child, and teen mortality. Retrieved from http://www.childtrends.org/?indicators=in-fant-child-and-teen-mortality
86. Ibid.
87. Jutte, S. Bentley, H., Tallis, D., Mayes, J., Jetha, N., O’Hagin, O., Brookes, H., & McConnell. (2015) How safe are our children? The most comprehen-sive overview of child protection in the UK. Retrieved from http://www.nspcc.org.uk/globalassets/documents/research-reports/how-safe-chil-dren-2015-report.pdf
88. Swenson, D. (2015). New Orleans 2014 murders: Victims and case status. Retrieved from http://www.nola.com/crime/index.ssf/2015/01/vic-tims_list_and_status_of_201.html
89. Losen, D. & Skiba, R. (2010). Suspended education. Southern Poverty Law Center. Retrieved from http://www.splcenter.org/get-informed/publi-cations/suspended-education
90. Ibid.
91. Iselin, A.(2010). Research on school suspension. Retrieved from https://childandfamilypolicy.duke.edu/pdfs/familyimpact/2010/Suspension_Re-search_Brief_2010-04-27.pdf
92. Smith, E. J., & Harper, S. R. (2015). Disproportionate impact of K-12 school suspension and expulsion on Black students in southern states. Re-trieved from http://www.gse.upenn.edu/equity/sites/gse.upenn.edu.equity/files/publications/Smith_Harper_Report.pdf
93. Ibid.
94. Iselin, A.(2010). Research on school suspension. Retrieved from https://childandfamilypolicy.duke.edu/pdfs/familyimpact/2010/Suspension_Re-search_Brief_2010-04-27.pdf
95. Jones, K.R. & Perkins, D.F. (2005). Determining the quality of youth-adult relationships within community-based youth programs. Journal of Extension, 43 (5). Retrieved from http://www.joe.org/joe/2005october/a5.php; Wu, H-C, Weiss, J., Kornbluh, M., & Roddy, L. (2014). Youth-Adult partnership rubric: A tool for professional development and program evaluation in youth settings. East Lansing, MI: Michigan State University. Retrieved from http://cerc.msu.edu/yaprubric/
96. Chen, P., Li, E., Milner, S., & Pareja, A.(2014). Youth city? You decide: An assessment toolkit for youth to measure youth civic engagement. Re-trieved from http://www.youthcity.ca/sites/default/files/pdfs/CMNS-487-Youth-City-Report.pdf

Principal Author
VICKI MACK, Senior Research Fellow
Dr. Mack is an expert in developmental psychology and juvenile delin-quency. She has examined topics such as community-based programs designed to serve youth, the social and demographic factors associat-ed with juvenile delinquency, and juvenile offenders’ responsiveness to interventions. Vicki’s other research interests include health disparities, and the types and quality of adolescent friendships.
Vicki joined the Data Center after holding positions of statistician and data dissemination specialist for the U.S. Census Bureau, most recently in New Orleans. She previously held faculty positions in the psychology departments of Clark Atlanta University and the University of Michi-gan–Dearborn, where she taught various undergraduate psychology courses. Vicki also has seven years of direct service experience in the fields of juvenile delinquency, foster care, and developmental disabili-ties. Vicki has a MA and PhD from Wayne State University, and an MHA in healthcare administration from Bellevue University.The Data Center is the
most trusted resource for data
about greater New Orleans
and Southeast Louisiana. Since
1997, The Data Center has
been an objective partner in
bringing reliable, thoroughly
researched data to conversa-
tions about building a more
prosperous, inclusive, and
sustainable region.
The Data Center (formerly
known as the Greater New
Orleans Community Data
Center) became the local
authority for tracking post–Ka-
trina recovery with The New
Orleans Index, developed in
partnership with the Brookings
Institution.