the mental health of australians 2file/mhaust2.pdf · foreword the mental health of australians 2...
TRANSCRIPT
The Mental Health of Australians 2
Report on the 2007 National Survey of Mental Health and Wellbeing
Tim SladeAmy JohnstonMaree Teesson
Harvey WhitefordPhillip Burgess
Jane PirkisSuzy Saw
May 2009

ISBN: 1-74186-903-X
Online: 1-74186-904-8
Publications Number: P3 -5317
Copyright Statements:
Paper-based publications
(c) Commonwealth of Australia 2009
This work is copyright. Apart from any use as permitted under the Copyright Act 1968, no part may be reproduced by any process without prior written permission from the Commonwealth. Requests and inquiries concerning reproduction and rights should be addressed to the Commonwealth Copyright Administration, Attorney-General’s Department, Robert Garran Offices, National Circuit, Barton ACT 2600 or posted at http://www.ag.gov.au/cca
Internet sites
(c) Commonwealth of Australia 2009
This work is copyright. You may download, display, print and reproduce this material in unaltered form only (retaining this notice) for your personal, non-commercial use or use within your organisation. Apart from any use as permitted under the Copyright Act 1968, all other rights are reserved. Requests and inquiries concerning reproduction and rights should be addressed to Commonwealth Copyright Administration, Attorney-General’s Department, Robert Garran Offices, National Circuit, Barton ACT 2600 or posted at http://www.ag.gov.au/cca
Suggested reference:Slade, T., Johnston, A., Teesson, M., Whiteford, H., Burgess, P., Pirkis, J., Saw, S. (2009) The Mental Health of Australians 2. Report on the 2007 National Survey of Mental Health and Wellbeing. Department of Health and Ageing, Canberra.

FOREWORD
The Mental Health of Australians 2 provides a comprehensive summary of the results of the 2007 National Survey of Mental Health and Wellbeing. Despite the very different context from 1997, when the first national survey was conducted, the results are remarkably similar.
One in five Australians continued to experience mental illness. Just over one third had received services for their mental health problems and the majority of those that didn’t use services reported that they didn’t need them. Not enough people accessed mental health services – services that can and should be helping with their mental health problems. Mental illness also continued to place a large burden upon the community, especially those who care for others experiencing mental health problems. In short, these results do not provide the evidence of improvements in access to mental health services and the mental health of Australians that were anticipated given the increasing investment in mental health services and targeted initiatives over the previous decade.
The survey provides a wealth of information on mental disorders, their severity, associated suicidality, and comorbidity with other mental disorders and physical conditions, as well as information on the health services people use for mental health problems and their connections with family and friends. Understanding the complex interplay between these factors is essential in determining the extent to which the apparent lack of progress in the treatment of mental disorders is due to problems with access to services and whether other factors are preventing people seeking mental health care. This information is a key component of the evidence base that will guide our work in mental health more generally over the coming years.
Special thanks must be given to the Australian Bureau of Statistics’ staff and experts who assisted in the development and analysis of the survey and, most importantly, to each of the respondents, whose generosity in answering such a long, complex and often intensely personal survey has allowed this important new evidence to be gathered.
The Government has committed through the revised National Mental Health Policy 2008 and work on a new, fourth national mental health plan, to work with states and territories on mental health reforms. It continues its significant investment in improving the access of Australians to mental health services by funding an expanded range of services by general practitioners and allied health professionals though Medicare and by better utilising telephone and web-based services. The Government also remains committed to working to improve the evidence on which all good policy and service reforms should be based. The aim is to ensure that future mental health initiatives promote better and more timely access to mental health services targeted to people’s needs.
Nicola Roxon
Minister for Health
May 2009

The Mental Health of Australians 2 v
COnTEnTs
Foreword
2007 national survey of Mental Health and Wellbeing highlights ....................... xi
1 Introduction ......................................................................................................... 11.1 Mental disorders in the Australian population - setting the scene ................................. 1
1.2 The 2007 national survey of Mental Health and Wellbeing ............................................. 1
1.3 The sample ........................................................................................................................... 2
1.4 strengths and limitations of the survey ............................................................................. 3
1.5 scope of the report ............................................................................................................. 3
2 An overview of mental disorders in Australia .................................................. 52.1 Prevalence of mental disorders in the Australian population ......................................... 5
2.2 Prevalence of mental disorders in different population sub-groups .............................. 5
2.2.1 Sex and age ................................................................................................................. 5
2.2.2 Social and demographic characteristics ....................................................................... 6
2.2.2.1 Marital status .................................................................................................. 6
2.2.2.2 Labour force status ......................................................................................... 7
2.2.2.3 Education ...................................................................................................... 7
2.2.2.4 Country of birth ............................................................................................... 7
2.2.2.5 Homelessness ................................................................................................ 8
2.2.2.6 Incarceration ................................................................................................... 8
2.3 Impact of mental disorders ................................................................................................ 8
2.3.1 Days out of role ............................................................................................................ 8
2.3.2 Severity of mental disorders ......................................................................................... 9
2.3.3 Psychological distress .................................................................................................. 9
3 service use ........................................................................................................ 113.1 service use in the Australian population ......................................................................... 11
3.2 service use by people with 12-month mental disorders ............................................... 12
3.2.1 Sex and age profile of service users ........................................................................... 12
3.2.2 Service use by mental disorder class .......................................................................... 12
3.2.3 Medication use by mental disorder class .................................................................... 13
3.2.4 Service use by comorbidity of mental disorder classes ............................................... 13
3.2.5 Service use by severity of mental disorders ................................................................ 14
3.3 People with mental disorders who did not use services ............................................... 15
3.4 Perception of need for services ....................................................................................... 15
3.5 service providers and patterns of service use ............................................................... 16
3.5.1 Service providers ........................................................................................................ 16
3.5.2 Patterns of service use ............................................................................................... 17
The Mental Health of Australians 2vi
4 Affective disorders in Australia ....................................................................... 194.1 Prevalence of affective disorders in the Australian population .................................... 19
4.2 Prevalence of affective disorders in different population sub-groups ......................... 19
4.2.1 Sex and age ............................................................................................................... 19
4.2.2 Social and demographic characteristics ..................................................................... 20
4.3 Impact of affective disorders ........................................................................................... 21
4.3.1 Days out of role .......................................................................................................... 21
4.3.2 Interference with life .................................................................................................... 21
4.3.3 Psychological distress ................................................................................................ 22
4.4 service use by people with affective disorders .............................................................. 22
5 Anxiety disorders in Australia .......................................................................... 235.1 Prevalence of anxiety disorders in the Australian population ....................................... 23
5.2 Prevalence of anxiety disorders in different population sub-groups ........................... 24
5.2.1 Sex and age ............................................................................................................... 24
5.2.2 Social and demographic characteristics ..................................................................... 24
5.3 Impact of anxiety disorders .............................................................................................. 25
5.3.1 Days out of role ......................................................................................................... 25
5.3.2 Interference with life ................................................................................................... 26
5.3.3 Psychological distress ............................................................................................... 26
5.4 service use by people with anxiety disorders ................................................................ 27
6 substance use disorders in Australia ............................................................. 296.1 Prevalence of substance use disorders in the Australian population .......................... 29
6.2 Prevalence of substance use disorders in different population sub-groups .................. 30
6.2.1 Sex and age ............................................................................................................... 30
6.2.2 Social and demographic characteristics ..................................................................... 30
6.3 Impact of substance use disorders ................................................................................. 31
6.3.1 Days out of role .......................................................................................................... 31
6.3.2 Interference with life ................................................................................................... 32
6.3.3 Psychological distress ................................................................................................ 32
6.4 service use by people with substance use disorders .................................................... 32
7 Comorbidity ....................................................................................................... 357.1 Mental disorder comorbidity ........................................................................................... 35
7.1.1 Prevalence of mental disorder comorbidity by sex ...................................................... 35
7.2 Impact of comorbidity ....................................................................................................... 36
7.2.1 Severity ...................................................................................................................... 36
7.2.2 Days out of role ......................................................................................................... 37
7.3 Mental and physical disorder comorbidity ...................................................................... 38
7.3.1 Days out of role ......................................................................................................... 38
The Mental Health of Australians 2 vii
8 suicidality .......................................................................................................... 418.1 Prevalence in the Australian population .......................................................................... 41
8.2 Prevalence in different population sub-groups .............................................................. 41
8.2.1 Sex and age ............................................................................................................... 41
8.2.2 Social and demographic characteristics ..................................................................... 42
8.2.3 Suicidality in people with 12-month mental disorders ................................................. 43
8.2.4 Suicidality in people with comorbid 12-month mental disorders .................................. 44
8.3 Impact of suicidality .......................................................................................................... 44
8.3.1 Days out of role .......................................................................................................... 44
8.3.2 Psychological distress ................................................................................................ 45
8.4 service use ......................................................................................................................... 45
9 social networks ................................................................................................ 479.1 Contact and closeness with family members ................................................................. 47
9.2 Contact and closeness with friends ................................................................................ 48
10 Caregiving ......................................................................................................... 51
11 Methodological issues and comparison of findings ..................................... 5311.1 Estimating the true prevalence of mental disorders ...................................................... 53
11.2 Comparison with 1997 national survey of Mental Health and Wellbeing .................... 53
11.3 Comparison with other mental health surveys ............................................................... 54
11.4 Conclusions ....................................................................................................................... 54
Glossary ................................................................................................................... 55

The Mental Health of Australians 2viii
LIsT OF TAbLEs
Table 2-1: Prevalence of lifetime and 12-month mental disorders ........................................................... 5
Table 2-2: Prevalence of 12-month mental disorders by mental disorder class and sex ........................... 6
Table 2-3: Prevalence of 12-month mental disorders by sex, marital status, labour force status, education and country of birth. ............................................................................................... 7
Table 3-1: Service use by 12-month mental disorder class .................................................................... 13
Table 3-2: Medication use for mental health problems by 12-month mental disorder class .................... 13
Table 3-3: Service use by comorbidity of 12-month mental disorder classes ........................................ 13
Table 3-4: Service use by severity of 12-month mental disorders .......................................................... 14
Table 3-5: Perception of met need in people with 12-month mental disorders who used services ......... 16
Table 3-6: Perception of need for services in people with 12-month mental disorders who did not use services .......................................................................................................................... 16
Table 3-7: Health professionals consulted by 12-month mental disorder class ...................................... 17
Table 3-8: Patterns of service use by health professional category and 12-month mental disorder class 17
Table 4-1: Prevalence of 12-month affective disorders by affective disorder type and sex ..................... 19
Table 4-2: Prevalence of 12-month affective disorders by sex, marital status, labour force status, education and country of birth .............................................................................................. 20
Table 4-3: Days out of role by type of 12-month affective disorder ......................................................... 21
Table 4-4: Proportion of people with severe or very severe interference across different life domains by type of 12-month affective disorder .................................................................................. 21
Table 4-5: Proportion of people with each psychological distress (K10) level by type of 12-month affective disorder ................................................................................................................. 22
Table 4-6: Service use by type of 12-month affective disorder ............................................................... 22
Table 5-1: Prevalence of 12-month anxiety disorders by anxiety disorder type and sex ......................... 23
Table 5-2: Prevalence of 12-month anxiety disorders by sex, marital status, labour force status, education and country of birth .............................................................................................. 25
Table 5-3: Days out of role by type of 12-month anxiety disorder .......................................................... 25
Table 5-4: Proportion of people with severe or very severe interference across different life domains by type of 12-month anxiety disorder .................................................................................... 26
Table 5-5: Proportion of people with each psychological distress (K10) level by type of 12-month anxiety disorder .................................................................................................................... 27
Table 5-6: Service use by type of 12-month anxiety disorder ................................................................. 27
Table 6-1: Prevalence of 12-month substance use disorders by substance use disorder type and sex .. 29
Table 6-2: Prevalence of 12-month substance use disorders by sex, marital status, labour force status, education and country of birth ................................................................................... 31
Table 6-3: Days out of role by type of 12-month substance use disorder ............................................... 31
Table 6-4: Proportion of people with severe or very severe interference across different life domains by type of 12-month substance dependence disorder .......................................................... 32
Table 6-5: Proportion of people with each psychological distress (K10) level by type of 12-month substance use disorder ........................................................................................................ 32
Table 6-6: Service use by type of 12-month substance use disorder ..................................................... 33
The Mental Health of Australians 2 ix
Table 7-1: Prevalence of 12-month mental disorder comorbidity in the total population and in people with 12-month mental disorders ................................................................................ 35
Table 7-2: Days out of role by comorbidity of 12-month mental disorder classes ................................... 37
Table 7-3: Prevalence of chronic physical conditions in people with 12-month mental disorders by sex . 38
Table 7-4: Age-standardised prevalence of 12-month mental disorders in people with National Health Priority Area (NHPA) chronic physical conditions by sex ............................................. 38
Table 7-5: Days out of role by comorbidity of 12-month mental disorders and National Health Priority Area (NHPA) chronic physical conditions ................................................................... 39
Table 8-1: Prevalence of lifetime and 12-month suicidality ...................................................................... 41
Table 8-2: Prevalence of 12-month suicidality by sex ............................................................................. 42
Table 8-3: Prevalence of 12-month suicidality by marital status, labour force status, education and country of birth ..................................................................................................................... 43
Table 8-4: Prevalence of 12-month suicidality by 12-month mental disorder class ................................. 44
Table 8-5: Prevalence of 12-month suicidality by 12-month mental disorder comorbidity ....................... 44
Table 8-6: Days out of role by 12-month suicidality ................................................................................ 45
Table 8-7: Proportion of people with each psychological distress (K10) level by type of suicidality .......... 45
Table 8-8: Service use by type of suicidality ........................................................................................... 45
Table 9-1: Prevalence of 12-month mental disorders in people with different amounts of contact with family members .................................................................................................................... 47
Table 9-2: Prevalence of 12-month mental disorders in people with different numbers of family members to whom they feel close ........................................................................................ 48
Table 9-3: Prevalence of 12-month mental disorders in people with different levels of contact with friends .................................................................................................................................. 48
Table 9-4: Prevalence of 12-month mental disorders in people with different numbers of friends to whom they feel close ............................................................................................................ 49

The Mental Health of Australians 2x
LIsT OF FIGuREs
Figure 2-1: Prevalence of 12-month mental disorders by age and sex ..................................................... 6
Figure 2-2: Days out of role by 12-month mental disorder class .............................................................. 8
Figure 2-3: Proportion of people with 12-month mental disorders by mental disorder class and severity level .......................................................................................................................... 9
Figure 2-4: Proportion of people with 12-month mental disorders by mental disorder class and psychological distress (K10) level ......................................................................................... 10
Figure 3-1: Proportion of people using services for mental health problems in the previous 12 months by mental disorder status .................................................................................................... 11
Figure 3-2: Service use by people with 12-month mental disorders by age and sex .............................. 12
Figure 3-3: Service use by single and comorbid 12-month mental disorder classes ............................... 14
Figure 3-4: Service use by 12-month mental disorder class and severity ............................................... 15
Figure 4-1: Prevalence of 12-month affective disorders by age and sex ................................................. 20
Figure 5-1: Prevalence of 12-month anxiety disorders by age and sex .................................................. 24
Figure 6-1: Prevalence of 12-month substance use disorders by age and sex ....................................... 30
Figure 7-1: Prevalence of comorbid 12-month affective, anxiety and substance use disorders in males ... 36
Figure 7-2: Prevalence of comorbid 12-month affective, anxiety and substance use disorders in females ............................................................................................................................... 36
Figure 7-3: Proportion of people with single and comorbid 12-month mental disorder classes by severity level ........................................................................................................................ 37
Figure 8-1: Prevalence of suicidality by age and sex .............................................................................. 42
Figure 10-1: Caregiving by health status of relatives .............................................................................. 51
The Mental Health of Australians 2 xi
2007 nATIOnAL suRVEY OF MEnTAL HEALTH AnD WELLbEInG HIGHLIGHTs
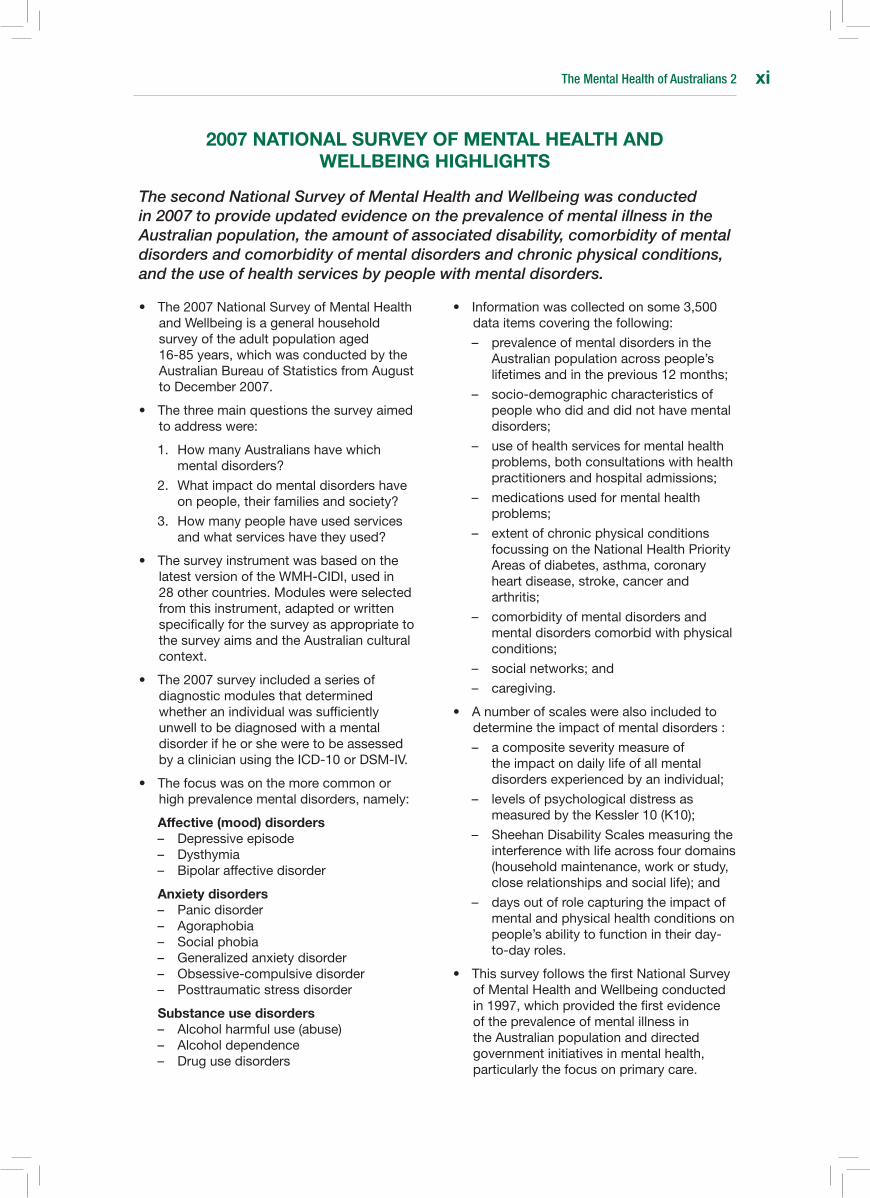
The second National Survey of Mental Health and Wellbeing was conducted in 2007 to provide updated evidence on the prevalence of mental illness in the Australian population, the amount of associated disability, comorbidity of mental disorders and comorbidity of mental disorders and chronic physical conditions, and the use of health services by people with mental disorders.
• The2007NationalSurveyofMentalHealthandWellbeingisageneralhouseholdsurveyoftheadultpopulationaged16-85years,whichwasconductedbytheAustralianBureauofStatisticsfromAugusttoDecember2007.
• Thethreemainquestionsthesurveyaimedtoaddresswere:
1. HowmanyAustralianshavewhichmentaldisorders?
2. Whatimpactdomentaldisordershaveonpeople,theirfamiliesandsociety?
3. Howmanypeoplehaveusedservicesandwhatserviceshavetheyused?
• ThesurveyinstrumentwasbasedonthelatestversionoftheWMH-CIDI,usedin28othercountries.Moduleswereselectedfromthisinstrument,adaptedorwrittenspecificallyforthesurveyasappropriatetothesurveyaimsandtheAustralianculturalcontext.
• The2007surveyincludedaseriesofdiagnosticmodulesthatdeterminedwhetheranindividualwassufficientlyunwelltobediagnosedwithamentaldisorderifheorsheweretobeassessedbyaclinicianusingtheICD-10orDSM-IV.
• Thefocuswasonthemorecommonorhighprevalencementaldisorders,namely:
Affective (mood) disorders– Depressiveepisode– Dysthymia– Bipolaraffectivedisorder
Anxiety disorders– Panicdisorder– Agoraphobia– Socialphobia– Generalizedanxietydisorder– Obsessive-compulsivedisorder– Posttraumaticstressdisorder
substance use disorders– Alcoholharmfuluse(abuse)– Alcoholdependence– Drugusedisorders
• Informationwascollectedonsome3,500dataitemscoveringthefollowing:
– prevalenceofmentaldisordersintheAustralianpopulationacrosspeople’slifetimesandintheprevious12months;
– socio-demographiccharacteristicsofpeoplewhodidanddidnothavementaldisorders;
– useofhealthservicesformentalhealthproblems,bothconsultationswithhealthpractitionersandhospitaladmissions;
– medicationsusedformentalhealthproblems;
– extentofchronicphysicalconditionsfocussingontheNationalHealthPriorityAreasofdiabetes,asthma,coronaryheartdisease,stroke,cancerandarthritis;
– comorbidityofmentaldisordersandmentaldisorderscomorbidwithphysicalconditions;
– socialnetworks;and
– caregiving.
• Anumberofscaleswerealsoincludedtodeterminetheimpactofmentaldisorders:
– acompositeseveritymeasureoftheimpactondailylifeofallmentaldisordersexperiencedbyanindividual;
– levelsofpsychologicaldistressasmeasuredbytheKessler10(K10);
– SheehanDisabilityScalesmeasuringtheinterferencewithlifeacrossfourdomains(householdmaintenance,workorstudy,closerelationshipsandsociallife);and
– daysoutofrolecapturingtheimpactofmentalandphysicalhealthconditionsonpeople’sabilitytofunctionintheirday-to-dayroles.
• ThissurveyfollowsthefirstNationalSurveyofMentalHealthandWellbeingconductedin1997,whichprovidedthefirstevidenceoftheprevalenceofmentalillnessintheAustralianpopulationanddirectedgovernmentinitiativesinmentalhealth,particularlythefocusonprimarycare.
The Mental Health of Australians 2xii
PREVALEnCE OF MEnTAL DIsORDERs In THE AusTRALIAn POPuLATIOn
The 2007 National Survey of Mental Health and Wellbeing provides information on the prevalence of mental disorders in the Australian population.The prevalence of mental disorders is the proportion of people in the population who meet criteria for a diagnosis of a mental disorder at a given point in time.
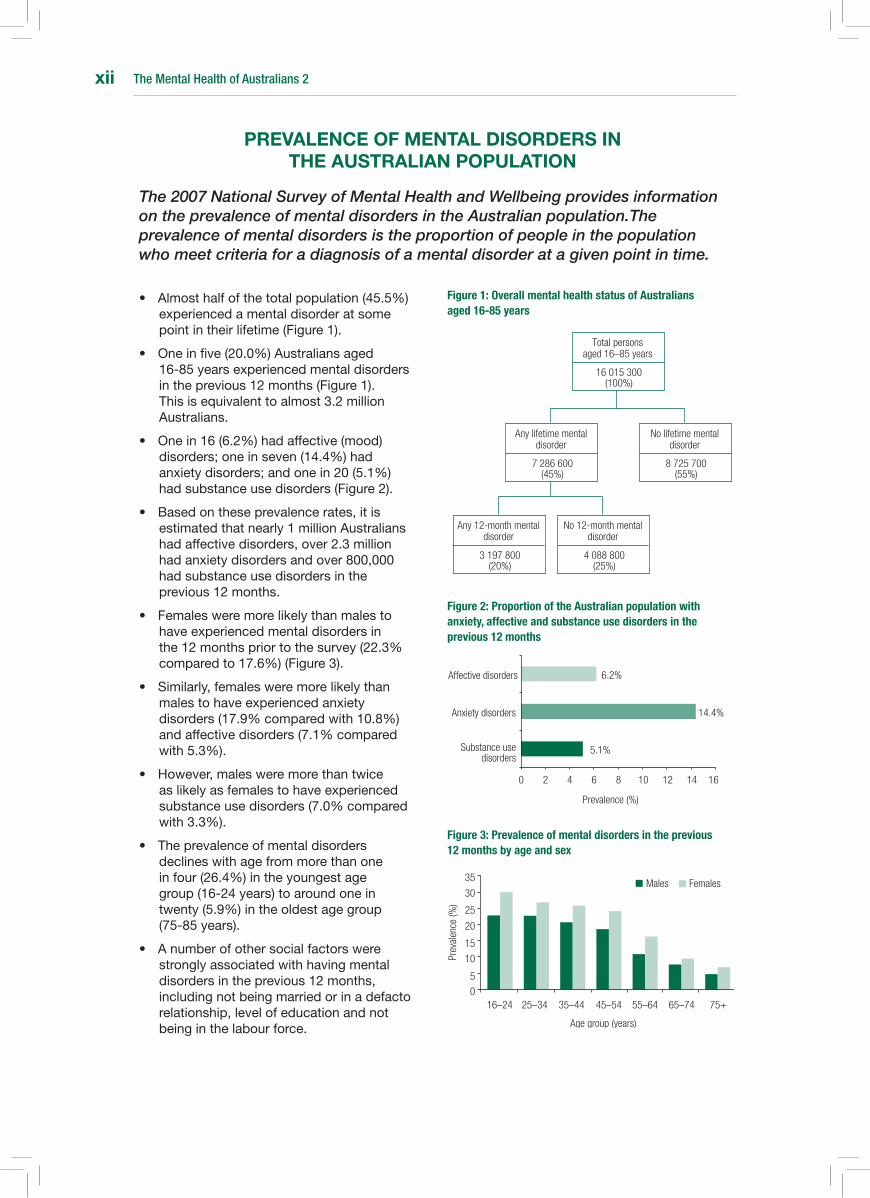
• Almosthalfofthetotalpopulation(45.5%)experiencedamentaldisorderatsomepointintheirlifetime(Figure1).
• Oneinfive(20.0%)Australiansaged16-85yearsexperiencedmentaldisordersintheprevious12months(Figure1).Thisisequivalenttoalmost3.2millionAustralians.
• Onein16(6.2%)hadaffective(mood)disorders;oneinseven(14.4%)hadanxietydisorders;andonein20(5.1%)hadsubstanceusedisorders(Figure2).
• Basedontheseprevalencerates,itisestimatedthatnearly1millionAustralianshadaffectivedisorders,over2.3millionhadanxietydisordersandover800,000hadsubstanceusedisordersintheprevious12months.
• Femalesweremorelikelythanmalestohaveexperiencedmentaldisordersinthe12monthspriortothesurvey(22.3%comparedto17.6%)(Figure3).
• Similarly,femalesweremorelikelythanmalestohaveexperiencedanxietydisorders(17.9%comparedwith10.8%)andaffectivedisorders(7.1%comparedwith5.3%).
• However,malesweremorethantwiceaslikelyasfemalestohaveexperiencedsubstanceusedisorders(7.0%comparedwith3.3%).
• Theprevalenceofmentaldisordersdeclineswithagefrommorethanoneinfour(26.4%)intheyoungestagegroup(16-24years)toaroundoneintwenty(5.9%)intheoldestagegroup(75-85years).
• Anumberofothersocialfactorswerestronglyassociatedwithhavingmentaldisordersintheprevious12months,includingnotbeingmarriedorinadefactorelationship,levelofeducationandnotbeinginthelabourforce.
Figure 1: Overall mental health status of Australians aged 16-85 years
Figure 2: Proportion of the Australian population with anxiety, affective and substance use disorders in the previous 12 months
Figure 3: Prevalence of mental disorders in the previous 12 months by age and sex
Total personsaged 16–85 years
16 015 300(100%)
Any lifetime mental disorder
7 286 600(45%)
No lifetime mental disorder
8 725 700(55%)
Any 12-month mental disorder
3 197 800(20%)
No 12-month mental disorder
4 088 800(25%)
Males Females
16–24 25–34 35–44 45–54 55–64 65–74 75+0
5
10
15
20
25
30
35
Age group (years)
Prev
alen
ce (%
)
5.1%
14.4%
6.2%
0 2 4 6 8 10 12 14 16
Substance usedisorders
Anxiety disorders
Affective disorders
Prevalence (%)

The Mental Health of Australians 2 xiii
sERVICE usE In THE AusTRALIAn POPuLATIOn
Mental health care in Australia is provided through a combination of primary health care services principally by general practitioners, specialised public mental health services managed by states and territories, private sector services delivered by psychiatrists and psychologists, and hospital services.
• Ofthetotalpopulation,11.9%usedhealthservicesformentalhealthproblemsintheprevious12months.Three-fifthsofusershadmentaldisordersintheprevious12monthsandone-fifthhadlifetimedisorders(Figure4).
• Notallpeoplewhousedserviceswereassessedashavingamentaldisorder.Manywillhavesoughtcareformentalhealthproblems,butwerenotsufficientlyunwelltobediagnosedwithamentaldisorder.Otherswillhavehaddisordersnotcoveredbythesurvey,suchasschizophreniaorpersonalitydisorders.
• Onethird(34.9%)ofpeoplewith12-monthmentaldisordersusedhealthservicesformentalhealthproblemsintheprevious12months.Thisisequivalentto1.1millionAustraliansseekinghelpformentalhealthproblems.
• Bycontrastabouttwothirdsor2.2millionpeoplewithmentaldisordersdidnotreportusingservicesfortheirmentalhealthproblems.Around90%ofthesereportedthattheydidnotneedservices.
• Peoplewithaffectivedisorders(includingdepression)weremorelikelythanpeoplewithanxietyorsubstanceusedisorderstouseservicesfortheirmentalhealthproblems(Figure5).
• Femalesweremorelikelytouseservicesformentalhealthproblemsthanmales(40.7%comparedwith27.5%)andthiswastrueforallagegroups(Figure6).
• Amongthosewith12-monthmentaldisorderswhousedservices,generalpractitionerswerethemostcommonlyconsultedgroupofhealthcareprofessionals(70.8%),followedbypsychologists(37.7%).
• 28.9%ofpeoplewith12-monthmentaldisorderswhousedservicessawageneralpractitioneronly,buttwothirds(64.2%)sawamentalhealthprofessionalaloneorincombinationwithageneralpractitioner.
Figure 4: Proportion of population who used services for mental health problems in the previous 12 months by mental disorder status
Figure 5: Proportion of people who used services for mental health problems by mental disorder class
Figure 6: Service use among people with 12-month mental disorders by sex and age
Lifetime mental disorder 19.8%
No mental disorder 21.5%
Mental disorder in the previous 12 months58.7%
24.0%
37.8%
58.6%
0 10 20 30 40 50 70
Substance use disorders
Anxiety disorders
Affective disorders
Proportion of people using services (%)
60
Males Females
16–24 25–34 35–44 45–54 55–64 65–74 75–85
Serv
ice
use
(%)
0
10
20
30
40
50
Age group (years)
The Mental Health of Australians 2xiv
AFFECTIVE, AnXIETY AnD subsTAnCE usE DIsORDERs In THE AusTRALIAn POPuLATIOn
The survey was designed to estimate the prevalence of common mental disorders defined according to the International Classification of Diseases 10th Revision (ICD-10). Three broad groups or classes of mental disorders were included in the survey – affective, anxiety and substance use disorders.
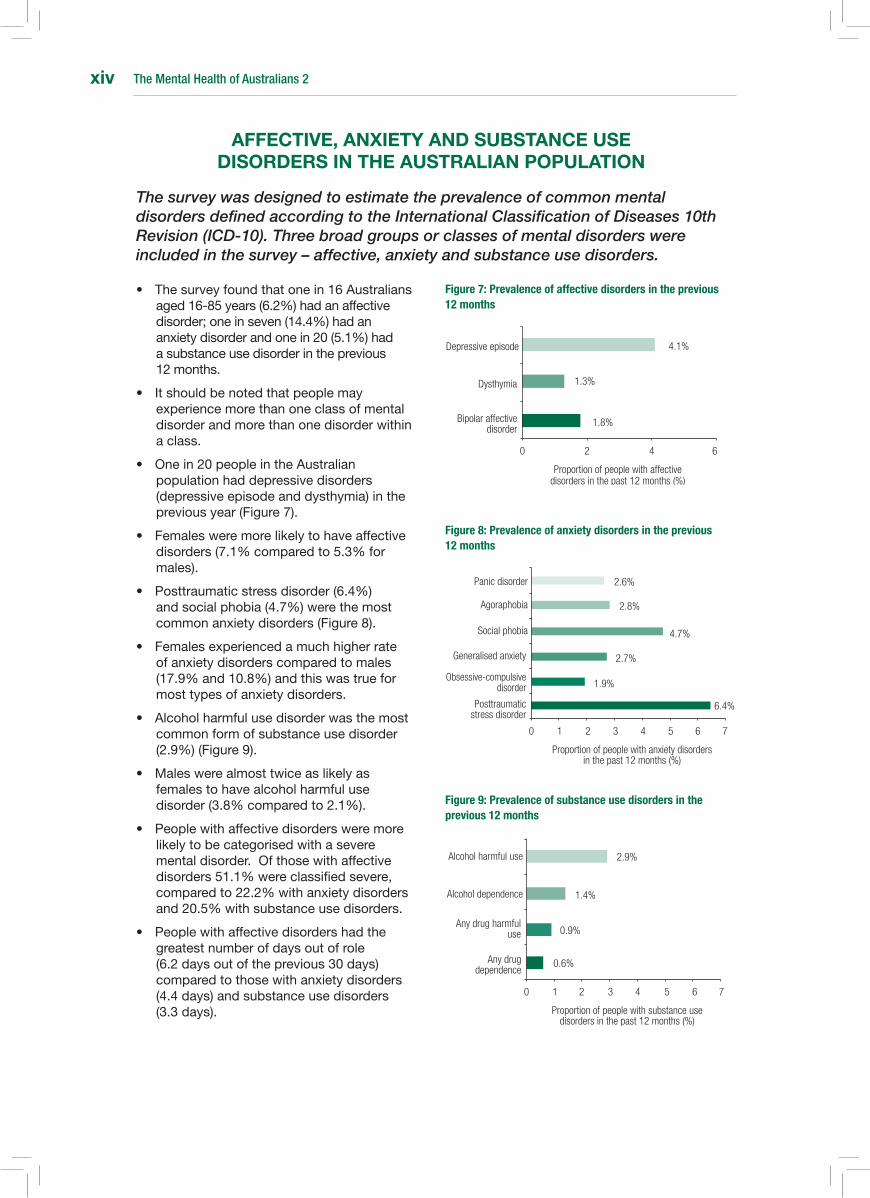
• Thesurveyfoundthatonein16Australiansaged16-85years(6.2%)hadanaffectivedisorder;oneinseven(14.4%)hadananxietydisorderandonein20(5.1%)hadasubstanceusedisorderintheprevious12months.
• Itshouldbenotedthatpeoplemayexperiencemorethanoneclassofmentaldisorderandmorethanonedisorderwithinaclass.
• Onein20peopleintheAustralianpopulationhaddepressivedisorders(depressiveepisodeanddysthymia)inthepreviousyear(Figure7).
• Femalesweremorelikelytohaveaffectivedisorders(7.1%comparedto5.3%formales).
• Posttraumaticstressdisorder(6.4%)andsocialphobia(4.7%)werethemostcommonanxietydisorders(Figure8).
• Femalesexperiencedamuchhigherrateofanxietydisorderscomparedtomales(17.9%and10.8%)andthiswastrueformosttypesofanxietydisorders.
• Alcoholharmfulusedisorderwasthemostcommonformofsubstanceusedisorder(2.9%)(Figure9).
• Maleswerealmosttwiceaslikelyasfemalestohavealcoholharmfulusedisorder(3.8%comparedto2.1%).
• Peoplewithaffectivedisordersweremorelikelytobecategorisedwithaseverementaldisorder.Ofthosewithaffectivedisorders51.1%wereclassifiedsevere,comparedto22.2%withanxietydisordersand20.5%withsubstanceusedisorders.
• Peoplewithaffectivedisordershadthegreatestnumberofdaysoutofrole(6.2daysoutoftheprevious30days)comparedtothosewithanxietydisorders(4.4days)andsubstanceusedisorders(3.3days).
Figure 7: Prevalence of affective disorders in the previous 12 months
Figure 8: Prevalence of anxiety disorders in the previous 12 months
Figure 9: Prevalence of substance use disorders in the previous 12 months
1.8%
1.3%
4.1%
0 2 4 6
Bipolar affective disorder
Dysthymia
Depressive episode
Proportion of people with affective disorders in the past 12 months (%)
6.4%
1.9%
4.7%
0 2 4 7
Posttraumatic stress disorder
Generalised anxiety
Social phobia
Proportion of people with anxiety disorders in the past 12 months (%)
61 3 5
Panic disorder
Agoraphobia
Obsessive-compulsive disorder
2.7%
2.8%
2.6%
0.6%
0.9%
1.4%
0 2 4 7
Any drug dependence
Any drug harmful use
Alcohol dependence
Proportion of people with substance use disorders in the past 12 months (%)
Alcohol harmful use
1 3 5 6
2.9%
The Mental Health of Australians 2 xv
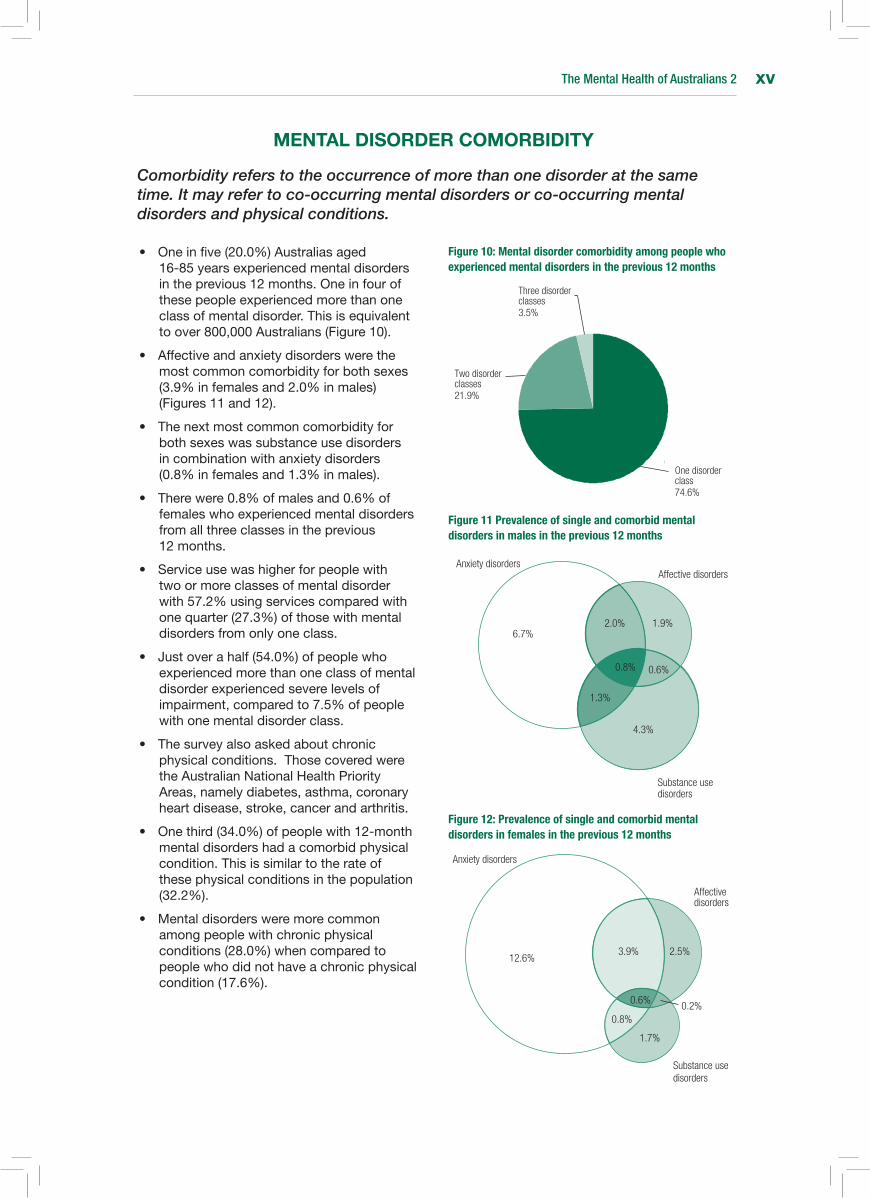
MEnTAL DIsORDER COMORbIDITY
Comorbidity refers to the occurrence of more than one disorder at the same time. It may refer to co-occurring mental disorders or co-occurring mental disorders and physical conditions.
• Oneinfive(20.0%)Australiasaged16-85yearsexperiencedmentaldisordersintheprevious12months.Oneinfourofthesepeopleexperiencedmorethanoneclassofmentaldisorder.Thisisequivalenttoover800,000Australians(Figure10).
• Affectiveandanxietydisorderswerethemostcommoncomorbidityforbothsexes(3.9%infemalesand2.0%inmales)(Figures11and12).
• Thenextmostcommoncomorbidityforbothsexeswassubstanceusedisordersincombinationwithanxietydisorders(0.8%infemalesand1.3%inmales).
• Therewere0.8%ofmalesand0.6%offemaleswhoexperiencedmentaldisordersfromallthreeclassesintheprevious12months.
• Serviceusewashigherforpeoplewithtwoormoreclassesofmentaldisorderwith57.2%usingservicescomparedwithonequarter(27.3%)ofthosewithmentaldisordersfromonlyoneclass.
• Justoverahalf(54.0%)ofpeoplewhoexperiencedmorethanoneclassofmentaldisorderexperiencedseverelevelsofimpairment,comparedto7.5%ofpeoplewithonementaldisorderclass.
• Thesurveyalsoaskedaboutchronicphysicalconditions.ThosecoveredweretheAustralianNationalHealthPriorityAreas,namelydiabetes,asthma,coronaryheartdisease,stroke,cancerandarthritis.
• Onethird(34.0%)ofpeoplewith12-monthmentaldisordershadacomorbidphysicalcondition.Thisissimilartotherateofthesephysicalconditionsinthepopulation(32.2%).
• Mentaldisordersweremorecommonamongpeoplewithchronicphysicalconditions(28.0%)whencomparedtopeoplewhodidnothaveachronicphysicalcondition(17.6%).
Figure 10: Mental disorder comorbidity among people who experienced mental disorders in the previous 12 months
Figure 11 Prevalence of single and comorbid mental disorders in males in the previous 12 months
Figure 12: Prevalence of single and comorbid mental disorders in females in the previous 12 months
1.9%2.0%
0.6%0.8%
6.7%
1.3%
4.3%
Substance use disorders
Affective disordersAnxiety disorders
Substance use disorders
Affective disorders
Anxiety disorders
12.6%2.5%3.9%
0.6%
0.8%0.2%
1.7%
Two disorder classes 21.9%
Three disorder classes3.5%
One disorder class 74.6%

The Mental Health of Australians 2xvi
suICIDALITY
The term suicidality covers suicidal ideation (serious thoughts about taking one’s own life), suicide plans and suicide attempts. People who experience suicidal ideation and make suicide plans are at increased risk of suicide attempts, and people who experience all forms of suicidal thoughts and behaviours are at greater risk of completing suicide.
• Atsomepointintheirlifetime,over2.1millionAustraliansaged16-85yearshadseriousthoughtsabouttakingtheirownlife;over600,000madeasuicideplan;andover500,000attemptedsuicide(Figure13).
• Femalesweremorelikelytobesuicidalthanmales,withsignificantlyhigherratesofsuicidalideationintheprevious12months(2.7%and1.9%).Suicideplansandattemptsalsotendedtobehigherforfemales.
• Thesefindingsareincontrasttothedataoncompletedsuicides,whichshowthatmalesarethreetofourtimesmorelikelythanfemalestodiebysuicide.
• Youngfemalesweremostsuicidal(5.1%offemalesaged16-24years)andtheprevalenceofsuicidalitydecreasedsignificantlywithage.
• Therewaslittlevariationinsuicidalityacrosstheagegroupsformales(Figure14).
• Almostoneinten(8.6%)peoplewith12-monthmentaldisordersreportedbeingsuicidalintheprevious12months.Thisisoverthreetimestherateinthegeneralpopulation(8.3%comparedto2.3%).
• Peopleexperiencingaffectivedisorderswereatgreaterriskofsuicidalitythanpeopleexperiencinganxietyorsubstanceusedisorders(17.4%comparedwith9.1%and10.9%)(Figure15).
• Serviceusewasrelativelyhighamongpeoplewhoattemptedsuicideintheprevious12months(73.4%)andbypeoplewhomadeasuicideplan(68%).
• Althoughserviceusewashighforthosewhoreportedsuicidality,oneinfourpeoplewhomadeasuicideattemptdidnotaccessservicesformentalhealthproblemsintheprevious12months.
Figure 13: Lifetime prevalence of suicidality in Australians aged 16-85 years
Figure 14: Prevalence of suicidality in the previous 12 months by sex and age
Figure 15: Suicidality among people experiencing mental disorders in the previous 12 month
3.3%
4.0%
13.3%
0 3 5 8 10 13 15
Suicide attempt
Suicide plan
Suicidal ideation
Proportion of people who experienced suicidality at some point in their lifetime (%)
Males Females
16–24 25–34 35–44 45–54 55–64 65–74 75+
Prev
alen
ce (%
)
0
1
2
3
4
5
6
Age group (years)
10.9%
9.1%
17.4%
0 5 10 15 20
Substance use disorder
Anxiety disorder
Affective disorder
Proportion of people with mental disorders who were suicidal in the previous 12 months (%)
The Mental Health of Australians 2 xvii
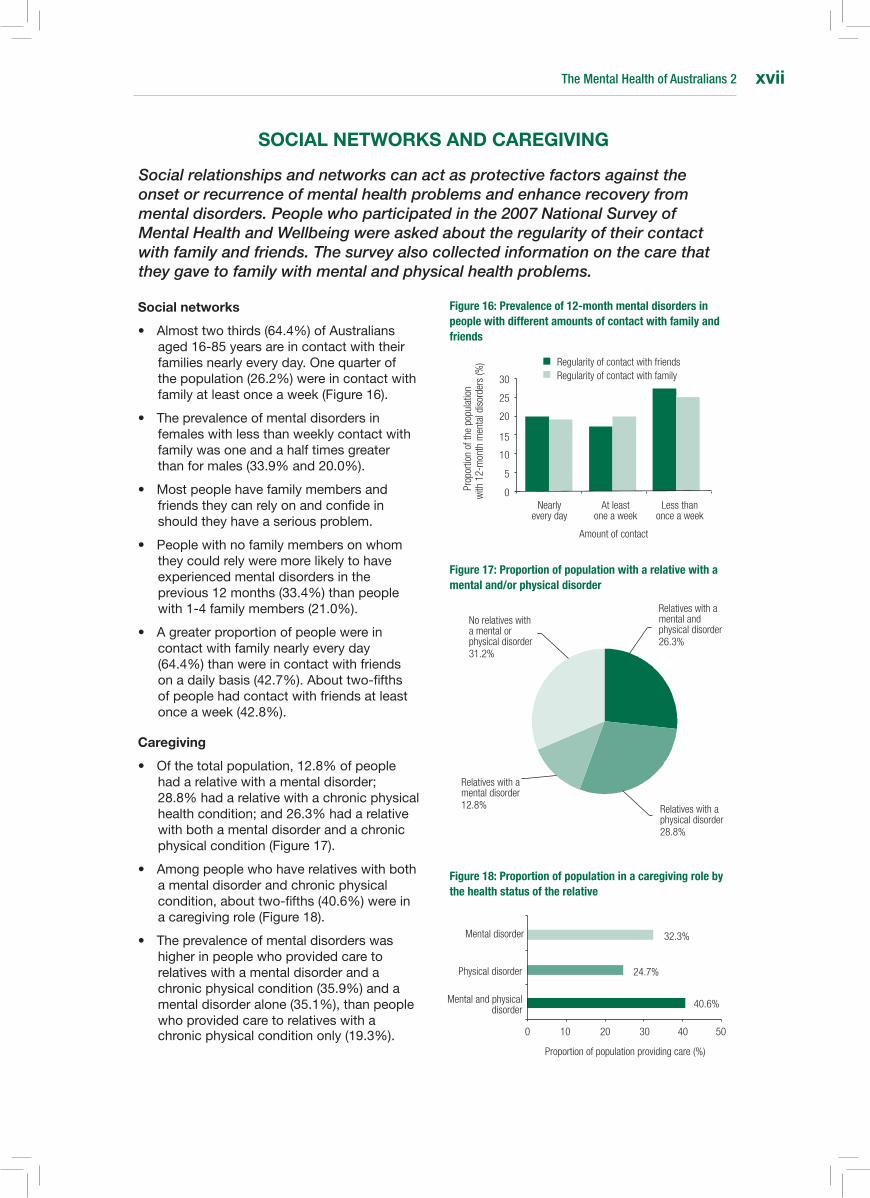
sOCIAL nETWORKs AnD CAREGIVInG
Social relationships and networks can act as protective factors against the onset or recurrence of mental health problems and enhance recovery from mental disorders. People who participated in the 2007 National Survey of Mental Health and Wellbeing were asked about the regularity of their contact with family and friends. The survey also collected information on the care that they gave to family with mental and physical health problems.
social networks
• Almosttwothirds(64.4%)ofAustraliansaged16-85yearsareincontactwiththeirfamiliesnearlyeveryday.Onequarterofthepopulation(26.2%)wereincontactwithfamilyatleastonceaweek(Figure16).
• Theprevalenceofmentaldisordersinfemaleswithlessthanweeklycontactwithfamilywasoneandahalftimesgreaterthanformales(33.9%and20.0%).
• Mostpeoplehavefamilymembersandfriendstheycanrelyonandconfideinshouldtheyhaveaseriousproblem.
• Peoplewithnofamilymembersonwhomtheycouldrelyweremorelikelytohaveexperiencedmentaldisordersintheprevious12months(33.4%)thanpeoplewith1-4familymembers(21.0%).
• Agreaterproportionofpeoplewereincontactwithfamilynearlyeveryday(64.4%)thanwereincontactwithfriendsonadailybasis(42.7%).Abouttwo-fifthsofpeoplehadcontactwithfriendsatleastonceaweek(42.8%).
Caregiving
• Ofthetotalpopulation,12.8%ofpeoplehadarelativewithamentaldisorder;28.8%hadarelativewithachronicphysicalhealthcondition;and26.3%hadarelativewithbothamentaldisorderandachronicphysicalcondition(Figure17).
• Amongpeoplewhohaverelativeswithbothamentaldisorderandchronicphysicalcondition,abouttwo-fifths(40.6%)wereinacaregivingrole(Figure18).
• Theprevalenceofmentaldisorderswashigherinpeoplewhoprovidedcaretorelativeswithamentaldisorderandachronicphysicalcondition(35.9%)andamentaldisorderalone(35.1%),thanpeoplewhoprovidedcaretorelativeswithachronicphysicalconditiononly(19.3%).
Figure 16: Prevalence of 12-month mental disorders in people with different amounts of contact with family and friends
Figure 17: Proportion of population with a relative with a mental and/or physical disorder
Figure 18: Proportion of population in a caregiving role by the health status of the relative
0
Amount of contact
Nearly every day
Prop
ortio
n of
the
popu
latio
n w
ith 1
2-m
onth
men
tal d
isor
ders
(%)
At least one a week
Less than once a week
5
10
15
20
25
30
Regularity of contact with friendsRegularity of contact with family
Relatives with a mental and physical disorder 26.3%
Relatives with a physical disorder 28.8%
Relatives with a mental disorder 12.8%
No relatives with a mental or physical disorder 31.2%
40.6%
24.7%
32.3%
0 10 20 40 50
Mental and physical disorder
Physical disorder
Mental disorder
Proportion of population providing care (%)
30

The Mental Health of Australians 2xviii
The Mental Health of Australians 2 1
1 InTRODuCTIOn
1.1 Mental disorders in the Australian population - setting the scene
When the first National Survey of Mental Health and Wellbeing was conducted in 1997 there were no data that could be used to estimate the number of people in Australia with mental disorders. There was little idea of the disability associated with mental illness, the services that people accessed and how many people were untreated. Evidence from surveys in other countries (primarily from the United States and the United Kingdom) suggested that mental disorders were relatively common, were associated with significant disability and that less than half of people with mental disorders sought help for their problems. The 1997 survey answered these basic questions within an Australian context.
Many other countries have since invested in national surveys to answer these same questions and provide the evidence base for policy and program development targeted at improving mental health outcomes. Like Australia, at least 28 other countries have undertaken these surveys as part of the World Mental Health Survey Initiative, using the World Mental Health Survey Initiative version of the Composite International Diagnostic Interview (WMH-CIDI). These surveys have focussed on the adult population and on the more common or high prevalence mental disorders, which can be effectively identified through this survey method.
Since 1997 there have been substantial changes in the way that Australians perceive mental illness and in their knowledge and expectations of mental health services. There have also been significant changes in the way that services are provided. Funding has increased for public specialised mental health services. Prompted in part by the findings of the 1997 survey, there has been an increased focus on identification and treatment of mental disorders by primary care professionals, particularly general practitioners. An expanded range of services for the coordinated treatment of people with mental disorders by general practitioners and psychologists is now funded through Medicare, the Australian system providing universal access to medical, optometrical and hospital services. Access to mental health services, however, is still not considered adequate and significant additional investments, such as through the Council of Australian Government’s National Action Plan on Mental Health 2006-2011, continue to provide additional funding for these.
1.2 The 2007 national survey of Mental Health and Wellbeing
The 2007 National Survey of Mental Health and Wellbeing was designed to update the evidence on mental health in Australia, with a particular focus on service use information. Like the 1997 survey, the three main questions the survey aimed to address were:
1. How many Australians have which mental disorders?
2. What impact do mental disorders have on people, their families and society?
3. How many people have used services and what services have they used?
The survey instrument was based on the WMH-CIDI. Modules were selected from this instrument, adapted or written specifically for the Australian survey to align with the survey aims and to fit the Australian cultural context.
The survey was designed to estimate the prevalence of common mental disorders defined according to clinical diagnostic criteria, as directed by both the International Classification of Diseases 10th Revision (ICD-10) and the Diagnostic and Statistical Manual of Mental Disorders Fourth Edition (DSM-IV). Three broad classes of mental disorders were included in the survey, namely affective, anxiety and substance use disorders. These cover a wide range of common mental disorders as follows:
• Affectivedisorders-mild,moderateandseveredepression,dysthymia,andbipolaraffectivedisorder;
• Anxietydisorders-panicdisorder,agoraphobia,socialphobia,generalizedanxietydisorder,obsessive-compulsivedisorderandposttraumaticstressdisorder;and
The Mental Health of Australians 22
• Substanceusedisorders-abuseorharmfuluseanddependenceonalcohol,cannabis,opioids,sedatives and stimulants.
The information collected through the diagnostic modules was processed through complex algorithms to determine whether the respondents met diagnostic thresholds for the mental disorders included in the survey. The diagnostic methods implemented by the WMH-CIDI instrument have been validated to ensure that individuals with a WMH-CIDI diagnosis are sufficiently unwell to be diagnosed with the given mental disorder if they were assessed by a clinician. This represents the latest innovation in diagnostic assessment for the common mental disorders within populations.
The assessment of service use was a key component of the 2007 survey. The content of the service use module was specifically developed for this survey. Information on general health care was collected, as well as more specific information on service use and medication taken for mental health problems. Collection of this information in a dedicated mental health survey enables examination of service use and medication in relation to specific mental disorders. Information on perceived needs for help with mental health problems was also collected, that is, firstly whether people’s needs for services were being met and, secondly, whether they recognised that they might need services that they were not receiving.
Functioning and disability were assessed using a number of standardised measures. The World Health Organisation Disability Assessment Schedule (WHO-DAS) and the Australian Bureau of Statistics’ Short Form Disability Module reflect the concept of disability as described in the International Classification of Functioning, Disability and Health and provide comparability with international and Australian national surveys. Sheehan Disability Scales were used to examine the interference with life in a number of domains (home, work or study, close relationships and social life) in relation to each mental disorder. Questions about days out of role, which assess the impact of mental disorders on day-to-day activities, were also asked in relation to specific disorders and, more generally, about all health problems.
The survey also collected information on the following:
• levelsofpsychologicaldistressusingtheKessler10scale(K10),astandardisedquestionnairecommonlyusedinAustralia,includingintheNationalHealthSurveys,andinternationally;
• theAssessmentofQualityofLife(AQoL)tomeasuretheburdenofdiseasethroughquestionsonillness, independence, social relationships, physical senses and psychological wellbeing1;
• chronicphysicalconditionsandriskfactorsforpoorphysicalhealth;
• socialnetworks;and
• provisionofcaretofamilyforphysicalandmentalhealthproblems.
1.3 The sample
The sample was representative of people aged 16-85 years who were usual residents of private dwellings across Australia. People living in very remote areas and in non-private dwellings, such as hotels, motels, hostels, hospitals and nursing homes, were excluded.
Dwellings were selected at random using a stratified, multistage area sampling technique.
To improve the reliability of estimates for the younger (16-24 years) and older (65-85 years) age groups, these groups were given a higher chance of selection in the household person selection process.
Interviews were conducted between August and December 2007. Proxy and foreign language interviews were not conducted. Interviews took an average of 90 minutes to complete.
The projected Australian adult population represented by the sample was 16,015,033. Of the eligible dwellings selected, there were 8,841 fully-responding households, representing a 60% response rate.
1 Data from the AQoL was not available at the time of publication.
The Mental Health of Australians 2 3
1.4 strengths and limitations of the survey
The 2007 National Survey of Mental Health and Wellbeing provides estimates of the prevalence of common mental disorders in the Australian general population. It also provides detailed information on the impact of these disorders and use of health services for mental health problems.
Use of the WMH-CIDI as the base instrument for the survey capitalised on the extensive methodological testing and development invested in this instrument and also facilitates international comparability. Adaptations to the instrument were made to improve its fit within the Australian context. Standardised measures were included to allow comparisons with other Australian national surveys and service use questions were written to be relevant to the Australian health system.
The WMH-CIDI instrument assesses mental disorders across the lifetime. Data on the age of onset of mental disorders, when treatment was first sought and when symptoms were last experienced were all collected. These provide important information on the timing of these events in relation to each other, but are unable to be used to determine the causes of disorders.
The survey does not attempt to detect less common or low prevalence mental disorders, such as schizophreniaandotherpsychoticdisorders,somatoformdisorders,eatingdisorders,impulse-controldisorders and personality disorders. It also did not cover dementia. Surveys with tailored sampling strategies and, in some cases, clinician or other specifically skilled interviewers are required to obtain useful information on these mental disorders. Good estimates for these disorders would also usually require sampling of non-private dwellings. Interview length and consequent factors, in particular the response burden, also restricted the number of mental disorders that could be included.
The survey sampling strategy and response rate have important implications for the reliability of estimates for sub-groups in the population. As a household survey, homeless people, people resident in nursing homes, hostels, and hospices and those in prison or other corrective service facilities were not surveyed. Although these groups comprise a relatively small proportion of the total Australian adult population, it is known that the prevalence of mental disorders is higher in these groups.
The 60% response rate of the 2007 survey was lower than expected, given the 78% response rate in 1997. A follow-up study of non-respondents was conducted by the Australian Bureau of Statistics to determine the effects of the non-response bias. This revealed that there is possible underestimation in the prevalence of mental disorders for men and for young people. However, this underestimation is likely to be small and the results presented in this report are considered to be representative of the Australian population.
1.5 scope of the report
In summary, the data contained in this report present a broad overview of the important interactions between mental disorder status (defined according to ICD-10 diagnostic criteria), associated demographic characteristics and other factors, such as suicidality, comorbid physical conditions, social networks and use of health services. Further detailed analyses of the data will be required to gain a better understanding of these complex relationships and the potential moderating role of perceived need for care. The results of these analyses have the potential for providing vital information on the service use patterns of people with mental disorders and the implications of this for the delivery of mental health services.

The Mental Health of Australians 24
The Mental Health of Australians 2 5
2 An OVERVIEW OF MEnTAL DIsORDERs In AusTRALIA
2.1 Prevalence of mental disorders in the Australian population
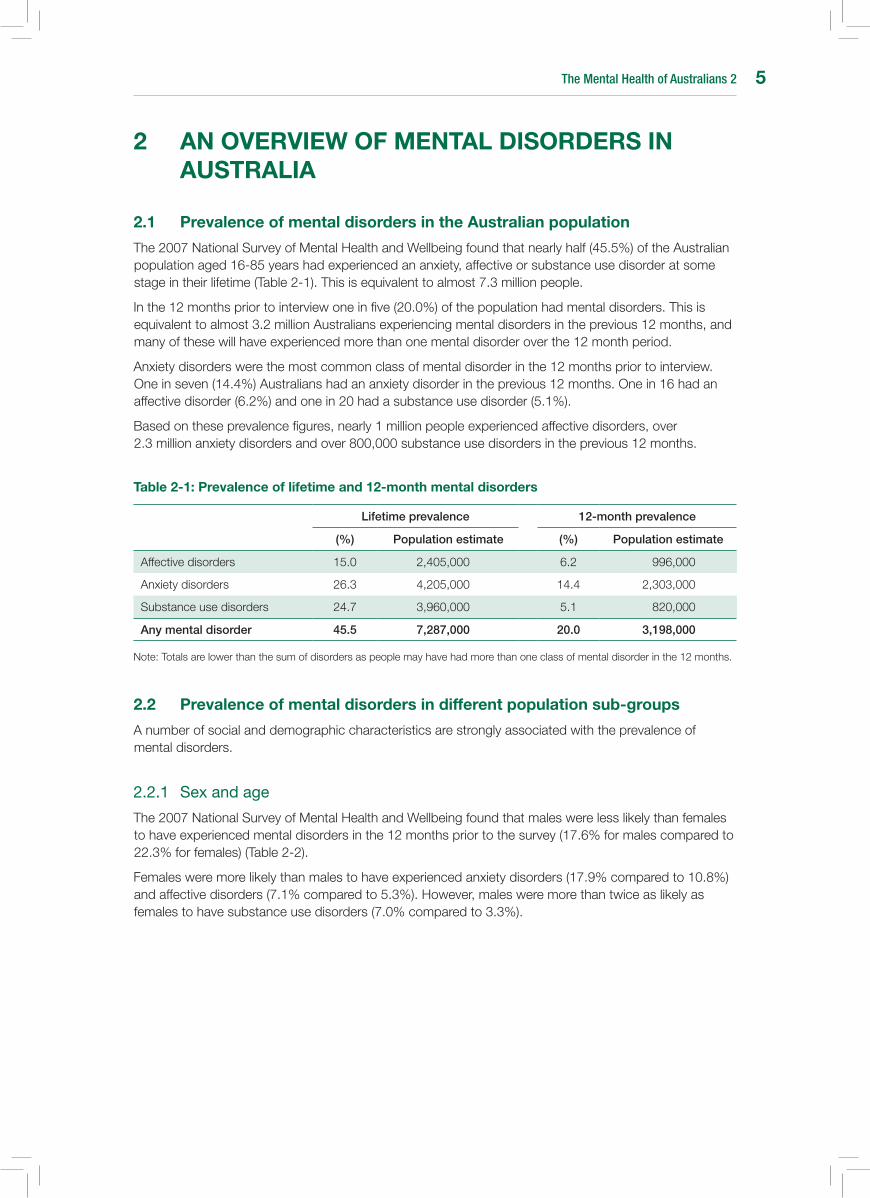
The 2007 National Survey of Mental Health and Wellbeing found that nearly half (45.5%) of the Australian population aged 16-85 years had experienced an anxiety, affective or substance use disorder at some stage in their lifetime (Table 2-1). This is equivalent to almost 7.3 million people.
In the 12 months prior to interview one in five (20.0%) of the population had mental disorders. This is equivalent to almost 3.2 million Australians experiencing mental disorders in the previous 12 months, and many of these will have experienced more than one mental disorder over the 12 month period.
Anxiety disorders were the most common class of mental disorder in the 12 months prior to interview. One in seven (14.4%) Australians had an anxiety disorder in the previous 12 months. One in 16 had an affective disorder (6.2%) and one in 20 had a substance use disorder (5.1%).
Based on these prevalence figures, nearly 1 million people experienced affective disorders, over 2.3 million anxiety disorders and over 800,000 substance use disorders in the previous 12 months.
Table 2-1: Prevalence of lifetime and 12-month mental disorders
Lifetime prevalence 12-month prevalence
(%) Population estimate (%) Population estimate
Affective disorders 15.0 2,405,000 6.2 996,000
Anxiety disorders 26.3 4,205,000 14.4 2,303,000
Substance use disorders 24.7 3,960,000 5.1 820,000
Any mental disorder 45.5 7,287,000 20.0 3,198,000
Note: Totals are lower than the sum of disorders as people may have had more than one class of mental disorder in the 12 months.
2.2 Prevalence of mental disorders in different population sub-groups
A number of social and demographic characteristics are strongly associated with the prevalence of mental disorders.
2.2.1 Sexandage
The 2007 National Survey of Mental Health and Wellbeing found that males were less likely than females to have experienced mental disorders in the 12 months prior to the survey (17.6% for males compared to 22.3% for females) (Table 2-2).
Females were more likely than males to have experienced anxiety disorders (17.9% compared to 10.8%) and affective disorders (7.1% compared to 5.3%). However, males were more than twice as likely as females to have substance use disorders (7.0% compared to 3.3%).
The Mental Health of Australians 26
Table 2-2: Prevalence of 12-month mental disorders by mental disorder class and sex
Male (%) Female (%)
Affective disorders 5.3 7.1
Anxiety disorders 10.8 17.9
Substance use disorders 7.0 3.3
Any mental disorder 17.6 22.3
Note: Totals are lower than the sum of disorders as people may have had more than one class of mental disorder in the 12 months.
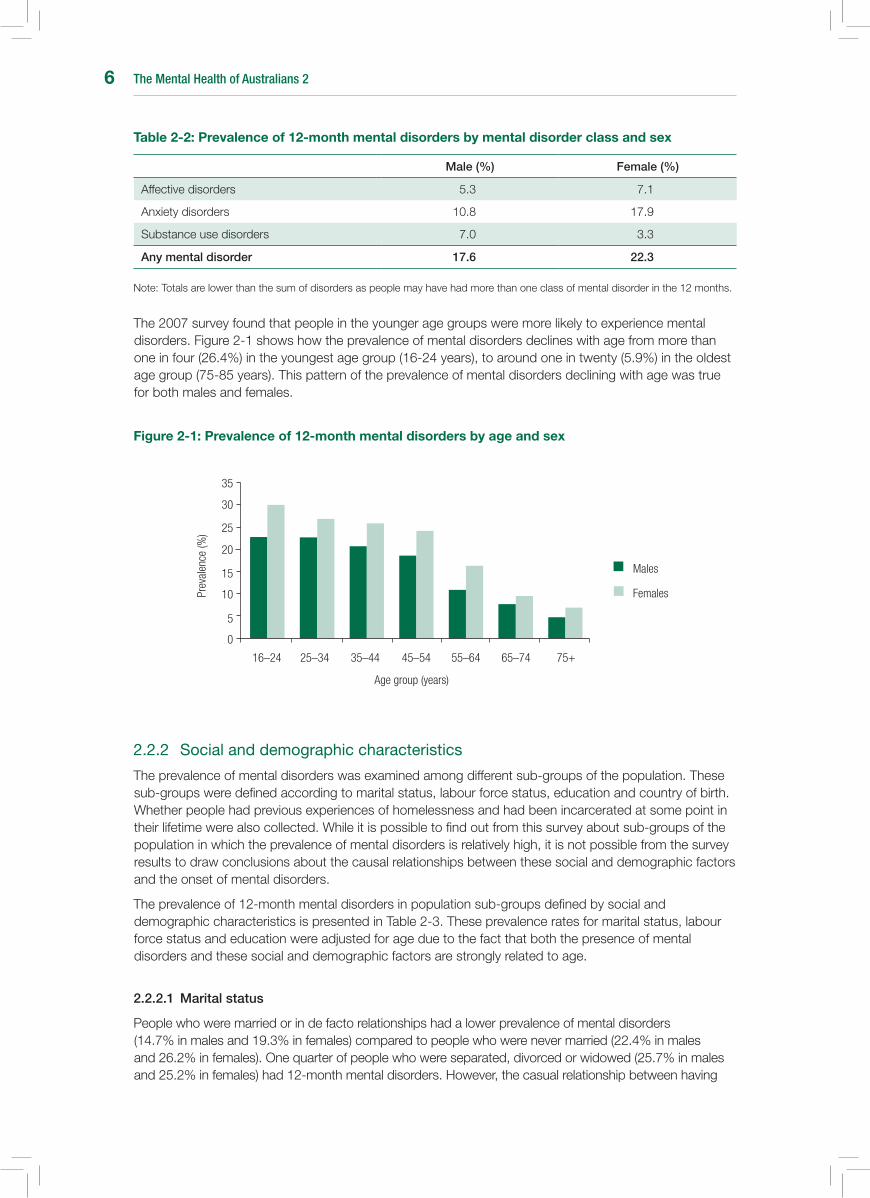
The 2007 survey found that people in the younger age groups were more likely to experience mental disorders. Figure 2-1 shows how the prevalence of mental disorders declines with age from more than one in four (26.4%) in the youngest age group (16-24 years), to around one in twenty (5.9%) in the oldest age group (75-85 years). This pattern of the prevalence of mental disorders declining with age was true for both males and females.
Figure 2-1: Prevalence of 12-month mental disorders by age and sex
2.2.2 Socialanddemographiccharacteristics
The prevalence of mental disorders was examined among different sub-groups of the population. These sub-groups were defined according to marital status, labour force status, education and country of birth. Whether people had previous experiences of homelessness and had been incarcerated at some point in their lifetime were also collected. While it is possible to find out from this survey about sub-groups of the population in which the prevalence of mental disorders is relatively high, it is not possible from the survey results to draw conclusions about the causal relationships between these social and demographic factors and the onset of mental disorders.
The prevalence of 12-month mental disorders in population sub-groups defined by social and demographic characteristics is presented in Table 2-3. These prevalence rates for marital status, labour force status and education were adjusted for age due to the fact that both the presence of mental disorders and these social and demographic factors are strongly related to age.
2.2.2.1 Marital status
People who were married or in de facto relationships had a lower prevalence of mental disorders (14.7% in males and 19.3% in females) compared to people who were never married (22.4% in males and 26.2% in females). One quarter of people who were separated, divorced or widowed (25.7% in males and 25.2% in females) had 12-month mental disorders. However, the casual relationship between having
16–24 25–34 35–44 45–54 55–64 65–74 75+
Prev
alen
ce (%
)
0
5
10
15
20
25
30
35
Females
Males
Age group (years)

The Mental Health of Australians 2 7
mental disorders and people’s marital status is not possible to determine from the survey. People with mental disorders may be less likely to marry or the stress of divorce or separation may impact on people’s mental health.
2.2.2.2 Labour force status
People who were employed had the lowest prevalence of mental disorders (18.7%). However, the prevalence of mental disorders was similar for unemployed people and those not in the labour force (25.8 and 26.8% respectively). Those not in the labour force cover a broad range of people, including people in caregiving roles not in employment, retired people and those on long-term disability and sickness benefits.
The exact causal nature of this association is not possible to determine from the survey. The presence of mental disorders may make it more difficult to find and maintain employment, while the stress of job loss may trigger the onset or exacerbate the symptoms of a mental disorder.
2.2.2.3 Education
The prevalence of mental disorders was higher among those with lower levels of education, particularly for females. The prevalence of mental disorders was 24.9% for those who did not complete school compared to 20.2% for those with school qualifications only and 19.5% for those with post-school qualifications.
2.2.2.4 Country of birth
People who were born in Australia had a higher prevalence of mental disorders (19.5% in males and 24.0% in females) compared to those born overseas. The prevalence of mental disorders in people born in other English-speaking countries was 17.7% for males and 19.9% for females. However, the prevalence of mental disorders was much lower for people from non-English speaking countries (8.4% in males and 16.2% in females).
The exact nature of this relationship is difficult to determine and may be explained in part by what is termed the ‘healthy migrant effect’. People who successfully migrate are more likely to be physically healthier than the remainder of the population. This may also be true for mental disorders.
Table 2-3: Prevalence of 12-month mental disorders by sex, marital status, labour force status, education and country of birth.
Males (%)
Females (%)
Persons (%)
Marital status
Married/De facto
Separated/Divorced/Widowed
Never married
14.7
25.7
22.4
19.3
25.2
26.2
17.3
25.7
24.3
Labour force status
Employed
Unemployed
Not in the labour force
17.7
23.9
23.9
19.5
26.6
28.3
18.7
25.8
26.8
Education
Post-school qualification
School qualification only
Did not complete school
17.6
16.0
22.9
21.5
25.1
26.7
19.5
20.2
24.9
Country of birth
Australia
Other English-speaking country
Non-English speaking country
19.5
17.7
8.4
24.0
19.9
16.2
21.8
18.7
12.6
Note: Numbers presented for marital status, labour force status and education are age-standardised.
The Mental Health of Australians 28
2.2.2.5 Homelessness
Three percent of the total population living in private households reported that they had been homeless at some point in their life. The prevalence of 12-month mental disorders was over two and a half times higher (53.6%) in this group compared to the general population (20.0%). While homelessness is often associated with psychotic illness and substance use disorders, affective disorders and anxiety disorders were also found to be significantly higher among people who reported prior homelessness (27.7% and 39.4% respectively) than the general population (6.2% and 14.4% respectively).
2.2.2.6 Incarceration
Just over two percent (2.4%) of the total population reported being in jail, prison or a correctional facility at some point in their lifetime. People who reported a previous history of incarceration were twice as likely (41.1%) to have had mental disorders in the previous 12 months when compared to the general population (20.0%).
Affective disorders were three times higher among people with a history of incarceration compared to the general population (19.3% compared to 6.2%), anxiety disorders twice as high (27.5% compared to 14.4%) and substance use disorders four times higher (22.8% compared to 5.1%).
2.3 Impact of mental disorders
One of the key aims of the survey was to determine the impact of mental disorders on the Australian population - that is how disabling mental disorders are and how they affect people’s functioning and day-to-day lives. A number of measures were included in the survey to provide this information. These include days out of role, measures of the severity of mental disorders and a measure of psychological distress, the Kessler 10 scale (K10).
2.3.1 Daysoutofrole
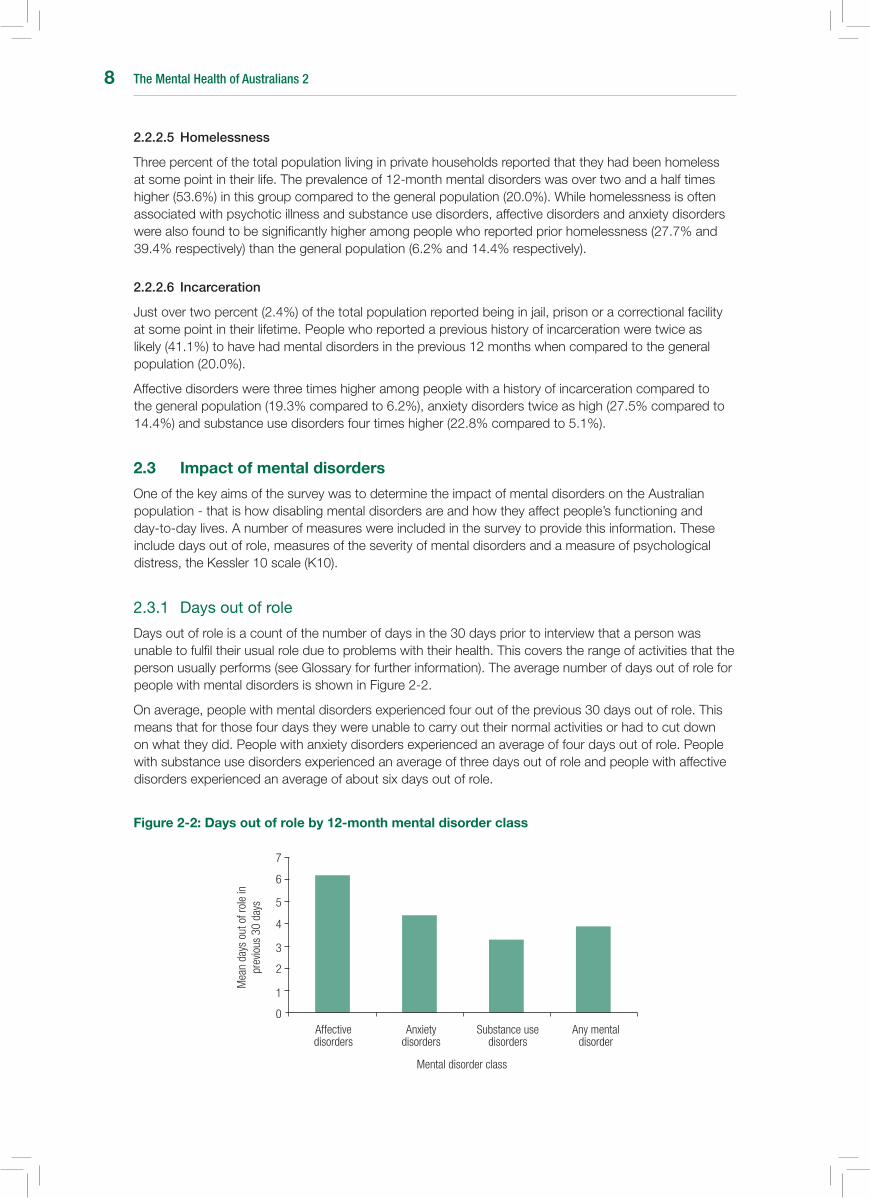
Days out of role is a count of the number of days in the 30 days prior to interview that a person was unable to fulfil their usual role due to problems with their health. This covers the range of activities that the person usually performs (see Glossary for further information). The average number of days out of role for people with mental disorders is shown in Figure 2-2.
On average, people with mental disorders experienced four out of the previous 30 days out of role. This means that for those four days they were unable to carry out their normal activities or had to cut down on what they did. People with anxiety disorders experienced an average of four days out of role. People with substance use disorders experienced an average of three days out of role and people with affective disorders experienced an average of about six days out of role.
Figure 2-2: Days out of role by 12-month mental disorder class
Affective disorders
0
1
2
3
4
5
6
7
Mea
n da
ys o
ut o
f rol
e in
pr
evio
us 3
0 da
ys
Anxiety disorders
Substance use disorders
Any mental disorder
Mental disorder class

The Mental Health of Australians 2 9
2.3.2 Severityofmentaldisorders
The severity of impairment associated with mental illness has important implications for the treatment of mental disorders, determining access to some services.
The measure of severity used in the survey summarises the impact of all the mental disorders experienced in a 12-month period on a person’s daily life and categorises this impact as severe, moderate or mild. For additional information on severity refer to the Glossary.
In terms of the total population, 4.1% or over 650,000 people had severe mental disorders in the previous 12 months, 6.6% or over one million people had moderate mental disorders and 9.3% or almost one and a half million people had mild mental disorders.
Of the one in five (20.0%) Australians aged 16-85 years who experienced mental disorders in the previous 12 months, one-fifth (20.5%) were classified as severe, one third (33.2%) were classified as moderate and just under half (46.3%) were classified as mild.
People with affective disorders were more likely to be categorised as having severe mental disorders compared to people with anxiety or substance use disorders (Figure 2-3). Among people with affective disorders, half (51.1%) were classified as severe, compared to just over one-fifth (22.2%) with anxiety disorders and one-fifth (20.6%) with substance use disorders. One in ten (10.2%) people with affective disorders had mild mental disorders, compared to 43.8% of people with anxiety disorders and 54.6% of people with substance use disorders.
Figure 2-3: Proportion of people with 12-month mental disorders by mental disorder class and severity level
2.3.3 Psychologicaldistress
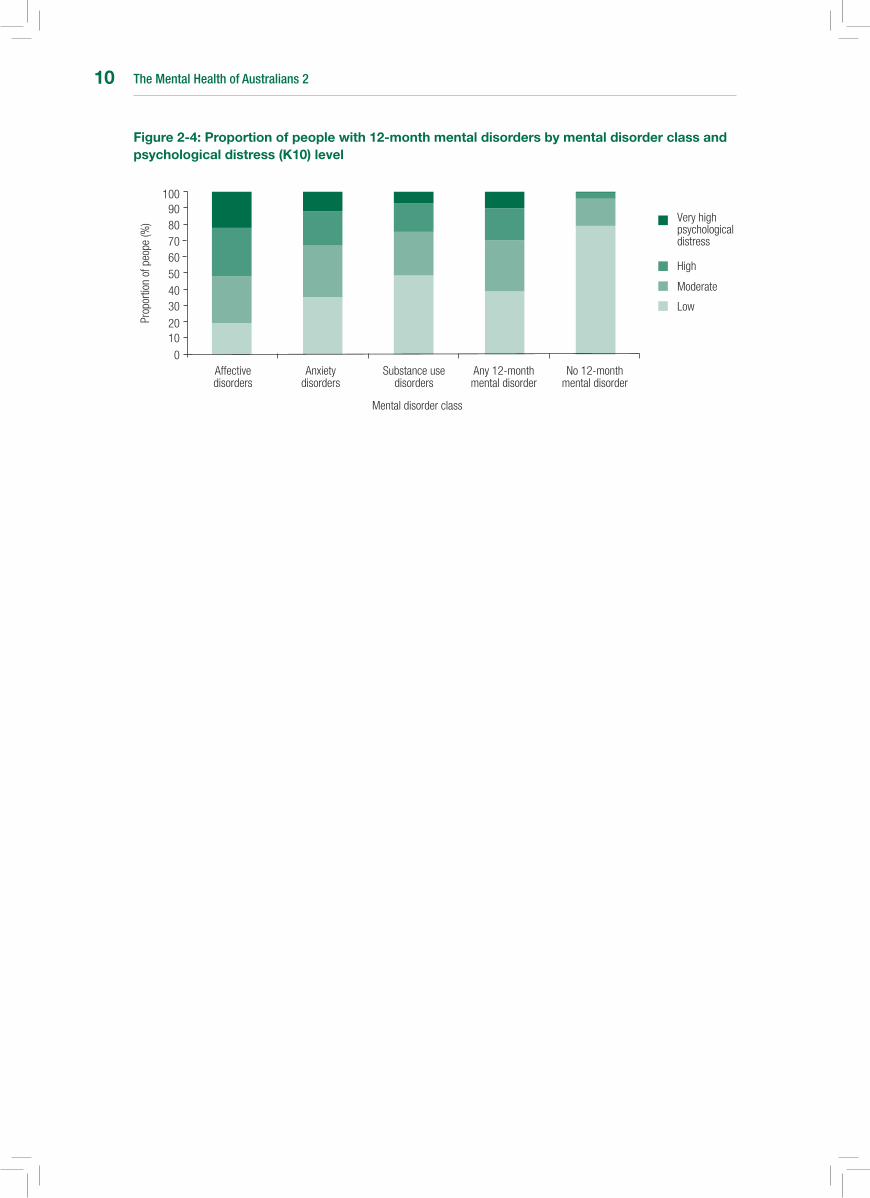
Psychological distress was measured using the Kessler 10 scale (K10). K10 scores were divided into four categories representing low psychological distress (scores ranging from 10-15), moderate psychological distress (scores ranging from 16-21), high psychological distress (scores ranging from 22-29) and very high psychological distress (scores ranging from 30-50) (Figure 2-4).
The average K10 score for people with any 12-month mental disorder was 19.1, which is rated as moderate psychological distress, compared to a score of 13.3 or low psychological distress for people who did not have a mental disorder in the previous 12 months.
Almost one quarter (22.2%) of people with affective disorders reported very high psychological distress, compared to 11.9% of people with anxiety disorders and 7.3% of people with substance use disorders.
Affective disorders
01020
3040506070
Prop
ortio
n of
peo
pe (%
)
Anxiety disorders
Substance use disorders
Any mental disorder
Mental disorder class
8090
100
Severe
Moderate
Mild
The Mental Health of Australians 210
Figure 2-4: Proportion of people with 12-month mental disorders by mental disorder class and psychological distress (K10) level
Affective disorders
0
1020
3040506070
Prop
ortio
n of
peo
pe (%
)
Anxiety disorders
Substance use disorders
Any 12-month mental disorder
Mental disorder class
8090
100
Very high psychological distress
High
Moderate
No 12-month mental disorder
Low
The Mental Health of Australians 2 11
3 sERVICE usE
A key aim of the 2007 survey was to obtain an up-to-date and detailed picture of the health services people use for their mental health problems. This chapter provides information on the characteristics of people who used services in the 12 months prior to interview and the types of health professionals they consulted.
The survey collected information on hospital admissions and consultations for mental health problems withawiderangeofserviceproviders,includinggeneralpractitioners;mentalhealthprofessionals,suchaspsychologists,psychiatristsandmentalhealthnurses;healthprofessionalsnotworkinginmentalhealthservices,suchasothermedicaldoctors,socialworkersandnurses;andpractitionersofcomplementary and alternative medicine. Information was also collected on the use of medication for mental health problems.
People were also asked if their needs for services were met and, for those who did not use services, whether they needed services, but had not received these.
3.1 service use in the Australian population
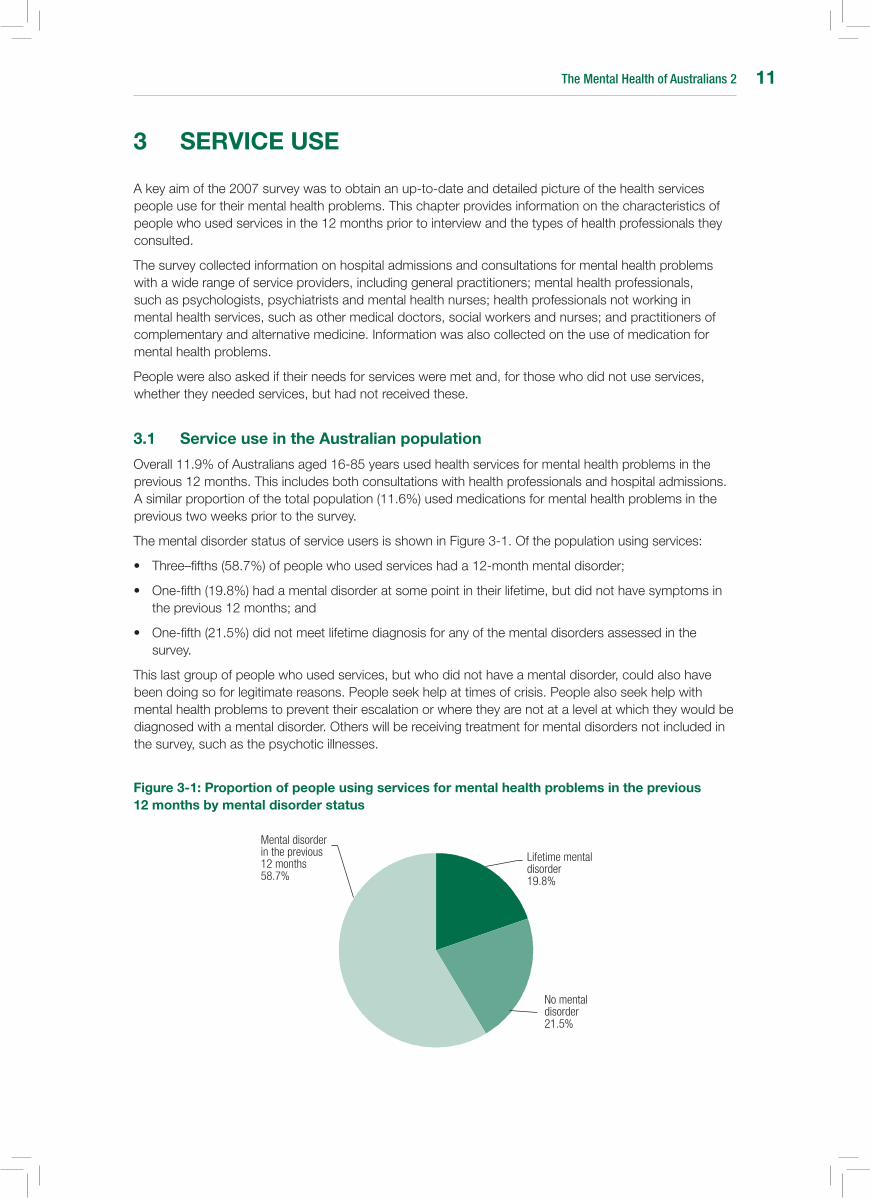
Overall 11.9% of Australians aged 16-85 years used health services for mental health problems in the previous 12 months. This includes both consultations with health professionals and hospital admissions. A similar proportion of the total population (11.6%) used medications for mental health problems in the previous two weeks prior to the survey.
The mental disorder status of service users is shown in Figure 3-1. Of the population using services:
• Three–fifths(58.7%)ofpeoplewhousedserviceshada12-monthmentaldisorder;
• One-fifth(19.8%)hadamentaldisorderatsomepointintheirlifetime,butdidnothavesymptomsintheprevious12months;and
• One-fifth(21.5%)didnotmeetlifetimediagnosisforanyofthementaldisordersassessedinthesurvey.
This last group of people who used services, but who did not have a mental disorder, could also have been doing so for legitimate reasons. People seek help at times of crisis. People also seek help with mental health problems to prevent their escalation or where they are not at a level at which they would be diagnosed with a mental disorder. Others will be receiving treatment for mental disorders not included in the survey, such as the psychotic illnesses.
Figure 3-1: Proportion of people using services for mental health problems in the previous 12 months by mental disorder status
Lifetime mental disorder 19.8%
No mental disorder 21.5%
Mental disorder in the previous 12 months58.7%

The Mental Health of Australians 212
3.2 service use by people with 12-month mental disorders
One third (34.9%) of people with 12-month mental disorders used health services for mental health problems in the 12 months prior to interview. This is equivalent to 1.1 million Australians seeking help for their mental health problems during this 12-month period.
Hospital admissions constituted a relatively small part of the services used for mental health problems, with 2.6% or just over 80,000 people with 12-month mental disorders reporting at least one hospital admission for a mental health problem in the previous 12 months.
3.2.1 Sexandageprofileofserviceusers
Service use for mental health problems was higher among females than males. Two-fifths (40.7%) of females with 12-month mental disorders used services for mental health problems in the previous 12 months compared to just over one quarter (27.5%) of males.
Service use was lowest among the youngest and oldest age groups with less than one quarter of people in both age groups having used services for mental health problems in the previous 12 months (23.3% aged 16-34 years and 22.6% aged 75-85 years).
For males, service use was lowest among those aged 16-24 years (13.2%), peaked among the 45-54 year olds with almost two-fifths (38.6%) using services and then declined with age to 19.2% among males aged 75-85 years.
For females, service use was also lower in the youngest and oldest age groups, being lowest for females aged 75 to 84 years (24.6%) and slightly higher for females aged 16-24 years (31.2%). Unlike males, service use for females remained above 40% for all other age groups, that is those between 25 and 74 years.
The difference in service use between the sexes (Figure 3-2) was greatest for those aged 16-24 years, with females being more than twice as likely to use services compared to males (31.2% in females compared to 13.2% in males).
Figure 3-2: service use by people with 12-month mental disorders by age and sex
Age group (years)
16–24 25–34 35–44 45–54 55–64 65–74 75–85
0
10
20
30
40
50
Females
Males
Serv
ice
use
(%)
3.2.2 Serviceusebyclassofmentaldisorder
People who experienced affective disorders in the 12 months prior to interview were more likely than people with anxiety or substance use disorders to access services for their mental health problems (Table 3-1). Over half (58.6%) of all people with affective disorders used services for mental health problems in the 12 months prior to interview. This compares to approximately one third (37.8%) of people with anxiety disorders and one quarter (24.0%) of people with substance use disorders who used services.

The Mental Health of Australians 2 13
Table 3-1: service use by 12-month mental disorder class
Service use (%)
Affective disorders 58.6
Anxiety disorders 37.8
Substance use disorders 24.0
Any mental disorder 34.9
3.2.3 Medicationusebymentaldisorderclass
One quarter of people (25.3%) with 12-month mental disorders used medications for mental health problems in the two weeks prior to interview (Table 3.2). Similar to service use, medication use was highest for people with affective disorders (42.1%) compared to people with anxiety disorders (28.2%) and substance use disorders (15.8%).
Table 3-2: Medication use for mental health problems by 12-month mental disorder class
Medication use (%)
Affective disorders 42.1
Anxiety disorders 28.2
Substance use disorders 15.8
Any mental disorder 25.3
3.2.4 Serviceusebycomorbidityofmentaldisorderclasses
Comorbidity refers to the occurrence of more than one disorder at the same time. It may refer to co-occurring mental disorders or co-occurring mental and physical disorders. In this section service use is reported for those people with mental disorders from one mental disorder class (affective disorder only, anxiety disorder only and substance use disorder only) and from two or more comorbid mental disorder classes (combinations of affective, anxiety and/or substance use disorders).
People experiencing all three classes of mental disorders in the 12 months prior to interview had the highest level of service with two thirds (65.4%) using services in the previous 12 months (Table 3.3). Over half (55.9%) of people experiencing disorders from two classes used services and just over one quarter (27.3%) of people with disorders from only one class of mental disorder used services.
Table 3-3: service use by comorbidity of 12-month mental disorder classes
Service use (%)
One mental disorder class 27.3
Two mental disorder classes 55.9
Three mental disorder classes 65.4
Any mental disorder 34.9
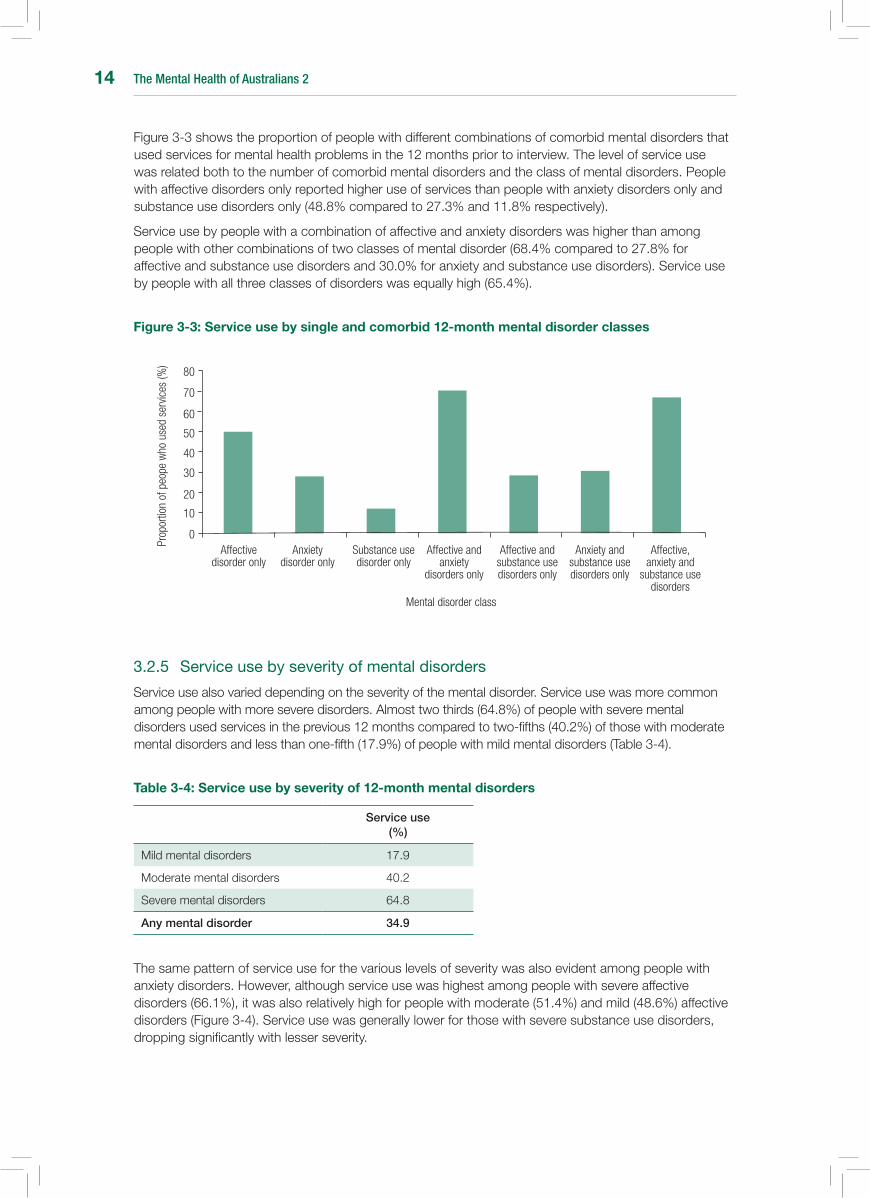
The Mental Health of Australians 214
Figure 3-3 shows the proportion of people with different combinations of comorbid mental disorders that used services for mental health problems in the 12 months prior to interview. The level of service use was related both to the number of comorbid mental disorders and the class of mental disorders. People with affective disorders only reported higher use of services than people with anxiety disorders only and substance use disorders only (48.8% compared to 27.3% and 11.8% respectively).
Service use by people with a combination of affective and anxiety disorders was higher than among people with other combinations of two classes of mental disorder (68.4% compared to 27.8% for affective and substance use disorders and 30.0% for anxiety and substance use disorders). Service use by people with all three classes of disorders was equally high (65.4%).
Figure 3-3: service use by single and comorbid 12-month mental disorder classes
3.2.5 Serviceusebyseverityofmentaldisorders
Service use also varied depending on the severity of the mental disorder. Service use was more common among people with more severe disorders. Almost two thirds (64.8%) of people with severe mental disorders used services in the previous 12 months compared to two-fifths (40.2%) of those with moderate mental disorders and less than one-fifth (17.9%) of people with mild mental disorders (Table 3-4).
Table 3-4: service use by severity of 12-month mental disorders
Service use (%)
Mild mental disorders 17.9
Moderate mental disorders 40.2
Severe mental disorders 64.8
Any mental disorder 34.9
The same pattern of service use for the various levels of severity was also evident among people with anxiety disorders. However, although service use was highest among people with severe affective disorders (66.1%), it was also relatively high for people with moderate (51.4%) and mild (48.6%) affective disorders (Figure 3-4). Service use was generally lower for those with severe substance use disorders, dropping significantly with lesser severity.
Affective disorder only
0
10
20
30
40
50
60
70
Anxiety disorder only
Substance use disorder only
Mental disorder class
80
Affective and anxiety
disorders only
Affective and substance use disorders only
Anxiety and substance use disorders only
Affective, anxiety and
substance use disorders
Prop
ortio
n of
peo
pe w
ho u
sed
serv
ices
(%)
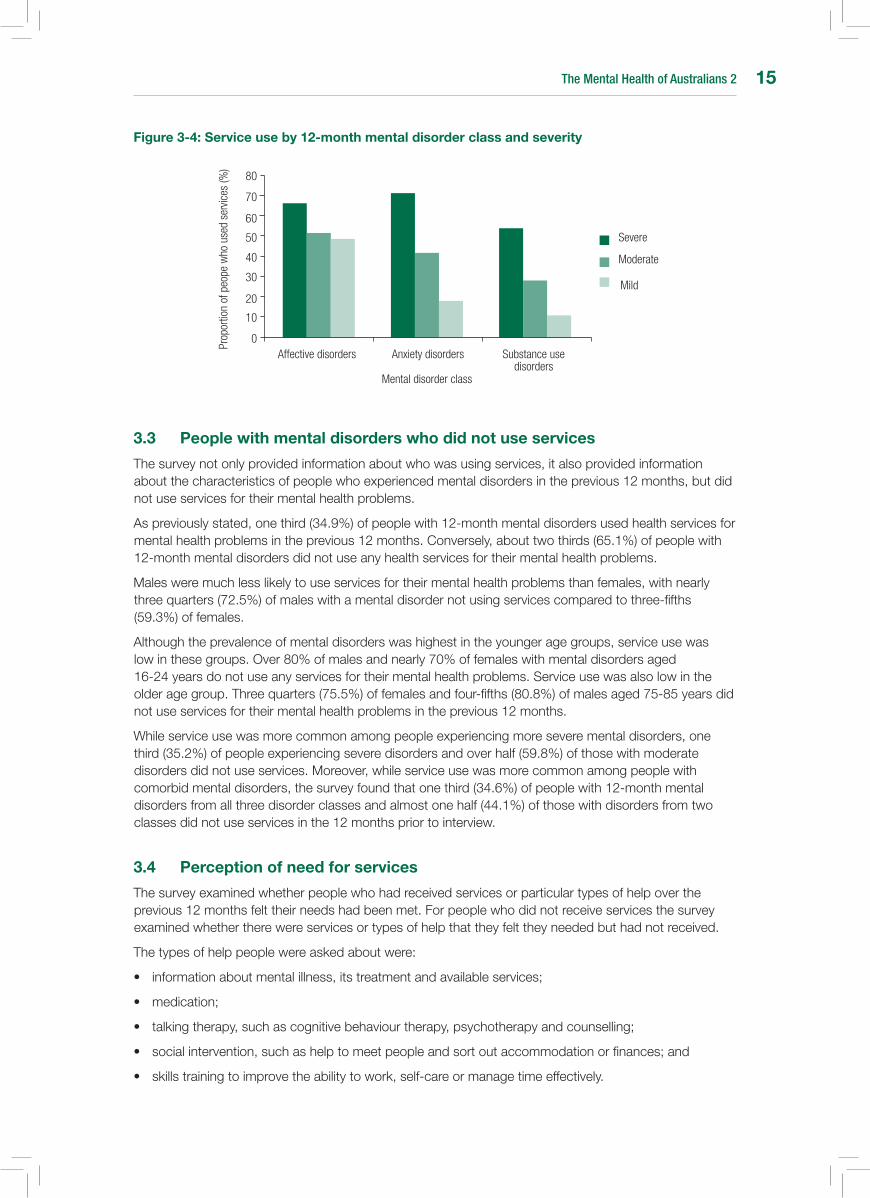
The Mental Health of Australians 2 15
Figure 3-4: service use by 12-month mental disorder class and severity
3.3 People with mental disorders who did not use services
The survey not only provided information about who was using services, it also provided information about the characteristics of people who experienced mental disorders in the previous 12 months, but did not use services for their mental health problems.
As previously stated, one third (34.9%) of people with 12-month mental disorders used health services for mental health problems in the previous 12 months. Conversely, about two thirds (65.1%) of people with 12-month mental disorders did not use any health services for their mental health problems.
Males were much less likely to use services for their mental health problems than females, with nearly three quarters (72.5%) of males with a mental disorder not using services compared to three-fifths (59.3%) of females.
Although the prevalence of mental disorders was highest in the younger age groups, service use was low in these groups. Over 80% of males and nearly 70% of females with mental disorders aged 16-24 years do not use any services for their mental health problems. Service use was also low in the older age group. Three quarters (75.5%) of females and four-fifths (80.8%) of males aged 75-85 years did not use services for their mental health problems in the previous 12 months.
While service use was more common among people experiencing more severe mental disorders, one third (35.2%) of people experiencing severe disorders and over half (59.8%) of those with moderate disorders did not use services. Moreover, while service use was more common among people with comorbid mental disorders, the survey found that one third (34.6%) of people with 12-month mental disorders from all three disorder classes and almost one half (44.1%) of those with disorders from two classes did not use services in the 12 months prior to interview.
3.4 Perception of need for services
The survey examined whether people who had received services or particular types of help over the previous 12 months felt their needs had been met. For people who did not receive services the survey examined whether there were services or types of help that they felt they needed but had not received.
The types of help people were asked about were:
• informationaboutmentalillness,itstreatmentandavailableservices;
• medication;
• talkingtherapy,suchascognitivebehaviourtherapy,psychotherapyandcounselling;
• socialintervention,suchashelptomeetpeopleandsortoutaccommodationorfinances;and
• skillstrainingtoimprovetheabilitytowork,self-careormanagetimeeffectively.
Affective disorders0
10
20
30
40
50
60
70
Anxiety disorders Substance use disorders
Mental disorder class
80
Severe
Moderate
Mild
Prop
ortio
n of
peo
pe w
ho u
sed
serv
ices
(%)
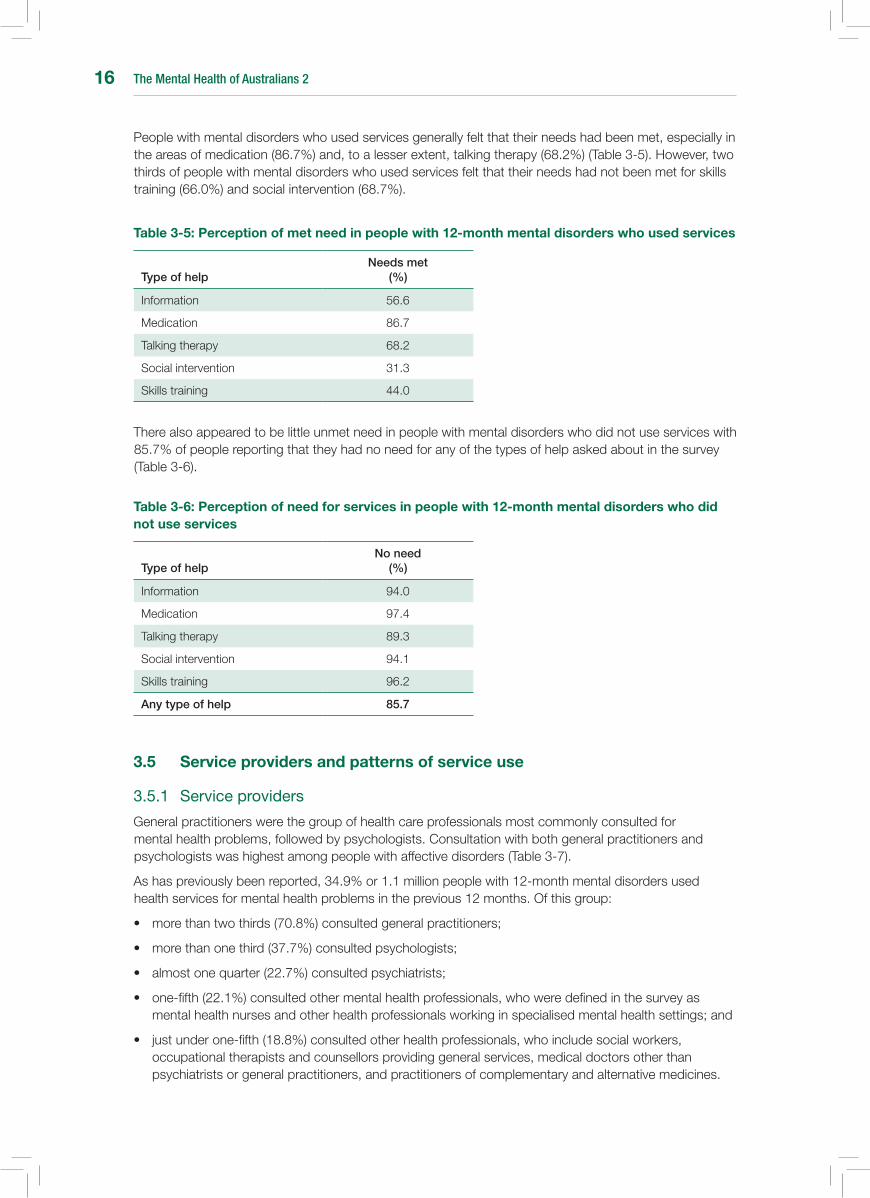
The Mental Health of Australians 216
People with mental disorders who used services generally felt that their needs had been met, especially in the areas of medication (86.7%) and, to a lesser extent, talking therapy (68.2%) (Table 3-5). However, two thirds of people with mental disorders who used services felt that their needs had not been met for skills training (66.0%) and social intervention (68.7%).
Table 3-5: Perception of met need in people with 12-month mental disorders who used services
Type of helpNeeds met
(%)
Information 56.6
Medication 86.7
Talking therapy 68.2
Social intervention 31.3
Skills training 44.0
There also appeared to be little unmet need in people with mental disorders who did not use services with 85.7% of people reporting that they had no need for any of the types of help asked about in the survey (Table 3-6).
Table 3-6: Perception of need for services in people with 12-month mental disorders who did not use services
Type of helpNo need
(%)
Information 94.0
Medication 97.4
Talking therapy 89.3
Social intervention 94.1
Skills training 96.2
Any type of help 85.7
3.5 service providers and patterns of service use
3.5.1 Serviceproviders
General practitioners were the group of health care professionals most commonly consulted for mental health problems, followed by psychologists. Consultation with both general practitioners and psychologists was highest among people with affective disorders (Table 3-7).
As has previously been reported, 34.9% or 1.1 million people with 12-month mental disorders used health services for mental health problems in the previous 12 months. Of this group:
• morethantwothirds(70.8%)consultedgeneralpractitioners;
• morethanonethird(37.7%)consultedpsychologists;
• almostonequarter(22.7%)consultedpsychiatrists;
• one-fifth(22.1%)consultedothermentalhealthprofessionals,whoweredefinedinthesurveyasmentalhealthnursesandotherhealthprofessionalsworkinginspecialisedmentalhealthsettings;and
• justunderone-fifth(18.8%)consultedotherhealthprofessionals,whoincludesocialworkers,occupational therapists and counsellors providing general services, medical doctors other than psychiatrists or general practitioners, and practitioners of complementary and alternative medicines.
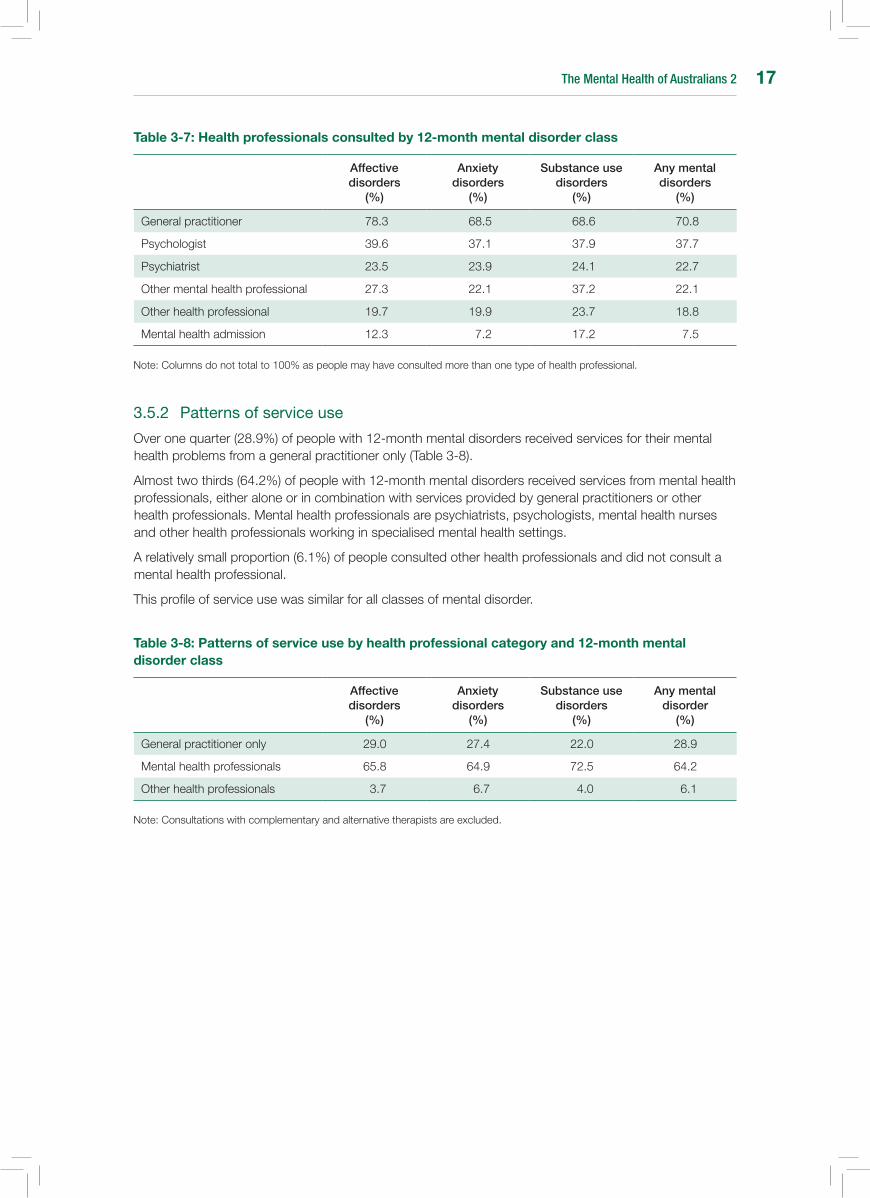
The Mental Health of Australians 2 17
Table 3-7: Health professionals consulted by 12-month mental disorder class
Affective disorders
(%)
Anxiety disorders
(%)
Substance use disorders
(%)
Any mental disorders
(%)
General practitioner 78.3 68.5 68.6 70.8
Psychologist 39.6 37.1 37.9 37.7
Psychiatrist 23.5 23.9 24.1 22.7
Other mental health professional 27.3 22.1 37.2 22.1
Other health professional 19.7 19.9 23.7 18.8
Mental health admission 12.3 7.2 17.2 7.5
Note: Columns do not total to 100% as people may have consulted more than one type of health professional.
3.5.2 Patternsofserviceuse
Over one quarter (28.9%) of people with 12-month mental disorders received services for their mental health problems from a general practitioner only (Table 3-8).
Almost two thirds (64.2%) of people with 12-month mental disorders received services from mental health professionals, either alone or in combination with services provided by general practitioners or other health professionals. Mental health professionals are psychiatrists, psychologists, mental health nurses and other health professionals working in specialised mental health settings.
A relatively small proportion (6.1%) of people consulted other health professionals and did not consult a mental health professional.
This profile of service use was similar for all classes of mental disorder.
Table 3-8: Patterns of service use by health professional category and 12-month mental disorder class
Affective disorders
(%)
Anxiety disorders
(%)
Substance use disorders
(%)
Any mental disorder
(%)
General practitioner only 29.0 27.4 22.0 28.9
Mental health professionals 65.8 64.9 72.5 64.2
Other health professionals 3.7 6.7 4.0 6.1
Note: Consultations with complementary and alternative therapists are excluded.

The Mental Health of Australians 218

The Mental Health of Australians 2 19
4 AFFECTIVE DIsORDERs In AusTRALIA
Three different types of affective disorders were asked about in the 2007 National Survey of Mental Health and Wellbeing. Depressive episode is characterised by periods of low mood lasting at least two weeks that are accompanied by symptoms such as loss of appetite, feelings of worthlessness, difficulty concentrating and suicidal thoughts. Dysthymia is characterised by a more longstanding low mood lasting for two years or more. The third form of affective disorder is bipolar affective disorder, characterised by periods of elevated or irritable mood, often fluctuating with periods of depression.
4.1 Prevalence of affective disorders in the Australian population
In the 12 months prior to interview 6.2% of Australians aged 16-85 years had affective disorders (Table 4-1). Females were more likely than males to have affective disorders (7.1% in females compared to 5.3% in males).
Depressive episode was the most common type of affective disorder with a prevalence of around one in twenty-five (4.1%) in the population. Dysthymia and bipolar affective disorder were less common with an overall prevalence in the population of 1.3% and 1.8% respectively.
Table 4-1: Prevalence of 12-month affective disorders by affective disorder type and sex
Males (%)
Females (%)
Persons (%)
Depressive episode 3.1 5.1 4.1
Dysthymia 1.0 1.5 1.3
Bipolar affective disorder 1.8 1.7 1.8
Any affective disorder 5.3 7.1 6.2
Note: Totals are lower than the sum of disorders as people may have had more than one type of affective disorder in the 12 months.
4.2 Prevalence of affective disorders in different population sub-groups
4.2.1 Sexandage
The prevalence of affective disorders was higher in females (7.1% compared to 5.3% in males). This difference between the sexes was also true for depressive episode and dysthymia, which were around one and a half times higher in females. However, males and females experienced similar rates of bipolar affective disorder (1.8% and 1.7% respectively).
The prevalence of affective disorders was not strongly associated with age and the pattern varied between males and females (Figure 4-1). For females, the prevalence started high and declined in the older age groups. While for males the prevalence started lower, peaked for 35-44 year olds and then declined with increasing age.
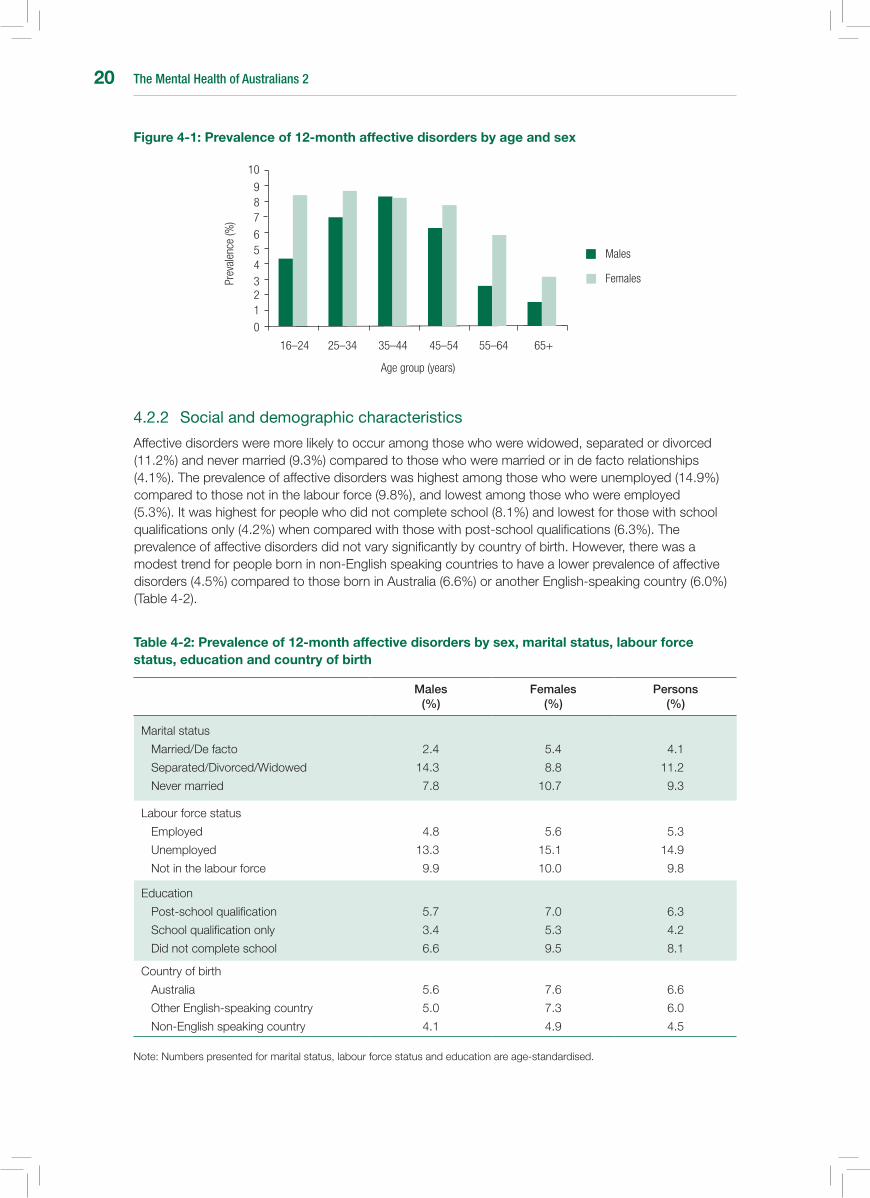
The Mental Health of Australians 220
Figure 4-1: Prevalence of 12-month affective disorders by age and sex
4.2.2 Socialanddemographiccharacteristics
Affective disorders were more likely to occur among those who were widowed, separated or divorced (11.2%) and never married (9.3%) compared to those who were married or in de facto relationships (4.1%). The prevalence of affective disorders was highest among those who were unemployed (14.9%) compared to those not in the labour force (9.8%), and lowest among those who were employed (5.3%). It was highest for people who did not complete school (8.1%) and lowest for those with school qualifications only (4.2%) when compared with those with post-school qualifications (6.3%). The prevalence of affective disorders did not vary significantly by country of birth. However, there was a modest trend for people born in non-English speaking countries to have a lower prevalence of affective disorders (4.5%) compared to those born in Australia (6.6%) or another English-speaking country (6.0%) (Table 4-2).
Table 4-2: Prevalence of 12-month affective disorders by sex, marital status, labour force status, education and country of birth
Males (%)
Females (%)
Persons (%)
Marital status
Married/De facto
Separated/Divorced/Widowed
Never married
2.4
14.3
7.8
5.4
8.8
10.7
4.1
11.2
9.3
Labour force status
Employed
Unemployed
Not in the labour force
4.8
13.3
9.9
5.6
15.1
10.0
5.3
14.9
9.8
Education
Post-school qualification
School qualification only
Did not complete school
5.7
3.4
6.6
7.0
5.3
9.5
6.3
4.2
8.1
Country of birth
Australia
Other English-speaking country
Non-English speaking country
5.6
5.0
4.1
7.6
7.3
4.9
6.6
6.0
4.5
Note: Numbers presented for marital status, labour force status and education are age-standardised.
Females
Males
16–24 25–34 35–44 45–54 55–64 65+
Prev
alen
ce (%
)
0
456
789
10
Age group (years)
321
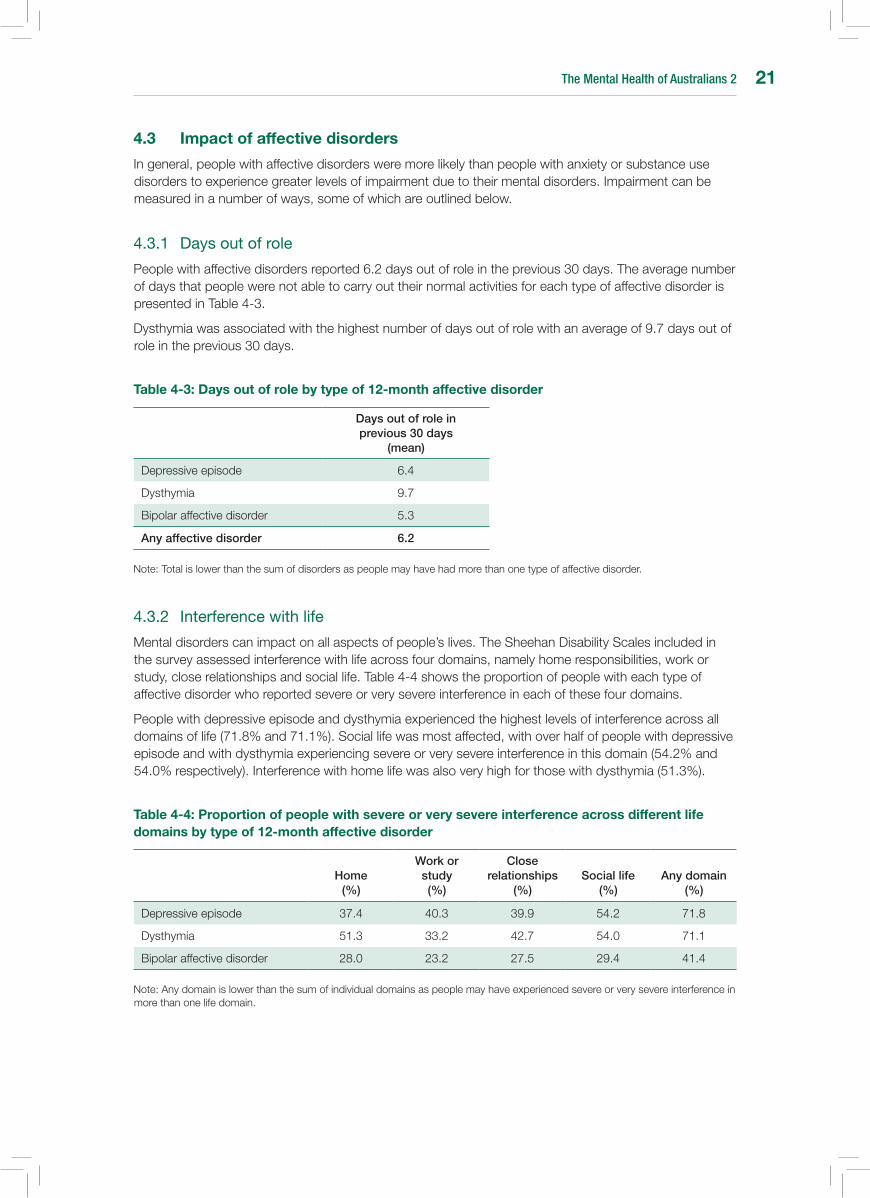
The Mental Health of Australians 2 21
4.3 Impact of affective disorders
In general, people with affective disorders were more likely than people with anxiety or substance use disorders to experience greater levels of impairment due to their mental disorders. Impairment can be measured in a number of ways, some of which are outlined below.
4.3.1 Daysoutofrole
People with affective disorders reported 6.2 days out of role in the previous 30 days. The average number of days that people were not able to carry out their normal activities for each type of affective disorder is presented in Table 4-3.
Dysthymia was associated with the highest number of days out of role with an average of 9.7 days out of role in the previous 30 days.
Table 4-3: Days out of role by type of 12-month affective disorder
Days out of role in previous 30 days
(mean)
Depressive episode 6.4
Dysthymia 9.7
Bipolar affective disorder 5.3
Any affective disorder 6.2
Note: Total is lower than the sum of disorders as people may have had more than one type of affective disorder.
4.3.2 Interferencewithlife
Mental disorders can impact on all aspects of people’s lives. The Sheehan Disability Scales included in the survey assessed interference with life across four domains, namely home responsibilities, work or study, close relationships and social life. Table 4-4 shows the proportion of people with each type of affective disorder who reported severe or very severe interference in each of these four domains.
People with depressive episode and dysthymia experienced the highest levels of interference across all domains of life (71.8% and 71.1%). Social life was most affected, with over half of people with depressive episode and with dysthymia experiencing severe or very severe interference in this domain (54.2% and 54.0% respectively). Interference with home life was also very high for those with dysthymia (51.3%).
Table 4-4: Proportion of people with severe or very severe interference across different life domains by type of 12-month affective disorder
Home (%)
Work or study (%)
Close relationships
(%)Social life
(%)Any domain
(%)
Depressive episode 37.4 40.3 39.9 54.2 71.8
Dysthymia 51.3 33.2 42.7 54.0 71.1
Bipolar affective disorder 28.0 23.2 27.5 29.4 41.4
Note: Any domain is lower than the sum of individual domains as people may have experienced severe or very severe interference in more than one life domain.
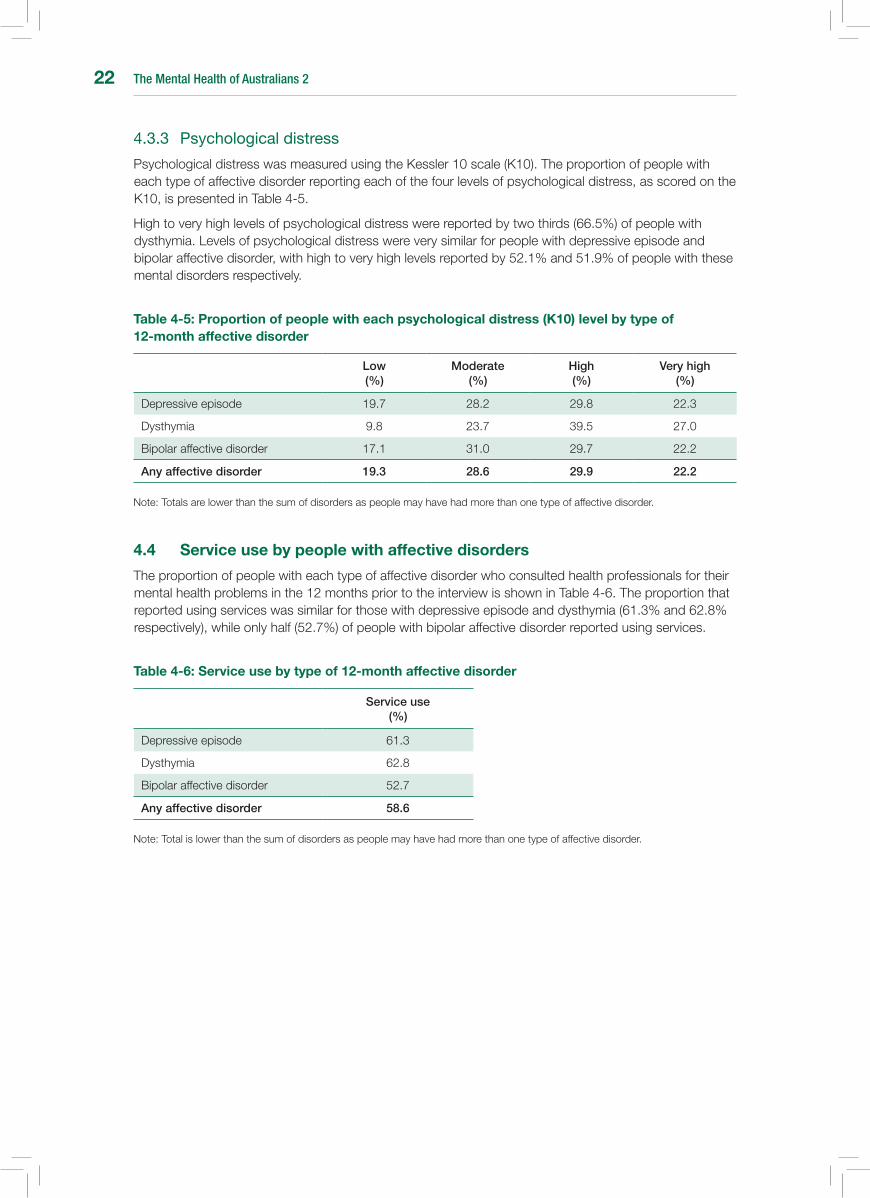
The Mental Health of Australians 222
4.3.3 Psychologicaldistress
Psychological distress was measured using the Kessler 10 scale (K10). The proportion of people with each type of affective disorder reporting each of the four levels of psychological distress, as scored on the K10, is presented in Table 4-5.
High to very high levels of psychological distress were reported by two thirds (66.5%) of people with dysthymia. Levels of psychological distress were very similar for people with depressive episode and bipolar affective disorder, with high to very high levels reported by 52.1% and 51.9% of people with these mental disorders respectively.
Table 4-5: Proportion of people with each psychological distress (K10) level by type of 12-month affective disorder
Low (%)
Moderate (%)
High (%)
Very high (%)
Depressive episode 19.7 28.2 29.8 22.3
Dysthymia 9.8 23.7 39.5 27.0
Bipolar affective disorder 17.1 31.0 29.7 22.2
Any affective disorder 19.3 28.6 29.9 22.2
Note: Totals are lower than the sum of disorders as people may have had more than one type of affective disorder.
4.4 service use by people with affective disorders
The proportion of people with each type of affective disorder who consulted health professionals for their mental health problems in the 12 months prior to the interview is shown in Table 4-6. The proportion that reported using services was similar for those with depressive episode and dysthymia (61.3% and 62.8% respectively), while only half (52.7%) of people with bipolar affective disorder reported using services.
Table 4-6: service use by type of 12-month affective disorder
Service use (%)
Depressive episode 61.3
Dysthymia 62.8
Bipolar affective disorder 52.7
Any affective disorder 58.6
Note: Total is lower than the sum of disorders as people may have had more than one type of affective disorder.
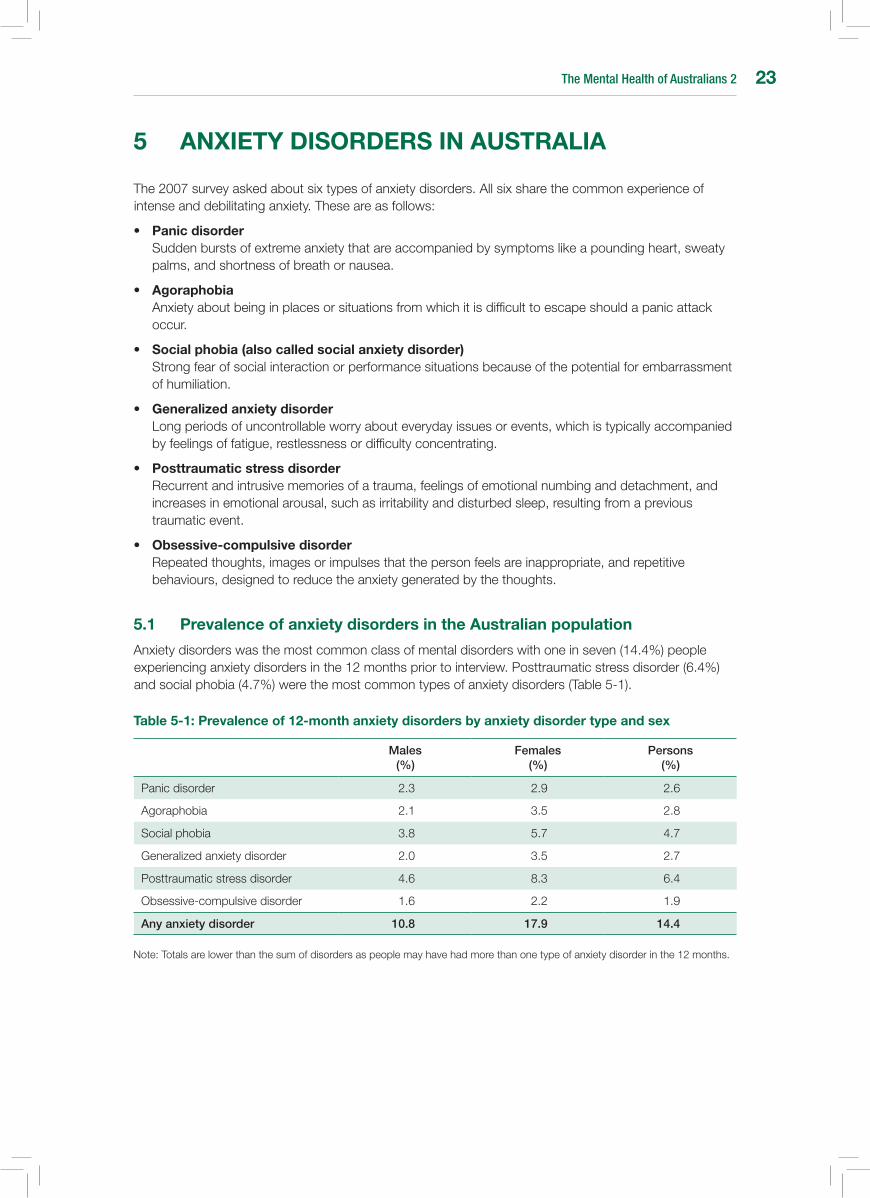
The Mental Health of Australians 2 23
5 AnXIETY DIsORDERs In AusTRALIA
The 2007 survey asked about six types of anxiety disorders. All six share the common experience of intense and debilitating anxiety. These are as follows:
• Panic disorder Sudden bursts of extreme anxiety that are accompanied by symptoms like a pounding heart, sweaty
palms, and shortness of breath or nausea.
• Agoraphobia Anxiety about being in places or situations from which it is difficult to escape should a panic attack
occur.
• social phobia (also called social anxiety disorder) Strong fear of social interaction or performance situations because of the potential for embarrassment
of humiliation.
• Generalized anxiety disorder Long periods of uncontrollable worry about everyday issues or events, which is typically accompanied
by feelings of fatigue, restlessness or difficulty concentrating.
• Posttraumatic stress disorder Recurrent and intrusive memories of a trauma, feelings of emotional numbing and detachment, and
increases in emotional arousal, such as irritability and disturbed sleep, resulting from a previous traumatic event.
• Obsessive-compulsive disorder Repeated thoughts, images or impulses that the person feels are inappropriate, and repetitive
behaviours, designed to reduce the anxiety generated by the thoughts.
5.1 Prevalence of anxiety disorders in the Australian population
Anxiety disorders was the most common class of mental disorders with one in seven (14.4%) people experiencing anxiety disorders in the 12 months prior to interview. Posttraumatic stress disorder (6.4%) and social phobia (4.7%) were the most common types of anxiety disorders (Table 5-1).
Table 5-1: Prevalence of 12-month anxiety disorders by anxiety disorder type and sex
Males (%)
Females (%)
Persons (%)
Panic disorder 2.3 2.9 2.6
Agoraphobia 2.1 3.5 2.8
Social phobia 3.8 5.7 4.7
Generalizedanxietydisorder 2.0 3.5 2.7
Posttraumatic stress disorder 4.6 8.3 6.4
Obsessive-compulsive disorder 1.6 2.2 1.9
Any anxiety disorder 10.8 17.9 14.4
Note: Totals are lower than the sum of disorders as people may have had more than one type of anxiety disorder in the 12 months.
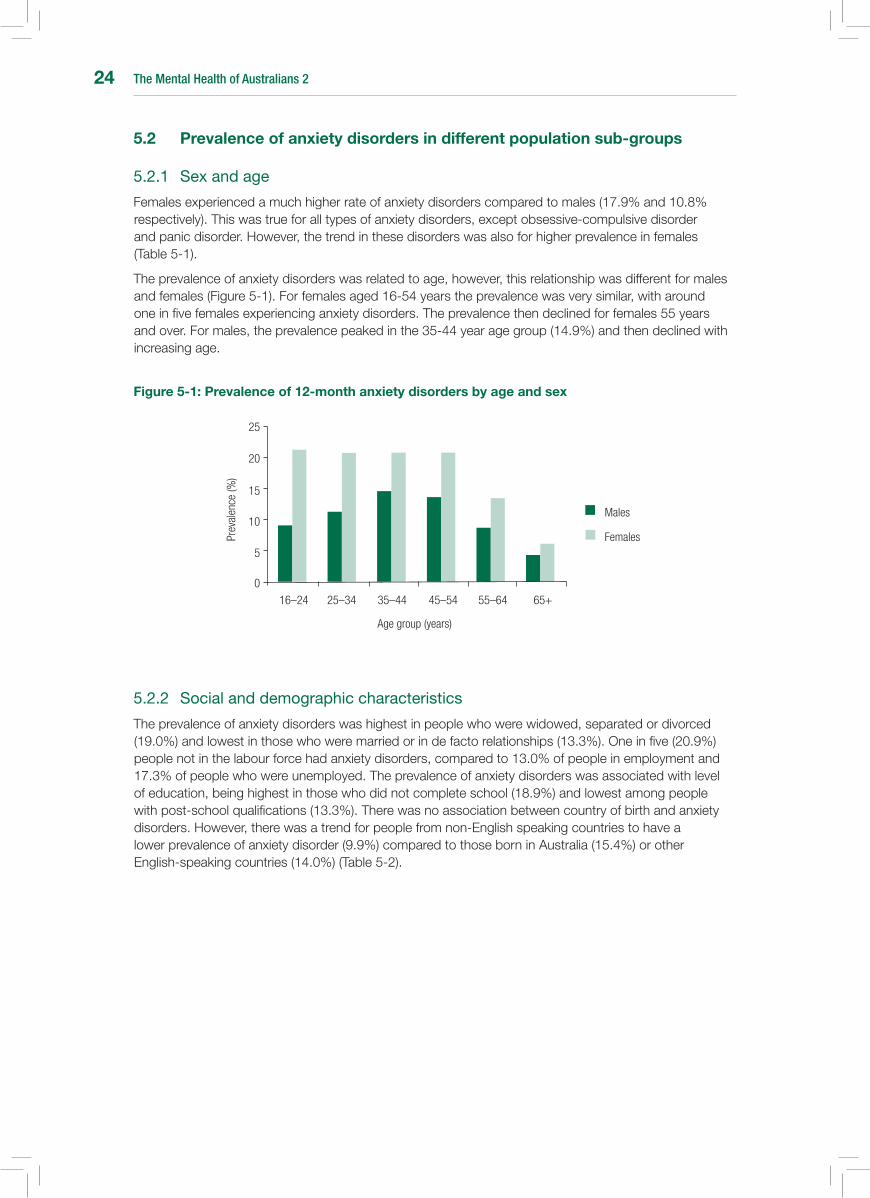
The Mental Health of Australians 224
5.2 Prevalence of anxiety disorders in different population sub-groups
5.2.1 Sexandage
Females experienced a much higher rate of anxiety disorders compared to males (17.9% and 10.8% respectively). This was true for all types of anxiety disorders, except obsessive-compulsive disorder and panic disorder. However, the trend in these disorders was also for higher prevalence in females (Table 5-1).
The prevalence of anxiety disorders was related to age, however, this relationship was different for males and females (Figure 5-1). For females aged 16-54 years the prevalence was very similar, with around one in five females experiencing anxiety disorders. The prevalence then declined for females 55 years and over. For males, the prevalence peaked in the 35-44 year age group (14.9%) and then declined with increasing age.
Figure 5-1: Prevalence of 12-month anxiety disorders by age and sex
5.2.2 Socialanddemographiccharacteristics
The prevalence of anxiety disorders was highest in people who were widowed, separated or divorced (19.0%) and lowest in those who were married or in de facto relationships (13.3%). One in five (20.9%) people not in the labour force had anxiety disorders, compared to 13.0% of people in employment and 17.3% of people who were unemployed. The prevalence of anxiety disorders was associated with level of education, being highest in those who did not complete school (18.9%) and lowest among people with post-school qualifications (13.3%). There was no association between country of birth and anxiety disorders. However, there was a trend for people from non-English speaking countries to have a lower prevalence of anxiety disorder (9.9%) compared to those born in Australia (15.4%) or other English-speaking countries (14.0%) (Table 5-2).
Females
Males
16–24 25–34 35–44 45–54 55–64 65+
Prev
alen
ce (%
)
0
20
25
Age group (years)
15
10
5
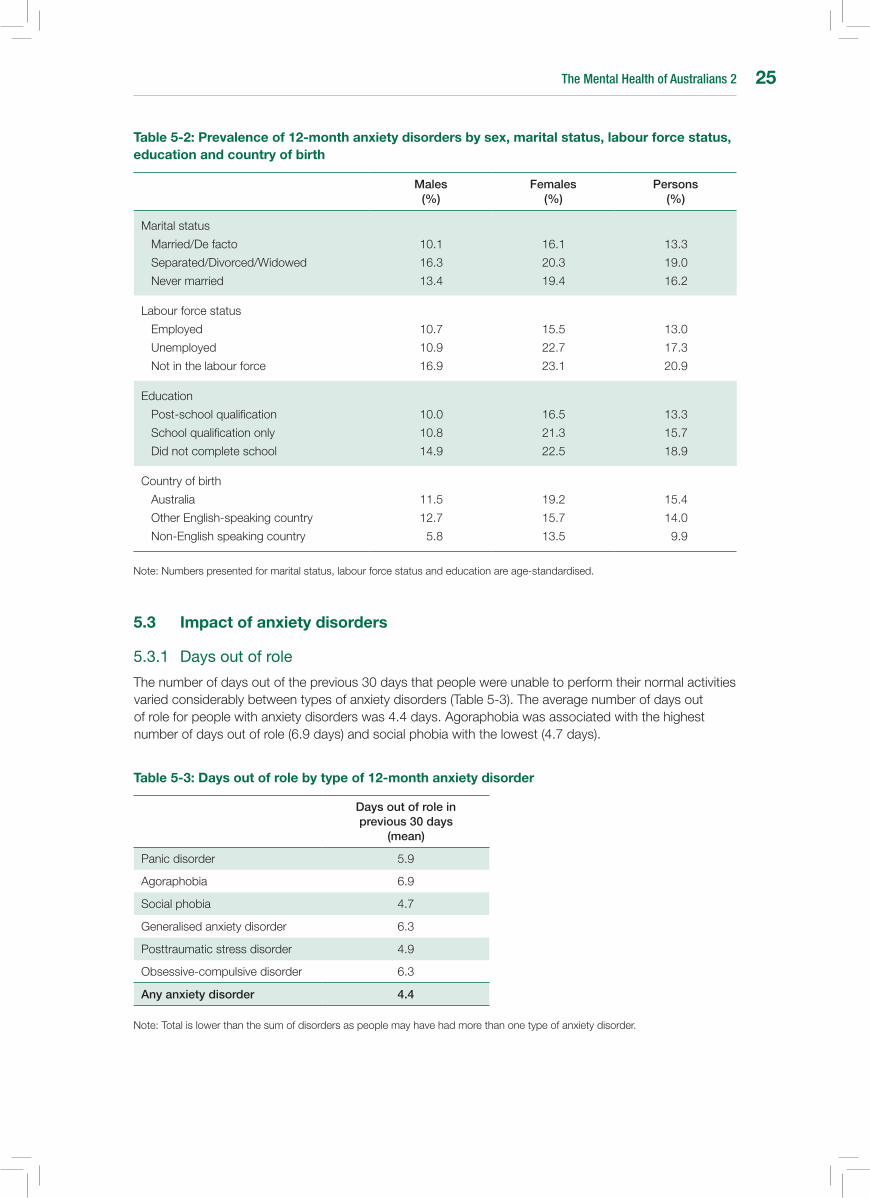
The Mental Health of Australians 2 25
Table 5-2: Prevalence of 12-month anxiety disorders by sex, marital status, labour force status, education and country of birth
Males (%)
Females (%)
Persons (%)
Marital status
Married/De facto
Separated/Divorced/Widowed
Never married
10.1
16.3
13.4
16.1
20.3
19.4
13.3
19.0
16.2
Labour force status
Employed
Unemployed
Not in the labour force
10.7
10.9
16.9
15.5
22.7
23.1
13.0
17.3
20.9
Education
Post-school qualification
School qualification only
Did not complete school
10.0
10.8
14.9
16.5
21.3
22.5
13.3
15.7
18.9
Country of birth
Australia
Other English-speaking country
Non-English speaking country
11.5
12.7
5.8
19.2
15.7
13.5
15.4
14.0
9.9
Note: Numbers presented for marital status, labour force status and education are age-standardised.
5.3 Impact of anxiety disorders
5.3.1 Daysoutofrole
The number of days out of the previous 30 days that people were unable to perform their normal activities varied considerably between types of anxiety disorders (Table 5-3). The average number of days out of role for people with anxiety disorders was 4.4 days. Agoraphobia was associated with the highest number of days out of role (6.9 days) and social phobia with the lowest (4.7 days).
Table 5-3: Days out of role by type of 12-month anxiety disorder
Days out of role in previous 30 days
(mean)
Panic disorder 5.9
Agoraphobia 6.9
Social phobia 4.7
Generalised anxiety disorder 6.3
Posttraumatic stress disorder 4.9
Obsessive-compulsive disorder 6.3
Any anxiety disorder 4.4
Note: Total is lower than the sum of disorders as people may have had more than one type of anxiety disorder.

The Mental Health of Australians 226
5.3.2 Interferencewithlife
Interference with life was assessed separately for each type of anxiety disorder across four domains, which capture different aspects of people’s lives (home responsibilities, work or study, close relationships and social life). Table 5-4 shows the percentage of people who reported severe or very severe interference in each of these four domains.
Generalizedanxietydisorderwasassociatedwiththehighestlevelofinterference,withalmosthalf(48.0%)ofpeoplewithgeneralizedanxietydisorderexperiencingsevereorverysevereinterferenceinatleast one of the four domains of life.
Generally, social life was the domain in which most people experienced severe or very severe interference due to their anxiety disorder (ranging from 13.6% for posttraumatic stress disorder through to 37.8% forgeneralizedanxietydisorder),followedbyinterferencewithcloserelationships(rangingfrom10.7%forposttraumaticstressdisorderthroughto31.8%forgeneralizedanxietydisorder).Theexceptionto this was panic disorder, for which a higher proportion of people experienced severe or very severe interference with work or study (28.4%).
Table 5-4: Proportion of people with severe or very severe interference across different life domains by type of 12-month anxiety disorder
Home (%)
Work or study (%)
Close relationships
(%)Social life
(%)Any domain
(%)
Panic disorder 17.6 28.4 17.3 22.8 37.7
Agoraphobia 18.7 19.1 22.4 27.0 34.5
Social phobia 7.7 9.1 15.9 18.0 20.0
Generalizedanxietydisorder 24.1 24.2 31.8 37.8 48.0
Posttraumatic stress disorder 9.6 10.7 10.7 13.6 20.0
Obsessive-compulsive disorder 10.7 9.7 14.5 16.2 24.7
Note: Any domain is lower than the sum of individual domains as people may have experienced severe or very severe interference in more than one life domain.
5.3.3 Psychologicaldistress
The proportion of people with each type of anxiety disorder reporting each of the four levels of psychological distress, as scored on the Kessler 10 scale (K10), is presented in Table 5-5. Levels of psychological distress differed depending on the type of anxiety disorder.
High or very high psychological distress was experienced by 55.0% of people with agoraphobia and53.2%ofpeoplewithgeneralizedanxietydisorder.Whereastwothirds(69.1%)ofpeoplewithposttraumatic stress disorder experienced low to moderate levels of psychological distress.
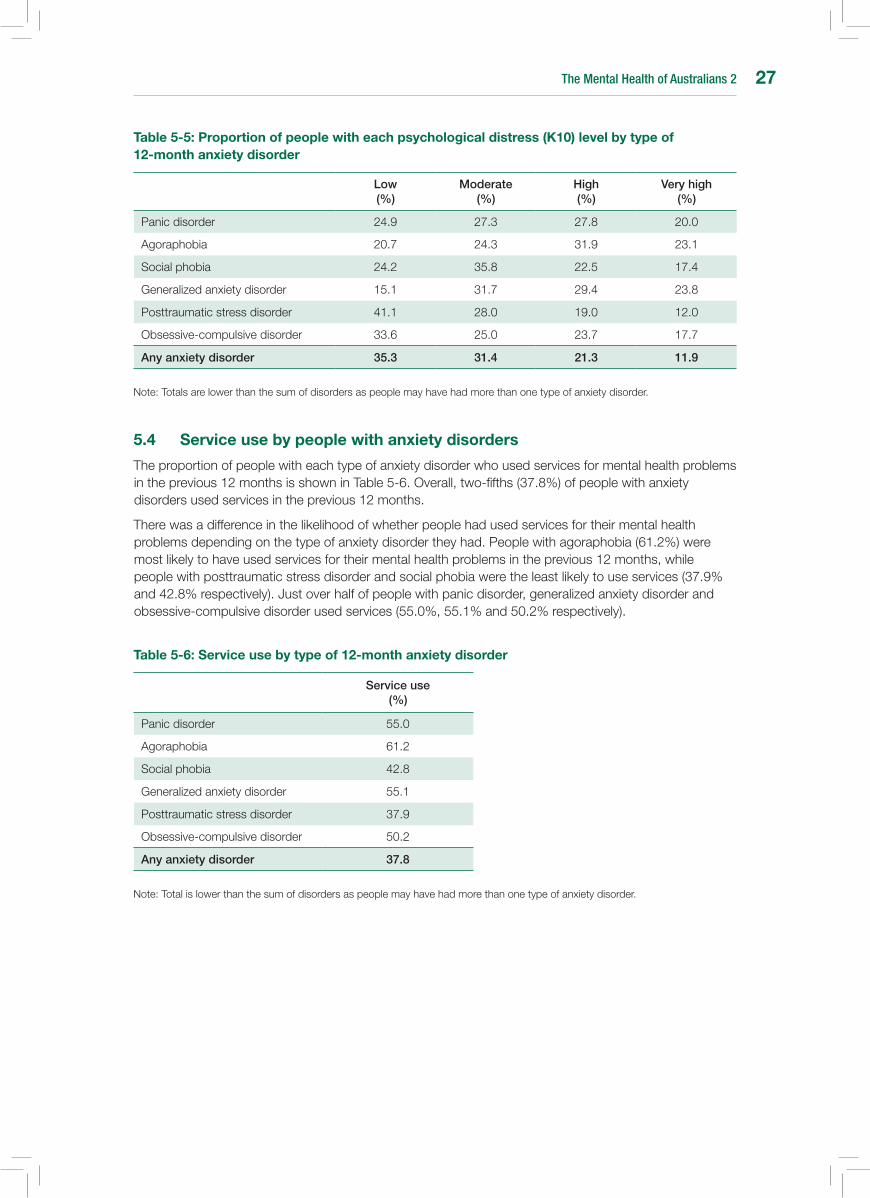
The Mental Health of Australians 2 27
Table 5-5: Proportion of people with each psychological distress (K10) level by type of 12-month anxiety disorder
Low (%)
Moderate (%)
High (%)
Very high (%)
Panic disorder 24.9 27.3 27.8 20.0
Agoraphobia 20.7 24.3 31.9 23.1
Social phobia 24.2 35.8 22.5 17.4
Generalizedanxietydisorder 15.1 31.7 29.4 23.8
Posttraumatic stress disorder 41.1 28.0 19.0 12.0
Obsessive-compulsive disorder 33.6 25.0 23.7 17.7
Any anxiety disorder 35.3 31.4 21.3 11.9
Note: Totals are lower than the sum of disorders as people may have had more than one type of anxiety disorder.
5.4 service use by people with anxiety disorders
The proportion of people with each type of anxiety disorder who used services for mental health problems in the previous 12 months is shown in Table 5-6. Overall, two-fifths (37.8%) of people with anxiety disorders used services in the previous 12 months.
There was a difference in the likelihood of whether people had used services for their mental health problems depending on the type of anxiety disorder they had. People with agoraphobia (61.2%) were most likely to have used services for their mental health problems in the previous 12 months, while people with posttraumatic stress disorder and social phobia were the least likely to use services (37.9% and42.8%respectively).Justoverhalfofpeoplewithpanicdisorder,generalizedanxietydisorderandobsessive-compulsive disorder used services (55.0%, 55.1% and 50.2% respectively).
Table 5-6: service use by type of 12-month anxiety disorder
Service use (%)
Panic disorder 55.0
Agoraphobia 61.2
Social phobia 42.8
Generalizedanxietydisorder 55.1
Posttraumatic stress disorder 37.9
Obsessive-compulsive disorder 50.2
Any anxiety disorder 37.8
Note: Total is lower than the sum of disorders as people may have had more than one type of anxiety disorder.

The Mental Health of Australians 228
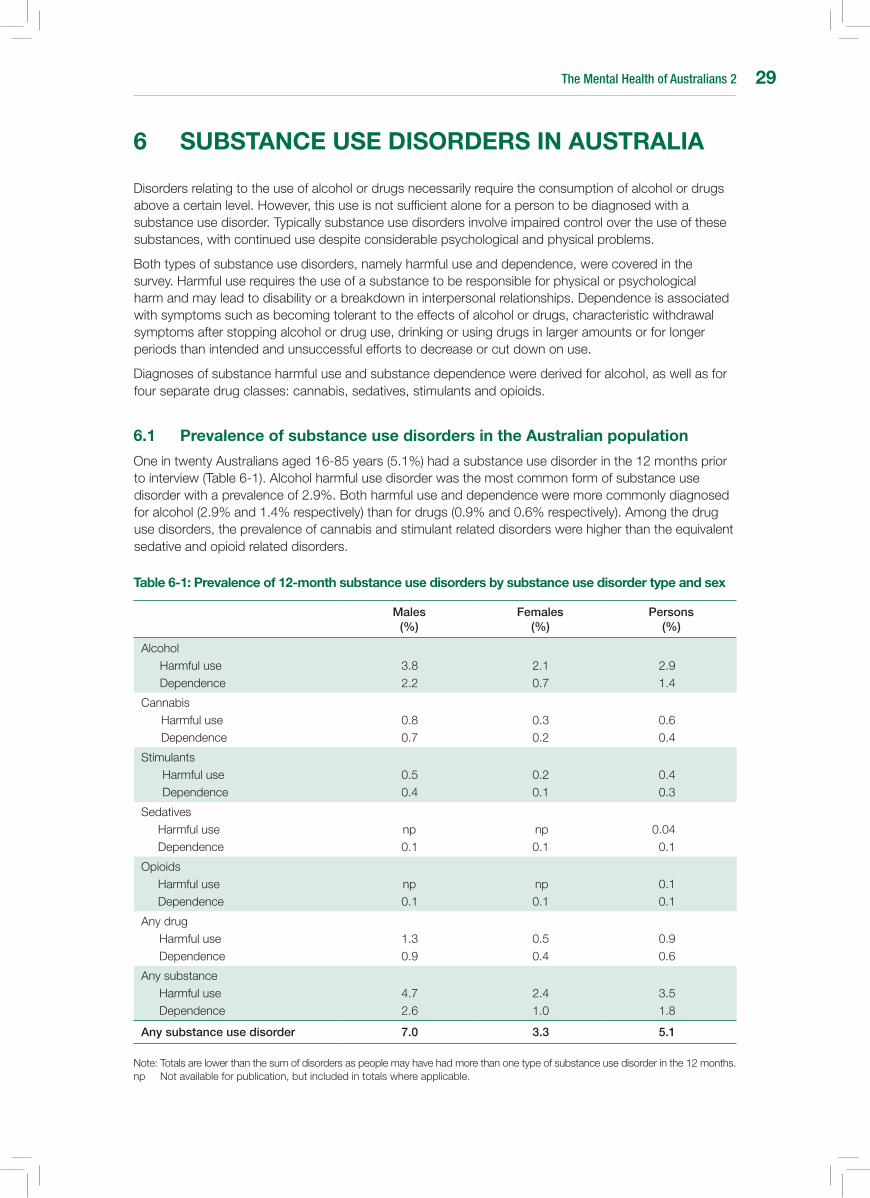
The Mental Health of Australians 2 29
6 subsTAnCE usE DIsORDERs In AusTRALIA
Disorders relating to the use of alcohol or drugs necessarily require the consumption of alcohol or drugs above a certain level. However, this use is not sufficient alone for a person to be diagnosed with a substance use disorder. Typically substance use disorders involve impaired control over the use of these substances, with continued use despite considerable psychological and physical problems.
Both types of substance use disorders, namely harmful use and dependence, were covered in the survey. Harmful use requires the use of a substance to be responsible for physical or psychological harm and may lead to disability or a breakdown in interpersonal relationships. Dependence is associated with symptoms such as becoming tolerant to the effects of alcohol or drugs, characteristic withdrawal symptoms after stopping alcohol or drug use, drinking or using drugs in larger amounts or for longer periods than intended and unsuccessful efforts to decrease or cut down on use.
Diagnoses of substance harmful use and substance dependence were derived for alcohol, as well as for four separate drug classes: cannabis, sedatives, stimulants and opioids.
6.1 Prevalence of substance use disorders in the Australian population
One in twenty Australians aged 16-85 years (5.1%) had a substance use disorder in the 12 months prior to interview (Table 6-1). Alcohol harmful use disorder was the most common form of substance use disorder with a prevalence of 2.9%. Both harmful use and dependence were more commonly diagnosed for alcohol (2.9% and 1.4% respectively) than for drugs (0.9% and 0.6% respectively). Among the drug use disorders, the prevalence of cannabis and stimulant related disorders were higher than the equivalent sedative and opioid related disorders.
Table 6-1: Prevalence of 12-month substance use disorders by substance use disorder type and sex
Males (%)
Females (%)
Persons (%)
Alcohol Harmful useDependence
3.8 2.2
2.1 0.7
2.9 1.4
CannabisHarmful useDependence
0.8 0.7
0.3 0.2
0.6 0.4
StimulantsHarmful useDependence
0.5 0.4
0.2 0.1
0.4 0.3
SedativesHarmful useDependence
np 0.1
np 0.1
0.04 0.1
OpioidsHarmful useDependence
np 0.1
np 0.1
0.1 0.1
Any drugHarmful useDependence
1.3 0.9
0.5 0.4
0.9 0.6
Any substanceHarmful useDependence
4.7 2.6
2.4 1.0
3.5 1.8
Any substance use disorder 7.0 3.3 5.1
Note: Totals are lower than the sum of disorders as people may have had more than one type of substance use disorder in the 12 months.np Not available for publication, but included in totals where applicable.
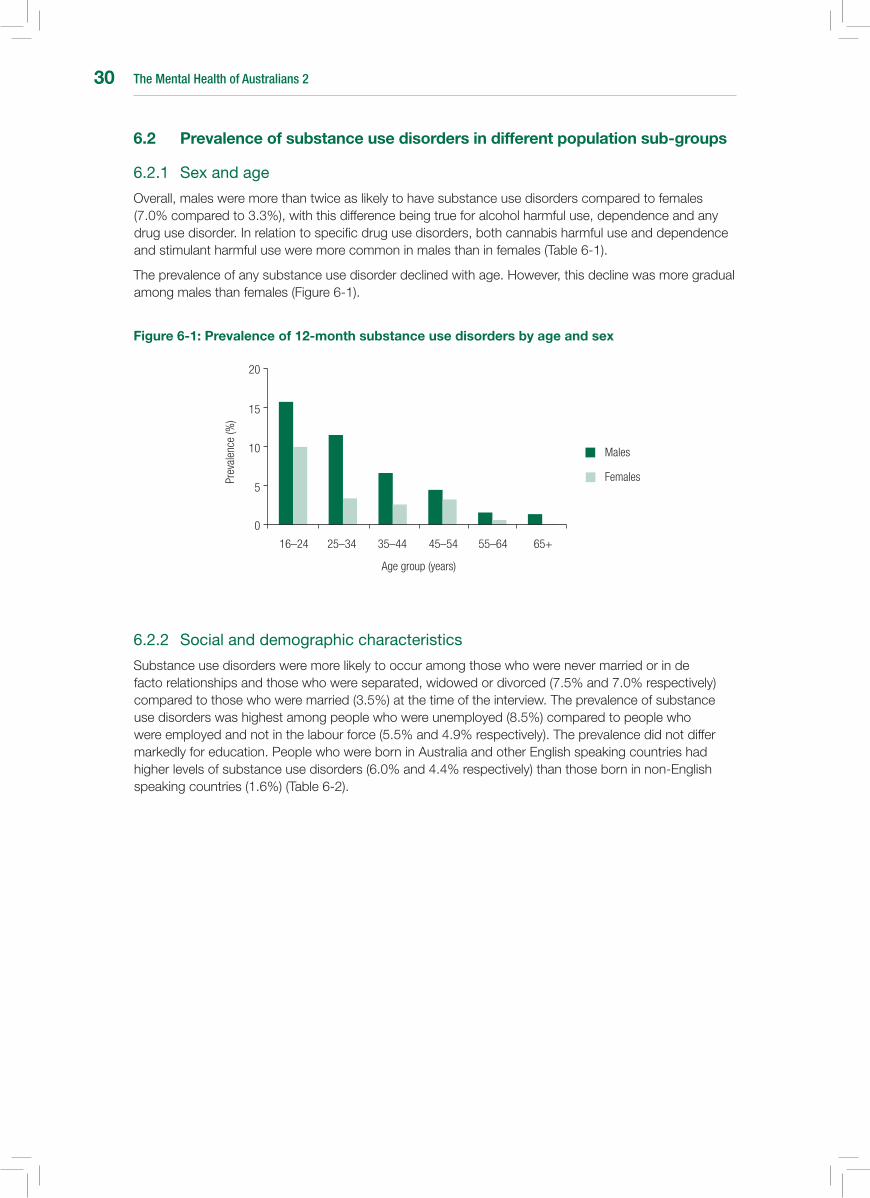
The Mental Health of Australians 230
6.2 Prevalence of substance use disorders in different population sub-groups
6.2.1 Sexandage
Overall, males were more than twice as likely to have substance use disorders compared to females (7.0% compared to 3.3%), with this difference being true for alcohol harmful use, dependence and any drug use disorder. In relation to specific drug use disorders, both cannabis harmful use and dependence and stimulant harmful use were more common in males than in females (Table 6-1).
The prevalence of any substance use disorder declined with age. However, this decline was more gradual among males than females (Figure 6-1).
Figure 6-1: Prevalence of 12-month substance use disorders by age and sex
6.2.2 Socialanddemographiccharacteristics
Substance use disorders were more likely to occur among those who were never married or in de facto relationships and those who were separated, widowed or divorced (7.5% and 7.0% respectively) compared to those who were married (3.5%) at the time of the interview. The prevalence of substance use disorders was highest among people who were unemployed (8.5%) compared to people who were employed and not in the labour force (5.5% and 4.9% respectively). The prevalence did not differ markedly for education. People who were born in Australia and other English speaking countries had higher levels of substance use disorders (6.0% and 4.4% respectively) than those born in non-English speaking countries (1.6%) (Table 6-2).
Females
Males
16–24 25–34 35–44 45–54 55–64 65+
Prev
alen
ce (%
)
0
20
Age group (years)
15
10
5
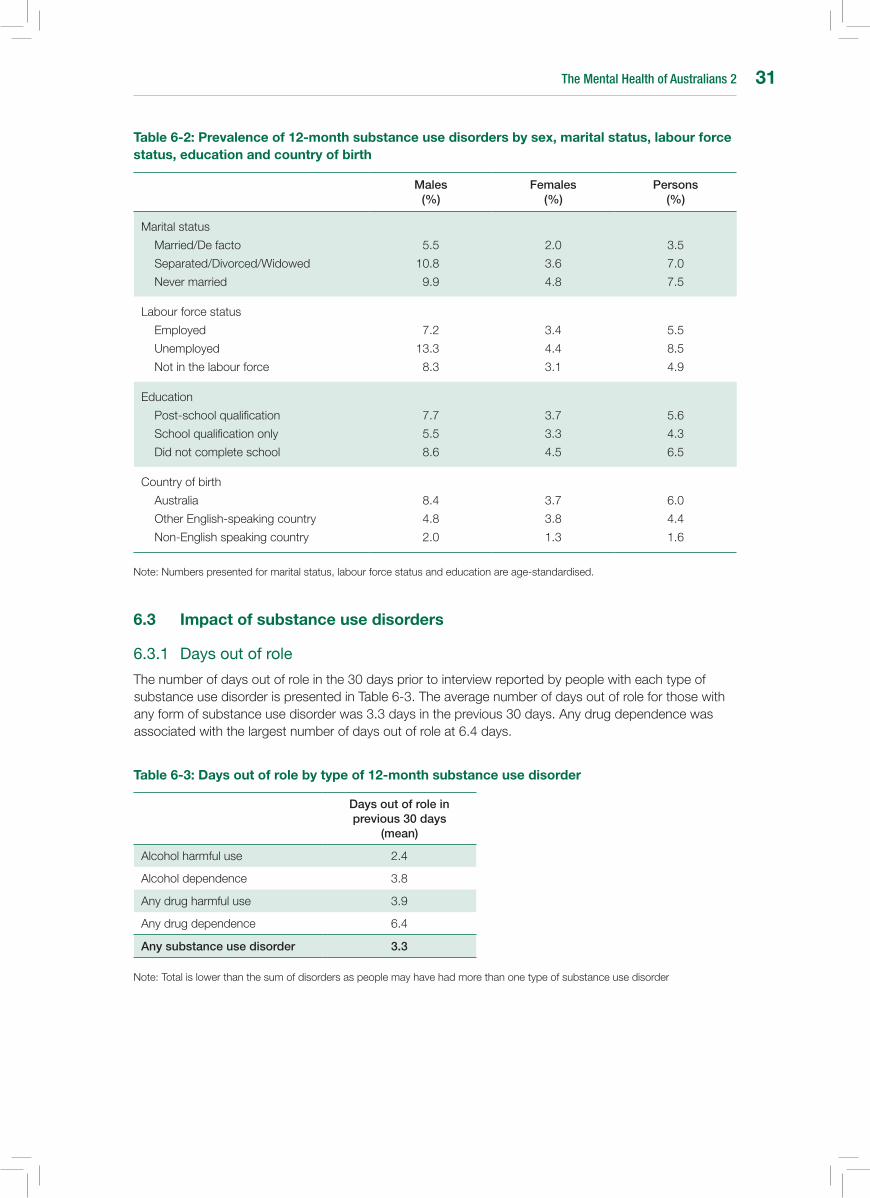
The Mental Health of Australians 2 31
Table 6-2: Prevalence of 12-month substance use disorders by sex, marital status, labour force status, education and country of birth
Males (%)
Females (%)
Persons (%)
Marital status
Married/De facto
Separated/Divorced/Widowed
Never married
5.5
10.8
9.9
2.0
3.6
4.8
3.5
7.0
7.5
Labour force status
Employed
Unemployed
Not in the labour force
7.2
13.3
8.3
3.4
4.4
3.1
5.5
8.5
4.9
Education
Post-school qualification
School qualification only
Did not complete school
7.7
5.5
8.6
3.7
3.3
4.5
5.6
4.3
6.5
Country of birth
Australia
Other English-speaking country
Non-English speaking country
8.4
4.8
2.0
3.7
3.8
1.3
6.0
4.4
1.6
Note: Numbers presented for marital status, labour force status and education are age-standardised.
6.3 Impact of substance use disorders
6.3.1 Daysoutofrole
The number of days out of role in the 30 days prior to interview reported by people with each type of substance use disorder is presented in Table 6-3. The average number of days out of role for those with any form of substance use disorder was 3.3 days in the previous 30 days. Any drug dependence was associated with the largest number of days out of role at 6.4 days.
Table 6-3: Days out of role by type of 12-month substance use disorder
Days out of role in previous 30 days
(mean)
Alcohol harmful use 2.4
Alcohol dependence 3.8
Any drug harmful use 3.9
Any drug dependence 6.4
Any substance use disorder 3.3
Note: Total is lower than the sum of disorders as people may have had more than one type of substance use disorder
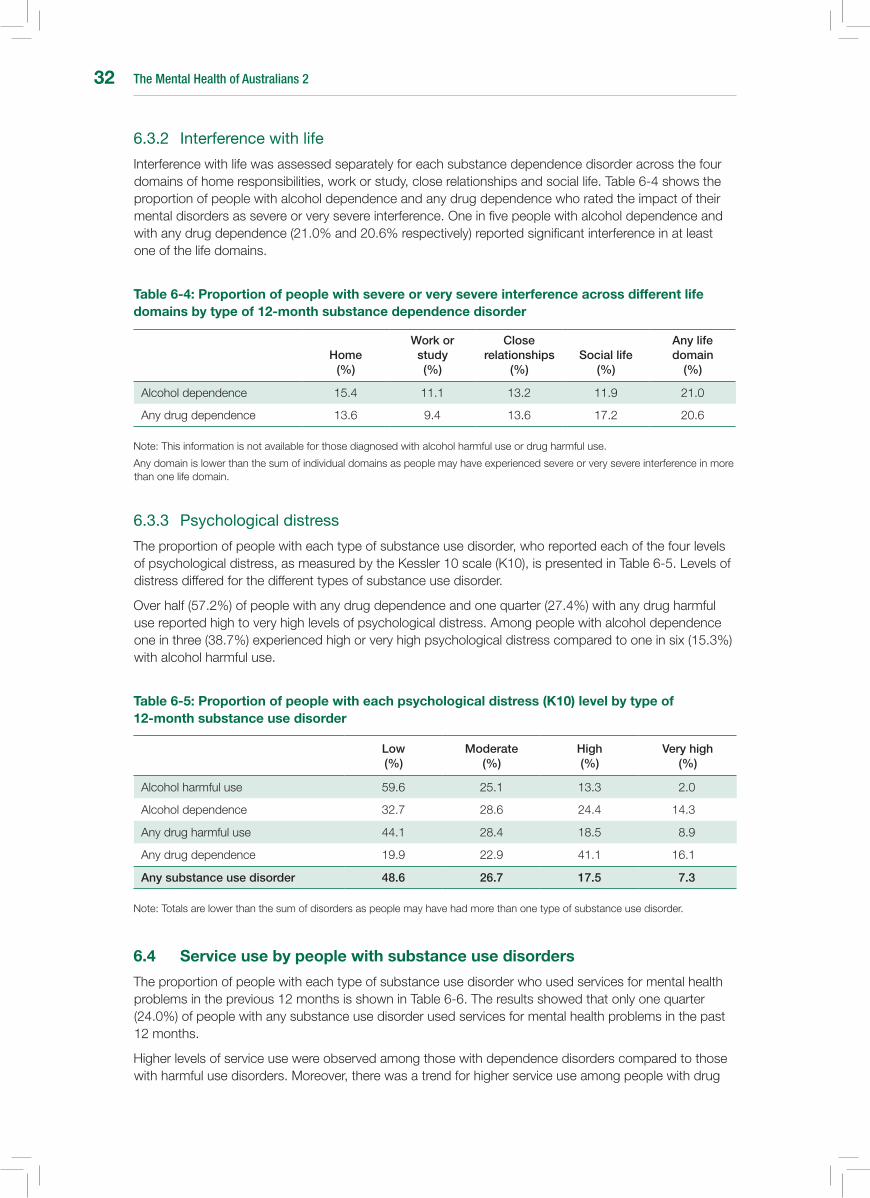
The Mental Health of Australians 232
6.3.2 Interferencewithlife
Interference with life was assessed separately for each substance dependence disorder across the four domains of home responsibilities, work or study, close relationships and social life. Table 6-4 shows the proportion of people with alcohol dependence and any drug dependence who rated the impact of their mental disorders as severe or very severe interference. One in five people with alcohol dependence and with any drug dependence (21.0% and 20.6% respectively) reported significant interference in at least one of the life domains.
Table 6-4: Proportion of people with severe or very severe interference across different life domains by type of 12-month substance dependence disorder
Home (%)
Work or study (%)
Close relationships
(%)Social life
(%)
Any life domain
(%)
Alcohol dependence 15.4 11.1 13.2 11.9 21.0
Any drug dependence 13.6 9.4 13.6 17.2 20.6
Note: This information is not available for those diagnosed with alcohol harmful use or drug harmful use.
Any domain is lower than the sum of individual domains as people may have experienced severe or very severe interference in more than one life domain.
6.3.3 Psychologicaldistress
The proportion of people with each type of substance use disorder, who reported each of the four levels of psychological distress, as measured by the Kessler 10 scale (K10), is presented in Table 6-5. Levels of distress differed for the different types of substance use disorder.
Over half (57.2%) of people with any drug dependence and one quarter (27.4%) with any drug harmful use reported high to very high levels of psychological distress. Among people with alcohol dependence one in three (38.7%) experienced high or very high psychological distress compared to one in six (15.3%) with alcohol harmful use.
Table 6-5: Proportion of people with each psychological distress (K10) level by type of 12-month substance use disorder
Low (%)
Moderate (%)
High (%)
Very high (%)
Alcohol harmful use 59.6 25.1 13.3 2.0
Alcohol dependence 32.7 28.6 24.4 14.3
Any drug harmful use 44.1 28.4 18.5 8.9
Any drug dependence 19.9 22.9 41.1 16.1
Any substance use disorder 48.6 26.7 17.5 7.3
Note: Totals are lower than the sum of disorders as people may have had more than one type of substance use disorder.
6.4 service use by people with substance use disorders
The proportion of people with each type of substance use disorder who used services for mental health problems in the previous 12 months is shown in Table 6-6. The results showed that only one quarter (24.0%) of people with any substance use disorder used services for mental health problems in the past 12 months.
Higher levels of service use were observed among those with dependence disorders compared to those with harmful use disorders. Moreover, there was a trend for higher service use among people with drug
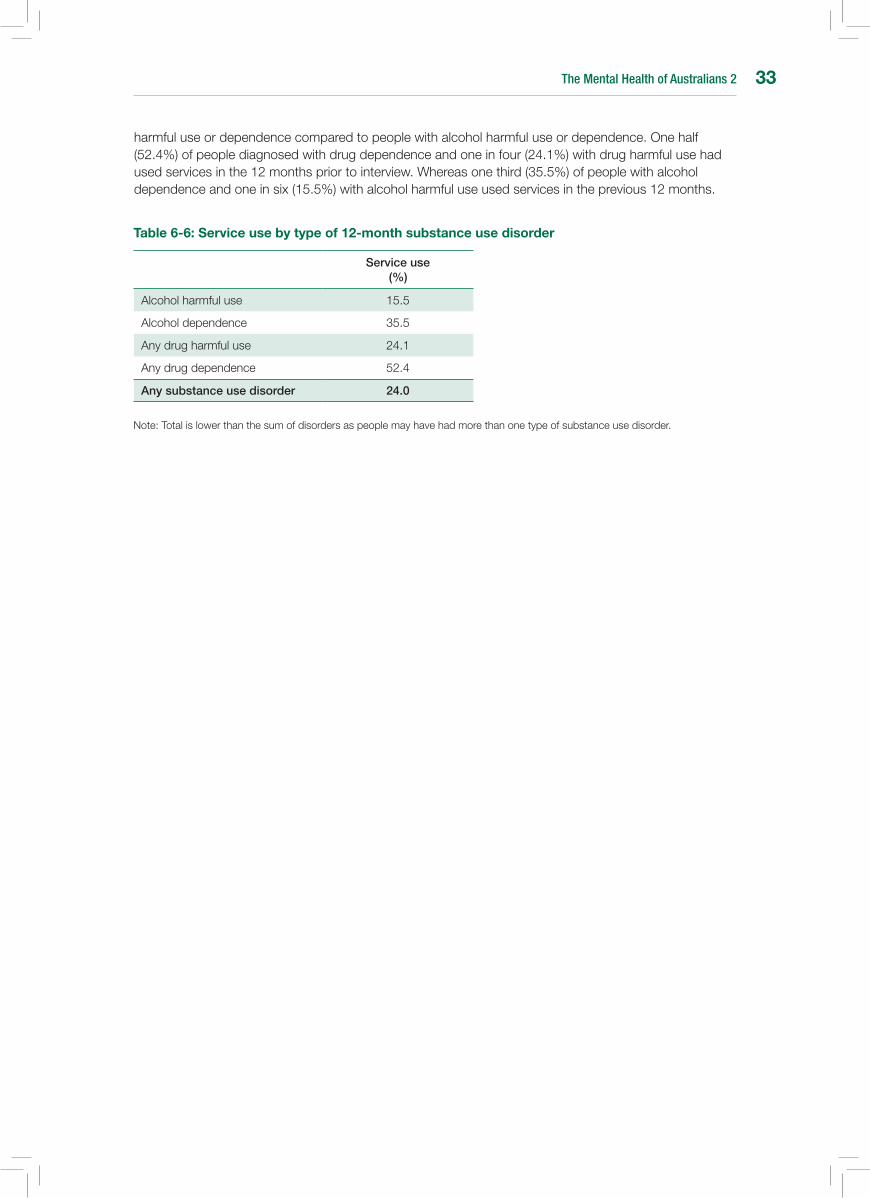
The Mental Health of Australians 2 33
harmful use or dependence compared to people with alcohol harmful use or dependence. One half (52.4%) of people diagnosed with drug dependence and one in four (24.1%) with drug harmful use had used services in the 12 months prior to interview. Whereas one third (35.5%) of people with alcohol dependence and one in six (15.5%) with alcohol harmful use used services in the previous 12 months.
Table 6-6: service use by type of 12-month substance use disorder
Service use (%)
Alcohol harmful use 15.5
Alcohol dependence 35.5
Any drug harmful use 24.1
Any drug dependence 52.4
Any substance use disorder 24.0
Note: Total is lower than the sum of disorders as people may have had more than one type of substance use disorder.

The Mental Health of Australians 234
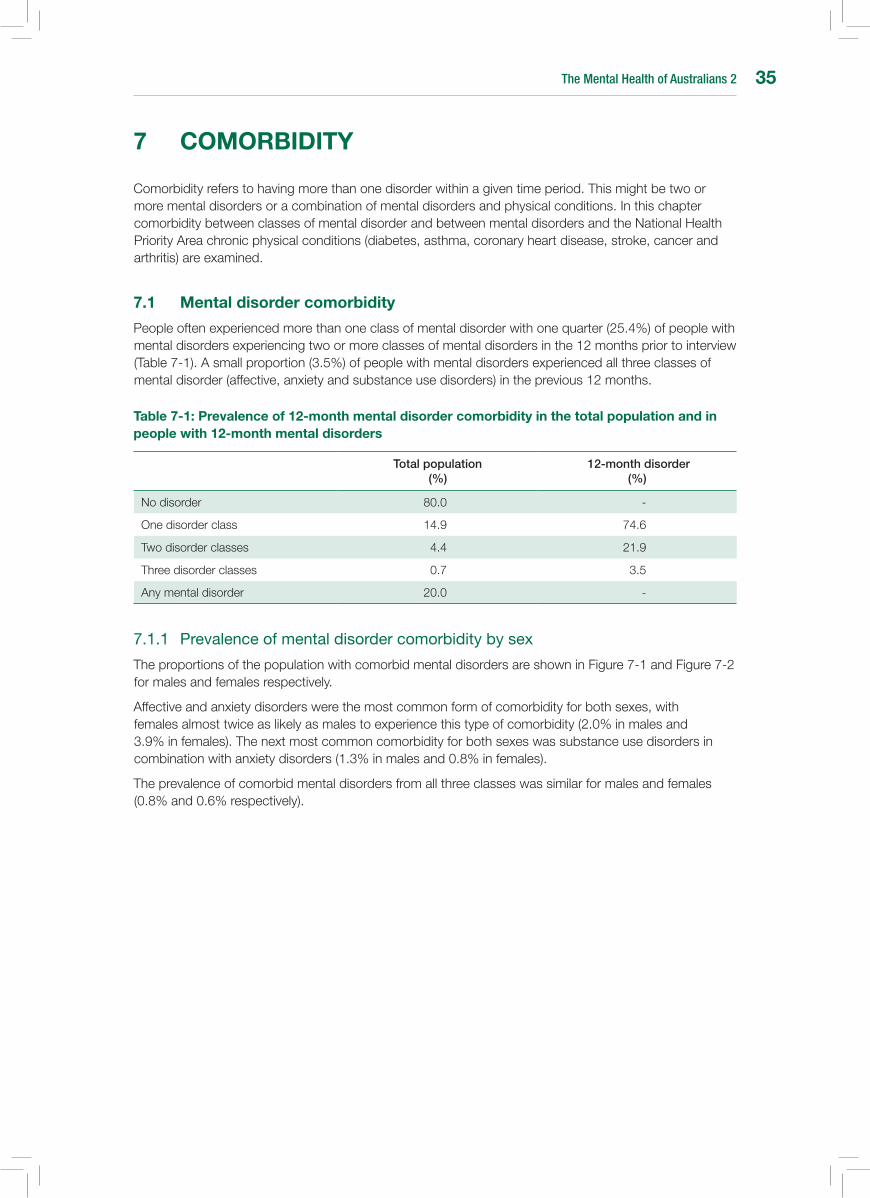
The Mental Health of Australians 2 35
7 COMORbIDITY
Comorbidity refers to having more than one disorder within a given time period. This might be two or more mental disorders or a combination of mental disorders and physical conditions. In this chapter comorbidity between classes of mental disorder and between mental disorders and the National Health Priority Area chronic physical conditions (diabetes, asthma, coronary heart disease, stroke, cancer and arthritis) are examined.
7.1 Mental disorder comorbidity
People often experienced more than one class of mental disorder with one quarter (25.4%) of people with mental disorders experiencing two or more classes of mental disorders in the 12 months prior to interview (Table 7-1). A small proportion (3.5%) of people with mental disorders experienced all three classes of mental disorder (affective, anxiety and substance use disorders) in the previous 12 months.
Table 7-1: Prevalence of 12-month mental disorder comorbidity in the total population and in people with 12-month mental disorders
Total population (%)
12-month disorder (%)
No disorder 80.0 -
One disorder class 14.9 74.6
Two disorder classes 4.4 21.9
Three disorder classes 0.7 3.5
Any mental disorder 20.0 -
7.1.1 Prevalenceofmentaldisordercomorbiditybysex
The proportions of the population with comorbid mental disorders are shown in Figure 7-1 and Figure 7-2 for males and females respectively.
Affective and anxiety disorders were the most common form of comorbidity for both sexes, with females almost twice as likely as males to experience this type of comorbidity (2.0% in males and 3.9% in females). The next most common comorbidity for both sexes was substance use disorders in combination with anxiety disorders (1.3% in males and 0.8% in females).
The prevalence of comorbid mental disorders from all three classes was similar for males and females (0.8% and 0.6% respectively).
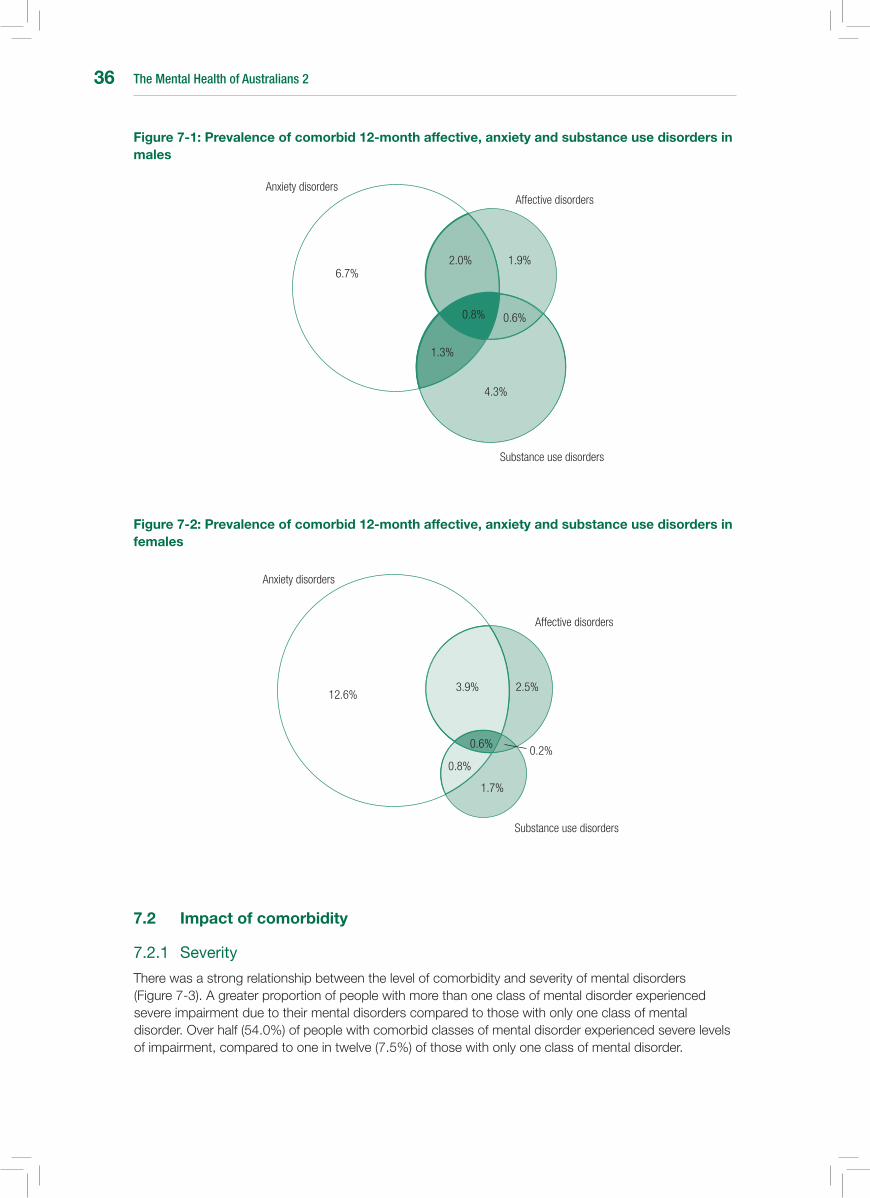
The Mental Health of Australians 236
Figure 7-1: Prevalence of comorbid 12-month affective, anxiety and substance use disorders in males
Figure 7-2: Prevalence of comorbid 12-month affective, anxiety and substance use disorders in females
1.9%2.0%
0.6%0.8%
6.7%
1.3%
4.3%
Substance use disorders
Affective disordersAnxiety disorders
Substance use disorders
Affective disorders
Anxiety disorders
12.6%2.5%3.9%
0.6%
0.8%0.2%
1.7%
7.2 Impact of comorbidity
7.2.1 Severity
There was a strong relationship between the level of comorbidity and severity of mental disorders (Figure 7-3). A greater proportion of people with more than one class of mental disorder experienced severe impairment due to their mental disorders compared to those with only one class of mental disorder. Over half (54.0%) of people with comorbid classes of mental disorder experienced severe levels of impairment, compared to one in twelve (7.5%) of those with only one class of mental disorder.
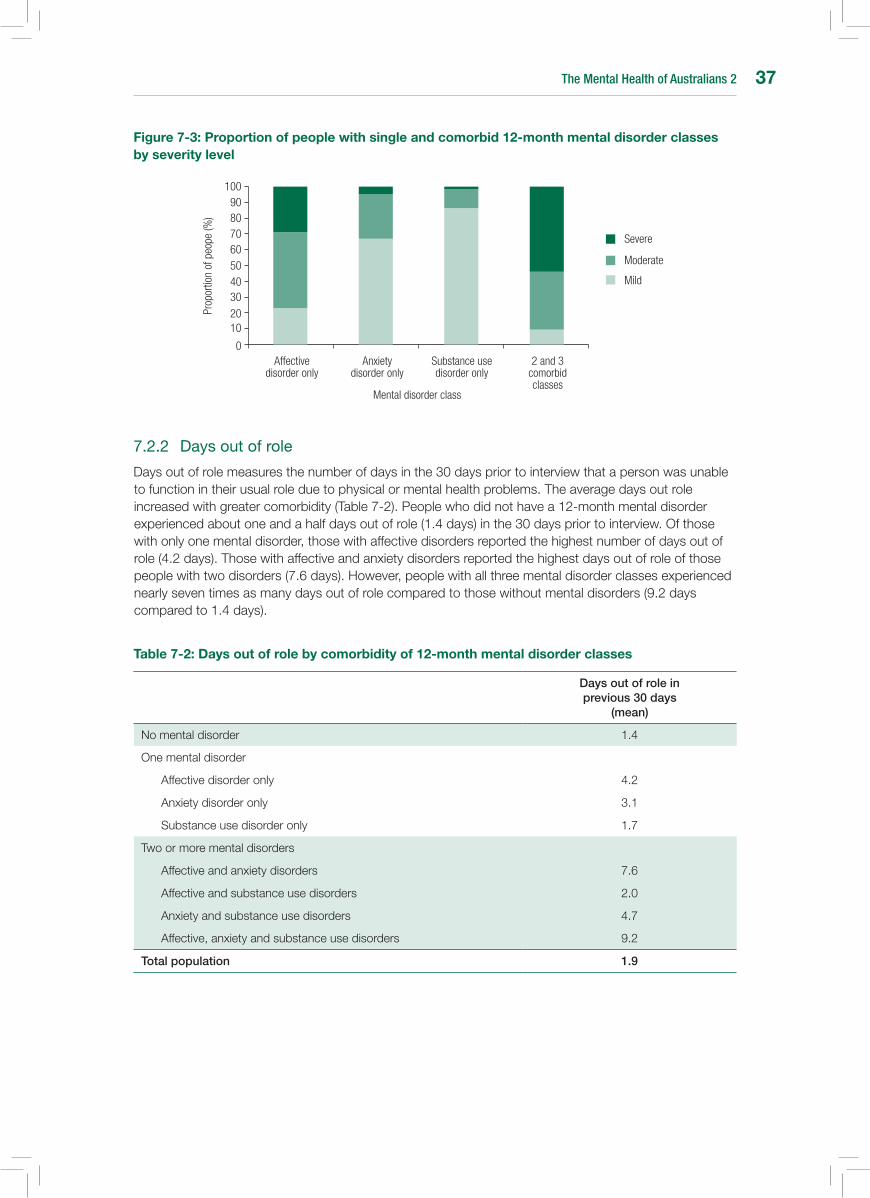
The Mental Health of Australians 2 37
Figure 7-3: Proportion of people with single and comorbid 12-month mental disorder classes by severity level
7.2.2 Daysoutofrole
Days out of role measures the number of days in the 30 days prior to interview that a person was unable to function in their usual role due to physical or mental health problems. The average days out role increased with greater comorbidity (Table 7-2). People who did not have a 12-month mental disorder experienced about one and a half days out of role (1.4 days) in the 30 days prior to interview. Of those with only one mental disorder, those with affective disorders reported the highest number of days out of role (4.2 days). Those with affective and anxiety disorders reported the highest days out of role of those people with two disorders (7.6 days). However, people with all three mental disorder classes experienced nearly seven times as many days out of role compared to those without mental disorders (9.2 days compared to 1.4 days).
Table 7-2: Days out of role by comorbidity of 12-month mental disorder classes
Days out of role in previous 30 days
(mean)
No mental disorder 1.4
One mental disorder
Affective disorder only 4.2
Anxiety disorder only 3.1
Substance use disorder only 1.7
Two or more mental disorders
Affective and anxiety disorders 7.6
Affective and substance use disorders 2.0
Anxiety and substance use disorders 4.7
Affective, anxiety and substance use disorders 9.2
Total population 1.9
Moderate
Affective disorder only
0
1020
3040506070
Prop
ortio
n of
peo
pe (%
)
Anxiety disorder only
Substance use disorder only
2 and 3 comorbid classes
Mental disorder class
8090
100
Severe
Mild

The Mental Health of Australians 238
7.3 Mental and physical disorder comorbidity
The 2007 National Survey of Mental Health and Wellbeing focussed on the six chronic physical conditions recognised as National Health Priority Areas (NHPA). These are diabetes, asthma, coronary heart disease, stroke, cancer and arthritis. Just less than one third (32.2%) of the population reported having at least one of the NHPA chronic physical conditions. There was little variation between the sexes (30.0% in males and 34.3% in females) (Table 7-3).
One third (34.0%) of people with 12-month mental disorders also identified that they had a chronic physical condition. For females, 38.2% of those with 12-month mental disorders had a chronic physical condition compared to 33.2% of females without a mental disorder. For males, 28.5% of those with 12-month mental disorders also had a chronic physical condition compared to 30.3% without a mental disorder.
Table 7-3: Prevalence of chronic physical conditions in people with 12-month mental disorders by sex
Any National Health Priority Area chronic physical condition (%)
Males Females Persons
Any mental disorder 28.5 38.2 34.0
No mental disorder 30.3 33.2 31.7
Total population 30.0 34.3 32.2
Mental disorders were more common among the population with chronic physical conditions than those without (28.0% compared to 17.6%) (Table 7-4). This was particularly true for females with 32.9% of those with a chronic physical condition also having 12-month mental disorders compared to 22.1% of males.
Table 7-4: Age-standardised prevalence of 12-month mental disorders in people with national Health Priority Area (nHPA) chronic physical conditions by sex
Males (%)
Females (%)
Persons (%)
Any NHPA chronic physical condition 22.1 32.9 28.0
No NHPA chronic physical condition 16.4 19.0 17.6
Total population 17.9 22.6 20.3
Note: Total population prevalence differs to that presented elsewhere due to age-standardisation.
7.3.1 Daysoutofrole
The average number of days out of role experienced by people with comorbid mental disorders and chronic physical conditions is shown in Table 7-5. People without a mental disorder or chronic physical condition had one day out role in the previous 30 days.
People with chronic physical conditions only had 2.5 days out of role. However, people with mental disorders had on average more days out of role, with those with mental disorders only reporting 3.2 days out of role and those with both a mental disorder and a chronic physical condition reporting the greatest number of days out of role (5.5 days) (Table 7-5).
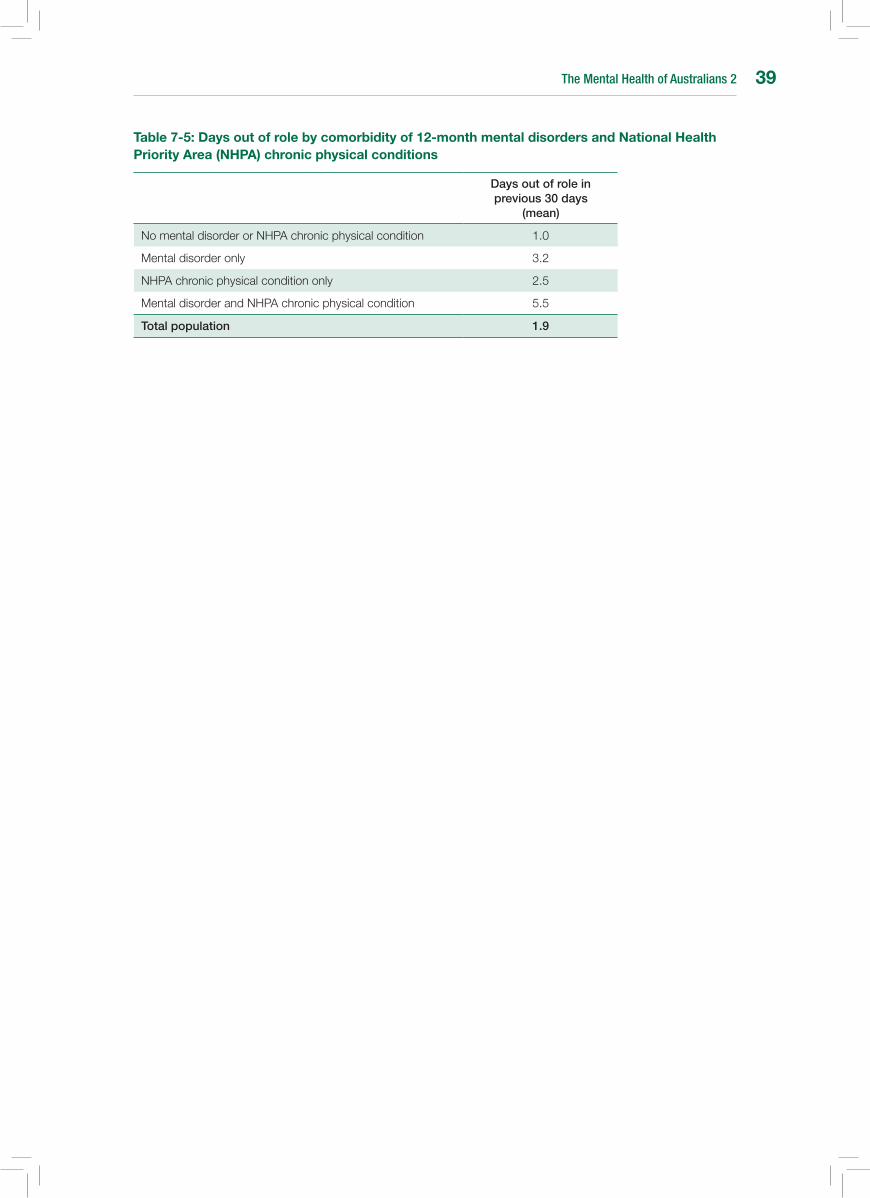
The Mental Health of Australians 2 39
Table 7-5: Days out of role by comorbidity of 12-month mental disorders and national Health Priority Area (nHPA) chronic physical conditions
Days out of role in previous 30 days
(mean)
No mental disorder or NHPA chronic physical condition 1.0
Mental disorder only 3.2
NHPA chronic physical condition only 2.5
Mental disorder and NHPA chronic physical condition 5.5
Total population 1.9

The Mental Health of Australians 240
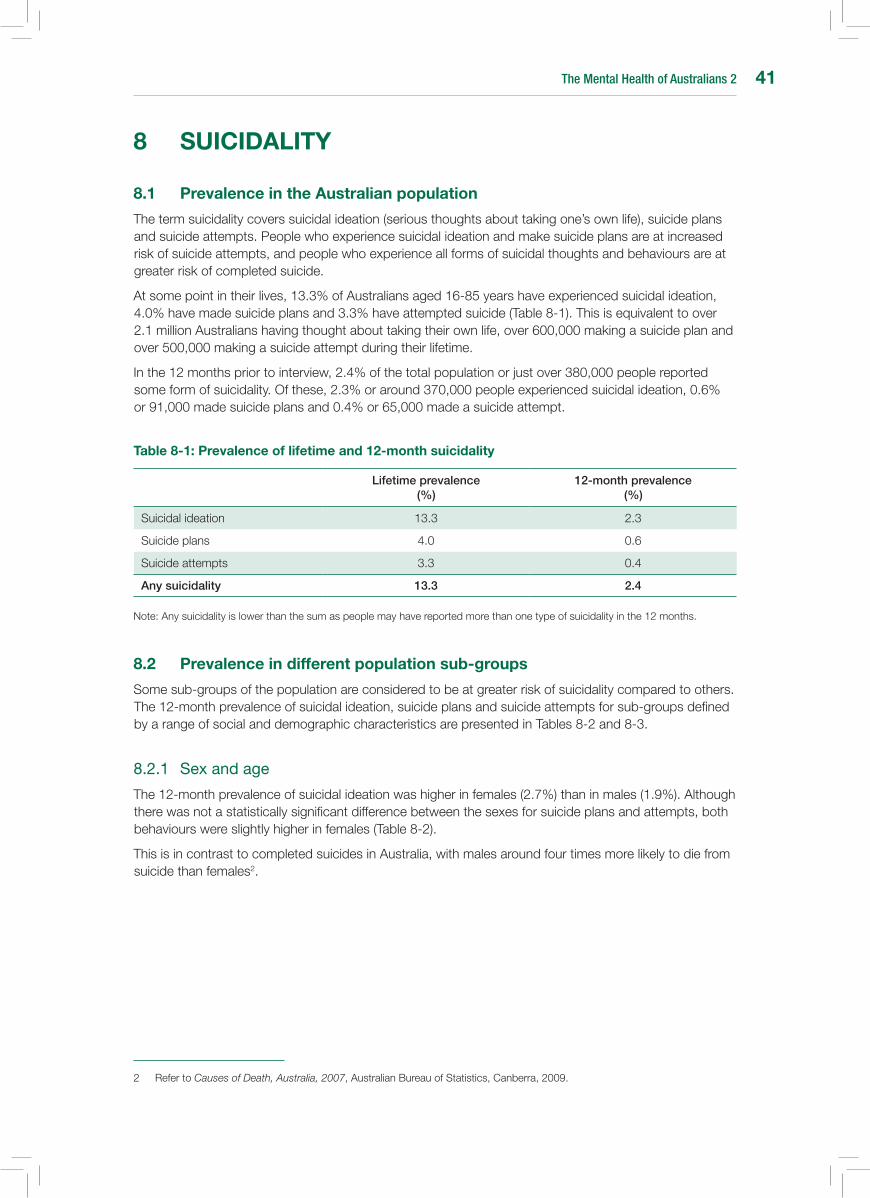
The Mental Health of Australians 2 41
8 suICIDALITY
8.1 Prevalence in the Australian population
The term suicidality covers suicidal ideation (serious thoughts about taking one’s own life), suicide plans and suicide attempts. People who experience suicidal ideation and make suicide plans are at increased risk of suicide attempts, and people who experience all forms of suicidal thoughts and behaviours are at greater risk of completed suicide.
At some point in their lives, 13.3% of Australians aged 16-85 years have experienced suicidal ideation, 4.0% have made suicide plans and 3.3% have attempted suicide (Table 8-1). This is equivalent to over 2.1 million Australians having thought about taking their own life, over 600,000 making a suicide plan and over 500,000 making a suicide attempt during their lifetime.
In the 12 months prior to interview, 2.4% of the total population or just over 380,000 people reported some form of suicidality. Of these, 2.3% or around 370,000 people experienced suicidal ideation, 0.6% or 91,000 made suicide plans and 0.4% or 65,000 made a suicide attempt.
Table 8-1: Prevalence of lifetime and 12-month suicidality
Lifetime prevalence (%)
12-month prevalence (%)
Suicidal ideation 13.3 2.3
Suicide plans 4.0 0.6
Suicide attempts 3.3 0.4
Any suicidality 13.3 2.4
Note: Any suicidality is lower than the sum as people may have reported more than one type of suicidality in the 12 months.
8.2 Prevalence in different population sub-groups
Some sub-groups of the population are considered to be at greater risk of suicidality compared to others. The 12-month prevalence of suicidal ideation, suicide plans and suicide attempts for sub-groups defined by a range of social and demographic characteristics are presented in Tables 8-2 and 8-3.
8.2.1 Sexandage
The 12-month prevalence of suicidal ideation was higher in females (2.7%) than in males (1.9%). Although there was not a statistically significant difference between the sexes for suicide plans and attempts, both behaviours were slightly higher in females (Table 8-2).
This is in contrast to completed suicides in Australia, with males around four times more likely to die from suicide than females2.
2 Refer to Causes of Death, Australia, 2007, Australian Bureau of Statistics, Canberra, 2009.
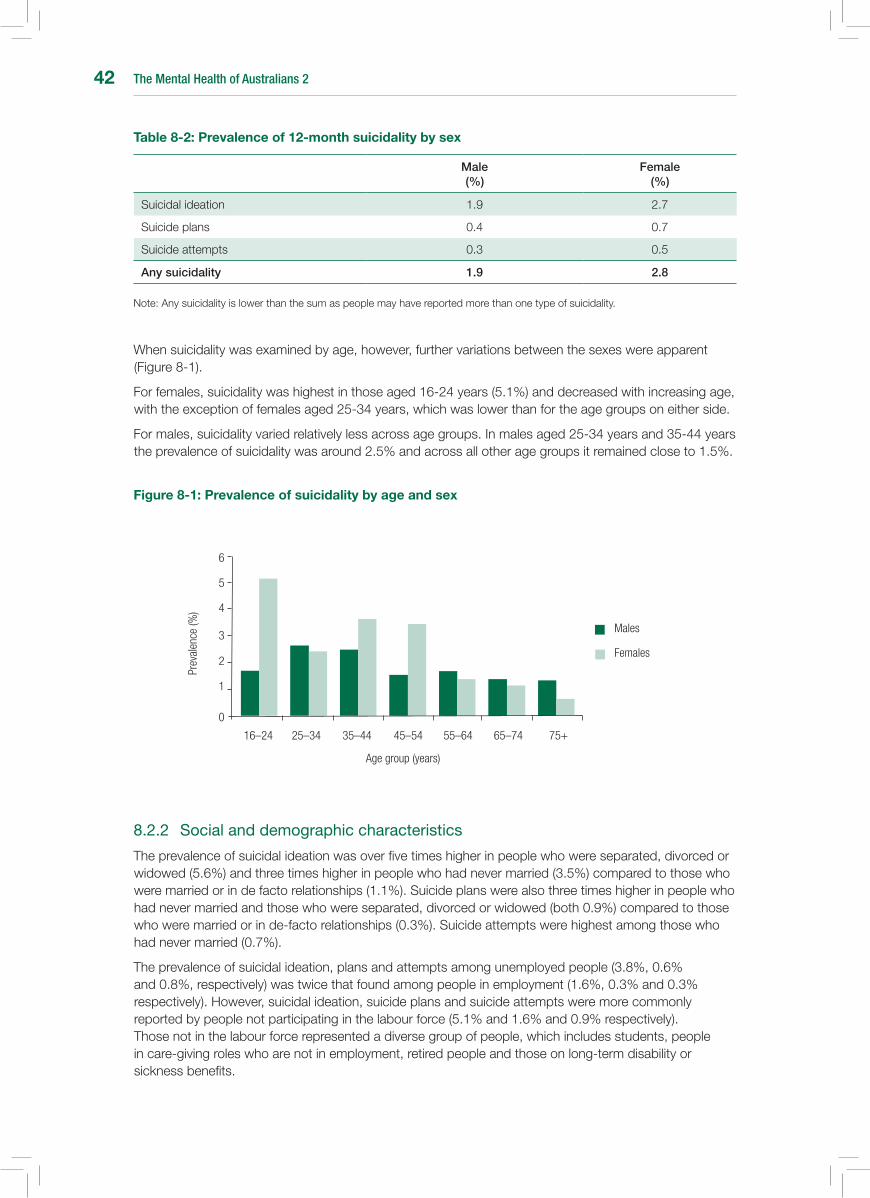
The Mental Health of Australians 242
Table 8-2: Prevalence of 12-month suicidality by sex
Male (%)
Female (%)
Suicidal ideation 1.9 2.7
Suicide plans 0.4 0.7
Suicide attempts 0.3 0.5
Any suicidality 1.9 2.8
Note: Any suicidality is lower than the sum as people may have reported more than one type of suicidality.
When suicidality was examined by age, however, further variations between the sexes were apparent (Figure 8-1).
For females, suicidality was highest in those aged 16-24 years (5.1%) and decreased with increasing age, with the exception of females aged 25-34 years, which was lower than for the age groups on either side.
For males, suicidality varied relatively less across age groups. In males aged 25-34 years and 35-44 years the prevalence of suicidality was around 2.5% and across all other age groups it remained close to 1.5%.
Figure 8-1: Prevalence of suicidality by age and sex
Age group (years)
16–24 25–34 35–44 45–54 55–64 65–74 75+
Prev
alen
ce (%
)
0
1
2
3
4
5
6
Females
Males
8.2.2 Socialanddemographiccharacteristics
The prevalence of suicidal ideation was over five times higher in people who were separated, divorced or widowed (5.6%) and three times higher in people who had never married (3.5%) compared to those who were married or in de facto relationships (1.1%). Suicide plans were also three times higher in people who had never married and those who were separated, divorced or widowed (both 0.9%) compared to those who were married or in de-facto relationships (0.3%). Suicide attempts were highest among those who had never married (0.7%).
The prevalence of suicidal ideation, plans and attempts among unemployed people (3.8%, 0.6% and 0.8%, respectively) was twice that found among people in employment (1.6%, 0.3% and 0.3% respectively). However, suicidal ideation, suicide plans and suicide attempts were more commonly reported by people not participating in the labour force (5.1% and 1.6% and 0.9% respectively). Those not in the labour force represented a diverse group of people, which includes students, people in care-giving roles who are not in employment, retired people and those on long-term disability or sickness benefits.

The Mental Health of Australians 2 43
People who did not complete school and people with post-school qualifications were more likely to have made suicide plans in the previous 12 months (0.6% and 0.8% respectively) compared to those with only a school qualification (0.1%). There was no relationship between suicidal ideation and level of education.Suicidal ideation, plans and attempts did not vary by people’s country of birth.
Table 8-3: Prevalence of 12-month suicidality by marital status, labour force status, education and country of birth
Suicidal ideation (%)
Suicide plans (%)
Suicide attempt (%)
Marital status
Married/De facto
Separated/Divorced/Widowed
Never married
1.1
5.6
3.5
0.3
0.9
0.9
0.2
0.1
0.7
Labour force status
Employed
Unemployed
Not in the labour force
1.6
3.8
5.1
0.3
0.6
1.6
0.3
0.8
0.9
Education
Post-school qualification
School qualification only
Did not complete school
2.6
1.4
3.2
0.8
0.1
0.6
0.4
np
np
Country of birth
Australia
Other English-speaking country
Non-English speaking country
2.5
1.6
2.0
0.6
0.6
0.4
0.4
0.3
0.3
Note: Numbers presented for marital status, labour force status and education are age-standardised. np Not available for publication.
8.2.3 Suicidalityinpeoplewith12-monthmentaldisorders
Suicidality in the previous 12 months was reported by 8.6% of people with a 12-month mental disorder (Table 8-4). This is three and a half times higher than suicidality in the general population.
Although experiences of suicidality are much more common in people with mental disorders, these experiences are not confined solely to this group. The prevalence of suicidality in people without a 12-month mental disorder was 0.8% (Table 8-5).
In terms of specific classes of disorders, the strongest association was between suicidality and affective disorders. Suicidal ideation was around one half times higher for those with affective disorders than for those with substance use disorders and anxiety disorders (16.8% compared to 10.8% and 8.9% respectively). Suicide plans and attempts were two times higher for affective disorders than for substance use disorders, and even higher than in people with anxiety disorders.
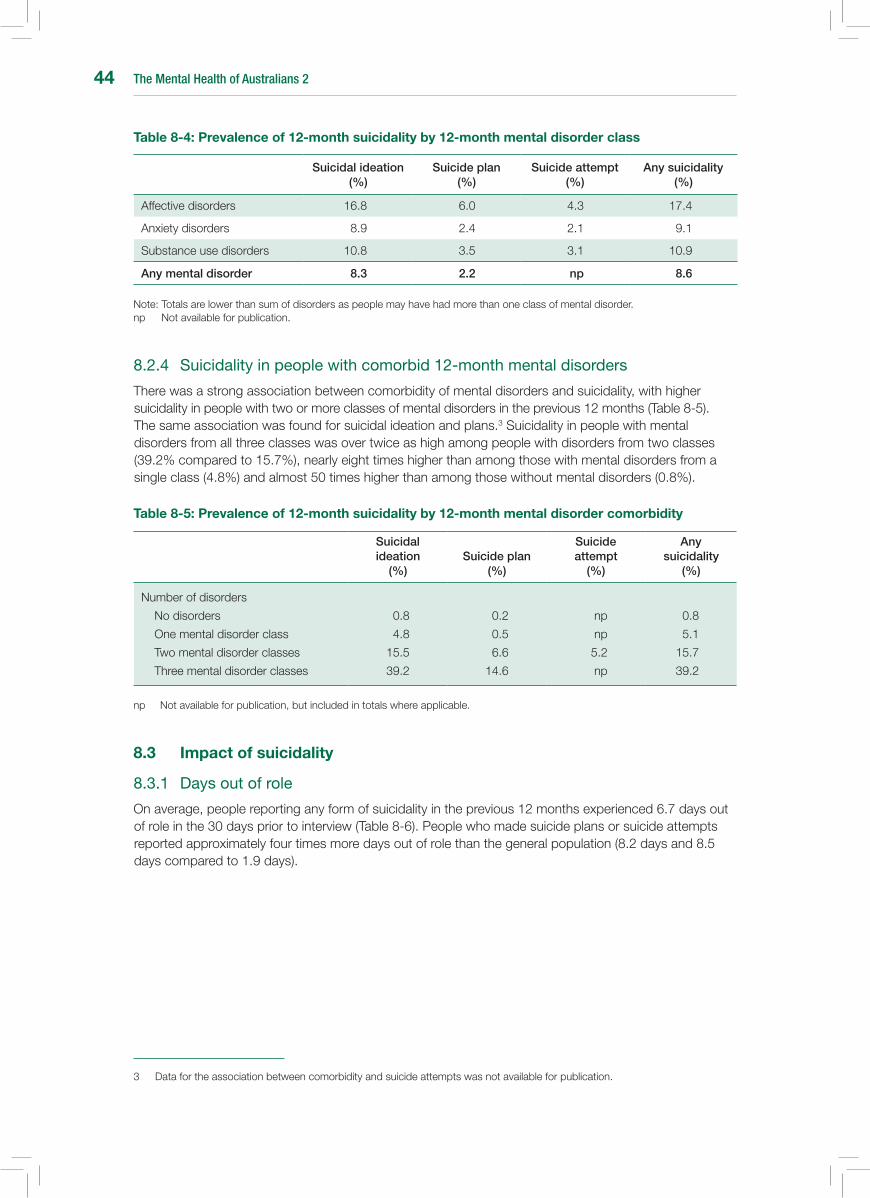
The Mental Health of Australians 244
Table 8-4: Prevalence of 12-month suicidality by 12-month mental disorder class
Suicidal ideation (%)
Suicide plan (%)
Suicide attempt (%)
Any suicidality (%)
Affective disorders 16.8 6.0 4.3 17.4
Anxiety disorders 8.9 2.4 2.1 9.1
Substance use disorders 10.8 3.5 3.1 10.9
Any mental disorder 8.3 2.2 np 8.6
Note: Totals are lower than sum of disorders as people may have had more than one class of mental disorder. np Not available for publication.
8.2.4 Suicidalityinpeoplewithcomorbid12-monthmentaldisorders
There was a strong association between comorbidity of mental disorders and suicidality, with higher suicidality in people with two or more classes of mental disorders in the previous 12 months (Table 8-5). The same association was found for suicidal ideation and plans.3 Suicidality in people with mental disorders from all three classes was over twice as high among people with disorders from two classes (39.2% compared to 15.7%), nearly eight times higher than among those with mental disorders from a single class (4.8%) and almost 50 times higher than among those without mental disorders (0.8%).
Table 8-5: Prevalence of 12-month suicidality by 12-month mental disorder comorbidity
Suicidal ideation
(%)Suicide plan
(%)
Suicide attempt
(%)
Any suicidality
(%)
Number of disorders
No disorders
One mental disorder class
Two mental disorder classes
Three mental disorder classes
0.8
4.8
15.5
39.2
0.2
0.5
6.6
14.6
np
np
5.2
np
0.8
5.1
15.7
39.2
np Not available for publication, but included in totals where applicable.
8.3 Impact of suicidality
8.3.1 Daysoutofrole
On average, people reporting any form of suicidality in the previous 12 months experienced 6.7 days out of role in the 30 days prior to interview (Table 8-6). People who made suicide plans or suicide attempts reported approximately four times more days out of role than the general population (8.2 days and 8.5 days compared to 1.9 days).
3 Data for the association between comorbidity and suicide attempts was not available for publication.
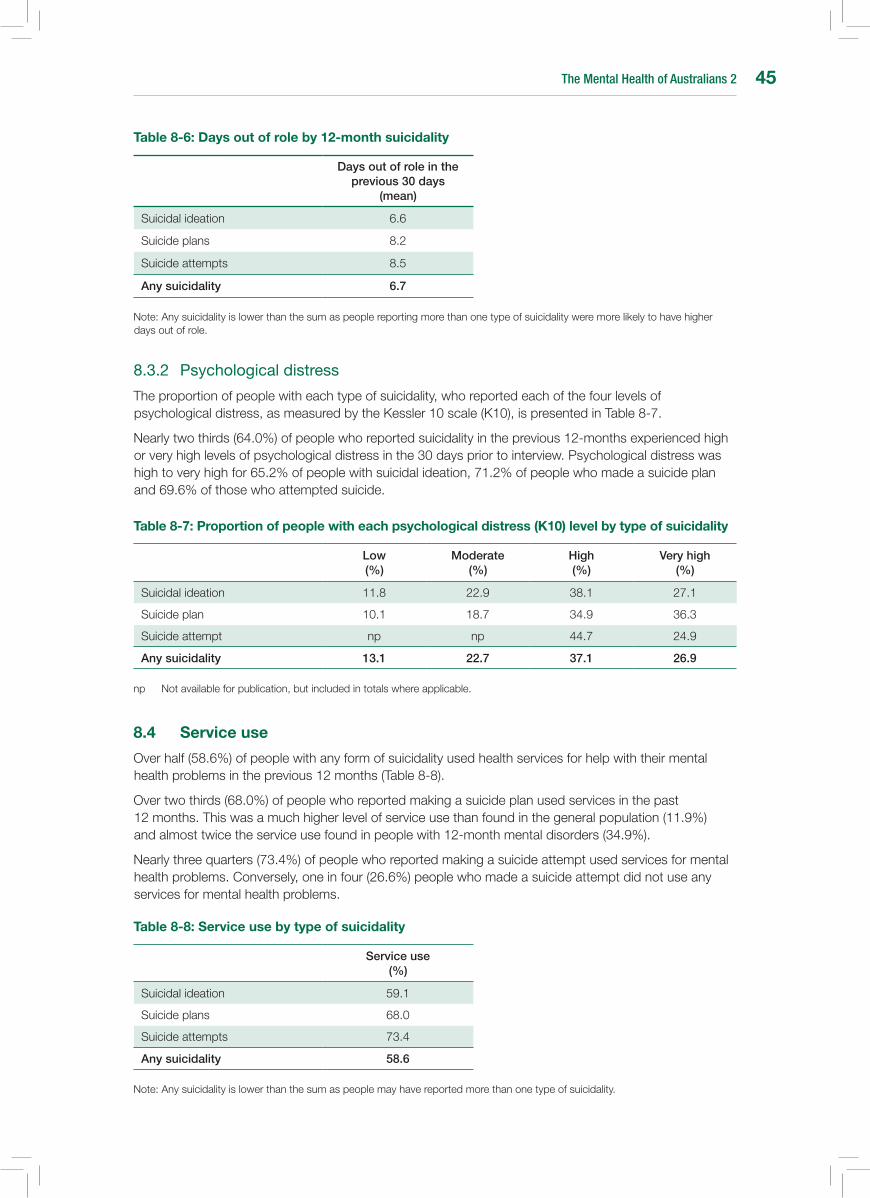
The Mental Health of Australians 2 45
Table 8-6: Days out of role by 12-month suicidality
Days out of role in the previous 30 days
(mean)
Suicidal ideation 6.6
Suicide plans 8.2
Suicide attempts 8.5
Any suicidality 6.7
Note: Any suicidality is lower than the sum as people reporting more than one type of suicidality were more likely to have higher days out of role.
8.3.2 Psychologicaldistress
The proportion of people with each type of suicidality, who reported each of the four levels of psychological distress, as measured by the Kessler 10 scale (K10), is presented in Table 8-7.
Nearly two thirds (64.0%) of people who reported suicidality in the previous 12-months experienced high or very high levels of psychological distress in the 30 days prior to interview. Psychological distress was high to very high for 65.2% of people with suicidal ideation, 71.2% of people who made a suicide plan and 69.6% of those who attempted suicide.
Table 8-7: Proportion of people with each psychological distress (K10) level by type of suicidality
Low (%)
Moderate (%)
High (%)
Very high (%)
Suicidal ideation 11.8 22.9 38.1 27.1
Suicide plan 10.1 18.7 34.9 36.3
Suicide attempt np np 44.7 24.9
Any suicidality 13.1 22.7 37.1 26.9
np Not available for publication, but included in totals where applicable.
8.4 service use
Over half (58.6%) of people with any form of suicidality used health services for help with their mental health problems in the previous 12 months (Table 8-8).
Over two thirds (68.0%) of people who reported making a suicide plan used services in the past 12 months. This was a much higher level of service use than found in the general population (11.9%) and almost twice the service use found in people with 12-month mental disorders (34.9%).
Nearly three quarters (73.4%) of people who reported making a suicide attempt used services for mental health problems. Conversely, one in four (26.6%) people who made a suicide attempt did not use any services for mental health problems.
Table 8-8: service use by type of suicidality
Service use (%)
Suicidal ideation 59.1
Suicide plans 68.0
Suicide attempts 73.4
Any suicidality 58.6
Note: Any suicidality is lower than the sum as people may have reported more than one type of suicidality.

The Mental Health of Australians 246
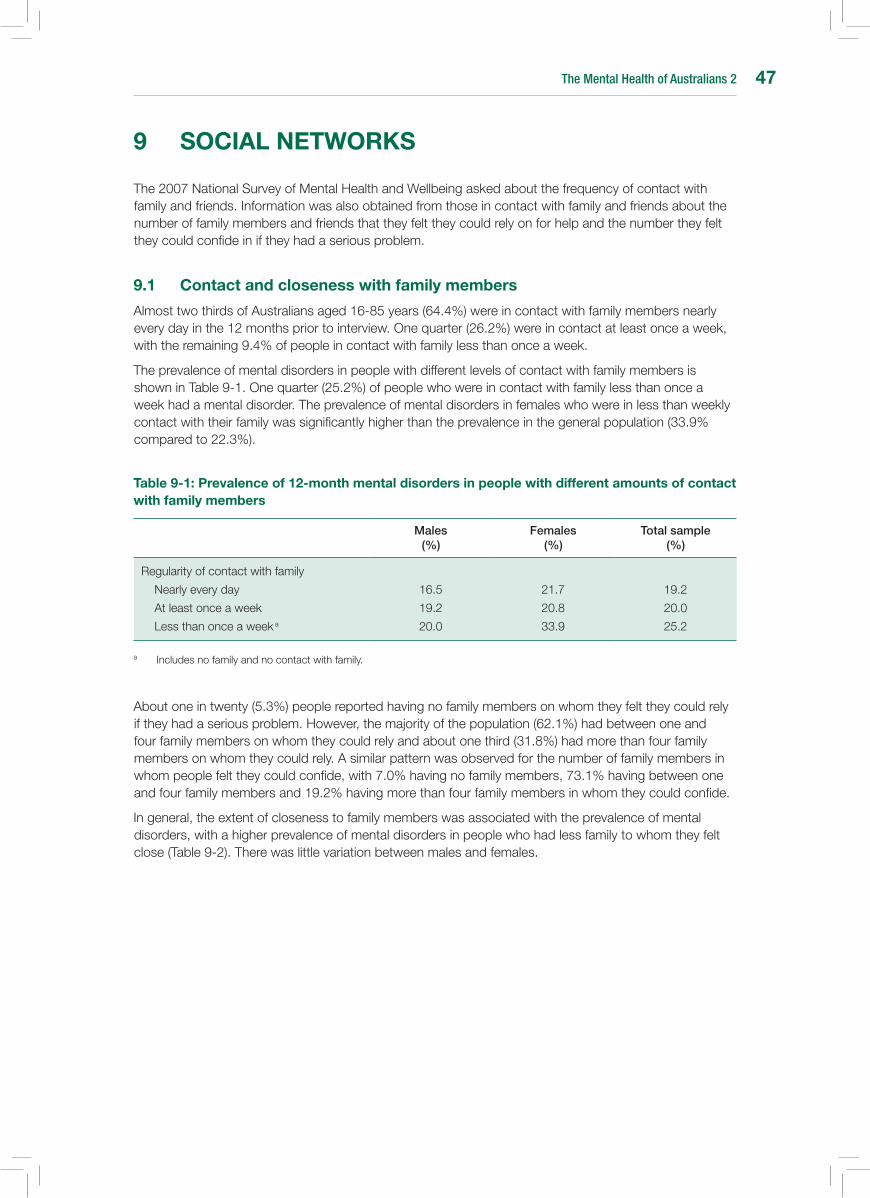
The Mental Health of Australians 2 47
9 sOCIAL nETWORKs
The 2007 National Survey of Mental Health and Wellbeing asked about the frequency of contact with family and friends. Information was also obtained from those in contact with family and friends about the number of family members and friends that they felt they could rely on for help and the number they felt they could confide in if they had a serious problem.
9.1 Contact and closeness with family members
Almost two thirds of Australians aged 16-85 years (64.4%) were in contact with family members nearly every day in the 12 months prior to interview. One quarter (26.2%) were in contact at least once a week, with the remaining 9.4% of people in contact with family less than once a week.
The prevalence of mental disorders in people with different levels of contact with family members is shown in Table 9-1. One quarter (25.2%) of people who were in contact with family less than once a week had a mental disorder. The prevalence of mental disorders in females who were in less than weekly contact with their family was significantly higher than the prevalence in the general population (33.9% compared to 22.3%).
Table 9-1: Prevalence of 12-month mental disorders in people with different amounts of contact with family members
Males (%)
Females (%)
Total sample (%)
Regularity of contact with family
Nearly every day
At least once a week
Less than once a week a
16.5
19.2
20.0
21.7
20.8
33.9
19.2
20.0
25.2
a Includes no family and no contact with family.
About one in twenty (5.3%) people reported having no family members on whom they felt they could rely if they had a serious problem. However, the majority of the population (62.1%) had between one and four family members on whom they could rely and about one third (31.8%) had more than four family members on whom they could rely. A similar pattern was observed for the number of family members in whom people felt they could confide, with 7.0% having no family members, 73.1% having between one and four family members and 19.2% having more than four family members in whom they could confide.
In general, the extent of closeness to family members was associated with the prevalence of mental disorders, with a higher prevalence of mental disorders in people who had less family to whom they felt close (Table 9-2). There was little variation between males and females.
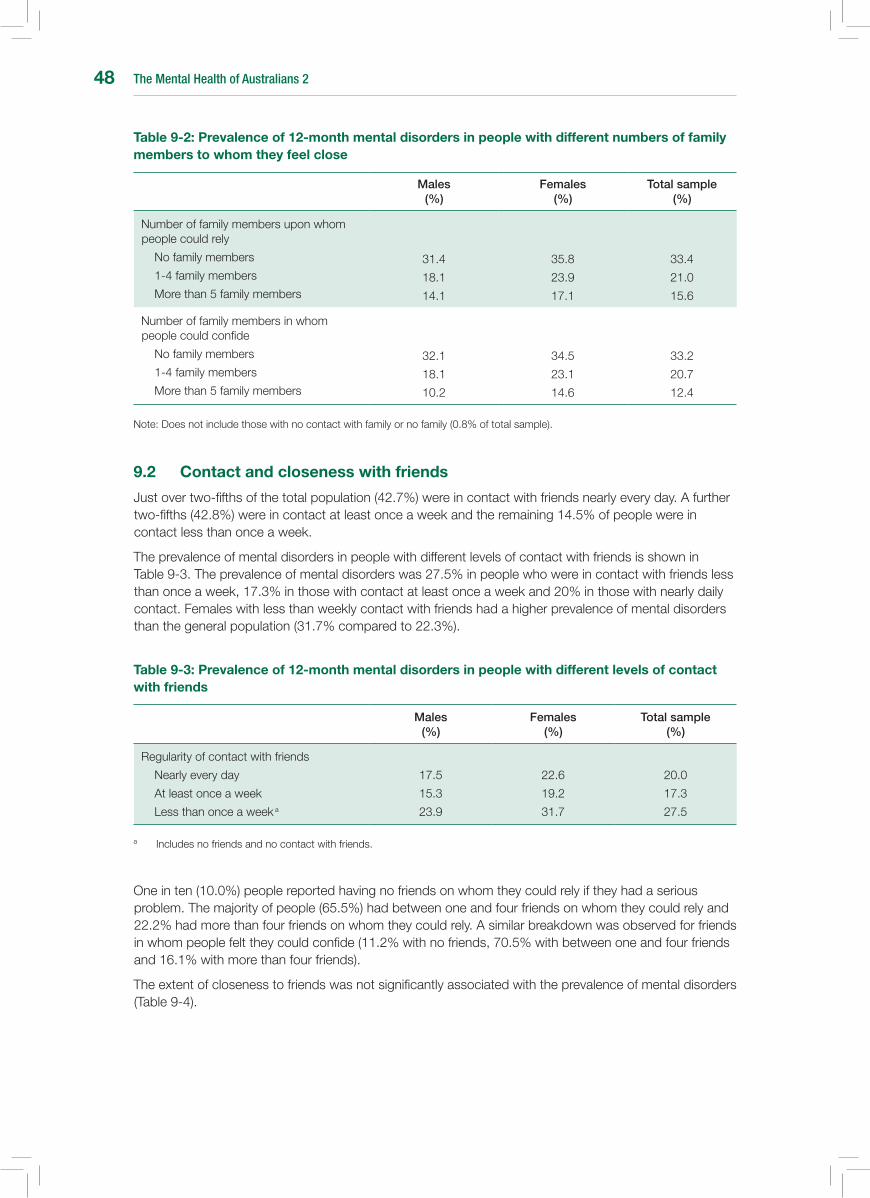
The Mental Health of Australians 248
Table 9-2: Prevalence of 12-month mental disorders in people with different numbers of family members to whom they feel close
Males (%)
Females (%)
Total sample (%)
Number of family members upon whom people could rely
No family members
1-4 family members
More than 5 family members
31.4
18.1
14.1
35.8
23.9
17.1
33.4
21.0
15.6
Number of family members in whom people could confide
No family members
1-4 family members
More than 5 family members
32.1
18.1
10.2
34.5
23.1
14.6
33.2
20.7
12.4
Note: Does not include those with no contact with family or no family (0.8% of total sample).
9.2 Contact and closeness with friends
Just over two-fifths of the total population (42.7%) were in contact with friends nearly every day. A further two-fifths (42.8%) were in contact at least once a week and the remaining 14.5% of people were in contact less than once a week.
The prevalence of mental disorders in people with different levels of contact with friends is shown in Table 9-3. The prevalence of mental disorders was 27.5% in people who were in contact with friends less than once a week, 17.3% in those with contact at least once a week and 20% in those with nearly daily contact. Females with less than weekly contact with friends had a higher prevalence of mental disorders than the general population (31.7% compared to 22.3%).
Table 9-3: Prevalence of 12-month mental disorders in people with different levels of contact with friends
Males (%)
Females (%)
Total sample (%)
Regularity of contact with friends
Nearly every day
At least once a week
Less than once a week a
17.5
15.3
23.9
22.6
19.2
31.7
20.0
17.3
27.5
a Includes no friends and no contact with friends.
One in ten (10.0%) people reported having no friends on whom they could rely if they had a serious problem. The majority of people (65.5%) had between one and four friends on whom they could rely and 22.2% had more than four friends on whom they could rely. A similar breakdown was observed for friends in whom people felt they could confide (11.2% with no friends, 70.5% with between one and four friends and 16.1% with more than four friends).
The extent of closeness to friends was not significantly associated with the prevalence of mental disorders (Table 9-4).

The Mental Health of Australians 2 49
Table 9-4: Prevalence of 12-month mental disorders in people with different numbers of friends to whom they feel close
Males (%)
Females (%)
Total sample (%)
Number of friends on whom people could rely
No friends
1 - 4 friends
More than 5 friends
19.7
16.3
17.8
31.6
21.4
19.9
24.6
19.0
18.8
Number of friends in whom people could confide
No friends
1 - 4 friends
More than 5 friends
18.1
16.8
17.4
28.6
21.5
20.4
22.2
19.3
18.8
Note: Does not include those with no contact with friends or no friends (2.2% of total sample).

The Mental Health of Australians 250

The Mental Health of Australians 2 51
10 CAREGIVInG
Many people in the general community care for a relative with a mental disorder or a chronic physical condition, and this can place a physical, emotional and financial burden on the carer themselves.
Around one third (31.2%) of people did not have a relative with either a mental disorder or a chronic physical condition. Of the remaining 68.8% of the population:
• 12.8%hadarelativewithamentaldisorderintheabsenceofachronicphysicalcondition;
• 28.8%hadarelativewithachronicphysicalconditionintheabsenceofamentaldisorder;and
• 26.3%hadarelativewithbothamentaldisorderandachronicphysicalcondition.
Among people who had relatives with mental disorders only, almost one third (32.3%) were in a caregiving role. One quarter (24.7%) of people who had a relative with a chronic physical disorder only were in a caregiving role. Whereas two-fifths (40.6%) of people with a relative with both a mental disorder and a chronic physical condition were in a caregiving role (Figure 10-1).
Figure 10-1: Caregiving by health status of relatives
There was a marked difference in the mental health status of caregivers themselves. The survey found a prevalence of 33.3% for mental disorders in people who were in a caregiving role, compared to a prevalence of 20.0% in the general population. The prevalence of 12-month mental disorders was higher both for people who provided care for relatives with mental disorders only and for those providing care for relatives with both mental disorders and chronic physical conditions (35.1 and 35.9% respectively). Whereas the prevalence of mental disorders among people who provided care for relatives with only chronic physical conditions was similar to that of the general population (19.3% compared to 20.0%).
Relatives with a mental disorder
0
10
20
30
40
Prop
ortio
n of
the
popu
latio
n in
a
care
givin
g ro
le (%
)
Relatives with a chronic physical condition
Health status of relative
50
Relatives with a mental disorder and chronic
physical condition

The Mental Health of Australians 252
The Mental Health of Australians 2 53
11 METHODOLOGICAL IssuEs AnD COMPARIsOn OF FInDInGs
11.1 Estimating the true prevalence of mental disorders
The 2007 National Survey of Mental Health and Wellbeing underestimates the true extent of mental disorders in the Australian population. The exact level of underestimation is unable to be determined, however, it is considered to be small. The main reasons for this are as follows.
Firstly,thesurveydidnotincludemodulestodeterminetheprevalenceofschizophreniaandotherpsychotic disorders, somatoform disorders, eating disorders, impulse-control disorders and personality disorders. These disorders are only likely to contribute a few extra percent to the prevalence of mental disorders in the total Australian population due to their lower prevalence and their likely overlap with other disorders covered in the survey.
Secondly, like other similar surveys of the general population, the 2007 survey only interviewed people living in households and not those in institutions, nursing homes, prisons, and other specialist settings. While these non-household groups cover populations known to have a higher likelihood of mental disorders, these people make up a relatively small proportion of the total population aged between 16 and 85 years. Therefore non-inclusion of these groups does not greatly affect the overall prevalence.
Thirdly, the interview asked about the symptoms of mental disorders at any time in the respondent’s lifetime. It is possible that milder symptoms, or those that occurred a long time ago, may have been forgotten.
Lastly, the response rate of the 2007 survey was considerably lower (60%) than that for the 1997 survey (78%). It is possible that the people who did not participate may have had a higher likelihood of meeting diagnostic criteria for mental disorders. If this is the case then the lower response rate in the 2007 survey may have led to a greater underestimation in prevalence compared to the 1997 survey. An intensive non-response survey was carried out by the Australian Bureau of Statistics to examine the impact of non-response on the accuracy of prevalence estimates. The results revealed that there is unlikely to be any major impact at the aggregate level and that the results of the survey are considered representative of the Australian population in terms of standard demographic factors.
11.2 Comparison with 1997 national survey of Mental Health and Wellbeing
The 2007 survey is the second national mental health survey carried out in Australia. A similar survey was carried out in 1997 and it is useful to reflect on the similarities and differences between the findings of the two surveys.
In 2007 one in five Australians experienced a mental disorder in the previous 12 months. The same prevalence was found in 1997. In 2007, as in 1997, anxiety disorders were the most prevalent mental disorder.
The 2007 survey also reinforced the 1997 findings that mental disorders are associated with significant levels of disability and distress. Around one in three people in 2007 who met diagnostic criteria for a mental disorder in the previous 12 months had seen a health professional for their mental health, a figure that is very similar to that which was found in the 1997.
While it is possible to make comparisons between the 1997 and the 2007 surveys, such comparisons should be made in the context of the similarities and differences between the methodologies used in the two surveys.
With regard to the similarities, both surveys assessed mental disorders according to the criteria set out in ICD-10 (as presented in this report) and also in the DSM-IV. Both surveys focussed on the same set of common mental disorders and the order in which these disorders were covered in the interview was roughly the same in both surveys. Both surveys interviewed a representative sample of the Australian adult population living in households. In terms of service use, both surveys asked about contact with the same major categories of health professionals who are most likely to provide help for mental health
The Mental Health of Australians 254
problems (that is, general practitioners, psychiatrists, psychologists, other mental health professionals and other health professionals). Both surveys asked the same set of questions regarding the perceived need for mental health care.
While every effort was made to maintain comparability between the 1997 and the 2007 surveys, there are also a number of significant differences. Firstly, there are methodological differences between the instruments used in the two surveys. The 1997 survey used version 2.1 of the CIDI as the base diagnostic instrument, whereas the 2007 survey used the World Mental Health Survey Initiative version of the CIDI, version 3.0. Substantial modifications were made to the CIDI to create version 3.0. These include changes to the number and content of questions used to tap the diagnostic criteria, changes to the structure of the interview specifically with regard to the placement of diagnostic screener questions in a separate early module, and changes to the sequencing of questions within diagnostic modules. Even small changes to the wording of a questionnaire can result in large differences in the extent and type of information elicited from respondents. Therefore, caution should be exercised when making comparisons between surveys that use different diagnostic interviews.
Another major difference between the interviews used in the 1997 and 2007 surveys relates to the timeframe used to assess the diagnostic criteria for mental disorders. In the 1997 survey the timeframe was the 12 months prior to the survey. In the 2007 survey the timeframe was the respondent’s entire lifetime. An estimate of 12-month prevalence from the 2007 survey was derived from a combination of the lifetime prevalence of mental disorders and the presence of symptoms in the last 12 months. This estimate is not based on a comprehensive assessment of all diagnostic criteria within the 12 months prior to the survey. It is difficult to determine the magnitude of bias (if any) associated with a 12-month prevalence estimate derived in this way.
The enumeration period differed between the two surveys with the 1997 survey taking place between May and August and the 2007 survey taking place between August and December. Seasonal differences in the prevalence or impact of mental disorders between these times of the year are considered unlikely.
It should also be noted that the 1997 survey interviewed people aged 18 years and over, while the 2007 survey interviewed people aged from 16 to 85 years.
11.3 Comparison with other mental health surveys
In recent years, mental health surveys have been conducted in at least 28 countries around the world, including the United States, France, Ukraine, Israel, India, China and New Zealand. Collectively, these surveys form the World Mental Health Survey Initiative. All these surveys make use of version 3.0 of the CIDI, thus enhancing the ability to perform cross-national comparisons of the prevalence and impact of mental disorders around the world.
Australia has one of the highest rates of mental disorders compared with these other countries. However, the findings are remarkably similar to those found in the nationally representative survey of mental disorders carried out in New Zealand in late 2003 and early 2004 as part of the World Mental Health Survey Initiative. Notwithstanding the fact that the New Zealand survey contained a somewhat different set of mental disorders and the data was reported with respect to the DSM-IV classification system, the prevalence of 12-month mental disorders in the New Zealand survey was remarkably similar to that found in Australia (20.7% compared to 20.0%). Anxiety disorders were also the most common class of mental disorder and the sex differences in prevalence follow the same patterns. The New Zealand survey also confirmed the high levels of disability associated with mental disorders.
11.4 Conclusions
The 2007 National Survey of Mental Health and Wellbeing provides unique data, particularly with regard to the prevalence and impact of mental disorders, and service use for mental health problems. Further analyses will provide invaluable information on the complex relationship between symptomatology, diagnosis, comorbidity, the experience of mental disorder, perceived needs for care and use of services, which can be used to guide service planning and mental health activities into the future.
The Mental Health of Australians 2 55
GLOssARY
12-month prevalence Meeting diagnostic criteria for a mental disorder at any point in the respondent’s lifetime and having symptoms of the disorder in the 12 months prior to interview.
This publication reports data using ICD-10.
Survey data is also available for DSM-IV.
Affective disorders Affective disorders is a class of mental disorders. The affective disorders included in the survey were episodes of depression (mild, moderate and severe), dysthymia and bipolar affective disorder. A key feature of these mental disorders is mood disturbance.
See Chapter 4 for further information.
Agoraphobia Agoraphobia is an anxiety disorder. The anxiety arises from fear of being in places or situations from which it is difficult to escape should a panic attack occur. Avoidance of these types of places or situations may be prominent.
Anxiety disorders Anxiety disorders is a class of mental disorders This class of mental disorder involves the experience of intense and debilitating anxiety. The anxiety disorders covered in the survey were panic disorder, social phobia, agoraphobia,generalizedanxietydisorder(GAD),posttraumaticstressdisorder (PTSD) and obsessive compulsive disorder (OCD). Specific phobias were not included in the survey. This is the same set as in 1997.
See Chapter 5 for further information.
bipolar affective disorder
Bipolar affective disorder is an affective disorder characterised by periods of elevated or irritable mood. In many cases these fluctuate with periods of low mood. Bipolar affective disorder has previously been termed ‘manic depressive disorder’.
Caregiving Caregiving was defined, for the purpose of the survey, as the provision of care to relatives who have long term physical or mental conditions, such as cancer, serious heart problems, serious memory problems, an intellectual disability, a physical disability, chronic physical illness, alcohol or drug problems,depression,anxiety,schizophreniaorpsychosis,bipolaraffectivedisorder or other chronic mental problems.
Provision of care included emotional and financial support and assistance with tasks of daily living, such as self-care, cooking and paperwork.
See Chapter 10 for further information.
Chronic condition A health condition or disorder that has lasted, or is expected to last, for six months or more.
Chronic physical conditions
Chronic physical conditions were defined for the survey as the five physical conditions identified as National Health Priority Areas in Australia. These are arthritis and musculoskeletal conditions, asthma, cancer, cardiovascular health and diabetes.
Class of mental disorder
Mental disorders are grouped into classes of disorder that share common features. Three classes of mental disorders were included in the survey. These were affective disorders, anxiety disorders and substance use disorders. The common feature of a disorder class is not exclusive to disorders within the class, for example mood disturbance is a key feature ofaffectivedisordersandisalsorequiredforadiagnosisofschizoaffectivedisorder, which is generally grouped with psychotic disorders.

The Mental Health of Australians 256
Comorbidity The occurrence of more than one disorder at the same time.
It may refer to co-occurring mental disorders and also co-occurring mental disorders and physical conditions.
See Chapter 7 for further information.
Composite International Diagnostic Interview (CIDI)
See World Mental Health Survey Initiative version of the Composite International Diagnostic Interview (WMH-CIDI).
Contact (with family/friends)
For the purposes of the survey, contact was defined as including visits, phone calls, letters, or electronic mail messages.
Days out of role This measure captures the impact of mental disorders and physical conditions on people’s ability to function in their day-to-day activities.
Respondents were asked two separate questions about the 30 days prior to interview:
– the number of days that they were ‘unable’ to work or carry out normal activitiesbecauseoftheirhealth;and
– the number of days they had to ‘cut down’ on what they did because of their health.
The answers to these questions are then totalled, with days cut back given half the weight of days unable to work.
Dependence Dependence is a substance use disorder and was measured in relation to alcohol and four separate categories of drugs (cannabis, stimulants, sedatives and opioids). It is characterised by tolerance to the effects of the substance, withdrawal symptoms if use of the substance is stopped or cut back and by difficulty controlling consumption of the substance despite associated physical and psychological problems.
Depressive episode Depressive episode is an affective disorder. Mild, moderate and severe depressive episode were assessed in the survey. It is characterised by periods of low mood with significant impairment due to symptoms required to meet diagnostic criteria. Symptoms include loss of interest and enjoyment, reduced energy and concentration and changes in sleep and appetite.
Diagnostic criteria The survey was designed to estimate the prevalence of common mental disorders defined according to clinical diagnostic criteria, as directed by both the International Classification of Diseases 10th Revision (ICD-10) and the Diagnostic and Statistical Manual of Mental Disorders Fourth Edition (DSM-IV).
Diagnostic criteria for a disorder usually involve specification of:
– thenature,numberandcombinationofsymptoms;
– a time period over which the symptoms have been continuously experienced;
– thelevelofdistressorimpairmentexperienced;and
– circumstances for exclusion of a diagnosis, such as it being due to a general medical condition or the symptoms being associated with another mental disorder.

The Mental Health of Australians 2 57
Dysthymia Dysthymia is an affective disorder characterised by chronic low mood lasting for two years or more.
Generalized anxiety disorder (GAD)
Generalizedanxietydisorderisananxietydisordercharacterisedbylongperiods of uncontrollable worry about everyday issues or events. The worry is typically accompanied by feelings of fatigue, restlessness or difficulty concentrating.
Harmful use Harmful use is a substance use disorder. It was measured in relation to alcohol and to four separate categories of drugs (cannabis, stimulants, sedatives and opioids). It is defined by levels of use associated with either physical or psychological harm.
Health professional Health professional is defined to include the following:
– generalpractitioner;
– psychiatrist;
– psychologist;
– mentalhealthnurse;
– other professionals providing specialist mental health services
– otherspecialistdoctororsurgeon;
– other professional providing general services, such as social worker, occupationaltherapistandcounsellor;and
– complementary and alternative medicine therapist.
These health professionals have been grouped in a number of ways for the purposes of reporting. See definitions for Mental health professionals, Other mental health professionals and Other health professionals.
Interference with life Interference with life was assessed for each type of mental disorder using the Sheehan Disability Scale.
The scale assesses impairment in the four domains of household maintenance, work or study, close relationships and social life for the worst month in the 12 months prior to interview. Interference for each domain is self-rated from 0 or no interference to 10 or very severe interference.
Kessler 10 scale (K10) See psychological distress.
Lifetime prevalence Meeting diagnostic criteria for a mental disorder at any point in the respondent’s lifetime.
This publication reports data using ICD-10.
Survey data is also available for DSM-IV.
Mental disorders Mental disorders are defined according to the detailed diagnostic criteria within classification systems.
This publication reports data for ICD-10
Survey data is also available for mental disorders as defined by DSM-IV.
Mental health problems This includes, but is not restricted to, such things as, stress, anxiety, depression, or dependence on alcohol or drugs. Individuals with mental health problems may never meet the diagnostic threshold for a mental disorder.
The Mental Health of Australians 258
Mental health professional
Defined in the survey as psychiatrists, psychologists and other mental health professionals, including mental health nurses and other health professionals working in specialised mental health settings.
national Health Priority Areas (nHPAs)
These are seven conditions identified at the Australian national level as National Health Priority Areas due to their high social and/or financial costs to Australian society or ‘burden of disease’. The conditions are arthritis and musculoskeletal conditions, asthma, cancer, cardiovascular health, diabetes, injury and mental disorders.
The survey collected data on the first five to enable examination of the associations between mental disorders and chronic physical conditions.
Obsessive-compulsive disorder (OCD)
Obsessive-compulsive disorder is an anxiety disorder characterised by repeated thoughts, images or impulses that the person feels are inappropriate, and repetitive behaviours, such as hand-washing, designed to reduce the anxiety generated by the thoughts.
Other mental health professional
Defined in the survey as mental health nurses and other health professionals working in specialised mental health settings.
Other health professional
Defined in the survey as including social workers, occupational therapists andcounsellorsprovidinggeneralservices;medicaldoctorsotherthanpsychiatrists or general practitioners, and practitioners of complementary and alternative medicines.
Panic disorder Panic disorder is an anxiety disorder. It involves experiencing sudden bursts of extreme anxiety that are accompanied by symptoms like a pounding heart, shortness of breath and nausea.
Posttraumatic stress disorder (PTsD)
Posttraumatic stress disorder is an anxiety disorder. It is characterised by symptoms that occur as a result of a previous traumatic event. These symptoms include recurrent and intrusive memories of the trauma, feelings of emotional numbing and detachment, and increases in emotional arousal such as irritability and disturbed sleep.
Prevalence of mental disorders
The proportion of people in a given population who meet diagnostic criteria for any mental disorder in a given time frame.
This publication reports data using ICD-10.
Survey data is also available for DSM-IV.
See also 12-month prevalence and lifetime prevalence.
Psychological distress Psychological distress is measured by the Kessler Psychological Distress Scale (K10). This is a widely used scale designed to detect the differing levels of psychological distress in the general population. While high levels of distress are often associated with mental illness, it is not uncommon for some people to experience psychological distress but not meet criteria for a mental disorder.
The K10 is based on 10 questions about negative emotional states in the 30 days prior to interview. It is scored from 10 to 50, with higher scores indicating higher levels of distress. In this report, scores are grouped as follows:
– 10–15 Lowlevelsofpsychologicaldistress;
– 16-21 Moderatelevelsofpsychologicaldistress;
– 22–29 Highlevelsofpsychologicaldistress;and
– 30–50 Very high levels of psychological distress.

The Mental Health of Australians 2 59
service use Service use includes consultations with health professionals and hospital admissions. People defined as having used services for mental health problems are those who identified having at least one consultation with a health professional or hospital admission in relation to mental health problems in the 12 months prior to interview (see also Health professional)
service provider See definition for Health professional.
severity Severity was measured using the World Mental Health Survey Initiative severity measure (modified for recent changes in the survey instrument). For each individual with a 12-month mental disorder the measure summarises the impact of all the mental disorders experienced in the previous 12 months into a mild, moderate or severe category:
– To be classified as severe, in addition to having a 12-month mental disorder, one of the following must have occurred in the previous 12months:anepisodeofmania;attemptedsuicide;orexperiencedsevere role impairment on at least two domains of the disorder specific Sheehan Disability Scales or overall functional impairment at a level equivalent to a Global Assessment of Functioning score of 50 or less.
– A classification as moderate requires a 12-month mental disorder and moderate role impairment in one domain on the Sheehan Disability Scales.
– The remaining people with a 12-month mental disorder were categorised as mild.
sheehan Disability scale
See Interference with life.
social phobia Social phobia is an anxiety disorder. It is characterised by a strong fear of social interaction or performance situations. People with social phobia avoid social situations in case of embarrassment or humiliation.
substance use disorders Substance use disorders is a class of mental disorders relating to problems arising from the use of alcohol and drugs.
The survey provided separate diagnoses of harmful use and dependence for alcohol, cannabis, sedatives, stimulants and opioids.
See Chapter 6 for further information.
suicidal ideation Suicidal ideation is defined as serious thoughts about taking one’s own life.
suicidality The term suicidality covers suicidal ideation (serious thoughts about taking one’s own life), suicide plans and suicide attempts.
See Chapter 8 for further information.
World Mental Health survey Initiative Composite International Diagnostic Interview (WMH-CIDI)
The WMH-CIDI is an extensive survey instrument designed for the collection of data on mental disorders and associated factors. In its current form (Version 3.0), the WMH-CIDI provides estimates of lifetime and 12-month prevalence of mental disorders, the impact of these disorders on functioning and types and frequency of service use.


