the maunder minimum is not as grand as it …leif.org/eos/maunder-minimum-not-so-grand.pdf · the...
TRANSCRIPT
The Astrophysical Journal, 800:42 (14pp), 2015 February 10 doi:10.1088/0004-637X/800/1/42C© 2015. The American Astronomical Society. All rights reserved.
THE MAUNDER MINIMUM IS NOT AS GRAND AS IT SEEMED TO BE
N. V. Zolotova and D. I. PonyavinSt. Petersburg State University, 198504 St. Petersburg, Russia; [email protected], [email protected]
Received 2014 August 18; accepted 2014 December 9; published 2015 February 6
ABSTRACT
The Maunder Minimum (MM), which occurred between 1645 and 1715, is mainly known as an almost spotlessperiod on the Sun. We analyze the nominal number of sunspot groups for each observer individually. Comparingthe sunspot drawings and textual reports, we conclude that the latter underestimate the number of sunspots. We alsoargue that the different points of view of observers in the seventeenth century on the origin of sunspots resulted inthe underestimation of sunspot groups or even gaps in observational reports. We demonstrate that Jean Picard andGiovanni Domenico Cassini of the Paris Observatory did not report any sunspots, while other observers reportedon the occurrence of spots. Moreover, compared with other observers, La Hire underestimated the solar activity.The MM looks like an ordinary secular minimum with a depressed 11 yr solar cyclicity.
Key words: Sun: activity – sunspots
1. INTRODUCTION
One of the most enigmatic features of the solar history inthe past is the Maunder Minimum (MM). Based on Sporer’sstudies of early records of sunspots, Maunder (1890, p. 252)summarized his conclusions: “For a period of about 70 yr,ending in 1716, there seems to have been a very remarkableinterruption of the ordinary course of the spot cycle. In sev-eral years no spots appear to have been seen at all, and in1705 it was recorded as a most remarkable event that two spotswere seen on the Sun at the same time, for a similar circum-stance had scarcely ever been seen during the 60 yr previous.”(Maunder 1890).
Eddy (1976) reexamined Sporer’s and Maunder’s findingsand concluded that the 70 yr period (1645–1715) was a timewhen solar activity all but stopped. The main objection toEddy’s claims regarding the anomaly in the behavior of theSun was that the solar activity, though weak during this period,followed an 11 yr solar cycle. As a result, there was no prolongedsunspot minimum (Legrand et al. 1992, and references therein).Particularly, it was argued that according to the auroral data, thesolar cycle was normal during the MM, though solar activity waslow (Schroder 1992). Based on 10Be records from a Greenlandice core, Beer et al. (1998) showed that vigorous cycles persistedin these time series throughout the MM.
Kopecky & Kuklin (1987) analyzed the impact of the effectiveresolving power of the so-called visibility function on thesunspot observations in the seventeenth century. They suggestedthat the reduction in the sunspot activity was not dramatic, butcould have been caused by a substantial qualitative change in thesolar activity, strengthened by a minimum in the secular cycleand observational conditions in connection with the visibilityfunction. Additionally, Ogurtsov et al. (2003) claimed thatduring the MM there were chaotic bursts of solar activityrandomly distributed in time, but that this claim requires in-depth study and verification.
Using the unique collection of sunspot observations recordedat the Paris observatory, Ribes & Nesme-Ribes (1993) recon-structed the butterfly diagram from 1666 to 1719. They demon-strated that the butterfly symmetry was broken, and the sunspotswere commonly observed in the southern hemisphere at low lat-itudes. Notice that Eddy (1976) indicated that this feature waspreviously reported by Sporer and Maunder (Maunder 1890).
Vaquero et al. (2015) restored latitudinal coordinates of thesunspots from 1671 to 1719. Also, Casas et al. (2006) definedthe positions of the sunspots observed by Galileo Galilei (Galileiet al. 1613). Soon & Yaskell (2003) mentioned that ElizabethNesme-Ribes also reconstructed the butterfly diagram from thesunspot drawings made by C. Scheiner, P. Gassendi, and J.Hevelius (Soon & Yaskell 2003, see Figure 48 therein).
Hoyt & Schatten (1998) introduced a time series known asthe group sunspot number (GSN or Rg). It uses the numberof sunspot groups (NSGs) observed, rather than groups andindividual sunspots. Hoyt et al. (1994) argued that the Rgseries is more reliable and homogeneous than the Wolf sunspotnumber series before 1849. Starting from 1610 to 1720, theindex is constructed from documentary sources provided by135 observers. Kovaltsov et al. (2004) evaluated the upper limitof the annual GSN during the deep MM (1645–1700), whichdoes not exceed 4. Rg demonstrates the abrupt onset of the MMnear the 1640s, which poses a challenge for the dynamo theories(Parker 1976; Sokoloff 2004; Charbonneau 2010).
Vaquero et al. (2011) recovered the sunspot observations byGeorg Marcgraf in 1637 and revised the Rg data for the period1636–1642. They suggested that the magnitude of the sunspotcycle just before the MM is about three times lower than thatin the paper by Hoyt & Schatten (1998). They also implied apossibly gradual onset of the minimum with the reduced activitythat started two cycles before the MM. Recently, Vaquero &Trigo (2015) proposed a redefinition of the MM period withthe core deep MM spanning from 1645 to 1700, as well as thewider extended MM for the period 1618–1723, which includesthe transition periods.
Processing naked-eye sunspot observations and auroral sight-ings, Schove (1955) defined the minima and maxima of the solarcycles from 649 b.c. to a.d. 2000. Assuming exactly nine solarcycles per calendar century, he numbered the solar cycles usingthe Zurich numbering system. Therefore, from 1610 to 1723Schove (1979) and Gleissberg et al. (1979) proposed 10 cy-cles with a duration of 8–15 yr (with reference to Wolf andhis successors).
Livingston & Penn (2009) discovered that from 1992 to 2009the nominal number of sunspots and the magnetic field strengthin spots decreased in time. Further, the prolonged minimumbetween Cycles 23 and 24 is one of the longest solar minima. TheSchwabe cycle period increases notably before each solar Grand
1
The Astrophysical Journal, 800:42 (14pp), 2015 February 10 Zolotova & Ponyavin
minimum (Frick et al. 1997). The current cycle is characterizedby small and short-lived sunspots. Whether the Sun is enteringan era of global quiet conditions, similar to the MM, remains tobe seen (Zolotova & Ponyavin 2014).
This paper is structured as follows. In Section 2, various stylesof sunspot drawings before the MM are presented. Section 3describes the underestimation of sunspot groups in textualsources. In the following sections, we compare the calendar dateand the nominal NSGs reported by various observers. Specialattention is given to the astronomers of the Paris observatory. InSection 8, we make our suggestions about the main features ofthe solar activity during the MM.
2. HISTORY
One of the first attempts to patent and sell a telescope wasin 1608, when the Dutch lens grinder Hans Lipperhey (orLippershey) presented his instrument to Maurice of Nassau,ruler of the Netherlands (Stefoff 2007). The lenses Lipperheyused would probably have restricted the magnification of histelescope to about three times (Watson 2004). Discoveringthe basic principles upon which the telescope worked, GalileoGalilei created instruments with magnifications of eight, twenty,and eventually thirty times. Along with the camera obscura, thetelescopes became widespread among solar observers of theseventeenth century (Vaquero & Vazquez 2009).
At that time, Aristotelian geocentrism, or the Ptolemaic sys-tem, was the generally accepted scientific doctrine. In particular,according to Aristotle, the Sun was perfect and immaculate. Themost popular point of view was that the sunspots (Sun’s planets)are shadows from planetary transits (Vaquero & Vazquez 2009).
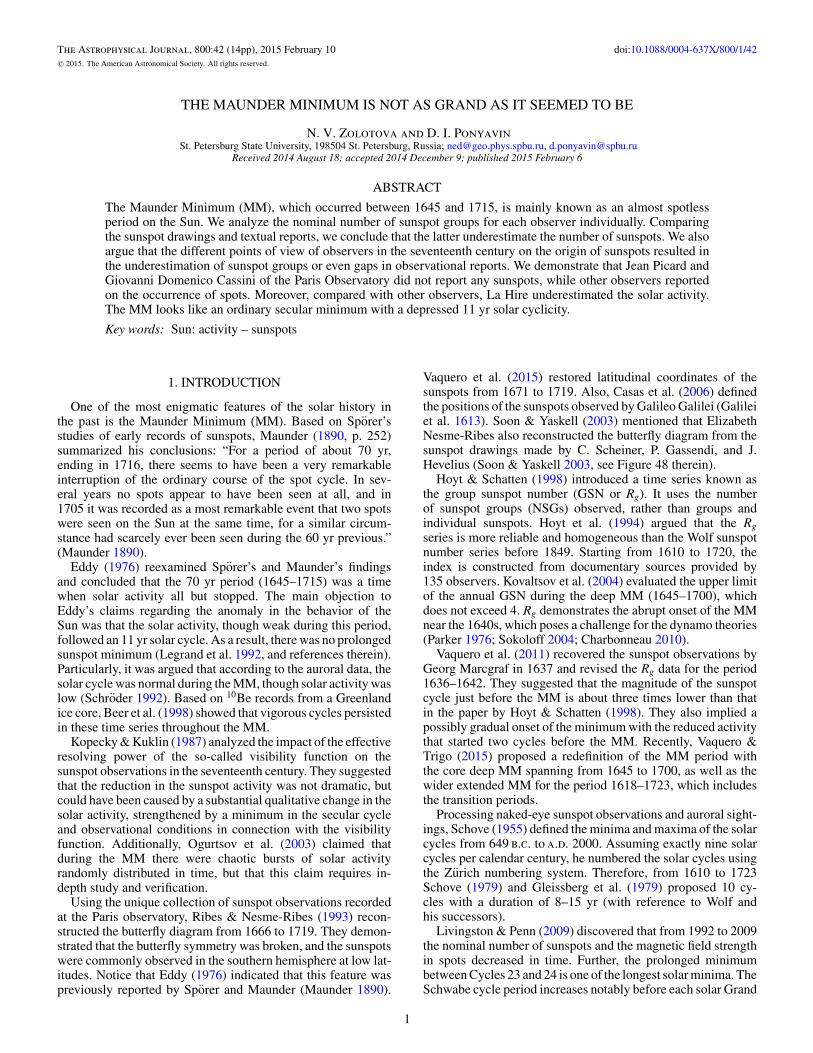
Figure 1 shows the sunspot drawings by Galileo Galilei(Galilei et al. 1613); Cristoph Scheiner (Scheiner 1630); PierreGassendi (Gassendi 1658), and Johannis Hevelii (Hevelii 1647).It is apparent that only the drawings by Galileo are similar tomodern sunspot observations. Notice that during the seventeenthcentury most of the sunspots in the drawings tend to be circu-larized. This can be caused by an adherence to the planetaryhypothesis of sunspot appearance on the Sun or just a psy-chological inclination to draw an unknown object as a circle(see drawings by Kircheri et al. 1678 or by John of Worcester1140–1160).
The German Jesuit Athanasius Kircher (Athanasii Kircheri),collaborating with Scheiner, thought that sunspots result froma combination of solid and liquid bodies (Vaquero & Vazquez2009). Thus, even though they had a different opinion of thesunspot origin, scientists tended to draw sunspots as circles(Kircheri et al. 1678, page 64). The origin of sunspots remainedunknown for quite a long time. For instance, even after con-structing the butterfly diagram Maunder (1922) claimed: “Thisdiagram further suggests that the origin of the solar spots lieswithin the Sun, not without. They come from below the sur-face; they are not impressed upon the surface by some exteriorinfluence; neither by planets, nor by meteors.” With referenceto Scheiner, Wolf (1861) also mentioned that rigorous observa-tions of sunspot appearance on the solar surface indicate thatspots are not the transit of a planet across the solar disk.
Cristoph Scheiner was a Jesuit priest and professor of math-ematics. Vaquero & Vazquez (2009) cited Scheiner’s letter,where, based on philosophy and his experience (Scheiner 1612),the author is sure that sunspots do not belong to the Sun. Overthe years Scheiner (1630) agreed with Galileo that sunspots areeither on the Sun’s surface or in its atmosphere, and that theSun is therefore not perfect (in contradiction to Aristotle). His
book Rosa Ursina (Scheiner 1630) contains drawings in twostyles: (1) sunspots tend to have a regular shape close to cir-cles which resemble shadows from planetary transits and (2)complex sunspot groups are similar to Galilei et al. (1613).
The work Opera Omnia by the French philosopher, priest, andscientist Pierre Gassendi (1658) addresses the rigorous geocen-tric system and Tychonic system (a hybrid of geocentrism andheliocentrism, published by Tycho Brahe in the late sixteenthcentury). Several sunspot drawings cover the period 1633–1638.Gassendi sketched only big spot groups and schematicallymarked them as circularized texture objects (Figure 1(c)).
The mayor of Danzig (Poland), brewer, and astronomerJohannes Hevelius (Johannis Hevelii) was probably familiarwith the works of Scheiner. The sunspot drawings from 1642to 1644 published in Solenographia (Hevelii 1647) imitatethe Scheiner (1630) style (Figures 1(b) and (d)). The sunspotgroups tend to be similar to a set of circles. Solenographia alsodescribes the geocentric, Tychonic, and heliocentric systems.Other sunspot observations up to 1684 are provided by Heveliusin a tabular format (Hoyt & Schatten 1995). Between 1653and 1679, Hevelius only reported 19 sunspot groups, whichis too few for the 26 yr period. This probably cannot beexplained by low solar activity, because in the 1640s and 1650sHevelius equally registered up to four to five sunspot groupsper day, but in 1650s his interests shifted toward the Moon. Inparticular, a significant part of the second volume of MachinaCoelestis (Hevelius 1679) is devoted to lunar observations(“Macula Lunaris,” which means “spots on the Moon”). Also, infour cases, Hevelius quite consciously did not record sunspotsreported by other European observers (Hoyt & Schatten 1995).The other possible explanation for the small number of sunspotsreported from 1653 and 1679 is discussed in the next section.
3. DIFFERENCE BETWEEN DRAWINGS ANDTEXT REPORTS ABOUT SUNSPOTS
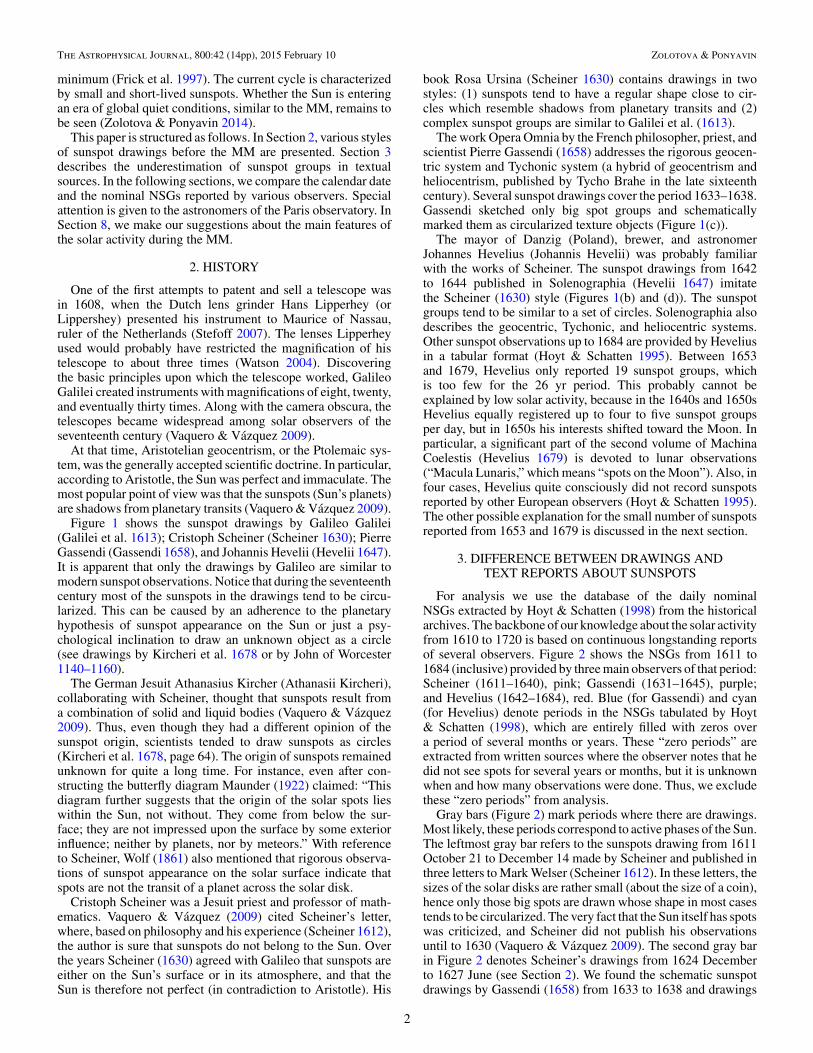
For analysis we use the database of the daily nominalNSGs extracted by Hoyt & Schatten (1998) from the historicalarchives. The backbone of our knowledge about the solar activityfrom 1610 to 1720 is based on continuous longstanding reportsof several observers. Figure 2 shows the NSGs from 1611 to1684 (inclusive) provided by three main observers of that period:Scheiner (1611–1640), pink; Gassendi (1631–1645), purple;and Hevelius (1642–1684), red. Blue (for Gassendi) and cyan(for Hevelius) denote periods in the NSGs tabulated by Hoyt& Schatten (1998), which are entirely filled with zeros overa period of several months or years. These “zero periods” areextracted from written sources where the observer notes that hedid not see spots for several years or months, but it is unknownwhen and how many observations were done. Thus, we excludethese “zero periods” from analysis.
Gray bars (Figure 2) mark periods where there are drawings.Most likely, these periods correspond to active phases of the Sun.The leftmost gray bar refers to the sunspots drawing from 1611October 21 to December 14 made by Scheiner and published inthree letters to Mark Welser (Scheiner 1612). In these letters, thesizes of the solar disks are rather small (about the size of a coin),hence only those big spots are drawn whose shape in most casestends to be circularized. The very fact that the Sun itself has spotswas criticized, and Scheiner did not publish his observationsuntil to 1630 (Vaquero & Vazquez 2009). The second gray barin Figure 2 denotes Scheiner’s drawings from 1624 Decemberto 1627 June (see Section 2). We found the schematic sunspotdrawings by Gassendi (1658) from 1633 to 1638 and drawings
2
The Astrophysical Journal, 800:42 (14pp), 2015 February 10 Zolotova & Ponyavin
(a) (b)
( )с (d)
Figure 1. Sunspot drawings on (a) 1612 June 26 by Galileo Galilei, (b) 1625 May 11–23 by Cristoph Scheiner, (c) 1638 October 30 to November 1 by Pierre Gassendi,and (d) 1644 May 3–16 by Johannes Hevelius.
0
2
4
6
8
10
1620 1630 1640 1650 1660 1670 16801620 1630 1640 1650 1660 1670 1680
zero evelius
1611
Figure 2. Nominal number of sunspot groups. Color defines the observer. Gray bars mark periods when the observers made drawings.
3
The Astrophysical Journal, 800:42 (14pp), 2015 February 10 Zolotova & Ponyavin
by Hevelii (1647) from October 1624 to October 1644 (the thirdand fourth gray bars in Figure 2). Reports about sunspots from1653 to 1679 (Hevelius 1679) were found in tabular form byHoyt & Schatten (1998).
From a comparison of the periods from the sunspot drawingsand the periods from the information on sunspots extractedfrom the text reports, we emphasize a significant differencebetween them (Figure 2). The cumulative NSGs extracted fromthe drawings made from 1642–1644 by Hevelii (1647) is about390, and that from the tables made from 1653–1679 by Hevelius(1679) is only 65. Figure 2 shows that the nominal NSGs perday in the 1640s and 1650s is comparable (up to four–five).Thus, the activity levels of these periods should be similar, butthe difference in the NSGs from the drawings and text reports isevident. This discrepancy in NSG leads to significant variationsin the amplitude of Rg. In particular, in the year 1642, Rg is about50, while in 1652, it is only 4. Scheiner’s observations (Figure 2)also exhibit a large difference between the drawings and thetext reports.
Since the text reports underestimate the NSGs, they auto-matically overestimate the number of spotless days. Here wewould like to mention the illustrative and curious case noted byVaquero & Vazquez (2009). A short text description made by theEnglish astronomer, mathematician, ethnographer, and transla-tor Thomas Harriot says that on 1610 December 8 the Sun wasclear, but it is accompanied by a sketch of three spots. An appar-ent discrepancy between drawing and text can be explained asa consequence of the dominant point of view that the sunspotsare shadows from a transit of an unknown planet. Therefore,a description of objects with irregular shape or consisting of aset of small spots could be withdrawn from a report because itwas impossible to be sure that this object was a celestial body.All these findings suggest to us that the sunspot data during theseventeenth century should be significantly corrected.
Finally, we conclude that the reports about sunspot observa-tions, especially those without drawings, contain reduced infor-mation on the NSGs. It was probably caused by the world viewthat a spot is an unknown celestial body. Let us do a thought ex-periment where an astronomer in the seventeenth century createsa text or tabular report on the solar observations. He sees objectsof an irregular shape on the solar disk. How can he report aboutsunspots (Sun’s planets) if he knows that the shadow of a celes-tial body must be round? Hence, irregular-shaped objects wereprobably skipped. That is why there is a crucial difference be-tween the drawings and text reports. This point of view suggeststo us that rare and short observations, which in the overwhelm-ing majority of cases provide evidence of single sunspots, mightalso underestimate the nominal NSG because the observer couldonly be interested in the sunspot (Sun’s planet) observation, butnot in the accurate count of the spots. Small spots or those ofirregular shapes could be skipped to avoid a mess in the reports.
4. FALSE SOLAR MINIMUM IN 1617–1618
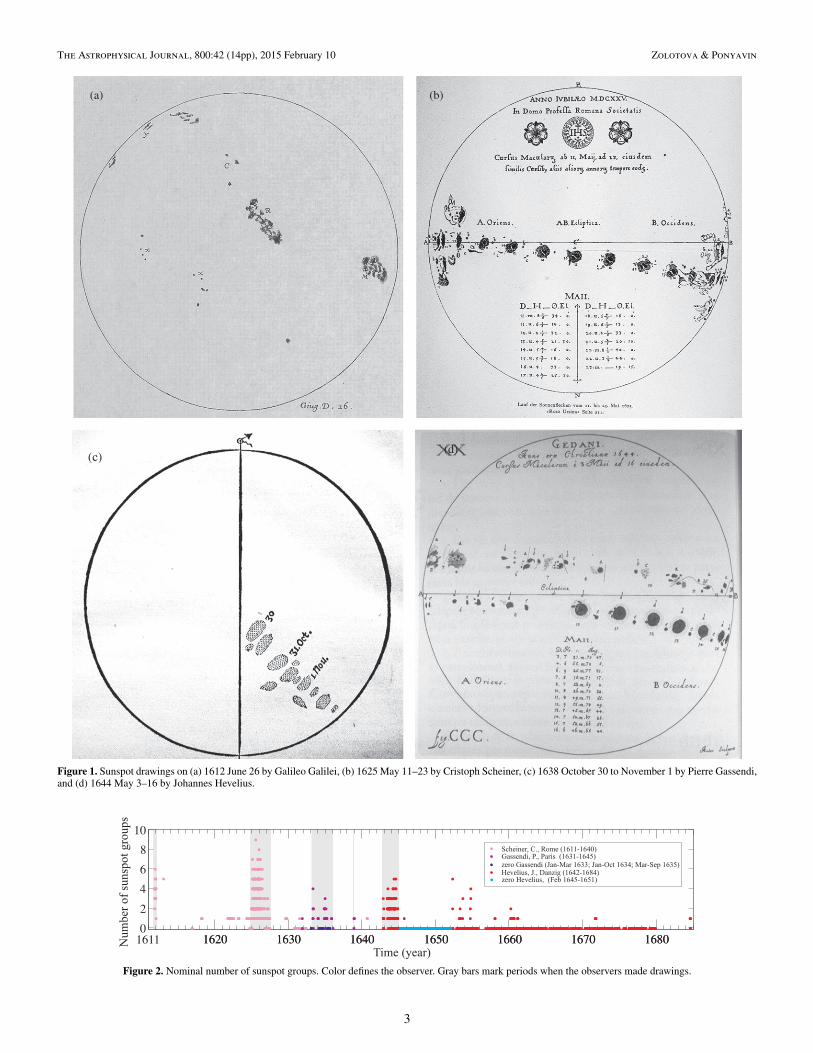
According to Hoyt & Schatten (1998), the period 1617–1618is densely covered by sunspot observations, mainly due toSimon Marius (Nuremberg, Germany) and Giovanni BattistaRiccioli (Bonomia, Italy). In 1617 Marius’s observations cov-ered 208 days. In 1618 Marius and Riccioli synchronously ob-served the Sun for 333 days. Figure 3 shows Rg from 1610 to1650. According to this plot, the period 1617–1618 correspondsto a solar minimum. Notice that Marius observed sunspots in1617–1618, and Riccioli in 1618, 1632, 1655–1657, and 1661.In those years, they only reported only a blank solar disk; in
1610 1615 1620 1625 1630 1635 1640 1645 16500
50
100
150
Figure 3. Group sunspot number from 1610 to 1650, according to Hoyt &Schatten (1998).
other words, they did not even register a single spot. Belowwe compare reports by Marius and Riccioli with those of otherobservers.
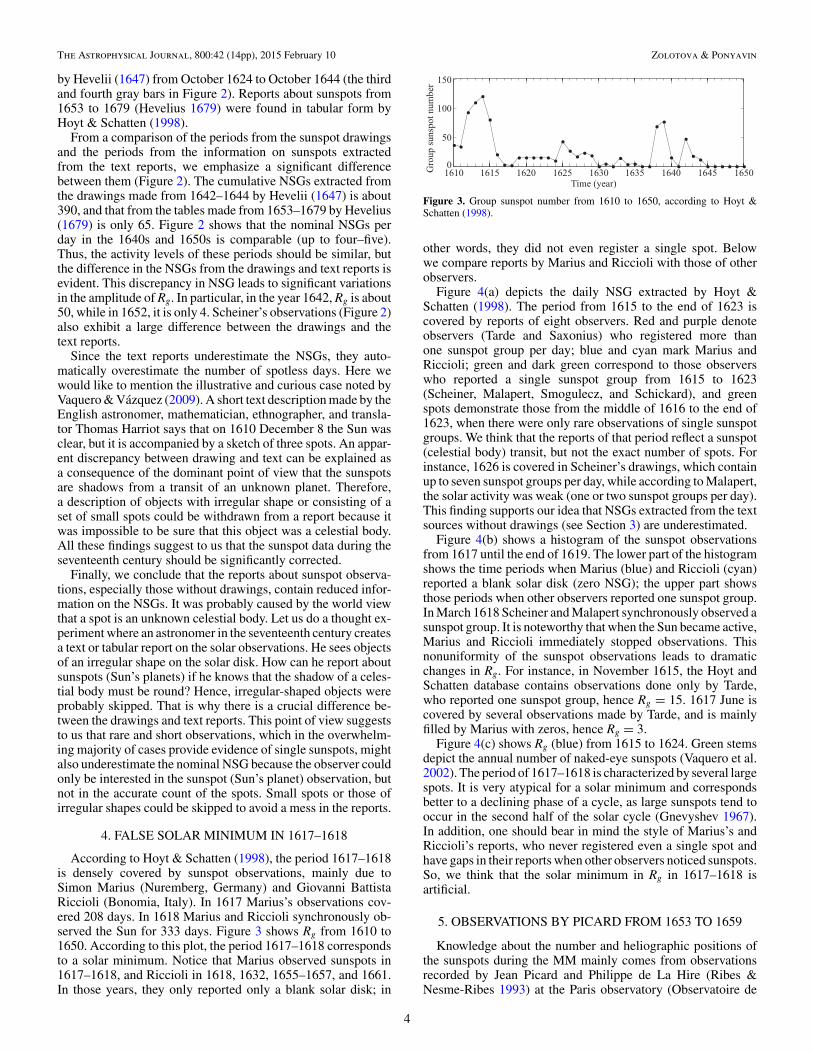
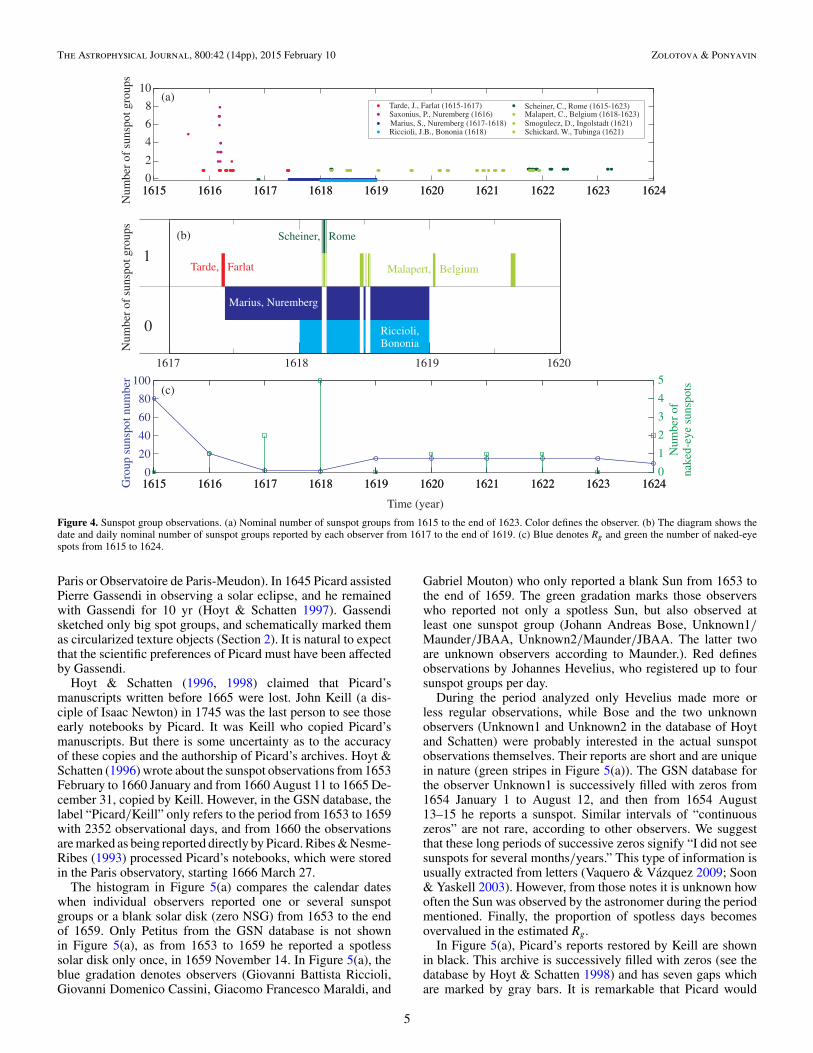
Figure 4(a) depicts the daily NSG extracted by Hoyt &Schatten (1998). The period from 1615 to the end of 1623 iscovered by reports of eight observers. Red and purple denoteobservers (Tarde and Saxonius) who registered more thanone sunspot group per day; blue and cyan mark Marius andRiccioli; green and dark green correspond to those observerswho reported a single sunspot group from 1615 to 1623(Scheiner, Malapert, Smogulecz, and Schickard), and greenspots demonstrate those from the middle of 1616 to the end of1623, when there were only rare observations of single sunspotgroups. We think that the reports of that period reflect a sunspot(celestial body) transit, but not the exact number of spots. Forinstance, 1626 is covered in Scheiner’s drawings, which containup to seven sunspot groups per day, while according to Malapert,the solar activity was weak (one or two sunspot groups per day).This finding supports our idea that NSGs extracted from the textsources without drawings (see Section 3) are underestimated.
Figure 4(b) shows a histogram of the sunspot observationsfrom 1617 until the end of 1619. The lower part of the histogramshows the time periods when Marius (blue) and Riccioli (cyan)reported a blank solar disk (zero NSG); the upper part showsthose periods when other observers reported one sunspot group.In March 1618 Scheiner and Malapert synchronously observed asunspot group. It is noteworthy that when the Sun became active,Marius and Riccioli immediately stopped observations. Thisnonuniformity of the sunspot observations leads to dramaticchanges in Rg. For instance, in November 1615, the Hoyt andSchatten database contains observations done only by Tarde,who reported one sunspot group, hence Rg = 15. 1617 June iscovered by several observations made by Tarde, and is mainlyfilled by Marius with zeros, hence Rg = 3.
Figure 4(c) shows Rg (blue) from 1615 to 1624. Green stemsdepict the annual number of naked-eye sunspots (Vaquero et al.2002). The period of 1617–1618 is characterized by several largespots. It is very atypical for a solar minimum and correspondsbetter to a declining phase of a cycle, as large sunspots tend tooccur in the second half of the solar cycle (Gnevyshev 1967).In addition, one should bear in mind the style of Marius’s andRiccioli’s reports, who never registered even a single spot andhave gaps in their reports when other observers noticed sunspots.So, we think that the solar minimum in Rg in 1617–1618 isartificial.
5. OBSERVATIONS BY PICARD FROM 1653 TO 1659
Knowledge about the number and heliographic positions ofthe sunspots during the MM mainly comes from observationsrecorded by Jean Picard and Philippe de La Hire (Ribes &Nesme-Ribes 1993) at the Paris observatory (Observatoire de
4
The Astrophysical Journal, 800:42 (14pp), 2015 February 10 Zolotova & Ponyavin
0
2
4
6
8
10
1615 1616 1617 1618 1619 1620 1621 1622 1623 16240
20
40
60
80
100
1615 1616 1617 1618 1619 1620 1621 1622 1623 16240
1
2
3
4
5
Tarde, J., Farlat (1615-1617)Saxonius, P., Nuremberg (1616)Marius, S., Nuremberg (1617-1618)Riccioli, J.B., Bononia (1618)
Scheiner, C., Rome (1615-1623)Malapert, C., Belgium (1618-1623)Smogulecz, D., Ingolstadt (1621)Schickard, W., Tubinga (1621)
Gro
upsu
nspo
t num
ber
Num
ber
ofna
ked-
eye
suns
pot s
1615 1616 1617 1618 1619 1620 1621 1622 1623 16241615 1616 1617 1618 1619 1620 1621 1622 1623 1624
Num
ber
ofsu
nspo
t gro
ups
(a)
Malapert, Belgium
Scheiner, Rome
Tarde, Farlat
Marius, Nuremberg
Riccioli,Bononia
1617 1618 1619 1620
1
0
Num
ber
ofsu
nspo
t gro
ups
Time (year)
Figure 4. Sunspot group observations. (a) Nominal number of sunspot groups from 1615 to the end of 1623. Color defines the observer. (b) The diagram shows thedate and daily nominal number of sunspot groups reported by each observer from 1617 to the end of 1619. (c) Blue denotes Rg and green the number of naked-eyespots from 1615 to 1624.
Paris or Observatoire de Paris-Meudon). In 1645 Picard assistedPierre Gassendi in observing a solar eclipse, and he remainedwith Gassendi for 10 yr (Hoyt & Schatten 1997). Gassendisketched only big spot groups, and schematically marked themas circularized texture objects (Section 2). It is natural to expectthat the scientific preferences of Picard must have been affectedby Gassendi.
Hoyt & Schatten (1996, 1998) claimed that Picard’smanuscripts written before 1665 were lost. John Keill (a dis-ciple of Isaac Newton) in 1745 was the last person to see thoseearly notebooks by Picard. It was Keill who copied Picard’smanuscripts. But there is some uncertainty as to the accuracyof these copies and the authorship of Picard’s archives. Hoyt &Schatten (1996) wrote about the sunspot observations from 1653February to 1660 January and from 1660 August 11 to 1665 De-cember 31, copied by Keill. However, in the GSN database, thelabel “Picard/Keill” only refers to the period from 1653 to 1659with 2352 observational days, and from 1660 the observationsare marked as being reported directly by Picard. Ribes & Nesme-Ribes (1993) processed Picard’s notebooks, which were storedin the Paris observatory, starting 1666 March 27.
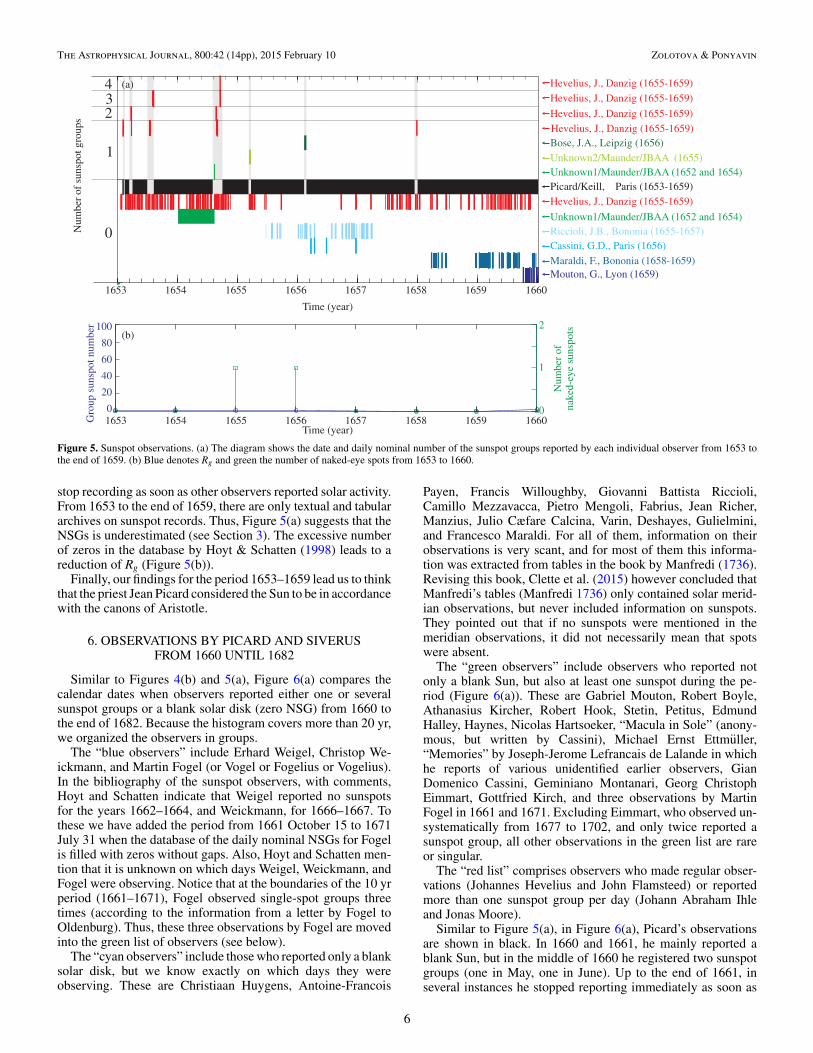
The histogram in Figure 5(a) compares the calendar dateswhen individual observers reported one or several sunspotgroups or a blank solar disk (zero NSG) from 1653 to the endof 1659. Only Petitus from the GSN database is not shownin Figure 5(a), as from 1653 to 1659 he reported a spotlesssolar disk only once, in 1659 November 14. In Figure 5(a), theblue gradation denotes observers (Giovanni Battista Riccioli,Giovanni Domenico Cassini, Giacomo Francesco Maraldi, and
Gabriel Mouton) who only reported a blank Sun from 1653 tothe end of 1659. The green gradation marks those observerswho reported not only a spotless Sun, but also observed atleast one sunspot group (Johann Andreas Bose, Unknown1/Maunder/JBAA, Unknown2/Maunder/JBAA. The latter twoare unknown observers according to Maunder.). Red definesobservations by Johannes Hevelius, who registered up to foursunspot groups per day.
During the period analyzed only Hevelius made more orless regular observations, while Bose and the two unknownobservers (Unknown1 and Unknown2 in the database of Hoytand Schatten) were probably interested in the actual sunspotobservations themselves. Their reports are short and are uniquein nature (green stripes in Figure 5(a)). The GSN database forthe observer Unknown1 is successively filled with zeros from1654 January 1 to August 12, and then from 1654 August13–15 he reports a sunspot. Similar intervals of “continuouszeros” are not rare, according to other observers. We suggestthat these long periods of successive zeros signify “I did not seesunspots for several months/years.” This type of information isusually extracted from letters (Vaquero & Vazquez 2009; Soon& Yaskell 2003). However, from those notes it is unknown howoften the Sun was observed by the astronomer during the periodmentioned. Finally, the proportion of spotless days becomesovervalued in the estimated Rg.
In Figure 5(a), Picard’s reports restored by Keill are shownin black. This archive is successively filled with zeros (see thedatabase by Hoyt & Schatten 1998) and has seven gaps whichare marked by gray bars. It is remarkable that Picard would
5
The Astrophysical Journal, 800:42 (14pp), 2015 February 10 Zolotova & Ponyavin
Num
ber
ofsu
nspo
t gro
ups
Time (year)
1653 1654 1655 1656 1657 1658 1659 1660
1653 1654 1655 1656 1657 1658 1659 16600
20
40
60
80
100
0
1
2(b)
Gro
upsu
nspo
tnum
ber
Num
ber
ofna
ked-
eye
suns
pots
2
0
1
34
Mouton, G., Lyon (1659)
Unknown1/Maunder/JBAA (1652 and 1654)
Unknown2/Maunder/JBAA (1655)
Hevelius, J., Danzig (1655-1659)
Picard/Keill, Paris (1653-1659)
Riccioli, J.B., Bononia (1655-1657)Cassini, G.D., Paris (1656)
Maraldi, F., Bononia (1658-1659)
Hevelius, J., Danzig (1655-1659)
Unknown1/Maunder/JBAA (1652 and 1654)
Time (year)
(a)
Bose, J.A., Leipzig (1656)
Hevelius, J., Danzig (1655-1659)
Hevelius, J., Danzig (1655-1659)
Hevelius, J., Danzig (1655-1659)
Figure 5. Sunspot observations. (a) The diagram shows the date and daily nominal number of the sunspot groups reported by each individual observer from 1653 tothe end of 1659. (b) Blue denotes Rg and green the number of naked-eye spots from 1653 to 1660.
stop recording as soon as other observers reported solar activity.From 1653 to the end of 1659, there are only textual and tabulararchives on sunspot records. Thus, Figure 5(a) suggests that theNSGs is underestimated (see Section 3). The excessive numberof zeros in the database by Hoyt & Schatten (1998) leads to areduction of Rg (Figure 5(b)).
Finally, our findings for the period 1653–1659 lead us to thinkthat the priest Jean Picard considered the Sun to be in accordancewith the canons of Aristotle.
6. OBSERVATIONS BY PICARD AND SIVERUSFROM 1660 UNTIL 1682
Similar to Figures 4(b) and 5(a), Figure 6(a) compares thecalendar dates when observers reported either one or severalsunspot groups or a blank solar disk (zero NSG) from 1660 tothe end of 1682. Because the histogram covers more than 20 yr,we organized the observers in groups.
The “blue observers” include Erhard Weigel, Christop We-ickmann, and Martin Fogel (or Vogel or Fogelius or Vogelius).In the bibliography of the sunspot observers, with comments,Hoyt and Schatten indicate that Weigel reported no sunspotsfor the years 1662–1664, and Weickmann, for 1666–1667. Tothese we have added the period from 1661 October 15 to 1671July 31 when the database of the daily nominal NSGs for Fogelis filled with zeros without gaps. Also, Hoyt and Schatten men-tion that it is unknown on which days Weigel, Weickmann, andFogel were observing. Notice that at the boundaries of the 10 yrperiod (1661–1671), Fogel observed single-spot groups threetimes (according to the information from a letter by Fogel toOldenburg). Thus, these three observations by Fogel are movedinto the green list of observers (see below).
The “cyan observers” include those who reported only a blanksolar disk, but we know exactly on which days they wereobserving. These are Christiaan Huygens, Antoine-Francois
Payen, Francis Willoughby, Giovanni Battista Riccioli,Camillo Mezzavacca, Pietro Mengoli, Fabrius, Jean Richer,Manzius, Julio Cæfare Calcina, Varin, Deshayes, Gulielmini,and Francesco Maraldi. For all of them, information on theirobservations is very scant, and for most of them this informa-tion was extracted from tables in the book by Manfredi (1736).Revising this book, Clette et al. (2015) however concluded thatManfredi’s tables (Manfredi 1736) only contained solar merid-ian observations, but never included information on sunspots.They pointed out that if no sunspots were mentioned in themeridian observations, it did not necessarily mean that spotswere absent.
The “green observers” include observers who reported notonly a blank Sun, but also at least one sunspot during the pe-riod (Figure 6(a)). These are Gabriel Mouton, Robert Boyle,Athanasius Kircher, Robert Hook, Stetin, Petitus, EdmundHalley, Haynes, Nicolas Hartsoeker, “Macula in Sole” (anony-mous, but written by Cassini), Michael Ernst Ettmuller,“Memories” by Joseph-Jerome Lefrancais de Lalande in whichhe reports of various unidentified earlier observers, GianDomenico Cassini, Geminiano Montanari, Georg ChristophEimmart, Gottfried Kirch, and three observations by MartinFogel in 1661 and 1671. Excluding Eimmart, who observed un-systematically from 1677 to 1702, and only twice reported asunspot group, all other observations in the green list are rareor singular.
The “red list” comprises observers who made regular obser-vations (Johannes Hevelius and John Flamsteed) or reportedmore than one sunspot group per day (Johann Abraham Ihleand Jonas Moore).
Similar to Figure 5(a), in Figure 6(a), Picard’s observationsare shown in black. In 1660 and 1661, he mainly reported ablank Sun, but in the middle of 1660 he registered two sunspotgroups (one in May, one in June). Up to the end of 1661, inseveral instances he stopped reporting immediately as soon as
6

The Astrophysical Journal, 800:42 (14pp), 2015 February 10 Zolotova & Ponyavin
Time (year)1660 1665 1670 1675 16801660 1665 1670 1675 1680
0
1
2
3
4
1660 1665 1670 1675 16801660 1665 1670 1675 16800
1
2
3
4
Num
ber
ofna
ked-
eye
suns
pots
020
40
60
80
100(b)
Gro
upsu
nspo
tnum
ber
S , H., Hiverus amburg (1671-1682)
Picard aris (1660-1682), J., P
1660 1665 1670 1675 16801660 1665 1670 1675 16801660 1665 1670 1675 16801660 1665 1670 1675 1680
0
1
2N
umbe
rof
suns
pot g
roup
s(a)
Picard aris (1660-1682), J., P
S , H., Hiverus amburg (1671-1682)
“Red observers”
“Red observers”
“Green observers”
“Green observers”
“Red observers”
“Cyan observers”
“Blue observers”
Time (year)
Figure 6. Sunspot observations. (a) The diagram shows the date and daily nominal number of the sunspot groups reported by an individual observer or a group ofobservers from 1660 to the end of 1682. (b) Blue denotes Rg and green the number of naked-eye spots from 1660 to 1683.
sunspot groups appeared on the solar surface (these periods aremarked by gray bars). The period of four years (1662–1665)is continuously filled with zeros. In Figure 6(a) we marked thisperiod by a hatched region, because it is unknown how oftenPicard carried out observations. Later, from 1666 to 1677, heobserved more or less regularly; the exact dates of observationsare known, and Picard also recorded most of the sunspot groupsreported by other observers. However, he never reported two ormore sunspot groups simultaneously visible on the solar disk.
To conclude, before 1666 Picard saw spots, but did not thinkthat these were sunspots; from 1666 onward, he saw spots andwrote in his notebooks that he observed sunspots. Thus, we thinkthat it is Picard’s scientific view on the nature of sunspots thatwas transformed, not the observing methods, because telescopeswere sufficiently good from the middle of the seventeenthcentury, and their field of view was much larger than that inGalilean telescopes (Vaquero & Vazquez 2009).
Another observer who deserves attention is Heinrich Siverus(brown in Figure 6(a)). In 1671, he reported two sunspot groups(one per observation). His regular observations began in 1675.In the bibliography, Hoyt and Shatten noticed that the originalobservations of Siverus are now lost and it is unknown on whichdays he was observing. However, similarly to Marius, Riccioli,and Picard/Keil, Siverus immediately discontinued monitoringwhen other observers reported sunspots (these periods aremarked by beige bars), and vice versa. He registered a fewsunspot groups in 1680 and 1681 (one per day) which were notmentioned by other observers (Figure 6). We can speculate thatSiverus and Picard had definite criteria for a sunspot, probably inaccordance with Aristotle, hence they could reject those objectson the solar surface which did not satisfy their prescriptions.In case of irregularly shaped, or small and not-deserving-of-attention objects, they also might not have marked the day asspotless; thus, gaps appeared in reports.
Finally, the period from 1660 to 1682 is poorly coveredby regular observations. A significant part of the reports was
extracted from the book by Manfredi (1736), which doesnot contain information on sunspots (Clette et al. 2014). Anexcessive number of zeros (spotless days) also originates fromhistorical archives that do not provide the exact dates of theobservations. Hence, Rg from 1660 to 1683 is about zero(Figure 6(b)). According to the database of the naked-eye spots(Vaquero et al. 2002), in 1665 there were four large spots, noneof which was registered in the historical archives from the GSNdatabase. These findings suggest to us that Rg is significantlyunderestimated from 1660 to 1682.
7. OBSERVATIONS BY FATHER AND SON LA HIRE
From 1682 June to 1718 April, solar observations in the Parisobservatory were carried out by Picard’s student Philippe de LaHire, and then from 1718 April to 1719 May by his son Gabriel-Philippe de La Hire. Ribes & Nesme-Ribes (1993) noticed thatafter Picard’s death, the elder La Hire worked independently.
Figure 7 compares the calendar dates and the nominal NSGsregistered by the astronomers in the Paris observatory and byother observers. Figure 7(a) shows the calendar dates whenthe father and son La Hire made regular observations andreported sunspots.
Figure 7(b) shows in green the dates and NSG for thelist of observers who reported a blank solar disk or onesunspot group per day during the period from 1680 to theend of 1720. These are Giovanni Domenico Cassini, JohannesHevelius, Christianus Agerholm (excluding the time period from1695 May 31 to 1700 October 31, which is entirely filledwith zeros in the GSN database), Gulielmini (from 1675 to1679 he only reported a spotless Sun, because according toFigure 6(a) he is from the cyan list), Georg Christoph Eimmart(observed regularly, but registered only a few spots in 1682 July,1684 June, 1703 May–July), Michael Ernst Ettmuller, Caswell,Clausen, Jesuit father Petrus Jartoux in Peking, Johann HeinrichHoffmann, Stephen Gray, Ole Christensen Roemer, Salvago,
7

The Astrophysical Journal, 800:42 (14pp), 2015 February 10 Zolotova & Ponyavin
5
2
4
0
1
3
1685 1690 1695 1700 1705 1710 1715 1720
(d)
0
1
2
Num
ber
ofna
ked-
eye
suns
pots
020406080
100
1685 1690 1695 1700 1705 1710 1715 1720Time (year)
Gro
upsu
nspo
tnum
ber
0
Num
ber
ofsu
nspo
tgr
oups
1685 1690 1695 1700 1705 1710 1715 1720
1685 1690 1695 1700 1705 1710 1715 1720
(a)
6
89
0
2
4
7
5
3
1Num
ber
ofsu
nspo
t gro
ups
Num
ber
ofsu
nspo
tgro
ups
(b)
Figure 7. Sunspot observations. (a) The diagram shows the date and daily nominal number of the sunspot groups reported by Philippe de La Hire and Gabriel-Philippede La Hire. (b) The same information but for a group of observers who reported at least one (green) or several (red) sunspot groups per day. Brown defines observationsby Siverous. (c) The same information but for a group of observers who reported a spotless Sun. Brown marks days when Siverous reported a blank solar disk.(d) Blue denotes Rg and green the number of naked-eye spots from 1682 to 1721.
De La Val, De Clapier, Fulchiron, Thyoli, Unknown/Lalande(unidentified observer from “Memories” by Joseph-JeromeLefrancais de Lalande), John Flamsteed (observed regularly upto 1700, reported few spots in 1684 and 1703), and JohannAbraham Ihle.
Further, Figure 7(b) illustrates the dates and NSG for thered list of the observers who reported more than one sunspotgroup per day from 1682 to the end of 1720. These are JacquesCassini, Johann Philipp Wurzelbaur (excluding the time periodfrom 1710 October 29 to 1713 May 17 which is entirely filledwith zeros in the GSN database), Johann Bernhard Wieden-burg (excluding the time period from 1708 January 16 to 1708August 10, due to the same reason), M. Maraldi (excluding1689, February, March, October, and December in 1716. Also,according to the GSN database, M. Maraldi is actually Gia-como Filippo Maraldi who is a son of Francesco Maraldi),Gottfried Kirch, Christoph or Christfried Kirch, Maria Mar-garethe Winkelmann Kirch, Christof Arnold, Eustachio Man-fredi, Francesco Blanchini, Stannyan, Plantade, J. H. Muller,Johann Christop Muller, Johann Jakob Scheuchzer, ChristianTheoph. Hertel, L. C. Sturm, Louis Feuillee, Christopher Wolf,Joseph-Nicolas De L’Isle, Joh. Wilhelmo Wagner, Alischer,Schutz, Antoine Francois Laval, and William Derham (exclud-
ing the time period from 1710 October 19 to 1714 September 9,which is filled with zeros in the GSN database).
During the “zero period” 1710–1714, Derham’s archives havethe only gap on 1713 May 18–30. It is exactly the time whenWurzelbaur, Kirch, De l’Isle, Unknown/Lalande, and Grayreported a sunspot group. Hence, Derham probably saw thisgroup, but preferred to be silent. Since this sunspot group wasregistered by observers from Nuremberg, Berlin, Paris, andCanterbury (England), it must not have been small. However,Ph. La Hire was the only one who observed the Sun for severaldays in 1713 May 18–30 but reported a spotless Sun. Here wecan conclude that not all sunspot groups were registered by theastronomers from the Paris observatory.
In the red list of observers, we do not include observationsdone by Johann Leonhard Rost, because in 1719 and 1720 hesystematically reported a very large NSGs, up to 36. However,according to the Royal Greenwich Observatory, the maximumnominal NSGs in Cycle 19 is only 25.
Figure 7(b) also contains two brown stems which mark oneand three sunspot groups, respectively, registered by Siverus in1689. With the exception of these two observations, Siverusreported of a blank Sun daily (brown in Figure 7(c)). Hisrecords on spotless days contain gaps as soon as other observers
8
The Astrophysical Journal, 800:42 (14pp), 2015 February 10 Zolotova & Ponyavin
M , M., Baraldi ononia
C , G.D., Passini arisD , M., Lechales ugduni
Eimmart, G.C., Nuremberg
Flamsteed, J., Cambridge
La Hire, Ph., Paris
Siverus, H., Hamburg
Time (month)Jan Mar Jul Sep Nov JanMay
Jan Mar Jul Sep Nov JanMay
Jan Mar Jul Sep Nov JanMay
Num
ber
ofsu
nspo
tgro
ups
0123
01
0
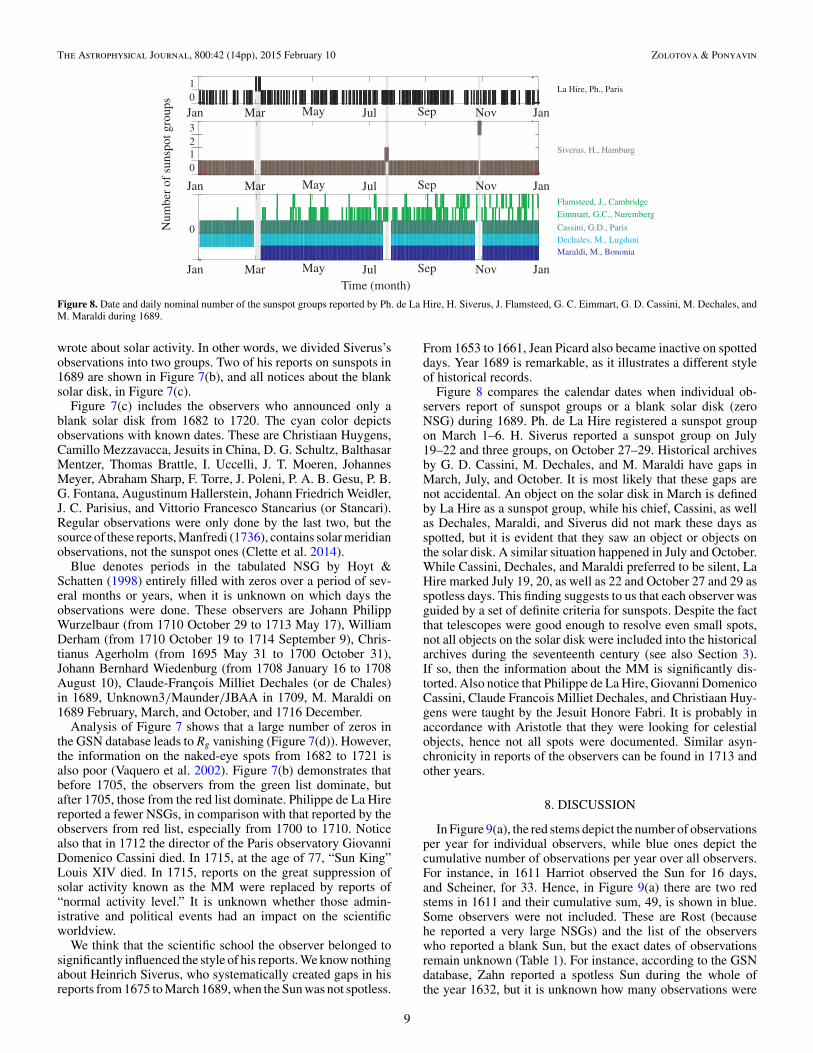
Figure 8. Date and daily nominal number of the sunspot groups reported by Ph. de La Hire, H. Siverus, J. Flamsteed, G. C. Eimmart, G. D. Cassini, M. Dechales, andM. Maraldi during 1689.
wrote about solar activity. In other words, we divided Siverus’sobservations into two groups. Two of his reports on sunspots in1689 are shown in Figure 7(b), and all notices about the blanksolar disk, in Figure 7(c).
Figure 7(c) includes the observers who announced only ablank solar disk from 1682 to 1720. The cyan color depictsobservations with known dates. These are Christiaan Huygens,Camillo Mezzavacca, Jesuits in China, D. G. Schultz, BalthasarMentzer, Thomas Brattle, I. Uccelli, J. T. Moeren, JohannesMeyer, Abraham Sharp, F. Torre, J. Poleni, P. A. B. Gesu, P. B.G. Fontana, Augustinum Hallerstein, Johann Friedrich Weidler,J. C. Parisius, and Vittorio Francesco Stancarius (or Stancari).Regular observations were only done by the last two, but thesource of these reports, Manfredi (1736), contains solar meridianobservations, not the sunspot ones (Clette et al. 2014).
Blue denotes periods in the tabulated NSG by Hoyt &Schatten (1998) entirely filled with zeros over a period of sev-eral months or years, when it is unknown on which days theobservations were done. These observers are Johann PhilippWurzelbaur (from 1710 October 29 to 1713 May 17), WilliamDerham (from 1710 October 19 to 1714 September 9), Chris-tianus Agerholm (from 1695 May 31 to 1700 October 31),Johann Bernhard Wiedenburg (from 1708 January 16 to 1708August 10), Claude-Francois Milliet Dechales (or de Chales)in 1689, Unknown3/Maunder/JBAA in 1709, M. Maraldi on1689 February, March, and October, and 1716 December.
Analysis of Figure 7 shows that a large number of zeros inthe GSN database leads to Rg vanishing (Figure 7(d)). However,the information on the naked-eye spots from 1682 to 1721 isalso poor (Vaquero et al. 2002). Figure 7(b) demonstrates thatbefore 1705, the observers from the green list dominate, butafter 1705, those from the red list dominate. Philippe de La Hirereported a fewer NSGs, in comparison with that reported by theobservers from red list, especially from 1700 to 1710. Noticealso that in 1712 the director of the Paris observatory GiovanniDomenico Cassini died. In 1715, at the age of 77, “Sun King”Louis XIV died. In 1715, reports on the great suppression ofsolar activity known as the MM were replaced by reports of“normal activity level.” It is unknown whether those admin-istrative and political events had an impact on the scientificworldview.
We think that the scientific school the observer belonged tosignificantly influenced the style of his reports. We know nothingabout Heinrich Siverus, who systematically created gaps in hisreports from 1675 to March 1689, when the Sun was not spotless.
From 1653 to 1661, Jean Picard also became inactive on spotteddays. Year 1689 is remarkable, as it illustrates a different styleof historical records.
Figure 8 compares the calendar dates when individual ob-servers report of sunspot groups or a blank solar disk (zeroNSG) during 1689. Ph. de La Hire registered a sunspot groupon March 1–6. H. Siverus reported a sunspot group on July19–22 and three groups, on October 27–29. Historical archivesby G. D. Cassini, M. Dechales, and M. Maraldi have gaps inMarch, July, and October. It is most likely that these gaps arenot accidental. An object on the solar disk in March is definedby La Hire as a sunspot group, while his chief, Cassini, as wellas Dechales, Maraldi, and Siverus did not mark these days asspotted, but it is evident that they saw an object or objects onthe solar disk. A similar situation happened in July and October.While Cassini, Dechales, and Maraldi preferred to be silent, LaHire marked July 19, 20, as well as 22 and October 27 and 29 asspotless days. This finding suggests to us that each observer wasguided by a set of definite criteria for sunspots. Despite the factthat telescopes were good enough to resolve even small spots,not all objects on the solar disk were included into the historicalarchives during the seventeenth century (see also Section 3).If so, then the information about the MM is significantly dis-torted. Also notice that Philippe de La Hire, Giovanni DomenicoCassini, Claude Francois Milliet Dechales, and Christiaan Huy-gens were taught by the Jesuit Honore Fabri. It is probably inaccordance with Aristotle that they were looking for celestialobjects, hence not all spots were documented. Similar asyn-chronicity in reports of the observers can be found in 1713 andother years.
8. DISCUSSION
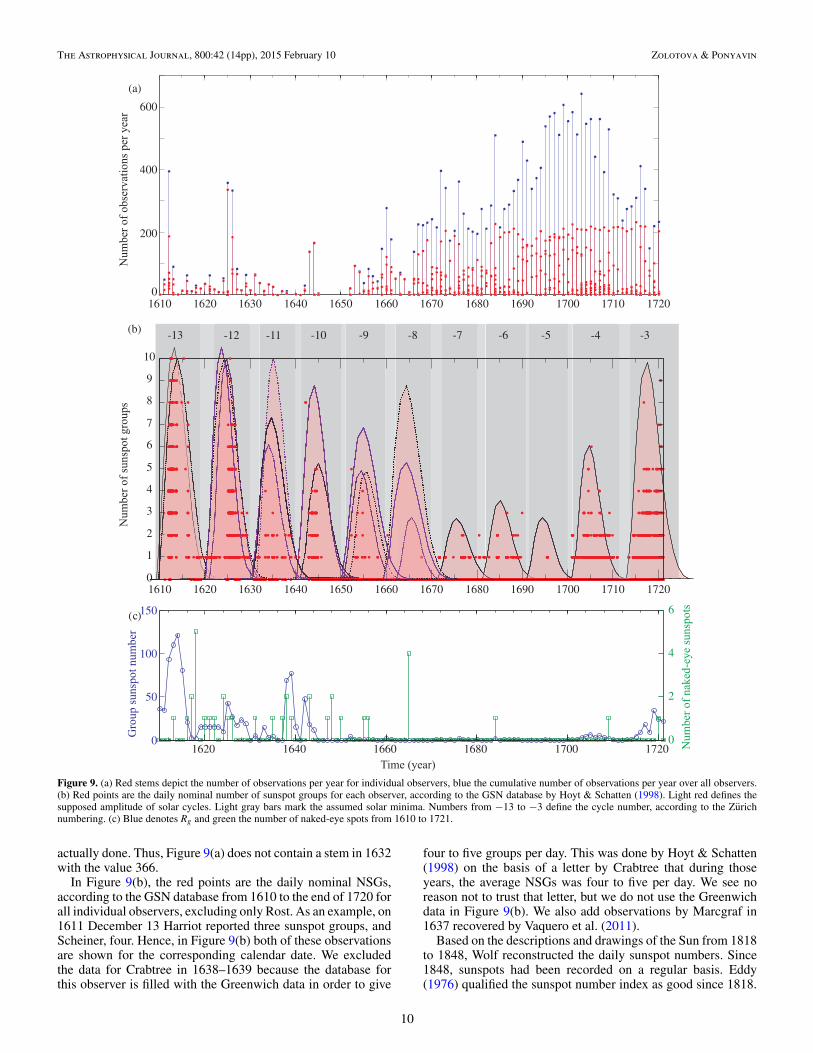
In Figure 9(a), the red stems depict the number of observationsper year for individual observers, while blue ones depict thecumulative number of observations per year over all observers.For instance, in 1611 Harriot observed the Sun for 16 days,and Scheiner, for 33. Hence, in Figure 9(a) there are two redstems in 1611 and their cumulative sum, 49, is shown in blue.Some observers were not included. These are Rost (becausehe reported a very large NSGs) and the list of the observerswho reported a blank Sun, but the exact dates of observationsremain unknown (Table 1). For instance, according to the GSNdatabase, Zahn reported a spotless Sun during the whole ofthe year 1632, but it is unknown how many observations were
9
The Astrophysical Journal, 800:42 (14pp), 2015 February 10 Zolotova & Ponyavin
1620 1640 1660 1680 1700 17200
50
100
150
0
2
4
6
-3-4-5-6-7-8-9-10-11-12-13
1620 1630 1640 1650 1660 1670 1680 1690 1700 1710 17201610
2
3
4
5
6
7
8
9
10
0
1
1620 1630 1640 1650 1660 1670 1680 1690 1700 1710 17201610
400
600
0
200
(a)
(b)
Figure 9. (a) Red stems depict the number of observations per year for individual observers, blue the cumulative number of observations per year over all observers.(b) Red points are the daily nominal number of sunspot groups for each observer, according to the GSN database by Hoyt & Schatten (1998). Light red defines thesupposed amplitude of solar cycles. Light gray bars mark the assumed solar minima. Numbers from −13 to −3 define the cycle number, according to the Zurichnumbering. (c) Blue denotes Rg and green the number of naked-eye spots from 1610 to 1721.
actually done. Thus, Figure 9(a) does not contain a stem in 1632with the value 366.
In Figure 9(b), the red points are the daily nominal NSGs,according to the GSN database from 1610 to the end of 1720 forall individual observers, excluding only Rost. As an example, on1611 December 13 Harriot reported three sunspot groups, andScheiner, four. Hence, in Figure 9(b) both of these observationsare shown for the corresponding calendar date. We excludedthe data for Crabtree in 1638–1639 because the database forthis observer is filled with the Greenwich data in order to give
four to five groups per day. This was done by Hoyt & Schatten(1998) on the basis of a letter by Crabtree that during thoseyears, the average NSGs was four to five per day. We see noreason not to trust that letter, but we do not use the Greenwichdata in Figure 9(b). We also add observations by Marcgraf in1637 recovered by Vaquero et al. (2011).
Based on the descriptions and drawings of the Sun from 1818to 1848, Wolf reconstructed the daily sunspot numbers. Since1848, sunspots had been recorded on a regular basis. Eddy(1976) qualified the sunspot number index as good since 1818.
10
The Astrophysical Journal, 800:42 (14pp), 2015 February 10 Zolotova & Ponyavin
0
-50
50
30
-30
1620 1630 1640 1650 1660 1670 1680 1690 1700 1710 17201610
Picard/KeillScheiner Hevelius Picard
GassendiGalilei
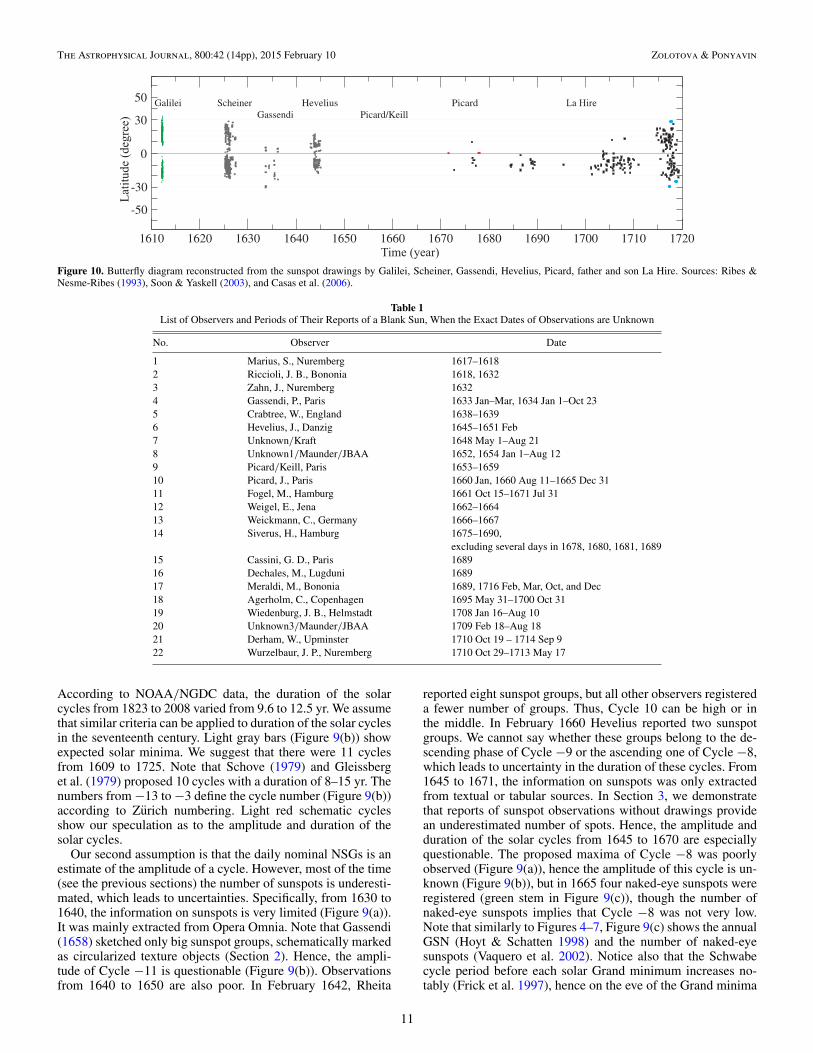
Figure 10. Butterfly diagram reconstructed from the sunspot drawings by Galilei, Scheiner, Gassendi, Hevelius, Picard, father and son La Hire. Sources: Ribes &Nesme-Ribes (1993), Soon & Yaskell (2003), and Casas et al. (2006).
Table 1List of Observers and Periods of Their Reports of a Blank Sun, When the Exact Dates of Observations are Unknown
No. Observer Date
1 Marius, S., Nuremberg 1617–16182 Riccioli, J. B., Bononia 1618, 16323 Zahn, J., Nuremberg 16324 Gassendi, P., Paris 1633 Jan–Mar, 1634 Jan 1–Oct 235 Crabtree, W., England 1638–16396 Hevelius, J., Danzig 1645–1651 Feb7 Unknown/Kraft 1648 May 1–Aug 218 Unknown1/Maunder/JBAA 1652, 1654 Jan 1–Aug 129 Picard/Keill, Paris 1653–165910 Picard, J., Paris 1660 Jan, 1660 Aug 11–1665 Dec 3111 Fogel, M., Hamburg 1661 Oct 15–1671 Jul 3112 Weigel, E., Jena 1662–166413 Weickmann, C., Germany 1666–166714 Siverus, H., Hamburg 1675–1690,
excluding several days in 1678, 1680, 1681, 168915 Cassini, G. D., Paris 168916 Dechales, M., Lugduni 168917 Meraldi, M., Bononia 1689, 1716 Feb, Mar, Oct, and Dec18 Agerholm, C., Copenhagen 1695 May 31–1700 Oct 3119 Wiedenburg, J. B., Helmstadt 1708 Jan 16–Aug 1020 Unknown3/Maunder/JBAA 1709 Feb 18–Aug 1821 Derham, W., Upminster 1710 Oct 19 – 1714 Sep 922 Wurzelbaur, J. P., Nuremberg 1710 Oct 29–1713 May 17
According to NOAA/NGDC data, the duration of the solarcycles from 1823 to 2008 varied from 9.6 to 12.5 yr. We assumethat similar criteria can be applied to duration of the solar cyclesin the seventeenth century. Light gray bars (Figure 9(b)) showexpected solar minima. We suggest that there were 11 cyclesfrom 1609 to 1725. Note that Schove (1979) and Gleissberget al. (1979) proposed 10 cycles with a duration of 8–15 yr. Thenumbers from −13 to −3 define the cycle number (Figure 9(b))according to Zurich numbering. Light red schematic cyclesshow our speculation as to the amplitude and duration of thesolar cycles.
Our second assumption is that the daily nominal NSGs is anestimate of the amplitude of a cycle. However, most of the time(see the previous sections) the number of sunspots is underesti-mated, which leads to uncertainties. Specifically, from 1630 to1640, the information on sunspots is very limited (Figure 9(a)).It was mainly extracted from Opera Omnia. Note that Gassendi(1658) sketched only big sunspot groups, schematically markedas circularized texture objects (Section 2). Hence, the ampli-tude of Cycle −11 is questionable (Figure 9(b)). Observationsfrom 1640 to 1650 are also poor. In February 1642, Rheita
reported eight sunspot groups, but all other observers registereda fewer number of groups. Thus, Cycle 10 can be high or inthe middle. In February 1660 Hevelius reported two sunspotgroups. We cannot say whether these groups belong to the de-scending phase of Cycle −9 or the ascending one of Cycle −8,which leads to uncertainty in the duration of these cycles. From1645 to 1671, the information on sunspots was only extractedfrom textual or tabular sources. In Section 3, we demonstratethat reports of sunspot observations without drawings providean underestimated number of spots. Hence, the amplitude andduration of the solar cycles from 1645 to 1670 are especiallyquestionable. The proposed maxima of Cycle −8 was poorlyobserved (Figure 9(a)), hence the amplitude of this cycle is un-known (Figure 9(b)), but in 1665 four naked-eye sunspots wereregistered (green stem in Figure 9(c)), though the number ofnaked-eye sunspots implies that Cycle −8 was not very low.Note that similarly to Figures 4–7, Figure 9(c) shows the annualGSN (Hoyt & Schatten 1998) and the number of naked-eyesunspots (Vaquero et al. 2002). Notice also that the Schwabecycle period before each solar Grand minimum increases no-tably (Frick et al. 1997), hence on the eve of the Grand minima
11
The Astrophysical Journal, 800:42 (14pp), 2015 February 10 Zolotova & Ponyavin
12 14 16 18 20 22 24
Area>500
Area>2500
1000
2000
0
(a)
0
20
40
(b)
Figure 11. Number of sunspot groups in the northern hemisphere (blue) and thesouthern hemisphere (red): (a) with an area larger than 2500 msh and (b) withan area larger than 500 msh.
we can expect a cycle similar to Cycles 4, 11, or 23 (Zolotova& Ponyavin 2014). Due to the large number of zeros in theGSN database, Rg has been vanishing since 1645 (blue line inFigure 9(c)). Also, few sunspot groups were registered from1670 to 1710 (red points in Figure 9(b)). We suggest that Cycles−7 to −5 correspond to the minimum of the secular cycle.
Figure 10 shows the spatio-temporal sunspot distributionfrom 1610 to 1719. Sunspot positions (green points) fromGalilei’s drawings are provided by Casas et al. (2006). Graycircles mark drawings by Scheiner, Gassendi, and Hevelius.This part of the figure was taken from the book by Soon &Yaskell (2003), where the authors referred to Elizabeth Nesme-Ribes. Notice that Opera Omnia by Gassendi (1658) containsdrawings from 1633 to 1638; however, the asymmetric butterflydiagram only covers 1634–1636. The small black squares from1671 to 1719, originally published by Ribes & Nesme-Ribes(1993), are taken from Sokoloff & Nesme-Ribes (1994). Thebutterfly diagram for the MM can also be found in Soon &Yaskell (2003). Also notice that the red squares in Figure 10 arepresent in Ribes & Nesme-Ribes (1993), but they are absent inSoon & Yaskell (2003), while the blue ones are present in Soon& Yaskell (2003) and absent in Ribes & Nesme-Ribes (1993).
According to reports by Gassendi, Picard, and La Hire, thebutterfly diagram was asymmetric (Figure 10) for several cycles(Eddy 1976; Ribes & Nesme-Ribes 1993). In Section 2, weargue that Gassendi (1658) drew only large sunspot groups. InSection 7, we demonstrate that La Hire also reported a fewer
number of spots compared to other observers. We suggest thatthese facts can be explained by the scientific point of view ofthe observers, according to which sunspots are shadows castby unknown celestial bodies. Hence, only sufficiently largesunspots with circularized shapes were reported. Small spotsand spots of irregular shapes were probably not mentioned, inorder to avoid a controversy.
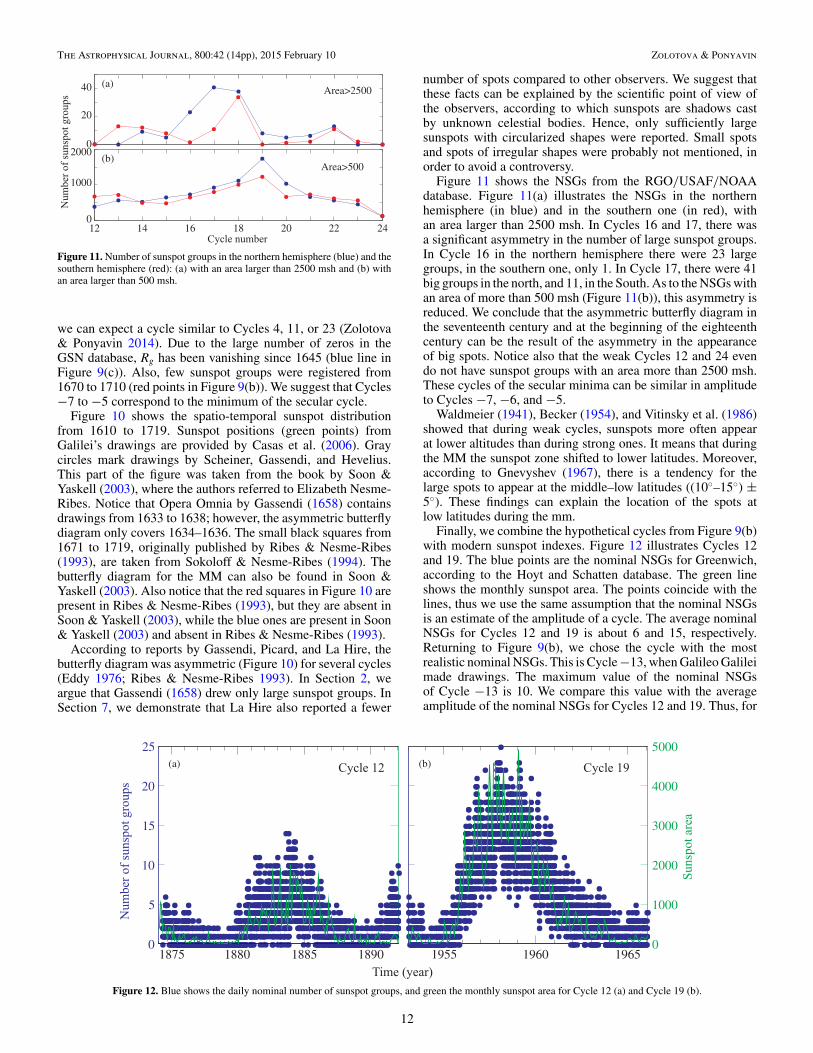
Figure 11 shows the NSGs from the RGO/USAF/NOAAdatabase. Figure 11(a) illustrates the NSGs in the northernhemisphere (in blue) and in the southern one (in red), withan area larger than 2500 msh. In Cycles 16 and 17, there wasa significant asymmetry in the number of large sunspot groups.In Cycle 16 in the northern hemisphere there were 23 largegroups, in the southern one, only 1. In Cycle 17, there were 41big groups in the north, and 11, in the South. As to the NSGs withan area of more than 500 msh (Figure 11(b)), this asymmetry isreduced. We conclude that the asymmetric butterfly diagram inthe seventeenth century and at the beginning of the eighteenthcentury can be the result of the asymmetry in the appearanceof big spots. Notice also that the weak Cycles 12 and 24 evendo not have sunspot groups with an area more than 2500 msh.These cycles of the secular minima can be similar in amplitudeto Cycles −7, −6, and −5.
Waldmeier (1941), Becker (1954), and Vitinsky et al. (1986)showed that during weak cycles, sunspots more often appearat lower altitudes than during strong ones. It means that duringthe MM the sunspot zone shifted to lower latitudes. Moreover,according to Gnevyshev (1967), there is a tendency for thelarge spots to appear at the middle–low latitudes ((10◦–15◦) ±5◦). These findings can explain the location of the spots atlow latitudes during the mm.
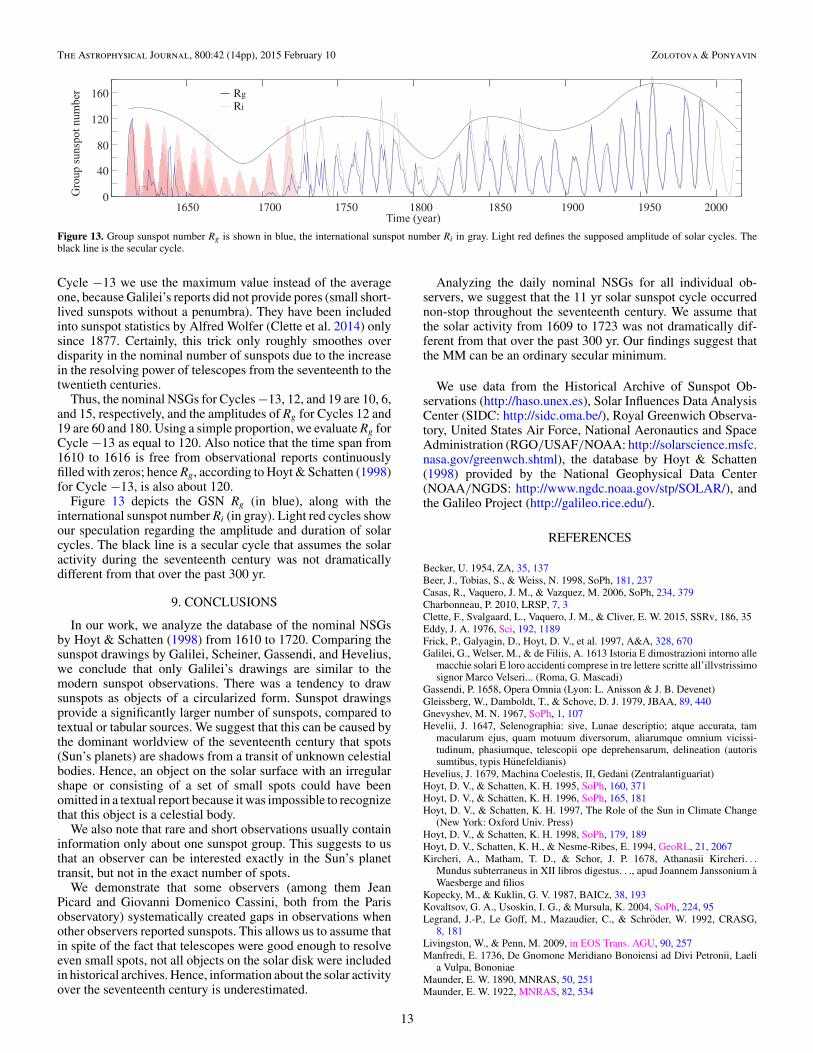
Finally, we combine the hypothetical cycles from Figure 9(b)with modern sunspot indexes. Figure 12 illustrates Cycles 12and 19. The blue points are the nominal NSGs for Greenwich,according to the Hoyt and Schatten database. The green lineshows the monthly sunspot area. The points coincide with thelines, thus we use the same assumption that the nominal NSGsis an estimate of the amplitude of a cycle. The average nominalNSGs for Cycles 12 and 19 is about 6 and 15, respectively.Returning to Figure 9(b), we chose the cycle with the mostrealistic nominal NSGs. This is Cycle −13, when Galileo Galileimade drawings. The maximum value of the nominal NSGsof Cycle −13 is 10. We compare this value with the averageamplitude of the nominal NSGs for Cycles 12 and 19. Thus, for
0
1000
2000
3000
4000
5000
1875 1880 1885 1890 1955 1960 1965
(a) (b)
0
5
10
15
20
25
Figure 12. Blue shows the daily nominal number of sunspot groups, and green the monthly sunspot area for Cycle 12 (a) and Cycle 19 (b).
12
The Astrophysical Journal, 800:42 (14pp), 2015 February 10 Zolotova & Ponyavin
120
160
0
40
80
1650 1700 1750 1800 1850 1900 1950 2000
RR
gi
Figure 13. Group sunspot number Rg is shown in blue, the international sunspot number Ri in gray. Light red defines the supposed amplitude of solar cycles. Theblack line is the secular cycle.
Cycle −13 we use the maximum value instead of the averageone, because Galilei’s reports did not provide pores (small short-lived sunspots without a penumbra). They have been includedinto sunspot statistics by Alfred Wolfer (Clette et al. 2014) onlysince 1877. Certainly, this trick only roughly smoothes overdisparity in the nominal number of sunspots due to the increasein the resolving power of telescopes from the seventeenth to thetwentieth centuries.
Thus, the nominal NSGs for Cycles −13, 12, and 19 are 10, 6,and 15, respectively, and the amplitudes of Rg for Cycles 12 and19 are 60 and 180. Using a simple proportion, we evaluate Rg forCycle −13 as equal to 120. Also notice that the time span from1610 to 1616 is free from observational reports continuouslyfilled with zeros; hence Rg, according to Hoyt & Schatten (1998)for Cycle −13, is also about 120.
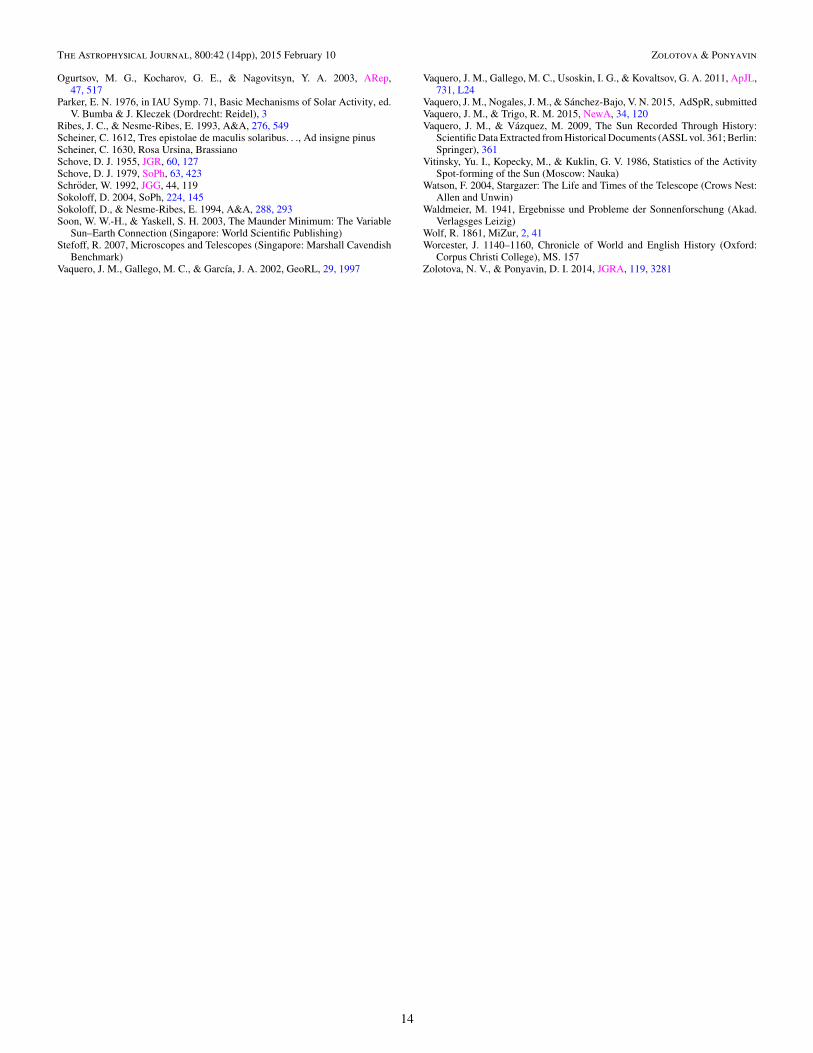
Figure 13 depicts the GSN Rg (in blue), along with theinternational sunspot number Ri (in gray). Light red cycles showour speculation regarding the amplitude and duration of solarcycles. The black line is a secular cycle that assumes the solaractivity during the seventeenth century was not dramaticallydifferent from that over the past 300 yr.
9. CONCLUSIONS
In our work, we analyze the database of the nominal NSGsby Hoyt & Schatten (1998) from 1610 to 1720. Comparing thesunspot drawings by Galilei, Scheiner, Gassendi, and Hevelius,we conclude that only Galilei’s drawings are similar to themodern sunspot observations. There was a tendency to drawsunspots as objects of a circularized form. Sunspot drawingsprovide a significantly larger number of sunspots, compared totextual or tabular sources. We suggest that this can be caused bythe dominant worldview of the seventeenth century that spots(Sun’s planets) are shadows from a transit of unknown celestialbodies. Hence, an object on the solar surface with an irregularshape or consisting of a set of small spots could have beenomitted in a textual report because it was impossible to recognizethat this object is a celestial body.
We also note that rare and short observations usually containinformation only about one sunspot group. This suggests to usthat an observer can be interested exactly in the Sun’s planettransit, but not in the exact number of spots.
We demonstrate that some observers (among them JeanPicard and Giovanni Domenico Cassini, both from the Parisobservatory) systematically created gaps in observations whenother observers reported sunspots. This allows us to assume thatin spite of the fact that telescopes were good enough to resolveeven small spots, not all objects on the solar disk were includedin historical archives. Hence, information about the solar activityover the seventeenth century is underestimated.
Analyzing the daily nominal NSGs for all individual ob-servers, we suggest that the 11 yr solar sunspot cycle occurrednon-stop throughout the seventeenth century. We assume thatthe solar activity from 1609 to 1723 was not dramatically dif-ferent from that over the past 300 yr. Our findings suggest thatthe MM can be an ordinary secular minimum.
We use data from the Historical Archive of Sunspot Ob-servations (http://haso.unex.es), Solar Influences Data AnalysisCenter (SIDC: http://sidc.oma.be/), Royal Greenwich Observa-tory, United States Air Force, National Aeronautics and SpaceAdministration (RGO/USAF/NOAA: http://solarscience.msfc.nasa.gov/greenwch.shtml), the database by Hoyt & Schatten(1998) provided by the National Geophysical Data Center(NOAA/NGDS: http://www.ngdc.noaa.gov/stp/SOLAR/), andthe Galileo Project (http://galileo.rice.edu/).
REFERENCES
Becker, U. 1954, ZA, 35, 137Beer, J., Tobias, S., & Weiss, N. 1998, SoPh, 181, 237Casas, R., Vaquero, J. M., & Vazquez, M. 2006, SoPh, 234, 379Charbonneau, P. 2010, LRSP, 7, 3Clette, F., Svalgaard, L., Vaquero, J. M., & Cliver, E. W. 2015, SSRv, 186, 35Eddy, J. A. 1976, Sci, 192, 1189Frick, P., Galyagin, D., Hoyt, D. V., et al. 1997, A&A, 328, 670Galilei, G., Welser, M., & de Filiis, A. 1613 Istoria E dimostrazioni intorno alle
macchie solari E loro accidenti comprese in tre lettere scritte all’illvstrissimosignor Marco Velseri... (Roma, G. Mascadi)
Gassendi, P. 1658, Opera Omnia (Lyon: L. Anisson & J. B. Devenet)Gleissberg, W., Damboldt, T., & Schove, D. J. 1979, JBAA, 89, 440Gnevyshev, M. N. 1967, SoPh, 1, 107Hevelii, J. 1647, Selenographia: sive, Lunae descriptio; atque accurata, tam
macularum ejus, quam motuum diversorum, aliarumque omnium vicissi-tudinum, phasiumque, telescopii ope deprehensarum, delineation (autorissumtibus, typis Hunefeldianis)
Hevelius, J. 1679, Machina Coelestis, II, Gedani (Zentralantiguariat)Hoyt, D. V., & Schatten, K. H. 1995, SoPh, 160, 371Hoyt, D. V., & Schatten, K. H. 1996, SoPh, 165, 181Hoyt, D. V., & Schatten, K. H. 1997, The Role of the Sun in Climate Change
(New York: Oxford Univ. Press)Hoyt, D. V., & Schatten, K. H. 1998, SoPh, 179, 189Hoyt, D. V., Schatten, K. H., & Nesme-Ribes, E. 1994, GeoRL, 21, 2067Kircheri, A., Matham, T. D., & Schor, J. P. 1678, Athanasii Kircheri. . .
Mundus subterraneus in XII libros digestus. . ., apud Joannem Janssonium aWaesberge and filios
Kopecky, M., & Kuklin, G. V. 1987, BAICz, 38, 193Kovaltsov, G. A., Usoskin, I. G., & Mursula, K. 2004, SoPh, 224, 95Legrand, J.-P., Le Goff, M., Mazaudier, C., & Schroder, W. 1992, CRASG,
8, 181Livingston, W., & Penn, M. 2009, in EOS Trans. AGU, 90, 257Manfredi, E. 1736, De Gnomone Meridiano Bonoiensi ad Divi Petronii, Laeli
a Vulpa, BononiaeMaunder, E. W. 1890, MNRAS, 50, 251Maunder, E. W. 1922, MNRAS, 82, 534
13
The Astrophysical Journal, 800:42 (14pp), 2015 February 10 Zolotova & Ponyavin
Ogurtsov, M. G., Kocharov, G. E., & Nagovitsyn, Y. A. 2003, ARep,47, 517
Parker, E. N. 1976, in IAU Symp. 71, Basic Mechanisms of Solar Activity, ed.V. Bumba & J. Kleczek (Dordrecht: Reidel), 3
Ribes, J. C., & Nesme-Ribes, E. 1993, A&A, 276, 549Scheiner, C. 1612, Tres epistolae de maculis solaribus. . ., Ad insigne pinusScheiner, C. 1630, Rosa Ursina, BrassianoSchove, D. J. 1955, JGR, 60, 127Schove, D. J. 1979, SoPh, 63, 423Schroder, W. 1992, JGG, 44, 119Sokoloff, D. 2004, SoPh, 224, 145Sokoloff, D., & Nesme-Ribes, E. 1994, A&A, 288, 293Soon, W. W.-H., & Yaskell, S. H. 2003, The Maunder Minimum: The Variable
Sun–Earth Connection (Singapore: World Scientific Publishing)Stefoff, R. 2007, Microscopes and Telescopes (Singapore: Marshall Cavendish
Benchmark)Vaquero, J. M., Gallego, M. C., & Garcıa, J. A. 2002, GeoRL, 29, 1997
Vaquero, J. M., Gallego, M. C., Usoskin, I. G., & Kovaltsov, G. A. 2011, ApJL,731, L24
Vaquero, J. M., Nogales, J. M., & Sanchez-Bajo, V. N. 2015, AdSpR, submittedVaquero, J. M., & Trigo, R. M. 2015, NewA, 34, 120Vaquero, J. M., & Vazquez, M. 2009, The Sun Recorded Through History:
Scientific Data Extracted from Historical Documents (ASSL vol. 361; Berlin:Springer), 361
Vitinsky, Yu. I., Kopecky, M., & Kuklin, G. V. 1986, Statistics of the ActivitySpot-forming of the Sun (Moscow: Nauka)
Watson, F. 2004, Stargazer: The Life and Times of the Telescope (Crows Nest:Allen and Unwin)
Waldmeier, M. 1941, Ergebnisse und Probleme der Sonnenforschung (Akad.Verlagsges Leizig)
Wolf, R. 1861, MiZur, 2, 41Worcester, J. 1140–1160, Chronicle of World and English History (Oxford:
Corpus Christi College), MS. 157Zolotova, N. V., & Ponyavin, D. I. 2014, JGRA, 119, 3281
14