climate model simulates global cold climate during late maunder minimum (1675-1710) hans von storch,...
TRANSCRIPT
CLIMATE MODEL SIMULATES GLOBAL COLD CLIMATE DURING
LATE MAUNDER MINIMUM (1675-1710)
Hans von Storch, Fidel González-Ruoco, Ulrich Cubasch, Jürg Luterbacher,
Eduardo Zorita, Beate Müller, Stephanie Legutke, and Ulrich Schlese
Visit to JISAO, Seattle, 30. October 2003

Simulation with ECHO-G (ECHAM4/HOPE-G) for
- 500 years (Columbus-run), and - 1000 years (Erik run)
forced with
- variable solar output- Volcanic aerosol load- GHG concentrations
Ed
uard
o Z
ori
ta,
pers
. co
mm
.
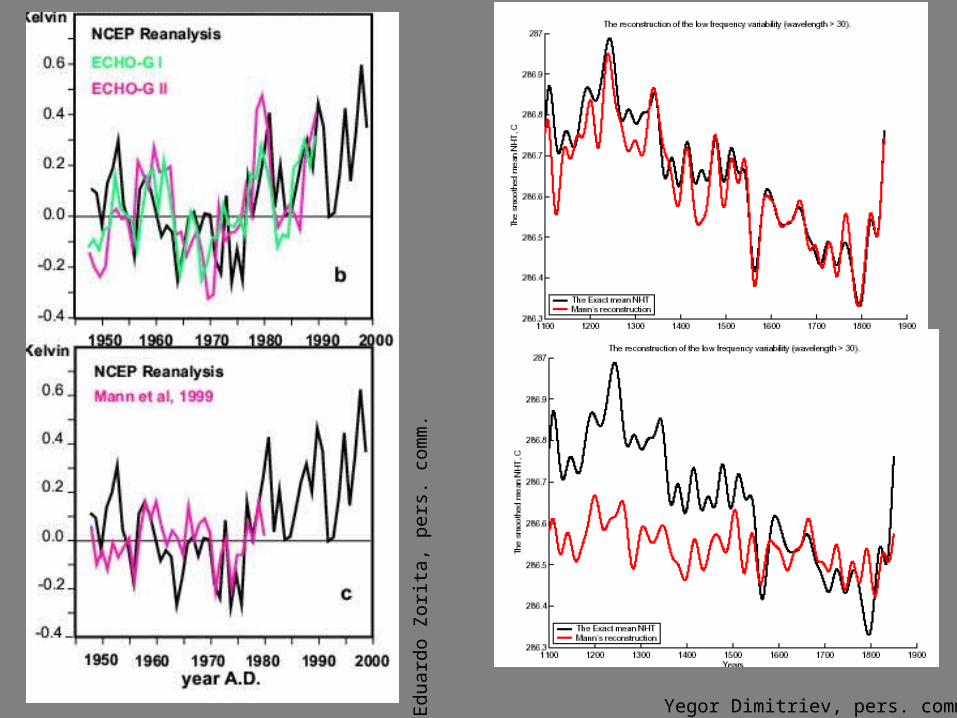
Yegor Dimitriev, pers. comm.

LMM1 1671-1684 NAO- and Cooling
LMM2 1685-1708 NAO+ and Warming
Irene Fischer-Bruns, pers. comm.

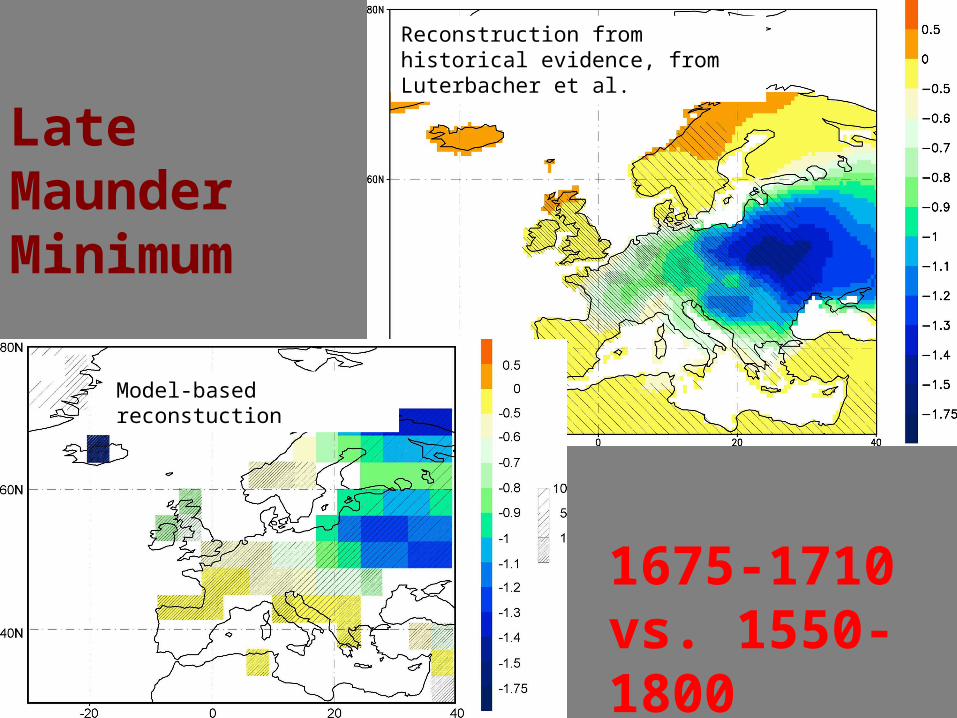
Late Maunder Minimum
Cold winters and springs, 1675-1710
Late Maunder Minimum
Cold winters and springs, 1675-1710
Analysis of Columbus run, only.

Baltic Sea ice winter index after Koslowski (1998)
grey: Index, red: 5 year mean, blue:20 year mean

The Late Maunder Minimum (LMM) is the coldest phase of the so-called ‘Little Ice Age’ with marked climatic variability over wide parts of Europe.
Temperature conditions in Switzerland according to Pfister‘s (1999) classification.
1675-1710vs. 1550-1800
Reconstruction from historical evidence, from Luterbacher et al.

Mean winter temperatures in TallinMean winter temperatures in Tallin as reconstructed by Tarand & Nordli, 2001as reconstructed by Tarand & Nordli, 2001
-12
-10
-8
-6
-4
-2
0
2
1550 1600 1650 1700 1750 1800 1850 1900 1950 2000
Tem
pera
tur [
°C]
Tarand & Nordli Gauß Filter (10 Jahre)
LMM
1675-1710vs. 1550-1800
Reconstruction from historical evidence, from Luterbacher et al.
Late Maunder Minimum
Model-based reconstuction
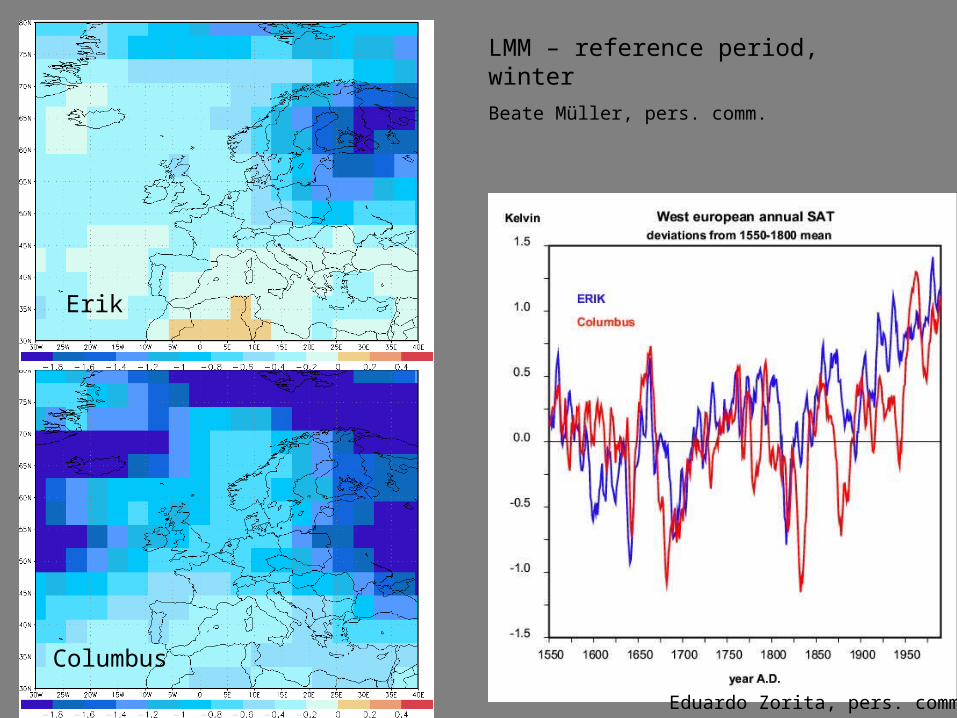
LMM – reference period, winter
Beate Müller, pers. comm.
Erik
Columbus
Eduardo Zorita, pers. comm.
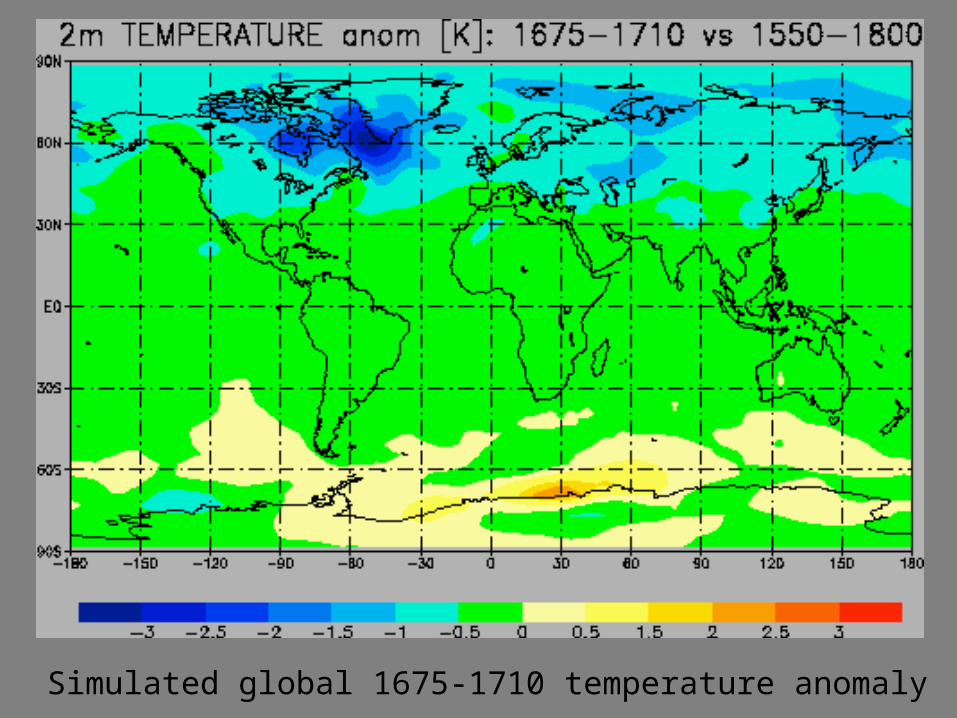
Simulated global 1675-1710 temperature anomaly

Ice Cores From Greenland and Antarctica
Stacked isotope record from five North-Greenland ice cores (Schwager, 2000)
Stacked isotope record from three ice cores from Dronning Maud Land, Antarctica (Graf et al., in press )
Reconstruction of solar
variability, deduced from
10Be measurements
(Crowley, 2000)
Antarctica
North Greenland


Corals off Madagaskar
The empirically reconstructed 338 year record of variations in sea-surface temperatures as inferred from the 1982-95 annual mean 18O -SST calibration equations using SST observations from different sources.
(From Jens Zinke)
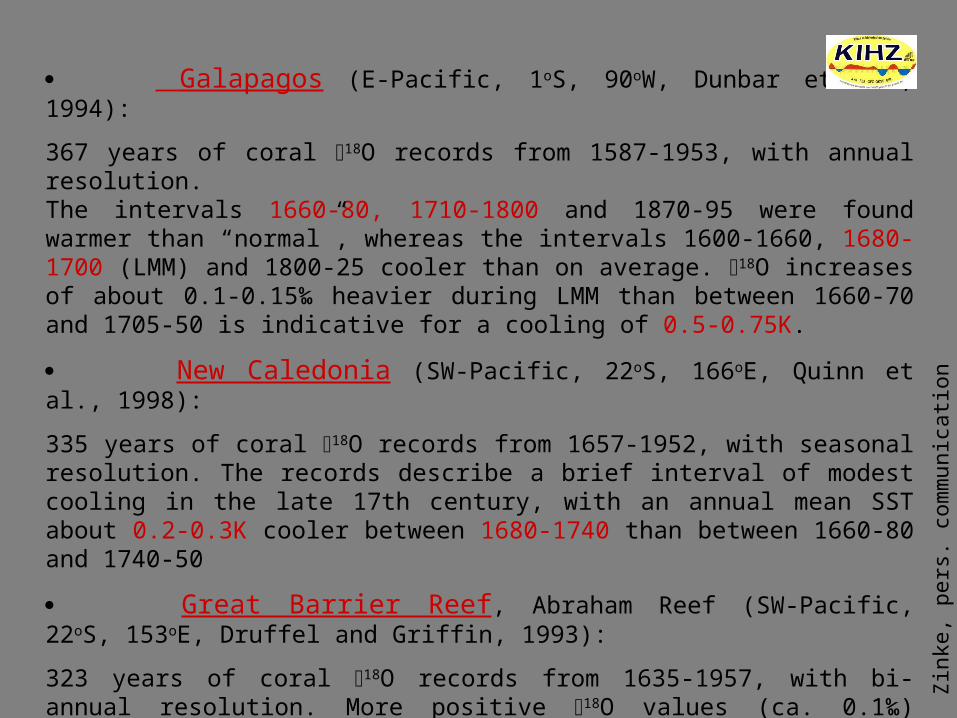
Galapagos (E-Pacific, 1oS, 90oW, Dunbar et al., 1994):
367 years of coral 18O records from 1587-1953, with annual resolution. The intervals 1660-80, 1710-1800 and 1870-95 were found warmer than “normal”, whereas the intervals 1600-1660, 1680-1700 (LMM) and 1800-25 cooler than on average. 18O increases of about 0.1-0.15‰ heavier during LMM than between 1660-70 and 1705-50 is indicative for a cooling of 0.5-0.75K.
New Caledonia (SW-Pacific, 22oS, 166oE, Quinn et al., 1998):
335 years of coral 18O records from 1657-1952, with seasonal resolution. The records describe a brief interval of modest cooling in the late 17th century, with an annual mean SST about 0.2-0.3K cooler between 1680-1740 than between 1660-80 and 1740-50
Great Barrier Reef, Abraham Reef (SW-Pacific, 22oS, 153oE, Druffel and Griffin, 1993):
323 years of coral 18O records from 1635-1957, with bi-annual resolution. More positive 18O values (ca. 0.1‰) during the LMM, are consistent with lower SST’s of about 0.5K
Zin
ke, p
ers.
com
mun
icat
ion

deMenocal et al.
(2000)
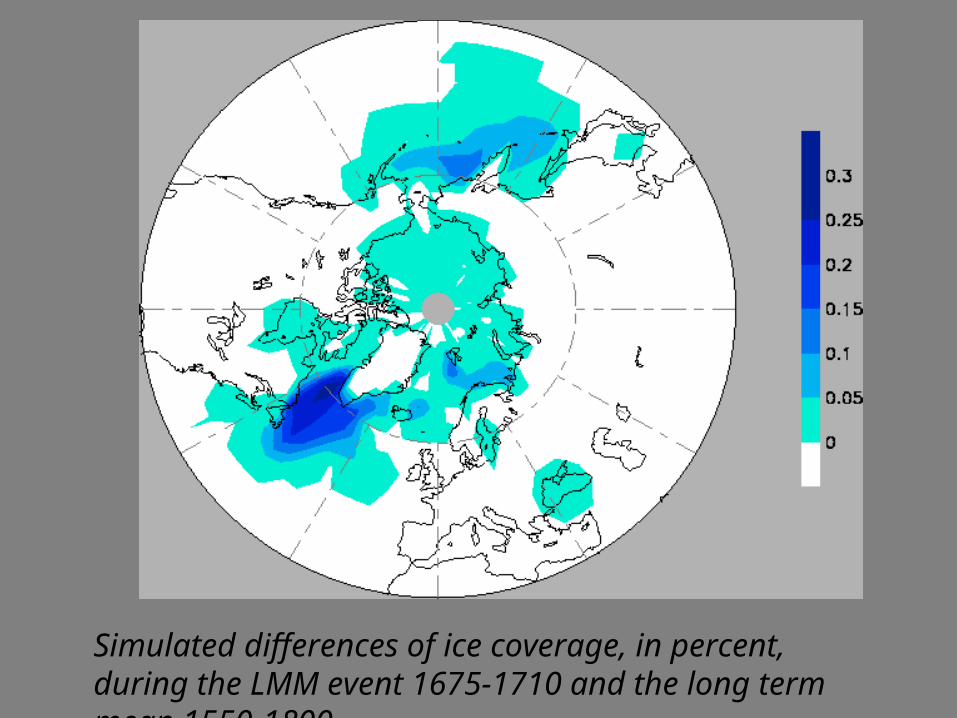
Simulated differences of ice coverage, in percent, during the LMM event 1675-1710 and the long term mean 1550-1800.

Information provided by
Fidel González-Rouco andSimon Tett
HadCM3
ECHO-G
differences relative to the 1550-1800 average;25-year running averages.
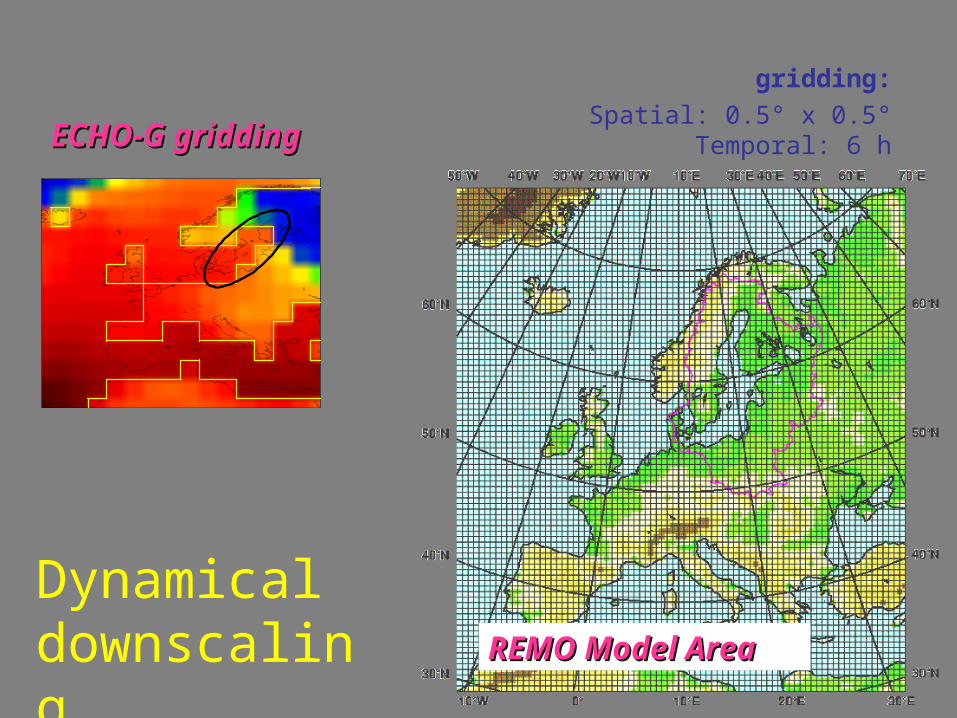
gridding:
Spatial: 0.5° x 0.5°Temporal: 6 h
REMO Model AreaREMO Model Area
ECHO-G griddingECHO-G gridding
Dynamical downscaling
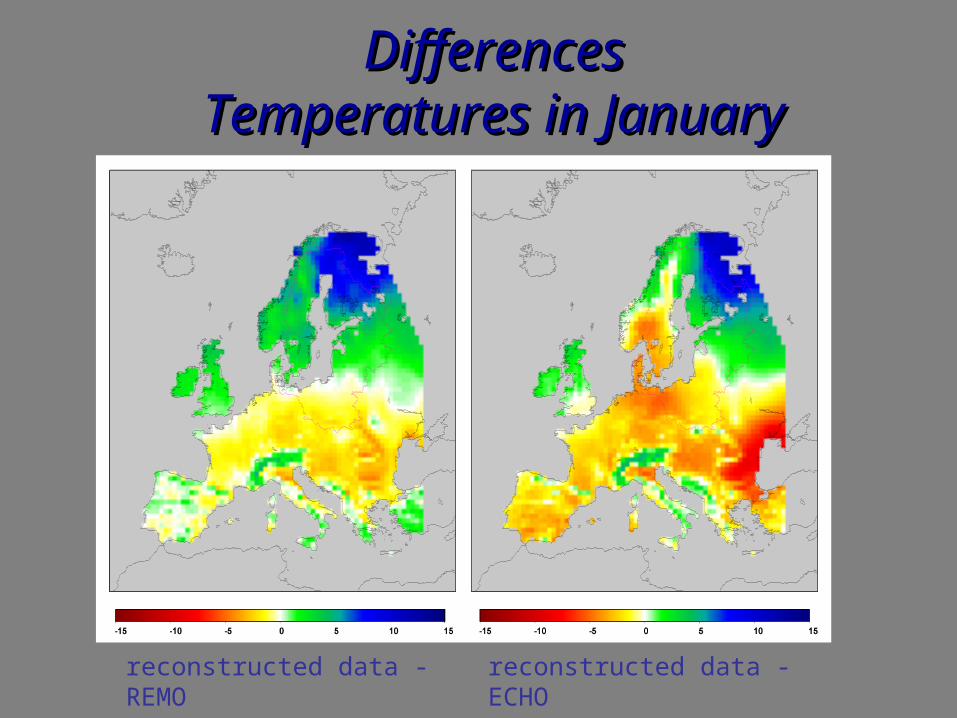
reconstructed data - REMO reconstructed data - ECHO
DifferencesDifferencesTemperatures in JanuaryTemperatures in January
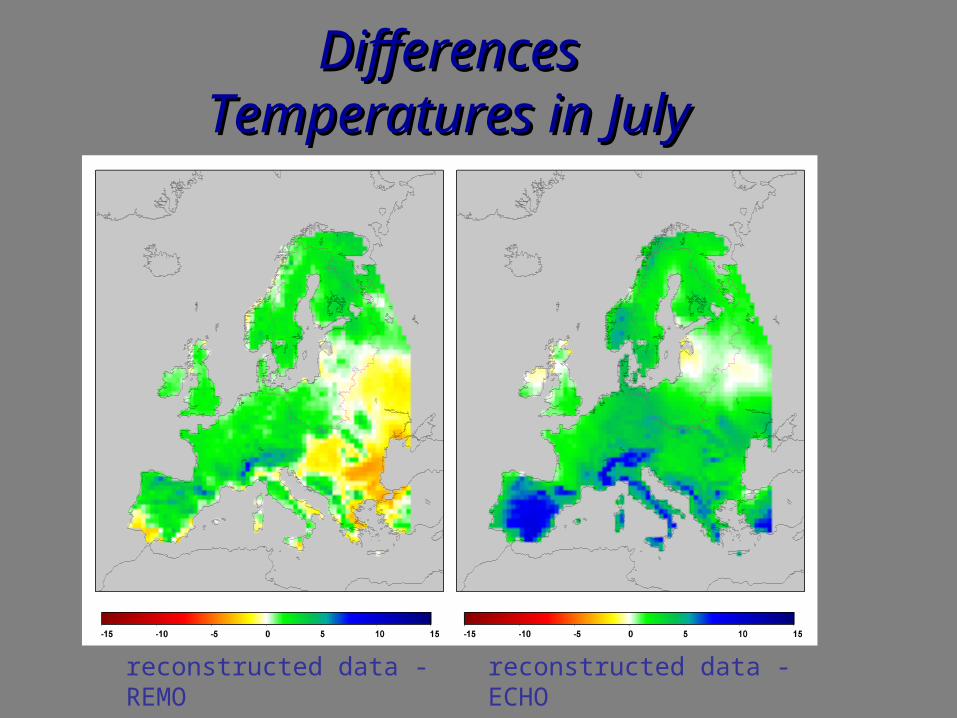
DifferencesDifferencesTemperatures in JulyTemperatures in July
reconstructed data - REMO reconstructed data - ECHO
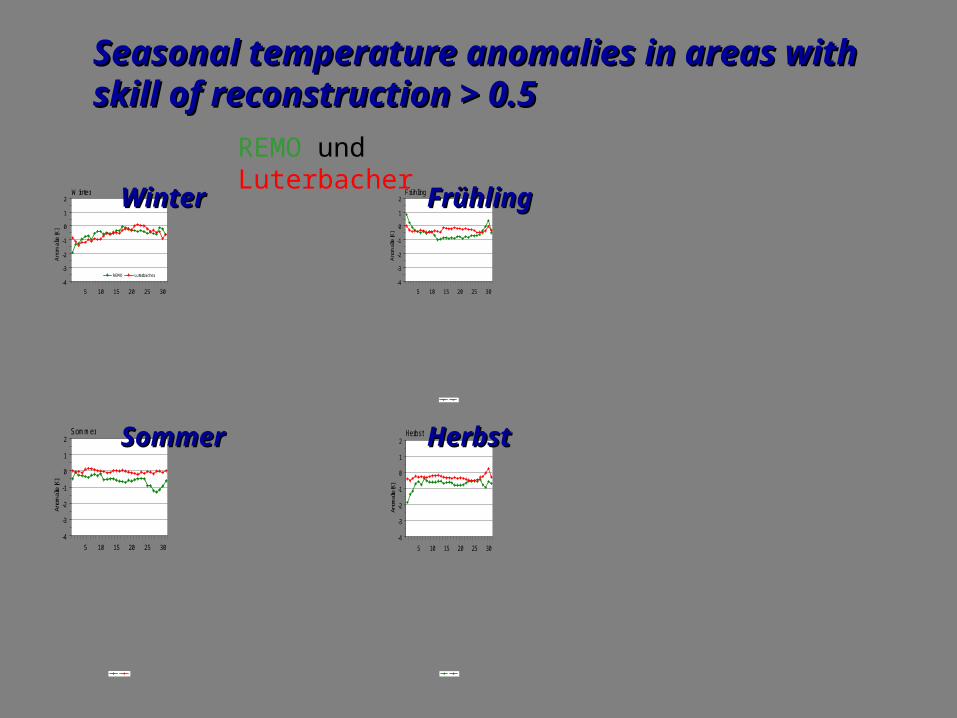
Winter
-4
-3
-2
-1
0
1
2
5 10 15 20 25 30
Ano
mal
ie [K
]
REMO Luterbacher
Frühling
-4
-3
-2
-1
0
1
2
5 10 15 20 25 30
Anom
alie
[K]
Sommer
-4
-3
-2
-1
0
1
2
5 10 15 20 25 30
Anom
alie
[K]
Herbst
-4
-3
-2
-1
0
1
2
5 10 15 20 25 30
Anom
alie
[K]
REMO und Luterbacher
Seasonal temperature anomalies in Seasonal temperature anomalies in areas with skill of reconstruction > 0.5areas with skill of reconstruction > 0.5
WinterWinter
HerbstHerbst
FrühlingFrühling
SommerSommer
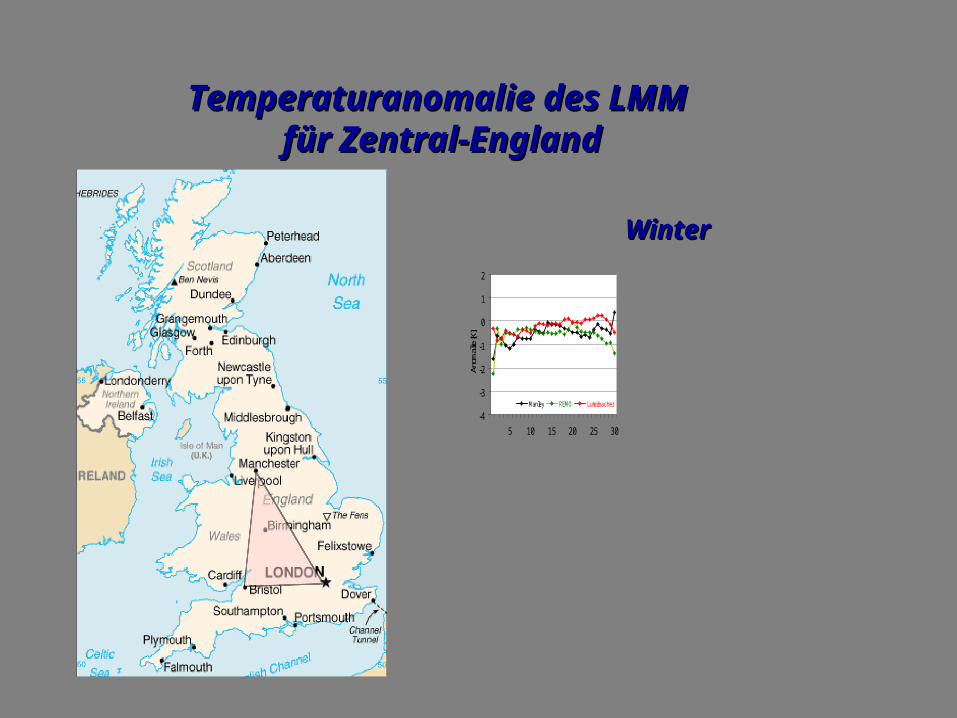
Temperaturanomalie des LMM Temperaturanomalie des LMM für Zentral-Englandfür Zentral-England
WinterWinter
-4
-3
-2
-1
0
1
2
5 10 15 20 25 30
Anom
alie
[K]
Manley REMO Luterbacher
256
260
264
268
272
5 10 15 20 25 30
Tem
pera
tur [
K]
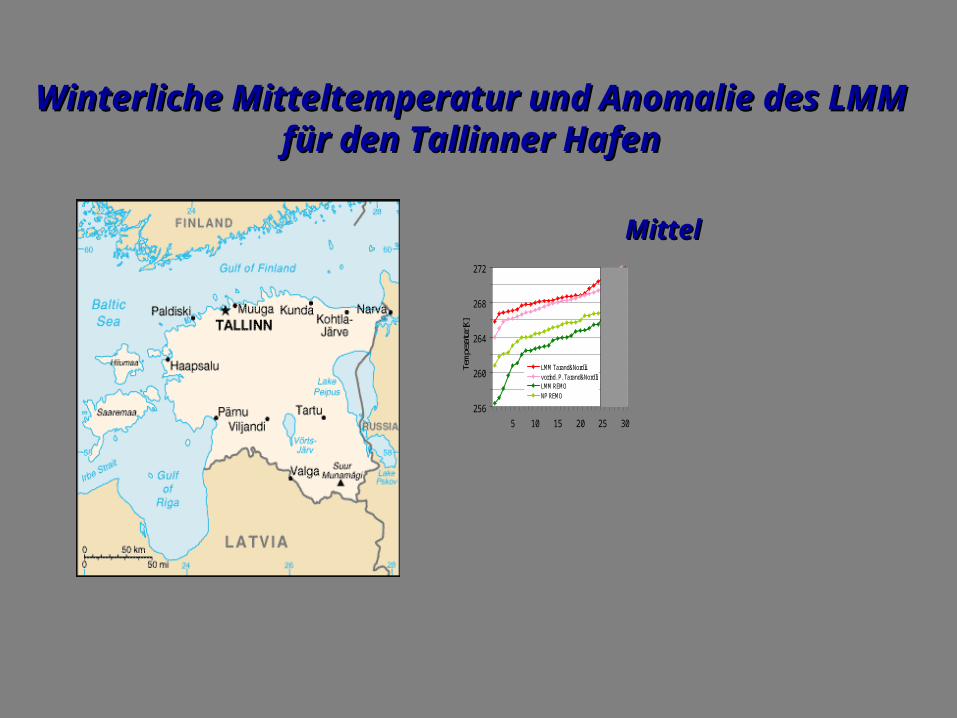
LMM Tarand&Nordlivorind. P. Tarand&NordliLMM REMONP REMO
Winterliche Mitteltemperatur und Anomalie Winterliche Mitteltemperatur und Anomalie des LMMdes LMM
für den Tallinner Hafenfür den Tallinner Hafen
MittelMittel
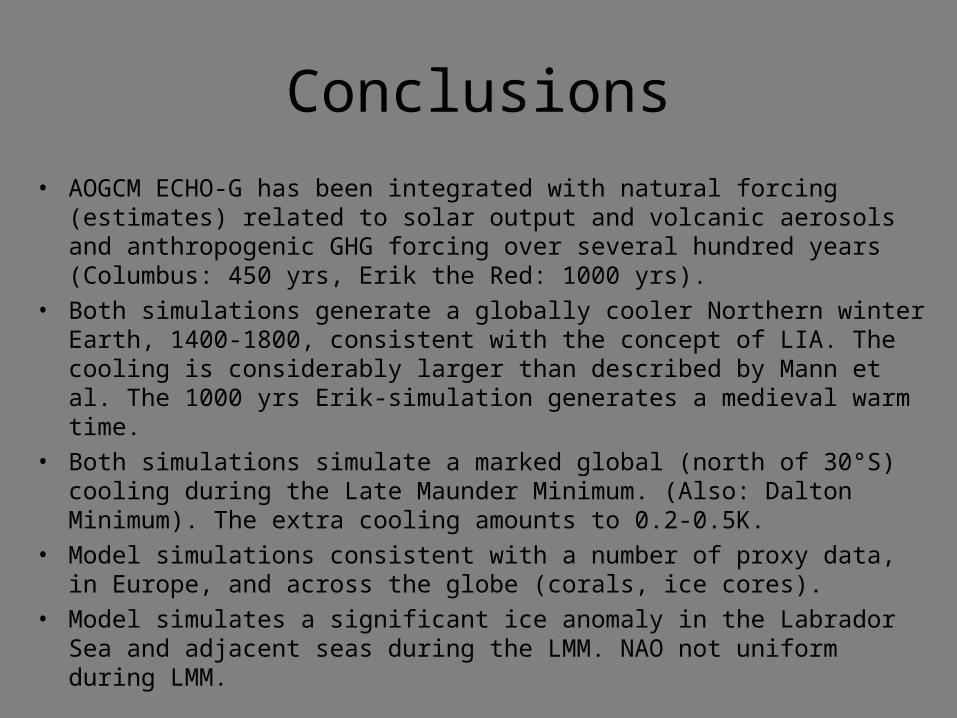
Conclusions
• AOGCM ECHO-G has been integrated with natural forcing (estimates) related to solar output and volcanic aerosols and anthropogenic GHG forcing over several hundred years (Columbus: 450 yrs, Erik the Red: 1000 yrs).
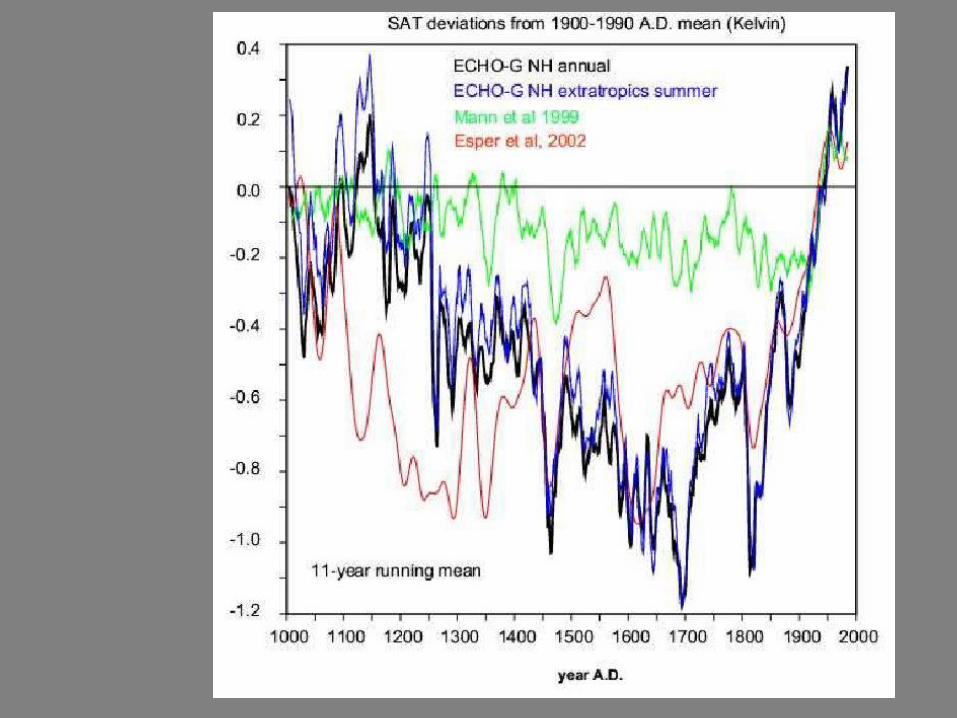
• Both simulations generate a globally cooler Northern winter Earth, 1400-1800, consistent with the concept of LIA. The cooling is considerably larger than described by Mann et al. The 1000 yrs Erik-simulation generates a medieval warm time.
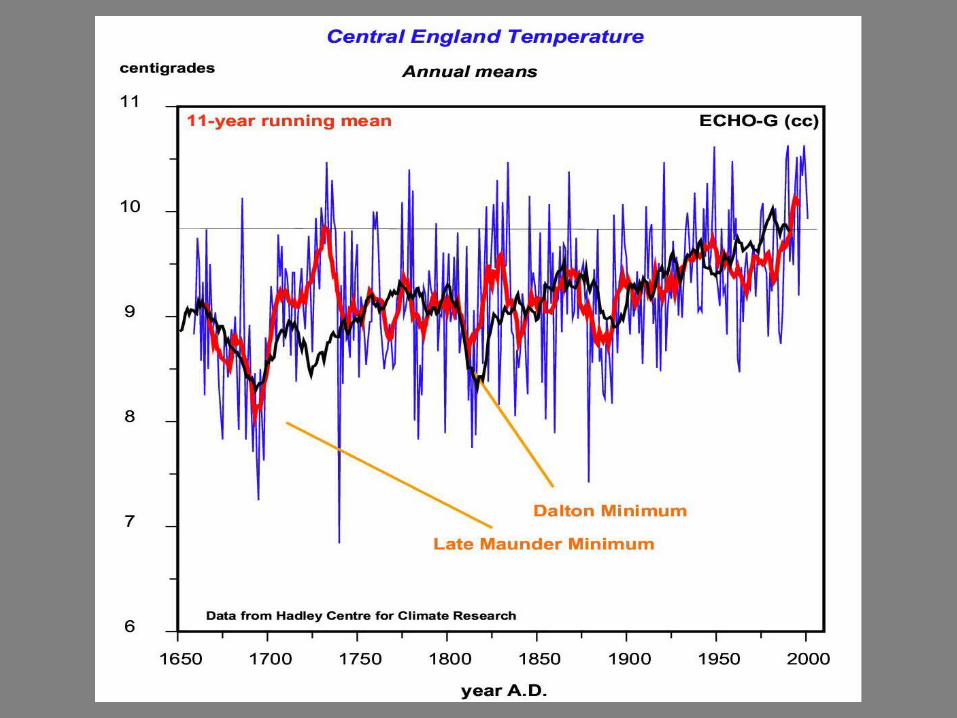
• Both simulations simulate a marked global (north of 30°S) cooling during the Late Maunder Minimum. (Also: Dalton Minimum). The extra cooling amounts to 0.2-0.5K.
• Model simulations consistent with a number of proxy data, in Europe, and across the globe (corals, ice cores).
• Model simulates a significant ice anomaly in the Labrador Sea and adjacent seas during the LMM. NAO not uniform during LMM.