the making of science
TRANSCRIPT

THE MAKING OF SCIENCE, TECHNOLOGY AND INNOVATION POLICY:
CONCEPTUAL FRAMEWORKS AS NARRATIVES, 1945-2005
Benoît GODIN
2009
Centre Urbanisation Culture Société Institut national de la recherche scientifique
385, rue Sherbrooke Est Montréal (Québec) H2X 1E3
Telephone : 514-499-4074 Facsimile : 514-499-4065 www.ucs.inrs.ca


TABLE OF CONTENTS
INTRODUCTION ........................................................................... 1Frameworks as Narratives ............................................................................... 4The Logic (Rhetoric?) of Narratives .............................................................. 14The Policy (Political?) Process ...................................................................... 21
PART I ............................................................................................ 25
CHAPTER ONE ............................................................................ 25
The Linear Model of Innovation: The Historical Construction of an Analytical Framework ........................ 25
A Political Rhetoric ....................................................................................... 28An Industrial Perspective .............................................................................. 36A Statistical Classification ............................................................................ 40Economists Appropriate the Model ............................................................... 52Conclusion .................................................................................................... 61
CHAPTER TWO ........................................................................... 67
The Making of Statistical Standards: The OECD Frascati Manual and the Accounting Framework ........................... 67
National Accounting ..................................................................................... 69The Frascati Manual ...................................................................................... 80
Accounting for Science ....................................................................... 81What Accounting Measures? .............................................................. 91
Accounting and Science Policy ................................................................... 103The Efficiency of Research ......................................................................... 113Conclusion .................................................................................................. 116
CHAPTER THREE ..................................................................... 123
Science and Efficiency: the Input-Output Framework ............. 123The Production Function ............................................................................. 127The Economics of Science .......................................................................... 138An Accounting Framework ......................................................................... 144Conclusion .................................................................................................. 148
CHAPTER FOUR ....................................................................... 155
Economic Growth, Productivity and the New Economy .......... 155

ii The Making of Science, Technology…, 2009
Integrating Science and Technology into the Econometric Equation .......... 156Studying Growth and Productivity at the OECD ......................................... 161The New Economy ...................................................................................... 171
Synthesizing Academic Works ......................................................... 175Internationalizing the Statistics ......................................................... 176Developing a Visual Rhetoric ........................................................... 178
Conclusion .................................................................................................. 179
CHAPTER FIVE ......................................................................... 183
Competitiveness and Trade in High-Technology ...................... 183A Very Basic Ratio ..................................................................................... 185Variations on a Theme ................................................................................ 188
Research Intensity ............................................................................. 189Technology Intensity ........................................................................ 193
High Technology ......................................................................................... 198Conclusion .................................................................................................. 207
CHAPTER SIX ............................................................................ 213
The Political Agenda on Globalization, its Framework and Measurement ...................................................................... 213
The Globalization Framework ..................................................................... 215The Globalization of Technology ................................................................ 221
Measuring the Internationalization of R&D ...................................... 223Renewed Interest in the Technological Balance of Payments ........... 225Other Impacts of Globalization on S&T Statistics ............................ 226
What Did the Numbers Say? ....................................................................... 228Conclusion .................................................................................................. 234
PART II ........................................................................................ 237
CHAPTER SEVEN ..................................................................... 237
National Innovation System: the System Approach in Historical Perspective .................................................... 237
National Innovation System at OECD ......................................................... 239The System Approach ................................................................................. 244Measuring the Research System .................................................................. 256Conclusion .................................................................................................. 259
CHAPTER EIGHT ...................................................................... 265

The Making of Science, Technology…, 2009 iii
The Knowledge-Based Economy: Conceptual Framework or Buzzword? .......................................................................... 265
Machlup’s Construction .............................................................................. 267Measuring Knowledge ...................................................................... 269The Message ..................................................................................... 274
The Knowledge-Based Economy at the OECD ........................................... 276Defining the Knowledge-Based Economy ........................................ 279Measuring the Knowledge-Based Economy ..................................... 281
An Umbrella-Concept ................................................................................. 285Conclusion .................................................................................................. 290
CHAPTER NINE ......................................................................... 295
The Information Economy: The History of a Framework Through its Measurement ................................................. 295
The Economics of Information .................................................................... 299The Ad Hoc Group on Scientific and Technical
Information (1962) ................................................................. 301The Ad Hoc Group on Information Policy (1965) ............................ 303The Economics of Information Panel (1965) .................................... 305
The Information Economy .......................................................................... 319The Working Party on Information, Computer,
and Communications Policy (1976) ....................................... 322The Group of Experts on ICC Statistics (1982) ................................ 329
The Information Society .............................................................................. 342The Working Party on Economic Implications of Information
Technologies (1988) .............................................................. 348The Working Party on Indicators for the Information Society (1999) 355
Conclusion .................................................................................................. 363
CONCLUSION ............................................................................ 367
Appendix 1 .................................................................................... 375
Labels Used for Modern Societal Transformations, 1950-1984 ............................................................................ 375
Appendix 2 .................................................................................... 379
Methodological Documents from the Directorate for Science, Technology and Industry (OECD) ................................... 379
Appendix 3 .................................................................................... 380
Appendix 4 .................................................................................... 381

iv The Making of Science, Technology…, 2009
Indicators of Knowledge Flows in National Innovation Systems ............................................................................... 381
Appendix 5 .................................................................................... 383
Indicators from The Knowledge-Based Economy: A Set of Facts and Figures ................................................ 383
Appendix 6 .................................................................................... 385
Indicators from Towards a Knowledge-Based Economy ......... 385
Appendix 7 .................................................................................... 389
Basic Data for Information Policy .............................................. 389
Appendix 8 .................................................................................... 391
Basic Statistics for STI Indicators .............................................. 391
Appendix 9 .................................................................................... 393
Policy Issues for ICC Statistics ................................................... 393
Appendix 10 .................................................................................. 395
ICCP Red Series .......................................................................... 395
Appendix 11 .................................................................................. 399
Bodies of the OEEC/OECD Responsible for Information ........ 399


In memoriam Jean-Jacques Salomon


The Making of Science, Technology…, 2009 1
INTRODUCTION
In recent years, policy analysts have studied policy as a process of argumentation 1
Policy-makers construct their problem through conceptual frameworks that structure policy action. As E. Goffman suggested, frameworks (or frames) are principles of organization “which govern the subjective meaning we assign to social events”, principles that transform fragmentary information into a structured and meaningful whole
. Gone are the analyses of politics based on rational choice and instrumental rationality, as well as the study of policy cycles (agenda-setting → policy formulation → adoption → implementation → evaluation), at least among critical authors. Policy-making is conceptual construction, from its very first step – the problem to be addressed – to the last – action.
2. More recently, D. Schon put it as follows: a frame is a “way of selecting, organizing, interpreting, making sense of reality”, and “provides guideposts for knowing, analyzing, persuading and acting” 3
Generally, a frame “[1] constructs the situation, [2] defines what is problematic about it, and [3] suggests what courses of action are
.
1 G. Majone (1989), Evidence, Argument, and Persuasion in the Policy
Process, New Haven: Yale University Press; D. Stone (1988) [2002], Policy Paradox: The Art of Political Decision Making, New York: Norton & Co; D. Stone (1989), Causal Stories and the Formation of Policy Agendas, Political Science Quarterly, 104 (2), p. 281-300; F. Fischer and J. Forester (eds.) (1993), The Argumentative Turn in Policy Analysis and Planning, Durham: Duke University Press; F. Fischer (2003), Reframing Public Policy: Discursive Politics and Deliberative Practices, Oxford: Oxford University Press.
2 E. Goffman (1974), Frame Analysis: An Essay on the Organization of Experience, Cambridge (Mass.): MIT Press, p. 10.
3 M. Rein and D. Schon (1993), Reframing Policy Discourse, in F. Fischer and J. Forester (eds.), The Argumentative Turn in Policy Analysis and Planning, op. cit., p. 145-166, p. 146. See also: M. Rein and D. Schon (1991), Frame-Reflective Policy Discourse, in P. Wagner et al. (eds.), Social Sciences and Modern States, Cambridge: Cambridge University Press, p. 262-332.

2 The Making of Science, Technology…, 2009
appropriate. It provides conceptual coherence, a direction for action, a basis for persuasion, and a framework for the collection and analysis of data” 4
1. Identifies a problem, its origins and the issues involved;
. For the purposes of this book, I define a conceptual framework as an argument or discourse that acts as an organizing principle to give meaning to a socioeconomic situation and answers to a series of analytical and policy questions. Ideally, a conceptual framework:
2. Suggests an explanation of the current situation;
3. Offers evidence, often in terms of statistics and indicators;
4. Recommends policies and courses of action.
Policy frameworks are often constructed as narratives or stories that give meaning to situations 5. This is not peculiar to policy. Narratives are present everywhere. They are an integral part of the discipline of history, where there is a long-running debate on the role of narratives in the discipline6. Narratives are also present in ordinary life, as Goffman has studied, as well as in science: think of theories on the origins of the universe 7, or the origins of life and humans8
4 M. Rein and D. Schon (1993), Reframing Policy Discourse, op. cit.,
p. 153. Fischer identifies the three steps as follows: defining the problem situation, identifying policy intervention, anticipating outcomes. See F. Fischer (2003), Reframing Public Policy, op. cit., p. 168.
. Economic
5 T. J. Kaplan (1986), The Narrative Structure of Policy Analysis, Journal of Policy Analysis and Management, 5 (4), p. 761-778.
6 H. White (1973), Metahistory: the Historical Imagination in Nineteenth-Century Europe, Baltimore: Johns Hopkins University Press; P. Ricoeur (1983), Temps et récit I: L’intrigue et le récit historique, Paris, Seuil.
7 S. Hawking (1988), A Brief History of Time: From the Big Bang to Black Holes, Toronto: Bantam Dell Pub Group; H. Kragh (1996), Cosmology and Controversy: the Historical Development of Two Theories of the Universe, Princeton: Princeton University Press.
8 P.J. Bowler (1984), Evolution: the History of an Idea, Berkeley: University of California Press; P. J. Bowler (1989), The Invention of Progress: the Victorians and the Past, Oxford: Basil Blackwell.

The Making of Science, Technology…, 2009 3
theory is also full of narratives 9, as is sociology. In the latter case, for example, you can think of the discipline as being composed of narratives on modernity10. Finally, narratives are present in matters concerning technology. D. Nye, for example, has documented how people appropriated technology in nineteenth century America for community creation, identity and self-representation 11. M. Hard and A. Jamison have looked at the intellectuals’ appropriation of technology in this century, as discourses on modernity12
This book looks at conceptual frameworks in science studies and science policy, and at the narratives involved. It is based on work conducted over the last ten years on science policy and on statistics about science, technology and innovation (see
.
www.csiic.ca). This introductory chapter offers an overview of the book. It offers a brief tour d’horizon of the frameworks developed over the twentieth century and discusses the logic, or rhetoric, of narratives. This chapter is a summary and a guide to the main arguments of the book. The rest of the book goes deeper into each of the conceptual frameworks.
The book is organized in two parts. The first looks at the emergence of conceptual frameworks in science policy and documents how they contributed to the gradual emergence of an economic doctrine. The second part studies more recent frameworks and the new rhetoric, if any, involved. The book uses an intergovernmental organization as
9 D. N. McCloskey (1990), If You’re So Smart: The Narrative of Economic
Expertise, Chicago: University of Chicago Press. 10 P. Wagner (1994), A Sociology of Modernity: Liberty and Discipline,
London: Routledge. 11 D. E. Nye (2003), America as Second Creation: Technology and
Narratives of New Beginnings, Cambridge (Mass.): MIT Press; D. E. Nye (1997), Narratives and Space: Technology and the Construction of American Culture, New York: Columbia University Press. See also: J. F. Kasson (1977), Civilizing the Machine: Technology and Republican Values in America, 1776-1900, New York: Penguin.
12 M. Hard and A. Jamison (1998), Intellectual Appropriation of Technology: Discourses on Modernity, Cambridge (Mass.): MIT Press.

4 The Making of Science, Technology…, 2009
example – the Organization for Economic and Co-Operation Development (OECD) – and emphasizes the role of statistics in science policy. As a matter of fact, for decades the OECD has been an influential think-tank for its member countries in matters of policy, and one of its main tasks is collecting statistics as evidence for the views promoted.
FRAMEWORKS AS NARRATIVES
Science policy is about 60 years old. The first modern arguments for science policy came from V. Bush, followed by the US President’s Scientific Research Board 13. The (OECD) came next: from the 1960s, the organization started publishing policy documents that have had a major influence in member countries14
Over the twentieth century, at least eight conceptual frameworks have been developed in the study of science, technology and innovation, and have been used for policy purposes. These frameworks can be organized around three generations (Table 1). The first conceptual framework was that on cultural lags, from American sociologist William F. Ogburn in the 1920-30s
. The policies suggested over the years, at both the national and international levels, relied on conceptual frameworks that furnished a rationale for action.
15
13 V. Bush (1945), Science: The Endless Frontier, North Stratford: Ayer Co.
Publishers, 1995; US President’s Scientific Research Board (1947), Science and Public Policy, New York: Arno Press, 1980.
. According to Ogburn’s story, society is experiencing an exponential growth of inventions but is insufficiently adapted. There are lags between the material culture and the adaptive culture. Therefore, there is need for society to adjust
14 One early and major document was: OECD (1963), Science and the Policies of Government, Paris: OECD.
15 This framework is not discussed in this book. See: B. Godin (2009), The Invention of Innovation: William F. Ogburn and the Use of Invention, Project on the Intellectual History of Innovation, Montreal: INRS, Forthcoming.

The Making of Science, Technology…, 2009 5
in order to reduce the lags. Society has to innovate in what he called social inventions, or mechanisms to maximize the benefits of technology. There is also a need for society to forecast and plan for the social effects of technology.
Table 1. Major Conceptual Frameworks Used in Science Policy
First generation Cultural Lags Linear model of innovation
Second generation Accounting Economic Growth Industrial competitiveness
Third generation National Innovation System Knowledge-Based Economy Information Economy (or Society)
The framework on lags has been very influential. It has served as basic narrative to Recent Social Trends (1933) and Technology and National Policy (1937), two major policy documents in the United States, the first on social indicators and the second on technological forecasting. It was also used during the debate on technological unemployment in the 1930s. Lastly, the framework on lags was the first of a series of conceptual frameworks concerned with innovation as a sequential process. It is in fact to this framework that we owe the idea of “time lags” (between invention and its commercialization) and the idea of technological gaps.
The best-known of the sequential frameworks is what came to be called the “linear model of innovation”. The precise source of the linear model remains nebulous, as its origin has only recently been documented (chapter 1). Authors who used, improved or criticized the model in the last fifty years rarely acknowledged or cited any
6 The Making of Science, Technology…, 2009
original source. The model was usually taken for granted. According to others, however, it comes directly from V. Bush’s Science: The Endless Frontier (1945). To still others, the model does not exist, but among its opponents. It is a straw man. In fact, however, the linear model does exist, and comes from economic historian W. Rupert Maclaurin at MIT in the 1940s.
Few people, including bureaucrats, really believed in this framework. The story behind the framework is rather simple. It suggests that innovation follows a linear sequence: basic research → applied research → development. In one sense, the model is trivially true, in that it is hard to disseminate knowledge that has not been created. The problem is that the academic lobby has successfully claimed a monopoly on the creation of new knowledge, and that policy-makers have been persuaded to confuse the necessary with the sufficient condition that investment in basic research would by itself necessarily lead to successful applications. Be that as it may, the framework fed policy analyses by way of taxonomies and classifications of research and, above all, it was the framework most others compared to.
The frameworks on cultural lags and on the linear model of innovation came from academics. The next generation of frameworks owes a great deal to governments and international organizations, above all the OECD. This latter organization is an influential think-tank for its member countries. It is not an advocacy think-tank looking for media exposure and defending partisan or ideological ideas 16
16 D. E. Abelson (2002), Do Think Tanks Matter? Assessing the Impact of
Public Policy Institutes, Montreal: McGill-Queens.
, but rather a research-oriented think tank that feeds concepts to national policy-makers for better understanding of issues in science, technology and innovation policies. Other organizations that have acted as think tanks in the short history of science, technology and innovation policy are the US National Bureau of Economic Research (NBER), the US RAND Corporation and the British Science Policy Research Unit (SPRU). However, the OECD has a

The Making of Science, Technology…, 2009 7
specific role as the source of ideas for national policy-makers. As with most think tanks, and like management gurus, the organization simplifies policy analysis through the use of metaphors and imagery 17
From its very beginning, science policy was defined according to the anticipated benefits of science. Because science brings benefits, so the story goes, there is a need to manage science, and management requires data. To contribute to this end, the OECD produced a methodological manual for national statisticians, the Frascati manual (1962), aimed at conducting and standardizing surveys of research and development (chapter 2). The manual offered a statistical answer and an accounting framework to three policy questions or issues of the time: the allocation of resources to science, the balance between choices or priorities, and the efficiency of research.
, but as an international organization, it brings immediate (although sometimes relative) legitimacy to discourses and frameworks, partly because the member countries themselves define the agenda of the organization. In this sense, the OECD frameworks are witnesses to national priorities and policies.
One basic statistics among the statistics collected with the manual was a figure on the “national science budget”, or Gross Domestic Expenditures on R&D (GERD). The statistics served two purposes. One was controlling the public expense on science, the growth of which was too high according to some budget bureaus. The other purpose, more positive, was setting targets for the support and development of science, technology and innovation, and this was used by policy departments. It gave rise to the GERD/GDP ratio as a measure of the intensity or efforts of a country or economic sector.
Among the benefits believed to accrue from science, technology and innovation, two have been particularly studied at the OECD: economic growth (through productivity) and competitiveness. These
17 D. Stone (1996), Second-Hand Dealers in Ideas, in D. Stone (ed.),
Capturing the Political Imagination: Think Tanks and the Policy Process, London: Frank Cross, p. 136-151.

8 The Making of Science, Technology…, 2009
gave rise to two frameworks. The framework on economic growth and productivity embodies a very simple (and again linear) story: research leads to economic growth and productivity. Consequently, the more investment, the more growth. This story is often framed within an input-output semantics: inputs → research activities → outputs (→ outcomes) (chapter 3). The accounting framework discussed above is precisely framed into such a semantics. The origins of the framework on economic growth and productivity can be traced back to the economic literature on technological unemployment in the 1930s, in which “technological change” was equated with changes in factors of production (input) and measured via changes in productivity (output). This equation is now known as the “production function”. Used extensively by economists in the mid-1950s and subsequently to study science, technology and innovation and its relationship to the economy, the economists’ framework immediately offered official policy-makers a useful conceptual framework. This was due to the fact that the framework was perfectly aligned with the policy discussions at the time on the “efficiency” (productivity) of the science system.
Certainly, the issue of productivity in science has a long history 18
18 B. Godin, (2009), The Value of Science: Changing Conceptions of
Scientific Productivity, 1869-circa 1970, Social Science Information, 4, Forthcoming; B. Godin (2007), From Eugenics to Scientometrics: Galton, Cattell and Men of Science, Social Studies of Science, 37 (5): 691-728; B. Godin (2006), On the Origins of Bibliometrics, Scientometrics, 68 (1): 109-133.
. It emerged among scientists themselves (Table 2). In the nineteenth century, the British statistician Francis Galton, followed in the twentieth century by James McKeen Cattell, the US psychologist and editor of Science for fifty years, started respectively computing the number of children scientists had and the number of scientists a nation (or state) produced. The numbers were called measures of productivity, or productiveness. Subsequently, productivity came to mean the scientific production of the scientists, above all the number of scientific papers they published. From the 1920-30s onward,

The Making of Science, Technology…, 2009 9
historians and psychologists were early producers of numbers on productivity defined as such. However, it was governments and their statistical bureaus that really developed this meaning after World War II. Finally, productivity in science matters came to examine not only the scientists and the science system, but the effects of science on the economy, above all economic productivity.
Table 2. Evolving Conceptions of Productivity in Science
Productivity as Reproduction
Key authors: F. Galton, J. M. Cattell Issue: civilization, then advancement of science Statistics: great men; men of science
Productivity as Output
Key authors: organizations (and their consultants: C. Freeman) Issue: efficiency Statistics: money spent on R&D
Productivity as Outcome
Key authors: economists (D. Weintraub, R. Solow) Issue: economic growth Statistics: productivity
Economic growth and productivity have been studied at the OECD since the very early years of science policy. They got increased attention in the early 1990s, following the Technology and Economy Programme (TEP), and then in the 2000s with the Growth project, where an explicit framework – the New Economy – was used to explain differences between member countries. The United States had the characteristics of a new economy, which means above all that it was innovative and it made more extensive and better use of new technologies, particularly information and communication technologies (chapter 4).

10 The Making of Science, Technology…, 2009
The other benefit of an economic type that was studied at the OECD was industrial competitiveness 19
We now come to a third generation of conceptual frameworks. These arose through a synergy among academics, governments and international organizations. The OECD, with the collaboration of economists as consultants, developed new frameworks for policy-making. The frameworks were generally constructed as alternatives to the linear model. One of the first such frameworks was the National Innovation System (chapter 7). The framework suggests that the research system’s ultimate goal is innovation, and that it is part of
. The story behind the framework is that science and technology have become a factor of leadership among countries. Like economic growth and productivity, industrial competitiveness has been discussed at the OECD from very early on. This led to a major study published at the end of the 1960s on technological gaps between countries, particularly between European countries and the United States. Technological gaps were considered signals that Europe was not performing well. The study developed a methodology for ranking countries based on multiple statistical indicators. Then, in the 1980s, the issue of industrial competitiveness gave rise to the concept of high technology and the role of new technologies in international trade (chapter 5). High technology came to be seen as a major factor contributing to international trade, and a symbol of an “advanced economy”. Statistics measuring the performances of countries with regard to the technological intensity of their industries were constructed and further developed to measure how countries maintain or improve their position in world trade. Then a framework on globalization was suggestted in the 1990s, as was a methodological manual for measuring globalization. Globalization was said to be a source of competitiveness for firms and countries, and gained widespread popularity in science, technology and innovation policy (chapter 6).
19 B. Godin (2002), Technological Gaps: An Important Episode in the
Construction of Science and Technology Statistics, Technology in Society, 24, p. 387-413.

The Making of Science, Technology…, 2009 11
a larger system composed of sectors like government, university and industry and their environment. Briefly stated, research and innovation do not come from the university sector alone, so the story goes. The framework emphasizes the relationships between the components or sectors, as the “cause” that explains the performance of innovation systems.
Most authors agree that this framework was developed by researchers like C. Freeman, R. Nelson and B.-A. Lundvall. In fact, however, the “system approach” in science policy owes its existence rather to the OECD and its very early works beginning in the 1960s, although the organization did not use the term National Innovation System as such. From the very early beginning of the OECD, policies were encouraged promoting to greater relationships among the component of the research system at five levels: between economic sectors (like university and industry), between types of research (basic and applied), between government departments, between countries, and between the research system and the economic environment. The Frascati manual itself was specifically framed in a system approach. As we mentioned above, the manual computed and aggregated the R&D expenditures of the sectors composing a research system into the GERD indicator, but also suggested constructing a matrix for measuring the flows of research funds between the sectors (sources of funds and research performers).
Then in the 1990s the OECD launched a research program on National Innovation Systems, with B.-A. Lundvall as Deputy Director. Many studies were published in the same spirit as that of the early system approach. Certainly there were more sources of innovation studied, more types of relationships were examined, and a different role was assigned to government. However, the industrial sector and the firm still held central place in the innovation system.

12 The Making of Science, Technology…, 2009
By then, the Oslo manual on measuring innovation had become the emblem of this framework at the OECD 20
The other new framework is that on the knowledge-based economy or society (chapter 8). The origins of the concept of a knowledge economy come from economist Fritz Machlup in the early 1960s, and the concept re-emerged at the OECD in the 1990s as an alternative, or competitor, to that on the National Innovation System. The latter was believed by many to be more or less relevant to policy-makers. The work at the organization was entrusted to the French economist Dominique Foray. The story on the knowledge-based economy suggests that societies and economies rely more and more on knowledge, hence the need to support knowledge in all its forms: tangible and intangible, formal and tacit. The framework suggests that we examine (and measure) the production, diffusion and use of knowledge as the three main dimensions of the knowledge economy.
.
In reality, the concept of knowledge is a fuzzy concept, and these three dimensions are very difficult to measure. More often than not, the concept is an umbrella-concept, that is, it synthesizes policy issues and collects existing statistics concerned with science, technology and innovation under a new label. A look at the statistics collected in measuring the concept is witness to this fact: existing statistics are simply shifted to new categories.
The last framework in the third generation is that on the information economy or information society (chapter 9). The information economy was one of the key concepts invented in the 1960-70s to explain structural changes in the modern economy. It has given rise to many theories on society, conceptual frameworks for policy, and statistics for measurement. The story behind the framework suggests that information, particularly information and communication technologies (ICT), is the main driver of growth.
20 B. Godin (2002), The Rise of Innovation Surveys: Measuring a Fuzzy
Concept, Project on the History and Sociology of Statistics on Science, Technology and Innovation, Montreal: INRS.

The Making of Science, Technology…, 2009 13
This preoccupation with information has a long history. The growth and management of scientific publications was the very first step toward the construction of the concept of the information economy. Through time, the concept evolved from an understanding of information as knowledge, to information as commodity or industrial activity, then information as technology.
Like knowledge, information is a difficult concept. For example, it took three decades to develop a methodological manual, or guide to measuring the information economy, at the OECD. What helped finally was politics. First, internal politics, like the efforts of the Working Party (on measuring the information society) done to raise its own visibility within the OECD. Second, ministers’ interests as manifested during summits and conferences. Ultimately it seems that the emergence of a political issue often leads to its measurement. Measurement in turn helps crystallize concepts and issues.
The framework on the information economy relies on other frameworks. In fact, most frameworks build on other frameworks. The OECD policy discourse relies on a cluster of frameworks that feed on each other. One such cluster is composed of third-generation frameworks: information economy and knowledge-based economy, coupled with new economy. Another cluster consists of those of the second generation: accounting, growth and productivity and industrial competitiveness, all three framed into an input-output semantics. Furthermore, this second generation, particularly the stories involved, feeds the third generation, giving the whole discourse a continuity and a coherent rationale. Metaphors often help here. A metaphor has important organizational properties: it is prescriptive and normative in that it generates a vision, and it unifies elements of reality because of its fluidity and flexibility (polysemy). A metaphor is both constructive (of meaning) and productive (of action). Briefly stated, it is both intellectually and socially useful. A metaphor serves a variety of worldviews. This is the role played by the information economy. Information and communication technologies are everywhere: it explains the knowledge-based economy, as well as globalization, the new economy and, of course,

14 The Making of Science, Technology…, 2009
the information economy. A network of interrelated concepts and frameworks thus feed each other.
THE LOGIC (RHETORIC?) OF NARRATIVES
I have suggested that conceptual frameworks in science, technology and innovation policies are usually constructed in the form of a story or narrative 21
1. Premise: science, technology and innovation are good for you and for society.
. A narrative gives meaning to science, technology and innovation, and to policy actions. It helps put science, technology and innovation on the political agenda. A typical narrative goes like this:
2. Something new is happening in society (CHANGE) and it is quite different from the past.
3. Let’s call this change … (NEW NAME).
4. The new phenomenon or event will generate big effects, rewards/returns.
5. Let’s collect STATISTICS as evidence.
6. It is essential that policies be developed.
7. Let’s imagine a FRAMEWORK to this end.
Let’s look at each step. A major premise or assumption lies behind each framework, namely that science, technology and innovation are good for you and for society. This is a premise no official narrative has ever questioned. For example, no one would imagine, and in fact there was never a framework developed that opposed or suggested getting rid of new technologies and their bad consequences. New science and new technologies are to be placed under control, but
21 I use the term narrative here as including any of the following, which a
literary critic would probably distinguish: argument, plot, storyline, story, tale.

The Making of Science, Technology…, 2009 15
never eliminated. As US sociologist William F. Ogburn once put it: “the control of invention (…) is generally interpreted as meaning their promotion not their denial”22
A narrative on science, technology and innovation starts with suggesting that something new is happening in the economy, that an important change is underway. This change is then contrasted to the past. Certainly, continuity is usually mentioned, with “arguments from qualification”, like “there is a new situation, but it is different only from a perspective of scale or form”; “things are changing, however it is only a matter of intensity or acceleration”
.
23
This is exactly what characterizes the framework on the knowledge-based economy. According to the OECD, knowledge and its production, diffusion and use is what defines today’s society. Certainly, knowledge has always been present and important in past economies and societies, but today it is more influential than ever: “although knowledge has always been a central component in economic development, the fact that the economy is strongly dependent on the production, distribution and use of knowledge is now being emphasized”
. The narrative generally suggests that it is difficult to draw a boundary between the current era and the past. But this specification, or qualification, is rapidly forgotten. Indeed, the newness is less that of a change in society or economy than a change in the interest of policy-makers and politicians. Be that as it may, dichotomies reign: the future will be different from the past. Change is what counts here: its nature, its size, its rate.
24
22 W. F. Ogburn and N. M. Nimkoff (1940), Sociology, Boston: Houghton
Mifflin, p. 916.
. How can the organization develop such a
23 This rhetorical move is similar to the “argument from limitations”, as discussed in B. Godin (2005), Measurement and Statistics on Science and Technology: 1920 to the Present, Chapter 9, London: Routledge.
24 OECD (1996), Science, Technology and Industry Outlook: Part V, Special Theme: The Knowledge-Based Economy, DSTI/IND/STP (96) 5, p. 5. For similar narratives from academics, see D. Foray (2004), The

16 The Making of Science, Technology…, 2009
vision? With a very broad concept of knowledge, one that embraces things previously separated or put aside in previous analyses – R&D, intangibles, learning – measuring them and adding the numbers together. The effect of the concept is to attract the attention of as many policy-makers (and experts) as possible in the field of science, technology and innovation policies.
Naming and classification are central features of conceptual frameworks. They offer labels that are easily memorized. As catchwords, labels are often “mere labeling without yielding anything but the label”, as H. Blumer suggested decades ago 25. Be that as it may, these labels gain the attention of many people, which helps them to reproduce or diffuse. Such is the role of names or terms given to frameworks, like knowledge-based economy or information society. Such is also the role of concepts like networks, clusters, social capital, as well as technological systems and its affiliates 26, and many others like the Triple-Helix and the New Production of Knowledge (Mode1/Mode2) 27
Economics of Knowledge, Cambridge (Mass.); MIT Press; N. Stehr (2005), Knowledge Politics, Boulder (London): Paradigm Publishers.
.
24 H. Blumer (1930), Science Without Concepts, reprinted in H. Blumer (1969), Symbolic Interactionism: Perspective and Method, Berkeley: University of California Press, p. 153-170. On the fuzziness of concepts, see also: W. B. Gallie (1956), Essentially Contested Concepts, Proceedings of the Aristotelian Society, p. 167-198
25 H. Blumer (1930), Science Without Concepts, reprinted in H. Blumer (1969), Symbolic Interactionism: Perspective and Method, Berkeley: University of California Press, p. 153-170. On the fuzziness of concepts, see also: W. B. Gallie (1956), Essentially Contested Concepts, Proceedings of the Aristotelian Society, p. 167-198.
26 Technological regime, technological guideposts, technological or techno-economic paradigms, techno-economic networks.
27 For more labels, see J. R. Beniger (1986), The Control Revolution: Technological and Economic Origins of the Information Society, Cambridge (Mass.): Harvard University Press. For critical analyses of academic frameworks, see: B. Godin (1998), Writing Performative History: The New “New Atlantis”, Social Studies of Science, 28 (3), p. 465-483; T. Shinn (2002), The Triple Helix and New Production of Knowledge: Prepackaged Thinking in Science and Technology, Social

The Making of Science, Technology…, 2009 17
The conceptual framework on the National Innovation System is a recent example of labelling. As we mentioned above, a system approach has always characterized the OECD work on science, technology and innovation since the 1960s. Then, in the early 1990s, a label came to be applied to such an approach – National Innovation System – and a research program developed. Certainly, as we have suggested, differences exist between the early system approach and the latter. Nevertheless, the National Innovation System brought an explicit framework to the field of science, technology and innovation policy, putting the firm at the center of the system, whereas the early system approach was instead concerned with the central role of governments and policies in the system. Only historical myopia leads some to think that the framework is new.
A similar rhetorical move (renaming something old for political purposes) also occurred with the concept of “high technology” 28
Studies of Science, 32 (4), p. 599-614; R. Miettinen (2002), National Innovation System: Scientific Concept or Political Rhetoric?, Helsinki: Edita. Some labels, like postmodern science, strategic science, or co-produced science, had much less fortune than the more popular ones discussed. See respectively: S. Funtowicz and J. Ravetz (1999), Post-Normal Science – an Insight Now Maturing, Futures, 31(7), p. 641-646; A. Rip (2002), Regional Innovation System and the Advent of Strategic Science, Journal of Technology Transfer, 27 (1), p. 123-131; M. Callon (1999), The Role of Lay People in the Production and Dissemination of Scientific Knowledge, 4 (1), p. 81-94. These three examples are cited in C. Freeman and L. Soete (2007), Developing Science, Technology and Innovation Indicators: What We Can Learn from the Past, UNU-MERIT, Working Paper Series, Maastricht, p. 11 (footnote 6).
. In the mid-1980s, the term high technology began to be used concurrently with, or in place of, the terms research intensity and technology intensity. Nothing had really changed with regard to the definition of the concept (by way of statistics), or at least not yet. But a valued and prestigious label (high) was now assigned to it. Technology trade had now gained strategic importance in the
28 B. Godin (2008), The Moral Economy of High Technology Indicators, in H. Hirsch-Kreinsen and D. Jacobson (eds.), Innovation in Low Tech Firms and Industries, Edward Elgar.

18 The Making of Science, Technology…, 2009
economic and political context of the time: research or technology-intensive industries were expanding more rapidly than other industries in international trade, so went the story and its numbers, and these industries were believed be an important policy option for economic progress. High technology would thereafter be the label for these industries, and would become a well-known and much-used label in the field of science, technology, and innovation policy.
As narrative, a conceptual framework generally suggests that the new phenomenon or event will generate big rewards/returns, as well as leadership potential for those at the forefront. It also suggests that if no action is taken, bad consequences could follow. Crisis stands on the horizon! Usually, the narrative is either in the form of hype, hyperbole or utopia, suggesting that enormous outcomes are looming, or in the form of dramatization, with metaphors on disease, defeat and decline, such as that there is too little investment in science, technology and innovation, which imperils economic performance.
One then arrives at the next element of a narrative: statistics. Briefly stated, a narrative suggests that it is necessary to know more about the change – in order to get more from it. More research is needed, particularly statistical work. In the case of frameworks, statistics helped to strengthen the narrative. How does narrative work here? Over the years, the OECD has developed a “formula” in three steps, and the framework on economic growth and productivity is the best evidence to document the strategy. First, the organization looks at academic work and synthesizes the results. These results generally concern specific national economies, and have to be placed in a comparative perspective with other countries. Second, the OECD internationalizes the numbers, more often than not based on the American experience (in fact, the frameworks used at the OECD are regularly those suggested by the United States delegation. This is where the value-added of the OECD lies: internationalizing statistics. The organization is rarely an innovator in the matter of theories and concepts. Generally, the organization has needed exemplars or models that it then standardizes and conventionalizes, generalizes and diffuses. This is the case for its methodological manuals, produced as

The Making of Science, Technology…, 2009 19
standards to be used by member countries for the collection of national data. However, collecting national statistics and placing them in an international frame is the task of the OECD.
As a third step, the organization identifies best practices/performers using indicators, rankings and benchmarking 29
Other tools or devices used as evidence in narratives are visual aids like boxes, tables, figures and graphs. Visual devices are essential, since numbers often do not or cannot demonstrate the results conclusively, like the OECD’s early work on technological gaps, and the more recent work on the new economy, on globalization and on the knowledge-based economy. In this latter case, for example, the OECD could measure only part of the phenomenon – the production of knowledge, not its diffusion and use (except for information and communication technologies) – because of a lack of data. Equally, the OECD had difficulties “proving” the emergence of a new economy in other countries: “Ten years or so from now, it should be easier to assess, for instance, the impacts on growth deriving from information and communication technologies, other new technologies and changes in firm organization”
. Coming first, or pride of first place, is what drives the exercises in measurement and its statistical comparisons. The results are published in what the OECD calls scoreboards, among others.
30
Pictorial devices generally help persuade the reader of the seriousness and empiricism of the organization, despite the limitations of the data. The physical space these devices occupy is sometimes even greater than that given to the text itself, as was the case for the project
. But at the time, such an assessment was impossible. Nevertheless, the organization concluded that more science, technology and innovation policies should be developed to bring economies closer to a new economy.
29 B. Godin, B. (2003), The Emergence of Science and Technology
Indicators: Why Did Governments Supplement Statistics with Indicators?, Research Policy, 32 (4): 679-691
30 OECD (2001), Drivers of Growth: Information Technology, Innovation and Entrepreneurship, Paris: OECD, p. 119.

20 The Making of Science, Technology…, 2009
on economic growth and productivity (new economy). It is worth recalling here that as early as 1919 the US economist W. C. Mitchell suggested presenting narratives to policy-makers with statistics precisely as such 31
Secure a quantitative statement of the critical elements in an official’s problem, draw it up in concise form, illuminate the tables with a chart or two, bind the memorandum in an attractive cover tied with a neat bow-knot (…). The data must be simple enough to be sent by telegraph and compiled overnight.
:
Apart from visual devices, an important strategy is black-boxing the limitations of statistics 32
Let’s conclude this section by mentioning that one of the major factors responsible for the success (use) of official statistics is their regularity. Individual researchers rarely have the resources to produce surveys year after year that would enable the measurement of trends. They certainly contribute in the very early development stages: they originate new statistics and methodologies. But they do not have the resources to conduct the surveys themselves, and many shift rapidly to another object of study, or become simple users of statistics produced by officials. Only governments and their statistical bureaus have sufficient resources to conduct annual surveys and produce
. This is done by using footnotes, appendices or separate manuals (like the so-called metadata), where the limitations are discussed, but without effect on the core of the text and its conclusions. The “argument from limitations” (the form of which is like “the data are incomplete, but this does not affect the results”) is also a recurrent tool of the strategy.
31 W. C. Mitchell (1919), Statistics and Government, Journal of the
American Statistical Association, 125, March, p. 223-235. 32 B. Godin (2005), Measurement and Statistics on Science and Technology,
Chapter 9, op. cit.

The Making of Science, Technology…, 2009 21
regular statistics. This gives them a relative monopoly and allows them to impose their vision (statistical) of science.
THE POLICY (POLITICAL?) PROCESS
A narrative generally ends with policy recommendations. In order to benefit from a new context, a series of policy objectives is defined, obstacles and conditions are identified, and targets suggested. The policy recommendations conclude the narrative. They, more often than not, are lists of fads, recurring from year to year, like increasing the industrial share of R&D in the national budget, improving the relevance of public research, need for structural adjustment (through adoption of new technologies). To these, the organization adds a little something new in every periodic publication or review, generally specific to a new technology or to a public issue. Over history, the most popular and regular policy formulas were magic ratios like the GERD/GDP ratio of 3% suggested as early as the 1960s, and a basic/applied research ratio of 10-20% basic research, first suggested by the French statistician Condorcet 33
In general, the development of frameworks at the OECD proceeds as follows. Work proposals come either from the Secretariat (in collaboration with committees composed of national delegates) or from the ministers (often under the influence of a specific country). Studies are then conducted by the Secretariat, with a view to presentation to a ministerial conference. The conference, in turn, generally under the advice of the OECD officials themselves, asks for more work. This is how projects extend and build on previous ones. To contribute to its work as a think tank, the OECD develops the following activities:
.
33 On basic research, see: B. Godin (2003), Measuring Science: Is There
Basic Research Without Statistics?, Social Science Information, 42 (1): 57-90.

22 The Making of Science, Technology…, 2009
- Organizing conferences and workshops to discuss policy issues.
- Setting up specific committees and working groups composed of national delegates.
- Sharing workload with member countries.
- Inviting or hiring national bureaucrats and researchers to join the organization.
The work is motivated by several factors, two of which deserve mention. Linked as it is to the political process, the OECD has to feed ministers regularly for their meetings. An easy way to do this is to turn readily-available academic fads into keywords (or buzzwords), then into “synthetic, attractive and readily understandable” narratives 34
A second factor explaining the OECD strategy is the publication process, or the rush to publish. As think tank, the OECD publishes biannual, yearly and biennial reports, among them those for ministers’ conferences, where time frames are very tight. Publication drives policy: there is a need for a new issue at every conference, and in every new publications of the organization, such as Science, Technology and Industry Scoreboard or Science, Technology and Industry Outlook, both published every two years. Umbrella concepts like that on the knowledge-based economy are thus very fertile for producing documents. They synthesize what is already available, what comes from day-to-day work conducted in other contexts and, above all, what is fashionable, often at the price of original work.
in order to catch the attention of policy-makers. Buzzwords and slogans help sell ideas: they are short, simple, and easy to remember.
Academics are regularly enrolled in these activities. They are consulted or invited to participate in various OECD forums to “enlighten” bureaucrats and share ideas, as researchers from SPRU 34 OECD (1998), Possible Meeting of the CSTP at Ministerial Level:
Statistical Compendium, DSTI/EAS/STP/NESTI (98) 8, p. 3.
The Making of Science, Technology…, 2009 23
did in the 1970s-80s. They are also employed as deputy directors by the organization, like D. Foray to work on the knowledge-based economy, or B. A. Lundvall on the national innovation system. In the end, academics are “accomplices”. Many of them use the same labels and narratives in their papers, and few of them develop fundamental criticisms of the frameworks.

The Making of Science, Technology…, 2009 25
PART I
CHAPTER ONE
THE LINEAR MODEL OF INNOVATION: THE HISTORICAL CONSTRUCTION OF AN
ANALYTICAL FRAMEWORK
One of the first conceptual frameworks developed for understanding science, technology, and innovation, and its relation to the economy has been the “linear model of innovation”. The model postulates that innovation starts with basic research, then adds applied research and development, and ends with production and diffusion:
Basic research → Applied research → Development → (Production and) Diffusion
The model has been very influential. Academic organizations, as a lobby for research funds1, and economists, as expert advisors to policy-makers 2, have disseminated the framework, or the understanding based thereon, widely, and have justified government support to science using this framework. As a consequence, science policies carried a linear conception of innovation for many decades 3
1 National Science Foundation (1957), Basic Research: A National
Resource, Washington: National Science Foundation.
, as did ademics studying science and technology. Very few people
2 R. R. Nelson (1959), The Simple Economics of Basic Scientific Research, Journal of Political Economy, 67: 297-306.
3 D. C. Mowery (1983), Economic Theory and Government Technology Policy, Policy Sciences, 16, p. 27-43.

26 The Making of Science, Technology…, 2009
defend such an understanding of innovation anymore: “Everyone knows that the linear model of innovation is dead”, claimed N. Rosenberg4
In order to answer this question, one must first trace the history of the framework to the present. The precise source of the linear model of innovation remains nebulous, having never been documented. Several authors who have used, improved or criticized the model in the last fifty years have rarely acknowledged or cited any original source. The model was usually taken for granted. According to others, however, it comes directly from, or is advocated clearly in V. Bush’s Science: The Endless Frontier (1945)
and others. But is this really the case?
5
In this chapter, I trace the history of the model, suggesting that it developed in three (overlapping) stages. The first, from the beginning of the twentieth century to circa 1945, was concerned with the first two terms, basic research and applied research. This period was
. One would be hard pressed, however, to find anything but a rudiment of this model in Bush’s manifesto. Bush talked about causal links between science (namely basic research) and socio-economic progress, but nowhere did he develop a full-length argument based on a sequential process broken down into its elements, or one that suggests a mechanism whereby science translates into socioeconomic benefits.
4 N. Rosenberg (1994), Exploring the Black Box: Technology, Economics,
and History, New York: Cambridge University Press, p. 139. 5 J. Irvine and B. R. Martin (1984), Foresight in Science: Picking the
Winners, London: Frances Pinter, p. 15; C. Freeman (1996), The Greening of Technology and Models of Innovation, Technological Forecasting and Social Change, 53, p. 27-39; D. A. Hounshell (1996), The Evolution of Research in the United States, in R. S. Rosenbloom and W. J. Spencer (eds.), Engines of Innovation: US Industrial Research at the End of an Era, Boston: Harvard Business School, p. 43; D. C. Mowery (1997), The Bush Report after Fifty Years – Blueprint or Relic?, in C. E. Barfield (ed.), Science for the 21st Century: The Bush Report Revisited, Washington: AEI Press, p. 34; D. E. Stokes (1997), Pasteur’s Quadrant: Basic Science and Technological Innovation, Washington: Brookings Institution, p. 10; P. Mirowski and E.-M. Sent (2002), Science Bought and Sold: Essays in the Economics of Science, Chicago: University of Chicago Press, p. 21-22.

The Making of Science, Technology…, 2009 27
characterized by the ideal of pure science, and people began developing a case for a causal link between basic research and applied research. This is the rhetoric in which Bush participated. Bush borrowed his arguments directly from his predecessors, among them industrialists and the US National Research Council. The second stage, lasting from 1934 to circa 1960, added a third term to the discussion, namely development, and created the standard three-stage model of innovation: Basic research → Applied research → Development. Analytical as well as statistical reasons were responsible for this addition. Analysis of this stage constitutes the core of this chapter. The last stage, starting in the 1950s, extended the model to non-R&D (not research and development-related) activities like production and diffusion. Business schools as well as economists were responsible for this extension of the model.
The main thesis of this chapter is that the linear model owes little to Bush. It is rather a theoretical construction of industrialists, consultants and business schools, seconded by economists. The paper also argues that the long survival of the model, despite regular criticisms, is due to statistics. Having become entrenched with the help of statistical categories for counting resources and allocating money to science, technology, and innovation, and standardized under the auspices of the OECD and its methodological manuals, the linear model functioned as a “social fact”. Rival models, because of their lack of statistical foundations, could not easily become substitutes.
This chapter is divided into four parts. The first discusses the core of the linear model and its source, that is, the political rhetoric, or ideal of pure science, that made applied research dependent on basic research. The second part discusses the first real step toward the construction of the model by looking at the category and the activity called “development” and its place in industrial research. The third part documents the crystallization of the standard three-stage model via statistics. It argues that statistics has been one of the main factors explaining why the model gained strength and is still alive, despite criticisms, alternatives and a proclaimed death. The last part
28 The Making of Science, Technology…, 2009
documents how economists extended the standard model to include innovation.
The chapter focuses on the United States, although it draws on material from other countries in cases where individuals from those countries contributed to the construction of the model or to the understanding of the issue. Two factors explain this focus. First, American authors were the first to formalize the linear model of innovation and to discuss it explicitly in terms of a sequential model. Second, the United States was the first country where the statistics behind the model began to be systematically collected. Although limited, this focus allows one to balance D. Edgerton’s recent thesis that the linear model does not exist: “the linear model is very hard to find anywhere, except in some descriptions of what it is supposed to have been”, claims Edgerton (p. 32) 6
A POLITICAL RHETORIC
. To Edgerton, the model does not exist in Bush’s writings, and here Edgerton and the present author agree, but neither does it exist elsewhere. As this chapter implies, only if one looks at the term itself can one supports Edgerton’s thesis. The model, whatever its name, has been THE mechanism used for explaining innovation in the literature on technological change and innovation since the late 1940s.
From the ancient Greeks to the present, intellectual and practical work have always been seen as opposites. The ancients developed a hierarchy of the world in which theoria was valued over practice.
6 D. Edgerton (2004), The Linear Model did not Exist, in K. Grandin, N.
Worms, and S. Widmalm (eds.), The Science-Industry Nexus: History, Policy, Implications, Sagamore Beach: Science History Publications, p. 31-57.

The Making of Science, Technology…, 2009 29
This hierarchy rested on a network of dichotomies that were deeply rooted in social practice and intellectual thought 7
A similar hierarchy existed in the discourse of scientists: the superiority of pure over applied research. The concept of pure research originated in 1648, according to I. B. Cohen
.
8. It was a term used by philosophers to distinguish between science or “natural philosophy”, which was motivated by the study of abstract concepts, and the mixed “disciplines” or subjects, like mixed mathematics, that were concerned with concrete concepts9
The ideology of pure science has been widely documented in the literature, and will not be discussed here
. The term came into regular use at the end of the nineteenth century, and was usually accompanied by the contrasting concept of applied research.
10
7 H. Arendt (1958), The Human Condition, Chicago: Chicago University
Press; G. E. R. Lloyd (1966), Polarity and Analogy: Two Types of Argumentation in Early Greek Thought, Cambridge: Cambridge University Press; N. Lobkowicz (1967), Theory and Practice: History of a Concept From Aristotle to Marx, London: University of Notre Dame.
. Suffice it to say that pure science was opposed to applied science on the basis of motive (knowledge for its own sake). The dichotomy was a rhetorical resource used by scientists, engineers and industrialists for defining, demarking and controlling their profession (excluding amateurs), for financial support (to scientists), for raising the status of a discipline (as engineers did), and for attracting scientists (as industrialists did). It was also a rhetoric, particularly present in Great Britain, that referred to the ideal of the freedom of science from interference from
8 I. B. Cohen (1948), Science Servant of Men, Boston: Little, Brown and Co., p. 56.
9 R. Kline (1995), Construing Technology as Applied Science: Public Rhetoric of Scientists and Engineers in the United States, 1880-1945, Isis, 86: 194-221.
10 G. H. Daniels (1967), The Pure-Science Ideal and Democratic Culture, Science, 156, p. 1699-1705; E. T. Layton (1976), American Ideologies of Science and Engineering, Technology and Culture, 17 (4), p. 688-700; D. A. Hounshell (1980), Edison and the Pure Science Ideal in 19th Century America, Science, 207: 612-617.

30 The Making of Science, Technology…, 2009
the State, with an eye to the counter-reference and negative experiences in Nazi Germany and to some extent in the Soviet Union11
Although generally presented as opposing terms, however, basic and applied research were at the same time being discussed as cooperating: basic research was the seed from which applied research grew: “to have the applications of a science, H. A. Rowland argued, the science itself must exist”
.
12
Industrial research underwent expansion after World War I. Several big firms became convinced of the necessity of investing in research,
. Certainly, the relationship was one-way (from basic to applied research), but it gave rise to a whole rhetoric in the early twentieth century, one supported by the industrialists, among others.
and began building laboratories for the purpose of conducting research 13
11 Congress for Cultural Freedom (1955), Science and Freedom, London:
Martin Secker & Warburg.
. Governments accompanied them in these efforts. In Great
12 H. A. Rowland (1902), A Plea for Pure Science, in The Physical Papers of Henry Augustus Rowland, Baltimore: Johns Hopkins University Press, p. 593-613, p. 594; N. Reingold and A. P. Molella (1991), Theorists and Ingenious Mechanics: Joseph Henry Defines Science, in N. Reingold (ed.), Science: American Style, New Brunswick: Rutgers University Press, p. 127-155.
13 On the emergence of industrial research, see: National Research Council (1941), Research: A National Resource (II): Industrial Research, National Resources Planning Board, Washington: USGPO; G. Wise (1985), W. R. Whitney, General Electric, and the Origins of US Industrial Research, New York: Columbia University Press; L. S. Reich (1985), The Making of American Industrial Research: Science and Business at GE and Bell, 1876-1926, New York: Cambridge University Press; D. A. Houndshell and J. K. Smith (1988), Science and Corporate Strategy: Du Pont R&D, 1902-1980, New York: Cambridge University Press; A. Heerding (1986), The History of N. V. Philips’ Gloeilampenfabriken, New York: Cambridge University Press; J. Schopman (1989), Industrious Science: Semiconductor Research at the N. V. Philips’ Gloeilampenfabriken, 1930-1957, Historical Studies in Physical and Biological Sciences, 19 (1), p. 137-172; M. B. W. Graham and B. H. Pruitt (1991), R&D for Industry: A Century of Technical Innovation at

The Making of Science, Technology…, 2009 31
Britain, for example, the Department of Scientific and Industrial Research aided and funded industries in their efforts to create industrial research organizations14
Alcoa, New York: Cambridge University Press; J. K. Smith (1990), The Scientific Tradition in American Industrial Research, Technology and Culture, 31 (1), p. 121-131; M. A. Dennis (1987), Accounting for Research: New Histories of Corporate Laboratories and the Social History of American Science, Social Studies of Science, 17, p. 479-518; D. Mowery (1984), Firm Structure, Government Policy, and the Organization of Industrial Research: Great Britain and the United States, 1900-1950, Business History Review, p. 504-531; G. Meyer-Thurow (1982), The Industrialization of Invention: A Case Study from the German Chemical Industry, ISIS, 73, p. 363-381; T. Shinn (1980), The Genesis of French Industrial Research, 1880-1940, Social Science Information, 19 (3), p. 607-640. For statistical analyses, see: D. C. Mowery and N. Rosenberg (1989), The US Research System Before 1945, in D. C. Mowery and N. Rosenberg, Technology and the Pursuit of Economic Growth, New York: Cambridge University Press; D. C. Mowery (1983), Industrial Research and Firm Size: Survival, and Growth in American Manufacturing, 1921-1946: An Assessment, Journal of Economic History, 63 (4), p. 953-980; D. E. H. Edgerton and S. M. Horrocks (1994), British Industrial Research and Development Before 1945, Economic History Review, 67 (2), p. 213-238; S. M. Horrocks (1999), The Nature and Extent of British Industrial Research and Development, 1945-1970, ReFresh, 29, Autumn, p. 5-9; D. C. Mowery (1986), Industrial Research, 1900-1950, in B. Elbaum and W. Lazonick (eds.), The Decline of the British Economy, Oxford: Clarendon Press; D. E. H. Edgerton (1993), British Research and Development After 1945: A Re-Interpretation, Science and Technology Policy, April, p. 10-16; D. E. H. Edgerton (1987), Science and Technology in British Business History, Business History, 29 (4), p. 84-103; M. Sanderson (1972), Research and the Firm in British Industry, 1919-1939, Science Studies, 2, p. 107-151.
. In the United States, it was the newly created National Research Council of the National Academy of Science that gave itself the task of promoting industrial research. The close links between the National Research Council and industry go back to the preparations for war (1916). Industrialists were called upon for the World War I research efforts coordinated by the National Research Council. After the war, the National Research
14 Committee on Industry and Trade (1927), Factors in Industrial and Commercial Efficiency, Part I, chapter 4, London: Majesty’s Stationery Office; D. E. H. Edgerton and S. M. Horrocks (1994), British Industrial R&D Before 1945, op. cit., p. 215-216.

32 The Making of Science, Technology…, 2009
Council, “impressed by the great importance of promoting the application of science to industry (…), took up the question of the organization of industrial research, (…) and inaugurated an Industrial Research Division to consider the best methods of achieving such organization (…)”15. “In the 1920s, the division had been a hotbed of activity, preaching to corporations the benefits of funding their own research” 16. The division conducted special studies on industrial research, arranged visits to industrial research laboratories for executives, organized conferences on industrial research, helped set up the Industrial Research Institute – an organization that still exists today17 – and compiled a biennial repertory of laboratories from 1920 to the mid 1950s18
In Europe as well as in North America, industrialists reproduced the nineteenth-century discourses of scientists on the utility of science: pure research was “of incalculable value to all the industries”
.
19
15 A. L. Barrows, The Relationship of the NRC to Industrial Research, in
National Research Council (1941), Research: A National Resource II: Industrial Research, op. cit. p. 367.
. The Reprint and Circular Series of the National Research Council in the late 1910s and 1920s was witness to this rhetoric by industrialists. J. J. Carty, vice-president, ATT, was a typical purveyor of the rhetoric. In 1924, speaking before the US Chamber of Commerce, he proclaimed, “The future of American business and commerce and
16 G. P. Zachary (1997), Endless Frontier: Vannevar Bush, Engineer of the American Century, Cambridge (Mass.): MIT Press, 1999, p. 81.
17 The Institute was launched in 1938 as the National Industrial Research Laboratories Institute, renamed the next year as the Industrial Research Institute. It became an independent organization in 1945.
18 See A. L. Barrows (1941), The Relationship of the NRC to Industrial Research, op. cit; R. C. Cochrane (1978), The National Academy of Sciences: The First Hundred Years 1863-1963, Washington: National Academy of Sciences, p. 227-228, 288-291, 288-316; National Research Council (1933), A History of the National Research Council, 1919-1933, Reprint and Circular Series of the National Research Council, No. 106, Washington, p. 44-48.
19 J. J. Carty (1916), The Relation of Pure Science to Industrial Research, Reprint and Circular Series, No. 14, National Research Council, p. 8.

The Making of Science, Technology…, 2009 33
industry is dependent upon the progress of science” 20. To Carty, science was composed of two kinds: pure and applied. To him, the pure scientists were “the advance guard of civilization. By their discoveries, they furnish to the engineer and the industrial chemist and other workers in applied science the raw material to be elaborated into manifold agencies for the amelioration of mankind, for the advancement of our business, the improvement of our industries, and the extension of our commerce” 21
Carty explicitly refused to debate the contested terms “pure” and “applied” research: “the two researches are conducted in exactly the same manner”
.
22. To Carty, the distinction was one of motive. He wanted to direct “attention to certain important relations between purely scientific research and industrial research which are not yet sufficiently understood”23. In an article published in Science 24, Carty developed the first full-length rationale for public support to pure research. To the industrialist, “pure” science was “the seed of future great inventions which will increase the comfort and convenience and alleviate the sufferings of mankind”25. But because the “practical benefits, though certain, are usually indirect, intangible or remote”, Carty thought that the “natural home of pure science and of pure scientific research is to be found in the university” 26
20 J. J. Carty (1924), Science and Business, Reprint and Circular Series, No.
24, National Research Council, p. 1.
, where each master scientist “should be provided with all of the resources and facilities and assistants that he can effectively employ, so that the range of his genius will in no way be restricted for the want of anything which money can provide. Every reasonable and even
21 Ibid., p. 1-2. 22 Ibid., p. 7. 23 Ibid., p. 1. 24 J. J. Carty (1916), The Relation of Pure Science to Industrial Research,
op. cit. 25 Ibid., p. 8. 26 Ibid., p. 8 and 9.

34 The Making of Science, Technology…, 2009
generous provision should be made for all workers in pure science” 27. But “where are the universities to obtain the money necessary for the carrying out of a grand scheme of scientific research? It should come from those generous and public-spirited men” [philanthropists and, much later, the State] and “from the industries”28. This rationale is not very far from that offered by W. von Humboldt, founder of the modern university, in his memorandum of 180929
V. Bush followed this rhetoric with his blueprint for science policy, titled Science: The Endless Frontier
.
30. He suggested the creation of a National Research Foundation that would publicly support basic research on a regular basis. The rhetoric behind the Bush report was entirely focused on the socioeconomic benefits of science: “Advances in science when put to practical use mean more jobs, higher wages, shorter hours, more abundant crops, more leisure for recreation, for study, for learning how to live the deadening drudgery which has been the burden of the common man for past ages. Advances in science will also bring higher standards of living, will lead to the prevention or cure of diseases, will promote conservation of our limited resources, and will assure means of defense against aggression” 31. “Without scientific progress no amount of achievement in other directions can insure our health, prosperity, and security as a nation in the modern world” 32
But what is the mechanism by which science translates into socio-economic progress? Bush distinguished between basic research, or
.
27 Ibid., p. 12. 28 Ibid., p. 14-15. 29 W. von Humboldt (1809), On the Spirit and the Organizational
Framework of Intellectual Institutions in Berlin, Minerva, 8, 1970, p. 242-250.
30 V. Bush (1945), Science: The Endless Frontier, North Stratford: Ayer Co., 1995.
31 Ibid., p. 10. 32 Ibid., p. 11.

The Making of Science, Technology…, 2009 35
research “performed without thought of practical ends” and resulting “in general knowledge and an understanding of nature and its laws”, and applied research 33. To Bush, however, the two types of research were or should be understood in relation to each other: “the further progress of industrial development would eventually stagnate if basic research were long neglected” 34. Basic research is the “means of answering a large number of important practical problems” 35. But how: 36
Basic research (…) creates the fund from which the practical applications of knowledge must be drawn. New products and new processes do not appear full-grown. They are founded on new principles and new conceptions, which in turn are painstakingly develop by research in the purest realms of science. Today, it is truer than ever that basic research is the pacemaker of technological progress.
This was the furthest Bush went in explaining the links between science and society. It is clear that Bush was dealing with the Basic research → Applied Research part of the linear model of innovation. Certainly, in the appendix to the Bush report, the Bowman committee used a taxonomy of research composed of pure research/background research/applied research and development, and argued that “the development of important new industries depends primarily on a continuing vigorous progress of pure science” 37
33 Ibid., p. 18.
. But the taxonomy was never used as a sequential model to explain socio-economic progress. It served only to estimate the discrepancy between the funds spent on pure research and those spent on applied research.
34 Ibid. 35 Ibid. 36 Ibid., p. 19. 37 Ibid., p. 81.

36 The Making of Science, Technology…, 2009
Bush succeeded in putting the ideal of pure science on officials’ lips and influencing the emerging science policy38
AN INDUSTRIAL PERSPECTIVE
. But he suggested no more than a causal link between basic research and its applications, and the rhetoric had been developed and discussed at length before him. Nowhere did Bush suggest a model, unless one calls a one-way relationship between two variables a model. Rather, we owe the development of such a model to industrialists, consultants and business schools.
The early public discourses of industrialists on science, among them those of US National Research Council members, were aimed at persuading firms to get involved in research. For this reason, they talked mainly of science or research, without always discussing the particulars of science in industry. But within firms, the reality was different: there was little basic research, some applied research, and a lot of development. It was not long before the organization of research reflected this fact.
Development (or the “D” in R&D) is a term that came from industry39. In the early 1920s, many large firms had “departments of applied science, or, as they are sometimes called, departments of development and research” 40
38 B. Godin (2003), Measuring Science: Is There Basic Research without
Statistics?, Social Science Information, 42 (1), p. 57-90.
. It was not long before every manager was using the expression “research and development”, recognizing the fact that the development of new products and processes was as important as research, if not the primary task of industrial
39 B. Godin (2006), Research and Development: How the “D” got into R&D, Science and Public Policy, 33 (1), p. 59-76.
40 J. J. Carty (1924), Science and Business, op. cit. p. 4.

The Making of Science, Technology…, 2009 37
laboratories. In the 1930s, several annual reports of companies brought both terms together 41
To industrialists, in fact, development was more often than not an integral part of (applied) research or engineering
.
42. “Many laboratories are engaged in both industrial research and industrial development. These two classes of investigation commonly merge so that no sharp boundary can be traced between them. Indeed, the term research is frequently applied to work which is nothing else than development of industrial processes, methods, equipments, production or by-products” 43. And the organization of research in firms reflected this interpretation. Until World War II, very few firms had separate departments for research on the one hand, and (product) development on the other44. Both activities were carried out in the same department, and it was the same kind of people (engineers) that carried out both types of tasks 45
41 For examples, see M. Holland and W. Spraragen (1933), Research in
Hard Times, Division of Engineering and Industrial Research, National Research Council, Washington p. 9-11.
. As noted by J. D. Bernal, the British scientist well known for his early social analysis of science and his advocacy for science planning rather than the freedom of science:
42 For an excellent discussion of the “confusion” between research and other activities, see: F. R. Bichowsky (1942), Industrial Research, New York: Chemical Publishing, chapters 3 and 7.
43 National Research Council (1920), Research Laboratories in Industrial Establishments of the United States of America, Bulletin of the NRC, vol. 1, part 2, March, p. 1-2.
44 After 1945, several large laboratories began having separate divisions for the two functions. See: F. R. Bichowsky (1942), Industrial Research, op. cit.; W. E. Zieber (1948), Organization Charts in Theory and Practice, in C. C. Furnas (ed.), Research in Industry: Its Organization and Management, Princeton: D. Van Nostrand, p. 71-89; C. E. K. Mees and J. A. Leermakers (1950), The Organization of Industrial Scientific Research, op. cit. p. 175-202.
45 G. Wise (1980), A New Role for Professional Scientists in Industry: Industrial Research at General Electric, 1900-1916, Technology and Culture, 21, p. 408-429; L. S. Reich (1983), Irving Langmuir and the Pursuit of Science and Technology in the Corporate Environment, Technology and Culture, 24, p. 199-221.

38 The Making of Science, Technology…, 2009
there is a “difficulty of distinguishing between scientists and technicians in industrial service. Many mechanical engineers, and still more electrical and chemical engineers, are necessarily in part scientists, but their work on the whole cannot be classified as scientific research as it mostly consists of translating into practical and economic terms already established scientific results”46
Development as an activity got more recognition and visibility when industrialists, consultants and academics in business schools started studying industrial research. In the 1940s and 1950s, these individuals began developing “models of innovation”. The models, usually illustrated with diagrams, portrayed research as a linear sequence or process starting with basic research, then moving on to applied research, and then development.
.
Already in 1920, in a book that would remain a classic for decades, C. E. K. Mees, director of the research laboratory at Eastman Kodak, described the development laboratory as a small-scale manufacturing department devoted to developing “a new process or product to the stage where it is ready for manufacture on a large scale” 47. The work of this department was portrayed as a sequential process: development work is “founded upon pure research done in the scientific department, which undertakes the necessary practical research on new products or processes as long as they are on the laboratory scale, and then transfers the work to special development departments which form an intermediate stage between the laboratory and the manufacturing department”48
46 J. D. Bernal (1939), The Social Function of Science, Cambridge (Mass.):
MIT Press, 1973, p. 55.
. To the best of my knowledge,
47 C. E. K. Mees (1920), The Organization of Industrial Scientific Research, New York: McGraw Hill, p. 79.
48 Ibid., p. 79. In the 1950 edition, the process of “technological advance” included the following steps: research, then development, the latter composed of three steps (establishment of small-scale use, pilot plant and models, adoption in manufacturing). C. E. K. Mees and J. A. Leermakers (1950), The Organization of Industrial Scientific Research, New York: McGraw-Hill, p. 4-5.

The Making of Science, Technology…, 2009 39
however, the first and most complete description of such a sequence came from To the best of my knowledge, however, the first discussion of such a model in the literature came in 1928 from Maurice Holland, Director of the Engineering and Industrial Research Division at the National Research Council49
- pure science research
. To Holland, research is "the prime mover of industry", because it accelerates the development of industries by reducing what he called the “time lag” between discovery and production. As n argument to convince industries to invest in research, Holland portrayed the development of industries as a series of successive stages. He called his sequence the "research cycle". It consists of the following seven steps:
- applied research
- invention
- industrial research [development]
- industrial application
- standardization
- mass production
More than ten years later, R. Stevens, vice-president at Arthur D. Little, in a paper appearing in the US National Research Council report to the Resources Planning Board titled Research: A National Resource, made his own attempt “to classify the stages through which research travels on its way towards adoption of results by industry” 50
49 M. Holland (1928), Research, Science and Invention, in F.W. Wile, A
Century of Industrial Progress, American Institute of the City of New York, New York: Doubleday, Doran and Co., p. 312-334.
. By then, such sequences were the common understanding of the relations between research and industry, and
50 R. Stevens (1941), A Report on Industrial Research as a National Resource: Introduction, in National Research Council: A National Resource (II): Industrial Research, op. cit. p. 6-7.

40 The Making of Science, Technology…, 2009
would proliferate among industrialists’ writings in the 1940s. For example, F. R. Bichowsky, in a lucid analysis of industrial research, distinguished several industrial activities and organized them into a “flow sheet chart”: research, engineering (or development), and factory (or production) 51. C. C. Furnas, in a classic analysis conducted for the Industrial Research Institute, proposed five activities and presented them as a flow diagram: exploratory research and fundamental research activities at a first level, followed by applied research, then development, then production52
These efforts would soon culminate in the well-known three-stage model: Basic research → Applied research → Development. It is to official (i.e.: government) statistics that we owe this simpler (and now standardized) model.
.
A STATISTICAL CLASSIFICATION
Over the period 1920-1950, official statisticians developed a definition and a classification of research made up of three components – basic research/applied research/development. The story of these statistical categories is the key to understanding the crystallization of the linear model of innovation and its coming into widespread use: statistics solidified a model in progress into one taken for granted, a “social fact”.
Although research had been measured since the early 1920s, the question “what is research?” was often left to the questionnaire respondent to decide. The first edition of the US National Research Council directory of industrial research laboratories, for example, reported using a “liberal interpretation” that let each firm decide which activities counted as research: “all laboratories have been included which have supplied information and which by a liberal
51 F. R. Bichowsky (1942), Industrial Research, op. cit. p. 81. 52 C. C. Furnas (1948), Research in Industry: Its Organization and
Management, op. cit. p. 4.

The Making of Science, Technology…, 2009 41
interpretation do any research work” 53. Consequently, any studies that used National Research Council numbers, like those by Holland and Spraragen 54 and by the US Work Project Administration55 were of questionable quality: “the use of this information [National Research Council data] for statistical analysis has therefore presented several difficult problems and has necessarily placed some limitations on the accuracy of the tabulated material”. 56 Again in 1941, in its study on industrial research conducted for the US National Resources Planning Board, the National Research Council used a similar practice: the task of defining the scope of activities to be included under research was left to the respondent57. In Canada as well, the first study by the Dominion Bureau of Statistics contained no definition of research 58
The situation improved in the 1950s and 1960s thanks wholly to the US National Science Foundation and the OECD, and to their methodological conventions. In 1951, the National Science Foundation was mandated by law to measure scientific and technological activities in the country
.
59
53 National Research Council (1920), Research Laboratories in Industrial
Establishments of the United States of America, Bulletin of the National Research Council, vol. 1, part 2, March, p. 45.
. To that end, the organization developed a series of surveys on R&D based on precise definitions and categories. Research then came to be defined as “systematic, intensive study directed toward fuller knowledge of the subject
54 M. Holland and W. Spraragen (1933), Research in Hard Times, op. cit. 55 G. Perazich and P. M. Field (1940), Industrial Research and Changing
Technology, Work Projects Administration, National Research Project, report no. M-4, Philadelphia: Pennsylvania.
56 Ibid., p. 52. 57 National Research Council (1941), Research: A National Resource (II):
Industrial Research, op. cit. p. 173. 58 Dominion Bureau of Statistics (1941), Survey of Scientific and Industrial
Laboratories in Canada, Ottawa. 59 B. Godin (2003), The Emergence of S&T Indicators: Why Did
Governments Supplement Statistics with Indicators?, Research Policy, 32 (4), p. 679-691.

42 The Making of Science, Technology…, 2009
studied and the systematic use of that knowledge for the production of useful materials, systems, methods, or processes” 60. Industrialized countries followed the National Science Foundation definition when they adopted the OECD Frascati manual in 1963. The manual was designed to help countries in their measurement efforts, offering methodological conventions that theoretically allowed international comparisons. In line with the National Science Foundation’s definition, the manual defined research as “creative work undertaken on a systematic basis to increase the stock of scientific and technical knowledge and to use this stock of knowledge to devise new applications”61
Before such definitions were arrived at, however, two practices prevailed. First, research was “defined” either by simply excluding routine activities or by supplying a list of activities designed solely to help respondents decide what to include in their responses to the questionnaires. Among these activities were basic and applied research, but also engineering, testing, prototypes, and design, which would later collectively come to be called development. No disaggregated data were available for calculating statistical breakdowns, however. In fact, “in these early efforts, the primary interest was not so much in the magnitude of the dollars going into scientific research and development, either in total or for particular agencies and programs, but in identifying the many places where research and development of some sort or other was going on (…)”
.
62
60 National Science Foundation (1953), Federal Funds for Science,
Washington, p. 3.
.
61 OECD (1970), The Measurement of Scientific and Technical Activities: Proposed Standard Practice for Surveys of Research and Experimental Development, Paris, p. 8. The first edition (1962) contained no definition of research.
62 W. H. Shapley (1959), Problems of Definition, Concept, and Interpretation of Research and Development Statistics, in National Science Foundation, The Methodology of Statistics on R&D, NSF 59-36, Washington.

The Making of Science, Technology…, 2009 43
Although no definition of research per se existed, people soon started “defining” research by way of categories. This was the second practice. The most basic taxonomy relied on the age-old dichotomy: pure vs. applied research. Three typical cases prevailed with regard to the measurement of these two categories. The first was an absence of statistics because of the difficulty of producing any numbers that met the terms of the taxonomy. Bernal, for example, was one of the first academics to conduct a national measurement of research in a western country, although he used available statistics and did not conduct his own survey. In The Social Function of Science (1939), Bernal did not break the research budget down by type of research or “character of work” — such statistics were not available. “The real difficulty (…) in economic assessment of science is to draw the line between expenditures on pure and on applied science”, Bernal said63
The second case with regard to the pure vs. applied taxonomy was the use of proxies. In his well-known report, Science: The Endless Frontier (1945), Bush elected to use the term “basic research”, and defined it as “research performed without thought of practical ends”
. He could only present total numbers, sometimes broken down by economic sector according to the System of National Accounts, but he could not figure out how much was allocated to basic research and how much to applied research.
64. He estimated that the nation invested nearly six times as much in applied research as in basic research 65. The numbers were derived by equating college and university research with basic research, and equating industrial and government research with applied research. More precise numbers appeared in appendices, such as ratios of pure research in different sectors – 5% in industry, 15% in government, and 70% in colleges and universities 66
63 J. D. Bernal (1939), The Social Function of Science, op. cit. p. 62.
– but the sources and methodology behind these figures were absent from the report.
64 V. Bush (1945), Science: The Endless Frontier, op. cit. p. 18. 65 Ibid., p. 20. 66 Ibid., p. 85.

44 The Making of Science, Technology…, 2009
The third case was skepticism about the utility of the taxonomy, to the point that authors rejected it outright. For example, Research: A National Resource (1938), one of the first measurements of science in government in America, explicitly refused to use any categories but research: “There is a disposition in many quarters to draw a distinction between pure, or fundamental, research and practical research (…). It did not seem wise in making this survey to draw this distinction”67. The reasons offered were that fundamental and applied research interact, and that both lead to practical and fundamental results. This was just the beginning of a long series of debates on the classification of research according to whether it is categorized as pure or applied 68
We owe to the British scientist J. S. Huxley, a colleague of Bernal and a member of the “visible college” of socialist scientists, as G. Werskey called them
.
69, the introduction of new terms and the first formal taxonomy of research (see Table 1). The taxonomy had four categories: background, basic, ad hoc and development 70. The first two categories defined pure research: background research is research “with no practical objective consciously in view”, while basic research is “quite fundamental, but has some distant practical objective (…). Those two categories make up what is usually called pure science” 71
67 National Resources Committee (1938), Research: A National Resource,
Washington: USGPO, p. 6.
. To Huxley, ad hoc meant applied research, and development meant more or less what we still mean by the term today: “work needed to translate laboratory findings into full-scale commercial practice”.
68 B. Godin (2003), Measuring Science: Is There Basic Research Without Statistics?, op. cit.
69 G. Werskey (1978), The Visible College: The Collective Biography of British Scientific Socialists of the 1930s, New York: Holt, Rinehart and Winston.
70 J. S. Huxley (1934), Scientific Research and Social Needs, London: Watts and Co.
71 Ibid., p. 253.

The Making of Science, Technology…, 2009 45
Despite having these definitions in mind, however, Huxley did not conduct any measurements. Nevertheless, Huxley’s taxonomy had several influences. Bush borrowed the term “basic” from Huxley when talking of pure research. The concept of “oriented basic research”, later adopted by the OECD, comes from Huxley’s definition of basic research 72
Table 3. Taxonomies of Research
. Above all, the taxonomy soon came to be widely used for measurement. We owe to the US President’s Scientific Research Board the first such use.
J. Huxley (1934) background, basic, ad hoc, development
J. D. Bernal (1939) pure (and fundamental), applied
V. Bush (1945) basic, applied Bowman (in Bush, 1945) pure, background, applied and
development US President’s Scientific Research Board (1947)
fundamental, background, applied, development
Canadian Department of Reconstruction and Supply (1947)
pure, background, applied, development, analysis & testing
R. N. Anthony uncommitted, applied, development
US National Science Foundation (1953) basic, applied, development British Department for Scientific and Industrial Research (1958)
basic, applied and development, prototype
OECD (1962) fundamental, applied, development
The US President’s Scientific Research Board conducted the first real survey of resources devoted to “R&D” in 1947, marking the first time
72 OECD (1970), The Measurement of Scientific and Technical Activities:
Proposed Standard Practice for Surveys of Research and Experimental Development, op. cit. p. 10.

46 The Making of Science, Technology…, 2009
that the term appeared in a statistical report, and using precise categories, although these did not make it “possible to arrive at precisely accurate research expenditures” because of the different definitions and accounting practices employed by institutions73. In the questionnaire it sent to government departments (other sectors like industry were estimated using existing sources of data), it included a taxonomy of research that was inspired directly by Huxley’s four categories: fundamental, background, applied and development 74. Using these definitions, the Board estimated that basic research accounted for about 4% of total research expenditure in the United States 75, and showed that university research expenditures were far lower than government or industry expenditures, that is, lower than applied research expenditures, which amounted to 90% of total research 76
We owe to the Canadian Department of Reconstruction and Supply the first measurement of development per se
. Despite the Board’s precise definitions, however, development was not measured separately, but was rather included in applied research.
77. In the survey it conducted in 1947 on government research, it distinguished research, defined as being composed of pure, background78
73 President’s Scientific Research Board (PSRB) (1947), Science and Public
Policy, Washington: USGPO, p. 73.
and applied research (but without separating the three items “because of the close inter-relationships of the various types of research”), from
74 Ibid., p. 299-314. 75 Ibid., p. 12. 76 Ibid., p. 21. 77 Department of Reconstruction and Supply (1947), Research and
Scientific Activity: Canadian Federal Expenditures 1938-1946, Ottawa; Department of Reconstruction and Supply (1947), Research and Scientific Activity: Canadian Federal Expenditures, 1946 and 1947, Ottawa; Department of Reconstruction and Supply (1947), Research and Scientific Activity: Provincial Government Expenditures: 1946-1947, Ottawa.
78 Here, the term background has changed meaning, as in Bush, and means collection and analysis of data.

The Making of Science, Technology…, 2009 47
development and analysis and testing. Development was defined as “all work required, after the initial research on laboratory (or comparable) level has been completed, in order to develop new methods and products to the point of practical application or commercial production”.
The inclusion of development was (probably) motivated by the importance of military procurement in the government’s budget for science (contracts to industry for developing war technologies). Indeed, most of the data in the report were broken down into military and non-military expenditures. Overall, the Department estimated that 40% of the $34 million spent on federal scientific activities went to research, 48% to development, and 12% into analysis and testing.
Although innovative with regard to the measurement of development in government research 79
An important measurement issue before the 1950s concerned the demarcation of research and non-research activities. Anthony et al. identified two problems: there were too many variations on what constituted research, and too many differences among firms concerning which expenses to include in research
, Canada would not repeat such measurements for years, and never did measure development in industry before the advent of the OECD statistical recommendations in the Frascati manual (1962). It is rather to accountant R. N. Anthony of Harvard Business School that we owe the first, and an influential, series of systematic measurements of all of the terms in the taxonomy. By that time, however, the taxonomy was reduced to three terms, as it continues to this day: basic research, applied research, and development.
80
79 The report of the US National Resources Committee on government
research published in 1938 made no use of the category development. See National Ressources Committee (1938), Research: A National Resource, op. cit.
. Although routine
80 D. C. Dearborn, R. W. Kneznek and R. N. Anthony (1953), Spending for Industrial Research, 1951-1952, Division of Research, Graduate School of Business Administration, Harvard University, p. 91.
48 The Making of Science, Technology…, 2009
work was almost always excluded, there were wide discrepancies at the frontier between development and production, and between scientific and non-scientific activities: testing, pilot plants, design, and market studies were sometimes included in research and at other times not. To Anthony, the main purpose of a survey was to propose a definition of research and then to measure it.
In the early 1950s, the US Department of Defense’s Research and Development Board asked Anthony to conduct a survey of industrial research to enable the government to locate available resources in the event of war, that is, to “assist the military departments in locating possible contractors for research and development projects” 81. Anthony had just conducted a survey of management controls in industrial research laboratories for the Office of Naval Research in collaboration with the corporate associates of the Harvard Business School 82, and was about to begin another survey to estimate the amounts spent on research. The Research and Development Board asked both the Harvard Business School and the Bureau of Labor Statistics to conduct a joint survey of industrial research. The two institutions coordinated their efforts and conducted three surveys. The results were published in 1953 83
The Bureau of Labor Statistics report does not have detailed statistics on categories of research, but Anthony’s report does. The survey included precise definitions that would have a major influence on the National Science Foundation, which was the official producer of
.
81 Bureau of Labor Statistics (1953), Scientific R&D in American Industry:
A Study of Manpower and Costs, Bulletin no. 1148, Washington, p. 1, 51-52.
82 R. N. Anthony and J. S. Day (1952), Management Controls in Industrial Research Organizations, Boston: Harvard University.
83 D. C. Dearborn, R. W. Kneznek and R. N. Anthony (1953), Spending for Industrial Research, 1951-1952, op. cit; US Department of Labor, Bureau of Labor Statistics, Department of Defense (1953), Scientific R&D in American Industry: A Study of Manpower and Costs, op. cit.

The Making of Science, Technology…, 2009 49
statistics on science and technology in the United States, and on the OECD. Anthony’s taxonomy contained three items 84
- Uncommitted research: pursue a planned search for new knowledge whether or not the search has reference to a specific application.
:
- Applied research: apply existing knowledge to problems involved in the creation of a new product or process, including work required to evaluate possible uses.
- Development: apply existing knowledge to problems involved in the improvement of a present product or process.
Along with the definitions, Anthony specified precisely the activities that should be included in development (scale activity, pilot plants and design) and those that should be excluded (market research, legal work, technical services and production). The survey revealed that industry spent 8% of its research budget on basic research (or uncommitted research), 42% on new products (applied research) and 50% on product improvement (development) 85
In the 1950s, the National Science Foundation started measuring research in the United States as part of its mandate to regularly evaluate national scientific activities. The Foundation extended Anthony’s definitions to all sectors of the economy – industry, government, and university – and produced the first national numbers on research so broken down. It took about a decade, however, for standards to appear at the National Science Foundation. Until 1957, for example, development was merged with applied research in the case of government research, with no breakdown. Similarly, until 1959, statistics on development were neither presented nor discussed
. This was the first of a regular series of measurements of these three categories in the history of science statistics. It soon became the norm.
84 D. C. Dearborn, R. W. Kneznek and R. N. Anthony (1953), Spending for
Industrial Research, 1951-1952, op. cit. p. 92. 85 Ibid., p. 47.

50 The Making of Science, Technology…, 2009
in reports on industrial research. 86
- Basic or fundamental research: research projects which represent original investigation for the advancement of scientific knowledge and which do not have specific commercial objectives, although they may be in the fields of present or potential interest to the reporting company
But thereafter, the three components of research were separated, and a national total was calculated for each based on the following definitions:
87
- Applied research: research projects which represent investigation directed to discovery of new scientific knowledge and which have specific commercial objectives with respect to either products or processes.
.
- Development: technical activity concerned with non-routine problems which are encountered in translating research findings or other general scientific knowledge into products or processes.
As Anthony had done, the National Science Foundation suggested three categories – with different labels. The main, and the important, difference has to do with the fact that Anthony’s definitions center on output, while the National Science Foundation’s emphasized aims or objectives. Nevertheless, the two taxonomies produced approximately the same statistical results. The NSF surveys showed once more the importance of development in the research budget: over 60% in the case of government research 88
86 The situation was similar in other countries. See, for example:
Department of Scientific and Industrial Research (1958), Estimates of Resources Devoted to Scientific and Engineering R&D in British Manufacturing Industry, 1955, London.
, and 76.9% for
87 The last part of the definition was, and still is, used for the industrial survey only.
88 National Science Foundation (1957), Federal Funds for Science: The Federal Research and Development Budget, Fiscal Years 1956, 1957, and 1958, NSF 57-24, Washington, p. 10.

The Making of Science, Technology…, 2009 51
industrial research 89. For the nation as a whole, the numbers were 9.1% of the research budget for basic research, 22.6% for applied research and 68.3% for development 90
Anthony’s and the National Science Foundation’s categories were developed for statistical purposes. However, the three categories also served to describe components or steps in the process of innovation, a description that culminated in the three-stage linear model: Basic research → Applied research → Development. Anthony talked of “a spectrum, with basic research at one end, with development activities closely related to production or sale of existing products at the other end, and with other types of research and development spread between these two extremes”
.
91. The National Science Foundation, for its part, suggested that: “the technological sequence consists of basic research, applied research, and development”, where “each of the successive stages depends upon the preceding” 92
By the early 1960s, most countries had more or less similar definitions of research and its components
.
93. Research had now come to be defined as R&D, composed of three types of activities 94
89 National Science Foundation (1959), Science and Engineering in
American Industry: Report on a 1956 Survey, NSF 59-50, Washington, p. 49.
. The OECD gave itself the task of conventionalizing and standardizing the definition. In 1963, OECD member countries adopted a
90 National Science Foundation (1962), Trends in Funds and Personnel for Research and Development, 1953-61, Reviews of Data on R&D, 33, April, NSF 62-9, p. 5.
91 R. N. Anthony and J. S. Day (1952), Management Controls in Industrial Research Organizations, op. cit. p. 58-59.
92 National Science Foundation (1952), Second Annual Report of the NSF: Fiscal Year 1952, Washington: USGPO, p. 11-12.
93 J. C. Gerritsen (1961), Government Expenditures on R&D in France and the United Kingdom, EPA/AR/4209, Paris: OEEC; J. C. Gerritsen (1963), Government Expenditures on R&D in the United States of America and Canada, DAS/PD/63.23, Paris: OECD.
94 B. Godin (2005), Research and Development: How the “D” got into R&D, op. cit.

52 The Making of Science, Technology…, 2009
methodological manual for conducting R&D surveys and producing statistics for indicators and policy targets, like the GERD/GDP ratio (Gross Expenditures on R&D divided by Gross Domestic Product). The Frascati manual included precise instructions for separating research from related scientific activities and non-research activities, and development from production. The manual, in line with the National Science Foundation’s definitions, also recommended collecting and tabulating data according to the three components of research defined as follows 95
- Fundamental research: work undertaken primarily for the advancement of scientific knowledge, without a specific practical application in view.
:
- Applied research: work undertaken primarily for the advancement of scientific knowledge, with a specific practical aim in view.
- Development: the use of the results of fundamental and applied research directed to the introduction of useful materials, devices, products, systems, and processes, or the improvement of existing ones.
ECONOMISTS APPROPRIATE THE MODEL
Economists came into the field quite late. In the early 1960s, when the three components of R&D were already in place in official circles, economists were still debating terms like development and its inclusion in R&D – because it was seen as not inventive in character 96
95 OECD (1962), The Measurement of Scientific and Technical Activities:
Proposed Standard Practice for Surveys of Research and Development, DAS/PD/62.47, p. 12.
– and looking for their own definitions and taxonomy of
96 S. Kuznets (1962), Inventive Activity: Problems of Definition and Measurement, in National Bureau of Economic Research, The Rate and Direction of Inventive Activity: Economic and Social Factors, op. cit, p. 35; J. Schmookler (1962), Comment on S. Kuznets’ paper, in National

The Making of Science, Technology…, 2009 53
research 97. They finally settled on the conventional taxonomy, using the standard three categories to analyze industrial research 98, and using numbers on R&D for measuring the contribution of science to economic progress. In fact, as R. R. Nelson reported in 1962, “the establishment of the NSF has been very important in focusing the attention of economists on R&D (organized inventive activity), and the statistical series the National Science Foundation has collected and published have given social scientists something to work with” 99
Where some economists innovated was in extending the model to one more dimension: the steps necessary to bring the technology to commercial production, namely innovation (Table 4). Some authors often refer back to J. Schumpeter to model the process of innovation. Certainly, we owe to Schumpeter the distinction between invention, (initial) innovation, and (innovation by) imitation (or diffusion)
.
100
Bureau of Economic Research, The Rate and Direction of Inventive Activity: Economic and Social Factors, op. cit. p. 45.
.
97 E. Ames (1961), Research, Invention, Development and Innovation, American Economic Review, 51 (3), p. 370-381; S. Kuznets (1962), Inventive Activity: Problems of Definition, in National Bureau of Economic Research, The Rate and Direction of Inventive Activity, op. cit. p. 19-43; J. Schmookler (1962), Comment on S. Kuznets’ paper, in National Bureau of Economic Research, The Rate and Direction of Inventive Activity: Economic and Social Factors, op. cit. p. 43-51; J. Schmookler (1966), Invention and Economic Growth, Cambridge: Harvard University Press, p. 5-9.
98 For early uses of these categories and construction of tables of categories by economists, see: C. F. Carter and B. R. Williams (1957), Industry and Technical Progress: Factors Governing the Speed of Application of Science, London: Oxford University Press; F. M. Scherer (1959), The Investment Decision Phases in Modern Invention and Innovation, in F. M. Scherer et al. (eds.), Patents and the Corporation, Boston: J. J. Galvin; E. Ames (1961), Research, Invention, Development and Innovation, op. cit. p. 373; F. Machlup (1962), The Production and Distribution of Knowledge in the United States, Princeton: Princeton University Press, p. 178s.
99 R. R. Nelson (1962), Introduction, in National Bureau of Economic Research, The Rate and Direction of Inventive Activity, op. cit. p. 4.
100 J. Schumpeter (1912), The Theory of Economic Development: An Inquiry into Profits, Capital, Credit, Interest, and the Business Cycle, Cambridge:

54 The Making of Science, Technology…, 2009
While invention is an act of intellectual creativity – and “is without importance to economic analysis” 101 – innovation and diffusion are defined as economic decisions, because of their “closeness to economic use”: a firm applying an invention or adopting it for the first time 102
Table 4. Taxonomies of Innovation
.
Mees (1920) Pure science, development, manufacturing Holland (1928) Pure science research, applied research,
invention, industrial research [development], industrial application, standardization, mass production
Stevens (1941) Fundamental research, applied research, test-tube or bench research, pilot plant, production (improvement, trouble shooting, technical control of process and quality)
Bichowsky (1942) Research, engineering (or development), factory (or production)
Furnas (1948) Exploratory and fundamental research, applied research, development, production
Maclaurin (1949) Fundamental research, applied research, engineering development, production engineering, service engineering
Mees and Leermakers (1950)
Research, development (establishment of small-scale use, pilot plant and models, adoption in manufacturing)
Brozen (1951a) Invention, innovation, imitation Brozen (1951b) Research, engineering development,
production, service Maclaurin (1953) Pure science, invention, innovation, finance,
acceptance Ruttan (1959) Invention, innovation, technological change
Harvard University Press, 1934; J. Schumpeter (1939), Business Cycles: A Theoretical, Historical, and Statistical Analysis of the Capitalist Process, New York: McGraw-Hill.
101 J. Schumpeter (1939), Business Cycles, op. cit. p. 85. 102 J. Schmookler (1962), Comment on S. Kuznets’ paper, op. cit. p. 51.
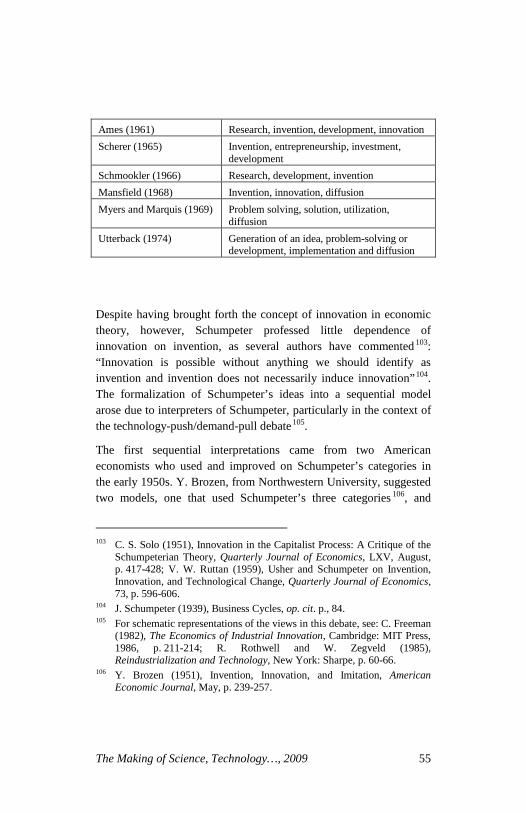
The Making of Science, Technology…, 2009 55
Ames (1961) Research, invention, development, innovation Scherer (1965) Invention, entrepreneurship, investment,
development Schmookler (1966) Research, development, invention Mansfield (1968) Invention, innovation, diffusion Myers and Marquis (1969) Problem solving, solution, utilization,
diffusion Utterback (1974) Generation of an idea, problem-solving or
development, implementation and diffusion
Despite having brought forth the concept of innovation in economic theory, however, Schumpeter professed little dependence of innovation on invention, as several authors have commented 103: “Innovation is possible without anything we should identify as invention and invention does not necessarily induce innovation”104. The formalization of Schumpeter’s ideas into a sequential model arose due to interpreters of Schumpeter, particularly in the context of the technology-push/demand-pull debate105
The first sequential interpretations came from two American economists who used and improved on Schumpeter’s categories in the early 1950s. Y. Brozen, from Northwestern University, suggested two models, one that used Schumpeter’s three categories
.
106
103 C. S. Solo (1951), Innovation in the Capitalist Process: A Critique of the
Schumpeterian Theory, Quarterly Journal of Economics, LXV, August, p. 417-428; V. W. Ruttan (1959), Usher and Schumpeter on Invention, Innovation, and Technological Change, Quarterly Journal of Economics, 73, p. 596-606.
, and
104 J. Schumpeter (1939), Business Cycles, op. cit. p., 84. 105 For schematic representations of the views in this debate, see: C. Freeman
(1982), The Economics of Industrial Innovation, Cambridge: MIT Press, 1986, p. 211-214; R. Rothwell and W. Zegveld (1985), Reindustrialization and Technology, New York: Sharpe, p. 60-66.
106 Y. Brozen (1951), Invention, Innovation, and Imitation, American Economic Journal, May, p. 239-257.
56 The Making of Science, Technology…, 2009
another that explained the factors necessary “to capitalize on the discoveries of science”: research, engineering development, production, service 107. W. P. Maclaurin, an economist from MIT who got interested in technological change early on, was another academic who developed a sequential analysis of innovation. Maclaurin served as secretary of one of the committees that assisted V. Bush in the preparation of Science: the Endless Frontier. In 1947, he published a paper in The Harvard Business Review in which he defended Bush’s proposal for a National Research Foundation108. He discussed the importance of fundamental research and its funding with the aid of a model broken down into “four distinct stages”: fundamental research, applied research, engineering development, and production engineering. Then in 1953, Maclaurin devoted an entire paper to the process of technological change. Suggesting that “Schumpeter regarded the process of innovation as central to an understanding of economic growth”, but that he “did not devote much attention to the role of science”, Maclaurin “broke down the process of technological advance into elements that may eventually be more measurable”. He identified five steps: pure science, invention, innovation, finance, and acceptance (or diffusion) 109
We had to wait several years to see these propositions coalesce into a series of linear models of innovation. Certainly, in their pioneering work on innovation in the late 1950s, C. F. Carter and B. R. Williams from Britain would examine investment in technology, as a
.
107 Y. Brozen (1951), Research, Technology and Productivity, in L. R. Tripp
(ed.), Industrial Productivity, Industrial Relations Research Association, Champaign: Illinois, p. 25-49.
108 W. R. Maclaurin (1947), Federal Support for Scientific Research, Harvard Business Review, Spring, p. 385-396.
109 W. R. Maclaurin (1953), The Sequence from Invention to Innovation and its Relation to Economic Growth, Quarterly Journal of Economics, 67 (1), p. 97-111. A few years before, Maclaurin suggested another model composed of five stages: fundamental research, applied research, engineering development, production engineering, and service engineering. See: W. R. Maclaurin (1949), Invention and Innovation in the Radio Industry, New York: Macmillan, p. xvii-xx.

The Making of Science, Technology…, 2009 57
“component in the circuit which links the pure scientist in his laboratory to the consumer seeking a better satisfaction of his needs” 110. But the authors neither discussed nor suggested a formalized model of innovation until 1967 111. Similarly, the influential conference on the rate and direction of inventive activity, organized in 1960 by the National Bureau of Economic Research and the Social Science Research Council, was concerned with another model than that of innovation per se: the production function, or input-output model 112. If there is one study that deserves mention before the 1960s, it is that of V. W. Ruttan from the university of Minnesota. Ruttan gave himself the task of clarifying the terms used up to the present to discuss innovation, and suggested a synthesis of A. P. Usher’s steps in the invention process113 and Schumpeter’s concept of innovation. From his analysis, Ruttan suggested the following sequence: Invention → Innovation → Technological Change 114
Then a series of models of innovation appeared in the 1960s. E. Ames, although critical of the term innovation (“innovation has come to mean all things to all men, and the careful student should perhaps avoid it wherever possible, using instead some other term”), suggested a model composed of four stages that he discussed in terms of a “sequence of markets”: research, invention (applied research), development and innovation
.
115
110 C. F. Carter and B. R. Williams (1957), Industry and Technical Progress,
op. cit.; C. F. Carter and B. R. Williams (1958), Investment in Innovation, London: Oxford University Press.
. This model came directly from F.
111 B. R. Williams (1967), Technology, Investment and Growth, London: Chapman and Hill.
112 See chapter 3 below. 113 A. P. Usher (1954), A History of Mechanical Inventions, Cambridge:
Harvard University Press. 114 V. W. Ruttan (1959), Usher and Schumpeter on Invention, Innovation,
and Technological Change, op. cit. 115 E. Ames (1961), Research, Invention, Development and Innovation, op.
cit.

58 The Making of Science, Technology…, 2009
Machlup’s early measurement of the knowledge society 116. A few years later, economist J. Schmookler, who was well known for his analyses on the role of demand in invention, looked at what he called technology-producing activities as being composed of three components: research, development, and inventive activity117. In light of other economists’ definitions, Schmookler was definitively dealing with invention rather than innovation, although he was concerned with the role of market forces (wants) in invention. At about the same time, F. M. Scherer, in a historical analysis of the Watt-Boulton engine, identified four ingredients or steps that define innovation: invention, entrepreneurship, investment and development 118. E. Mansfield, for his part, distinguished invention from innovation and diffusion, and defined innovation as the (first) application of an invention and diffusion as its (first) use119
All of these individuals were developing models that defined innovation as a sequence from research or invention to commercialization and diffusion. Academics from management schools followed, and have been very influential in popularizing such models
.
120
116 F. Machlup (1962), The Production and Distribution of Knowledge in the
United States, Princeton: Princeton University Press, p. 178s.
. S. Myers and D. G. Marquis, in a study conducted for the National Science Foundation, defined the process of innovation as composed of five stages: recognition (of both technical feasibility and demand), idea formulation, problem solving, solution, utilization and
117 J. Schmookler (1966), Invention and Economic Growth, op. cit., p. 7. 118 F. M. Scherer (1965), Invention and Innovation in the Watt-Boulton
Steam Engine Venture, Technology and Culture, 6, p. 165-187. 119 E. Mansfield (1968), The Economics of Technological Change, New
York: W. E. Norton, chapters 3 and 4. 120 For reviews, see: R. E. Roberts and C. A. Romine (1974), Investment in
Innovation, Washington: National Science Foundation, p. 20-29; M. A. Saren (1984), A Classification and Review of Models of the Intra-Firm Innovation Process, R&D Management, 14 (1), p. 11-24; J. E. Forrest (1991), Models of the Process of Technological Innovation, Technology Analysis and Strategic Management, 3 (4), p. 439-452.

The Making of Science, Technology…, 2009 59
diffusion 121. J. M. Utterback is another author often cited in the literature for his model of innovation, composed of the following three steps: generation of an idea, problem-solving or development, and implementation and diffusion 122
It was these efforts from both economists and researchers in management schools that led to the addition of diffusion in the much-quoted linear model of innovation: Basic research → Applied research → Development → (Pro duction and) Diffusion. Yet it is important to mention two areas of research that contributed to the focus on diffusion and its integration into theoretical models of innovation. The first was the sociological literature, particularly on the diffusion of invention. This tradition goes back to W. F. Ogburn and S. C. Gilfillan and their contributions to the US National Resources Committee’s report on technology and its social impacts (1937). The “model” they suggested was one of the first descriptions of innovation as a social process, and was motivated by the authors’ interest in social consequences of technology and diffusion lags. It included diffusion as a phase in the process, but also included the social impacts of invention, as the ultimate phase
.
123
121 S. Myers and D. G. Marquis (1969), Successful Industrial Innovations: A
Study of Factors Underlying Innovation in Selected Firms, NSF 69-17, Washington: National Science Foundation, p. 3-6.
. It was E. M.
122 J. M. Utterback (1974), Innovation in Industry and the Diffusion of Technology, Science, 183, p. 621.
123 Other contributions from Ogburn are: The Subcommittee on Technology of the National Resources Committee, presided by W. F. Ogburn, defined invention as a process composed of four phases “occurring in sequence”: beginnings, development, diffusion, social influences. See Technological Trends and National Policy (1937), Subcommittee on Technology, National Resources Committee, Washington, p. vii. See also p. 6 and 10. A few years previously, in the President’s report on social trends, Ogburn and Gilfillan defined invention as a series of stages as follows: idea, trial device (model or plan), demonstration, regular use, adoption. See W. F. Ogburn and S. C. Gilfillan (1933), The Influence of Invention and Discovery, in Recent Social Trends in the United States, Report of the President’s Research Committee on Social Trends, New York: McGraw-Hill, Volume 1, p. 132. In the 1950 edition of Social Change, first

60 The Making of Science, Technology…, 2009
Rogers’ classic book, however, that would be most influential on the literature. In Diffusion of Innovations (1962), Rogers depicted innovation as composed of four elements: innovation, communication (or diffusion), consequences on the social system, and consequences over time 124. By the third edition (1983) of his book, however, Rogers had adopted the economic understanding of innovation. The process of innovation was now portrayed as composed of six main phases or sequential steps: needs/problems, research, development, commercialization, diffusion and adoption, and consequences125
The second influence with regard to diffusion was the theory of the product life cycle. Authors portrayed the life cycle of new products or technologies as having an S-shaped curve, and the process of technological development as consisting of three phases: innovation (product), maturation (process), and standardization
.
126
By the early 1960s, then, the distinctions between and the sequence of invention
.
127, innovation and diffusion were already in place – and even qualified as “conventional”128 or “common” 129
published in 1922, Ogburn developed another classification: invention, accumulation, diffusion, adjustment (p. 377).
. Invention was defined as the development of a new idea for a product or process and its reduction to practice; innovation was defined as the process of bringing invention into commercial use or an invention brought into
124 E. M. Rogers (1962), Diffusion of Innovations, New York: Free Press, p. 12-20.
125 E. M. Rogers (1983), Diffusion of Innovation, Third Edition, New York: Free Press, p. 136.
126 R. Vernon (1966), International Investment and International Trade in the Product Cycle, Quarterly Journal of Economics, 80, p. 190-207; J. M. Utterback and W. J. Abernathy (1975), A Dynamic Model of Process and Product Innovation, Omega, 3 (6), p. 639-656.
127 Invention as a short-cut for Basic research → Applied research → Development.
128 A. D. Little (1963), Patterns and Problems of Technical Innovation in American Industry, Washington: National Science Foundation, p. 6.
129 US Department of Commerce (1967), Technological Innovation: Its Environment and Management, Washington: USGPO, p. 9.

The Making of Science, Technology…, 2009 61
commercial use; and diffusion was defined as the spread of innovation in industry. The sequence became a taken-for-granted “fact” in the OECD literature 130, and a classic proposition or “lesson” for research managers 131
CONCLUSION
.
The linear model of innovation as a conceptual framework was not a spontaneous invention arising from the mind of one individual (V. Bush). Rather, it developed over time in three steps. The first linked applied research to basic research, the second added experimental development, and the third added production and diffusion. These three steps correspond in fact to three scientific communities and their successive entries into the field of science studies and/or science policy, each with their own concepts. First were natural scientists (academic as well as industrial), developing a rhetoric on basic research as the source for applied research or technology; second were researchers from business schools, having been interested in science studies long before economists and studying the industrial management of research and the development of technologies; third were economists, bringing forth the concept of innovation into the discipline. All three communities got into the field by adding a term (their stamp) to the most primitive term – pure or basic research –and its sequence. The three steps also correspond to three phases of policy preoccupations or priorities: the public support to university research (basic research), the strategic importance of technology for industry (development), and the impact of research on the economy and society (diffusion).
130 OECD (1966), Government and Technical Innovation, Paris: OECD, p. 9. 131 J. R. Bright (1969), Some Management Lessons from Innovation
Research, Long Range Planning, 2 (1), p. 36-41. For an example of the use of the model in project evaluation, see: A. Albala (1975), Stage Approach for the Evaluation and Selection of R&D Projects, IEEE Transactions on Engineering Management, EM-22 (4), p. 153-164.

62 The Making of Science, Technology…, 2009
Despite its widespread use, the linear model of innovation was not without its opponents. In 1967, the Charpie report, an influential study by the US Department of Commerce on measuring the costs of innovation, estimated that research amounts to only 10% of the costs of innovation132. Briefly stated, innovation does not depend on either research or basic research specifically. Other “steps” are more important 133. The US Department of Defense also challenged the linear sequence. As we have seen with Anthony’s study conducted for the Department’s Research and Development Board, the Department of Defense was a pioneer in the use of the R&D categories, even developing its own classification of R&D activities and using the linear model to manage its programs 134. In the mid-1960s, however, the Department began to defect from its previous optimism regarding investments in basic research as a factor in innovation. The Department was, in a sense, beginning to question aspects of the linear model. It therefore conducted an eight-year analysis of twenty major weapons technologies, concluding that only 0.3% of innovation “events” came from “undirected science” 135. The National Science Foundation replied with its own study, and came to opposite conclusions. The organization found that 70% of the key events in the development of five recent technological innovations stemmed from basic research 136
132 US Department of Commerce, Technological Innovation: Its
Environment and Management, Washington: USGPO.
. These two studies, each carrying the
133 The numbers were based on a “rule of thumb”, and were widely criticized. See: E. Mansfield et al. (1971), Research and Innovation in the Modern Corporation, New York: Norton; H. Stead (1976), The Costs of Technological Innovation, Research Policy, 5: 2-9.
134 See: A. C. Lazure (1957), Why Research and Development Contracts are Distinctive, in A. C. Lazure and A. P. Murphy (eds.), Research and Development Procurement Law, Washington: Federal Bar Journal, p. 255-264.
135 US Department of Defense (1969), Project Hindsight Final Report, Office of the Director of Defense Research and Engineering, Washington.
136 IIT Research Institute (1968), Technology in Retrospect and Critical Events in Science (TRACES), Washington: NSF; Battelle Columbus Labs.

The Making of Science, Technology…, 2009 63
message of its respective community (industrialists in the case of Defense, scientists for the NSF) were among the first of a long series of debates on aspects of the linear model of innovation.
In the 1960s, academics also leveled criticisms concerning the linearity of the model 137. However, it was historians and histories of technology that proved the most productive and convincing: the literature documented the complex interrelationships between science and technology138, and developed the idea of technology-as-knowledge as a “substitute” for basic research in engineering 139
In a sense, we owe this persistent image the very simplicity of the model. The model is a rhetorical entity. It is a thought figure that simplifies and affords administrators and agencies a sense of orientation when it comes to thinking about allocation of funding to R&D. However, official statistics are as important in explaining the continued use of the linear model. By collecting numbers on research
. Despite these efforts, the linear model continued to feed public discourses and academic analyses – despite the widespread mention, in the same documents that used the model, that linearity was a fiction.
(1973), Interactions of Science and Technology in the Innovative Process: Some Case Studies, Washington: NSF
137 J. Schmookler (1966), Invention and Economic Growth, op. cit.; W. J. Price and L. W. Bass (1969), Scientific Research and the Innovative Process, Science, 164, 16 May, p. 802-806; S. Myers and D. G. Marquis (1969), Successful Industrial Innovation: A Study of Factors Underlying Innovation in Selected Firms, op. cit.
138 The journal Technology and Culture published several issues and articles on the topic from 1959 on. For early representatives of the discussions on the non-causality between science and technology, see: D. J. D. Price (1965), Is Technology Historically Independent of Science? A Study in Historiography, Technology and Culture, 6 (4), p. 553-568; M. Kranzberg (1968), The Disunity of Science-Technology, American Scientist, 56 (1), p. 21-34.
139 E. T. Layton (1974), Technology as Knowledge, Technology and Culture, 15 (1), p. 31-41. See also the collected papers of Vincenti in W. G. Vincenti (1990), What Engineers Know and How They Know It, Baltimore: Johns Hopkins University Press.

64 The Making of Science, Technology…, 2009
as defined by three components, and presenting and discussing these components one after the other within a linear framework, official statistics helped to crystallize the model as early as the 1950s. In fact, statistics on the three components of research were for a long time (and still are for many), the only available statistics allowing one to “understand” the internal organization of research, particularly within firms. Furthermore, as innovation came to define the science-policy agenda, statistics on R&D were seen as a legitimate proxy for measuring technological innovation because they included development (of new products and processes). Having become entrenched in discourses and policies with the help of statistics and methodological rules, the model became a “social fact”.
Recent efforts to modify or replace the model have been limited with regard to their impact. First, alternative models, with their multiple feedback loops140, look more like modern artwork or a “plate of spaghetti and meatballs” 141 than a useful analytical framework. Second, efforts to measure the new interactive models have not yet been fruitful, at least in the official literature: statistics and indicators on flows of knowledge between economic sectors, performers and users of research, and types of activities are still in the making 142
140 S. J. Kline (1985), Innovation is not a Linear Process, Research
Management, July-August, p. 36-45; R. Rothwell (1992), Successful Industrial Innovation: Critical Factors for the 1990s, R&D Management, 22, p. 221-239.
. Equally, very few accurate numbers on the costs of innovation have come from the official innovation surveys, at least not robust enough numbers to supplement R&D figures. All in all, the success of the linear model suggests how statistics are often required to give (long)
141 This is how Kelly et al. contrasted their “ecological” model to the linear model. See: P. Kelly, M. Kranzberg, F. A. Rossini, N. R. Baker, F. A. Tarpley and M. Mitzner (1975), Technological Innovation: A Critical Review of Current Knowledge, Volume 1, Advanced Technology and Science Studies Group, Georgia Tech, Atlanta, Georgia, Report submitted to the National Science Foundation, p. 33.
142 See chapters 8 and 9 below.

The Making of Science, Technology…, 2009 65
life to concepts, but also how their absence can be a limitation in changing analytical models and frameworks.


The Making of Science, Technology…, 2009 67
CHAPTER TWO
THE MAKING OF STATISTICAL STANDARDS: THE OECD FRASCATI MANUAL AND THE
ACCOUNTING FRAMEWORK
In the 1950s and 1960s, a new type of analysis appeared in the then-emerging field of science, technology and innovation studies: accounting exercises. The analyses were of two types. A first one was growth accounting. Economists developed different techniques, among them econometric equations, most of them based on the concept of labour productivity, to estimate the contribution of science and technology to economic growth. Among the forerunners were J. Schmookler and M. Abramovitz 1. In 1957, R. Solow formalized these analyses, using an equation called the production function 2
A second type of accounting analyses was national accounting. Here, academics measured the “costs” of science and technology and its share in the national income or budget. One influential such study was Machlup’s The Production and Distribution of Knowledge in the United States, published in 1962
. This is discussed below (chapters 3 and 4).
3
1 J. Schmookler (1952), The Changing Efficiency of the American
Economy, 1869-1938, Review of Economics and Statistics, 34, p. 214-231; M. Abramovitz (1956), Resource and Output Trends in the United States Since 1870, American Economic Review, 46, p. 5-23; J. Kendrick (1956), Productivity Trends, Capital and Labor, Review of Economics and Statistics, 38, p. 248-257.
, and discussed in Chapter 8 below. But there were public organizations involved in such types of analyses as well, among them the US National Science Foundation
2 R. Solow (1957), Technical Change and the Aggregate Production Function, Review of Economics and Statistics, 39, p. 312-320.
3 F. Machlup (1962), The Production and Distribution of Knowledge in the United States, Princeton: Princeton University Press.

68 The Making of Science, Technology…, 2009
and the OECD. From then on, accounting became a basic framework for policies for decades to come. It allowed identification of where research is conducted, what amount is invested, and for what purposes.
Accounting, as measurement of science, was quite different from the previous statistics produced from the 1860s onward. Then, what was measured were men of science, or scientists, and their output: knowledge, or scientific publications. J. M Cattell, an American psychologist and editor of Science from 1895 to 1944, was the first producer of systematic statistics on men of science, based on data from a directory he started publishing regularly in 19064. The systematic counting of scientific publications we also owe to psychologists. At the same time as Cattell, psychologists started collecting data on the discipline’s output, in order to contribute to the advancement of psychology as a science 5
Then costs, or money devoted to research activities, became the privileged statistics. This chapter looks at national accounting of science, and at the OECD Frascati manual as a major contributor to the field. Adopted by member countries in 1963, the manual is a methodological document for conducting surveys on research and development (R&D)
.
6. It suggests definitions, classifications and indicators for national statisticians in order to compile comparable statistics among countries. According to the OECD, the manual “has probably been one of the most influential documents issued by this Directorate (…)” 7
4 B. Godin (2007), From Eugenics to Scientometrics: Galton, Cattell and
Men of Science, Social Studies of Science, forthcoming.
. It allowed the collection of standardized statistics among several countries, and made possible, for the first time in
5 B. Godin (2006), On the Origins of Bibliometrics, Scientometrics, 68 (1), p. 109-133.
6 OECD (1962), The Measurement of Scientific and Technical Activities: Proposed Standard Practice for Surveys of Research and Development, DAS/PD/62.47. Hereafter cited as FM.
7 OECD (1979), Notes by the Secretariat on the Revision of the Frascati Manual, DSTI/SPR/79.37, p. iii.

The Making of Science, Technology…, 2009 69
history, international comparisons on science. The manual is now in its sixth edition (2002), and is the standard used in every national statistical office.
This paper shows what accounting for science owes to the manual, by looking at the manual’s first forty years of existence (1962-2002). From its very beginning, science policy was defined according to the anticipated economic benefits of science. To contribute to this end, the Frascati manual offered a statistical, or accounting, answer to three policy questions or issues of the time: the allocation of resources (how much should government invest in science), the balance between choices or, priorities (where to invest), and efficiency (what are the results).
The first part of this chapter traces the origins of national accounting for scientific activities. It discusses the main 20th century developments leading up to the Frascati manual. The second part looks at the manual’s central statistic for allocating resources to science – Gross Expenditures on R&D (GERD) – and discusses what goes into the measurement. The third part looks at the use of statistics to “balance” the science budget, while the last part looks at efficiency. This last part suggests that, although the Frascati manual was entirely devoted to measuring inputs, this was only the first stage toward input/output analyses, or measuring the efficiency of science, technology and innovation.
NATIONAL ACCOUNTING
National accounting for science is part of a larger movement. National accounting for the economy appeared in England at the end of the 17th century. Using data from various sources, among them population figures and tax records, William Petty and Gregory King produced the first estimates of national “income of the people”. The aims were twofold: calculate the taxable capacity of the nation and effect policies, and compare the material strength or wealth of the country to that of rival nations. The two authors would soon be

70 The Making of Science, Technology…, 2009
followed by others, first of all in England, but also in other countries like France (P. Boisguilbert, M. Vauban).
Prior to World War II, such exercises were mainly conducted by individual investigators 8. Then in 1932, with the impetus of the Great Depression and the need to devise macroeconomic policy, the US Congress gave the Department of Commerce a mandate to prepare a comprehensive set of national accounts. Economist Simon Kuznets, who had done considerable work with the National Bureau of Economic Research’s early national accounting exercises in the 1920s, set the basic framework for what became the System of National Accounts9. Similar works in Great Britain, conducted by Richard Stone10 led to a standardized system conventionalized by international organizations like the United Nations and the OEEC (Organization for European Economic Co-Operation), the predecessor to the OECD, and used in most countries of the world 11
8 See: P. Deane (1955), The Implications of Early National Income
Estimates for the Measurement of Long-Term Economic Growth in the United Kingdom, Economic Development and Cultural Change, 4 (1), Part I, p. 3-38; P. Studenski (1958), The Income of Nations: Theory, Measurement, and Analysis, Past and Present, New York: New York University Press; N. Ruggles and R. Ruggles (1970), The Design of Economic Accounts, National Bureau of Economic Research, New York: Columbia University Press; J. W. Kendrick (1970), The Historical Development of National-Income Accounts, History of Political Economy, 2 (1), p. 284-315; A. Sauvy (1970), Histoire de la comptabilité nationale, Économie et Statistique, 14, p. 19-32; C. S. Carson (1975), The History of the United States National Income and Product Accounts: the Development of an Analytical Tool, Review of Income and Wealth, 21 (2), p. 153-181; F. Fourquet (1980), Les comptes de la puissance, Paris: Encres; A. Vanoli (2002), Une histoire de la comptabilité nationale, Paris: La Découverte.
.
9 S. S. Kuznets (1941), National Income and its Composition, 1919-1938, New York: National Bureau of Economic Research.
10 On the contribution of Stone, see: T. Suzuki (2003), The Epistemology of Macroeconomic Reality: the Keynesian Revolution from an Accounting Point of View, Accounting, Organizations and Society, 28, p. 471-517.
11 The system of national accounts, now in its fourth edition, was developed in the early 1950s and conventionalized at the world level by the United

The Making of Science, Technology…, 2009 71
While early national accounting exercises focused on measuring incomes, the System of National Accounts also collects information on the production (value) of goods and services in a country, and their consumption. As C. S. Carson suggested, the central question for government with regard to the development of the accounts during the 1940s was: “Given government expenditures, how much of the total product will be left for civilian consumption?”12
The System of National Accounts is a representation of the economic activity as production and circulation. Such a representation was first suggested by the French physiocrat F. Quesnay in 1758, and came to be framed into an accounting model (the exemplar of which is the firm) in the 20th century. The measurement of science, technology and innovation has adopted this framework to a significant degree. Since the 1950s, official statistics on science, technology and innovation have been collected and presented in an accounting framework. The emblematic model for such an understanding is the OECD Frascati manual. The manual offers national statisticians definitions, classifications and methodologies for measuring the expenditures and human resources devoted to R&D.
. The focus on products had consequences on estimates of the national wealth: production was restricted to material production and to marketed (prices) production. This produced the indicator known as Gross National Product (GNP).
How did an accounting framework get into science, technology and innovation? Official statistics on R&D started to be collected in the early 1920s in the United States, then in Canada and Great Britain 13
Nations: United Nations (1953), A System of National Accounts and Supporting Tables, Department of Economic Affairs, Statistical Office, New York; OEEC (1958), Standardized System of National Accounts, Paris.
. Before the 1950s, official measurement of R&D was usually
12 C. S. Carson (1975), The History of the United States National Income and Product Accounts, op. cit., p. 169.
13 B. Godin (2005), Measurement and Statistics on Science and Technology: 1920 to the Present, London: Routledge.

72 The Making of Science, Technology…, 2009
conducted piecemeal. Organizations surveyed either industrial or government R&D, for example, but very rarely aggregated the numbers to compute a “national research budget”. The first such efforts arose in Great Britain and the United States, and were aimed at assessing the share of expenditures that should be devoted to science (and basic science) compared to other economic activities, and at helping to build a case for increased R&D resources.
The British scientist J. D. Bernal was one of the first academics to perform measurement of science expenditures in a Western country. He was also one of the first to figure out how much was spent nationally on R&D – the budget of science, as he called it. In The Social Function of Science (1939), Bernal estimated the money devoted to science in the United Kingdom using existing sources of data: government budgets, industrial data (from the Association of Scientific Workers) and University Grants Committee reports14. He had a hard time compiling the budget, however, because “the sources of money used for science do not correspond closely to the separate categories of administration of scientific research” 15. “The difficulties in assessing the precise sum annually expended on scientific research are practically insurmountable. It could only be done by changing the method of accounting of universities, Government Departments, and industrial firms” 16. The national science budget was nevertheless estimated at about four million pounds for 1934, and Bernal added: “The expenditure on science becomes ludicrous when we consider the enormous return in welfare which such a trifling expenditure can produce”17
Bernal also suggested a type of measurement that became the main indicator on science, technology and innovation: the research budget as a percentage of the national income. He compared the UK’s
.
14 J. D. Bernal (1939) [1973], The Social Function of Science, Cambridge
(Mass.): MIT Press, p. 57-65. 15 Ibid., p. 57. 16 Ibid., p. 62. 17 Ibid., p. 64.
The Making of Science, Technology…, 2009 73
performance with that of the United States and the USSR, and suggested that Britain should devote between one-half percent and one percent of its national income to research 18. The number was arrived at by comparing expenditures in other countries, among them the United States, which invested 0.6%, and the Soviet Union, which invested 0.8%, while Great Britain spent only 0.1%. “This certainly seems a very low percentage and at least it could be said that any increase up to tenfold of the expenditure on science would not notably interfere with the immediate consumption of the community; as it is it represents only 3% of what is spent on tobacco, 2% of what is spent on drink, and 1% of what is spent on gambling in the country” 19. “The scale of expenditure on science is probably less than one-tenth of what would be reasonable and desirable in any civilized country” 20
The source of Bernal’s idea is probably a very early calculation made by British economist L. Levi in 1869
.
21
18 Ibid., p. 65.
. Using data from a circular sent to British scientific societies, Levi computed a ratio of incomes of scientific societies to national income of 0.04%. Another such calculation before Bernal was that of E. B. Rosa, chief scientists at the US Bureau of Standards. In 1920, Rosa compiled, for the first time in American history, a government budget for “research-
19 Ibid., p. 64. Already in 1914, J. M. Cattell, editor of Science, offered a similar rationale: “Over a billion dollars a year are spent in the United States on the drinking of alcohol and its consequences, a comparable amount on prostitution and its ensuing diseases. We devote twice as much money to each of these destructive agencies as to our entire educational work. Pleasure automobiles or moving-picture shows cost each year more than the support of the teachers in all our schools. The national wealth is ample to double the salary of every teacher (…)” (p. 161-162). See J. M. Cattell (1914), Science, Education and Democracy, Science, 39 (996), January 30, p. 154-164.
20 J. D. Bernal (1939), The Social Function of Science, op. cit., p. 65. 21 L. Levi (1869), On the Progress of Learned Societies, Illustrative of the
Advancement of Science in the United Kingdom during the Last Thirty Years, in Report of the 38th Meeting of the British Association for the Advancement of Science (1868), London: John Murray, p. 169-173.

74 The Making of Science, Technology…, 2009
education-development” 22. Rosa estimated that government’s expenditures on research amounted to 1% of the federal budget. In the following year, J. M. Cattell, editor of Science, would use the ratio (1%) in his crusade for the advancement of science 23. In the next decades, variants of the ratio took on names like research intensity, then technology intensity 24
The next experiment toward estimating a national budget was conducted in the United States by V. Bush in his well-known report to the President titled Science: The Endless Frontier
.
25. Primarily using existing data sources, the Bowman committee – one of the four committees involved in the report – estimated the national research budget at $345 million (1940). These were very rough numbers, however: “since statistical information is necessarily fragmentary and dependent upon arbitrary definition, most of the estimates are subject to a very considerable margin of error” 26. The committee showed that industry contributed by far the largest portion of the national research expenditure, but calculated that the government’s expenditure expanded from $69 million in 1940 to $720 million in 1944. It also documented how applied, rather than basic, research benefited most from the investments (by a ratio of 6 to 1), and developed a rhetoric arguing that basic research deserved more resources from government 27
22 E. B. Rosa (1921), Expenditures and Revenues of the Federal
Government, Annals of the American Academy of Political and Social Sciences, 95, May, p. 26-33. See also: E. B. Rosa (1920), Scientific Research: The Economic Importance of the Scientific Work of the Government, Journal of the Washington Academy of Science, 10 (12), p. 341-382.
.
23 J. M. Cattell (1922), The Organization of Scientific Men, The Scientific Monthly, June, p. 568-578.
24 See Chapter 5 below. 25 V. Bush (1945) [1995], Science: The Endless Frontier, North Stratford:
Ayer Co., p. 85-89. 26 Ibid., p. 85. 27 B. Godin (2003), Measuring Science: Is There Basic Research Without
Statistics?, Social Science Information, 42 (1), p. 57-90.

The Making of Science, Technology…, 2009 75
The committee added data on national income in its table on total expenditures, and plotted R&D per capita of national income on a graph. But nowhere did the committee use the data to compute the research budget as a percentage of national income, as Bernal had. It was left to the US President’s Scientific Research Board to innovate in this respect. In 1947, at the request of the US President, the Board published its report Science and Public Policy, which estimated, for the second time in as many years, a national R&D budget 28. With the help of a questionnaire it sent to 70 industrial laboratories and 50 universities and foundations, the Board in fact conducted the first survey of resources devoted to R&D using precise categories, although these did not make it “possible to arrive at precisely accurate research expenditures” because of the different definitions and accounting practices employed by institutions29
Based on the numbers obtained in the survey, the Board proposed quantified objectives for science policy. For example, it suggested that resources devoted to R&D be doubled in the next ten years, and that resources devoted to basic research be quadrupled. The Board also introduced into science policy the indicator first suggested by Bernal, and that is still used by governments today: R&D expenditures as a percentage of national income. Unlike Bernal however, the Board did not explain how it arrived at a 1% goal for 1957. Nevertheless, President Truman subsequently incorporated this
. The Board estimated the US budget at $600 million (annually) on average for the period 1941-45. For 1947, the budget was estimated at $1.16 billion. The federal government was responsible for 54% of total R&D expenditures, followed by industry (39%) and universities (4%).
28 US President’s Scientific Research Board (1947), Science and Public
Policy, President’s Scientific Research Board, Washington: USGPO, p. 9. 29 Ibid., p. 73.

76 The Making of Science, Technology…, 2009
objective into his address to the American Association for the Advancement of Science (AAAS) in 194830
The last exercise in constructing a total R&D figure before the US National Science Foundation, as official producer of statistics on science, technology and innovation, entered the scene, came from the US Department of Defense in 1953
.
31. Using many different sources, the Office of the Secretary of Defense for R&D estimated that $3.75 billion, or over 1% of the Gross National Product, was spent on research funds in the United States in 1952. The report presented data regarding both sources of expenditures and performers of work: “The purpose of this report is to present an over-all statistical picture of present and past trends in research, and to indicate the relationships between those who spend the money [funders] and those who do the work [performers]”. The Office’s concepts of sources (of funds) and performers (of research activities) would soon become the main categories of the National Science Foundation’s accounting system for R&D. The statistics showed that, as sources of funds, the federal government was responsible for 60% of the total 32
Then came the National Science Foundation. According to its mandate, the organization started measuring R&D across all sectors of the economy with specific and separate surveys in 1953: government, industry, university and non-profit
, industry 38% and non-profit institutions (including universities) 2%. With regard to the performers, industry conducted the majority of R&D (68%) – and half of this work was done for the federal government – followed by the federal government itself (21%) and non-profit institutions and universities (11%).
33
30 H. S Truman (1948), Address to the Centennial Anniversary, AAAS
Annual Meeting, Washington.
. Then, in 1956, it
31 Department of Defense (1953), The Growth of Scientific R&D, Office of the Secretary of Defense (R&D), RDB 114/34, Washington.
32 The Department of Defense and the Atomic Energy Commission were themselves responsible for 90% of the federal share.
33 B. Godin (2002), The Number Makers: Fifty Years of Science and Technology Official Statistics, Minerva, 40 (4), p. 375-297; B. Godin

The Making of Science, Technology…, 2009 77
published its “first systematic effort to obtain a systematic across-the-board picture” 34 – one year before Great Britain did 35. It consisted of the sum of the results of the sectoral surveys for estimating national funds36. The National Science Foundation calculated that the national budget amounted to $5.4 billion in 1953 37
The organization’s analyses made extensive use of gross national product (GNP). To the National Science Foundation, this was its way to relate R&D to economic output: “despite the recognition of the influence of R&D on economic growth, it is difficult to measure this effect quantitatively”, stated the National Science Foundation
.
38. Therefore, this “analysis describes the manner in which R&D expenditures enter the gross national product in order to assist in establishing a basis for valid measures of the relationships of such expenditures to aggregate economic output”39. The ratio of research funds to GNP was estimated at 1.5% for 1953, 2.6% for 1959 and 2.8% for 1962. The NSF remained careful, however, with regard to interpretation of the indicator: “Too little is presently known about the complex of events to ascribe a specified increase in gross national product directly to a given R&D expenditure”40
(2003), The Emergence of S&T Indicators: Why did Governments Supplement Statistics with Indicators?, Research Policy, 32 (4), p. 679-691.
.
34 National Science Foundation (1956), Expenditures for R&D in the United States: 1953, Reviews of Data on R&D, 1, NSF 56-28, Washington.
35 Advisory Council on Scientific Policy (1957), Annual Report 1956-57, Cmnd 278, HMSO: London.
36 The term “national” appeared for the first time only in 1963. See: National Science Foundation (1963), National Trends in R&D Funds, 1953-62, Reviews of Data on R&D, 41, NSF 63-40.
37 The data were preliminary and were revised in 1959. See: National Science Foundation (1959), Funds for R&D in the United States, 1953-59, Reviews of Data on R&D, 16, NSF 59-65.
38 National Science Foundation (1961), R&D and the GNP, Reviews of Data on R&D, 26, NSF 61-9, p. 2.
39 Ibid., p. 1. 40 Ibid., p. 7.

78 The Making of Science, Technology…, 2009
In the same publication, the National Science Foundation innovated in another way over previous attempts to estimate the national budget. Using the Department of Defense categories, the organization constructed a matrix of financial flows between the sectors, as both sources and performers of R&D (Table 1). Of sixteen possible financial relationships (four sectors as original sources, and also as ultimate users), ten emerged as significant (major transactions). The matrix showed that the federal government sector was primarily a source of funds for research performed by all four sectors, while the industry sector combined the two functions, with a larger volume as performer. Such tables were thereafter published regularly in the National Science Foundation bulletin series Reviews of Data on R&D 41, until a specific and more extensive publication appeared in 1967 42
The matrix was the result of deliberations on the US research system conducted in the mid-fifties at the National Science Foundation
.
43 and of demands to relate science and technology to the economy: “An accounting of R&D flow throughout the economy is of great interest at present (…) because of the increasing degree to which we recognize the relationship between R&D, technological innovation, economic growth and the economic sectors (…)”, suggested H. E. Stirner from the Operations Research Office at Johns Hopkins University44
41 Reviews of R&D Data, Nos. 1 (1956), 16 (1959), 33 (1962), 41 (1963);
Reviews of Data on Science Resources, no. 4 (1965).
. But “today, data on R&D funds and personnel are
42 National Science Foundation (1967), National Patterns of R&D Resources, NSF 67-7, Washington.
43 “Our country’s dynamic research effort rests on the interrelationships – financial and non-financial – among organizations” stated K. Arnow. See K. Arnow (1959), National Accounts on R&D: The National Science Foundation Experience, in National Science Foundation, Methodological Aspects of Statistics on Research and Development: Costs and Manpower, NSF 59-36, Washington, p. 57.
44 H. E. Stirner (1959), A National Accounting System for Measuring the Intersectoral Flows of R&D Funds in the United States, in National

The Making of Science, Technology…, 2009 79
perhaps at the stage of growth in which national income data could be found in the 1920s”45. Links with the System of National Accounts were therefore imagined: “The idea of national as well as business accounts is a fully accepted one. National income and product, money flows, and inter-industry accounts are well-known examples of accounting systems which enable us to perform analysis on many different types of problems. With the development and acceptance of the accounting system, data-gathering has progressed at a rapid pace” 46
Science Foundation, Methodological Aspects of Statistics on R&D: Costs and Manpower, op. cit., p. 37.
.
45 K. Arnow (1959), National Accounts on R&D: The National Science Foundation Experience, in National Science Foundation, Methodological Aspects of Statistics on R&D: Costs and Manpower, op. cit., p. 61.
46 H. E. Stirner (1959), A National Accounting System for Measuring the Intersectoral Flows of R&D Funds in the United States, in National Science Foundation, Methodological Aspects of Statistics on R&D: Costs and Manpower, op. cit., p. 32.

80 The Making of Science, Technology…, 2009
Table 5. Transfers of Funds Among the Four Sectors as Sources of R&D Funds and as R&D Performers, 1953 (in
millions)
R&D PERFORMERS Sector Federal
Government Industry Colleges/
universities Other
institutions Total
SOURCES of R&D FUNDS Federal Government agencies
$970 $1,520 $280 $50 $2,810
Industry 2,350 20 2,370 Colleges/ universities
130 130
Other institutions
30 20 50
Total $970 $3,870 $460 $70 $5,370
The National Science Foundation methodological guidelines – as well as the matrix – became international standards with the adoption of the OECD methodological manual by member countries in Frascati (Italy) in 1963.
THE FRASCATI MANUAL
The Frascati manual is a methodological document aimed at national statisticians for collecting and framing the data on R&D. It proposes standardized definitions, classifications and a methodology for conducting R&D surveys. The first edition was prepared by British economist C. Freeman from the National Institute of Economic and Social Research (London), who was assigned at the time to improving the survey on industrial R&D conducted by the Federation of British Industries (FBI). Freeman was recommended as expert to the OECD by E. Rudd, from the British Department of Scientific and Industrial Research (DSIR). He visited the main countries where

The Making of Science, Technology…, 2009 81
measurements were conducted. The manual owes a great deal to the National Science Foundation and its series of surveys in the early 1950s47
The Frascati manual essentially developed three sets of guidelines. Firstly, norms were proposed for defining science as “systematic” research and demarcating research from other activities so these other activities could be excluded: research/related scientific activities, development/production, research/teaching. Secondly, the manual suggested classification of research activities according to 1) the sector that finances or executes the research: government, university, industry or non-profit organizations and, in relation to this latter dimension, 2) the type or character of the research, which is either basic, applied or concerned with the development of products and processes, 3) the activities classified by discipline in the case of universities (and non-profit organizations), by industrial sector or product in the case of firms, and by functions or socioeconomic objectives in the case of governments. Finally, the manual suggested a basic statistic as an indicator for policy targets.
.
Accounting for Science
The Frascati manual suggests collecting two types of statistics: the financial resources invested in R&D, and the human resources devoted to research activities. The main indicator to come out of the manual is Gross Domestic Expenditures on R&D (GERD) – the sum of R&D expenditures in the four main economic sectors: business, university, government and non-profit 48
47 This is admitted in the first edition, FM (1962), p. 7.
. The manual’s specifications also allow one to follow the flow of funds between sectors (by way of a matrix), specifically between funders and performers of R&D, as the National Science Foundation had already suggested.
48 The measure includes R&D funded from abroad, but excludes payments made abroad.

82 The Making of Science, Technology…, 2009
GERD is the term invented by the OECD for measuring what was, before the 1960s, called national funds or budget49. In line with the System of National Accounts, and following the National Science Foundation, the manual recommended summing R&D according to the main economic sectors of the system of national accounts: business, government and private non-profit 50, to which the OECD, following the NSF again, added a fourth one: higher education. The following rationale was offered for the decision51
The definitions of the first three sectors are basically the same as in national accounts, but higher education is included as a separate main sector here because of the concentration of a large part of fundamental research activity in the universities and the crucial importance of these institutions in the formulation of an adequate national policy for R&D.
:
Why align R&D statistics with the system of national accounts? The first edition of the OECD Frascati manual stated that the classification of R&D data by economic sector “corresponds in most respects to the definitions and classifications employed in other statistics of national income and expenditure, thus facilitating comparison with existing statistical series, such as gross national product, net output, investment in fixed assets and so forth”52
When the system of national accounts, now in its fourth edition, was developed in the early fifties and conventionalized at the world level by the United Nations, R&D was not recognized as a category of expenditures that deserved a specific mention in the national
.
49 FM (1962), p. 34-36. 50 Households, that is, the sector of that name in the system of national
accounts, was not considered by the manual. 51 FM (1962), p. 22. 52 FM (1962), p. 21.

The Making of Science, Technology…, 2009 83
accounts53. In 1993 again, during the last revision of the system of national accounts, the United Nations rejected the idea of recognizing R&D “because it was felt that it opened the door to the whole area of intangible investment” 54. It decided instead to develop a functional classification of expenditures that would make items such as R&D visible in the system of national accounts by way of what was called “satellite accounts”. However, R&D is not part of the accounting system of nations, despite the many efforts of statisticians for whom “being part of the National Accounts [would] raise the importance and visibility of R&D statistics and statisticians”55. Despite its alignment with the system of national accounts, the Frascati manual still uses a different system of classification in a number of cases, including, for example, the coverage of each economic sector 56
The GERD, as statistics on national research, remains fragile. The first edition of the Frascati manual suggested that national “variations [in R&D statistics] may be gradually reduced” with standardization
.
57
53 Only institutions primarily engaged in research are singled out as a
separate category.
. But the collection of statistics on R&D expenditures still remains a very difficult exercise: not all units surveyed have an accounting system to track the specific expenses defined as composing R&D. The OECD regularly has to adjust or estimate national data to correct discrepancies. It also started a series called Sources and Methods, documenting national differences with regard to OECD standards. It finally developed a whole system of
54 J. F. Minder (1991), R&D in National Accounts, OECD, DSTI/STII (91) 11, p. 3.
55 OECD (2003), Summary Record of the Working Party of NESTI, OECD/EAS/STP/NESTI/M (2003) 2, p. 4. The current revision of the system promises some changes, however.
56 S. Peleg (2000), Better Alignment of R&D Expenditures as in Frascati Manual with Existing Accounting Standards, OECD/EAS/STP/NESTI (2000) 20; OECD (2001), Better Alignment of the Frascati Manual with the System of National Accounts, DSTI/EAS/STP/NESTI (2001)14/PART8.
57 FM (1962), p. 6.

84 The Making of Science, Technology…, 2009
footnotes, allowing for the construction of comparable data among member countries, while black-boxing the data’s limitations 58
This is the case for R&D in the higher education sector. In the 1970s, the OECD launched a series of studies on its international surveys of R&D
. Consequently, what one observes is increasing reliance with time on what official statisticians would call “sub-optimal” (or non-survey) techniques of measurement in member countries, to the point that the Frascati manual has started “standardizing” these techniques.
59. After having analyzed the data, the OECD refused to publish the report devoted to university R&D 60, the data being qualified as “rather unsatisfactory” because of “serious conceptual and practical problems” that prevented reliable international comparisons61. How, for example, could a country spend twice as much as another on university research and yet report similar numbers of university personnel involved in R&D? Why did expenditures on basic research differ by a ratio of 1 to 2 between otherwise similar countries? The sources of the discrepancies were 62
58 B. Godin (2005), Metadata: How Footnotes Make for Doubtful Numbers,
op. cit.
: the coverage of the university
59 The OECD does not conduct surveys among performers of R&D, but rather collects the data from national sources. OECD (1971), R&D in OECD Member Countries: Trends and Objectives; OECD (1975), Patterns of Resources Devoted to R&D in the OECD Area, 1963-1971; OECD (1975), Changing Priorities for Government R&D: An Experimental Study of Trends in the Objectives of Government R&D Funding in 12 OECD Member Countries, 1961-1972; OECD (1979), Trends in Industrial R&D in Selected OECD Countries, 1967-1975; OECD (1979), Trends in R&D in the Higher Education Sector in OECD Member Countries Since 1965 and Their Impact on National Basic Research Efforts, SPT (79) 20.
60 OECD (1979), Trends in R&D in the Higher Education Sector in OECD Member Countries Since 1965 and Their Impact on National Basic Research Efforts, op. cit.
61 Ibid., p. 1. 62 Some of these were already well identified as early as 1969. See: OECD
(1969), The Financing and Performance of Fundamental Research in the OECD Member Countries, DAS/SPR/69.19, p. 4. See B. Godin (2005), Is

The Making of Science, Technology…, 2009 85
sector differed according to country (some institutions, like university hospitals and national research councils, were treated differently); estimates were used in place of surveys because they were cheaper, and coefficients derived from the estimates were little more than informed guesswork and were frequently out-of-date; general university funds were attributed either to the funder or to the performer; the level of aggregation (fields of science classification) was generally not detailed enough to warrant analysis; finally, there was a great deal of subjectivity involved in classifying research activities, according to a basic/applied scheme that was “no longer used in certain countries, although policy makers still persist in requesting such data in spite of its many shortcomings” 63
These difficulties led to a small study of national methods for measuring resources devoted to university research in 1981
.
64, updated in 1983 65, a workshop on the measurement of R&D in higher education in 1985 66 and, as a follow-up, a supplement to the Frascati manual in 1989 67
There Basic Research Without Statistics, in Measurement and Statistics on Science and Technology, op. cit.
, which was later incorporated into the manual as Appendix 3. The supplement recommended norms for coverage of the university sector, the activities and types of costs to be included in research, and the measurement of R&D personnel. However, subsequent editions of the Frascati manual “authorized” national estimates of R&D expenditures based on techniques that the
63 OECD (1986), Summary Record of the OECD Workshop on Science and Technology Indicators in the Higher Education Sector, DSTI/SPR/85.60, p. 24.
64 OECD (1981), Comparison of National Methods of Measuring Resources Devoted to University Research, DSTI/SPR/81.44.
65 OECD (1984), Comparison of National Methods of Measuring Resources Devoted to University Research, DSTI/SPR/83.14.
66 OECD (1985), Summary Record of the OECD Workshop on Science and Technology Indicators in the Higher Education Sector, DSTI/SPR/85.60.
67 OECD (1989), The Measurement of Scientific and Technical Activities: R&D Statistics and Output Measurement in the Higher Education Sector, Paris.

86 The Making of Science, Technology…, 2009
unpublished report had disqualified 68
This was only the first example of deviating from the norm concerning the survey as the preferred instrument
. Estimates were used in place of surveys because they were cheaper, but coefficients derived from the estimates were little more than informed guesswork and were frequently out-of-date.
69. Government R&D was a second example. The OECD began collecting data on socioeconomic objectives of government funded R&D in the early 1970s, and introduced corresponding standards in the third edition of the Frascati manual (1975)70. The method was in fact supplied by the European Commission. A work group of European statisticians was set up as early as 1968 by the Working Group on Scientific and Technical Research Policy in order to study central government funding of R&D. The purpose was to “indicate the main political goals of government when committing funds to R&D” 71. The implicit goal was to contribute to the “construction” of a European science policy and budget. To this end, in 1969 the Commission adopted the Nomenclature for the Analysis and Comparison of Science Programmes and Budgets (NABS) 72
68 FM (1993), p. 146ss.
produced by the a
69 While a certain amount of R&D data can be derived from published sources, there is no substitute for a special R&D survey”, stated the manual. See FM (1981), p. 22.
70 The first two editions of the Frascati manual included preliminary and experimental research classifications.
71 Eurostat (1991), Background Information on the Revision of the NABS, Room document to the Expert Conference to Prepare the Revision of the Frascati Manual for R&D Statistics, OECD.
72 The first NABS was issued in 1969 and revised in 1975 (and included in the 1980 edition of the Frascati Manual) and again in 1983 (to include biotechnology and information technology, not as categories, but broken down across the whole range of objectives). In 1993, improvements were made in the Environment, Energy, and Industrial Production categories.

The Making of Science, Technology…, 2009 87
working group, and published a statistical analysis based on the classification 73
In line with the spirit of the OECD Brooks report, which had argued for changes in the objectives of government-funded R&D
.
74, the OECD Directorate for Science, Technology and Industry (DSTI) adopted the European Commission’s approach to obtaining appropriate statistics 75. However, few governments actually conducted surveys of government R&D 76. Most preferred to work with budget documents because, although less detailed and accurate than a survey, the information was easier and cheaper to obtain 77. Among the methodology’s advantages was speed, since the data were extracted directly from budget documents without having to wait for a survey. But it also had several limitations 78
73 CEC (1970), Research and Development: Public Financing of R&D in
the European Community Countries, 1967-1970, BUR 4532, Brussels.
, among them the fact that national data relied on different methodologies and concepts, and on different administrative systems. With regard to the classification of expenses, it reflected the intention to spend, and not actual expenditures. Furthermore, data were difficult to extract from budgets because they lacked the required level of detail: “the more detailed
74 OECD (1972), Science, Growth and Society, Paris. 75 The first OECD (experimental) analysis of data by socioeconomic
objective was published in 1975: OECD (1975), Changing Priorities for Government R&D: An Experimental Study of Trends in the Objectives of Government R&D Funding in 12 OECD Member Countries, 1962-1972, op. cit.
76 Exceptions were Canada and the United Kingdom. Other countries either produced text analysis of budgets or estimate appropriations from budget documents. For methodologies used in European countries, see: Eurostat (1995), Government R&D Appropriations: General University Funds, DSTI/STP/NESTI/SUR (95) 3, p. 2-3.
77 Eurostat (2000), Recommendations for Concepts and Methods of the Collection of Data on Government R&D Appropriations, DSTI/EAS/STP/NESTI (97) 10, p. 3.
78 Eurostat (2000), The Frascati Manual and Identification of Some Problems in the Measurement of GBAORD, DSTI/EAS/STP/NESTI (2000) 31.

88 The Making of Science, Technology…, 2009
the questions are, the less accurate the data become” because it was not always possible to define the specific NABS sub-level in the budget since budget items can be quite broad79. Finally, OECD statisticians were also confronted with a wide diversity of budgetary and national classification systems in member countries, systems over which they had relatively little control 80
The unit classified varied considerably between countries (…) because national budget classification and procedures differ considerably. In some countries, such as Germany, the budget data are available in fine detail and can be attributed accurately between objectives. In others, such as the United Kingdom and Canada, the budgetary data are obtained from a survey of government funding agencies which is already based on an international classification. However, in others again such as France, the original series are mainly votes by ministry or agency.
:
To better harmonize national practices, a draft supplement to the Frascati manual specifically devoted to measurement of the socioeconomic objectives of government R&D was completed in 1978 81, but it was never issued as a separate publication. These data “play only a modest role in the general battery of science and technology indicators and do not merit a separate manual” stated the OECD 82
79 OECD (2000), The Adequacy of GBAORD Data, DSTI/EAS/STP/NESTI
(2000) 18, p. 3.
. Instead of being put in a separate manual, the specifications
80 OECD (1990), Improving OECD Data on Environment-Related R&D, DSTI/IP (90) 25, p. 9.
81 OECD (1978), Draft Guidelines for Reporting Government R&D Funding by Socio-Economic Objectives: Proposed Supplement to the Frascati Manual, DSTI/SPR/78.40.
82 OECD (1991), Classification by Socio-Economic Objectives, DSTI/STII (91) 19, p. 9.

The Making of Science, Technology…, 2009 89
were abridged and included within a chapter in the fourth edition of the Frascati manual 83
All in all, the GERD is not really a national budget, but “a total constructed from the results of several surveys each with its own questionnaire and slightly [one could rather say very] different specifications”
.
84. Some data come from a survey (industry), others are estimated using different mathematical formulas (university), still others are proxies (government). For this reason, “The GERD, like any other social or economic statistic, can only be approximately true (…). Sector estimates probably vary from 5 to 15% in accuracy. The GERD serves as a general indicator of science and technology and not as a detailed inventory of R&D (…). It is an estimate and as such can show trends”85
Nonetheless, according to a recent survey by the OECD Secretariat, GERD is currently the most cherished indicator among OECD member countries
.
86, despite the age-old suggestion that human resources are a better statistic 87
83 In 1991, Australia again proposed that there should be a supplement to
the manual dealing with detailed classification by socioeconomic objective and by field of science. See: OECD (1992), Summary Record of the Meeting of NESTI, DSTI/STII/STP/NESTI/M (92) 1.
. Over the last fifty years, the
84 D. L. Bosworth, R. A. Wilson and A. Young (1993), Research and Development, Reviews of United Kingdom Statistical Sources Series, vol. XXVI, London: Chapman and Hill, p. 29.
85 Statistics Canada (2002), Estimates of Total Expenditures on R&D in the Health Fields in Canada, 1988 to 2001, 88F0006XIE2002007.
86 OECD (1998), How to Improve the MSTI: First Suggestions From Users, DSTI/EAS/STP/NESTI/RD (98) 9.
87 R. N. Anthony (1951), Selected Operating Data: Industrial Research Laboratories, Harvard Business School, Division of Research, Boston, p. 3-4: “In view of these difficulties [accounting methods and definitions], we decided to collect only a few dollar figures (…) and to place most of our emphasis on the number of persons”; W. H. Shapley (1959), Problems of Definition, Concept, and Interpretation of R&D Statistics, in National Science Foundation, Methodological Aspects of Statistics on R&D: Costs and Manpower, op. cit. p. 13: “Manpower rather than dollars may be a preferable and more meaningful unit of

90 The Making of Science, Technology…, 2009
indicator has been used for several purposes, from rhetorically displaying national performance to lobbying for more funds for science to setting policy targets. The OECD was responsible for this worldwide popularization of the indicator. The organization was also an ardent promoter of the GERD/GDP ratio as policy target. In fact, the American GERD/GDP ratio of the early 1960s, that is 3%, was mentioned in the first paragraphs of the first edition of the Frascati manual, and became the ideal to which member countries would aspire 88. In every OECD statistical publication, the indicator was calculated, discussed, and countries ranked according to it, because “it is memorable” 89, and is “the most popular one at the science policy and political levels, where simplification can be a virtue” 90
measurement”; C. Freeman (1962), Research and Development: A Comparison Between British and American Industry, National Institute Economic Review, 20, May, p. 24: “The figures of scientific manpower are probably more reliable than those of expenditures”; C. Falk, and A. Fechter (1981), The Importance of Scientific and Technical Personnel Data and Data Collection Methods Used in the United States, Paper presented for the OECD Workshop on the Measurement of Stocks of Scientific and Technical Personnel, October 12-13, 1981, p. 2: “At the current time scientific and technical personnel data seem to be the only feasible indicator of overall scientific and technical potential and capability and as such represent a most valuable, if not essential, tool for S&T policy formulation and planning”.
.
88 FM (1963), p. 5. In fact, at the time of the first edition of the Frascati manual, the US GERD/GDP was 2.8%. See: National Science Foundation (1962), Trends in Funds and Personnel for R&D, 1953-61, Reviews of Data on R&D, 33, NSF 62-9, Washington; National Science Foundation (1963), National Trends in R&D Funds, 1953-62, Reviews of Data on R&D, 41, NSF 63-40.
89 OECD (1984), Science and Technology Indicators, Paris, p. 26. 90 OECD (1992), Science and Technology Policy: Review and Outlook
1991, Paris, p. 111. The French translation is interesting, and reads as follows: “le plus prisé parmi les responsables de la politique scientifique et des hommes politiques, pour lesquels la simplification se pare parfois de certaines vertus” (p. 119).

The Making of Science, Technology…, 2009 91
What Accounting Measures?
The accounting framework and its methodology, or rather methodological difficulties, has had enormous impact on what was and could be measured. To properly understand the difficulties, one must turn to history. The Frascati manual was the OECD’s response to at least three methodological problems that prevented early statisticians from comparing surveys, drawing historical series or even believing in the numbers generated prior to the 1960s. The first problem concerned definitions of research. Two situations prevailed at the time. Firstly, more often than not, there was no definition of research at all, as was discussed above (Chapter 1). This was the case for the US National Research Council directory of industrial R&D 91, the US National Resources Planning Board92, and Canada’s Dominion Bureau of Statistics93
The second situation regarding definitions was the use of categories of research in lieu of a precise definition. Both the V. Bush
.
94 and US President’s Scientific Research Board 95 reports, as well as the first survey from the British Department of Scientific and Industrial Research 96
91 National Research Council, Research Laboratories in Industrial
Establishments of the United States of America, Bulletin of the NRC, vol. 1, part 2, March 1920, p. 45.
, suggested categories that resembled each other (basic, applied and development) – but that were never in fact the same. As a rule, these categories served to help respondents decide what to include in their responses to the questionnaire, but disaggregated data were not available for calculating statistical breakdowns. Others, such
92 National Resources Planning Board (1941), Research: A National Resource (II): Industrial Research, Washington: USGPO, p. 173.
93 Dominion Bureau of Statistics (1941), Survey of Scientific and Industrial Laboratories in Canada, Ottawa.
94 V. Bush (1945), Science: The Endless Frontier, op. cit., p. 81-83. 95 President’s Scientific Research Board (1947), Science and Public Policy,
op. cit., p. 300-301. 96 DSIR (1958), Estimates of Resources Devoted to Scientific and
Engineering R&D in British Manufacturing Industry, 1955, London, p. 8.

92 The Making of Science, Technology…, 2009
as the US National Resources Committee, simply refused to use such categories because of the intrinsic connections between basic and applied research, which seemed to prevent any clear distinctions from being made 97
The second problem of pre-1960s R&D surveys, closely related to the problem of definition, concerned the demarcations of research and non-research activities. The main purpose of both the Harvard Business School study
.
98 and the US Bureau of Labor Statistics99 survey, two influential studies of the early 1950s, was to propose a definition of R&D and to measure it. Two problems were identified: there were too many variations on what constituted R&D, so they claimed, and too many differences among firms concerning which expenses to include in R&D. Although routine work was almost always excluded, there were wide discrepancies at the frontier between development and production, and between scientific and non-scientific activities: testing, pilot plants, design and market studies were sometimes included in research and at other times not. Indeed, companies had accounting practices that did not allow these activities to be easily separated100
Even if all the organizations responding to the NSF’s statistical inquiries shared, by some miracle,
. K. Arnow, of the US National Science Foundation, summarized the problem as follows:
97 National Resources Committee (1938), Research: A National Resource
(I): Relation of the Federal Government to Research, Washington: USGPO, p. 6.
98 D. C. Dearborn, R. W. Kneznek and R. N. Anthony (1953), Spending for Industrial Research, 1951-1952, Division of Research, Graduate School of Business Administration, Harvard University.
99 US Department of Labor, Bureau of Labor Statistics, Department of Defense (1953), Scientific R&D in American Industry: A Study of Manpower and Costs, Bulletin no. 1148, Washington.
100 O. S. Gellein and M. S. Newman (1973), Accounting for R&D Expenditures, American Institute of Certified Accountants, New York; S. Fabricant, M. Schiff, J. G. San Miguel and S. L. Ansari (1975), Accounting by Business Firms for Investments in R&D, Report submitted to the National Science Foundation, New York University.

The Making of Science, Technology…, 2009 93
a common core of concepts and definitions, they might still not be able to furnish comparable data, since they draw on a diversity of budget documents, project reports, production records, and the like for estimating R&D expenditures101
According to R. N. Anthony, author of the Harvard Business School survey, accounting practices could result in variations of up to 20% in numbers on industrial R&D
.
102. Both the US Bureau of Census and the National Science Foundation also believed that only better accounting practices could correct such errors103
A third and final problem of early R&D surveys concerned the population under study. We have noted how the US National Research Council directory was open to all firms who agreed to complete the questionnaire: “the National Research Council surveys were designed for the purpose of compiling a series of directories of research laboratories in the United States. The schedules were therefore sent out without instructions which would have been necessary had it been intended to use the data for purposes of statistical analysis”
.
104
101 K. Arnow (1959), National Accounts on R&D: The National Science
Foundation Experience, in National Science Foundation, Methodological Aspects of Statistics on Research and Development: Costs and Manpower, NSF 59-36, Washington, p. 58.
. When statisticians finally began addressing the problem, however, their methodologies differed: some limited the
102 R. N. Anthony (1951), Selected Operating Data: Industrial Research Laboratories, Harvard Business School, Division of Research, Boston, p. 3.
103 H. Wood, Some Landmarks in Future Goals of Statistics on R&D, in National Science Foundation (1959), Methodological Aspects of Statistics on Research and Development: Costs and Manpower, NSF 59-36, Washington, p. 52; National Science Foundation (1960), Research and Development in Industry, 1957, NSF 60-49, Washington, p. 99.
104 G. Perazich and P. M. Field (1940), Industrial Research and Changing Technology, op. cit. p. 52.

94 The Making of Science, Technology…, 2009
survey to distinct laboratories105, others sent the questionnaire on a consolidated company basis106, and still others concentrated on big firms to “speed up results”107
All in all, the absence of norms made survey comparisons impossible before the 1960s, resulting in statistics that were often of limited value. The US President’s Scientific Research Board wrote that it was “not possible to arrive at precisely accurate research expenditures” because of three limitations: 1) variations in definition, 2) variations in accounting practices and 3) the absence of a clear division between science and other research activities
. There were no real standards.
108. Similarly, the National Science Foundation admitted that the industrial R&D surveys it conducted before 1957 were not comparable to those it conducted after that date109
The Frascati manual aimed to improve the situation with precise definitions. Surprisingly, the first edition carried no definition of research at all. Research was rather contrasted to routine work:
.
The guiding line to distinguish R&D activity from non-research activity is the presence or absence of an element of novelty or innovation. Insofar as the activity follows an established routine pattern it is not R&D. Insofar as it departs from routine and breaks new ground, it qualifies as R&D (p. 16).
The manual therefore put emphasis on discussing precisely what routine activities were – not in order to measure them, but to exclude
105 R. N. Anthony (1951), Selected Operating Data: Industrial Research
Laboratories, op. cit. p. 42. 106 D. C. Dearborn, R. W. Kneznek and R. N. Anthony (1953), Spending for
Industrial Research, 1951-1952, op. cit. p. 43. 107 Dominion Bureau of Statistics (1956), Industrial Research-Development
Expenditures in Canada, 1955, Ottawa, p. 22. 108 President’s Scientific Research Board (1947), Science and Public Policy,
op. cit. p. 73, 301. 109 National Science Foundation (1960), Funds for R&D: Industry 1957, op.
cit. p. 97-100

The Making of Science, Technology…, 2009 95
them from measurement110
Not measuring related scientific activities was a decision as important as measuring R&D. As UNESCO constantly reminded national statisticians, what was defined as related scientific activities includes many important scientific and technological activities
. The first edition dealt extensively with boundaries (frontiers) between routine work and R&D. It distinguished R&D from two other types of activities: related scientific activities and non-scientific activities (of which industrial production was perhaps the most important). It is here that the main differences were said to exist between member countries. According to the 1962 edition, related scientific activities fall into four classes: 1) scientific information (including publications), 2) training and education, 3) data collection and 4) testing and standardization. Non-scientific activities are of three kinds: 1) legal and administrative work for patents, 2) testing and analysis and 3) other technical services.
111. These activities cover, for example, information, data collection, testing and standardization. Without these activities, many R&D activities would not be possible, or at least not possible in their current form: “the optimal use of scientific and technological information depends on the way it is generated, processed, stored, disseminated, and used”. 112 In some countries, related scientific activities amount to over one-third of all scientific and technological activities. The Frascati manual also recognized the centrality of these activities to a country113
110 As a UNESCO document once reported, there have never been any
positive criteria for defining related scientific activities. See J.-C. Bochet, The Quantitative Measurement of Scientific and Technological Activities Related to R&D Development, CSR-S-2, Paris: UNESCO, 1974, p. 2.
:
111 K. Messman (1975), A Study of Key Concepts and Norms for the International Collection and Presentation of Science Statistics, COM-75/WS/26, UNESCO, p. 33-34.
112 UNESCO, Guide to Statistics on Scientific and Technological Information and Documentation (STID), ST-84/WS/18, Paris, 1984, p. 5.
113 FM (1962), p. 13.
96 The Making of Science, Technology…, 2009
R&D activities are only one part of a broad spectrum of scientific activities which include scientific information activities, training and education, general purpose data collection, and (general purpose) testing and standardization. Indeed, in some countries one or more of these related scientific activities may claim a larger share of material and human resources than R&D. It may well be desirable for such countries to begin their statistical inquiries by surveying one or more of these areas rather than R&D.
The first edition of the manual suggested measuring these activities, but separately114, while the following editions recommended excluding them unless they serve R&D directly115. The rationale for the non-treatment of these activities was offered as early as the first edition: “It is not possible here to make a detailed standard recommendation for related scientific activities (…). The objective of this manual is to attain international comparability in the narrower field of R&D (…). Arising from this experience, further international standards can be elaborated by the OECD for related activities”116. The recommendation for standards was soon abandoned, however, despite talks about extending the Frascati manual to related scientific activities as early as 1964117
114 The Frascati manual nevertheless recommended that: “All calculation of
deductions for non-research activities of research organizations, and of additions for R&D activities of non-research organizations should be made explicit, that is to say, recorded both by individual respondents and by those compiling national totals from the data furnished by individual respondents. Furthermore, whenever possible, related scientific activities such as documentation and routine testing, should be measured simultaneously with R&D and reported separately”. FM (1962), p. 14.
: “We are not concerned here with the
115 Starting with FM (1970), p. 17. 116 FM (1962), p. 14-15. 117 OECD (1964), Committee for Scientific Research: Programme of Work
for 1965, SR (64) 33, p. 12 and 18; OECD (1964), Committee for Scientific Research: Programme of Work for 1966, SR (65) 42, p. 23.

The Making of Science, Technology…, 2009 97
problem of measuring R&D related activities,” stated the manual, “but with the conventions to be used to exclude them when measuring R&D activities”118
Such an understanding of what scientific activities are was in line with a “moral” hierarchy in vogue for decades: “The facilities available in the laboratories make it possible for the scientist to devote his time exclusively to work of a professional caliber [R&D]. He is not required to perform routine tasks of testing and experimentation but is provided with clerical and laboratory assistants who carry on this work”
.
119. No argument was needed to convince people of this hierarchy. It was taken for granted by almost everybody that “soft” activities like market studies or design, for example, were not part of science. This was the general understanding of the time120
Having delimited what was not considered research in the first edition, the OECD turned to a precise definition of research in the second edition: R&D is “creative work undertaken on a systematic basis to increase the stock of scientific and technical knowledge, and the use of this stock of knowledge to devise new applications”
.
121. The idea of systematicness comes from the industrial R&D surveys conducted in the United States since the 1940s122
118 FM (1962), p. 14.
. It equated research with large organizations that had experimental laboratories, or “organized” research facilities. The US Works Progress Administration report, for example, began with the following fact: “The systematic application of scientific knowledge and methods to
119 G. Perazich and P. M. Field (1940), Industrial Research and Changing Technology, op. cit. p. 43.
120 For an historical point of view, see: S. Shapin (1989), The Invisible Technician, American Scientist, 77, p. 554-563.
121 FM (1970), p. 8. 122 National Research Council (1941), Research: A National Resource (II):
Industrial Research, National Resource Planning Board, Washington: USGPO; D. C. Dearborn, R. W. Kneznek and R. N. Anthony (1953), Spending for Industrial Research, 1951-1952, op. cit.

98 The Making of Science, Technology…, 2009
research in the production problems of industry has in the last two decades assumed major proportions”123. The authors contrasted colonial times, when research was random, haphazard and unorganized because it was conducted by independent inventors124, with modern times when, between 1927 and 1938 for example, “the number of organizations reporting research laboratories has grown from about 900 to more than 1,700 affording employment to nearly 50,000 workers”125. And the report continued: “Industry can no longer rely on random discoveries, and it became necessary to organize the systematic accumulation and flow of new knowledge. This prerequisite for the rise of industrial research to its present proportions was being met by the formation of large corporations with ample funds available for investment in research”126
Similarly, the Harvard Business School study showed that firm size was one of the main variables explaining R&D investment. Consequently, the authors suggested limiting the samples to larger units:
.
127
123 G. Perazich and P. M. Field (1940), Industrial Research and Changing
Technology, op. cit. p. xi.
124 Ibid., p. 46-47. 125 Ibid., p. 40. 126 Ibid., p. 41. This was, in fact, the common understanding about the
emergence of industrial research for at least two decades (1920): “The starting and development of most manufacturing businesses depended upon discoveries and inventions made by some individual or group of individuals who developed their original discoveries into an industrial process”. This was more often than not accidental. “With the increasing complexity of industry and the parallel growth in the amount of technical and scientific information necessitating greater specialization, the work of investigation and development formerly performed by an individual, has been delegated to special departments of the organization, one example of which is the modern industrial research laboratory”. C. E. K. Mees (1920), The Organization of Industrial Scientific Research, New York: McGraw Hill, p. 5-6.
127 R. N. Anthony and J. S. Day (1952), Management Controls in Industrial Research Organizations, Cambridge (Mass.): Harvard University Press, p. 6-7.

The Making of Science, Technology…, 2009 99
The fact that there are almost 3,000 industrial research organizations can be misleading. Most of them are small. (…) Over half employ less than 15 persons each, counting both technical and non-technical personnel. Many of these small laboratories are engaged primarily in activities, such as quality control, which are not research or development.
[Therefore] this report is primarily concerned with industrial laboratories employing somewhat more than 15 persons.
To the OECD, systematic research meant research conducted on a regular basis. However, it was 1993 before there was an explicit OECD rationale for this definition. In fact, the word “systematic” had never been defined explicitly in any edition of the Frascati manual. During the fourth revision of the manual in 1991, then, the French delegate suggested certain modifications to the definition of research128. Two options were discussed. One was the omission of references to “systematic” in the definition of R&D. This was rejected because it was felt that the term was useful in excluding non-R&D activities. The other option was to qualify “systematic” as “permanent and organized” in the definition of R&D. This option was also rejected. However, a precise number was proposed and adopted for defining (core) R&D: a minimum of one full-time equivalent person working on R&D per year129. From then on, the manual began distinguishing R&D according to whether it was continuous or ad hoc130
128 OECD (1991), R&D and Innovation Surveys: Formal and Informal R&D,
DSTI/STII/(91)5 and annex 1.
:
129 FM (1994), p. 106. 130 Ibid., p. 51.

100 The Making of Science, Technology…, 2009
R&D by business enterprises may be organized in a number of ways. Core R&D may be carried out in units attached to establishments or in central units serving several establishments of an enterprise. In some cases, separate legal entities may be established to provide R&D services for one or more related legal entities. Ad hoc R&D, on the other hand, is usually carried out in an operational department of a business such as the design, quality or production department.
In 1993, the manual explicitly recommended concentrating on continuous R&D only131
R&D has two elements. R&D carried out in formal R&D departments and R&D of an informal nature carried out in units for which it is not the main activity. In theory, surveys should identify and measure all financial and personnel resources devoted to all R&D activities. It is recognised that in practice it may not be possible to survey all R&D activities and that it may be necessary to make a distinction between “significant” R&D activities which are surveyed regularly and “marginal” ones which are too small and/or dispersed to be included in R&D surveys. (…) This is mainly a problem in the business enterprise sector where it may be difficult or costly to break out all the ad hoc R&D of small companies.
:
This meant that a part of R&D, that part conducted by small and medium-sized enterprises, would continue to be poorly surveyed because R&D was thought to be “a statistically rare event in smaller
131 Ibid., p. 105-106.

The Making of Science, Technology…, 2009 101
units”, i.e.: not systematic132. And indeed, surveys conducted by academics have documented how official R&D figures underestimate R&D conducted by undercounting small and medium-sized enterprises by at least 30%133. The definition of research as systematic research has also restricted the coverage of the sciences surveyed. The Frascati manual was restricted to the natural and engineering sciences until the third edition. In 1976, the manual included the social and human sciences for the first time134. The social sciences and humanities had been excluded from definitions and measurements because they were considered as conducting not organized (systematic) but individual research. Even after being included, “some deviations from the standards may still have to be accepted”, stated the OECD Frascati manual135. Today, the bias continues in other OECD methodological manuals136, where a system of “priorities” is established with the natural sciences and engineering situated at its core137
132 FM (1981), p. 72.
.
133 A. Kleinknecht (1987), Measuring R&D in Small Firms: How Much Are We Missing?, The Journal of Industrial Economic, 36 (2): 253-256; A. Kleinknecht and J. O. N. Reijnen (1991), More evidence on the undercounting of Small Firm R&D, Research Policy, 20: 579-587. For similar numbers in France, see: S. Lhuillery and P. Templé (1994), L’organisation de la R&D dans les PMI-PME, Économie et Statistique, 271-272, p. 77-85. For Italy, see: E. Santarelli and A. Sterlacchini (1990), Innovation, Formal vs Informal R&D and Firm Size, Small Business Economics, 2, p. 223-228.
134 The definition of R&D was modified as follows, and an appendix specifically dealing with these sciences was added: “R&D may be defined as creative work undertaken on a systematic basis to increase the stock of scientific and technical knowledge, including knowledge of man, culture and society and the use of this stock of knowledge to devise new applications”. FM (1976), p. 29.
135 FM (1981), p. 17. 136 OECD (1995), Manual on the Measurement of Human Resources
Devoted to S&T, OECD/GD (95) 77. 137 “The Nordic group [of countries] had difficulties in accepting the use of
the term “low priority” in connection with the humanities (…). It was agreed that the priorities terminology be replaced by coverage”: OECD
102 The Making of Science, Technology…, 2009
When official definitions and surveys began to cover the social sciences and humanities138, the conventions designed for the natural sciences in the previous decade were strictly applied to these new disciplines. Therefore, activities such as data collection and scientific and technical information – among them the production of statistics – which are the raw material of the social sciences and humanities, and which are an integral part of research in these disciplines, were excluded because they were considered as related scientific activities139. Similarly, economic studies and market research were never considered as research activities by industry surveys140
That research came to be equated with systematized research or large organizations with dedicated laboratories
.
141
(1994), NESTI: Summary Record of the Meeting Held on 18-20 April 1994 in Canberra, Australia, DSTI/EAS/STP/NESTI/M (94) 1, p. 4.
is due partly to methodological difficulties of accounting and the costs of conducting a survey. Because there are tens of thousands of firms in a country, units surveyed have to be limited to manageable proportions. This was done by introducing a bias in industrial surveys: the survey identified all major R&D performers, that is, big firms with laboratories (or “organized” research) and surveyed them all, but selected only a sample of smaller performers, when they selected any. This decision was also supported by the fact that only big firms had
138 Today, nine OECD countries still do not include the social sciences and humanities in their surveys.
139 P. Lefer (1971), The Measurement of Scientific Activities in the Social Sciences and Humanities, UNESCO: Paris, CSR-S-1; OECD (1970), The Measurement of Scientific Activities: Notes on a Proposed Standard Practice for Surveys of Research in the Social Sciences and Humanities, DAS/SPR/70.40, Paris.
140 In the case of industrial R&D, the exception was: D. C. Dearborn, R. W. Kneznek and R. N. Anthony (1953), Spending for Industrial Research, 1951-1952, op. cit.
141 On academics’ use of the idea, see: J. Schmookler (1959), Bigness, Fewness, and Research, Journal of Political Economy, 67 (6), p. 628-632; F. Machlup (1962), The Production and Distribution of Knowledge in the United States, Princeton: Princeton University Press, p. 82-83.

The Making of Science, Technology…, 2009 103
precise book-keeping practices on R&D since the activity could be located in a distinct and formal entity, the laboratory.
All in all, the manual and its statistics brought forth a specific definition of science142
- An activity, rather than knowledge or output;
. According to the Frascati manual science is:
- Research, rather than research plus its supporting activities;
- Research as R&D, and mainly development of products and processes (accounting for two thirds of R&D);
- Systematic, or organized and institutionalized R&D.
Such a definition is due to many factors, among them the institutionalization of research in organizations and its role in the economy, the importance of firms in the national research budget, and the limitations of statistics and their collection.
ACCOUNTING AND SCIENCE POLICY
That the OECD developed a methodological manual on R&D based on an accounting framework had to do with policy. As the NSF suggested in 1951: “A sound policy must rest on a sound foundation of fact”143. And again in 1952: “The necessary first step in policy development is the assembly of an adequate body of fact”144
142 B. Godin (2007), What is Science: Defining Science by the Numbers,
1920-2000, Project on the History and Sociology of STI Statistics, Paper no. 35, Montreal: INRS.
. Such a rationale for the collection and analysis of data was also offered at OECD in the early 1960s when discussions on science policy emerged. Science was now becoming recognized as a factor in
143 National Science Foundation, First Annual Report, 1950-51, Washington: USGPO, p. 13.
144 National Science Foundation, Second Annual Report, Fiscal Year 1952, Washington: USGPO, p. 5.

104 The Making of Science, Technology…, 2009
economic growth, at least by OECD bureaucrats. In order that science might optimally contribute to progress, however, science policies had to be developed. And to inform the latter, statistics were essential, so thought the organization: “Informed policy decisions (…) must be based on accurate information about the extent and forms of investment in research, technological development, and scientific education”, argued the OECD’s Piganiol report145. “Provision for compilation of data is an indispensable prerequisite to formulating an effective national policy for science”146. Freeman would identify similar needs in subsequent years, among others in a 1963 study for the first ministerial conference on science: “most countries have more reliable statistics on their poultry and egg production than on their scientific effort and their output of discoveries and inventions”. (…) The statistics available for analysis of technical change may be compared with those for national income before the Keynesian revolution”147
What were the policy decisions for which data were so necessary? There were three, and all were framed within the vocabulary of neoclassical economics, even among evolutionary economists’ hands
.
148
145 OECD (1963), Science and the Policies of Government, op. cit. p. 24.
. The first was how to allocate resources to R&D, or what economists call the optimum level of resources: “Assessing what is in some sense the “right” or “optimum” level of allocation of
146 OECD (1963), Science and the Policies of Government, op. cit. p. 24. 147 OECD (1963), Science, Economic Growth and Government Policy, Paris,
p. 21-22; the same quotation (more or less) can be found on p. 5 of the first edition of the Frascati manual.
148 For a summary of neoclassical economists’ view on science policy, see: S. Metcalfe (1995), The Economic Foundations of Technology Policy: Equilibrium and Evolutionary Perspectives, in P. Stoneman (ed.), Handbook of the Economics of Innovation and Technological Change, Oxford: Blackwell, p. 408-512, especially p. 408-447.

The Making of Science, Technology…, 2009 105
resources”149
The second policy decision was what should be the balance between choices or priorities, or what economists call equilibrium. To many, decisions about research funding were analyzed in terms of tensions between freedom and control, between big science and little science, between socioeconomic objectives, between scientific fields, and between basic and applied research
. As discussed above, the GERD was developed to serve this end, and the ratio GERD/GDP became a policy target.
150
The first edition of the Frascati manual suggested classifying R&D by dimension. One of the central dimensions was concerned with economic sectors, as discussed above. Other classifications concerned each of the sectors individually. The Frascati manual’s recommended system of classification is peculiar in that each economic sector in the system of national accounts has its own
. To the OECD, statistics was the solution to the issue, and a system of classification for statistical breakdowns was proposed.
149 C. Freeman and A. Young (1965), The Research and Development Effort
in Western Europe, North America and the Soviet Union, Paris: OECD, p. 15.
150 Bernal, J. D. (1939), The Social Function of Science, Cambridge (Mass.): MIT Press, 1973; US President’s Scientific Research Board (1947), Science and Public Policy, Washington: USGPO; T. Parsons (1948), Social Science: A Basic National Resource, paper submitted to the Social Science Research Council, reprinted in S. Z. Klausner and V. M. Lidz (1986), The Nationalization of the Social Sciences, Philadelphia: University of Pennsylvania Press, 41-112, p. 109; A. M. Weinberg (1963/1964), Criteria for Scientific Choice, Minerva , 1(2), p. 159-171 and 3 (1), p. 3-14; S. Toulmin (1964), The Complexity of Scientific Choice: A Stocktaking, Minerva, 2 (3), p. 343-359; National Research Council (1965), Basic Research and National Goals, Washington: National Academy Press; National Research Council (1967), Applied Science and Technological Progress, Washington: National Academy Press; B. L. R. Smith (1966), The Concept of Scientific Choice, American Behavioral Scientist, 9, p. 27-36; C. Freeman (1969), National Science Policy, Physics Bulletin, 20, p. 265-270; H. Krauch (1971/1972), Priorities for Research and Technological Development, Research Policy, 1, p. 28-39; H. Brooks (1978), The Problem of Research Priorities, Daedalus, 107, p. 171-190.

106 The Making of Science, Technology…, 2009
classification. Whereas in most official surveys the units are analyzed according to a common system of classifications (every individual of a population, for example, is classified according to the same age structure), here the main economic sectors of the system of national accounts were distinguished and classified separately. The business sector was classified (and the statistics broken down) according to industry, the university (and private non-profit) sector according to fields of science or scientific disciplines, and the government sector according to socioeconomic objectives. The principal recommendations regarding these classifications were made in the first edition of the Frascati manual, and have been regularly updated since 1970.
Although each economic sector has its own classification, there is one more classification recommended in the manual, and it applies across all economic sectors. It concerns whether R&D is basic, applied or development, and has been an issue discussed for over forty years at the OECD151. Since M.J.A. Condorcet in the eighteenth Century, a magic number of 20 is often suggested as the percentage of R&D funds that should be devoted nationally to basic research, and such a target was proposed to the OECD early on152
151 The first discussions on the balance between basic and applied research
are to be found in Bernal (1939), Bush (1945) and the US President Scientific and Research Board (1947). For the OECD, see: B. Godin (2005), Measurement and Statistics on Science and Technology: 1920 to the Present, op. cit., p. 298-302.
. Such a ratio depends on statistical breakdowns of research funds between basic research, applied research and development, the three categories that appear in the linear model of innovation. Former National Science Foundation director D. N. Langenberg once explained how the National Science Foundation “must retain some ability to characterize, even to quantify, the state of the balance between basic and applied research across the Foundation. It must do so in order to
152 OECD (1966), Fundamental Research and the Policies of Government, Paris, p. 32-33.
The Making of Science, Technology…, 2009 107
manage the balance properly and to assure the Congress and the scientific and engineering community that it is doing so”153
Of all the concepts defined in the first edition of the Frascati manual, the first dealt with what the manual then called fundamental research. While a definition of research itself did not appear until the second edition, fundamental research was defined explicitly as follows
.
154
Work undertaken primarily for the advancement of scientific knowledge, without a specific practical application in view.
:
In the last edition of the manual, the definition is substantially the same as the one in 1962, although the term “basic” is now used instead of fundamental155
Basic research is experimental or theoretical work undertaken primarily to acquire new knowledge of the underlying foundation of phenomena and observable facts, without any particular application or use in view.
:
Between 1962 and 2002, therefore, all six editions of the manual carried essentially the same definition without any significant changes: basic (or fundamental) research is research concerned with knowledge per se, as contrasted with applied research, which is concerned with the application of knowledge. Over the same period, however, the definition has frequently been discussed, criticized and, in some cases, even abandoned.
The concept of basic research and its contrast with applied research has a long history that goes back to the nineteenth century, and the integration of the dichotomy into taxonomies used for statistical
153 D. N. Langenberg (1980), Memorandum for Members of the National
Science Board, NSB-80-358, Washington, p. 4. 154 FM (1962), p.12. 155 FM (2002), p. 77.

108 The Making of Science, Technology…, 2009
surveys comes from the British scientists J. S. Huxley and J. D. Bernal156. V. Bush appropriated the taxonomy for the statistics of his report Science: the Endless Frontier, as did the US President’s Scientific Research Board. But it was the National Science Foundation that gave the concept of basic research its influential definition with its very first R&D surveys157
The first OECD meeting of national experts on the Frascati manual, held in 1963, brought together people and groups from several countries, chief among which was the National Science Foundation. K. S. Arnow
.
158 and K. Sanow159 discussed at length the difficulties of defining appropriate concepts for surveys. Indeed, for some time the National Science Foundation devoted a full-time person specifically to this task (K. S. Arnow). At the meeting, C. Oger from France (Direction générale de la recherche, de la science et de la technologie) discussed the limitations of a definition of fundamental research based exclusively on researchers’ motives, and suggested alternatives160. In fact, the main criticism of the concept concerned – and still concerns – its subjectivity: whether a project is classified as basic or applied is still up to the survey respondent161
156 Huxley, J. S. (1934), Scientific Research and Social Needs, London:
Watts and Co.; Bernal, J. D. (1939), The Social Function of Science, op. cit.
. Oger’s suggestion (crossing categories of research according to three criteria: aims, results and types of work) appeared without discussion in an appendix to the first edition of the Frascati manual.
157 B. Godin (2003), Measuring Science: Is There Basic Research Without Statistics?, op. cit.
158 K. S. Arnow (1963), Some Conceptual Problems Arising in Surveys of Scientific Activities, OECD, DAS/PD/63.37.
159 K. Sanow (1963), Survey of Industrial Research and Development in the United States: Its History, Character, Problems, and Analytical Uses of Data, OECD, DAS/PD/63.38.
160 C. Oger (1963), Critères et Catégories de recherche, OECD, DAS/PD/63.30.
161 Researchers tend to qualify their research as basic, while providers of funds prefer to call it applied or oriented.

The Making of Science, Technology…, 2009 109
Discussions continued over the following few years, resulting in the addition of a brief text to the second edition of the manual. In 1970, the manual discussed a sub-classification of basic research according to whether it was pure or oriented162. Pure basic research was defined as research in which “it is generally the scientific interest of the investigator which determines the subject studied”. “In oriented basic research the organization employing the investigator will normally direct his work toward a field of present or potential scientific, economic or social interest”163
Discussions resumed in 1973. C. Falk, of the National Science Foundation, proposed to the OECD a definition of research with a new dichotomy based on the presence or absence of constraints. He suggested “autonomous” when the researcher was virtually unconstrained and “exogenous” when external constraints were
.
162 To the best of my knowledge, the term “oriented research” came from
P. Auger (1961), Tendances actuelles de la recherche scientifique, Paris: UNESCO, p. 262. The OECD rapidly appropriated the concept in two publications. First, in a document produced for the first ministerial conference on science in 1963, C. Freeman et al. suggested that fundamental research fell into two categories – free research that is driven by curiosity alone, and oriented research (OECD (1963), Science, Economic Growth and Policy, op. cit. p. 64). Second, in the second edition of the Frascati manual, the OECD defined oriented research as follows: “In oriented basic research the organization employing the investigator will normally direct his work toward a field of present or potential scientific, economic or social interest”: FM (1970), p. 10. A precursor to the concept is Huxley’s definition of basic research (J. S. Huxley (1934), Scientific Research and Social Needs, London: Watts and Co.) and the definition of basic research offered to firms in the National Science Foundation surveys of industrial research: “Research projects which represent original investigation for the advancement of scientific knowledge and which do not have specific commercial objectives, although they may be in the fields of present or potential interest to the reporting company”: National Science Foundation (1959), Science and Engineering in American Industry: Report on a 1956 Survey, Washington, NSF 59-50, p. 14.
163 FM(1970), p. 10.

110 The Making of Science, Technology…, 2009
applied to the research program164. He recommended that some form of survey be undertaken by the OECD to test the desirability and practicality of the definitions. He had no success: “the experts (…) did not feel that the time was ripe for a wholesale revision of this section of the manual. It was suggested that as an interim measure the present division between basic and applied research might be suppressed”165
Then, in 1992, the delegates from the United Kingdom and Australia tried to introduce the term “strategic research” into the Frascati manual – the Australian going so far as to delay publication of the Frascati manual
. However, the only modifications that member countries accepted – to appear in the 1981 edition of the Frascati manual – were that the discussion of the difference between pure and basic research was transferred to another chapter, separated from the conventional definitions.
166: strategic research was “original investigation undertaken to acquire new knowledge which has not yet advanced to the stage when eventual applications to its specific practical aim or objective can be clearly specified”167. After “lively discussions”, as the Portuguese delegate described the meeting168
164 C. Falk (1973), The Sub-Division of the Research Classification: A
Proposal and Future Options for OECD, OECD, DAS/SPR/73.95/07.
, they failed to win consensus. We read in the 1993 edition of the Frascati manual that: “while it is recognized that an element of applied research can be described as strategic research, the lack of an agreed approach to its
165 OECD (1973), Results of the Meeting of the Ad Hoc Group of Experts on R&D Statistics, DAS/SPR/73.61, p. 8.
166 This is only one of two discussions concerning the taxonomy of research at the time. A new appendix was also suggested but rejected. It concerned distinguishing between pure and “transfer” sciences. See OECD (1991), Distinction Between Pure and Transfer Sciences, DST/STII(91)12; OECD (1991), The Pure and Transfer Sciences, DSTI/STII(91)27.
167 OECD (1992), Frascati Manual – 1992, DSTI/STP(92)16; OECD (1993), The Importance of Strategic Research Revisited, DSTI/EAS/STP/NESTI(93)10.
168 OECD (1993), Treatment of Strategic Research in the Final Version of Frascati Manual - 1992, DSTI/EAS/STP/NESTI/RD(93)5.

The Making of Science, Technology…, 2009 111
separate identification in member countries prevents a recommendation at this stage”169
The 1992 debate at the OECD centered on, among other things, where to locate strategic research. There were three options. First, subdivide the basic research category into pure and strategic, as the OECD had suggested. Second, subdivide the applied research category into strategic and specific, as the British government did. Third, create an entirely new category (strategic research) as recommended by the Australian delegate
.
170. In the end, “delegates generally agreed that strategic research was an interesting category for the purposes of science and technology policy but most felt that it was very difficult to apply in statistical surveys”171
In 2000, the question was on the agenda again during the fifth revision of the Frascati manual
.
172. This time, countries indicated a “strong interest in a better definition of basic research and a breakdown into pure and oriented basic research” but agreed that discussions be postponed and addressed in a new framework after they had advanced on policy and analytical ground173. To this end, a workshop was held in Oslo (Norway) in 2001 as part of a project related to the financing of basic research, entitled Steering and Funding Research Institutions174
169 FM (1994), p. 69.
. The final report of the project, however, completely evaded the question and did not discuss
170 See OECD (1991), Ventilation fonctionnelle de la R-D par type d’activité, DSTI/STII(91)7.
171 OECD (1993), Summary Record of the NESTI Meeting, DSTI/EAS/STP/NESTI/M(93) 1, p. 5.
172 OECD (2000a), Review of the Frascati Manual: Classification by Type of Activity, DSTI/EAS/STP/NESTI/RD(2000)4; OECD (2000b), Ad Hoc Meeting on the Revision of the Frascati Manual R&D Classifications: Basic Research, DSTI/EAS/STP/NESTI/RD(2000)24.
173 OECD (2000), Summary Record, DSTI/EAS/STP/NESTI/M (2000) 1, p. 5.
174 OECD (2002), Workshop on Basic Research: Policy Relevant Definitions and Measurement: Summary Report, http://www.oecd.org/dataoecd/61/8/2676067.pdf.

112 The Making of Science, Technology…, 2009
definitions. The rationale given by the OECD was the following: “the key question is not to find a new conceptual definition for basic research, but to define its scope sufficiently broadly to cover the whole range of research types needed to establish a sound body of knowledge to achieve socio-economic advances”175
The result of all this was that, beginning in the mid-1970s, governments started to delete the question on basic research from their surveys. Today, only half of OECD member countries collect data on basic research. The OECD itself deleted the question on basic research from the list of mandatory questions on the R&D questionnaire, and rarely published numbers on basic research except for sector totals because of the low quality of the data, and because too many national governments failed to collect the necessary information
.
176. Beginning with the 1981 edition, the manual also added reservations on the classification because it was qualified as subjective177. All in all, it seems that the current statistical breakdown of research, and the numbers generated, are not judged by several people to be useful for balancing the budget178
175 OECD (2003), Governance of Public Research: Toward Better Practices,
Paris, p. 101.
. As W. H. Shapley, from the US Bureau of Budget, once suggested: “breakdowns do not
176 The only numbers appear in the Basic Science and Technology Statistics series, but missing data abound.
177 FM (1981), p. 21. 178 Neither are they by industrialists (see: H. K. Nason (1981), Distinctions
Between Basic and Applied in Industrial Research, Research Management, May, p. 23-28). According to the NSF itself, industrial representatives “prefer that the National Science Foundation not request two separate figures” (basic and applied), but “the Foundation considers it to be extremely important” to distinguish both (K. Sanow (1963), Survey of Industrial Research and Development in the United States: Its History, Character, Problems, and Analytical Uses of Data, op. cit. p. 13). With regard to government representatives, the second OECD users group reported that the least-popular of all the standard indicators were those concerning basic research, applied research and experimental development: OECD (1978), Report of the Second Ad Hoc Review Group on R&D Statistics, STP (78) 6.

The Making of Science, Technology…, 2009 113
tell anything about balance (…). Two programs are not in “balance” in any meaningful sense just because the same number of dollars happens to be applied to them in some particular year”179. Equally, as the Frascati manual itself admits, classifications are “not detailed enough to be of use to one significant class of potential users of R&D data (…) [because] this manual is essentially designed to measure national R&D efforts (…)”180
THE EFFICIENCY OF RESEARCH
.
We suggested that there were three policy decisions that required data, according to the OECD. The first was how to allocate resources to R&D. The second was how to balance the budget. The third decision, defined again according to neoclassical economics, was how to determine the efficiency, or effectiveness of research. The first edition of the Frascati manual set the stage for measuring efficiency by using an input-output approach as a framework for science statistics, linking what comes out of science, technology, and innovation (output) to investments (input). Certainly the manual was primarily concerned with proposing standards for the measurement of inputs. But this was only a first stage181. Despite this focus, the manual did discuss output, and inserted a chapter (section) specifically dedicated to its measurement because “in order really to assess R&D efficiency, some measures of output should be found”182
179 W. H. Shapley (1959), Problems of Definition, Concept, and
Interpretation of R&D Statistics, in National Science Foundation, Methodological Aspects of Statistics on R&D: Costs and Manpower, op. cit. p. 14.
. However, stated the manual, “measures of output have not yet reached the stage of development at which it is possible to
180 FM (1981), p. 21. 181 FM (1962), p. 11. 182 Ibid.

114 The Making of Science, Technology…, 2009
advance any proposals for standardization”183. “It seems inevitable that for some time to come it will not be possible to undertake macro-economic analysis and to make international comparisons on the basis of the measurement of output (…). This is an important limitation”184
Nevertheless, from its very first edition, the Frascati manual suggested that a complete set of statistics and indicators, covering both input and output, was necessary in order to properly measure science. The output indicators suggested were patents and payments for patents, licensing and technical know-how
.
185. Things began to really change in 1976. According to the OECD, the manual had “reached maturity”186 and the Secretariat began looking at other indicators than R&D expenditures. In December, the OECD Committee for Scientific and Technological Policy organized a meeting of national experts on R&D statistics in order to prepare the work of the second ad hoc review group on statistics. The OECD Secretariat submitted the question of indicators to the group: “Science indicators are a relatively new concept following in the wake of the long-established economic indicators and the more recent social indicators. So far, the main work on this topic has been done in the United States where the National Science Board of the National Science Foundation has published two reports: Science Indicators 1972 (issued 1973) and Science Indicators 1974 (issued 1975)”187
183 FM (1962), p. 37.
. The background document for the meeting analyzed the indicators that appeared in Science Indicators in depth, and compared them to the statistics available and to those that could be collected, and at
184 FM (1962), p. 37-38. 185 An early statistical analysis of two indicators was conducted by the
director of the OCED statistical unit and presented at the Frascati manual meeting in 1963. See: Y. Fabian (1963), Note on the Measurement of the Output of R&D Activities, DAS/PD/63.48.
186 Ibid., p. 3. 187 OECD (1976), Science and Technology Indicators, DSTI/SPR/76.43,
p. 3.

The Making of Science, Technology…, 2009 115
what cost188
The final report of the review group suggested a three-stage program for the development of new indicators
. The group was asked “to draw some lessons for future work in member countries and possibly at OECD”.
189
- Short-term: input indicators (like industrial R&D by product group).
:
- Medium-term: manpower indicators (like occupations of scientists and engineers).
- Long-term: output (productivity, technological balance of payments, patents) and innovation indicators, as well as indicators on government support to industrial R&D.
A few months later, in November 1978, the OECD Directorate for Science, Technology and Industry responded to the ad hoc review group report and made proposals to member countries190. It suggested limiting indicators to those most frequently requested by users of statistics, i.e.: input indicators. The decision was dictated by the need to accelerate the dissemination of data – a limitation already identified by the first ad hoc review group on statistics. It was nevertheless suggested that a database be created, from which a report based on indicators would be published every two years. The report would “be modeled to some extent on the National Science Foundation Science Indicators reports”191
The Canadian delegate, H. Stead, judged these proposals too timid. He suggested that the Frascati manual be revised in order to turn it
.
188 See particularly the annex of OECD (1976), Science and Technology
Indicators, op. cit. 189 OECD (1978), Report of the Second Ad Hoc Review Group on R&D
Statistics, STP (78) 6, p. 17-21. 190 OECD (1978), General Background Document for the 1978 Meeting of
the Group of National Experts on R&D Statistics, DSTI/SPR/78.39 and annex.
191 Ibid., p. 8.

116 The Making of Science, Technology…, 2009
into an indicator manual that would cover more aspects or dimensions of science than just R&D192. The first part would match more or less the current content of the manual, while the second part would deal with other indicators, namely scientific and technical personnel, related scientific activities, outputs and high-technology trade. His suggestions were rejected as premature193, but the Introduction to the manual was rewritten for the 1981 edition in order to place R&D statistics in the larger context of indicators, including output. By 1981, the manual included an appendix specifically devoted to output, and discussed a larger number of indicators, namely innovations, patents, technological payments, high-technology trade and productivity. The tone of the manual had also changed. While recognizing that there still remained problems of measurement, it stated that: “Problems posed by the use of such data should not lead to their rejection as they are, for the moment, the only data which are available to measure output”194
CONCLUSION
. As the next two chapters document, an input-output approach to science, technology, and innovation finally developed in the following years.
Accounting and the Frascati manual were the statistical answer or policy tool to contribute to the anticipated economic benefits of science. At the OECD, these benefits had to do with economic growth. In 1961, the organization and member countries adopted a 192 Ibid., p. 16-17. 193 OECD (1979), Summary of the Meeting of NESTI, STP (79) 2, p. 4.
YThey concluded that the revised Frascati manual should continue to deal essentially with R&D activities and that separate manuals in the Measurement of Scientific and Technical Activities series should be developed for S&T output and impact indicators which are derived from entirely different sources from R&D statistics”: OECD (1988), Summary of the Meeting of NESTI, STP (88) 2.
194 OECD (1981), The Measurement of Scientific and Technical Activities: Proposed Standard Practice for Surveys of Research and Experimental Development, op. cit. p. 131.

The Making of Science, Technology…, 2009 117
50% economic growth target. All divisions of the organization aligned themselves with the objective, first among them the Directorate for Scientific Affairs195. With regard to R&D, a whole program of work on the economics of science was developed. The Committee for Scientific Research (CSR) of the Directorate for Scientific Affairs recommended that the OECD Secretariat “give considerable emphasis in its future program to the economic aspects of scientific research and technology”196
The Committee for Scientific Research proposal was based on the fact that there is “an increasing recognition of the role played by the so-called third factor [technical progress] in explaining increases in GNP”
.
197. But, the committee continued, “the economist is unable to integrate scientific considerations into his concepts and policies because science is based largely on a culture which is anti-economic”198. Thus, the OECD gave itself the task of filling the gap. To this end, the organization developed a research program on the economy of science that led to a statement on science in relation to economic growth as a background document for the first ministerial conference held in 1963199. The document contained one of the first international comparisons of R&D efforts in several countries based on existing statistics, conducted by Freeman et al.200
195 OECD (1962), The 50 Per Cent Growth Target, CES/62.08, Paris.
.
196 OECD (1962), Economics of Research and Technology, SR (62) 15, p. 1. 197 Ibid., p. 2. 198 Ibid., p. 5. 199 OECD (1963), Science, Economic Growth and Government Policy, op.
cit. 200 The year before, S. Dedijer (Sweden) had published the first such
comparison: S. Dedijer (1962), Measuring the Growth of Science, Science, 138, 16 November, p. 781-788. Two other international statistical comparisons, again based on existing statistics, would soon follow: A. Kramish (1963), Research and Development in the Common Market vis-à-vis the UK, US and USSR, report prepared by the RAND Corporation for the Action Committee for a United Europe (under the chairmanship of J. Monnet); C. Freeman and A. Young (1965), The

118 The Making of Science, Technology…, 2009
The committee went further than simply recommending the collection of statistics. It also suggested that the OECD conduct studies on the relationships between investment in R&D and economic growth. Indeed, “comprehensive and comparable information on R&D activity is the key to [1] a clearer understanding of the links between science, technology and economic growth, [2] a more rational formulation of policy in government, industry and the universities, [3] useful comparisons, exchange of experience, and policy formation internationally”201. The main obstacle to this suggestion was identified as being the inadequacy of available data202. To enlighten policy, the committee thus supported the development of a methodological manual203
The OECD had been responsible for a major achievement in the field of science measurement, that of conventionalizing a specific and particular vision of science as research accounting. Today, every country uses the framework and its statistics to analyze science, technology and issues. The importance of the OECD contribution is considered so great, by the OECD itself, that: “if the OECD were to close its doors tomorrow, the drying up of its statistics would probably make a quicker and bigger impact on the outside world than would the abandonment of any of its other activities”
.
204
An important aspect of the OECD’s accounting framework was that it occurred without any opposition from member countries. This is quite different from the history of other standards and statistics. Dissemination of the French meter outside France, for example, has not been an easy task, and the meter is still not universally used
.
Research and Development Effort in Western Europe, North America and the Soviet Union, op. cit.
201 OECD (1963), A Progress and Policy Report, SR (63) 33, p. 4-5. 202 OECD (1962), Economics of Research and Technology, op. cit., p. 10. 203 OECD (1962), Draft 1963 Programme and Budget, SR (62) 26, p. 19. 204 OECD (1994), Statistics and Indicators for Innovation and Technology,
DSTI/STP/TIP (94) 2, p. 3.

The Making of Science, Technology…, 2009 119
today205. Similarly, the standardization of time units for a while saw its English proponents opposed to the French206
At least three factors contributed to the easy acceptance of the Frascati manual and its accounting framework among OECD countries. Firstly, few countries collected data on science in the early 1960s. The OECD offered a ready-made model for those who had not yet developed the necessary instruments. For the few countries that already collected data, mainly the United States, Canada and Great-Britain, the manual reflected their own practices fairly well: it carried a community of views that they already shared. Secondly, the accounting was proposed by an international organization and not by a specific country, as in the case of the meter or the time unit, for example. This was perceived as evidence of neutrality, although the United States exercised overwhelming influence. Thirdly, the OECD introduced the manual with a step-by-step strategy. First step: as with the first edition, the document began as an internal document only (1962). It would not be published officially before the third edition (1976). Second step: the manual was tested (1963-64) in a large number of countries. Third step: it was revised in light of the experience gained from the surveys. Regular revisions followed, the manual being in its sixth edition now. The philosophy of the OECD was explicitly stated in 1962 in the following terms
.
207
It would be unrealistic and unwise to expect certain Member governments to adapt completely and immediately their present system of definition and classification of research and development activity to a proposed standard system of the OECD. However, it should perhaps be possible for governments to present the results of their surveys following a proposed OECD system, in addition to
:
205 D. Guedj (2000), Le mètre du monde, Paris: Seuil. 206 E. Zerubavel (1982), The Standardization of Time: A Socio-Historical
Perspective, American Journal of Sociology, 88 (1), p. 1-23. 207 FM (1962), p. 2.

120 The Making of Science, Technology…, 2009
following their own national systems. Furthermore, governments could take account of a proposed OECD system when they are considering changes in their own system. Finally, those government who have yet to undertake statistical surveys of R&D activity could take account of, and even adopt, a proposed OECD system.
An additional factor explaining the relative consensus of OECD member countries with regard to accounting was the involvement of national statisticians in the construction of OECD statistics and methodological manuals. This took three forms. Firstly, the creation of a group of National Experts on Science and Technology Indicators (NESTI) to guide OECD activities. Secondly, the setting up of regular ad hoc review groups on science statistics to align OECD statistical work to users’ needs. Thirdly, the active collaboration of member countries in developing specific indicators.
In the end, the Frascati manual was the product of a large number of influences: ideological, political, administrative, historical and individual. First, the manual owes its existence to the early policy demand for statistics. It was the OECD Directorate for Scientific Affairs that pushed and piloted the whole operation. It did this, secondly, with a view to orienting policies, and therefore the statistics, toward accounting. Third, the manual is the product of official statisticians who hold a specific view of the field and who “control” its measurement (via the national survey). Fourth, it owes most of its concepts to previous experiments in measurement, chief among them that of the US National Science Foundation. The Foundation was an influential source of ideas for several concepts like systematic research, basic research and the GERD matrix, but UNESCO, the United Nations, and the European Commission also played an important role, in classifications for example. Finally, one individual was behind several of these early developments – the manual but also the (economic) analyses of the time – the economist Freeman. Besides writing the first edition of the Frascati manual

The Making of Science, Technology…, 2009 121
(1962), Freeman would produce one of the first international statistical comparisons of R&D for the first OECD ministerial conference on science (1963). This analysis would be very influential on subsequent OECD studies of technological gaps. Freeman would also produce the first comparison of methodologies used in different countries to measure science (1965). In this study, he inaugurated the use of multiple indicators to measure science and technology. Finally, Freeman would contribute to the diffusion of OECD norms and methods on accounting to developing countries: he wrote the UNESCO manual for the measurement of scientific and technical activities (1969)208
208 UNESCO (1969), The Measurement of Scientific and Technological
Activities: Proposals for the Collection of Statistics on Science and Technology on an Internationally Uniform Basis, COM.69/XVI-15 A, Paris.
.


The Making of Science, Technology…, 2009 123
CHAPTER THREE
SCIENCE AND EFFICIENCY: THE INPUT-OUTPUT FRAMEWORK
With its periodic publication, titled Report of the World Social Situation, first published in 1952, UNESCO launched a series of measurements of society based on an accounting framework. The exercise would soon be imitated worldwide, first of all in the United States1. According to Mancur Olson, contributor to the first such exercise in the United States, while the national income measures the growth or decline in the economy, a social report should measure “social gains and losses”2. The aim of social accounting is to go further than measurements of an economic type: “for all its virtues, the national income statistics don’t tell us what we need to know about the condition of American society. They leave out most of the things that make life worth living (…). The most notable limitation of the national income statistics is that they do not properly measure those external costs and benefits that are not fully reflected in market prices”3
Despite these suggestions, the example or model behind a social accounting is that of economic accounting. In fact, “the figures on the national income are probably the most impressive and elaborate type
. For Olson, the national welfare is also concerned, among other things, with learning, culture… and science.
1 US Department of Health, Education, and Welfare (1970), Towards a
Social Report, Ann Arbor: University of Michigan Press. 2 M. Olson (1969), The Plan and Purpose of a Social Report, The Public
Interest, 15, p. 86. 3 Ibid.

124 The Making of Science, Technology…, 2009
of socioeconomic measure that we have”, admitted Olson4. Therefore, “the structure and parallelism of the chapters of Towards a Social Report derives in part from the paradigm of the national income and product accounts”5
Olson’s proposal for including science in social reports had no impact. Rather, one must turn to specific publications dedicated to this end. The first such exercise appeared in 1973, and was prepared by the National Science Foundation (NSF) in the United States
.
6. Inspired by the work of the OECD in the late 1960s when it collected multiple indicators to document technological gaps between the United States and Europe, the report collected several statistics that measured science according to several dimensions7
. The model used to collect and analyze the newly imagined data on science was framed in terms of input and output. Inputs are investments in the resources necessary to conduct scientific activities, like money and scientific and technical personnel. Outputs are what come out of these activities: knowledge and inventions. A very simple framework defined the relationship between input and output as follows:
Input → Research activities → Output
Since the early 1960s, this framework has guided analysts in framing statistics into “meaningful” categories, within the academic literature (science and technology studies) as well as official circles like OECD and its member countries. As the OECD stated: “The term R&D [research and development] statistics covers a wide range of possible
4 Ibid. 5 Ibid., p. 87. 6 National Science Board (1973), Science Indicators 1972, Washington:
National Science Foundation. 7 B. Godin (2003), The Emergence of Science and Technology Indicators:
Why Did Governments Supplement Statistics with Indicators?, Research Policy, 32 (4), p. 679-691.

The Making of Science, Technology…, 2009 125
statistical series measuring the resources devoted to R&D stages in the activity of R&D [input] and the results of the activity [output]”8
Where does the input-output framework come from? Certainly, the framework is not alien to a long tradition of cost-benefit analyses in engineering and their use in policy decisions
. An international community of official statisticians has, over time, developed standards for measuring inputs devoted to R&D activities – known as the OECD Frascati manual – and produced a whole “family” of methodological manuals specifically dedicated to measuring output. Today, both series of statistics are collected and published in documents called compendiums or scoreboards of science and technology statistics.
9. The framework is also not alien to input-output tables, as originally developed by W. Leontief10
8 OECD (1981), The Measurement of Scientific and Technical Activities:
Proposed Standard Practice for Surveys of Research and Experimental Development, Paris: OECD, p. 17.
, and used in the System of National Accounts. In this chapter, however, the origin of the framework is traced back to the economic literature and an econometric equation called the production function. At exactly the same time governments were getting interested in measuring science systematically, such analyses were very popular (and still are today). Several of these works were published under the auspices of the US National Bureau of Economic Research. This was the first real “concerted” attempt to integrate
9 For the introduction of accounting in “science policy” (or public decisions and programs involving scientific and technological activities), see T. M. Porter’s discussion of the role of engineers in cost-benefit analyses: T. M. Porter (1995), Trust in Numbers: The Pursuit of Objectivity in Science and Public Life, Princeton: Princeton University Press. On accounting and science generally, see M. Power (ed.) (1994), Accounting and Science: Natural Inquiry and Commercial Reason, Cambridge: Cambridge University Press.
10 Leontief founded input/output accounts, and developed his first I-O tables in the 1930s to study the effects of technological change on the American economy. See: W. Leontief (1936), Quantitative Input-Output Relations in the Economic System of the United States, Review of Economics and Statistics, 18 (3), p. 105-125.

126 The Making of Science, Technology…, 2009
science into the economic equation. The analyses immediately offered a framework and a semantic to official statisticians for organizing statistics on science, technology and innovation.
Some authors have argued that economics has been framed into an accounting “metaphor” for a very long time11
From the start, a distinction and a clarification must be made. The input-output framework should not be confused with another framework, called the linear model of innovation
. A metaphor is a figure of speech used to understand one thing in terms of another. This chapter is concerned with how the input-output framework, as accounting metaphor, got into a specific kind of activity – science, technology and innovation, and its measurement. The chapter is divided into three parts. The first reviews the economists’ model for studying science and its impact on the economy: the production function. Framed within an input-output vocabulary, the semantic was perfectly adapted to the official collection and interpretation of statistics for measuring the efficiency of science, technology and innovation investments. A large part of this section is devoted to the US National Bureau of Economic Research conference organized in 1960, which examined for the first time in history various aspects of the input-output framework. The second part looks at how the semantics of input and output entered into official statistics on science, technology and innovation. The work of the OECD and an influential consultant, Chris Freeman, serves here as the vehicle for examining the impact of the input-output framework on official science and technology statistics. The third part looks at what remains of the framework in current official statistics. It argues that the input-output framework is a symbolic representation or metaphor and has little to do with accounting as such.
12
11 A. Klamer and D. McCloskey (1992), Accounting as a Master Metaphor
of Economics, European Accounting Review, 1, p. 145-160.
. The former is an accounting framework for science activities, and is concerned with measuring upstream and downstream quantities and establishing
12 See Chapter 1 above.

The Making of Science, Technology…, 2009 127
empirical relationships between the two. The linear model of innovation is devoted rather to explaining research activities themselves. Certainly, the activities or steps identified by the linear model are usually measured using input and output indicators. But the linear model is an analytical one – that owes a large debt to statistics, certainly – while the input-output framework is a framework that leaves research activities themselves as a “black box”.
THE PRODUCTION FUNCTION
Science, technology and innovation came to be studied in quantitative terms by economists in the 1930s, namely in the context of increased mechanization of industries and the role of machines in the Great Depression. In order to measure technology as a cause of unemployment (technological unemployment as it was called), economists developed statistics linking technology to labor productivity (that is, equating the two), defined as “quantity output per employee man-year”. Most economists then “showed” that technology increases the productivity of labor13
The US Work Projects Administration has been quite influential. With over sixty projects conducted between 1938 and 1940, among them one on the impact of the depression on industrial laboratories
.
14
13 D. Weintraub (1937), Unemployment and Increasing Productivity, in
National Research Council, Technological Trends and National Policy, Washington.
, D. Weintraub, as director of the project on Reemployment Opportunities and Recent Change in Industrial Techniques, thought, in line with a study he conducted for the National Bureau of
14 G. Perazich and P. M. Field (1940), Industrial Research and Changing Technology, Work Projects Administration, National Research Project, report no. M-4, Pennsylvania: Philadelphia.

128 The Making of Science, Technology…, 2009
Economic Research in 193215, that measuring labor productivity as a ratio of “quantity output per employee man-year” would answer the question on technology and unemployment, “since the net effects of the underlying economic factors find their quantitative expression in the net changes of the volume of production and employment, a statistical analysis of the relationship between the total volume of goods and services produced in the country and the number of hired workers engaged in the production offers an approach toward a better understanding of the nature of a problem which has come to be referred popularly as that of technological unemployment”16. To Weintraub, “the unit-labor-requirement ratio indicates changes in man-years employed per unit of total output”17. If the same number of workers or less is required to produce the same level of output or more, it means that technology causes increased productivity, and therefore unemployment. Indeed, Weintraub found a disparity between production and employment: “while production in 1935 was 14 percent above 1920, the productivity of hired workers was 39 percent higher or the unit labor requirement was 28 percent lower (…). While 146 units of the nation’s output were being produced in 1929 for every 100 in 1920, only 16 percent more man-years were employed in 1929”18
Weintraub admitted, however, that his ratio of labor productivity “cannot be interpreted as measures of the extent of technological
.
15 For an early economic writer on framing the problem of technological
unemployment in terms of productivity, or input/output ratio, see: P. H. Douglas (1930), Technological Unemployment, American Federationist, 37 (8), p. 923-950; P. H. Douglas (1930), Technological Unemployment: Measurement of Elasticity of Demand as a Basis for Prediction of Labor Displacement, Bulletin of the Taylor Society, 15 (6), p. 254-270; P. H. Douglas and A. Director (1931), The Problem of Unemployment, New York: Macmillan, p. 119-164.
16 D. Weintraub (1937), Unemployment and Increasing Productivity, op. cit., p. 67.
17 Ibid., p. 72. 18 Ibid., p. 71-72.

The Making of Science, Technology…, 2009 129
advance”19. “To measure the full effect of even a single technological change on displacement or absorption would necessitate the virtually impossible task of tracing it through the innumerable factors which bear on the total volume of production and employment”20. “The effect of strictly technological change on employment in a single industry or even a single plant cannot be isolated (…). Over-all productivity ratios (…) reflect a variety of factors in addition to the mechanical improvements”21. In the end, Weintraub concluded that the productivity ratios “can be regarded as indicative of the effects of technological changes only in the broadest sense”22
Despite these caveats, measuring labor productivity became the main statistics on the outcomes of science and technology. Using the production function, economists began interpreting movements in the curve as technological change (the substitution of capital for labor), while others equated labor productivity with science (technological change is likely to result, all other things being equal, in labor productivity), and still others correlated R&D with productivity measures.
.
We often read in the literature that R. Solow was the first author to quantify, although imperfectly, the impact of science, technology and innovation on the economy. This is probably because his article is part of the very formalized tradition of econometrics23. Yet other authors preceded him by several years, as M. Abramovitz recalled24
The production function is an equation, or econometric “model” that links the quantity produced of a good (output) to quantities of input.
, and used the same kind of model: the production function.
19 Ibid., p. 78. 20 Ibid., p. 80. 21 Ibid., p. 79. 22 Ibid. 23 R. M. Solow (1957), Technical Change and the Aggregate Production
Function, Review of Economics and Statistics, 39, August, p. 312-320. 24 M. Abramovitz (1989), Thinking About Growth, New York: Cambridge
University Press, p. 71.

130 The Making of Science, Technology…, 2009
There are, at any given time, or so argue economists, inputs (labour, capital, technology) available to the firm, and a large variety of techniques by which these inputs can be combined to yield the desired (maximum) output. As E. Mansfield explained: “The production function shows, for a given level of technology, the maximum output rate which can be obtained from a given amount of inputs”25. Other economists shared his description: “Basically, technological progress consists of any change (…) of the production function that either permits the same level of output to be produced with less inputs or enables the former levels of input to produce a greater output”26
The production function was the first framework used to integrate science, technology and innovation into economic analyses. It had several variants: some simply interpreted movements in the production function, or curve, as technological change (the substitution of capital for labour), while others equated labour productivity with science (technological change is likely to result, all other things being equal, in labour productivity), and still others correlated R&D with multifactor productivity.
.
The production function is directly inspired by classical economics and the maximization axiom, or rationality as efficiency (means-ends): maximizing output for a given input, or minimizing input for a given output. C. W. Cobb and P. H. Douglas were the first to formalize the idea of the production function in the late 1920s27
25 E. Mansfield (1968), The Economics of Technological Change, New
York: Norton, p. 13.
. With
26 C. Ferguson (1969), Microeconomic Theory, Homewood: Richard D. Irwin Inc, p. 386.
27 C. W. Cobb and P. H. Douglas (1928), A Theory of Production, American Economic Review, 18, March, p. 139-165; P. H. Douglas (1948), Are There Laws of Production?, American Economic Review, 38, March, p. 1-41. Douglas also contributed to the debate on technological unemployment in the 1930s, using the concept of productivity. See: P. H. Douglas (1930), Technological Unemployment, American Federationist, 37 (8), p. 923-950; P. H. Douglas (1930), Technological Unemployment: Measurement of Elasticity of Demand as a Basis for Prediction of Labor

The Making of Science, Technology…, 2009 131
regard to science, we find an early use in J. Schumpeter’s works – a fact often forgotten today. In Business Cycles, Schumpeter defined innovation by means of the production function28: “This function describes the way in which quantity of product varies if quantities of factors vary. If, instead of quantities of factors, we vary the form of the function, we have an innovation”29. “Whenever at any time a given quantity of output costs less to produce than the same or a smaller quantity did cost or would have cost before, we may be sure, if prices of factors have not fallen, that there has been innovation somewhere”30
We had to wait for the patronage of the US National Bureau of Economic Research to see the development of a systematic and continued interest in science, technology and innovation and the production function, a development of which Solow was part (see Table 1). The 1930s, and the following decades, can in fact be described as the beginning of a long series of studies on productivity and the role of science in explaining growth rates.
. Innovation, then, is “the combination of factors in a new way”, “the setting up of a new production function”: a new commodity, a new form of organization, or opening up of new markets.
In 1960, in collaboration with the US Social Science Research Council, the National Bureau of Economic Research organized an important conference on the economics of science. The conference was probably the first time the production function was extensively discussed for studying science. In fact, most of the papers were concerned with an input-output framework. As Z. Griliches reported, the conference’s focus was “on the knowledge producing industry, its output, the resources available to it, and the efficiency with which
Displacement, Bulletin of the Taylor Society, 15 (6), p. 254-270; P. H. Douglas and A. Director (1931), The Problem of Unemployment, New York: Macmillan, p. 119-164.
28 J. Schumpeter (1939), Business Cycles, op. cit. 29 Ibid., p. 87. 30 Ibid., p. 89.

132 The Making of Science, Technology…, 2009
they are being used”31. Equally, to F. Machlup, “the analysis of the supply of inventions divides itself logically into three sections”: input, input-output relationship (the transformation of inventive labour into useful inventions), output32
The framework was not without its detractors. Perhaps the most critical was W. Leontief who, in the late 1960s, would argue that “elaborate aggregative growth models can contribute very little to the understanding of processes of economic growth, and they cannot provide a useful theoretical basis for systematic empirical analysis”
.
33. Regular users like Griliches were also critical: “the concept of a production function, frontier, or possibilities curve [is] a very unsatisfactory tool of analysis”34
31 Z. Griliches (1962), Comment on W. R. Mueller’s paper, in National
Bureau of Economic Research, The Rate and Direction of Inventive Activity, Princeton: Princeton University Press, p. 347.
. The criticisms generally centered around two lines of argument. First, how do we measure input and output with regard to science and technology? Second, what is the relationship between input and output?
32 F. Machlup (1962), The Supply of Inventors and Inventions, in National Bureau of Economic Research, The Rate and Direction of Inventive Activity, op. cit. p. 143.
33 W. Leontief (1970), Comment on J. S. Chipman’s paper, in R. Vernon (ed.), The Technology Factor in International Trade, National Bureau of Economic Research, New York: Columbia University Press, p. 132.
34 Z. Griliches (1962), Comment on W. R. Mueller’s paper, op. cit. p. 348.

The Making of Science, Technology…, 2009 133
Table 6. US National Bureau of Economic Research’s Early Studies on Productivity, Science,
Technology and Innovation
D. Weintraub (1932), The Displacement of Workers Through Increases in Efficiency and their Absorption by Industry.
F. C. Mills (1932), Economic Tendencies in the United States.
H. Jerome (1934), Mechanization in Industry.
F. C. Mills (1936), Prices in Recession and Recovery.
F. C. Mills (1938), Employment Opportunities in Manufacturing Industries of the United States.
G. S. Stigler (1947), Trends in Output and Employment.
S. Fabricant (1954), Economic Progress and Economic Change.
J. W. Kendrick (1961), Productivity Trends in the United States.
National Bureau of Economic Research (1962), The Rate and Direction of Inventive Activity.
These questions were discussed at length by Z. Griliches, S. Kutznets, F. Machlup, J. Schmookler and researchers from RAND35
35 K. J. Arrow, C. J. Hitch, B. H. Klein, A. W. Marchall, W. H. Meckling, J.
R. Minasian and R. R. Nelson.
, among others, at the National Bureau of Economic Research conference. Defining invention and understanding the process of invention was an issue addressed by almost every speaker. To a certain extent, the issue relied on appropriate statistics for measuring input and output. Almost all available statistics were criticized. In one of two introductory papers to the conference, B. S. Sanders, from the Patent, Trademark, and Copyright Foundation of George Washington University, declared: “none of the measures used to date is satisfactory even as a crude measure of inventiveness as such or

134 The Making of Science, Technology…, 2009
inventive activity”36. With regard to input measures, Sanders argued that labour devoted to inventive activity was badly measured, as were expenditures on R&D, because they were limited to institutions and subject to judgment. All in all, “neither the quality nor the completeness of the information which we now have, nor our conceptual understanding of the functional relationship between input and inventions, are such as to enable us to determine from apparent trends in input the trends in inventions”37. With regard to output, Sanders was equally critical: “We have devised no objective yardstick for the measurement of this quantity and may never be able to devise one (…). Substituting in its place some measurable end product far removed from the initial act of inventing (…) may be the nearest we shall ever be able to come to measuring invention”38. J. Schmookler did not entirely agree, particularly on patent statistics: “No one will dispute that accurate measures of a thing are always better than an uncertain index of it (…). In the meantime, much as we might prefer caviar, we had better settle for plain bread when that is all we can get. The question, therefore, is not whether to use statistics of aggregate patents granted or applied, but how”39
S. Kuznets was as pessimistic as Sanders, particularly with regard to the new data series on R&D coming out of the National Science Foundation’s recently-launched series of surveys, because it included development – an activity Kuznets qualified as adjustment, not original invention – and excluded the efforts of individuals and independent inventors
.
40
36 B. S. Sanders (1962), Some Difficulties in Measuring Inventive Activity,
in National Bureau of Economic Research, The Rate and Direction of Inventive Activity, op. cit. p. 53.
. The National Science Foundation
37 Ibid., p. 63. 38 Ibid., p. 65. 39 J. Schmookler (1962), Comment on B. S. Sanders’s paper, in National
Bureau of Economic Research, The Rate and Direction of Inventive Activity, op. cit. p. 78.
40 S. Kuznets (1962), Inventive Activity: Problems of Definition and Measurement, in National Bureau of Economic Research, The Rate and Direction of Inventive Activity, op. cit. p. 19-51.
The Making of Science, Technology…, 2009 135
representative, H. I. Liebling, accused Kuznets of applying “somewhat more rigorous standards to the R&D series than he does to the national income category we have learned from him”41. To Liebling, “in the construction of any complex set of statistics, attention must be given to its operational requirements in obtaining a successful measure, often requiring the adoption of certain conventions”42. To the National Science Foundation, he added, the “series on R&D expenditures is designed [mainly] to measure the scope of the scientific effort for government policy purposes”43
Defining input and output was only one of the two issues addressed during the conference. The other was the relationship between input and output. “Our economy operates on the belief that there is a direct causal relationship between input and the frequency and extent of inventions”, recalled Sanders
.
44. “No doubt there is a direct relationship of some kind, but we have no evidence that this relationship does not change”. Griliches asked the participants “whether an increase in inputs in the knowledge producing industry would lead to more output”45. Machlup’s answer was: “a most extravagant increase in input might yield no invention whatsoever, and a reduction in inventive effort might be a fluke result in the output that had in vain been sought with great expense”46
41 H. I. Liebling (1962), Comment on S. Kuznets’ paper, in National Bureau
of Economic Research, The Rate and Direction of Inventive Activity, op. cit. p. 89.
. To Griliches, “none of [the] studies [from the conference: J. R. Minasian,
42 Ibid., p. 88. 43 Ibid., p. 90. 44 B. S. Sanders (1962), Some Difficulties in Measuring Inventive Activity,
op. cit., p. 55. For a highly lucid analysis on the same topic at about the same time, see: W. H. Shapley (1959), Problems of Definition, Concept, and Interpretation of Research and Development Statistics, in National Science Foundation, Methodological Aspects of Statistics on Research and Development: Costs and Manpower, NSF 59-36, Washington
45 Z. Griliches (1962), Comment on W. R. Mueller’s paper, op. cit., p. 349. 46 F. Machlup (1962), The Supply of Inventors and Inventions, op. cit.,
p. 153.

136 The Making of Science, Technology…, 2009
R. R. Nelson, J. L. Enos, A. W. Marshall and W. H. Meckling] comes anywhere near supplying us with a production function for inventions”, and when they establish a relationship between input and output, these relationships “are not very strong or clear”47
The problem with regard to the relationship between input and output was threefold, the last part of which several participants discussed at the conference. First, there was the well-known problem of causality. Although J. R. Minasian, from RAND Corporation, concluded his study by affirming that “beyond a reasonable doubt, causality runs from research and development to productivity, and finally to profitability”
.
48, what the production function demonstrated was a correlation between input and output, rather than any causality. The production function is “only an abstract construction designed to characterize some quantitative relationships which are regarded as empirically relevant”, stated Machlup49. Second, there was the problem of lags between invention and its diffusion, which complicates measurements and was rarely addressed by econometricians. Related to this problem, and finally, there were difficulties in accounting correctly for returns on R&D. To Machlup, there were two schools of thought here: “According to the acceleration school, the more that is invented the easier it becomes to invent still more – every new invention furnishes a new idea for potential combination (…). According to the retardation school, the more that is invented, the harder it becomes to invent still more – there are limits to the improvement of technology”50
47 Z. Griliches (1962), Comment on W. R. Mueller’s paper, op. cit., p. 350.
. To Machlup, the first hypothesis was “probably more plausible”, but “an increase in opportunities to invent need not mean that inventions become easier to make; on the contrary, they become harder. In this case there
48 J. R. Minasian (1962), The Economics of Research and Development, in National Bureau of Economic Research, The Rate and Direction of Inventive Activity, op. cit. p. 95.
49 F. Machlup (1962), The Supply of Inventors and Inventions, op. cit., p. 155.
50 Ibid., p. 156.

The Making of Science, Technology…, 2009 137
would be a retardation of invention (…)”51, because “it is possible for society to devote such large amounts of productive resources to the production of inventions that additional inputs will lead to less than proportional increases in output”52
From the conference and its participants, we can conclude that the semantics of input and output, and a model linking the two, were definitely in place by the early 1960s, at least in economists’ prose. The model was far from perfect, but economists would make extensive use of it in the following decades, calculating social and private rates of return on R&D
.
53, estimating multifactor productivity and economic growth54, and measuring sectoral flows of technology55, as an extension to input-output tables56
51 Ibid., p. 162.
.
52 Ibid., p. 163. 53 Z. Griliches (1958), Research Costs and Social Return: Hybrid Corn and
Related Innovations, Journal of Political Economy, 66 (5), p. 419-431; E. Mansfield (1965), Rates of Return from Industrial R&D, American Economic Review, 55 (2), p. 310-32; J. R. Minasian (1969), R&D, Production Functions, and Rates of Return, American Economic Review, 59 (2), p. 80-85; E. Mansfield et al. (1977), Social and Private Rates of Return From Industrial Innovations, Quarterly Journal of Economics, May, p. 221-240.
54 E. F. Denison (1962), The Sources of Economic Growth in the United States and the Alternatives Before Us, Committee for Economic Development, New York; E. F. Denison (1967), Why Growth Rates Differ, Washington: Brookings Institution; D. W. Jorgensen and Z. Griliches (1967), The Explanation of Productivity Change, Review of Economic Studies, 34 (3), p. 249-283.
55 C. Maestre (1966), Vers une mesure des échanges intersectoriels entre la recherche et l’industrie, Progrès scientifique, 102, November, p. 2-45; F. M. Scherer (1982), Inter-Industry Technology Flows in the United States, Research Policy, 11, p. 227-245; K. Pavitt (1984), Sectoral Patterns of Technical Change: Towards a Taxonomy and a Theory, Research Policy, 13, p. 343-373; M. Robson, J. Townsend and K. Pavitt (1988), Sectoral Patterns of Production and Use of Innovations in the UK, 1945-1983, Research Policy, 17, p. 1-14.
56 W. Leontief (1936), Quantitative Input-Output Relations in the Economic System of the United States, op. cit.; W. Leontief (1953), Domestic Production and Foreign Trade: the American Capital Position Re-

138 The Making of Science, Technology…, 2009
Two years after the National Bureau of Economic Research conference, Machlup published his work on the knowledge economy, defined and measured as education, R&D, communication, information57. The whole work was based on an accounting framework. In his chapter on R&D, Machlup constructed a much-quoted table where a list of indicators on input and output were organized according to stages of research (basic research, applied research, development, innovation) and according to whether they were tangible or intangible, and whether they were measurable (see Appendix 3)58
THE ECONOMICS OF SCIENCE
. Machlup’s table marked a transition here. From a theoretical and “abstract construct”, the production function became a “practical” tool as well. Official statisticians would follow Machlup and adapt the input-output semantic to their efforts at measuring science. To understand how the input-output framework got into official statistics and indicators on science, technology and innovation, one has to turn to the OECD and UNESCO, and the work of an economist as consultant, Chris Freeman.
As documented in the previous chapter, the first edition of the OECD Frascati manual, written by C. Freeman, set the stage for an input-
Examined, Proceedings of the American Philosophical Society, 97 (4); W. Leontief (ed.) (1953), Studies in the Structure of the American Economy, op. cit.; W. Leontief (1966), Input-Output Economics, Oxford: Oxford University Press, 1986.
57 For a very early collection of several statistics on science (patents, inventions, discoveries) used for measuring knowledge and its growth, see W. F. Ogburn and S. C. Gilfillan (1933), The Influence of Invention and Discovery, in Recent Social Trends in the United States, Report of the President’s Research Committee on Social Trends, New York: McGraw Hill, p. 126.
58 F. Machlup (1962), The Production and Distribution of Knowledge in the United States, Princeton: Princeton University Press, p. 178-179. The table, with an acknowledgement to Machlup, first appeared in E. Ames (1961), Research, Invention, Development and Innovation, American Economic Review, 51 (3), p. 370-381.

The Making of Science, Technology…, 2009 139
output approach as a framework for science statistics. Freeman continued to advocate an input-output framework in the following years, to UNESCO officials among others. “There is no nationally agreed system of output measurement, still less any international system”, repeated C. Freeman in 1969 in a study on output conducted for UNESCO. “Nor does it seem likely that there will be any such system for some time to come. At the most, it may be hoped that more systematic statistics might become possible in a decade or two”59. The dream persisted, however, because “it is only by measuring innovations (…) that the efficiency of the [science] system (…) can be assessed”, continued Freeman60. “The output of all stages of R&D activity is a flow of information and the final output of the whole system is innovations – new products, processes and systems”61
To Freeman, “the argument that the whole output of R&D is in principle not definable is unacceptable (…). If we cannot measure all of it because of a variety of practical difficulties, this does not mean that it may not be useful to measure part of it. The GNP does not measure the whole of the production activity of any country, largely because of the practical difficulties of measuring certain types of work. The measurement of R&D inputs omits important areas of research and inventive activity. But this does not mean than GNP or R&D input measures are useless”
.
62
59 C. Freeman (1969), Measurement of Output of Research and
Experimental Development, UNESCO, ST/S/16, p. 8.
. And what about the relationship between input and output? “The argument that the input/output relationship is too arbitrary and uncertain in R&D activity to justify any attempts to improve efficiency or effectiveness (…) rests largely on the view that unpredictable accidents are so characteristic of the process that rationality in management is impossible to attain (…). The logical fallacy lies in assuming that, because accidental features
60 Ibid., p. 25. 61 Ibid., p. 27. 62 Ibid., p. 10-11.

140 The Making of Science, Technology…, 2009
are present in individual cases, it is therefore impossible to make useful statistical generalizations about a class of phenomena”63
Armed with such a “convincing” rationale, the Frascati manual continued, edition after edition, to suggest an input-output framework for science (under paragraph 1.4), as well as offering its readers an appendix discussing output indicators. It also continued to argue for the development of output indicators as follows: “Problems posed by the use of such data should not lead to their rejection as they are, for the moment, the only data which are available to measure output”
.
64. “At present, only R&D inputs are included in official R&D statistics and, thus, in the body of this manual. This is regrettable since we are more interested in R&D because of the new knowledge and inventions which result from it than in the activity itself”65
The 1993 edition of the manual innovated, however, by adding a table presenting the OECD “family” of methodological manuals on measuring science, among them three manuals on output indicators
.
66. What happened that could explain such a sudden development on output indicators (Table 7)?67
In 1973, the National Science Foundation published the first edition of Science Indicators, a compendium of statistics on science covering
63 Ibid., p. 11. 64 OECD (1981), The Measurement of Scientific and Technical Activities:
Proposed Standard Practice for Surveys of Research and Experimental Development, op. cit. p. 131.
65 Ibid., p. 17. 66 This was a small innovation, however, compared to the proposal, made
fifteen years before, about transforming the Frascati manual into a manual on indicators. See: OECD (1978), General Background Document for the 1978 Meeting of the Group of National Experts on R&D Statistics, DSTI/SPR/78.39 and annex.
67 To this table, we could add a working paper on bibliometrics: Y. Okubo (1997), Bibliometric Indicators and Analysis of Research Systems: Methods and Examples, OECD/GD (97) 41. This document, however, was not really a methodological manual.

The Making of Science, Technology…, 2009 141
both input and output68. What characterized the NSF publication, besides the fact that it was the first of a regular series that systematically collected a large number of statistics on science, was that it carried an input-output framework. Despite the quality of the publication, this framework was rapidly criticized by academics at conferences held in 1974 and 197669 and by other public organizations: Science Indicators is “too constricted by an input-output framework. In this approach, science and technology are seen as resources which go into, and tangible results which come out of, a black box”, complained the US General Accounting Office (GAO)70
Table 7. The OECD Family of R&D Manuals
.
1962 The Measurement of Scientific and Technical Activities: Proposed Standard Practice for Surveys of Research and Development (Frascati manual).
1990 Proposed Standard Practice for the Collection and Interpretation of Data on the Technological Balance of Payments.
1992 Proposed Guidelines for Collecting and Interpreting Technological Innovation Data (Oslo manual).
1994 Data on Patents and Their Utilization as Science and Technology Indicators.
1995 Manual on the Measurement of Human Resources in Science and Technology (Canberra manual).
68 B. Godin (2003), The Emergence of Science and Technology Indicators:
Why Did Governments Supplement Statistics with Indicators?, Research Policy, 32 (4), p. 670-690.
69 Papers from the conferences can be found in: Y. Elkana et al. (1978), Towards a Metric of Science: The Advent of Science Indicators, New York: John Wiley; H. Zuckerman and R. Balstad-Miller (eds.) (1980), Science Indicators 1976, Scientometrics, 2 (5-6), Special Issue.
70 GAO (1979), Science Indicators: Improvements Needed in Design, Construction, and Interpretation, Washington, p. 19.

142 The Making of Science, Technology…, 2009
Be that as it may, the publication caught the attention of the OECD and its second ad hoc review group on science statistics: output could be measured. The publication served as a catalyst to OECD efforts on measuring output. After more than twenty years devoted almost exclusively to collecting and analyzing data on inputs71, the OECD organized a large conference on output indicators in 1980, launched experimental studies and convened workshops concerned with specific output indicators: patents, technological receipts and payments, high-technology and innovation72
First, an analytical series entitled Science and Technology Indicators was started in 1984. Three editions were published, then replaced in 1988 by Main Science and Technology Indicators, a collection of statistics on science for each member country, covering both input and output series: GERD, R&D personnel, patents, technological balance of payments and high-technology trade. Main Science and Technology Indicators was complemented, in the mid 1990s, by a series titled Science, Technology and Industry Scoreboard, containing a larger set of statistics, and ranking countries accordingly. The second result from the OECD work was a series of methodological manuals on measuring output, and intended for official statisticians.
. These activities produced two results.
From the start, national statisticians vehemently criticized the indicators on output. The main point of controversy related to
71 OECD (1967), A Study of Resources Devoted to R&D in OECD Member
Countries in 1963/64: The Overall Level and Structure of R&D Efforts in OECD Member Countries, Paris; OECD (1971), R&D in OECD Member Countries: Trends and Objectives, Paris; OECD (1975), Patterns of Resources Devoted to R&D in the OECD Area, 1963-1971, Paris; OECD (1975), Changing Priorities for Government R&D: An Experimental Study of Trends in the Objectives of Government R&D Funding in 12 OECD Member Countries, 1961-1971, Paris; OECD (1979), Trends in Industrial R&D in Selected OECD Countries, 1967-1975, Paris.
72 B. Godin (2005), Measuring Output: When Economics Drives Science and Technology Measurement, in B. Godin, Measurement and Statistics on Science and Technology, op. cit.

The Making of Science, Technology…, 2009 143
methodology73. Every indicator was said to measure the phenomenon improperly, a point already made by Sanders and Kuznets, because of the limitation of the concepts underlying the indicators: patents measured only part of innovations; technological receipts and payments did not consider non-market exchanges of technology; and high-technology indicators minimized embodied technology and diffusion. To the OECD, however, these limitations were manageable. On patents, for example, the OECD argued: “There has been continuing controversy over the use of patent statistics. (…). But, as J. Schmookler wrote, we have a choice of using patent statistics continuously and learning what we can from them, and not using them and learning nothing. (…). All progress in this field will come ultimately from the reasoned use of this indicator which, while always taking into account the difficulties it presents, works to reduce them74. Similarly, for the indicator on high-technology: “Obviously, one has to be very careful in making policy conclusions on the basis of statistically observed relationships between technology-intensity measures and international competitiveness. Yet, as emphasized by one participant, to deny that policy conclusions can be made is to ignore some of the most challenging phenomena of the last decade”75
The main reason for criticizing output indicators, however, and one rarely avowed, had to do with the fact that the data came from other sources than the official survey, sources over which the official statisticians had no control
.
76
73 Ibid.
. Nevertheless, one output indicator gained rapid and widespread consensus among national statisticians: the measurement of technological innovation. From the beginning, science policy was definitively oriented toward economic goals and
74 OECD (1983), State of Work on R&D Output Indicators, SPT (83) 12, p. 11.
75 OECD (1980), Preliminary Report of the Results of the Conference on Science and Technology Indicators, SPT (80) 24, p. 18.
76 B. Godin (2005), Measuring Output: When Economics Drives Science and Technology Measurement, op. cit.

144 The Making of Science, Technology…, 2009
technological innovation. In fact, to policy-makers, innovation was always considered to be the final output of the science system, as suggested by Freeman. What helped achieve the consensus view on innovation indicators was the fact that official statisticians could develop a tool that they controlled: the survey of innovation activities77
Having measured input and output, the OECD could then turn to the task of relating them to one another. It did so precisely on the same topic as that studied by economists in the 1950s – growth and productivity – and with the same methodology: the production function and multifactor productivity. In the 1990s, as discussed below (Chapter 4), as part of the OECD Growth Project, the Directorate for Science, Technology and Industry analyzed economic growth and productivity trends and the role that information and communication technologies play in it.
.
AN ACCOUNTING FRAMEWORK
Linking input to output came quite late in official statistical work on science. As a matter of fact, no input-output ratio has even been constructed by national bureaus of statistics to measure the efficiency of science. The one and only ratio in the official literature is GERD/GDP78
77 B. Godin (2005), The Rise of Innovation Surveys: Measuring a Fuzzy
Concept, in B. Godin, Measurement and Statistics on Science and Technology, op. cit.
. Certainly, one could argue that GDP accounts for (economic) output. But the ratio GERD/GDP measures intensity or efforts (that part of economic activities devoted to R&D), not efficiency.
78 And variants on this measure. See: B. Godin (2004), The Obsession for Competitiveness and its Impact on Statistics: The Construction of High-Technology Indicators, Research Policy, 33 (8), p. 1217-1229.

The Making of Science, Technology…, 2009 145
Nor can one find any trace of input-output framework in recent scoreboards of statistics. Certainly, the very first editions of the scoreboards included some elements, in the sense that indicators were grouped into categories corresponding, among others, either to inputs or outputs, the latter with this precise label. The following editions, however, reorganized the groupings and re-labeled the categories without any trace of the input-output semantics. Scoreboards are actually simple collections of statistics, where ranking of countries is the (very indirect and only) measure of efficiency.
We have, then, to look elsewhere for traces of accounting and efficiency in official statistics on science. The very first edition of the Frascati manual suggested classifying R&D by dimension. One of the central dimensions was concerned with economic sectors. In line with the system of national accounts, and following the practice of the National Science Foundation79, the manual recommended collecting and classifying R&D according to the following four main economic sectors: business, government, university and private non-profit80
Yet this “accounting” is not real accounting. First, with regard to inputs: despite its alignment with the system of national accounts, GERD is not really a national budget, as we have documented in the previous chapter. Second, outputs are measured via proxies rather than as actual outputs, and are constructed from different sources that
. This alignment to the system of national accounts gave us Gross Expenditures on R&D (GERD), which is the sum of R&D expenditures in the four economic sectors, and gave us the matrix of R&D flows between economic sectors of the System of National Accounts.
79 K. Arnow (1959), National Accounts on R&D: The National Science
Foundation Experience, in NSF, Methodological Aspects of Statistics on R&D, op. cit. p. 57-61; H. E. Stirner (1959), A National Accounting System for Measuring the Intersectoral Flows of R&D Funds in the United States, in NSF, Methodological Aspects of Statistics on R&D, op. cit. p. 31-38.
80 Households, as a sector in the SNA, was not considered separately by the manual, but was included in the non-profit sector.

146 The Making of Science, Technology…, 2009
do not share any common framework. Third, very few, if any, official statistics exists that link input to output as measures of efficiency. In retrospect, the efficiency in official statistics on science is rather symbolic, or a semantics based on an accounting metaphor within which numbers are discussed and presented.
What then are the virtues of this framework? A framework is a representation. It provides meaning and organization. The input-output framework was part of the understanding of science policy that developed after World War II. The measurement of science emerged within a background and an intellectual context composed of ideas and models all concerned with accounting and efficiency81. The production function was one such, as was the System of National Accounts82 and the input-output tables83. But there were also operations research, cybernetics, system analysis, and the emerging positive political science, all concerned with rational choice and costs-benefit analyses84
81 On this context, see: P. Miller and T. O’Leary (1987), Accounting and the
Construction of the Governable Person, Accounting, Organizations and Society, 12 (3), p. 235-265.
. This whole “philosophy” of accounting
82 P. Studenski (1958), The Income of Nations: Theory, Measurement, and Analysis: Past and Present, New York: New York University Press; N. Ruggles and R. Ruggles (1970), The Design of Economic Accounts, NBER, New York: Columbia University Press; F. Fourquet (1980), Les comptes de la puissance: histoire de la comptabilité nationale et du plan, Paris: Encres; A. Vanoli (2002), Une histoire de la comptabilité nationale, Paris: La Découverte. A. Maddison (2003), The World Economy: Historical Statistics, Paris: OECD.
83 W. Leontief (1966), Input-Output Economics, op. cit. 84 A. Wildavsky (1966), The Political Economy of Efficiency: Cost-Benefit
Analysis, Systems Analysis, and Program Budgeting, Public Administration Review, 26 (4), p. 292-310; I. R. Hoos (1972), Systems Analysis in Public Policy: A Critique, Berkeley: University of California Press. RAND, one of the pioneers on the economics of technical change, was part of this movement (see the paper from RAND researchers for the NBER conference). However, the focus at RAND was generally on allocating resources to science and technology rather than with an input-output framework per se. See: D. A. Hounshell, The Medium is the Message, or How Context Matters: the RAND Corporation Builds an Economics of Innovation, 1946-1962, in A. C. Hughes and T. P. Hughes

The Making of Science, Technology…, 2009 147
spread rapidly to official statistics: social indicators85, education86, environment87, health88, human capital89
In this context, the input-output framework as metaphor served discourses on science policy in the sense that it contributed to making sense of (already made) decisions. C. Freeman’s is a good example of such argumentation: “As long as governments or enterprises were spending only very small sums on scientific research, they could afford to regard this outlay in a very similar way to patronage of the arts, using prestige criteria rather than attempting to assess efficiency. But it is one thing to endow an occasional eminent scientist; it is quite another to maintain laboratories regularly employing thousands of scientists and technicians on a continuous basis. The increased scale of scientific activities led inexorably to an increased concern with their effectiveness”
and … science.
90
If there was any real accounting in science policy, it did not owe anything to official statistics and its input-output framework. It was conducted elsewhere than in statistical offices – in government departments – and with other kinds of statistics: administrative data.
.
(eds.) (2000), Systems, Experts, and Computers: The Systems Approach in Management and Engineering, World War II and After, Cambridge (Mass.): MIT Press, p. 255-310.
85 UNESCO (1952), Report of the World Social Situation, Paris; US Department of Health, Education, and Welfare (1970), Towards a Social Report, op. cit.; United Nations (1975), Towards a System of Social and Demographic Statistics, Studies in Methods, Series F, 18, New York, United Nations; United Nations (1989), UN Handbook on Social Indicators, New York: United Nations.
86 OECD (1992), Education at a Glance: OECD Indicators, Paris. 87 P. Bartelmus et al. (1991), Integrated Environmental and Economic
Accounting Framework for a SNA Satellite System, Review of Income and Wealth, 2, p. 111-148.
88 OECD (2000), A System of Health Accounts, Paris. 89 OECD (1996), Measuring What People Know: Human Capital
Accounting for the Knowledge Economy, Paris; OECD (1998), Human Capital Investment: An International Comparison, Paris.
90 C. Freeman (1969), Measurement of Output of Research and Experimental Development, op. cit. p. 7.

148 The Making of Science, Technology…, 2009
Official statistics, because they were “too macro”, were usually not appropriate to such tasks. They were what I have elsewhere called “contextual” data91. As the OECD admitted recently: “Monitoring and benchmarking are not coupled with policy evaluation (…). They are seldom used for evaluation purposes (…) but to analyze [countries’] position vis-à-vis competing countries and to motivate adaptation or more intense policy efforts (…)”92
Official statistics mainly served discourse purposes, and in this sense the input-output framework and the statistics presented within it were influential because they fit perfectly well with the policy discourse on rationality, efficiency and accountability: it aligns and frames the science system, by way of statistics, as goal-oriented and accountable. As it actually exists, accounting and efficiency in official statistics on science is a metaphor
.
93
CONCLUSION
.
Accounting of a certain type exists in science. For decades, firms have constructed input-output ratios to assess rates of return on their
91 B. Godin (2005), Are Statistics Really Useful? Myths and Politics of
Science and Technology Measurement, in B. Godin, Measurement and Statistics on Science and Technology, op. cit.
92 OECD (2005), Governance of Innovation Systems, vol. 1, Paris: OECD, p. 64.
93 For a reading of accounting as symbolic and metaphoric, see: B. G. Carruthers and W. N. Espeland (1991), Accounting for Rationality: Double-Entry Bookkeeping and the Rhetoric of Economic Rationality, American Journal of Sociology, 97 (1), p. 31-69. Some authors prefer talking of accounting as a “social and organizational” practice for naming the ideology of efficiency by numbers. This includes all types of accounting that are implicated in economic activities such as costing, budgeting, cost-benefit analysis, risk assessment, censuses, samples, etc. See: A. G. Hopwood and P. Miller (eds.) (1994), Accounting as Social and Institutional Practice, Cambridge: Cambridge University Press; M. Power (ed.) (1994), Accounting and Science: Natural Inquiry and Commercial Reason, op. cit.

The Making of Science, Technology…, 2009 149
investments94, including investments in R&D95. Governments have conducted their evaluation exercises using data that deal with both investments and results96
Academics were very influential in these accounting developments. The first were economists, above all C. Freeman, author of the first edition of the OECD Frascati manual. Very early on, Freeman conducted statistical studies linking input to output
. The input-output framework used to frame official statistics on science is part of this movement, as were other official “accounting” exercises such as the measurements of the technological balance of payments, the balance between types of research (fundamental and applied), and human capital.
97, and remained a fervent advocate of the input-output framework for decades98
94 H. T. Johnson and R. S. Kaplan (1987), Relevance Lost: The Rise and
Fall of Management Accounting, Boston: Harvard Business School Press.
. This framework came directly from mainstream economics, and F. Machlup has been very influential here. By the end of the 1960s, however, few traces of the production function remained in statistics on science, technology and innovation except in econometric studies on productivity. The input-output framework now had a life of its own. D. J. D. Price, an historian of science and one of the founders of
95 F. Olsen (1948), Evaluating the Results of Research, in C. C. Furnas (ed.), Research in Industry: Its Organization and Management, Princeton: D. Van Nostrand, p. 402-415.
96 Office of Technology Assessment (1978), Research Funding as an Investment: Can We Measure the Returns?, USGPO: Washington.
97 C. Freeman (1962), Research and Development: A Comparison Between British and American Industry, National Institute Economics Review, 20, May, p. 21-39; C. Freeman, R. Poignant and I. Svennilson (1963), Science, Economic Growth and Government Policy, op. cit.
98 C. Freeman and A. Young (1965), The Research and Development Effort in Western Europe, North America and the Soviet Union, op. cit; C. Freeman (1967), Research Comparisons, Science, 158 (3800), October 27, p. 463-468; C. Freeman (1969), Measurement of Output of Research and Experimental Development, op. cit.; C. Freeman (1974), The Economics of Industrial Innovation, London: Penguin Books; C. Freeman (1982), Recent Developments in Science and Technology Indicators: A Review, mimeo, Brighton: SPRU.

150 The Making of Science, Technology…, 2009
scientometrics and bibliometrics99, was an influential person in this respect. He collected several indicators to measure science as a system, presented them in an input-output framework, and suggested all sort of input-output ratios100
A second historical source for the input-output framework has to be mentioned, namely the management of industrial research and cost control. Establishing a relationship between input and output at the national level, that is, the level that interests governments most, is in fact the analogue of the firms’ “return on investment” (ROI) ratio. For decades, managers have constructed such ratios in order to evaluate their investments
. The National Science Foundation, with its series of indicators published every two years from 1973 onward, was equally influential. In the following decades, most researchers would use an input-output framework to conduct “accounting” or evaluation exercises of investments in science.
101
99 D. J. D. Price (1963), Little Science, Big Science, New York: Columbia
University Press.
. Very early on, these ratios came to be
100 See, for example: D. J. D. Price (1967), Nations can Publish or Perish, Science and Technology, October, p. 84-90; D. J. D. Price (1967), Research on Research, in D. L. Arm (ed.), Journeys in Science, University of New Mexico Press, p. 1-21; D. J. D. Price (1978), Toward a Model for Science Indicators, in Y. Elkana et al. (eds.), Towards a Metric of Science: The Advent of Science Indicators, New York: Wiley & Sons, p. 69-95; D. J. D. Price (1980), Towards a Comprehensive System of Science Indicators, Paper presented to the Conference on “Evaluation in Science and Technology: Theory and Practice”, Dubrovnik, July; and to the “Quality Indicators Seminar”, MIT, October; D. J. D. Price (1980), A Theoretical Basis for Input-Output Analysis of National R&D Policies, in D. Sahal (ed.), Research Development and Technological Innovation, D. C. Heath and Co., p. 251-260.
101 A. D. Chandler (1977), The Visible Hand: The Managerial Revolution in American Business, Cambridge: Belknap Press; H. T. Johnson (1978), Management Accounting in an Early Multidivisional Organization: General Motors in the 1920s, Business History Review, 52 (4), p. 490-517; H. T. Johnson and R. S. Kaplan (1987), Relevance Lost: The Rise and Fall of Management Accounting, Boston: Harvard Business School Press; D. A. Hounshell and J. K. Smith (1988), Science and Corporate Strategy: Du Pont R&D, 1902-1980, Cambridge: Cambridge University Press.

The Making of Science, Technology…, 2009 151
applied to R&D activities. By the 1950s, most companies calculated ratios like R&D as a percentage of earnings, as a percentage of sales, or as a percentage of value-added102, and a whole “industry” developed around studying the “effectiveness” of research103. Very few administrative decisions really relied consistently on metrics104
102 F. Olsen (1948), Evaluating the Results of Research, in C. C. Furnas (ed.)
(1948), Research in Industry: Its Organization and Management, Princeton: D. Van Nostrand, p. 402-415; A. Abrams (1951), Contribution to the Session on Measuring the Returns from Research, in Engineering Research Institute, Proceedings of the Fourth Annual Conference on the Administration of Research, University of Michigan, September 11-13, 1950, University of Michigan, p. 22-24; R. N. Anthony and J. S. Day (1952), Management Controls in Industrial Research Organizations, Boston: Harvard University, p. 286-300; J. B. Quinn (1960), How to Evaluate Research Output, Harvard Business Review, March-April, p. 69-80.
, but it was not long before performance ratios came to be applied to
103 R. M. Hogan (1950), Productivity in Research and Development, Science, 112 (2917), November 24, p. 613-616; D. C. Pelz (1956), Some Social Factors Related to Performance in a Research Organization, Administrative Science Quarterly, 1, p. 310-325; J. B. Quinn (1959), Yardsticks for Industrial Research: The Evaluation of Research and Development Output, New York: Ronald Press; N. Kaplan (1960), Some Organizational Factors Affecting Creativity, IEEE Transactions of Engineering Management, 30, p. 24-30; The Institution of Chemical Engineers (1963), Productivity in Research, Proceedings of a Symposium held in London on 11-12 December 1963, London; B.-A. Lipetz (1965), The Measurement of Efficiency of Scientific Research, Carlisle: Intermedia; R. E. Seiler (1965), Improving the Effectiveness of Research and Development, New York: McGraw Hill; M. C. Yovits et al. (eds.) (1966), Research Program Effectiveness, New York: Gordon and Breach; D. C. Pelz and F. M. Andrews (1966), Scientists in Organizations: Productive Climate for Research and Development, New York: John Wiley; B. V. Dean (1968), Evaluating, Selecting, and Controlling R&D Projects, American Management Association.
104 For evidence, see: National Science Foundation (1956), Science and Engineering in American Industry, op. cit, Washington; A. H. Rubenstein (1957), Setting Criteria for R&D, Harvard Business Review, January-February, p. 95-104; N. C. Seeber (1964), Decision-Making on R&D in the Business Firm, Reviews of Data on R&D, 44, February, NSF 64-6, Washington: National Science Foundation.

152 The Making of Science, Technology…, 2009
aggregated statistics on industrial R&D105 and national R&D expenditures106
There are currently two explanations or rationales offered for statistics and accounting on science. The most common rationale is “controlling” science, in the sense of limiting expenses, for example. The very first edition of the Frascati manual assigned two main goals to this practical side of statistics: managing research and assessing returns on R&D
. In the latter case, GDP served as denominator, producing the famous GERD/GDP ratio as the objective of science policies.
107
105 J. V. Sherman (1941), Research as a Growth Factor in Industry, op. cit.;
K. T. Compton (1941), Industrial Research Expenditures, in Ibid., p. 124-125; US National Association of Manufacturers (1949), Trends in Industrial Research and Patent Practices, op. cit.; US Bureau of Labor Statistics (1953), Industrial R&D: A Preliminary Report, Department of Labor and Department of Defense; Bureau of Labor Statistics (1953), Scientific R&D in American Industry: A Study of Manpower and Costs, Bulletin no. 1148, Washington; D. C. Dearborn, R. W. Kneznek and R. N. Anthony (1953), Spending for Industrial Research, 1951-1952, op. cit.; National Science Foundation (1956), Science and Engineering in American Industry, op. cit.; National Science Foundation (1960), Funds for R&D in Industry: 1957, NSF 60-49, Washington. For Great Britain, see: Federation of British Industries (1952), R&D in British Industry, London: FBI; DSIR (1958), Estimates of Resources Devoted to Scientific and Engineering R&D in British Manufacturing, op. cit. For Canada, see: Dominion Bureau of Statistics (1956), Industrial R&D Expenditures in Canada, 1955, Reference paper no. 75, Ottawa.
. Management of research (or management control) consists of “the optimum use of resources” and involves concepts like the productivity of research and the balance between types of research. Assessment of returns deals with the effectiveness of research. Yet science policy is full of statistics used not to control
106 J. D. Bernal (1939), The Social Function of Science, Cambridge (Mass.): MIT Press, 1973; R. H. Ewell (1955), Role of Research in Economic Growth, Chemical and Engineering News, 18 July, p. 2980-2985; NSF (1956), Expenditures for R&D in the United States: 1953, Reviews of Data on R&D, 1, NSF 56-28, Washington.
107 OECD (1962), The Measurement of Scientific and Technical Activities: Proposed Standard Practice for Surveys of Research and Development, op. cit. p. 9-11.

The Making of Science, Technology…, 2009 153
science, but to make a case for providing increasing resources to science, such as in the current official literature on the knowledge-based economy.
A second rationale relates to the theoretical use of statistics and the input-output framework – and this was mentioned in the first edition of the Frascati manual108. The framework is a kind of “model” that explains science activities. It is centered on a specific kind of “mechanisms” and has a certain truth: inputs come first, and without money and personnel there would be no output. It is an administrative or accounting view, and is concerned exclusively with accounting of an economic type. Another understanding, developed by academics with the same semantics, started with suggesting that science is a complex phenomenon, or system as Price suggested. To measure science properly, one therefore needs to take account of several dimensions: inputs, but also outputs and outcomes109
A third rationale, or use, is for efficiency in science to act as “rhetoric”. We have seen how accounting in official statistics on science is a representation. By representation, we do not mean just an idea. A representation, like an imaginary or ideology, is an ideal. It is a “common understanding that makes possible common practices and a widely shared sense of legitimacy”
. This “philosophy” is known as multiple converging indicators.
110
108 Information and description, evolution, comparison.
. A representation incorporates expectations and norms about how people or things behave and fit together, and suggests courses of action. By definition, the representation carried by official statistics is (usually) that of its patron, the State. Whether or not the representation really serves accounting as such does not matter. It suffices that the rhetoric (of
109 K. Pavitt (1982), R&D, Patents and Innovative Activities, Research Policy, 11, p. 33-51; B. R. Martin and J. Irvine (1983), Assessing Basic Research: Some Partial Indicators of Scientific Progress in Radio Astronomy, Research Policy, 12, p. 61-90.
110 C. Taylor (2004), Modern Social Imaginaries, Durham: Duke University Press, p. 23.

154 The Making of Science, Technology…, 2009
efficiency) appear to be real, since rationalizing and justifying decisions to the nation rest in large part on a web of discourses that look coherent and seem to make sense with decisions taken at the organizational level where accounting is real.

The Making of Science, Technology…, 2009 155
CHAPTER FOUR
ECONOMIC GROWTH, PRODUCTIVITY AND THE NEW ECONOMY
Spending money on research in order that society and the economy benefit has always been the driving force behind public investment in science and technology. Even during the so-called “policy for science” period (1950s-1960s), governments never funded research for its own sake. The goals were varied and many, and ultimately utilitarian – political, economic and social.
In the literature, most if not all measured impacts of science and technology concentrate on the economic dimension. In the 1950s, economists began integrating science and technology into their models, and focused on the impact of R&D on economic growth and productivity. Cost/benefit analyses were conducted and econometric models developed that tried to measure what the economy owed to science and technology. The limitations of the studies were many, as this chapter documents, but never so large, from the economist’s point of view, as to question the validity of the results.
In the 1990s, these studies coalesced into new growth theories and the concept of the New Economy. The new economy referred to data that indicated the appearance of new economies in the United States and in a number of smaller OECD countries not very “vibrant” in terms of entrepreneurship. What characterized new economies was the acceleration of trend growth and productivity. Technologies, particularly information and communication technologies, were believed to be at the heart of the phenomenon, and several researchers, both from universities and governments, developed programs of work to study the phenomenon.

156 The Making of Science, Technology…, 2009
Why and how did governments and statistical offices develop an interest in measuring growth and productivity and the role of science, technology and innovation? I suggest looking to the OECD to answer this question because, as a think tank, the organization has over time developed an influential framework used in its member countries.
This chapter is divided into three parts. The first is a brief presentation of early academic methodologies for measuring the economic impact of R&D. The second part traces the main events and decisions that led to the OECD’s Directorate for Science, Technology and Industry measuring the contribution of science, technology and innovation to economic growth and productivity. The third and final part examines the rhetorical construction recently developed at the OECD to convince people that there was something new happening in the economy (the New Economy), and shows that the main factor responsible for this situation was technology.
INTEGRATING SCIENCE AND TECHNOLOGY INTO THE ECONOMETRIC EQUATION
In 1955, R. H. Ewell from the National Science Foundation conducted one of the first quantitative analyses of R&D showing (sic from the editor of the magazine) a definite correlation between research, economic growth and productivity1. According to Ewell, “R&D conducted during the preceding 25-year period contributed to $40 to $80 billion of the GNP in 1953” by way of new products and by lowering the cost of production for old ones2
1 R. H. Ewell (1955), Role of Research in Economic Growth, Chemical
and Engineering News, 18 July, p. 2980-2985.
. These gains implied that “the GNP would have been only $285 to $325 billion in 1953 if no research had been conducted since 1928 (…), or looked at cumulatively, there would have been a cumulative loss of national
2 Ibid., p. 2984.

The Making of Science, Technology…, 2009 157
product of $400 to $800 billion during the period 1928-53 in the absence of research”3
Ewell also calculated the return on research investment: R&D expenditures of $1.5 billion produced $40-$80 billion in benefits, that is, a 2,000% to 5,400% overall return, or 100% to 200% annually over a 25 year period, a relatively high rate of return compared to other areas of investment
.
4. “In fact, it indicates that from an investment standpoint we probably should be putting more of the national income, or of the national effort, into research than we are now doing”5. “This would mean that the $4 billion spent on research in 1955 should result in a cumulative increment to the national product of $100 to $200 billion in 25 years”6. All in all, concluded Ewell, “research may be the most important single factor in economic growth in the United States”7
The methodology of the study was very sketchy. Ewell used fragmentary data dating back to 1920 (and before, even going back to 1776) to project R&D expenditures of $6.9 billion in 1965 based on past trends, and to project a requirement of 75,000 research scientists and engineers
.
8. His estimates of the impact of research on productivity were highly speculative, based on rough over-all estimates and a margin of error by a factor of two9. But the limitations, according to the author, did “not really affect the conclusions”10
3 Ibid.
.
4 Ibid., p. 2985. 5 Ibid. 6 Ibid. 7 Ibid., p. 2980. 8 Ibid., p. 2982. 9 Ibid., p. 2983. Based on cursory analyses of the new products and
technological changes in 40 industries since 1928 and on discussions with a number of industrial research leaders.
10 Ibid., p. 2980.

158 The Making of Science, Technology…, 2009
Ewell’s early efforts at linking science and economic growth would soon be followed by others. The task has occupied economists since the mid-1950s, when they began integrating science, technology and innovation into their theoretical models. These efforts began at the US Department of Agriculture11 – one of the first departments to set up a Bureau of Economic Research12 – and the US National Bureau of Economic Research13
Until the 1950s, economic growth was explained as a function of capital and labour – the Cobb-Douglas function
.
14. Science and technology came to be added in the following two ways. Firstly, R. M. Solow formalized early works on growth accounting (decomposing GDP into capital and labor and equated the residua in his equation with technical change – although it included everything that was neither capital nor labor – as “a shorthand expression for any kind of shift in the production function”15. Integrating science and technology into the equation was thus not a deliberate initiative, but it soon became a fruitful one. Solow estimated that nearly 90% of growth was due to the residual. In the following years, researchers began adding variables to the equation in order to better isolate science and technology16
11 For a brief summary of the studies coming out of the Department, see Z.
Griliches (1998), R&D and Productivity: The Econometric Evidence, Chicago: University of Chicago Press, p. 1-3.
, or adjusting the labour and capital factors
12 G. M. Lyons (1969), The Uneasy Partnership: Social Sciences and the Federal Government in the 20th Century, New York: Sage.
13 J. Kendrick (1961), Productivity Trends in the United States, NBER, Princeton: Princeton University Press.
14 R. R. Solow (1956), A Contribution to the Economic Theory of Economic Growth, Quarterly Journal of Economics, 70 (1), p. 65-94.
15 R. M. Solow (1957), Technical Change and the Aggregate Production Function, Review of Economics and Statistics, 39, August, p. 312-320.
16 E. F. Denison (1962), The Sources of Economic Growth in the United States and the Alternatives Before Us, Committee for Economic Development, New York; E. F. Denison (1967), Why Growth Rates Differ, Washington: Brookings Institution.

The Making of Science, Technology…, 2009 159
to capture quality changes in output17. Since these first calculations, the literature on the topic has grown considerably18
Solow’s approach has been the dominant methodology for studies on science, economic growth and productivity, and more recent studies still suggest a large growth residual, generally accounting for one-third of productivity. There was, however, another approach for integrating science and technology into studies of economic growth: calculating rates of return on R&D by way of cost/benefit analyses and econometrics
. Typically, a 1% increase in the R&D investment is found to lead to a rise in output of between 1% and 5%.
19
The second type of economic model into which science and technology began to be integrated was that dealing with international trade
. These studies concluded that the large majority of R&D projects produces social returns that exceeded the private financial returns, generally by a factor of two (between 20% and 50% on average).
20
17 D. W. Jorgenson and Z. Griliches (1967), The Explanation of
Productivity Change, Review of Economic Studies, 34 (3), p. 249-283.
. Until the 1960s, the current model of international trade, known as Heckscher-Ohlin-Samuelson, centered on resource endowments as the main factor explaining international trade patterns. However, in the 1960s, following Wassily Leontief’s
18 For an overview, see: G. Cameron (1998), Innovation and Growth: A Survey of the Empirical Evidence, Nuffield College, Oxford.
19 Z. Griliches (1958), Research Costs and Social Return: Hybrid Corn and Related Innovations, Journal of Political Economy, 66 (5), p. 419-431; E. Mansfield (1965), Rates of Return from Industrial R&D, American Economic Review, 55 (2), p. 310-32; J. R. Minasian (1969), R&D, Production Functions, and Rates of Return, American Economic Review, 59 (2), p. 80-85; E. Mansfield et al. (1977), Social and Private Rates of Return From Industrial Innovations, Quarterly Journal of Economics, May, p. 221-240.
20 For an overview, see: P. Krugman (1995), Technological Change in International Trade, in P. Stoneman (ed.), Handbook of the Economics of Innovation and Technological Change, Oxford: Blackwell, p. 342-365.

160 The Making of Science, Technology…, 2009
work21, authors began introducing additional factors, among them technology (generally measured by R&D), to explain why some countries led in terms of trade and others lagged22. This interest in using technology to explain international trade patterns appeared in response to the persistent and structural shortage of dollars in the world, and the ensuing foreign-trade patterns. The new studies suggested that countries were not equal in terms of publicly available science and technology. Some became leaders because they innovated and disseminated technologies before others23
The two models – of economic growth and international trade – are often intimately related today. Studies on convergence of countries or
.
21 W. Leontief (1953), Domestic Production and Foreign Trade: the
American Capital Position Re-Examined, Proceedings of the American Philosophical Society, 97 (4); W. Leontief (ed.) (1953), Studies in the Structure of the American Economy, New York: Oxford University Press.
22 M. V. Posner (1961), International Trade and Technical Change, Oxford Economic Papers, 13, p. 323-341; R. Vernon (1966), International Investment and International Trade in the Product Cycle, Quarterly Journal of Economics, 80, p. 190-207; R. Vernon (ed.) (1970), The Technology Factor in International Trade, NBER, New York: Columbia University Press; S. Hirsch (1965), The United States Electronics Industry in International Trade, National Institute Economic Review, 34, p. 92-97; G. C. Hufbauer (1965), The Impact of National Characteristics and Technology on the Commodity of Trade in Manufacturing Goods, in R. Vernon (ed.), The Technology Factor in International Trade, op. cit. p. 145-231; D. B. Keesing (1967), The Impact of R&D on United States Trade, Journal of Political Economy, 25 (1), p. 38-48; W. Gruber, D. Mehta and R. Vernon (1967), The R&D Factor in International Trade and International Investment of United States Industries, Journal of Political Economy, 25 (1), p. 20-37.
23 M. Abramovitz (1986), Catching Up, Forging Ahead, and Falling Behind, Journal of Economic History, XLVI (2), p. 385-406; J. Fagerberg (1994), Technology, and International Differences in Growth Rates, Journal of Economic Literature, 32, p. 1147-1175; J. Fagerberg, B. Varspagen and N. von Tunzelmann (1994), The Dynamics of Technology, Trade and Growth, Aldershot (Hants): Edward Elgar.

The Making of Science, Technology…, 2009 161
technological gaps (catch-up) are an illustration of such links24
STUDYING GROWTH AND PRODUCTIVITY AT THE OECD
. In the rest of this chapter, however, I will concentrate on economic growth.
Very early on, the mathematics behind economists’ models was qualified as “not strong enough to permit very accurate estimates (…). At best, the available estimates are rough guidelines” wrote E. Mansfield in a review article published in 197225. Twenty-five years later, Z. Griliches concluded that “the quantitative basis for these convictions [links between investments in science, technology and innovation to economic growth] is rather thin”, and pleaded for realism26
24 M. Abramovitz (1986), Catching Up, Forging Ahead, and Falling Behind,
Journal of Economic History, XLVI (2), p. 385-406; W. J. Baumol (1986), Productivity Growth, Convergence, and Welfare: What the Long-Run Data Show, American Economic Review, 76 (5), p. 1072-1085; J. Fagerberg, B. Varspagen and N. von Tunzelmann (1994), The Dynamics of Technology, Trade and Growth, Aldershot (Hants): Edward Elgar; W. J. Beaumol, R. R. Nelson and E. N. Wolff (eds.) (1994), Convergence of Productivity: Cross-National Studies and Historical Evidence, Oxford: Oxford University Press; M. Abramovitz and P. A. David (1996), Convergence and Deferred Catch-Up: Productivity Leadership and the Waning of American Exceptionalism, in R. Laudan, T. Taylor and G. Wright (eds.), The Mosaic of Economic Growth, Stanford: Stanford University Press: 21-62.
. Despite forty years of development, the field is still plagued by important methodological limitations that prevent anyone “proving without doubt” the impact of science and technology and innovation on growth and productivity. As the OECD constantly reminded its readers, everyone is convinced of the contribution of science and technology to the economy (imagine a world without technologies), but statistically, the demonstration remains limited.
25 E. Mansfield (1972), Contribution of R&D to Economic Growth in the United States, Science, 175 (4021), p. 478.
26 Z. Griliches (1998), R&D and Productivity: Econometric Results and Measurement Issues, in R&D and Productivity: The Econometric Evidence, op. cit. p. 52-89.

162 The Making of Science, Technology…, 2009
Why, then, had the OECD and its member countries entered the field?
In 1962, the OECD Committee on Scientific Research of the Directorate for Scientific Affairs decided “to give more emphasis in the future to the economic aspects of scientific research and technology”27. The committee suggested that governments link science, technology and innovation to economic growth and productivity, and assess the contribution of the former to the latter. Again, in 1976, the second ad hoc review group on science and technology statistics suggested that studies on the links between R&D and productivity be established at the Directorate for Science, Technology and Industry28
People had to wait until the 1990s, however, to see work on science, technology and innovation and on productivity at the Directorate for Science, Technology and Industry. The lag between the demands of the 1960s and the work of the 1990s can be explained by at least two factors. First was the reluctance of mainstream (classical) economists to bring technology and innovation into theories and econometric models. Second was the difficulties that lie behind linking science, technology and innovation directly to growth and productivity.
.
Nevertheless, very early on, the OECD responded indirectly to the challenges posed by the new economic theories and models of the 1950s-1960s. With regard to economic growth, in 1963 the OECD conventionalized an indicator combining science/technology and economic output – GERD/GDP – and harmonized its concepts with the System of National Accounts. All OECD studies conducted on R&D in the 1970s and 1980s analyzed the indicator and compared member countries according to it29
27 OECD (1962), Minutes of the 4th Session, Committee for Scientific
Research, SR/M (62) 2, p. 17.
. Concerning theories of
28 OECD (1978), Report of the Second Ad Hoc Review Group on R&D Statistics, SPT (78) 6 p. 25-27.
29 Besides this innovation, the OECD produced its first, and very brief, analysis comparing industrial R&D with economic variables in the mid

The Making of Science, Technology…, 2009 163
international trade, the OECD conducted several studies on competitiveness in the 1980s, and developed indicators on the technological balance of payments and trade in high technology.
The real work began, however, in the 1990s. The fact that the OECD and its member countries entered the field of science, technology and innovation, and economic growth, followed the reorientation of its program on science and technology statistics towards more economic issues. Certainly, the economic impact of science and technology has always been a priority for the Directorate for Scientific Affairs and for the Directorate for Science, Technology and Industry’s statistical unit, and evolutionary economists as consultants, among them R. Nelson and C. Freeman, pushed for integrating science and technology into economic policy for several years30. Beginning in the 1990s, however, OECD classical economists finally began developing an interest in science and technology. Policy had shifted from a focus on macro-economic policies to a focus on micro-economic, such as firm-level innovation. New growth theories were then in vogue, and succeeded in focusing OECD mainstream economists on science and technology as a source of economic growth31
1970s. See: OECD (1976), Comparing R&D Data with Economic and Manpower Series, DSTI/SPR/76.45.
. According to many, however, there is nothing new under the sun here. New growth theories are only a mathematical – or stylized – formalization of what we have known for decades, and their practitioners have “limited acquaintance (…) with the previous
30 See, for example, OECD (1980), Technical Change and Economic Policy, Paris; OECD (1991), Technology and Productivity: the Challenges for Economic Policy, Paris.
31 G. M. Grossman and E. Helpman (1991), Innovation and Growth in the Global Economy, Harvard: MIT Press; P. Aghion and P. Howitt (1992), A Model of Growth through Creative Destruction, Econometrica, 60 (2), p. 323-351; P. M. Romer (1990), Endogenous Technological Change, Journal of Political Economy, October (98), p. 71-102.

164 The Making of Science, Technology…, 2009
empirical literature”32
With the diverging rates of economic growth across countries in the 1970s and 1980s, the impact of technology on economic growth and productivity became a cause for concern. The Directorate for Science, Technology and Industry developed projects on structural adjustment and technology
. Be that as it may, the OECD mainstream economists followed the new academic fashion.
33, science and technology in the new economic context34, and science, technology and competitiveness35. But it was during the Technology and Economy Program in the late 1980s-early 1990s and later that work on productivity expanded36. The Economic and Statistical Analysis Division of the DSTI came to be associated with several horizontal OECD projects devoted specifically to productivity: analyses were conducted on productivity and job creation for the OECD Job Study project37, and on the contribution of R&D, innovation and technologies to economic growth for the OECD Growth Project38
This followed the transformation of the Directorate for Science, Technology and Industry’s statistical unit into a division in 1986. A coordinated project was launched in 1988 (the Structural Analysis
(Table 8).
32 Z. Griliches (1998), Introduction, in R&D and Productivity: The
Econometric Evidence, op. cit. p. 7. R. R. Nelson (1994), What Has Been the Matter with Neoclassical Growth Theory, in G. Silverberg and L. Soete (eds.), The Economics of Growth and Technical Change, Aldershot: Edward Elgar; R. Nelson (1997), How New is New Growth Theory, Challenge, September/October, p. 29-58.
33 OECD (1978), Technology and the Structural Adaptation of Industry, DSTI/SPR/78.25 and 78.26.
34 OECD (1980), Technical Change and Economic Policy, op. cit. 35 OECD (1984), Technology and International Competitiveness,
DSTI/SPR/84.46. 36 OECD (1992), Technology and the Economy: the Key Relationships,
Paris. 37 OECD (1996), Technology, Productivity and Job Creation, Paris; OECD
(1996), Technology and Industrial Performance, Paris. 38 OECD (2001), The New Economy: Beyond the Hype, Paris.

The Making of Science, Technology…, 2009 165
Program) on indicators of scientific, technological and industrial competitiveness and performance, with three broad goals39
- To establish comprehensive, disaggregated, internationally-comparable databases linking R&D, input-output, industrial and import/export data at the individual industry level.
:
- To construct a wide range of industry and aggregate-level indicators of the evolution of technological and economic performance.
- To undertake empirical studies of the role of technology in globalization, international competitiveness, productivity growth and structural change.
Table 8. OECD Projects on Science, Technology and Innovation, and the Economy
1. New Economic Context (1976-80)
2. Technology and Structural Change (1975-79)
3. Science, Technology and Competitiveness (1980-84)
4. Innovation and Economic Climate (1981-85)
5. Trade in High-Technology (1984-85)
6. Contribution of Science and Technology to Economic Growth (1987-88)
7. Technology/Economy Programme (TEP) (1988-91)
8. Technology, Productivity and Jobs (1994-99)
9. Growth Project (1999-2001)
The main output of the project was a new database, STAN (Structural Analysis), implemented in 199240
39 OECD (1994), Statistics and Indicators for Innovation and Technology,
DSTI/STP/TIP (94) 2, p. 8.
. STAN was intended to cover the

166 The Making of Science, Technology…, 2009
full data spectrum from basic research to trade indicators. It was designed specifically to underpin analyses of the connection between technology, structural adjustment and economic performance. STAN was “intended to be an analytical tool on which much of the quantitative analysis and modeling carried out in the Directorate for Science, Technology and Industry will be founded (…) and provide a scoreboard of indicators in order to monitor and evaluate the evolution of industrial structures and economic competitiveness and performance in the light of scientific and technological developments”41. As a consequence, Science, Technology and Industry Outlook, a biennial review combining elements from the Industrial Review, the S&T Policy Outlook and the earlier S&T Indicators reports, was started in 199642
The work on technology and the economy really started with the Technology and Economy Program, at least at the Directorate for Science, Technology and Industry. Among the eight issues identified during the Technology and Economy Program exercise was “technology and economic growth”. To study the issue, the Directorate for Science, Technology and Industry organized an important international conference on technology and productivity in 1989, where M. Abramovitz, Z. Griliches, J. W. Kendrick and R. R. Nelson, among others, participated
. Also, a scoreboard of indicators became regularly available from 1995 onward as Industry and Technology: Scoreboard of Indicators.
43
40 OECD (1988), Progress Report on STAN, DSTI/IP/88.19; OECD (1994),
STAN Databases and Associated Analytical Work, DSTI/EAS/STP/NESTI (94) 7.
. The purpose of the conference was to “identify various factors that influence the development, adoption and diffusion of technology and, ultimately, the rate of
41 OECD (1987), Review of the Committee’s Work Since 1980, DSTI/SPR/87.42, p. 18; OECD (1988), Summary of the Meeting of NESTI, SPT (88) 2, p. 10.
42 OECD (1994), Developing STI Reviews/Outlooks: A Proposal, DSTI/IND/STP/ICCP (94) 4.
43 OECD (1991), Technology and Productivity: The Challenge for Economic Policy, op. cit.

The Making of Science, Technology…, 2009 167
productivity growth”44
The conference discussed growth trends since World War II (and the convergence of OECD economies than ensued), the causes of the slowdown that followed in the seventies and after, and the difficulty of measuring the contribution of science, technology and innovation to productivity and economic growth. The output of the conference, at least with regard to the prospects for studies on science, technology and innovation, and on productivity, was not very optimistic. The chairman of the conference concluded
, and particularly to shed light on the productivity (or Solow) paradox: although there was evidence of acceleration of industry’s technological efforts in most member countries, this had not yet been reflected in an upturn in productivity.
45
A deepening of the research on these complex issues probably requires some redirection of the analysis of productivity growth (…). It is clear that it is important to improve the methods of making direct measurements of technological change, rather than trying to interpret residuals (…). We are far away from a situation when policy implications can be derived in a satisfactory way from research in this area.
:
In a similar tone, R. R. Nelson concluded his communication as follows: “Attempts by governments to influence growth rates are likely to be shallow until the connections among the variables are better understood. And, indeed, I am impressed by the shallowness of most of the prescriptions for faster growth. It is easy enough to recommend that rates of physical investment be increased, or that industrial R&D be expanded, or that time horizons of executives be extended, or that labor and management be more cooperative and less
44 A. Lindbeck (1991), Lessons From the Conference, in OECD,
Technology and Productivity: The Challenge for Economic Policy, op. cit. p. 13.
45 Ibid., p. 15.

168 The Making of Science, Technology…, 2009
adversarial. But if the prescription stops here, it is hard to see what one actually is to do”46
Despite (or because of) these warnings, the Directorate for Science, Technology and Industry entered the field of studies on productivity with the same methodology then in vogue in academic circles. Its first contribution appeared in 1992, in a chapter of the Technology and Economy Program final report that concluded on very low correlations between (embodied as well disembodied) R&D and productivity
.
47. “The proposition that investment in R&D and technological progress are essential for future growth has not yet been conclusively empirically demonstrated. Nevertheless, economists generally agree that R&D and technical progress do indeed play a crucial role in economic growth”48
The Technology and Economy Program was only a prelude to the Directorate for Science, Technology and Industry efforts on science, technology and productivity. The G7 ministerial conference held in 1994 in Detroit, based on the results of studies conducted at the request of the previous ministerial meeting (1992) on the causes of unemployment (known as the Jobs study project)
.
49
46 R. R. Nelson (1991), A Conference Overview: Retrospect and Prospect,
in OECD, Technology and Productivity: The Challenge for Economic Policy, op. cit. p. 584.
, arrived at the consensus that technological change is perhaps the leading force for job creation and economic growth. But everyone agreed that there was a lack of internationally-comparable information to properly document the case. The head of the Private Office of the Secretary-
47 OECD (1992), Technology and Economic Growth, in OECD, Technology and the Economy: the Key Relationships, op. cit. chapter 8.
48 OECD (1992), Technology and Economic Growth, in OECD, Technology and the Economy: the Key Relationships, op. cit. p. 184.
49 OECD (1994), The OECD Jobs Study: Facts, Analysis, Strategies, Paris; OECD (1994), The OECD Jobs Study: Evidence and Explanations, Paris; OECD (1995), The OECD Jobs Study: Implementing the Strategy, Paris.

The Making of Science, Technology…, 2009 169
General summarized the issue as follows50: “Further work on the relationship between technology, productivity and employment [is] needed for the following reasons: at the beginning of the [Jobs] study, there existed less relevant work in Directorate for Science, Technology and Industry than in [other] directorates (…); studying the link between technology and employment was conceptually more difficult, given its indirect nature and the corresponding lack of statistics; this link could thus be argued rather than proved”. The G7 conference therefore asked the OECD Secretariat to examine the relationship between productivity, job creation and technology, especially information and communication technologies. In a letter to the Secretary-General, the US Secretary of the Treasury suggested five topics that became the five focuses of the OECD Secretariat on the horizontal project Technology, Productivity and Job Creation51
- relationship between technological change, productivity, job creation and job loss,
:
- best practice in technology policy,
- demand for highly-skilled labor,
- information technology and changes in industries,
- development of information infrastructure.
This was the background in which the Directorate for Science, Technology and Industry participated in Phase II of the Jobs study: the Technology, Productivity and Job Creation project. According to OECD member countries, Technology, Productivity and Job Creation was the “most important work undertaken on this difficult
50 OECD (1994), Summary Record of the Joint Ad Hoc Expert Meeting on
Technology, Productivity and Job Creation, DSTI/IND/STP/ICCP/M (94) 1, p. 8.
51 OECD (1994), Future Work on Technology, Productivity and Job Creation: Addendum, DSTI/IND/STP/ICCP (94) 3/ADD1.

170 The Making of Science, Technology…, 2009
subject of technology and jobs to date”52. With regard to the relationships between technology and productivity, the Directorate for Science, Technology and Industry conducted two kinds of analyses53: 1) at the industry level: looking at the impact of R&D and, above all, (embodied) technology diffusion and acquisition on productivity54; 2) at the firm level: analyzing the heterogeneity of firms’ experiences and characteristics within industries and its capacity to explain productivity55. The results were published respectively in 199656 and 199857
52 OECD (1996), Summary Record of the 6th Meeting,
DSTI/IND/STP/ICCP/M (96) 2, p. 7.
. The main message was that both R&D and embodied technology had an impact on productivity, but that the latter was far more important, particularly with regard to information and communication technologies in services. However, “it is very difficult to prove beyond doubt that technology has been a
53 OECD (1994), Future Work on Technology, Productivity and Job Creation: Road Map, DSTI/IND/STP/ICCP (94) 3, p. 6-7.
54 OECD (1994), Technology Diffusion Flows in 10 OECD Countries: Interim Report, DSTI/IND/STP/ICCP (94) 8.
55 OECD (1997), Technology and Productivity: A Three-Country Study Using Micro-Level Databases, DSTI/EAS/IND/SWP (97) 7. This very preliminary work was pursued as a follow-up to the Growth project discussed below. See: OECD (2002), Proposed Work on ICT and Business Performance, DSTI/ICCP (2002) 2; OECD (2003), ICT and Economic Growth: Evidence from OECD Countries, Industries, and Firms, Paris.
56 N. Sakurai, E. Ioannidis and G. Papaconstantinou (1996), The Impact of R&D and Technology Diffusion on Productivity Growth: Evidence for 10 OECD Countries in the 1970s and 1980s, OECD/GD (96) 27; OECD (1996), Technology, Productivity and Growth, in OECD, Technology, Productivity and Job Creation, Paris, chapter 2; OECD (1996), Technology and Productivity, in OECD, Technology and Industrial Performance, Paris, chapter 3.
57 OECD (1998), The Dynamics of Industrial Performance: What Drives Productivity Growth? in OECD, Science, Technology and Industry Outlook, Paris, chapter 4.

The Making of Science, Technology…, 2009 171
major factor in productivity gains (…). [But] the slowdown would have been worse without new technology“58
THE NEW ECONOMY
.
The ministerial demand for more data and analyses continued. As a follow-up to the Technology, Productivity and Jobs Creation project, the OECD Council of Ministers asked the Secretariat in May 1999 to study the causes of growth disparities across and within OECD countries. In the 1950s and 1960s, most OECD countries grew rapidly as they recovered from the war and applied American technology and know-how. This catch-up period came to a halt in the 1970s59. In the United States, however, the last decade has seen an acceleration of growth in GDP per capita, but some of the other major economies have lagged. This divergence between countries has caused renewed interest in the main factors driving economic growth and the policies than might influence it. It also gave rise to claims about the emergence of a New Economy60
The fundamental question asked by the OECD Council was whether in recent years growth trends have changed in various OECD
.
58 OECD (1996), Technology, Productivity and Growth, in OECD,
Technology, Productivity and Job Creation, op. cit. p. 48-49. 59 R. R. Nelson and G. Wright (1992), The Rise and Fall of American
Technological Leadership: The Postwar Era in Historical Perspective, Journal of Economic Literature, 30, p. 1931-1964; M. Abramovitz (1994), The Origins of the Postwar Catch-Up and Convergence Boom, in J. Fagerberg, B. Varspagen and N. von Tunzelmann (eds.) (1994), The Dynamics of Technology, Trade and Growth, op. cit. A. Maddison (1987), Growth and Slowdown in Advanced Capitalist Economies: Techniques of Quantitative Assessment, Journal of Economic Literature, 25 (2), June, p. 649-698. A. Maddison (1991), Dynamic Forces in Economic Development: A Long Run Comparative View, Oxford: Oxford University Press.
60 The Economist (2000), A Survey of the New Economy, September 23rd; Business Week (1997), The New Economy: What It Really Means, November 17-23, p. 38-40.

172 The Making of Science, Technology…, 2009
countries and, if so, what factors can explain this61. In response, the OECD launched a two-year multidisciplinary study involving three Directorates62 and several committees. The first phase was dedicated to fact-finding, and the second to analyzing policies that support grow63 The results were presented in two steps to the Council of Ministers: June 200064 and May 200165. A special edition of the Science, Technology and Industry Outlook series followed66, as well as a background study67
The Growth Project, as it was called, was inspired by the strong economic performance of the United States. The OECD “confirmed” that there was a New Economy, although uneven across countries. Cross-country disparities (or gaps) in economic growth have increased in the OECD in the 1990s: only about one-fifth of OECD countries experienced a rise in trend growth, among them the United States
.
68
61 OECD (1999), Growth Project, DSTI/IND/STP/ICCP (99) 1.
. The causes behind growth performances were multiple and difficult to single out, according to the OECD, but innovation and technological change, particularly information and communication technologies, were “shown” to be the main drivers of economic
62 Directorate for Science, Technology and Industry (DSTI), Directorate for Education, Employment, Labour and Social Affairs (DEELSA), Economics Department (ECO).
63 OECD (2000), The OECD Growth Project: Proposed Work for the Second Year in the DSTI, DSTI/IND/STP/ICCP (2000) 4.
64 OECD(2000), Is There a New Economy? First Report on the OECD Growth Project, Paris; OECD (2000), A New Economy? The Changing Role of Innovation and Information Technology in Growth, Paris.
65 OECD (2001), The New Economy: Beyond the Hype, op. cit. 66 OECD (2001), Drivers of Growth: Information Technology, Innovation
and Entrepreneurship, Paris. 67 OECD (2003), The Sources of Economic Growth in OECD Countries,
Paris. 68 OECD (1999), Economic Growth in the OECD Area: Are the Disparities
Growing?, DSTI/EAS/IND/SWP (99) 3; OECD (2000), Economic Growth in the OECD Area: Recent Trends at the Aggregate and Sectoral Level, DSTI/IND/STP/ICCP (2000) 2; OECD (2000), Innovation and Economic Performance, DSTI/STP (2000) 2.
The Making of Science, Technology…, 2009 173
growth: “something new is happening in the structure of OECD economies (…). It is this transformation that might account for the high growth recorded in several countries. Crucially, ICT seems to have facilitated productivity enhancing changes in the firm, in both new and traditional industries (…)”69
How was the discourse constructed and the demonstration arrived at? In a sense, the US issue submitted to the OECD Secretariat, an issue pushed and pulled by central banks
.
70
In the econometric literature, the contribution of technology to productivity is measured by correlating the residual to indicators of science and technology (R&D, patents): “All productivity growth is related to all expenditures on R&D and an attempt is made to estimate statistically the part of productivity growth that can be attributed to R&D”
, was not a new one. As we mentioned above, it has been over 40 years since academics studied the issue. The model used to this end was growth accounting. The economy was represented by a production function linking output (production) to inputs (labor, capital), plus a residual – called multifactor productivity (MFP) today.
71
The theoretical model underlying most research by economists on productivity growth over time, and across countries, is superficial and to some degree
. This procedure is considered to be very limited by the experts themselves:
69 OECD (2001), The New Economy: Beyond the Hype, op. cit. p. 4. 70 For example, see the contributions of the US Federal Reserve economists
(S. D. Oliner and K. J. Stiroh): S. D. Oliner and D. E. Sichel (1994), Computers and Output Growth Revisited: How Big is the Puzzle?, Brookings Papers on Economic Activity, 2, p. 273-334; S. D. Oliner and D. E. Sichel, The Resurgence of Growth in the Late 1990s: Is Information Technology the Story?, Journal of Economic Perspectives, 14 (4), p. 3-22; D. W. Jorgenson and K. J. Stiroh (2000), US Economic Growth in the New Millennium, Brookings Papers on Economic Activity,1, p. 125-211.
71 Z. Griliches (1998), Issues in Assessing the Contribution of R&D to Productivity Growth, in R&D and Productivity: The Econometric Evidence, op. cit. p. 17.

174 The Making of Science, Technology…, 2009
even misleading72. Despite all the efforts to make the residual go away it still is very much with us. And despite all the efforts to give substance to its interpretation as technological advance, or advance of knowledge, that interpretation is far from persuasive (…). The residual accounts for a hodge-podge of factors (…) difficult to sort out73
Indeed, the limitations of studies on technology and productivity are numerous, among them: the factors in the growth equation are not independent of each other and cannot be simply added up; the residual covers many sources of growth besides technological advance; R&D takes time and may not affect productivity until several years have elapsed; only economic impacts are measured, and only those that are measurable with the System of National Accounts. Finally, correlation is not causality, an old lesson frequently overlooked.
.
The OECD knew these limitations very well: “Innovation and technological change are commonly considered as being the most important drivers of economic growth. However, it is difficult to capture their contribution in empirical analysis”74. In 2001, in collaboration with the OECD Statistics Directorate, the Directorate for Science, Technology and Industry therefore published “the first comprehensive” productivity manual aimed at “statisticians, researchers and analysts involved in constructing industry-level productivity indicators”. Written by P. Schreyer, from the Statistics Directorate, the manual stated75
72 R. R. Nelson (1981), Research on Productivity Growth and Productivity
Differences: Dead Ends and New Departures, op. cit. p. 1029.
:
73 Ibid., p. 1035. 74 OECD (2000), A New Economy? The Changing Role of Innovation and
Information Technology in Growth, op. cit. p. 27. 75 OECD (2001), Measuring Productivity: Measurement of Aggregate and
Industry-Level Productivity Growth (Productivity Manual), Paris, p. 115-117.

The Making of Science, Technology…, 2009 175
When labour and capital are carefully measured, taking into account their heterogeneity and quality change, the effects of embodied technical change and of improved human capital should be fully reflected in the measured contribution of each factor of production (…). More often than not [however], data and resource constraints do not permit a careful differentiation and full coverage of all labour and capital inputs. As a consequence, some of the embodiment effects of technological change and some or all of the changes in skill composition of labour input are picked up by the MFP [multifactor productivity] residual (…). [But] MFP is not necessarily technology [it also includes the impact of other factors], nor does technological change exclusively translate into changes in MFP.
These limitations did not prevent the Directorate for Science, Technology and Industry from getting involved in productivity studies. Three elements characterized the way the Directorate “demonstrated” the link between science, technology and innovation, and productivity: 1) synthesizing academic works; 2) internationalizing the statistics; 3) developing a visual rhetoric. These are discussed below.
Synthesizing Academic Works
Academics usually convince others that they have done a good job by citing previous work to support their arguments76
76 B. Latour (1987), Science in Action, Cambridge (Mass), Harvard
University Press, Chapter 1.
. The OECD reports were no exception. The main argument of the reports on the New Economy was usually reviewing and citing the academic work on the issue. This step was central, since the OECD always conducted a

176 The Making of Science, Technology…, 2009
limited number of studies itself. Academic studies have always been the main source of OECD ideas.
The 2000 report on the Growth Project reviewed two kinds of work. First was the studies conducted on economic aspects of science and technology77
The second kind of work reviewed specifically concerned the contribution of information and communication technologies to productivity
. Trends in business R&D over the 1990s were discussed, as well as patents, high-tech trade, changes in research activities like new forms of financing (venture capital) and increased collaboration. Although interesting in themselves, these indicators had nothing to do with growth and productivity measurement per se. They have been used for a long time in other contexts, and are now widely grouped under the “knowledge-based economy” concept. In fact, these indicators were eliminated from the final OECD Growth Report (2001) – only to be reinserted later into a Directorate for Science, Technology and Industry specific publication on the subject.
78
Internationalizing the Statistics
. Studies conducted at the aggregate, industry and firm level were discussed. Most if not all of the data were of American origin and, for this reason, were a major limitation in documenting the phenomenon for other countries. Nevertheless, the US growth pattern was sufficient to convince the OECD that something important was happening and waited only to be measured in other countries.
Besides using academic work to support its case, the OECD conducted its own studies. The added value of OECD works on statistics has always been its comparative and international basis. Nowhere else but in the Growth Project was this expertise present.
77 OECD (2000), A New Economy? The Changing Role of Innovation and
Information Technology in Growth, op. cit, p. 27-47. 78 Ibid., p. 50-71; OECD (2001), The New Economy: Beyond the Hype, op.
cit. p. 16-26.

The Making of Science, Technology…, 2009 177
The OECD extended the American preoccupation on the New Economy and information and communication technologies to other countries.
Notwithstanding the limitations of academic studies, the Directorate for Science, Technology and Industry conducted the same kind of work with the same concepts and methodology, that is, calculating the contribution of R&D and information and communication technologies to multifactor productivity. This was the methodology that had already inspired the Directorate’s contribution to the Technology, Productivity and Job Creation project. Equally, during the Growth Project, two kinds of such work were conducted. The first concentrated on the impact of R&D on productivity in 16 OECD countries79. An econometric model was developed that measured the impact of business R&D, public R&D and foreign R&D on productivity. With a few caveats, the author concluded: “Overall, the study points to the importance of technology for economic growth”. Despite the positive correlations, however, the group of National Experts on Science and Technology Indicators (NESTI) qualified the study as “having numerous shortcomings and being rather mechanical”80
The second kind of study conducted with the multifactor productivity methodology dealt with the impact of information and communication technologies on several OECD countries
.
81
79 D. Guellec (2000), R&D and Productivity Growth: A Panel Data
Analysis of 16 OECD Countries, DSTI/EAS/STP/NESTI (2000) 40.
. At the
80 OECD (2001), Summary Record of the NESTI Meeting, 14-15 May 2001, DSTI/EAS/STP/NESTI/M (2001) 1, p. 7.
81 P. Schreyer (2000), The Contribution of ICT to Output Growth: A Study of the G7 Countries, DSTI/DOC (2000) 2; D. Pilat and F. C. Lee (2001), Productivity Growth in ICT-Producing and ICT-Using Industries: A Source of Growth Differentials in the OECD?, DSTI/DOC (2001) 4; A. Colecchia (2001), The Impact of ICT on Output Growth: Issues and Preliminary Findings, DSTI/EAS/IND/SWP (2001) 11; A. Colecchia and P. Schreyer (2001), ICT Investment and Economic Growth in the 1990s: Is the United States a Unique Case? - A Comparative Study of 9 OECD Countries, DSTI/DOC (2001) 7.
178 The Making of Science, Technology…, 2009
aggregate (country) level – where the OECD could innovate – measurements showed only a weak correlation between the importance of the information and communication sector and multifactor productivity: having an information and communication technology producing sector is not a prerequisite for growth, the studies concluded. The diffusion of information and communication technologies to other industries was therefore looked at, as it was hypothesized that it was this that played a leading role. However, there was insufficient evidence, again, to attribute productivity improvements in these industries directly to their use of information and communication technologies. “Ten years or so from now, it should be easier to assess, for instance, the impacts on growth deriving from information and communication technologies, other new technologies and changes in firm organization”82
Developing a Visual Rhetoric
. But at the time, it was impossible.
The meagre empirical results did not prevent the OECD from publishing its report on the New Economy, adding a very long section on policies that should be promoted by governments in order to participate in the New Economy83
One should add, however, that the reports were very cautious with regard to the data. They constantly reminded the reader of the limitations of current studies. This was really different from what the Directorate for Science, Technology and Industry has generally done with its own data: policy papers are usually short on caveats
. Multifactor productivity was only weakly correlated with growth, yet the report ignored much of its own data and proceeded to trot out the same old policy prescriptions that are open to some of the same criticisms that Nelson made (see p. 133 above).
82 OECD (2001), Drivers of Growth: Information Technology, Innovation
and Entrepreneurship, op. cit. p. 119. 83 OECD (2001), The New Economy: Beyond the Hype, op. cit. p. 27-68.

The Making of Science, Technology…, 2009 179
concerning data and sources. Here, however, the problems of measurement were amply discussed: the difficulty of measuring productivity correctly (output, services, quality changes); the limitations of using R&D as an indicator of science, technology, and innovation; and the lag before (information and communication) technologies become really productive and have an impact on the statistics. The OECD message was also cautious in another sense. The OECD constantly reminded the reader that the links between science, technology and innovation, and productivity have not been demonstrated. Equally, its own conclusions on these links were very timid, using words like “might” or “seem” (see p. 137 above) or concluding counterfactually (see p. 134 above).
In light of the limitations of the data and methodology, then, how could one make a convincing case for the New Economy? By balancing the limitations with a specific rhetorical device: a plethora of figures and graphs. The final Growth Report (2001) contains a total of 74 pages, on which one can find 35 graphs and figures, that is: a graph or figure for every two pages. The purpose here was twofold. First, graphs and figures were used in lieu of tables – only two statistical tables appeared in the report – because it made the document more attractive. Such a rhetorical strategy is important considering the readership of the OECD: ministers, policy-makers, journalists. Second, a large series of graphs and figures could persuade the reader of the seriousness of the study. Although no statistics could be used to prove without doubt the emergence of the New Economy, graphs and figures nevertheless served the purpose (save the image!) of empiricism.
CONCLUSION
In the end, one is thus left with a very modest role for economic statistics in narratives on science, technology and innovation, a role with diminishing returns. After nearly fifty years of studies, one still looks in vain for hard data on the links between science, technology
180 The Making of Science, Technology…, 2009
and innovation, and productivity. The parameters for measurement “appear to be chosen not for their relevance but, either because data are already available or, because they are in line with dominant theoretical concepts”84
Economic growth and productivity issues have had a long history at the OECD. The mystique of growth started after World War II, and owed its existence in Europe mainly to American aid (the Marshall Plan). The OEEC – the predecessor of the OECD – and the European Productivity Agency devoted considerable efforts to convincing member countries to improve their productivity in the 1950s
. While it finally became possible to get mainstream economists engaged in analyzing technology and innovation, they came to be engaged in a dubious hypothesis, and the methods they used did not help the understanding of the complex phenomenon involved. In fact, the virtue of the framework on the new economy at the OECD has been that of a political device: finding a common ground between the Schumpeterian economists composing the Directorate for Science, Technology and Industry, and active for many years, even decades, on analyzing science, technology and innovation, and those neo-classical economists composing the Economic Directorate, new to the field, and beginning to arrive at far-reaching policy conclusions derived from simple correlations between composite variables, which they could not explain.
85
84 G. Bell, F. Chesnais and H. Wienert (1991), Highlights of the
Proceedings, in OECD, Technology and Productivity: The Challenge for Economic Policy, op. cit. p. 7.
. Today, alongside the OECD, it is the European Commission that most faithfully pursues work on productivity gaps between Europe and the United States in its annual reports on competitiveness. The failure to close the gap appears to be, according to the Commission, what characterizes the New Economy in the United States: higher employment rates, and higher labor productivity as a consequence of investments in information and communication technologies.
85 B. Godin (2002), Technological Gaps: an Important Episode in the Construction of S&T Statistics, Technology in Society, 24 (4), p. 387-413.

The Making of Science, Technology…, 2009 181
At the OECD, measurement of science, technology and productivity waited until the 1990s to appear. Methodological difficulties, but also skepticism, limited the efforts for some time. In 1980, for example, the Directorate for Science, Technology and Industry policy division published a document titled Technical Change and Economic Policy (1980) which explicitly rejected the classical economists’ work on measuring the contribution of science and technology to productivity86
To attempt to attribute so much experienced economic growth to technical advance, so much to capital formation, and so much to increased educational attainments of the work force, is like trying to distribute the credit for the flavour of a cake between the butter, the eggs and the sugar. All are essential and complementary ingredients.
:
Over time, the economists won. The strategy developed at the OECD to integrate productivity into its statistics and reports was threefold. First, digest all available academic work in order to imitate its methodology. Second, internationalize the (academic and national) statistics to make a convincing case for its member countries. Third, organize the narrative into a policy-oriented framework, using buzzwords. In the present case, it was new growth theories and the New Economy that were the buzzwords. But over the OECD history, the buzzwords also shared their popularity with others to which we now turn: competitiveness, globalization, national system of innovation, knowledge-based economy, and information economy.
86 OECD (1980), Technical Change and Economic Policy, op. cit. p. 65.
The same example appeared in R. R. Nelson (1981), Research on Productivity Growth and Productivity Differences: Dead Ends and New Departures, op. cit. p. 1054.


The Making of Science, Technology…, 2009 183
CHAPTER FIVE
COMPETITIVENESS AND TRADE IN HIGH-TECHNOLOGY
Early official economic statistics dealt with national income, industrial production and productivity. Following World War II, international trade was increasingly added to these statistical series1
It was in this context that two of the main science, technology and innovation indicators that are currently in vogue came to be developed: the technological balance of payments and high technology. This chapter deals with the emergence of the latter as an indicator of competitiveness. High technology (or technology intensity) is an indicator much in vogue in OECD countries, as it is a symbol of an “advanced” economy. The indicator is in fact the analog for industry of the GERD/GDP indicator for countries: a ratio of R&D divided by production. Industries are classified according to whether they are above or below the average ratio. An industry that invests above the average in R&D is considered to be a high-technology industry.
. In fact, international relations between countries, growing trading exchanges and competitiveness came to dominate the political agendas of several governments.
The indicator remains a controversial one for conceptual and methodological reasons. Nevertheless, governments use it continually as part of their economic and innovation policy. As the US National
1 J. Tomlinson (1996), Inventing Decline: the Falling Behind of the British
Economy in the Postwar Years, Economic History Review, 69 (4), p. 731-757.

184 The Making of Science, Technology…, 2009
Science Foundation has put the story, high-technology industries are important to nations for several reasons2
1. High-technology firms innovate, and firms that innovate tend to gain market share, create new products/markets, and/or use resources more productively;
:
2. Industrial R&D performed by high-technology industries benefits other commercial sectors by generating new products and processes that increase productivity, expand business and create high-wage jobs;
3. High-technology firms develop high-valued-added products and are successful in foreign markets, which results in increased competition.
What is characteristic about the indicator on high technology is its linkage to competitiveness issues and its framework. This chapter explains that the reason has to do with the fact that the indicator emerged in the context of debates on the competitiveness of countries and their efforts to maintain or improve their positions in world trade. High technology rapidly came to be viewed as the solution to the issue, and statistics were developed to document the case.
Some authors have qualified the debates on competitiveness as obsessive. To P. Krugman, for example, countries do not compete economically with each other as corporations do3. But the metaphor “derives much of its attractiveness from its seeming comprehensibility”4
2 National Science Foundation (2002), Science and Engineering Indicators,
Washington, p. 6-5.
. First, the competitive image is exciting, and thrills sell tickets. Second, the metaphor makes difficulties easier to solve (subsidize high technology and be tough on competitor). Third, it is a political device that assists in justifying choices. This chapter shows how statistics contributed to the framework on
3 P. Krugman (1994), Competitiveness: A Dangerous Obsession, Foreign Affairs, 73 (2), p. 28-44.
4 Ibid., p. 39.

The Making of Science, Technology…, 2009 185
competitiveness, looking at the efforts of official statisticians to rhetorically transform early statistics on R&D into indicators on high technology.
Where does the high-technology indicator come from? Who was behind its construction? What narratives did governments construct using the indicator? This chapter attempts to answer these questions. It is divided into three parts. The first looks at the basic statistics behind the indicator, statistics developed in early analyses of industrial R&D surveys. The second part traces the evolution of the statistic through its use as an indicator of research or technological intensity. The third part discusses the internationalization of the indicator via the OECD.
A VERY BASIC RATIO
The simplest indicator on high technology is constructed by dividing R&D expenditures by production (i.e.: value-added, turn-over or sales) and then classifying industries according to this ratio. As R. N. Anthony, author of an influential survey on industrial R&D, once wrote: “Use of this ratio implies that there is some relationship between research spending and sales; to the extent that sales is a measure of the size of the company, this implication is in general warranted”5
The indicator has precursors that go back to the 1930s: following industrial managers’ practices, analyses of industrial R&D have always calculated ratios of R&D to sales. The US National Research Council conducted the first such analysis among the industrialized countries. In 1933, its Division of Engineering and Industrial Research tried to assess the effect of the Great Depression on
.
5 R. N. Anthony and J. S. Day (1952), Management Controls in Industrial
Research Organizations, Boston: Harvard University Press, p. 295.

186 The Making of Science, Technology…, 2009
industrial laboratories6. The report classified companies according to whether they spent over 10% of sales revenue on R&D, 5-10%, 1-5% or under 1%. With the data in hand, the authors concluded: “it appears that those companies the products of which more nearly approach the classification of raw materials spent a smaller percentage of their sales income for research than the companies in which products are of a highly manufactured character”7
The following two industrial surveys in the United States were conducted by or with the National Association of Manufacturers (NAM). In 1941, the organization participated in an industrial survey conducted by the National Research Council. The report measured that: “the median expenditure of the companies for industrial research was (…) 2 percent of gross sales income”. This was the only number on R&D expenditures in the report, because the questionnaire had concentrated on personnel data (man-years), which were easier to obtain from companies. Eight years later, the National Association of Manufacturers published the results of a survey of industrial R&D in which these statistics appeared again
.
8. The organization reported that in 1947, companies displayed an average ratio of research expenditures to estimated sales of 1.6%9
In the early 1950s, the US Bureau of Labor Statistics continued with similar statistics, locating some industries above the average (2.0%) – aircraft, electrical machinery, professional and scientific instruments,
. A larger proportion of the sales dollar was being spent by companies making professional, scientific and control instruments and photographic supplies, and electrical goods, the ratios being respectively 3.34% and 2.80%.
6 M. Holland and W. Spraragen (1933), Research in Hard Times, Division
of Engineering and Industrial Research, National Research Council, Washington.
7 Ibid., p. 3. 8 National Research Council(1941), Research: A National Resource (II):
Industrial Research, National Resources Planning Board, Washington: USGPO, p. 124.
9 National Association of Manufacturers (1949), Trends in Industrial Research and Patent Practices, p. 3, 77-79.

The Making of Science, Technology…, 2009 187
chemicals – and others below it10. The practice was thereafter carried over into publications of the National Science Foundation – the official producers of R&D statistics in the United States. The first National Science Foundation survey of industrial R&D, conducted by the Bureau of Labor Statistics (BLS), related R&D expenditures to sales – and tentatively to assets11. Then, in its third industrial survey, the Foundation calculated a second kind of ratio: R&D expenditures to value-added. R&D to capital was also calculated, a statistic that was said to “reflect more completely the magnitude of the manufacturing activities of a company or group of companies than do net sales”12
Ratios of R&D expenditures to sales were not confined to the United States. Similar statistics appeared in an early industrial R&D survey conducted in the United Kingdom (R&D to turn-over
. The National Science Foundation calculated that the value-added ratio was 4.8%, versus 2.0% for net sales. The statistic was short lived, however, with the Foundation abandoning the ratio in the following editions of the series.
13; R&D to net output14) and Canada (R&D as a percentage of sales)15
10 Bureau of Labor Statistics (1953), Industrial R&D: A Preliminary Report,
Department of Labor and Department of Defense, p. 12-13; Bureau of Labor Statistics (1953), Scientific R&D in American Industry: A Study of Manpower and Costs, Bulletin no. 1148, Washington, p. 26-29; D. C. Dearborn, R. W. Kneznek and R. N. Anthony (1953), Spending for Industrial Research, 1951-1952, Division of Research, Graduate School of Business Administration, Harvard University, p. 29ss.
.
11 National Science Foundation (1956), Science and Engineering in American Industry: Final Report on a 1953-1954 Survey, Bureau of Labor Statistics, NSF 56-16, Washington, p. 33ss.
12 National Science Foundation (1960), Funds for R&D in Industry: 1957, NSF 60-49, Washington, p. 28.
13 Federation of British Industries (1952), R&D in British Industry, London: FBI, p. 7.
14 Department of Scientific and Industrial Research (1958), Estimates of Resources Devoted to Scientific and Engineering R&D in British Manufacturing, 1955, London: HMSO, p. 17.
15 Dominion Bureau of Statistics (1956), Industrial R&D Expenditures in Canada, 1955, Reference paper no. 75, Ottawa, p. 15.

188 The Making of Science, Technology…, 2009
In general, the ratio was presented as a useful guide for managers interested in comparing their performance to other companies. For example, the National Science Foundation suggested: “In deciding upon their research budget, company officials frequently give consideration to certain objective financial standards, such as the ratio of R&D expenditures to sales. Such standards are seldom used in a rigid way but, rather, serve as a guide to management in determining the size of a research budget”16
VARIATIONS ON A THEME
. From an analytical point of view, the statistic served to assess and compare the relative efforts of industries in terms of R&D, and to look at the impact of R&D on industries’ economic performances. The message was to influence policies supporting R&D, particularly in big firms that invest more than others. A totally different rhetoric accompanies the indicator on high technology.
What characterized the construction of the high technology indicator was that a specific rhetoric and narrative came to be associated with the statistic. Firstly, labels were now associated with the ratio of R&D expenditures to sales: research intensity, technology intensity, high technology. Secondly, the indicator was developed and increasingly used in the context of debates on the competitiveness of countries. The United States was at the origins of the rhetoric, and the OECD was at the heart of the indicator’s worldwide dissemination17
16 NSF (1956), Science and Engineering in American Industry, op. cit.
p. 33.
.
17 On the contribution of France to the issue of competitiveness and the technological balance of payments, see B. Godin (2002), Technological Gaps: An Important Episode in the Construction of Science and Technology Statistics, op. cit.

The Making of Science, Technology…, 2009 189
Research Intensity
In 1958, E. Hoffmeyer coined the term research-intensity to talk about the performances of industries in terms of R&D effort18. The balance of payments deficit in the United States was the context in which Hoffmeyer published his analysis of US foreign trade over the 20th Century. In fact, in the late 1950s, the balance of payments came to be an important economic issue (for the second time in a decade), and the competitiveness of countries was measured according to the statistics. A country was considered to be competitive if its exports exceeded its imports. Many countries began expressing concerns about their competitiveness as understood in this sense. Britain, for example, seconded by the OEEC’s numbers, increased its laments on “economic decline”19, particularly in light of its balance-of-payments deficit20. France launched a campaign against foreign investment21 that led to the well-known debate on technological gaps22. The United States was no exception. Concerns over the US balance of payments occurred in the late 1950s and early 1960s23
18 E. Hoffmeyer (1958), Dollar Shortage and the Structure of US Foreign
Trade, Amsterdam: North-Holland.
. Science and technology would soon come to be regarded as a source of strength in economic growth and foreign trade.
19 J. Tomlinson (1996), Inventing Decline: the Falling Behind of the British Economy in the Postwar Years, op. cit.
20 J. M. McGeehan (1968), Competitiveness: A Survey of Recent Literature, The Economic Journal, 78 (3), p. 243-262.
21 A. W. Johnstone (1965), United States Direct Investment in France: An Investigation of the French Charges, Cambridge (Mass.): MIT Press.
22 B. Godin (2002), Technological Gaps: An Important Episode in the Construction of Science and Technology Statistics, Technology in Society, 24, p. 387-413.
23 Joint Economic Committee (1962), Factors Affecting the United States Balance of Payments, Subcommittee on International Exchange and Payments, Congress of the United States, Washington: USGPO; H. G. Johnson (1963), The International Competitive Position of the United States and the Balance of Payments Prospect for 1968, Review of Economics and Statistics, 66, February, p. 14-32.

190 The Making of Science, Technology…, 2009
Using the National Science Foundation ratios of R&D expenditures to sales, Hoffmeyer looked at the structure of US foreign trade: eleven industries were classified into four groups according to their research effort or intensity. With the data, Hoffmeyer showed that the United States had a competitive advantage in the research-intensive industries. To the best of my knowledge, Hoffmeyer was the first to use this term, as well as the first to use it in the context of an analysis of international trade24
In 1963, the OECD published a study it presented to the first ministerial meeting on science. The study, written by C. Freeman, R. Poignant and I. Svennilson, was the result of the OECD’s early research program on the economics of science. Using available statistics, the authors looked at industrial R&D and constructed three industry groups, classified according to the ratio of R&D expenditures to sales
. He would soon be imitated worldwide, first of all at the OECD.
25. The first group (Group A) was called research-intensive industries and was composed of aircraft, vehicles, electronics, other electrical, machinery, instruments, and chemicals. The study measured that “all the industrial countries considered show over two-thirds (the United States and the United Kingdom over nine-tenths) of their industrial R&D expenditure in Group A which comprises the research-intensive industries (…)”26
24 In his early studies on the structural (technological) basis of the American
economy, W. Leontief had coined the term “capital intensive goods” for those commodities that require for their manufacture large quantities of capital. See W. Leontief (1953), Domestic Production and Foreign Trade: The American Capital Position Reexamined, Proceedings of the American Philosophical Society, 97 (4), reprinted in Input-Output Economics, Oxford: Oxford University Press, 1986, p. 65-93.
.
25 OECD (1963), Science, Economic Growth and Government Policy, Paris, p. 81. Such a grouping comes from a study published by C. Freeman in 1962, except that no label was used with regard to research intensity: C. Freeman (1962), Research and Development: A Comparison Between British and American Industry, National Institute Economic Review, 20, May, p. 21-39.
26 OECD (1963), Science, Economic Growth and Government Policy, op. cit., p. 30.

The Making of Science, Technology…, 2009 191
To the authors, research-intensive industries had several characteristics that made them valuable from the point of view of policies: 1) they were generally the fastest-growing industries27, 2) their share of world trade was growing28, and 3) they had the highest technological balance of payments29
Such a term contributed to the OECD campaign for science policies. In fact, in the early 1960s, the OECD was campaigning to convince governments to develop science policies and set up ministries to this end. Thus, research-intensive industries were a phenomenon that policies should work on, but also a symbol with rhetorical overtones that precisely fit the efforts of the organization to convince officials to get their countries into the modern economy. The R&D intensity ratio would be calculated regularly in the following decades, particularly in OECD surveys and analyses on trends in R&D.
.
A few years after the 1963 report, the OECD took part in a second campaign, this one calling for the closing of the technological gaps between European countries and the United States. In its main report, the OECD introduced a new term: science-based industries30
27 Ibid., p. 29.
. Using the same criteria as in 1963 (R&D as a percentage of sales), industries were classified into four groups: science-based, mixed, average, and non-science based (Table 9). The report calculated that the United States had the highest proportion of R&D activity in the science-based industries, and found the largest difference between the United States and other countries in this group.
28 Ibid., p. 32. 29 Ibid., p. 33. 30 OECD (1970), Gaps in Technology: Comparisons Between Member
Countries in Education, R&D, Technological Innovation, and International Economic Exchanges, Paris, p. 135ss. I found only one occurrence of the term before the OECD: C. F. Carter and B. R. Williams (1958), Investment in Innovation, London: Oxford University Press, p. 68.

192 The Making of Science, Technology…, 2009
The OECD study took things one step further than the previous study, looking at product groups instead of industries: “a distinction must be made between the industry group and the product field”, stated the OECD. While firms are usually classified in an industry group according to their main activity, an industry “may be relevant to several products”. The OECD thus classified industrial R&D according to fifty products. It then used the data to study the role of science and technology, particularly science-based industries, in the international competitive position of countries as measured by export performance31
Table 9. OECD Research-Intensity Levels (1970)
.
Science Based
Mixed Average Non-Science Based
Aircraft Machinery Non ferrous metals
Textiles
Electronics Fabricated metal
products
Ferrous metals
Paper
Drugs Petroleum Other transport
equipment
Food and drink
Chemicals Miscellaneous Manufacturing
The OECD study – the empirical material for which came from Science Policy Research Unit (SPRU) researchers – was one of the first conducted worldwide linking science and trade32
31 OECD (1970), Gaps in Technology, op. cit. p. 206ss and 253ss.
. It confirmed earlier findings of the organization. Research-intensive groups accounted for a large share of manufacturing exports, and the Americans had the lead over Europe, followed by the medium-sized countries, then the smaller industrialized OECD member countries: “there is a high concentration of United States exports in those
32 For an overview, see: P. Krugman (1995), Technological Change in International Trade, in P. Stoneman (ed.), Handbook of the Economics of Innovation and Technological Change, Oxford: Blackwell, p. 342-365.

The Making of Science, Technology…, 2009 193
product groups where there is a high concentration of R&D effort”33
Technology Intensity
. However, the OECD calculated that the share of the United States in OECD exports had declined from 23.7% in 1962 to 21.3% in 1966 as a result of catching-up by other OECD countries.
It was precisely in the context of issues of international competitiveness that a new term – technology intensity – appeared, used to describe the same phenomenon. In the course of the debate on the technological gaps between Europe and the United States, the US government set up an interdepartmental committee to study the issue34. At the request of the (Hornig) committee, the Department of Commerce conducted one of the first surveys of American investments and operations in Europe. To the best of my knowledge, it is this survey that coined the term technology-intensive industries to document the structure of US direct investment in Western Europe35
As a follow-up to its report, the committee recommended that the Department of Commerce “conduct on a continuing basis in-depth analytical studies on the economic and technological questions related to technological disparities and to the international flow of technology, trade, and investments”
. According to the committee, 80% of all US direct investments in manufacturing in Western Europe were in technology-intensive industries, and Americans controlled large segments of the market in such technology-intensive products as computers.
36
33 OECD (1970), Gaps in Technology, op. cit., p. 255.
. The Department of Commerce responded with further studies and reports that brought onto the scene the concept of technology intensity, and the decline of the United
34 B. Godin (2003), Technological Gaps, op. cit. 35 Report of the Interdepartmental Committee on the Technological Gap,
Report submitted to the President, December 22, 1967, White House, p. 13-14.
36 Ibid., p. v.

194 The Making of Science, Technology…, 2009
States in technology-intensive industries. M. T. Boretsky, director of the Technological Gap Study Program (1967-69) at the Department of Commerce, launched the research program.
Until then, as we have seen above, “research-intensive industries” were defined as those that had a high R&D/sales ratio. Boretsky instead used three statistics (or criteria, as he called them) to construct what he called technology-intensive products (although he used industries as the unit, not products)37
Boretsky showed that the United States was in danger of losing its preeminence in advanced technologies, particularly those that are important in world trade. American exports of technology-intensive manufactured products were leveling off. This was so mainly because of the narrowing of the gap with other OECD countries, and because of faster growth rates in these countries. Ironically, “if, in the 1960s, any country’s economically-relevant R&D performance could be described as having had the characteristics of a gap, the description
. These criteria were R&D, scientific and technical manpower, and the skill level of workers. The following industries were thus identified as belonging to the category: chemicals, non-electrical machinery, electrical machinery and apparatus (including electronics), transportation equipment (including automobiles and aircraft), and scientific and professional instruments and controls. The industries responsible for these products represented 14% of GDP in the United States, employed 60% of all scientific and engineering manpower, and performed 80% of non-defense industrial R&D.
37 M. Boretsky (1971), Concerns About the Present American Position in
International Trade, Washington: National Academy of Engineering, p. 18-66; M. Boretsky (1975), Trends in US Technology: A Political Economist’s View, American Scientist, 63, p. 70-82; Science (1971), Technology and World Trade: Is There Cause for Alarm, 172 (3978), p. 37-41; M. Boretsky (1973), US Technology: Trends and Policy Issues, Revised version of a paper presented at a seminar sponsored by the Graduate Program in Science, Technology and Public Policy of the George Washington University, Washington.

The Making of Science, Technology…, 2009 195
should have been accorded to the United States rather than to the major countries of Europe, or to Japan”, concluded M. Boretsky38
The Department of Commerce continued to develop and improve the indicator in the following years
.
39, and used the data to document America’s competitiveness40. In fact, the 1980s was a time when the US government became obsessed with international competitiveness: “the United States is playing a relatively smaller role in the world economy”, stated the report of the President on US competitiveness in 198041. Indeed, in 1971, the US balance of trade turned to a deficit for the first time since 1893, and in 1986 the US trade performance in technology-intensive industries would dip into a $2.6 billion deficit for the first time. But now it was Japan rather than Europe that was the target: “Japan has joined the United States in having a comparative advantage in technology-intensive products (…)”, warned the document42
38 M. Boretsky (1973), US Technology: Trends and Policy Issues, op. cit.
p. 85.
. In response, the US government set up a
39 R. K. Kelly (1976), Alternative Measurements of Technology-Intensive Trade, Office of International Economic Research, Department of Commerce; R. Kelly (1977), The Impact of Technology Innovation on International Trade Patterns, Department of Commerce, Washington; L. Davis (1982), Technology Intensity of US Output and Trade, Department of Commerce, International Trade Administration, Washington; L. A. Davis (1988), Technology Intensity of US, Canadian and Japanese Manufacturers’ Output and Exports, Office of Trade and Investment Analysis, Department of Commerce.
40 US Department of Commerce (1983), An Assessment of US Competitiveness in High Technology Industries, International Trade Administration; V. L. Hatter (1985), US High Technology Trade and Competitiveness, Department of Commerce, International Trade Administration, Washington.
41 Together with the Study on US Competitiveness, Report of the President on US Competitiveness, Office of Foreign Economic Research, Department of Labor, 1980.
42 Soon, every US organization would get into the discourse. See, for example: Office of Technology Assessment (1991), Competing Economies: America, Europe, and the Pacific Rim, Washington; National Research Council (1992), Japan’s Growing Capability: Implications for the US Economy, Office of International Affairs, Washington: National

196 The Making of Science, Technology…, 2009
Commission on Industrial Competitiveness in 198343, then the Council on Competitiveness in 198644, and the Competitiveness Policy Council in 199245. It also set up the Critical Technologies Institute in 1991 (renamed the Science and Technology Policy Institute in 1998), which periodically identified technologies critical for the future46. It was in this context that concepts like critical technologies, core technologies, basic technologies, advanced technologies, new technologies, strategic technologies and emerging technologies came onto the scene47
In its methodological works, the Department of Commerce used more or less the same criteria as initially suggested by Boretsky, but more work was conducted at the level of product groups (R. Kelly) and on embodied technology (L. A. Davis). Soon, other US organizations started developing their own classifications, among them the
.
Academy Press; National Science Foundation (1995), Asia’s New High-Tech Competitors, NSF 95-309, Washington: National Science Foundation.
43 Global Competition: the New Reality, 1985. 44 Influential reports were: America’s Competitive Crisis, 1987; US
Competitiveness: A Ten-Year Strategic Assessment, 1996. 45 Building a Competitive America, 1992, Washington. 46 For criticisms of the exercises, see: M. E. Mogee (1991), Technology
Policy and Critical Technologies: A Summary of Recent Reports, National Academy Press; L. M. Branscomb (1993), Targeting Critical Technologies, in Empowering Technology, Cambridge: MIT Press, p. 36-63.
47 National Research Council (1983), International Competition in Advanced Technology: Decisions for America, Washington: National Academy Press; US Department of Commerce (1987), The Status of Emerging Technologies: An Economic/Technological Assessment to the Year 2000, NBSIR 87-3671, Washington; H. Giersch (ed.) (1982), Emerging Technologies: Consequences for Economic Growth, Structural Change and Employment, Tubinger, Mohr; Science Council of Canada (1986), A National Consultation on Emerging Technologies, Ottawa; OECD (1985), Analytical Report of the Ad Hoc Group on Science, Technology and Competitiveness, SPT (84) 26; OECD (1988), New Technologies in the 1990s: A Socio-Economic Strategy, Paris.

The Making of Science, Technology…, 2009 197
Department of Labor,48 the Bureau of Census,49 and the National Science Foundation50
From these efforts, the use of the indicator soon spread to other countries
. The Foundation’s work in fact started soon after Boretsky’s, and was intended to add new indicators to its recent Science Indicators series. The organization defined technology intensity using two criteria: R&D as a percentage of sales, and the number of scientists and engineers engaged in R&D.
51 and international organizations like the European Commission52
48 C. M. Aho and H. F. Rosen (1980), Trends in Technology-Intensive
Trade with Special Reference to US Competitiveness, Office of Foreign Economic Research, US Department of Labor.
and the OECD.
49 G. Worden (1986), Problems in Defining High-Technology Industries, Bureau of Census, Washington; T. Abbott et al. (1989), Measuring the Trade Balance in Advanced Technology Products, Center for Economic Studies, US Bureau of Census, Washington; T. A. Abbott (1991), Measuring High Technology Trade: Contrasting International Trade Administration and Bureau of Census Methodologies and Results, Journal of Economic and Social Measurement, 17, p. 17-44; R. H. McGuckin et al. (1992), Measuring Advanced Technology Products Trade: A New Approach, Journal of Official Statistics, 8 (2), p. 223-233; M. E. Doms and R. H. McGuckin (1992), Trade in High Technology Products, Science and Public Policy, 19 (6), p. 343-346.
50 See Science Indicators (1974) and subsequent editions. Starting with the 1993 edition, new indicators were constructed by researchers from the Georgia Institute of Technology (A. L. Porter and J. D. Roessner).
51 H. Legler (1987), West German Competitiveness of Technology Intensive Products, in H. Grupp (ed.), Problems of Measuring Technological Change, Koln: Verlag TUV Rheinland GmbH; OECD (1988), La mesure de la haute technologie: méthodes existantes et améliorations possibles, DSTI/IP/88.43, p. 10-14. For the United Kingdom, see: R. L. Butchart (1987), A New UK Definition of the High-Technology Industries, Economic Trends, 400, p. 82-88; For Canada, see: Ministry of State, Science and Technology (1978), Canadian Trade in Technology-Intensive Manufactures, 1964-1976, Ottawa.
52 European Commission (1994), First European Report on Science and Technology Indicators, Brussels.

198 The Making of Science, Technology…, 2009
HIGH TECHNOLOGY
In the mid-1980s, the term high technology began to be used concurrently or in place of technology intensity, as evidenced in the US Department of Commerce reports53
As early as 1980, the OECD Committee for Scientific and Technological Policy (CSTP) set up an ad hoc group on science, technology and competitiveness to get a better understanding of international competitiveness and its relations to technology. The group delivered its analytical report in 1984. According to the group, “differences in R&D intensities are best interpreted as signifying, first that in some industries technology is more immediately geared to R&D than it is in others”, and second that “such industries may also represent the technology base on which other industrial sectors rely and from which inter-sectoral transfers of technology must take place (…)”
. Nothing had changed with regard to the statistic, however, but a valued and prestigious label (high) was now assigned to it. The OECD was an important catalyst in the dissemination of this term.
54. The main thesis of the report was therefore: “changes in the nature and location within industry of core technologies are probably associated with extensive economic and industrial changes of a structural type, both at the domestic and at the international level, many of which will bear directly on the competitiveness of firms and economies”55
The real impetus to work on high technology, however, came from the OECD Council of Ministers, which asked the Secretariat in 1982 to examine the problems that could arise in the trade of high-technology products. High-technology trade had now gained strategic
.
53 An early use of the term appears in R. N. Cooper (1971), Technology and
US Trade: A Historical Review, in National Academy of Engineering, Technology and International Trade, Proceedings of a Symposium Held on October 14 and 15, 1970, Washington: NAE, p. 9.
54 OECD (1985), Analytical Report of the Ad Hoc Group on Science, Technology and Competitiveness, op. cit. p. 11.
55 Ibid., p. 14.
The Making of Science, Technology…, 2009 199
importance in the economic and political context of the time, particularly in the United States (due to security reasons and economic concerns), but also in other OECD member countries: high-tech industries were expanding more rapidly than other industries in international trade, and were believed to be an important policy option for economic progress. The Industry Committee and the Committee for Science and Technology Policy of the Directorate for Science, Technology and Industry thus studied approaches to international trade theory56, and conducted two series of analyses: six case studies of specific industrial technologies, plus some reflections on defining high technology in terms of five characteristics or criteria (which went beyond mere ratios of R&D expenditures to sales)57. It reported back to the Council in 198558
The first international statistics were published in 1986 in the second issue of the OECD’s Science and Technology Indicators series. The organization improved over previous works, in two senses. Firstly, it began using a new label systematically – high technology. Secondly, it broke down the statistics into subclasses. Up until then, there had been only one class of industries or products classified according to technology intensity. Others were simply forgotten or called non-technology-intensive. With the OECD, three categories of technology intensity were now constructed: high, medium and low (Table 10).
.
56 OECD (1981), Analysis of the Contribution of the Work on Science and
Technology Indicators to Work on Technology and Competitiveness, DSTI/SPR/81.21.
57 OECD (1984), Background Report on the Method of Work and Findings of the Studies Carried Out by the Industry Committee and the Committee for Scientific and Technological Policy, DSTI/SPR/84.1.
58 OECD (1985), An Initial Contribution to the Statistical Analysis of Trade Patterns in High Technology Products, DSTI/SPR/84.66.

200 The Making of Science, Technology…, 2009
Table 10. OECD Technology Intensity Levels (1986) High Medium Low
Aerospace Automobiles Stone, clay, glass Office machines,
computers Chemicals Food, beverage,
tobacco Electronics and
components Other manufacturing Shipbuilding
Drugs Non-electrical machinery
Petroleum refineries
Instruments Rubber, plastics Ferrous metals Electrical machinery Non-ferrous metals Fabricated metal
products Paper, printing Wood, cork, furniture Textiles, footwear,
leather
The source of this innovation is most probably economist Rupert W. Maclaurin from MIT. Maclaurin is an author totally forgotten today. One finds nothing in the literature on his biography, and neither is there anything on his role in the literature on innovation, except old citations59. Beginning in the early 1940s, he developed the first program of research on the economics of technological change60
59 R. R. Nelson (1959), The Simple Economics of Basic Scientific
Research, Journal of Political Economy, 67, p. 297-306; E. Mansfield (1968), The Economics of Technological Change, New York: Norton, p. 12 (footnote 2), p. 34 (footnote 45).
. He used Schumpeter’s ideas, analyzing innovation as a process composed of several stages or steps, and proposed a theory of innovation, later called the linear model of innovation. From this research, he developed the first full-length discussion of the model,
60 B. Godin (2007), In the Shadow of Schumpeter: W. Rupert Maclaurin and the Study of Technological Innovation, Project on the History and Sociology of STI Statistics, INRS: Montreal, Forthcoming.

The Making of Science, Technology…, 2009 201
and suggested the first list of indicators for measuring innovation61. Then in 1954, Maclaurin suggested a measure of “technological progress” based on a three-stage classification (high, medium and low) and classified thirteen industries according to the volume of R&D expenditures, the number of patents issued and the number of scientists 62
Highest rate of progress
:
Chemical Photographic Airplane Oil
High Progress Radio and television Electric light
Medium Progress Automobile Paper Steel
Lower progress Food processing Cotton textile Coal mining House assembling
The classification was influential. In the following years, similar classifications appeared. In the late 1950s, C. F. Carter and B. R. Williams, respectively from Belfast and Keele universities, carried out a series of studies on innovation for the Science and Industry
61 W. R. Maclaurin (1953), The Sequence from Invention to Innovation and
its Relation to Economic Growth, Quarterly Journal of Economics, 67 (1), p. 97-111.
62 W. P. Maclaurin (1954), Technological Progress in Some American Industries, American Economic Review, 44 (2), p. 178-200.

202 The Making of Science, Technology…, 2009
Committee of the British Association for the Advancement of Science63. One of these studies looked at the characteristics of firms that make them “technically progressive”, or innovative, defined as using science and technology, and capable of producing or adopting new products and processes64. The suggested classification for over 150 firms in their sample population was: progressive, moderately progressive and non-progressive. From their calculations, Carter and Williams measured a relationship between progressiveness and firms’ performance, such as profits. Then, a three-level classification came to be used in several national reports, like the US Tariff Commission in 197365, and the Canadian Ministry of State for Science and Technology66
With its new classification, the OECD calculated that the R&D-intensive industries
.
67 were responsible for 51% of total industrial R&D of OECD countries during the period 1970-198068
63 C. F. Carter and B. R. Williams (1957), Industry and Technical Progress:
Factors Governing the Speed of Application of Science, London: Oxford University Press; C. F. Carter and B. R. Williams (1958), Investment in Innovation, London: Oxford University Press; C. F. Carter and B. R. Williams (1959), Science in Industry: Policy for Progress, London: Oxford University Press.
. The organization also found that these industries have the highest growth, and show a positive correlation between R&D intensity and exports. The United States and Japan were at the forefront. In the next decade,
64 C. F. Carter and B. R. Williams (1957), Industry and Technical Progress, op. cit., p. 108-111, 177-188; C. F. Carter and B. R. Williams (1959), The Characteristics of Technically Progressive Firms, Journal of Industrial Economics, 7 (2), p. 87-104.
65 US Tariff Commission (1973), Implications of Multinational Firms for World Trade and Investment and for US Trade and Labor, Washington.
66 Ministry of State, Science and Technology (1978), Performance of Canadian Manufacturing Industries by Levels of Research Intensity, Background Paper, Ottawa.
67 The term R&D intensity is used in the OECD text despite the fact that the chapter dealt with technology intensity.
68 OECD, Science and Technology Indicators, Paris, p. 58-74.

The Making of Science, Technology…, 2009 203
all statistical analyses on competitiveness conducted by the Directorate showed the same patterns69
The early OECD analytical work on high technology was based on the US classification scheme
.
70. The US Department of Commerce had developed a list of ten high-technology industries based on ratios of R&D expenditures to sales. The first OECD list of high-technology industries extrapolated the structure of American industry onto the entire area covered by the OECD, and was criticized for this reason71. The OECD consequently organized a workshop in 198372 in which the literature on international trade theory and its main concepts73 were studied to learn how to develop high-technology trade indicators. The workshop concluded on the need for such indicators based on the following “fact”: “direct investment or the sale of technology are as effective as exports in gaining control of markets”74
69 OECD (1992), Technology and the Economy: the Key Relationships,
Paris, chapter 11; OECD (1992), Science and Technology Policy Outlook, Paris, chapter 2; OECD (1996), Technology and Industrial Performance, Paris, chapter 5.
.
70 In fact, before the OECD Secretariat worked on the topic, no country had developed much work apart from the United States. See OECD (1993), Summary of Replies to the Questionnaire on Methodology, DSTI/EAS/IND/STP (93) 4.
71 OECD (1980), International Trade in High R&D Intensive Products, STIC/80.48; OECD (1983), Experimental Studies on the Analysis of Output: International Trade in High Technology Products – An Empirical Approach, op. cit.
72 OECD (1984), Summary Record of the Workshop on Technology Indicators and the Measurement of Performance in International Trade, DSTI/SPR/84.3.
73 Export/import, specialization (advantages), competitiveness (market share). For more recent discussions, see: T. Hatzichronoglou (1996), Globalization and Competitiveness: Relevant Indicators, OECD/GD(96)43.
74 OECD (1984), Summary Record of the Workshop on Technology Indicators and the Measurement of Performance in International Trade, op. cit. p. 4.

204 The Making of Science, Technology…, 2009
In collaboration with the Fraunhofer Institute for Systems and Innovation Research (Germany), the OECD then developed a new classification based on a broader sample of eleven countries75. But there were still problems regarding the lack of sufficiently-disaggregated sectoral data: the list was based on industries rather than products76. All products from high-technology industries were qualified as high-tech even if they were not, simply because the industries that produced them were classified as high-tech. And conversely, all high-tech products from low-technology industries were qualified as low-tech. Another difficulty was that the indicator did not take technology dissemination into account, but only R&D. An industry was thus reputed to be high-technology intensive if it had high levels of R&D, even if it did not actually produce or use much in the way of high-technology products and processes. Finally, the data upon which the list was based dated from 1970-8077, whereas high-technology products were known to be continuously evolving78
The list was therefore revised in the mid-1990s in collaboration with Eurostat
.
79 and following a workshop held in 199380
75 OECD (1984), Specialization and Competitiveness in High, Medium and
Low R&D-Intensity Manufacturing Industries: General Trends, DSTI/SPR/84.49.
. It used much more recent data, and included a new dimension to take technology dissemination, as embodied technology (technology incorporated in
76 OECD (1978), Problems of Establishing the R&D Intensities of Industries, DSTI/SPR/78.44.
77 OECD (1988), La mesure de la haute technologie: méthodes existantes et améliorations possibles, op. cit.; OECD (1991) High Technology Products: Background Document, DSTI/STII (91) 35.
78 All these problems were already identified in R. K. Kelly (1976), Alternative Measurements of Technology-Intensive Trade, op, cit.
79 OECD (1994), Classification of High-Technology Products and Industries, DSTI/EAS/IND/WP9 (94) 11; OECD (1995), Classification of High-Technology Products and Industries, DSTI/EAS/IND/STP (95) 1; OECD (1997), Revision of the High Technology Sector and Product Classification, DSTI/IND/STP/SWP/NESTI (97) 1.
80 OECD (1994), Seminar on High Technology Industry and Products Indicators: Summary Record, DSTI/EAS/IND/STP/M (94) 1.

The Making of Science, Technology…, 2009 205
physical capital), into account. Two lists were in fact developed. The first concerned high-technology industries, and considered both direct (R&D)81 and indirect82 intensities83. Four groups of industries were identified, with medium technology being divided into high and low (Table 11). But limitations persisted: high-technology intensities were calculated on the basis of the principal activity of the firms that made up the industry, and there was a lack of disaggregated details. In addition, the OECD recognized that: “the classification of the sectors in three or four groups in terms of their R&D intensity is partly a normative choice”84
This led to the development of the second list, which was based on products rather than industries, and which was solely concerned with the high-technology category. All products with R&D intensities above the industry average, i.e.: about 3.5% of total sales, were considered high-tech. This list excluded products that were not high-tech, even if they were manufactured by high-tech industries. Furthermore, the same products were classified similarly for all countries. But there were and still remain two limitations. Firstly, the indicator was not totally quantitative: it was partly based on expert opinion. Secondly, the data were not comparable with other industrial data.
.
81 R&D expenditure-to-output ratios were calculated in 22 sectors of the 10
countries that accounted for more than 95% of OECD industrial R&D, then, using purchasing power parities, each sector was weighted according to its share of the total output.
82 Input-output coefficients. 83 For details on calculations, see OECD (1995), Technology Diffusion:
Tracing the Flows of Embodied R&D in Eight OECD Countries, DSTI/EAS (93) 5/REV1; G. Papaconstantinou et al. (1996), Embodied Technology Diffusion: An Empirical Analysis for 10 OECD Countries, OECD/GD (96) 26.
84 OECD (1995), Classification of High-Technology Products and Industries, DSTI/EAS/IND/STP (95) 1, p. 8.

206 The Making of Science, Technology…, 2009
Table 11. OECD List of Technology Industries (1997) HIGH
Aircraft and Spacecraft (ISIC 353) Pharmaceuticals (ISIC 2423) Office, accounting and computing machinery (ISIC 30) Radio, TV and communications equipment (ISIC 32) Medical, precision and optical instruments (ISIC 33)
MEDIUM-HIGH Electrical machinery and apparatus (ISIC 31) Motor vehicles, trailers and semi-trailers (ISIC 34) Chemicals excluding pharmaceuticals (ISIC 24 less 2423) Railroad equipment and transport equipment (ISIC 352 + 359) Machinery and equipment (ISIC 29)
MEDIUM-LOW Coke, refined petroleum products and nuclear fuel (ISIC 23) Rubber and plastic products (ISIC 25) Other non-metallic mineral products (ISIC 26) Building and repairing of ships and boats (ISIC 351) Basic metals (ISIC 27) Fabricated metal products, except machinery & equipment (ISIC 28)
LOW Manufacturing; Recycling (ISIC 36-37) Wood and products of wood and cork (ISIC 20) Pulp, paper, paper products, printing and publishing (ISIC 21-22) Food products, beverages and tobacco (ISIC 15-16) Textiles, textile products, leather and footwear (ISIC 17-19)
Unlike other OECD science and technology indicators, the work of the organization on high technology never led to a methodological manual. Several times, among them during the fourth revision of the Frascati manual, a manual devoted to high technology was

The Making of Science, Technology…, 2009 207
envisioned85
CONCLUSION
, but never written. Nevertheless, indicators on international trade in high technology industries were published regularly in Main Science and Technology Indicators from 1988.
How has the concept of high technology improved over the previous concepts? Certainly, one could argue with Kelly that: “research-intensity and technology-intensity are not necessarily the same concept. What one is really trying to measure [with technology intensity] is the degree of technical sophistication of products that gives them a competitive edge (…)”86
When multiple criteria are used, they usually center around Boretsky’s three criteria, to the point that “limited progress appears to have been made on the measurement of technology intensiveness since the original Boretsky paper”
. However, it should have become clear from the above analysis that both concepts are actually the same, according to their measurement. This is because, as Kelly himself admitted: “as in many areas of economics, proxies must be used as an indicator (…). [And we] chose the R&D intensity”. The OECD technology intensity indicator is also based on R&D expenditures to sales ratios, and is frequently discussed in terms of R&D intensity rather than technology intensity.
87
85 OECD (1991), Future Work on High Technology, DSTI/STII/IND/WP9
(91) 7; OECD (1991), High Technology Products, DSTI/STII (91) 35; OECD (1992), High Technology Industry and Products Indicators: Preparation of a Manual, DSTI/STII/IND/WP9 (92) 6; OECD (1993), Seminar on High Technology Industry and Products Indicators: Preparation of a Manual, DSTI/EAS/IND/STP (93) 2.
, except for rhetorical inventiveness. For example, a newly-coined concept appeared
86 R. K. Kelly (1976), Alternative Measurements of Technology-Intensive Trade, op. cit. p. 8.
87 F. Chesnais and C. Michon-Savarit (1980), Some Observations on Alternative Approaches to the Analysis of International Competitiveness and the Role of Technology Factor, STIC/80.41, OECD, p. 14.

208 The Making of Science, Technology…, 2009
recently at the OECD in its work on the knowledge-based economy: knowledge-based industries88. Knowledge-based industries are defined as those that have the following three characteristics: 1) a high level of investment in innovation, 2) intensive use of acquired technology, and 3) a highly-educated workforce89
Briefly stated, if technology intensity is a replica of research intensity, high technology is simply a rhetorical exercise renaming technology intensity. Why? The label was the way to link and align the statistical work to political and normative issues, where buzzwords are the rule. In fact, high technology is the perfect example of a fuzzy concept with much value for rhetorical purposes. Officials use it constantly without any systematic definition, simply for its prestigious appeal.
. This is a perfect example of a variation on the high technology indicator.
Academics are no better90. What role have they played in all this? It is clear that the indicator originally came from official organizations. However, some precursors exist in the academic literature: W. R. Maclaurin, C. F. Carter and B. R. Williams. In general, however, academics (economists) have satisfied themselves with models correlating R&D with exports to assess the role of science in trade performances91
88 See Chapter 8 below.
. But they also acted as consultants to public
89 C. Webb (2000), Knowledge-Based Industries, DSTI/EAS/IND/SWP (2000)5; C. Webb (2001), Knowledge-Based Industries, DSTI/EAS/IND/SWP (2001)13.
90 Y. Baruch (1997), High Technology Organizations: What It Is, What It Isn’t, International Journal of Technology Management, 13 (2), p. 179-195.
91 T. C. Lowinger (1975), The Technology Factor and the Export Performance of US Manufacturing Industries, Economic Inquiry, 13, p. 221-236; F. Wolter (1977), Factor Proportions, Technology and West German Industry’s International Trade Patterns, Weltwirtschaftliches Archiv, 113, p. 250-267; H. Legler (1987), West German Competitiveness of Technology Intensive Products, in H. Grupp (ed.), Problems of Measuring Technological Change, Kohl: Verlag, p. 171-190; J. Fagerberg (1988), International Competitiveness, The Economic

The Making of Science, Technology…, 2009 209
organizations, helping to define indicators on technology intensity92, and increasingly used the high-technology label and its indicators in the 1990s, or developed their own classifications93. Above all, academics were at the heart of the discourses on competitiveness94
Today, the indicator remains a highly-contested measure. The main criticism has to do with the basic statistics behind the indicator: R&D expenditures. Some authors therefore have suggested replacing R&D with patents
.
95
Journal, 98, p. 353-374; G. Dosi and L. Soete (1988), Technical Change and International Trade, in G. Dosi et al. (eds.), Technical Change and Economic Theory, London: Frances Pinter, p. 401-431.
, and others have argued for using several dimensions
92 C. Freeman (SPRU) for the OECD; T. A. Abbott (Rutgers University) for the US Bureau of Census; A. L. Porter and J. D. Roessner (Georgia Institute of Technology) for the NSF.
93 E. Papagni (1992), High-Technology Exports of EEC Countries: Persistence and Diversity of Specialization Patterns, Applied Economics, 24, p. 925-933; G. Amendola and A. Perrucci (1994), European Structures of Specialization in High-Technology Products: A New Approach, STI Review, 14, p. 163-191; H. Grupp (1995), Science, High Technology and the Competitiveness of EU Countries, Cambridge Journal of Economics, 19, p. 209-223; P. Guerrieri and C. Milana (1995), Changes and Trends in the World Trade in High-Technology Products, Cambridge Journal of Economics, 19, p. 225-242; J. D. Roessner et al. (1996), Anticipating the Future High-Tech of Nations: Indicators for 28 Countries, Technological Forecasting and Social Change, 51, p. 133-149; A. L. Porter et al (1996), Indicators of Technology Competitiveness of 28 Countries, International Journal of Technology Management, 12 (1), p. 1-32; A. L. Porter et al., (1999), Indicators of Technology-Based Competitiveness of 33 Countries, TPAC, Georgia Institute of Technology, Atlanta; A. L. Porter et al. (2001), Changes in National Technological Competitiveness, Technology Analysis and Strategic Management, 13, p. 477-496; D. Roessner et al. (2002), A Comparison of Recent Assessments of High-Tech Competitiveness of Nations, International Journal of Technology Management, 23, p. 536-537.
94 M. E. Porter (1990), The Competitive Advantage of Nations, New York: Free Press.
95 L. Soete (1987), The Impact of Technological Innovation on International Trade Patterns: The Evidence Reconsidered, Research Policy, 16, p. 101-130.

210 The Making of Science, Technology…, 2009
and statistics to define the indicator96. A second frequently-voiced criticism has to do with the fact that a firm may be considered technology-intensive not only because it conducts R&D, but also if it adopts and uses advanced technologies in its activities and employs highly-trained workers97. In this sense, low-tech and medium-tech industries are in a close, symbiotic relationship with high-tech industries, and constitute a market for the latter98. A third criticism refers to the fact that there is no standardization yet, and therefore organizations and authors produce different results. T. A. Abbott, for example, has documented how a trade surplus of $3.5 billion (1985-88) is measured when products are used as units, and a deficit ($17 billion) appears when the measurement is based on industries99
Certainly, the indicator brought simplification to statistical analyses. Before high-technology groups appeared, analysis of R&D and trade was conducted according to individual industrial classes or
.
96 E. Sciberras (1986), Indicators of Technical Intensity and International
Competitiveness: A Case for Supplementing Quantitative Data with Qualitative Studies in Research, R&D Management, 16 (1), p. 3-14; K. Hughes (1988), The Interpretation and Measurement of R&D Intensity: A Note, Research Policy, 17, p. 301-307; D. Felsenstein and R. Bar-El (1989), Measuring the Technological Intensity of the Industrial Sector: A Methodological and Empirical Approach, Research Policy, 18, p. 239-252.
97 K. S. Palda (1986), Technological Intensity: Concept and Measurement, Research Policy, 15, p. 187-198; J. R. Baldwin and G. Gellatly (1998), Are There High-Tech Industries or Only High-Tech Firms? Evidence From New Technology-Based Firms, Research Paper series, No. 120, Statistics Canada.
98 N. von Tunzelmann and V. Acha (2005), Innovation in “Low-Tech” Industries, in J. Fagerberg, D. C. Mowery and R. R. Nelson (eds.), The Oxford Handbook of Innovation, Oxford: Oxford University Press, 407-432. See also the contributions to the PILOT Project’s conference on “Low-Tech as a Misnomer: the Role of Non-Research-Intensive Industries in the Knowledge Economy”, Brussels, 29-30 June 2005. http://www.pilot-project.org/conference.html.
99 T. A. Abbott (1991), Measuring High Technology Trade: Contrasting International Trade Administration and Bureau of Census Methodologies and Results, op. cit.

The Making of Science, Technology…, 2009 211
products100. The high-technology indicator reduced the classification to only three groups. But the indicator also highlighted statistical discrepancies between studies. As the OECD itself argued, each author, organization or country has its own idea of what constitutes high technology, and each uses its own vocabulary101. The OECD was only partly right, however, when it suggested that “the concept of high technology became part of our everyday vocabulary before economists and scientists had even managed to produce a precise and generally-accepted definition of the term”102. Very early on, official economists (and statisticians) invented the concept and constructed a measurement – which more or less focused on R&D data. The problem stems rather from the political obsession to which it was applied – competitiveness103
100 For example, see: Leontief (1953), op. cit; B. Balassa (1962), Recent
Developments in the Competitiveness of American Industry and Prospects for the Future, in Joint Economic Committee, Factors Affecting the United States Balance of Payments, op. cit, p. 27-54; W. H. Branson and H. B. Junz (1971), Trends in US Trade and Comparative Advantage, Brooking Papers on Economic Activity, 2, p. 285-345.
– and the urge to support the case quantitatively.
101 OECD (1993), Summary of Replies to the Questionnaire on Methodology, DSTI/EAS/IND/STP (93) 4.
102 OECD (1988), La mesure de la haute technologie: méthodes existantes et améliorations possibles, DSTI/IP/88.43, p. 3.
103 To get an idea of the reports produced in several countries in the early 1990s, see: OECD (1995), Competitiveness: An Overview of Reports Issued in Member Countries, DSTI/IND (95) 15. For the OECD program of work on competitiveness in the 1990s, see: OECD (1993), Framework Conditions for Industry: A New Policy Paradigm, DSTI/IND (93) 31.


The Making of Science, Technology…, 2009 213
CHAPTER SIX
THE POLITICAL AGENDA ON GLOBALIZATION, ITS FRAMEWORK AND MEASUREMENT
As the previous chapter documented, industrial competitiveness, or the capacity of firms to produce and sell goods and services, was on every government’s lips in the 1990s1. The OECD was no exception, and conducted several studies on industrial competitiveness. What was characteristic of these works was that, with time, they increasingly came to be linked to a narrative on globalization: “The concern with competitiveness is not new (…). However, within the current context of the globalization of product and capital markets and the rapid diffusion of know-how, meeting the competitiveness agenda has assumed greater urgency”2
According to every analyst, the competitiveness of a nation is much more difficult to define than that of a firm
.
3
1 For an overview of national reports on industrial competitiveness, see:
OECD (1996), Industrial Competitiveness, Paris.
. Broadly defined, however, national competitiveness refers to at least three elements. First, to the capacity of a country to sell its products and services in other countries. Here international trade is the traditional indicator for assessing the countries’ competitiveness, and early on, the OECD Directorate for Science, Technology and Industry developed indicators on high technology trade. The second way to compare countries according to competitiveness is by looking at productivity. Again, the Directorate conducted a whole program of work in the
2 OECD (1995), High Level Forum on Industrial Competitiveness: Draft Synthesis of the Discussions, DSTI/IND (95) 18, p. 3.
3 P. Krugman (1997), Pop Internationalism, Cambridge (Mass.), MIT Press.

214 The Making of Science, Technology…, 2009
1990s that compared the productivity of OECD member countries and tried to explain the differences as being attributable to technology. Third, the competitiveness of countries refers to the factors, or the national environment, that are the major determinants of the location and of the investment decisions of firms4
In all OECD countries, a major impact of globalization on government policy has been to focus policymakers’ attention to the importance of the framework conditions for business activity. In global competition in product and capital markets, and ensuing mobility of production capacity in trade exposed sectors, domestic level of investment, employment and earnings are heavily influenced by the framework parameters that affect local firms’ productivity, cost-effectiveness and innovativeness. These factors make the national business sector more or less attractive to internationally mobile investment capital, and to localization decisions by multinational corporations.
:
In 1994, the OECD embarked on a project using benchmarking indicators precisely for comparing the characteristics, strengths and weaknesses of domestic business environments, that is, the “framework conditions” of OECD countries5
4 OECD (1996), Framework Conditions for Industrial Competitiveness:
Past Progress and Next Steps, DSTI/IND (96) 14, p. 2.
. Eight variables were finally chosen to define competitiveness and to benchmark countries: research and development (R&D) infrastructure, educational profile of the labour force, corporate governance environments, employment
5 OECD (1993), Framework Conditions for Industry: A New Policy Paradigm, DSTI/IND (93) 31; OECD (1994), Framework Conditions for Industrial Competitiveness: the OECD Industry Committee Project, DSTI/IND (94) 4; OECD (1994), Cadre des activités industrielles: résumé et conclusions de la reunion “méthodologie et plan de travail”, DSTI/IND (94) 11.

The Making of Science, Technology…, 2009 215
regulations, labour costs, corporate taxation, energy costs, telecommunication costs and infrastructures. The results were published under the umbrella of globalization in 19976. To the OECD, these factors were framework conditions for decisions of firms to globalize: “in rapidly globalizing OECD economies, differences in framework conditions for industry are having an increasing impact (…)”7
But what is globalization? And how should we measure it? This chapter looks at the efforts of the OECD to define globalization, a concept that still remains fuzzy today, and to develop standardized indicators. It develops the thesis that globalization is not a new phenomenon but rather reflects policy-makers and statisticians’ new interest in globalization. The first part discusses the conceptual framework that the OECD developed in the 1990s to analyze the globalization of economies. The framework centered on foreign direct investment as the main characteristic of globalization. The second part analyzes the impact of both globalization and OECD work on science and technology statistics. As technology was identified as the second characteristic of globalization, several science, technology and innovation statistics came to be revised or reconsidered to introduce the dimension of globalization. The last section discusses the empirical results emerging from the OECD work.
.
THE GLOBALIZATION FRAMEWORK
The current statistical work of the OECD Directorate for Science, Technology and Industry owes its orientation partly to the Technology and Economy Program of the early 1990s, which
6 OECD (1997), Industrial Competitiveness: Benchmarking Business
Environment in the Global Economy, Paris. 7 OECD (1994), Framework Conditions for Industrial Competitiveness: the
OECD Industry Committee Project, op. cit. p. 4.

216 The Making of Science, Technology…, 2009
identified globalization as one of the eight topics that should be extensively studied. In fact, the conference that launched the Technology and Economy Program concluded that the concept of globalization was fuzzy, subjective, badly defined and a hodge-podge of ideas8. Years later, globalization was still qualified as a “fairly vague and imprecise concept”9. Certainly, international trade has grown by a factor of 16 in real terms since 1950, and foreign direct investment by 25 times since 197010. But, “none of these components of economic globalization is actually new”, admitted the OECD; “rather, it is their intensity and multiplicity, which gathered pace in the 1980s and 1990s, that are creating a new world-wide economic system”11. Internationalization has taken new forms, and it was to these new forms that the OECD applied the term globalization: “International trade can no longer be considered as being virtually the sole vector for the penetration of foreign markets: international investments and transfers of technology now play important parts in this process”12. For the OECD, a distinctive feature of globalization is the division of firms’ operations into separate segments carried out in different countries. The most prominent features of globalization are foreign direct investment, various aspects of international trade, and international inter-firm collaboration13
In the view of the OECD, these new forms of internationalization were not being appropriately measured. “Until [the 1990s], all indicators of competitiveness were based exclusively on international
.
8 OECD (1992), Technology and the Economy: The Key Relationships,
Chapter 10, Paris, p. 232. 9 OECD (1996), Possibility of Preparing a Manual on Globalization
Indicators, DSTI/EAS/IND/WP9 (96) 8, p. 2. 10 OECD (1998), Globalization and Industry Performance, DSTI/IND (98)
11. 11 OECD (2001), Manual on Economic Globalization Indicators: Chapter 1,
DSTI/EAS/IND/SWP (2001) 1, p. 4. 12 OECD (1992), Indicators of the Globalization of Industrial Activities,
DSTI/STII/IND/WP9 (92) 1; OECD (1996), Globalization and Competitiveness: Relevant Indicators, OCDE/GD (96) 43.
13 OECD (1996), Globalization of Industry, Paris, p. 15.

The Making of Science, Technology…, 2009 217
trade”14 and “were proving a less effective guide to policymaking”15. “Many aspects of globalization will only be understood through collection and examination of new internationally comparable data and case studies”, declared the OECD.16 But there was a great deal of data for which international comparability was not satisfactory and required harmonization17
These two limitations – the fuzziness of the concept and the inadequacy of the indicators – required coordination of the then-current studies to pull the work together into a more coherent whole
.
18. Above all, what was needed was a framework, as suggested by the US delegate: “work has been underway in a number of OECD committees studying the impact of a range of domestic policies on globalization. The US believes these crosscutting proposals require coordination”, that is, a framework including sectoral studies and horizontal statistical analysis19
The OECD’s program of work on globalization started in the early 1990s with the following definition: “Globalization is the outcome of the progressive international expansion of firms since World War II. Firms strategies have shifted from exporting, through local sales networks and local assembly, to fully integrated foreign operations
.
14 OECD (1992), Indicators of the Globalization of Industrial Activities, op.
cit. p. 5. 15 OECD (2000), Manual on Economic Globalization Indicators: General
Presentation, DSTI/IND (2000) 16, p. 2. 16 OECD (1992), Industrial Policy in OECD Countries: Annual Review
1992, Paris, p. 195. 17 OECD (1996), Possibility of Preparing a Manual on Globalization
Indicators, op. cit. p. 3. See also: OECD (1998), Database on the Activity of Foreign Affiliates in OECD Countries and National Firms’ Affiliates Abroad, DSTI/EAS/IND/SWP (98) 15.
18 OECD (1992), Globalization of Industrial Activities: Globalization Framework, DSTI/IND (92) 45, p. 3.
19 OECD (1992), Globalization of Industrial Activities: Globalization Framework, DSTI/IND/WP9 (92) 6/07, p. 3.

218 The Making of Science, Technology…, 2009
with local headquarters functions and networks of suppliers and co-operating firms”20
The OECD identified two sets of reasons for studying the phenomenon. First, policy issues: “Lasting solutions to many problems facing governments can now only be found at the world level: environment, trade, technology, financial markets, capital flows, foreign direct investment”
.
21. According to the OECD, policy issues concerned the concentration of economic power within a few companies, the low level of local sourcing and linkages between foreign firms and national suppliers, the subsidization of foreign investment and constraints on inward investment, the impact on small businesses, and intellectual property rights. In fact, for years, fears had been expressed concerning multinationals and foreign takeovers. As the US National Research Council’s Committee on Foreign Participation in US R&D reminded its readers: foreign participation in US R&D may weaken the nation’s technology base, increase US dependence on foreign sources of technology, undermine military strength, or shift jobs and profits away from the United States22
Apart from the above policy issues, however, imperatives on economic growth came to dominate the rhetoric in the mid 1990s: “Industries which are globalizing faster perform better in a measurable way than industries which are less exposed to globalization”
.
23
20 OECD (1992), Globalization of Industrial Activities: Overview of Work,
DSTI/IND (92) 28, p. 4.
. Briefly stated, the OECD thought that globalization had a significant impact on economic growth, productivity and competitiveness.
21 OECD (1991), Indicators of the Internationalization of Industrial Activities, DSTI/STII/IND/WP9 (91) 3, p. 3.
22 P. P. Reid and A. Schriesheim (eds.) (1996), Prospering in a Global Economy: Foreign Participation in US R&D: Asset or Liability, Washington: National Academy Press, p. V.
23 OECD (1998), Globalization and Industry Performance, op. cit. p. 4.

The Making of Science, Technology…, 2009 219
In 1991, the OECD Industry Committee asked its working party on industrial statistics to include the development of new indicators on the “globalization of industrial activities” in its program of work. In fact, “most of the indicators currently available are purely national in conception (…)”24
To launch this work program, a workshop on Globalization Indicators was held in June 1993, and from then on, the working party held a special annual session on globalization
. Work was suggested on the following indicators: foreign investments in production and trade, mergers and acquisitions, agreements and alliances, concentration, intra-branch and intra-product trade, patents, technological balance of payments, and location of R&D centers.
25. Within the working party, foreign direct investment was identified as a priority for measurement, particularly the activity of foreign affiliates. Two main projects came out of the workshop. First was a databank on foreign affiliates. The first OECD survey on the activities of foreign affiliates had already been conducted in 1989, and an analysis had been published in 1994 (The Performance of Foreign Affiliates in OECD Countries). The working party extended the databank with a survey of the activities of affiliates of national firms abroad (multinationals) (Activities of Foreign Affiliates in OECD Countries, 1997). The databank now includes 18 variables, among them R&D, and is concerned with inward26 and outward27
24 OECD (1991), Indicators of the Internationalization of Industrial
Activities, op. cit. p. 3.
investments, for both manufacturing and services (Measuring Globalization, 2001). The databank was also made compatible with data from industrial surveys.
25 OECD (1993), Workshop on Globalization Indicators, DSTI/EAS/IND/WP9 (93) 5; OECD (1993), Workshop on Globalization Indicators, DSTI/IND/RD (93) 5.
26 Activities of foreign affiliates within each country. 27 Affiliates of national firms abroad.

220 The Making of Science, Technology…, 2009
The second output from the workshop was related to a suggestion to develop methodological guidelines on Flows of Direct Investments28. The suggestion gave rise to the idea of a manual on economic globalization indicators in 199629
The manual, now called a handbook
. Five areas were suggested for measuring globalization and for harmonizing national statistics: a definition of the concept itself, trade, direct investment, employment and technology. Employment was later deleted.
30, made available in 200431, defined globalization as follows: a “phenomenon in which markets and production of different countries become increasingly interdependent through the changes induced by the dynamics of trade, capital and technology flows – changes of which the primary vehicles are multinational enterprises. Thanks to information and communication technologies, such firms are organized into transnational networks in a context of intense international competition which also extends to local firms, as well as to other spheres of each country’s economic and social life”32
The handbook developed three sets of indicators: trade in goods and services, foreign direct investment by multinational firms, and internationalization of technology. Three sets of indicators were also suggested for measuring the internationalization of technology: R&D expenditures, technology receipts and payments, and high technology products.
.
28 OECD (1993), Workshop on Globalization Indicators, op. cit. 29 OECD (1996), Possibility of Preparing a Manual on Globalization
Indicators, op. cit. 30 In the end, “manual” was changed to “handbook” because the OECD
judged the document not mature enough. The term manual, however, remains in the French version. Personal conversation with T. Hatzichronoglou, 21 May 2004.
31 OECD (2004), Handbook on Economic Globalization Indicators, DSTI/EAS/IND/SWP (2004) 1.
32 OECD (2001), Manual on Economic Globalization Indicators, op. cit. p. 4.

The Making of Science, Technology…, 2009 221
THE GLOBALIZATION OF TECHNOLOGY
The OECD narrative identified three phases in the process leading to globalization33. The first was concerned with trade in products and services. This phase is called internationalization. The second, called multinationalization, was concerned with the increased use of direct investment as a strategy by firms to expand. The last is globalization proper. It is characterized, among other things, by the relocation of R&D centers34
To the OECD, technology was an important factor explaining globalization: “Technology is one of the main driving forces behind globalization, thanks in particular to the growth in and acceleration of the dissemination of new information and communication technologies”
.
35. “Probably the most important change in firm strategies to improve competitiveness is their emphasis on investment in intangible assets; this shift is part of the larger move towards a more knowledge-based economy”36. The rhetoric goes back to the Technology and Economy Program Conference, which insisted that technology played a role in the globalization process37
The early draft version of the handbook on globalization originally covered five forms of globalization with regard to technology
.
38
33 OECD (1992), Globalization of Industrial Activities: Four Case Studies,
Paris; T. Hatzichronoglou (1999), The Globalization of Industry in OECD Countries, STI Working Papers 1999/2, DSTI/DOC (99) 2.
:
34 For variations on such taxonomies, see: D. Hamdani (2003), Global or Multinational: It Matters for Innovation, Innovation Analysis Bulletin, Statistics Canada, 88-003, p. 3-4.
35 OECD (1996), Possibility of Preparing a Manual on Globalization Indicators, op. cit.
36 OECD (1997), Industrial Performance and Competitiveness in an Era of Globalization and Technological Change, DSTI/IND (97) 23, p. 3.
37 OECD (1991), TEP: International Conference Cycle, Paris; OECD (1992), Technology and the Economy: The Key Relationships, Chapter 10, op. cit.
38 OECD (1999), Manual on Globalization Indicators, DSTYI/IND/STP/SWP/NESTI (99) 1.

222 The Making of Science, Technology…, 2009
R&D, patents, trade in disembodied technology (technology payments and receipts), international technology alliances between firms, and high-technology products. It finally centered around three39: R&D, technology diffusion (payments and receipts), and high-technology trade. The rationale for deleting the other two series of indicators was one that was offered as early as 1993 at the workshop on globalization, which suggested dropping work on collection of international data on mergers and acquisitions and collaboration agreements between firms because these data “are collected mainly by private sources without any involvement of official statistical services”40. The handbook on globalization added that such data require further methodological analysis, but also stated that these areas “would raise some problems because most of the basic data have until now been collected by private sources. Consequently, the harmonization of data, which is one of the main objectives of this manual, becomes more difficult”41
While this argument is true for technological alliances between firms, it is not for patents. Data on patents come from public patent offices. Furthermore, the Directorate for Science, Technology and Industry recently launched a whole program of work on patents, based on patent families
.
42, which owes its existence partly to the globalization framework43
39 OECD (2002), Manual on Economic Globalization Indicators, op. cit.
. Since 2002, the indicators on patent families have been judged sufficiently developed to be included in Main Science and Technology Indicators. The same is true for the other deleted
40 OECD (1993), Workshop on Globalization Indicators, op. cit., p. 17. 41 OECD (2002), Manual on Economic Globalization Indicators, op. cit.
p. 3. 42 OECD (2000), Counting Patent Families: Preliminary Findings,
DSTI/EAS/STP/NESTI/RD (2000) 11; OECD (2001), Patent Families: Methodology, DSTI/EAS/STP/NESTI (2001) 11.
43 OECD (1999), The Internationalization of Technology Analyzed with Patent Data, DSTI/EAS/STP/NESTI (99) 3.

The Making of Science, Technology…, 2009 223
statistics: their lacunae never prevented the OECD from using the statistics and conducting whole analyses based on them44
Be that as it may, the handbook was the occasion for the Directorate for Science, Technology and Industry to review its science, technology and innovation statistics at three levels, to which we now turn: redefining GERD (Gross Expenditures on R&D), resuscitating the technological balance of payments indicator, and revising statistics on government funding of R&D
.
45
Measuring the Internationalization of R&D
.
In 1993, the workshop on globalization suggested that the “detailed data reveal that [the recent R&D] decline may be attributed to the decision by several major companies to relocate their R&D laboratories abroad. These companies have also acquired a number of foreign R&D laboratories through mergers and acquisitions”46
44 See, for example: OECD (2000), Changing Patterns of Industrial
Globalization: International Strategic Alliances, DSTI/IND (2000) 2; Nam-Hoon Kang and S. Johansson, Cross-Border Mergers and Acquisitions: Their Role in Industrial Globalization, DSTI/DOC (2000) 1; OECD (2001), Science, Technology and Industry Scoreboard, Paris; OECD (2002), Industrial Globalization and Restructuring, in Science, Technology and Industry Outlook, Paris, p. 203-227.
. There was therefore a need to redefine the concept of the national R&D effort in the context of globalization: “Until now the attention of the authorities in every country has focused essentially on research carried out inside their own borders. However (…) it is important to take into account that a significant portion of R&D carried out inside a country’s national borders is intended for foreign markets and,
45 Indicators on high technology were already well developed, and nothing new, with regard to globalization, was suggested in the manual on economic globalization.
46 OECD (1992), Indicators of the Globalization of Industrial Activities, op. cit. p. 5.

224 The Making of Science, Technology…, 2009
conversely, that a share of the R&D carried out abroad is intended for the domestic market”47
The working party suggested working together with the Group of National Experts on Science and Technology Indicators (NESTI) to improve the indicators on R&D activities of foreign firms in domestic markets, and of domestic firms abroad. To date, multinational firms have never been considered as a distinct category of firm, neither in national R&D surveys nor in the Frascati manual. The R&D expenditures of a country’s industry (Business Expenditures on R&D, or BERD) is currently defined as the sum of the R&D expenditures by nationally-controlled firms in that country, plus R&D expenditures by affiliates owned by firms from other countries for R&D carried out in the country in question. The handbook on economic globalization indicators suggested that a firm’s nationality take precedence, rather than the country in which its research activities are carried out. Using this approach, a country’s business R&D effort would consist of the research conducted on its territory by domestically-controlled firms and by affiliates of those firms abroad, excluding research done locally by foreign-owned firms. The handbook therefore suggested a series of appropriate indicators: R&D activities of foreign affiliates in each country (inward investment), R&D activities of affiliates of national firms abroad (outward investment), and R&D activities of parent companies in their home countries.
.
The survey and the databank on the Activities of Multinational Firms were the envisaged sources of data for the indicators, since they include R&D expenditures of affiliates of national firms abroad since the mid 1990s – to which R&D activities by parent company have recently been added. However, another source of data came to be available: the OECD agreed to modify its international survey on
47 OECD (2004), The Internationalization of Industrial R&D: Policy Issues
and Measurement Problems, DSTI/EAS/STP/NESTI (2004) 24, p. 3.

The Making of Science, Technology…, 2009 225
R&D48. For years, the survey collected data on funding of R&D to and from other countries, but no distinction was made between national firms and foreign affiliates. In the case of external funding of industrial R&D, a distinction is now made in the survey between BERD (domestic business expenditures on R&D) and NBERD (national business expenditures on R&D). Furthermore, the most recent edition of the Frascati manual included in its sectoral classification of private enterprise a distinction among “enterprises not belonging to any group, enterprises belonging to a national group and enterprises belonging to a foreign multinational group”. 49 The challenge remains that of persuading countries to collect such information50
Renewed Interest in the Technological Balance of Payments
.
The technological balance of payments has always been a criticized indicator. The problems are in fact many, but the main ones involve methodological concerns (limited international comparability of the data and heterogeneous sources) and interpretation (a negative balance, for example, can be a positive sign for a country’s economy). It is therefore surprising to find the technological balance of payments selected as an indicator for measuring globalization.
In fact, according to the OECD, globalization provided an opportunity – a framework – for interpreting technological payments
48 OECD (1996), Collection of R&D Data in Connection with Work on
Globalization, DSTI/EAS/STP/NESTI (96) 11; OECD (1998), Internationalization of Technology: Discussion Paper, DSTI/EAS/STP/NESTI (98) 9; OECD (1999), Data Collection on the Internationalization of Industrial R&D, DSTI/EAS/STP/NESTI (99) 8.
49 OECD (2002), The Measurement of Scientific and Technological Activities: Proposed Standard Practice for Surveys on Research and Experimental Development, Paris, p. 61.
50 On the availability of data in member countries, see: OECD (2004), The Internationalization of Industrial R&D: Policy Issues and Measurement Problems, op. cit.

226 The Making of Science, Technology…, 2009
and receipts by putting the indicator in a systemic perspective, that is, combining technological indicators (embodied technology flows like inter-industrial flows, high-technology flows and trade by foreign affiliates) and non-technological indicators (like the technological balance of payments). According to the OECD, the concept of globalization makes possible a different (sequential) vision of economic phenomena: direct investment flows generate exports from the investing countries (and imports from the host country) which are accompanied by transfers of technology and know-how, and by capital movements51
Despite the usefulness of the indicator for the globalization framework, the OECD has yet to publish any analyses on technology flows. In the past, the OECD conducted very few analyses on technological payments and receipts, only including some tables in Main Science and Technology Indicators. It remains to be seen whether the organization is serious about its new rationale on globalization. If investment flows, rather than trade, characterize globalization, then technological flows (payments and receipts) should figure prominently in any analyses of globalization.
.
Other Impacts of Globalization on S&T Statistics
In the early 1990s, some people began to wonder whether increasing internationalization of R&D activities might not have resulted in an incomplete picture of public R&D funding. In fact, the share of Gross Expenditures on R&D (GERD) financed by government declined from one-half in 1975 to about one-third in 1995. The reasons were many – a decline in defense R&D, increased use of fiscal incentives instead of direct financing – but the OECD Technology, Productivity and Jobs project identified the internationalization of R&D as having a major impact on the traditional measure of the government
51 OECD (1996), Technology Balance of Payments Indicators within the
Framework of the Activity on Globalization, DSTI/EAS/STP/NESTI (96) 10, p. 5.

The Making of Science, Technology…, 2009 227
contribution to R&D52
Government R&D financing can be measured in three ways: 1) from GBAORD (Government Budget Appropriations or Outlays for R&D) derived from budgetary documents, 2) from the GERD (where statistics on government R&D come from a specific survey), and 3) from the GNERD (Gross National Expenditures on R&D), which measures the total amount of R&D financed by national sources. GNERD comprises R&D performed in the country and financed by national sources (GERD minus funds from abroad), plus extramural payments by national sources for R&D performed abroad.
. Greater use was being made of international programs and facilities abroad, and these were incompletely measured.
The problem identified by the OECD was that government payments to international organizations were not included in R&D performed abroad. European countries, for example, included neither the estimated R&D content of their contribution to the European Community budget (Framework program, CERN, ESA), which amounted to 14% of GERD in 1995, nor their receipts from abroad, as government R&D. Although the latter was of little statistical consequence in countries with large R&D efforts, its effects were much more strongly felt in small R&D-intensive countries, and in fact were twice as intense in countries like Greece and Ireland than others53
In the end, the OECD concluded that statistics on government financing of R&D were not lower because greater use was being made of programs and facilities abroad, but because, according to some countries (European countries and Canada), they merely provide an incomplete picture of government funding. The
.
52 OECD (1998), Technology, Productivity and Job Creation: Best Policy
Practices, Paris, Chapter 3. 53 OECD (1997), Treatment of European Commission Funds in R&D
Surveys: Summary of National Practices, DSTI/EAS/STP/NESTI/RD (97) 3; OECD (1998), Measuring the Internationalization of Government Funding of R&D, DSTI/EAS/STP/NESTI (98) 3.

228 The Making of Science, Technology…, 2009
discrepancies led the OECD to construct new estimates and suggest standards54, and circulate a Sources and Methods paper documenting national statistics on public funding of R&D55
WHAT DID THE NUMBERS SAY?
.
To date, the OECD has made very few uses of its new statistics on globalization. First, very few countries provide data on NBERD (national business expenditures on R&D). Second, the database on the Activities of Foreign Affiliates in OECD Member Countries is limited by “the availability of data, which suffers from small samples, short time series and a lack of information on a broader range of countries and industrial sectors”56
Table 12. OECD Publications on Globalization
. Nevertheless, two kinds of output on science and technology came from a decade of efforts: analytical studies and indicators (Table 12).
Trade, Investment and Technology in the 1990s, 1991. International Direct Investment, 1992. Globalization of Industrial Activities: Four Case Studies, 1992. International Direct Investment: Policies and Trends, 1993. The Performance of Foreign Affiliates in OECD Countries, 1994. Globalization of Industry: Overview and Sector Reports, 1996. Globalization and SMEs, 1997. Towards a New Global Age: Challenges and Opportunities, 1997. Activities of Foreign Affiliates in OECD Countries, 1997. Internationalization of Industrial R&D: Patterns and Trends, 1998.
54 OECD (1998), Measuring the Internationalization of Government
Funding of R&D, op. cit. 55 OECD (1998), Measuring the Internationalization of Government
Funding: Sources and Methods, DSTI/EAS/STP/NESTI/RD (98) 2. 56 OECD (1997), Globalization of Industrial Research: Background Paper,
DSTI/STP/TIP (97) 6, p. 6.
The Making of Science, Technology…, 2009 229
Measuring Globalization: the Role of Multinationals in OECD Economies, 2001. Manual on Economic Globalization, 2003. OECD Economic Globalization Indicators, 2005.
There have always been analyses of globalization in the Science, Technology and Industry Outlook series (started in 1992), but these were very brief and used non-standardized data57. The first standardized empirical analysis appeared in a short chapter titled The Role of Technology in The Performance of Foreign Affiliates in OECD Countries published in 1994. In the view of the OECD, setting up laboratories outside the country of origin and the extension of co-operation agreements and alliances (technoglobalism) were the decisive elements among the technological changes that took place in the 1980s58. The publication reported that the proportion of R&D carried out by foreign affiliates tended to increase steadily, but was generally smaller than that of their turnover or production59. The R&D intensity of foreign affiliates was generally low, except in the United States, which was twice as great as the national average in pharmaceuticals, three times as great in chemicals and four times as great in mechanical engineering60
The study was followed two years later by a second one. However, Globalization of Industry (1996) was not devoted to R&D, but
.
57 OECD (1992), Science and Technology Policy: Review and Outlook,
Paris, p. 36-38, 87-100; OECD (1996), Science, Technology and Industry Outlook, Paris, p. 61-71; OECD (2000), Science, Technology and Industry Outlook, Paris, p. 41-49; OECD (2002), Science, Technology and Industry Outlook, Paris, p. 45-50, 81-85, 203-225.
58 OECD (1994), The Performance of Foreign Affiliates in OECD Countries , Paris, p. 61.
59 Ibid., p. 63. 60 Ibid., p. 65.

230 The Making of Science, Technology…, 2009
science and technology figured regularly in the analysis. The study started by defining globalization as follows61
Globalization of industry refers to the trans-border operations of firms undertaken to organize their development, production, sourcing, marketing and financing activities (…). Historically, international expansion was mainly through trade, followed in the 1980s by a major increase in international direct investment and inter-firm collaboration. What has changed recently is that firms have used new combinations of international investment, trade and international collaboration to expand internationally and achieve greater efficiencies. International strategies of the past, based on exports, and multi-domestic strategies based on sales in separate foreign markets, are giving way to new strategies based on a mixture of cross-border operations – foreign investment, exports and sourcing, and international alliances (…). At the macroeconomic level, the term globalization refers to the emergence of new patterns in the international transfer of products and knowledge by three main routes: international trade, international direct investment, and international collaboration agreements.
:
The study then looked at a series of indicators that revealed the following trends:
- International trade now represented 20% of GDP. The greatest growth was observed in Europe and Asia, and in transportation equipment and materials. OECD member countries were shown to concentrate their efforts in high technology sectors. Trade in intermediary goods was also on
61 OECD (1996), Globalization of Industry, Paris: OECD, p. 19-20.

The Making of Science, Technology…, 2009 231
the increase, mainly for products with high R&D efficiency ratios.
- Intra-firm exchanges (data for the United States and Japan only): a third of exchanges were between firms of the same group, and in sectors of high R&D intensity.
- Direct investment: foreign direct investment increased more rapidly than GDP or trade between 1970 and 1990. The destination was initially the United States, but Europe had now become the preferred location. Flows of Direct Investments (FDI) concerned primarily manufacturing (30-45%), and were often achieved through mergers and acquisitions.
- Foreign Affiliates: foreign affiliates were responsible for a growing share of production in many industrial sectors, and had better economic performance than national firms: production, value-added employment, productivity and salaries. However, their R&D intensity was lower than national firms, except in small countries like Canada (where it was almost equal) or the United States (where it was higher).
- Inter-firm agreements: Collaborative agreements had increased by 10% annually since the 1980s. These occurred mainly in high-technology sectors, and concerned mainly big firms (except for pharmaceuticals and biotechnology).
- Small and Medium-sized Enterprises (SMEs) had not yet globalized. Only about 25% had, versus 50-66% for larger firms. When SMEs did globalize, they did so mainly through trade.
The first real study entirely devoted to the internationalization of R&D was published in 1998. The Directorate for Science, Technology and Industry estimated that R&D handled by foreign affiliates accounted globally for about 11 per cent of industrial R&D

232 The Making of Science, Technology…, 2009
in the mid 1990s62. This varies, however, by country, from 5% in Japan to 60% in Ireland. It also varies by industrial sector: those most likely to globalize were high-technology industries63
Despite these results, the study admitted that it underestimated the level of internationalization, because a large number of countries have data on the R&D activities of foreign affiliates in their own countries, but not on their domestic companies’ affiliates:
.
In view of the fact that, until now, most firms’ laboratories have been located in OECD Member countries, the available data should give some indications of the level of internationalization of R&D functions. Over the last few years, however, more and more firms have been setting up R&D centers outside the OECD Member countries. This means that the information available underestimates the real level of R&D internationalization. In addition, the available data for all but a few of the largest countries only cover a relatively short period, and cannot really reflect the magnitude of these changes.
Nonetheless, the year 2001 saw the introduction of two innovations in science, technology and innovation indicators with regard to globalization. First, regular indicators on globalization started to be included in Main Science and Technology Indicators. To the data on GERD financed from abroad (published since the 1990 edition), tables were added on the R&D expenditures of foreign affiliates. Second, the 2001 edition of the Scoreboard of Science, Technology and Industry Indicators included a whole section of indicators on globalization, some of which were concerned with science and technology (Table 13).
62 OECD (1998), Internationalization of Industrial R&D: Patterns and
Trends, Paris, 1998. See also: OECD (1998), Globalization of Industrial R&D: Policy Implications, DSTI/STP/TIP (98) 4.
63 OECD (1997), Globalization of Industrial Research: Background Paper, op. cit.

The Making of Science, Technology…, 2009 233
More recently, the OECD started publishing a new series titled OECD Economic Globalization Indicators. But the work on globalization has yet to really bear fruit with regard to science and technology. This can be explained by two factors. First, the work on globalization illustrates the lag between a concept and policy demands on one hand, and the response of statisticians on the other. It takes at least ten years, or more, to develop appropriate and reliable statistics and indicators. Second, the concept (globalization) competes with others when it comes to developing and organizing statistics into conceptual frameworks for policy purposes: national systems of innovation, the knowledge-based economy and the new economy. The latter two, as we will now see, came to dominate the OECD work in the mid 1990s.
Table 13. Globalization Indicators (OECD Science, Technology
and Industry Scoreboard 2001)
Global Integration of Economic Activity International trade Exposure to international trade competition by industry Foreign direct investment flows Cross-border mergers and acquisitions Activity of foreign affiliates in manufacturing Activity of foreign affiliates in services Internationalization of industrial R&D International strategic alliances between firms Cross-border ownership of inventions International cooperation in science and technology Technology balance of payments Economic Structure and Productivity International trade by technology intensity International trade in high-technology and medium high-technology industries

234 The Making of Science, Technology…, 2009
CONCLUSION
In the 1980s, economists and statisticians began measuring an increase in international trade among OECD member countries. Trade was only one facet of internationalization, however. In fact, several authors admitted that internationalization was badly measured. The OECD gave itself the task of developing standardized methodological rules for three aspects of measuring internationalization: trade, flows of direct investments and technology. With regard to technology, three sets of indicators were suggested: R&D, technological balance of payments and high technology.
Globalization is a term or label assigned to the growth of internationalization and to its new forms. It is above all a rhetorical concept. Many authors admit that nothing really new defines globalization. The OECD itself seems to agree. After characterizing the global economy using elements different from the previous period, where international trade was the driving force, the OECD continues: “trade is still the most substantial form of integration into the global economy”64
What, then, is the function of such labels? They help to place an issue on the policy agenda and to capture political attention – and consequently give statisticians further topics to work on. The whole process works as follows. In general, work proposals come either from the OECD Secretariat (and/or committees) or from the ministers (often under the influence of a specific country). Studies are then conducted by the Secretariat, with a view to presenting to a ministerial conference. The conference, in turn, generally with the
. In fact, as we will see below, the same rhetoric defines other popular concepts at the OECD, like the knowledge-based economy. One characteristic of the discourses on the knowledge-based economy was that the phenomenon was not new, but simply more present.
64 OECD (2001), Manual on Economic Globalization Indicators, op. cit.
p. 17.

The Making of Science, Technology…, 2009 235
advice of the OECD officials themselves, asks for more work. This is how projects extend and build on previous ones. In 1998, for example, the meeting of the Industry Committee at the ministerial level was presented with work done to date, and recommended that the OECD advance the analysis of globalization, determine its implications for firm and sector performance, and determine how governments can pursue policies whereby the benefits of globalization are fully realized. This was a necessary step for consolidating the work on globalization and continuing its development.
Nevertheless, one should not be too cynical. The concept of globalization has allowed the OECD to develop new indicators, and to initiate studies on new dimensions of science and technology. R&D performed by foreign affiliates was one example, as was its work in progress on patent families, and on the migration of highly-qualified personnel.


The Making of Science, Technology…, 2009 237
PART II
CHAPTER SEVEN
NATIONAL INNOVATION SYSTEM: THE SYSTEM APPROACH IN HISTORICAL
PERSPECTIVE
In the late 1980s, a new kind of conceptual framework appeared in the science, technology and innovation studies: the National Innovation System. The National Innovation System framework suggests that the research system’s ultimate goal is innovation, and that the system is part of a larger system composed of sectors like government, university and industry and their environments. The framework also emphasized the relationships between the components or sectors as the “cause” explaining the performance of innovation systems.
Where does the idea of the National Innovation System come from? Most authors agree that it came from researchers like C. Freeman, R. Nelson and B.-A. Lundvall1
1 C. Freeman (1987), Technology Policy and Economic Performance,
London: Pinter; G. Dosi et al. (1988), Technical Change and Economic Theory, Part V: National Innovation Systems, London: Pinter; B.-A., Lundvall (ed.) (1992), National Systems of Innovation: Towards a Theory of Innovation and Interactive Learning, London: Pinter; R. R. Nelson (ed.) (1993), National Innovation Systems: A Comparative Analysis, Oxford: Oxford University Press. See also: C. Edquist (ed.) (1997), Systems of Innovation: Technologies, Institutions and Organizations,
. In this chapter, I go back further back in

238 The Making of Science, Technology…, 2009
time and show what the “system approach” owes to the OECD and its very early works from the 1960s. This chapter is not a study of the concept of the National Innovation System itself, and neither is it a critical analysis of its main rationale. R. Miettinen has conducted a very enlightened analysis that serves this purpose2
The first part of the chapter presents the emergence of the National Innovation System framework in the OECD literature of the 1990s
. Rather, I develop the idea that a system approach was fundamental to OECD work and that, although it did not use the term National Innovation System as such, the organization considerably influenced the above authors (as much as they influenced the organization).
3
London: Pinter; B. Amable, R. Barré and R. Boyer (1997), Les systèmes d’innovation à l’ère de la globalisation, Paris: Economica.
, and its relationship to one of its competitors, the Knowledge-Based Economy framework. Two of the National Innovation System’s limitations, as discussed in the OECD literature, are presented: lack of substance and statistics. The first criticism is a severe one, and should be addressed, if true, with regard to the entire system approach. The second criticism is real, at least as opposed to the early system approach. The second part of the chapter goes back in history to trace the emergence of a system approach at OECD from the early 1960s onward. Three major documents in this regard are Gaps in Technology (1968-70), the Salomon report titled The Research System, which was published in three volumes between 1972 and 1974, and Technical Change and Economic Policy (1980). The third part looks at how a system approach entered into early statistics on science, via the Frascati manual.
2 R. Miettinen (2002), National Innovation System: Scientific Concept or Political Rhetoric, Helsinki: Edita. See also N. Sharif (2006), Emergence and Development of the National Innovation System Concept, Research Policy, 35 (5), p. 745-766.
3 On the system approach and its use at the European policy level, see the following publication, as well as the subsequent strategies of the European Commission: L. Soete and A. Arundel (eds.) (1993), An Integrated Approach to European Innovation and Technology Diffusion Policy, EIMS Series, Publication no. 15090, European Commission.

The Making of Science, Technology…, 2009 239
NATIONAL INNOVATION SYSTEM AT OECD
For several decades, (neo-classical) economists have been criticized for their failure to integrate institutions into their theories and econometric models4. Partly as a response to this situation, scholars in the field of science, technology and innovation studies invented the concept of a National Innovation System. However, the concept also owes a large debt to the old debate (1960s) on technological gaps and competitiveness, as illustrated in the paper by Freeman (1987) with its analysis of the Japanese system5. Since World War II, Europeans have always been fascinated with the disparities in technological and economic performance between Europe on one hand and the United States and Japan on the other6
According to R. R. Nelson, a National Innovation System “is a set of institutions whose interactions determine the innovative performance of national firms”
. The National Innovation System, with its emphasis on the ways institutions behave and relate to each other, offered a new rationale to explain these gaps.
7. To B.-A. Lundvall, it “is constituted by elements and relationships which interact in the production, diffusion and use of new, and economically useful, knowledge”8
4 R. R. Nelson (1981), Research on Productivity Growth and Productivity
Differences: Dead Ends and New Departures, Journal of Economic Literature, 19, p. 1029-1064; R. R. Nelson and S. G. Winter (1977), In Search of a Useful Theory of Innovation, Research Policy, 6, p. 36-76.
. These elements or institutions are firms, public laboratories and universities, but also financial institutions, the educational system, government regulatory bodies and others that interact together.
5 C. Freeman (1987), Technology Policy and Economic Performance, op. cit.
6 B. Godin (2002), Technological Gaps: An Important Episode in the Construction of Science and Technology Statistics, op. cit.
7 R. R. Nelson (ed.) (1993), National Innovation Systems: A Comparative Analysis, op. cit. p. 4.
8 B.-A. Lundvall (1992), Introduction, in B.-A., Lundvall (ed.), National Systems of Innovation: Towards a Theory of Innovation and Interactive Learning, op. cit. p. 2.

240 The Making of Science, Technology…, 2009
There are two families of authors in the National Innovation System literature: those centering on the analysis of institutions (including institutional rules) and describing the ways countries have organized their National Innovation Systems9, and those who are more conceptual, focusing on knowledge and the process of learning itself: learning-by-doing, learning-by-using, etc.10
It was to Lundvall – nominated deputy director of the OECD Directorate for Science, Technology and Industry (DSTI) in 1992 (until 1995) – that the OECD Secretariat entrusted its program on National Innovation Systems. In fact, the OECD always looked for conceptual frameworks to catch the attention of policy-makers. In the early 1990s, it was the National Innovation System that was supposed to do the job: getting a better understanding of the significant differences between countries in terms of their capacity to innovate, and looking at how globalization and new trends in science and technology affect national systems
. From the latter group, the concept of the knowledge economy, first suggested in the early 1960s, re-emerged in the 1990s.
11. However, the program did not have the expected impact on policies. In a recent review paper, the OECD admitted: “there are still concerns in the policy making community that the National System of Innovation approach has too little operational value and is difficult to implement”12
Too little operational value, but also a lack of substance, according to some authors. To D. Foray (France), the individual behind the resurgence of the concept of the knowledge-based economy
.
13
9 R. R. Nelson (ed.) (1993), National Innovation Systems, op. cit.
, the
10 B.-A. Lundvall (ed.) (1992), National Systems of Innovation, op. cit. 11 OECD (1992), National Systems of Innovation: Definitions, Conceptual
Foundations and Initial Steps in a Comparative Analysis, DSTI/STP(92)15; OECD (1994), National Innovation Systems: Work Plan for Pilot Case Studies, DSTI/STP/TIP(94)16; OECD (1996), National Innovation Systems: Proposals for Phase II, DSTI/STP/TIP(96)11.
12 OECD (2002), Dynamising National Innovation Systems, Paris, p. 11. 13 D. Foray (2000), L’économie de la connaissance, Paris: La Découverte.

The Making of Science, Technology…, 2009 241
OECD work on the concept of National Innovation Systems is “neither strikingly original, nor rhetorically stirring”14, and places too much emphasis on national institutions and economic growth, and not enough on the distribution of knowledge itself. However, Foray (and P. David) concluded similarly to Lundvall on a number of points, among them: “an efficient system of distribution and access to knowledge is a sine qua non condition for increasing the amount of innovative opportunities. Knowledge distribution is the crucial issue”15
Thus, it seems that a central characteristic of a National Innovation System is the way knowledge is distributed and used. As K. Smith, author of the OECD methodological manual on innovation, put it: “The overall innovation performance of an economy depends not so much on how specific formal institutions (firms, research institutes, universities, etc.) perform, but on how they interact with each other”
.
16. Indeed, according to others, “knowledge is abundant but the ability to use it is scarce”17
Another consensual view of authors on National Innovation Systems was that statisticians simply did not have the appropriate tools to measure the concept. To Smith, the “system approaches have been notable more for their conceptual innovations, and the novelty of their approaches, rather than for quantification of empirical description”
.
18
14 P. David and D. Foray (1995), Assessing and Expanding the Science and
Technology Knowledge Base, STI Review, 16, p. 14.
. “There are no straightforward routes to empirical system mapping: we have neither purpose-designed data sources, nor any obvious methodological approach. The challenge, therefore, is to
15 Ibid., p. 40. 16 K. Smith (1995), Interactions in Knowledge Systems: Foundations,
Policy Implications and Empirical Methods, STI Review, 16, p. 72. 17 B.-A. Lundvall and B. Johnson (1994), The Learning Economy, op. cit.
p. 31. 18 K. Smith (1995), Interactions in Knowledge Systems: Foundations,
Policy Implications and Empirical Methods, op. cit. p. 81.

242 The Making of Science, Technology…, 2009
use existing indicators and methods”19. To Lundvall, “the most relevant performance indicators of a National Innovation System should reflect the efficiency and effectiveness in producing, diffusing and exploiting economically useful knowledge. Such indicators are not well developed today”20. Similarly, David and Foray suggested: “A system of innovation cannot be assessed only by comparing some absolute input measures such as research and development (R&D) expenditures, with output indicators, such as patents or high-tech products. Instead innovation systems must be assessed by reference to some measures of the use of that knowledge”21. “The development of new quantitative and qualitative indicators (or the creative use of existing ones) is an urgent need in the formation of more effective science and technology policies”22
The OECD project on the National Innovation System flirted with the idea of knowledge distribution and use, having even temporarily redefined the initial objectives of the project around knowledge access and distribution, whereas the original aims concerned institutional factors explaining the efficiency of National Innovation Systems
.
23. The National Innovation System project also flirted with indicators on knowledge distribution, but rapidly concluded, “it has proved difficult to produce general indicators of the knowledge distribution power of a national innovation system”24
19 Ibid., p. 70.
.
20 B.-A. Lundvall (1992), Introduction, op. cit. p. 6. 21 P. David and D. Foray (1995), Assessing and Expanding the Science and
Technology Knowledge Base, op. cit. p. 81. 22 Ibid., p. 82. 23 Compare OECD (1993), Work on National Innovation Systems: Road
Map, op. cit. with OECD (1994), National Innovation Systems: Work Plan for Pilot Case Studies, op. cit.
24 OECD (1996), National Innovation Systems: Proposals for Phase II, DSTI/STP/TIP(96)11, p. 3.

The Making of Science, Technology…, 2009 243
From the start, the OECD project identified the construction of indicators for measuring National Innovation Systems as a priority25, and indeed early on suggested a list of indicators to this end (see Appendix 4)26. But the decision to build on existing work because of budgetary constraints27 considerably limited the empirical novelty of the studies. Nevertheless, the project, conducted in two phases between 1994 and 2001, produced several reports that looked at flows and forms of transactions among institutions, among them: networks, clusters and mobility of personnel (Table 14)28
Table 14. OECD Publications on National Innovation Systems
.
1995 National Systems for Financing Innovation. 1997 National Innovation Systems. 1999 Managing National Innovation Systems. 1999 Boosting Innovation: The Cluster Approach. 2001 Innovative Networks: Co-Operation in
National Innovation Systems. 2001 Innovative Clusters: Drivers of National
Innovation Systems. 2001 Innovative People: Mobility of Skilled
25 OECD (1993), Work on National Innovation Systems: Road Map,
DSTI/STP(93)8. 26 OECD (1997), National Innovation Systems, Paris, p. 45. 27 OECD (1992), National Systems of Innovation: Definitions, Conceptual
Foundations and Initial Steps in a Comparative Analysis, op. cit. p. 10. 28 OECD (1995), National Systems for Financing Innovation, Paris; OECD
(1997), National Innovation Systems, op. cit.; OECD (1999), Managing National Innovation Systems, Paris; OECD (1999), Boosting Innovation: The Cluster Approach, Paris; OECD (2001), Innovative Networks: Co-Operation in National Innovation Systems, Paris; OECD (2001), Innovative Clusters: Drivers of National Innovation Systems, Paris; OECD (2001), Innovative People: Mobility of Skilled Personnel in National Innovation Systems, Paris; OECD (2002), Dynamising National Innovation Systems, op. cit; OECD (2005), Governance of Innovation Systems, 3 volumes, Paris.

244 The Making of Science, Technology…, 2009
Personnel in National Innovation Systems. 2002 Dynamising National Innovation Systems. 2005 Governance of Innovation Systems.
THE SYSTEM APPROACH
The OECD has been very influential on the development of science policy among member countries29. The interest of the organization in these matters goes back to the OEEC30
Between the highly developed, science-based industries of the United States and the explosive development of Russian technology, Europe sits uneasily. (…) True, Europe has the great advantage of the tradition and maturity of its scientific institutions, and particularly those for fundamental research. (…) But this is not enough. (…) Europe has, as a region, been slow to exploit in production the discoveries of its laboratories
, the predecessor to the OECD. In 1958, the Council of Europe asked a working party (WP26) to examine the activities of the European Productivity Agency, where the main activities for science were conducted. To the Council, there was a “scientific research crisis in Europe”:
31. It is no longer possible for each of its constituent countries to undertake the amount of research necessary for its security and prosperity32
29 J. J. Salomon (2000), L’OCDE et les politiques scientifiques, Revue pour
l’histoire du CNRS, 3, 40-58.
. [But] most of our governments have evolved little in the way of a coherent national science policy, while the concept of scientific research and development as an
30 Organization for European Economic Co-operation. 31 OEEC (1959), A Programme for European Co-operation in Science and
Technology, C/WP26/W/4, p. 2. 32 Ibid., p. 2-3.

The Making of Science, Technology…, 2009 245
important and integral feature of company investment is foreign to the thought of most of European industry33
Following the working party report, Dina Wilgress was asked by the Secretary-General to visit member countries to discover their approaches to science and technology. He reported, “It is in Western Europe that most of the great scientific discoveries have taken place (…) but in the race for scientific advance, the countries on the Continent of Europe stood comparatively still for more than two decades while the Soviet Union and North America forged ahead”
.
34
It was in this context that the newly created OECD (1961), via a Directorate for Scientific Affairs, turned to the promotion of national science policies. From its creation in 1961 to the emergence of the literature on National Innovation Systems, the OECD produced several policy papers, and most of them carried a system approach (Table 15). This approach consisted of emphasizing the institutional and contextual aspects of research. To the OECD, research was a system composed of four sectors, or components, and embedded within a larger environment:
. The sources of the problem were many: the educational system was “better fitted for turning out people trained in the liberal arts than in science and technology”; there were prejudices against those who work with their hands, and few applications of the results of science; there were also a lack of resources for science, too great an emphasis on short-run profits and not enough on investment for the future, small-sized firms that were not so science-minded, and inadequacy of university facilities and technical training. Briefly stated, the components of the research system were not adapted to the then-new situation, nor well related to each other, nor oriented towards a common goal.
33 Ibid., p. 3. 34 OECD (1959), Co-operation in Scientific and Technical Research, C (59)
165, p. 14. Officially published in 1960.

246 The Making of Science, Technology…, 2009
- Sectors: government, university, industry and non-profit.
- Economic environment.
- International environment.
The view that the research system is composed of four main sectors goes back to the very first analyses on science, as conducted by J. D. Bernal in the United Kingdom (1939)35 and V. Bush and others in the United States in the 1940s36
According to the OECD, science policy is concerned with the issues and problems of each of these sectors, and with the relationships between the sectors. As the Piganiol committee (1963), set up by the Secretary-General to define the agenda of the organization in science policy matters, stated: “Science is not an autonomous activity but contributes to national safety, physical health, adequate nutrition, economic growth, improved living standards, and more leisure for the populations of the world”
. Organizations and organized research (laboratories) were seen as the main drivers of growth, and were analytically classified into economic sectors. The same sectors, except for the university sector, were also used in the main classification of the System of National Accounts. The classification was soon conventionalized into statistics on R&D – as discussed below.
37
35 J. D. Bernal (1939), The Social Function of Science, Cambridge (Mass.):
MIT Press, 1973.
. “The scientist (…) has the opportunity to cooperate with the educator, the economist, and the political leader in deciding how science as a social asset can be furthered, and how a
36 V. Bush (1945), Science: The Endless Frontier, North Stratford: Ayer Co., 1995, p. 85-89 President’s Scientific Research Board (1947), Science and Public Policy, President’s Scientific Research Board, Washington: USGPO.
37 OECD (1963), Science and the Policies of Government, Paris, p. 14.

The Making of Science, Technology…, 2009 247
nation and the human community can best benefit from its fruits. Science, in a word, has become a public concern”38
Table 15. OECD Major Publications On science and Technology
.
Before the National Innovation System Ser ies (1960-1992) 1960 Co-Operation in Scientific and Technical
Research (Wilgress report). 1963 Science and the Policies of Governments
(Piganiol report). 1963 Science, Economic Growth and Government
Policy (C. Freeman, R. Poignant, I. Svennilson).
1966 Fundamental Research and the Policies of Governments.
1966 Government and the Allocation of Resources to Science.
1966 Government and Technical Innovation. 1966 The Social Sciences and the Politics of
Governments. 1968 Fundamental Research and Universities (B.
David). 1968-70 Gaps in Technology.
1971 The Conditions for Success in Technological Innovation (K. Pavitt).
1972 Science, Growth and Society (Brooks report).
1972-74 The Research System (Salomon report). 1980 Technical Change and Economic Policy
(Delapalme report). 1981 Science and Technology Policy for the
1980s. 1988 New Technologies in the 1990s: a Socio-
economic Strategy (Sundqvist report). 1991 Choosing Priorities in Science and
38 Ibid., p. 15.

248 The Making of Science, Technology…, 2009
Technology. 1991 Technology in a Changing World. 1992 Technology and the Economy: the Key
Relationships.

The Making of Science, Technology…, 2009 249
Over the period 1960-1992, the OECD study that most explicitly carried a system approach was The Research System, published in three volumes between 1972 and 1974 under the direction of Jean-Jacques Salomon. The study looked at the research system in ten countries, large and small: organization, financing, application of science (or innovation), government research, university-industry relations, international dimensions, foundations39. Because research is not an autonomous system, so said the authors, the document “put emphasis on the institutional context in which research is conducted. One of the most delicate problem of science policy is how to influence the process by which scientific discoveries are transformed into useful applications and how to contribute, in some way or another, towards bringing the supply of science into closer harmony with the demand of society40. “The whole problem of university research consists in the break-up of its institutional framework (…)”41
The study framed the central issue of the system approach in terms of science policy, and contrasted two periods as defined in the OECD report known as the Piganiol report
.
42: the policy for science period, as the expansion of research per se, versus the science for policy period, where “developing national research potential [is] generally regarded as synonymous with national innovation potential”43
39 Volume 1: France, Germany, United Kingdom; Volume 2: Belgium,
Netherlands, Norway, Sweden, Switzerland; Volume 3: Canada, United States.
. In the words of the Salomon report:
40 OECD (1972), The Research System, Volume 1, Paris, p. 16. 41 Ibid., p. 17-18. 42 OECD (1963), Science and the Policies of Government, Paris: OECD,
p. 18, See also the OECD Brooks report OECD (1972), Science, Growth and Society, Paris: OECD, p. 37. A. Elzinga and A. Jamison (1995), Changing Policy Agenda in Science and Technology, in S. Jasanoff et al. (eds.), Handbook of Science and Technology Studies, Thousand Oaks (Calif.): Sage, p. 572-597.
43 OECD (1974), The Research System, Volume 3, Paris, p. 168.

250 The Making of Science, Technology…, 2009
The needs of fundamental research depend primarily on the talent available and the fields opened up by the unsolved (or unformulated) problems of science itself. The needs of applied research and development, on the other hand, depend primarily on the problems which the industrial system sets itself. There is no hermetic seal between the first type of problem and the second, the terms of each being renewed or changed by the progress made by the other on the basis of a certain degree of osmosis between the university and industry and that is precisely why it is better to speak of a “research system” rather than a juxtaposition or hierarchy of different forms of research44
In the words of the report, again, “fundamental research will be required to respond more closely to the imperatives of selectivity dictated by the social, political and industrial context”
.
45. “The new links which are now taking shape between science and society will no doubt be reflected in the long term in new patterns of organization”46
As a major conclusion from the study, The Research System suggested: “Scientific and technological research, viewed from an institutional approach, cannot be separated from its political, economic, social and cultural context”
.
47. “There is no single model, and each country must seek its own solutions”48
Another influential report with regard to systemic conclusions at the OECD was Gaps in Technology, published in 1968-1970. In the 1960s, there were concerns in Europe that the continent was lagging
.
44 OECD (1972), The Research System, Volume 1, op. cit. p. 20. 45 Ibid., p. 21. 46 Ibid., p.22. 47 OECD (1974), The Research System, Volume 3, op. cit. p. 197. 48 Ibid., p. 199.

The Making of Science, Technology…, 2009 251
behind the United States in term of technological potential49. As the analysis of the first international survey on R&D concluded: “There is a great difference between the amount of resources devoted to R&D in the United States and in other individual member countries. None of the latter spend more than one-tenth of the United States’ expenditure on R&D (…) nor does any one of them employ more than one-third of the equivalent United States number of qualified scientists and technicians”50
The OECD conducted a two-year study, collecting many statistics on the scientific and technological activities of European countries and of the United States. In the end, none of the statistics appeared conclusive in explaining economic performance. The OECD suggested that the causes of the gaps were not R&D per se: “scientific and technological capacity is clearly a prerequisite but it is not a sufficient basis for success”
.
51
The conclusions of this OECD study were reinforced by a second study contracted to Joseph Ben-David
. The organization rather identified other factors in the “innovation system” as causes: capital availability, management, competence, attitudes, entrepreneurship, marketing skills, labour relations, education and culture.
52
49 B. Godin (2002), Technological Gaps: An Important Episode in the
Construction of S&T Statistics, op. cit.
. Using several indicators, Ben-David documented a gap in the development of (applied and) fundamental research between Europe and the United States, and suggested that the origins of the gap went back to the beginning of the twentieth century: to the failure in Europe to develop adequate research organizations and effective entrepreneurship in the
50 OECD (1967), The Overall Level and Structure of R&D Efforts in OECD Member Countries, Paris, p. 19.
51 OECD (1968), Gaps in Technology: General Report, Paris; OECD (1970), Gaps in Technology: Comparisons Between Countries in Education, R&D, Technological Innovation, International Economic Exchanges, Paris, p. 23.
52 OECD (1968), Fundamental Research and the Universities: Some Comments on International Differences, Paris.

252 The Making of Science, Technology…, 2009
exploitation of science for practical purposes. Briefly stated, European universities were not oriented enough toward economic and social needs: academics still considered science essentially as a cultural good. To change the situation would, according to Ben-David, require long-term policies involving structural changes.
Now, what were the relationships essential to an effective research system? According to the OECD, there were five types of relationships. The first is between economic sectors, above all: government, university and industry. Here, a recurrent focus or target of policy proposals was the industrial sector as a source of innovation and economic growth. The early literature was concerned with putting industrial research activities at the center of policies and arguing for devoting government funding extramurally, namely to firms, and for orienting fundamental research. Then, the organization put the emphasis on university-industry relationships for cross-fertilization of research. This was the 1980s. Finally, the organization urged universities to enter the marketplace and commercialize their inventions. From this emphasis on the industrial sector and the contribution of other sectors to innovation and economic growth, we can see that the research system at OECD was really an innovation system.
The second type of relationship in the “innovation system” was between basic and applied research, and here many OECD documents rejected the idea of innovation as a linear process starting with basic research and ending with commercialization. As the background document to the first ministerial conference on science (1963) stated: there is no natural boundary between basic and applied research. “The real problem is that of linking these two types of research activity”53
53 OCDE (1963), Science, Economic Growth, and Government Policy,
Paris, p. 63.
. Similarly, in the words of The Research System, it is “progressively more difficult to trace the line of demarcation between what is deemed to be fundamental and what is oriented or

The Making of Science, Technology…, 2009 253
applied”54. Science and technology are intimately linked together. This was, in fact, the main reason the report gave for adopting a system approach55: “the special characteristic of modern scientific research is that it is developing in institutions which are no longer confined to the university environment”56. “Scientific research is a continuous process (...) whose different element are so many links in a continuous and retro-active feed system”57
The third type of relationship in the “innovation system” regards policy itself. According to the OECD, policy was too fragmented and uncoordinated. As the Piganiol report stated in 1963: “There is a great need for studies of the several fields and ways in which science and policy interact, and there is a need above all for a continuing and intimate working relationship between officials responsible for science policy and other policy makers”
.
58. To the OECD, “national policies in other fields must take account of the achievements and expectations of science and technology”: economic policy, social policy, military policy, foreign policy and aid policy59. To this end, the Piganiol report recommended the creation in each country of a national science office which would take on the tasks of formulating a national policy, co-coordinating the various scientific activities, and integrating science policy with general policy60
“A more comprehensive approach”, namely “science policy as an integral factor in overall public policy”
.
61
54 OECD (1972), The Research System, Volume 1, op. cit. p. 11.
, was also the message of the Brooks report (1972), centered around social issues in science. To the OECD committee of experts, “purely economic solutions are
55 This was also the rationale already offered by Jean-Jacques Salomon (1970) in Science et politique, Paris: Seuil.
56 OECD (1972), The Research System, Volume 1, op. cit., p. 12. 57 Ibid., p. 12-13. 58 OECD (1963), Science and the Policies of Government, op. cit. p. 26-27. 59 Ibid., p. 26. 60 Ibid., p. 34. 61 OECD (1972), Science, Growth and Society, Paris, p. 12.

254 The Making of Science, Technology…, 2009
insufficient”62. “Science policy must be much more broadly conceived than in the past (…)”63
First, the different elements of science policies were usually treated independently of each other; second, science policies themselves were often treated in relative isolation from other policy decisions
:
64. [Now], science and technology are an integral part of social and economic development, and we believe that this implies a much closer relationship between policies for science and technology and all socio-economic concerns and governmental responsibilities than has existed in the past65
Again in 1980, in Technical Change and Economic Policy, concerned with the economic situation at the time in OECD countries, the Delapalme committee recommended a “better integration of the scientific and technical aspects of public policy, and the social and economic aspects”
.
66, and “much closer links regarding such government functions as providing for national defence, agricultural productivity, health, energy supply, and protecting the environment and human safety”67. To the OECD, “the organizations that propose and carry out science and technology policies tend to stand separate from offices at a comparable level concerned with the more legal and economic aspects of policy”68
The fourth type of relationship in the “innovation system” stressed by the OECD concerns the economic environment. From its very
.
62 Ibid., p. 30. 63 Ibid., p. 36. 64 Ibid., p. 47. 65 Ibid., p. 96. 66 OECD (1980), Technical Change and Economic Policy, Paris, p. 96. 67 Ibid. 68 Ibid.

The Making of Science, Technology…, 2009 255
beginning, science policy at the OECD was definitely oriented toward innovation and economic progress69. This was the message of the Piganiol report70 and of the background document to the first ministerial meeting on science. In the words of the latter, “the relationship between a national policy for economic development and a national policy for scientific research and development is one of the essential subjects for study (…)”71. What was needed was a dialogue between those responsible for economic policy and those responsible for science policy72
From 1980 on, the economic environment therefore became the central concern to the OECD. Because “science and technology policies have usually been defined and implemented independently of economic policies”
.
73
If there is little justification for assuming limits to science and technology, there are limitations imposed by political, economic, social and moral factors which may retard, inhibit or paralyze both scientific discovery and technical innovation
, Technical Change and Economic Policy recommended that science and technology policies be better integrated with economic and social policies:
74. The most intractable problems lie not in the potential of science and technology as such, but rather in the capacity of our economic systems to make satisfactory use of this potential75
69 B. Godin (2005), Measurement and Statistics on Science and Technology:
1920 to the Present, London: Routledge.
.
70 “A growing opportunity for science and technology lies in the field of economic development” (p. 16).
71 OECD (1963), Science, Economic Growth and Government Policy, op. cit., p. 52.
72 Ibid., p. 69-73. 73 OECD (1980), Technical Change and Economic Policy, op. cit., p. 12. 74 Ibid., p. 93. 75 Ibid.

256 The Making of Science, Technology…, 2009
The last type of relationship in the “innovation system” was international cooperation. This was the object of the very first policy document produced by the OECD (or OEEC at the time). International cooperation was, in fact, the raison d’être of the organization: “While scientists have co-operated on a regular basis without regard to national boundaries, there are few co-operations between governments in science and technology”76. “Each European country has an interest in assuring that Western Europe as a whole does not fall behind in the race for scientific advance between North America on the one hand and Russia and China on the other”77. “The OEEC is the only international organization that is in the position to develop co-operation between the countries of Europe (...)”78
In summary, the OECD documents produced since the early 1960s were concerned with developing a system approach to science policy. The research system was composed of several institutional sectors in relationship to each other and all oriented toward technological innovation. The industrial sector was embedded in an economic environment. The government sector was composed of different departments with policies that were related, but were badly coordinated. The university sector had to orient its research potential more toward applied or oriented research and develop relationships with industry. On top was the OECD as a forum where countries collaborated to create a new object: science policy.
.
MEASURING THE RESEARCH SYSTEM
Unlike the National Innovation System framework, the system approach has the advantage of benefiting from statistics from its very beginning. As early as 1962, the OECD published the Frascati
76 OECD (1960), Co-Operation in Scientific and Technical Research, Paris,
p. 12. 77 Ibid. 78 Ibid., p. 38.

The Making of Science, Technology…, 2009 257
manual, which offered national statisticians methodological rules for surveys on R&D expenditures and manpower79. One of the main concepts of the manual was GERD (Gross Expenditures on R&D), defined as the sum of the expenditures from the four main sectors of the economy: government, university, industry and non-profit80
The matrix is not directly the result of a system approach
. Each sector was measured, and the results aggregated to construct a national budget for research. But the statistics also served to analyze how each sector performed in terms of R&D activities, and to measure the relationships as flows of funds between the sectors of the system. To this end, a matrix was suggested crossing sectors as sources of funds and sectors as performers of research activities, and identifying the transfers of funds between them.
81, but it fit the approach perfectly well. As we saw in Chapter 2, the idea of a matrix comes from the US Department of Defense and its very first measurement of research funds in the United States in 195382, and the US National Science Foundation developed the idea further83
The National Science Foundation matrix became an international standard with the adoption of the OECD Frascati manual by member countries in 1963. The manual, written by C. Freeman after visiting
. The organization constructed a matrix of financial flows between the sectors, as both sources and performers of R&D (see Chapter 2, Table 1).
79 B. Godin (2007), The Making of Statistical Standards: OECD and the
Frascati Manual, 1962-2002, Accounting, Organization, and Society, forthcoming.
80 OECD (1962), Proposed Standard Practice for Surveys of Research and Development, Paris, p. 34-35.
81 Although economic input-output tables (or matrices), as originally developed by W. Leontief, and part of the System of National Accounts, are of a systemic nature and may have influenced the statistics on R&D.
82 Department of Defense (1953), The Growth of Scientific R&D, Office of the Secretary of Defense (R&D), RDB 114/34, Washington.
83 National Science Foundation (1956), Expenditures for R&D in the United States: 1953, Reviews of Data on R&D, 1, NSF 56-28, Washington.

258 The Making of Science, Technology…, 2009
countries where measurement was conducted, suggested collecting data on sectors for both intra-mural84 and extra-mural activities85, and breaking down R&D data according to funder and performer. The matrix was suggested as a useful way to determine the flows of funds between sectors86. From then on, the OECD produced regular studies analyzing the sectors and their performances87
In sum, the statistics on R&D served as the first tool to measure the “innovation system”, the interrelationships between its components and its links to the economy. Later, these statistics appeared limited for measuring the diversity and complexity of National Innovation Systems, and new ones were developed, among them the innovation survey. But few of the new statistics had the “rigour” of the R&D statistics for “objectifying” the framework
.
88
84 Intra-mural expenditures include all funds used for the performance of
R&D within a particular organization or sector of the economy, whatever the sources of finance.
. At the same time, the conceptual framework on National Innovation Systems itself came to be challenged by other frameworks.
85 Extra-mural expenditures include all funds spent for the performance of R&D outside a particular organization or sector of the economy, including abroad.
86 OECD (1962), Proposed Standard Practice for Surveys of Research and Development, op. cit. p. 35-36.
87 OECD (1967), The Overall Level and Structure of R&D Efforts in OECD Member Countries, op. cit.; OECD (1971), R&D in OECD Member Countries: Trends and Objectives, Paris; OECD (1975), Patterns of Resources Devoted to R&D in the OECD Area, 1963-1971, Paris; OECD (1975), Changing Priorities for Government R&D: An Experimental Study of Trends in the Objectives of Government R&D Funding in 12 OECD Member Countries, 1961-1972, Paris; OECD (1979), Trends in Industrial R&D in Selected OECD Countries, 1967-1975, Paris; OECD (1979), Trends in R&D in the Higher Education Sector in OECD Member Countries Since 1965 and Their Impact on National Basic Research Efforts, SPT (79) 20 (unpublished).
88 By strength I mean 1) a consensus among countries, and 2) a historical series of data.

The Making of Science, Technology…, 2009 259
CONCLUSION
Recently, B.-A. Lundvall unearthed an earlier paper from Chris Freeman as being the first written contribution on the concept of National Innovation Systems. The paper was produced for the OECD in 1982, but never published89. We have seen above that a system approach originated at the OECD thirty years before the literature on National Innovation Systems. Equally, in the 1960s, system dynamics, among social scientists90, and system analysis were both quite popular, the latter particularly in the United States at RAND91. Many researchers, particularly from management, began to use a system approach to study decisions and choices regarding science, technology and innovation92
89 C. Freeman (1982), Technological Infrastructure and International
Competitiveness. Published with a foreword by Lundvall in Industrial and Corporate Change, 13, 3, 2004, p. 541-569. The history of the concept, according to Lundvall, goes back to F. List (1841), then jumps hundred and fifty later to C. Freeman.
. This was also the approach of the
90 On system dynamics, see the works of J. W. Forrester in the late 1960s. For an influential application, see: D. L. Meadows et al. (1972), The Limits to Growth, New York: Universe Books.
91 See: A. C. Hughes and T. P. Hughes (2000), Systems, Experts, and Computers: the System Approach in Management and Engineering, World War II and After, Cambridge (Mass.): MIT Press. For a sample of RAND’s published analyses, see: C. Hitch (1955), An Appreciation of Systems Analysis, Journal of the Operations Research Society of America, November, p. 466-481; C. Hitch (1958), Economics and Military Operations Research, Review of Economics and Statistics, 40 (3), p. 199-209; B. Klein and W. Meckling (1958), Application of Operations Research to Development Decisions, Operations Research, 6 (3), p. 352-363; E. S. Ouade (1969), The Systems Approach and Public Policy, Santa Monica (California): RAND Corporation.
92 M. H. Halbert and R. L. Ackoff (1959), An Operations Research Study of the Dissemination of Scientific Information, in National Academy of Sciences/National Research Council, Proceedings of the International Conference on Scientific Information, Washington, Volume 1, p. 97-130; R. E. Gibson (1964), A Systems Approach to Research Management, in J. R. Bright (ed.), R&D and Technological Innovation, Homewood (Illinois): R. D. Irwin, p. 34-49; G. A. Lakhtin (1968), Operational Research Methods in the Management of Scientific Research, Minerva,

260 The Making of Science, Technology…, 2009
experts composing the OECD committees. Here, the system approach meant (or was transformed into) a holistic approach to science policy.
Certainly Freeman contributed to the early approach. First, he had been advocating system analysis since the early 1960s: “There is no reason why these methodologies [operational research, system analysis and technological forecasting], developed for military purposes but already used with success in such fields as communication and energy, could not be adapted to the needs of civilian industrial technology”93
Where Freeman was even more influential was relative to a second systemic tradition in science and technology studies: technological systems. In the 1970s and 1980s, a whole literature concerned itself with (inter-industry) technology flows
. Second, he wrote the first edition of the Frascati manual, co-produced the background document for the first OECD ministerial conference on science, and acted as expert on many OECD committees, reports from which appear in Table 2. Inversely, Freeman’s National Innovation System framework drew inspiration from, among others, three decades of OECD work and the contributions of OECD experts.
94
Summer, p. 524-540; R. L. Ackoff (1968), Operational Research and National Science Policy, in A. De Reuck, M. Goldsmith and J. Knight (eds.), Decision Making in National Science Policy, Boston: Little, Brown and Co., p. 84-91.
, technological regimes and
93 OECD (1963), Science, Economic Growth and Government Policy, C. Freeman, R. Poignant and I. Svennilson, op. cit. p. 73; see also C. Freeman (1971), Technology Assessment and its Social Context, Studium Generale, 24, p. 1038-1050.
94 C. de Bresson and J. Townsend (1978), Notes on the Inter-Industry Flow of Technology in Post-War Britain, Research Policy, 7, p. 48-60; N. Rosenberg (1979), Technological Interdependence in the American Economy, Technology and Culture, January, p. 25-50; F. M. Scherer (1982), Inter-Industry Technology Flows in the United States, Research Policy, 11, p. 227-245; K. Pavitt (1984), Sectoral Patterns of Technical Change: Towards a Taxonomy and a Theory, Research Policy, 13, p. 343-373; M. Robson, J. Townsend and K. Pavitt (1988), Sectoral Patterns of Production and Use of Innovations in the UK, 1945-1983, Research Policy, 17, p. 1-14;

The Making of Science, Technology…, 2009 261
natural trajectories95, technological guideposts96, technological paradigms97, and techno-economic networks98. This literature looked at technologies from a system-of-interrelated-components perspective99. Freeman added his voice to the literature with two concepts. First, he talked of “technology systems” as families of innovations clustering in a system with wide effects on industries and services100. Then, he coined the term “techno-economic paradigm” as a cluster of technological systems with pervasive effects that change the mode of production and management of an economy101
95 R. S. Nelson and S. D. Winter (1977), In Search of a Useful Theory of
Innovation, op. cit.
.
96 D. Sahal (1981), Patterns of Technological Innovation, Reading, Mass.: Addison-Wesley Publishing Company; D. Sahal (1985), Technological Guideposts and Innovation Avenues, Research Policy, 14, p. 61-82.
97 G. Dosi (1982), Technological Paradigms and Technological Trajectories, Research Policy, 11 (1982), p. 142-167.
98 M. Callon et al. (1992), The Management and Evaluation of Technological Programs and the Dynamics of Techno-Economic Networks: the Case of the AFME, Research Policy, 21, p. 215-236; G. Bell and M. Callon (1994), Techno-Economic Networks and Science and Technology Policy, STI Review, 14, p. 67-126.
99 The literature borrowed from economist J. Schumpeter’s study of long waves, W. Leontief’s input-output analyses, and historians. In fact, system was one of the most commonly discussed concepts among historians of technology who adopted a contextual approach. See, for example: T. P. Hughes (1983), Networks of Power: Electrification in Western Society, 1880-1930, Baltimore: Johns Hopkins University Press. For an early analysis of technological paradigms by a historian, see: E. W. Constant (1973), A Model for Technological Change Applied to the Turbojet Revolution, Technology and Culture, 14 (4), p. 553-572.
100 C. Freeman, J. Clark, and L. Soete (1982), New Technology Systems: an Alternative Approach to the Clustering of Innovations and the Growth of Industries, in Unemployment and Technical Innovation, Connecticut: Greenwood Press, p. 64-81.
101 C. Freeman (1987), Information Technology and Change in Techno-Economic Paradigm, in C. Freeman and L. Soete (eds.), Technical Change and Full Employment, Oxford: Basil Blackwell, p. 49-69; C. Freeman and C. Perez (1988), Structural Crises of Adjustment, Business Cycles and Investment Behaviour, in G. Dosi et al. (eds.), Technical Change and Economic Theory, London: Frances Pinter, p. 38-66. See

262 The Making of Science, Technology…, 2009
With these terms, Freeman developed a much-cited typology of innovation composed of four categories: incremental innovation, radical innovation, new technological system, techno-economic paradigm102. To Freeman, only the latter was equivalent to a revolution. And among the many generic technologies actually in existence, only electronics was of this type. This was precisely the rationale that the OECD needed to “sell” its new discourse on the information economy to policy-makers and the public103. Freeman’s analyses on electronics as revolution contributed to the then-popular discourses on the information economy, or information society, at the OECD104
What, then, did the framework on National Innovation System add to the early system approach? Certainly, the issues studied and the types of relationships are more diverse and complex in the framework than those portrayed in the early approach. Globalization of research activities, networks of collaborators, clusters and the role of users are only some of the new terms added to the system approach in the 1990s. More fundamentally, however, the differences between the two periods are twofold. First, in its early years, the systemic view dealt above all with policy issues. The government was believed at that time to have a prime responsibility in the performance of the system. The role of government was its capacity to make the system work. But the policies had to be adapted and coordinated. That was the main message of OECD reports. With the National Innovation System, it would instead be the role of government as facilitator that
.
also: F. Kodama (1990), Can Changes in the Techno-Economic Paradigm Be Identified Through Empirical and Quantitative Study?, STI Review, 7, p. 101-129; F. Kodama (1991), Changing Global Perspectives: Japan, the USA and the New Industrial Order, Science and Public Policy, 19 (6), p. 385-392.
102 On OECD use of the typology, see, among others: C. Freeman (1987), The Challenge of New Technologies, in OECD, Interdependence and Co-operation in Tomorrow’s World, Paris, p. 123-156; OECD (1988), New Technologies in the 1990s: A Socio-Economic Strategy, Chapter 1, Paris.
103 See Chapter 9 below. 104 See Chapter 9 below.

The Making of Science, Technology…, 2009 263
would be emphasized. The message was directed towards the actors, or sectors, and focused on the need for greater “collaboration”. Second, whereas the early system approach was centered on the research system and its links to other components or sub-systems, the National Innovation System framework was wholly centered on the firm as its main component, around which other sectors gravitate. The two approaches, however, put the emphasis on technological innovation and its economic dimension, and urge all sectors to contribute to this goal – each in their respective roles.
What the framework on National Innovation System certainly brought to a system approach that had existed for thirty years was a name or label105. Such labels are important for academics as well as governments to highlight issues and bring them onto the intellectual or political agenda. Mode 1/Mode 2 and the Triple Helix are other examples of academic labels used to increase an issue’s visibility – and the researcher’s own visibility106
105 This is what happened in the 1960s, when people started talking about the
linear model of innovation, giving a name to a theory on technological change that had emerged in the 1940s. This phenomenon of labelling explains the difference in point of view between B. Godin and D. Edgerton on the history of the linear model of innovation. See D. Edgerton (2004), The Linear Model did not Exist, in K. Grandin, N. Worms, and S. Widmalm (eds.), The Science-Industry Nexus: History, Policy, Implications, Sagamore Beach: Science History Publications, p. 31-57; B. Godin (2006), The Linear Model of Innovation: The Historical Construction of an Analytical Framework, op. cit.
. High-Technology, Knowledge-Based Economy, Information Economy or Society, and New Economy are examples of labels used by governments and the OECD
106 For critical analyses, see: B. Godin (1998), Writing Performative History: The New “New Atlantis”, Social Studies of Science, 28 (3), p. 465-483; T. Shinn (2002), The Triple Helix and New Production of Knowledge: Prepackaged Thinking in Science and Technology, Social Studies of Science, 32 (4), p. 599-614. B.-A. Lundvall recently imitated the strategy of the authors on the Triple Helix to re-launch the concept of National Innovation System in a special issue of Research Policy. See: B.-A. Lundvall, B. Johnson, E. S. Andersen and B. Dalum (2003), National Systems of Production, Innovation and Competence Building, Research Policy, 31, p. 213-231.

264 The Making of Science, Technology…, 2009
to promote the case of science, technology and innovation and their inclusion in the policy agenda of governments107
There is an irony in this story. The system approach suggested better theorizing of institutions, rules and culture and their integration into technological analyses, stating that innovation is not an autonomous activity but is embedded within the larger society. From a science-policy point of view, however, the approach saw the institutions, rules and culture as not only contributing to innovation, but as (almost) totally defined (or analyzed) in terms of, and as devoted to, innovation as the commercialization of technological invention. This is one more consequence of the economic approach that has driven science, technology and innovation policy for nearly sixty years
. The National Innovation System is one such recent label invented as a conceptual framework for policy that serves many purposes.
108
107 For critical analyses, see: B. Godin (2004), The Obsession for
Competitiveness and its Impact on Statistics: The Construction of High-Technology Indicators, Research Policy, 33 (8), p. 1217-1229; B. Godin (2004), The New Economy: What the Concept Owes to the OECD, Research Policy, 33, p. 679-690; B. Godin (2006), The Knowledge-Based Economy: Conceptual Framework or Buzzword?, op. cit; B. Godin (2007), The Information Economy: the History of a Concept through its Measurement, or How to Make Politically Relevant Indicators, 1949-2005, op. cit.
.
108 See: B. Godin (2006), Statistics and STI Policy: How to Get Relevant Indicators, Communication presented at the OECD Blue Sky II Conference “What Indicators for Science, Technology and Innovation Policies in the 21st Century?”, Ottawa, Canada, 25-27 September 2006 [http://www.oecd.org/document/60/0,2340,en_2649_34409_37083516_1_1_1_1,00.html#Wednesday] (page consulted on October 25, 2006).
The Making of Science, Technology…, 2009 265
CHAPTER EIGHT
THE KNOWLEDGE-BASED ECONOMY: CONCEPTUAL FRAMEWORK OR BUZZWORD?
According to many authors, think tanks, governments and international organizations, we now live in a knowledge-based economy. Knowledge is reputed to be the basis for many if not all decisions, and an asset to individuals and firms. Certainly, the role of knowledge in the economy is not new, but knowledge is said to have taken on increased importance in recent years, both quantitatively and qualitatively, partly because of the development of information and communication technologies.
Where does the concept of the knowledge-base economy or society come from? In 1932, the American sociologist W. F. Ogburn, who had worked for decades on technology and its impact on society, published a short paper titled The Volume of Knowledge109. To Ogburn, “the volume of knowledge has grown so great that it is beyond the human capacity of any one man to assimilate it all”110. Ogburn measured knowledge as being what was recorded by German scholar L. Darmstaeder in a bibliography of inventions and discoveries from 1300 to 1900 and published in 1908111. Ogburn computed an exponential growth curve and asked “how the human race will ever acquire all the present and future accumulation of knowledge”112
109 W. F. Ogburn (1932), The Volume of Knowledge, Journal of Adult
Education, 4, p. 26-29.
. He answered that it would do so in two ways. The
110 Ibid., p. 26. 111 The data were produced for a chapter included in the report Recent Social
Trends, published in 1933. See W. F. Ogburn and S. C. Gilfillan (1933), The Influence of Invention and Discovery, in Recent Social Trends in the United States, US Committee on Social Trends, Washington.
112 Ibid., p. 28.

266 The Making of Science, Technology…, 2009
first was through specialization, “a process being followed today”113, and the second was through education. The latter was his recommendation. However, since “there is a limit to the length of the period of formal education for which society can afford to pay”114
This was one of the first papers concerned directly with the role of knowledge in society and the implications for policy from a macro perspective. Although more a popularization than an academic paper, Ogburn’s article was nevertheless the first one written on the knowledge-based society. It was a discourse, or narrative, on the growth of knowledge, a measure of this growth and recommendations for policy. However, it is Fritz Machlup who is recognized as the real father of the topic and its measurement.
, Ogburn recommended, without much discussion, adult education.
In 1962 Machlup, an Austrian-born economist, published a study that measured the production and distribution of (all kinds of) knowledge in the United States115
Machlup’s calculations gave rise to a whole literature on the knowledge economy, its policies and its measurement. The first wave, starting in the 1970s, was concerned with the so-called information economy. In fact, both information and knowledge as terms were used interchangeably in the literature. Using Machlup’s insights and the System of National Accounts as source for data, M. U. Porat calculated that the information economy amounted to 46%
. The author estimated that in 1958, the knowledge economy accounted for $136.4 million or 29% of GNP. Machlup was the first to measure knowledge as a broad concept, while other measurements were concerned with the production of scientific knowledge, either through counting of scientific papers or R&D expenditures, and not with its distribution.
113 Ibid. 114 Ibid., p. 29. 115 F. Machlup (1962), The Production and Distribution of Knowledge in the
United States, Princeton: Princeton University Press.

The Making of Science, Technology…, 2009 267
of GNP and 53% of labour income in the United States in 1967116
This chapter looks at the reemergence of the concept in the 1990s at the OECD. The first part discusses Machlup’s measurement of the concept and the discourse he conducted on the concept. The second part discusses recent efforts at the OECD to define the concept and improve on its measurement.
. Porat’s study launched a series of similar analyses, conducted in several countries and at the OECD. This is the subject of the next chapter. The second wave of studies on the knowledge economy started in the 1990s and still continues today. The OECD, and economist D. Foray as consultant to the organization, re-launched the concept of a knowledge economy, with characteristics broadly similar to those Machlup identified.
MACHLUP’S CONSTRUCTION
Fritz Machlup (1902-1983), studied economics under Ludwig von Mises and Friedrich Hayek at the University of Vienna in the 1920s, and emigrated to the United States in 1933117
Machlup’s work on the knowledge economy, a work of a methodological nature, grew out of five lectures he gave in 1959 and 1960. The rationale Machlup offered for studying the economics of knowledge was the centrality of knowledge in society, and the absence of theorizing on this subject in the economic literature. To Machlup, “knowledge has always played a part in economic analysis,
. His two main areas of work were industrial organization and monetary economics, but he also had a life-long interest in the methodology of economics and in the ideal-typical role of assumptions in economic theory.
116 M. U. Porat (1977), The Information Economy, Nine volumes, Office of
Telecommunication, US Department of Commerce, Washington. 117 He taught at the University of Buffalo (1935-1947), then Johns Hopkins
(1947-1960), then Princeton (1960-1971). After retiring from teaching in 1971, he joined New York University until his death.

268 The Making of Science, Technology…, 2009
or at least certain kinds of knowledge have (…). But to most economists and for most problems of economics the state of knowledge and its distribution in society are among the data assumed as given”118. To Machlup, “now, the growth of technical knowledge, and the growth of productivity that may result from it, are certainly important factors in the analysis of economic growth and other economic problems”119. However, Machlup argued, there are other types of knowledge in addition to scientific knowledge. There is also knowledge of an “unproductive” type to which society allocates ample resources: schools, books, radio and television. Also, organizations rely more and more on “brain work” of various sorts: “besides the researchers, designers, and planners, quite naturally, the executives, the secretaries, and all the transmitters of knowledge (...) come into focus”120
Machlup suggested a definition of knowledge that had two characteristics. First, Machlup’s definition included all kinds of knowledge, scientific and ordinary knowledge: “we may designate as knowledge anything that is known by somebody”
. To Machlup, these kinds of knowledge deserved study.
121. Second, knowledge was defined as consisting of both its production and distribution: “producing knowledge will mean, in this book, not only discovering, inventing, designing and planning, but also disseminating and communicating”122
118 F. Machlup (1962), The Production and Distribution of Knowledge in the
United States, op. cit. p. 3-4.
. The intellectual sources of these definitions have been documented in Godin (2008): philosophy (epistemology), economics (of information), mathematics
119 Ibid., p. 5. 120 Ibid., p. 7. 121 Ibid., p. 7. 122 Ibid.

The Making of Science, Technology…, 2009 269
(cybernetics), and accounting123
Measuring Knowledge
. In this chapter, I concentrate on Machlup’s measurement of knowledge.
When Machlup published The Production and Distribution of Knowledge, the economic analysis of science, technology and innovation was just beginning124. A “breakthrough” of the time was R. M. Solow’s paper on using the production function to estimate the role of science and technology in economic growth and productivity125. As we saw in Chapter 3, a mathematical exercise such as the production function was, according to Machlup, “only an abstract construction”. For measuring knowledge, Machlup chose another method than econometrics and the production function, namely national accounting. National accounting goes back to the 18th century and what was then called political arithmetic126
123 B. Godin (2008), The Knowledge Economy: Fritz Machlup’s
Construction of a Synthetic Concept, in H, Etzkowitz and R. Viale (eds.), Proceedings of the 5th Triple Helix Conference, Edward Elgar, forthcoming.
. National
124 D. A. Hounshell (2000), The Medium is the Message, or How Context Matters: The RAND Corporation Builds an Economics of Innovation, 1946-1962, in A. C. Hughes and H. P. Hughes (eds.), Systems, Experts, and Computers, op. cit., p. 255-310.
125 R. M. Solow (1957), Technical Change and the Aggregate Production Function, Review of Economics and Statistics, 39, August, p. 312-320.
126 P. Deane (1955), The Implications of Early National Income Estimates for the Measurement of Long-Term Economic Growth in the United Kingdom, Economic Development and Cultural Change, 4 (1), Part I, p. 3-38; P. Buck (1977), Seventeenth-Century Political Arithmetic: Civil Strife and Vital Statistics, ISIS, 68 (241), p. 67-84; P. Buck (1982), People Who Counted: Political Arithmetic in the 18th Century, ISIS, 73 (266), p. 28-45; J. E. Cookson (1983), Political Arithmetic and War in Britain, 1793-1815, War and Society, 1, p. 37-60; A. M. Endres (1985), The Functions of Numerical Data in the Writings of Graunt, Petty, and Davenant, History of Political Economy, 17 (2), p. 245-264; J. Mykkanen (1994), To Methodize and Regulate Them: William Petty’s Governmental Science of Statistics, History of the Human Sciences, 7 (3), p. 65-88; J.
270 The Making of Science, Technology…, 2009
accounting really developed after World War II with the establishment of a standardized System of National Accounts, which allowed a national bureau of statistics to collect data on the production of economic goods and services in a country in a systematic way127
There are, argued Machlup, “insurmountable obstacles in a statistical analysis of the knowledge industry”
. Unfortunately for Machlup, knowledge was not – and is still not – a category in the National System of Accounts.
128. Usually, in economic theory, “production implies that valuable input is allocated to the bringing forth of a valuable output”, but with knowledge there is no physical output, and knowledge is most of the time not sold on the market129. The need for statistically-operational concepts forced Machlup to concentrate on costs, or national income accounting. To estimate costs130
Hoppit (1996), Political Arithmetic in 18th Century England, Economic History Review, 49 (3), p. 516-540.
and sales of knowledge products and services, Machlup collected numbers from diverse sources, both private and public. However, measuring costs meant that no data were available on the internal (non-marketed) production and use of knowledge, for example inside a firm: “all the people whose work consists of conferring, negotiating, planning, directing, reading, note-taking,
127 P. Studenski (1958), The Income of Nations: Theory, Measurement, and Analysis, Past and Present, New York: New York University Press; N. Ruggles and R. Ruggles (1970), The Design of Economic Accounts, National Bureau of Economic Research, New York: Columbia University Press; J. W. Kendrick (1970), The Historical Development of National-Income Accounts, History of Political Economy, 2 (1), p. 284-315; A. Sauvy (1970), Histoire de la comptabilité nationale, Économie et Statistique, 14, p. 19-32; C. S. Carson (1975), The History of the United States National Income and Product Accounts: the Development of an Analytical Tool, Review of Income and Wealth, 21 (2), p. 153-181; F. Fourquet (1980), Les comptes de la puissance, Paris: Encres; A. Vanoli (2002), Une histoire de la comptabilité nationale, Paris: La Découverte.
128 F. Machlup (1962), The Production and Distribution of Knowledge in the United States, op. cit., p. 44.
129 Ibid., p. 36. 130 Machlup preferred the concept of investments in the case of education
and R&D.

The Making of Science, Technology…, 2009 271
writing, drawing, blueprinting, calculating, dictating, telephoning, card-punching, typing, multigraphing, recording, checking, and many others, are engaged in the production of knowledge”131. Machlup thus looked at complementary data to capture the internal market for knowledge. He conducted work on occupational classes of the census, differentiating classes of white-collar workers who were knowledge-producing workers from those that were not, and computing the national income of these occupations132
. Machlup then arrived at his famous estimate: the knowledge economy was worth $136.4 million, or 29% of GNP in 1958, had grown at a rate of 8.8% per year over the period 1947-58, and occupied people representing 26.9% of the national income:
$ (millions) %
Education 60.194 44.1 R&D 10.990 8.1 Media of communication
38.369 28.1
Information machines
8.922 6.5
Information services
17.961 13.2
In conducting his accounting exercise, Machlup benefited from the experience of previous exercises conducted on education133, on human capital134
131 F. Machlup (1962), The Production and Distribution of Knowledge in the
United States, op. cit., p. 41.
and, above all, on research. The US National
132 Ibid., p. 383 and 386. 133 J. D. Wiles (1956), The Nation’s Intellectual Investment, Bulletin of the
Oxford University Institute of Statistics, 18 (3), p. 279-290. 134 J. R. Walsh (1935), Capital Concept Applied to Man, Quarterly Journal
of Economics, 49 (2), p. 255-285; J. Mincer (1958), Investment in Human

272 The Making of Science, Technology…, 2009
Science Foundation, as the producer of official statistics on science in the United States, had started collecting data on R&D expenditures in the early 1950s135. Regular surveys were conducted on four economic sectors: government, universities, firms and non-profit organizations. Then, in 1956, the Foundation published its “first systematic effort to obtain a systematic across-the-board picture”136
From the start, the data on R&D from the National Science Foundation were framed within the System of National Accounts’ framework as model. Surveys were conducted according by economic sector, the classifications used corresponded to available classifications, the matrix of R&D money flows imitated the input-output tables accompanying the System of National Accounts, and a ratio R&D/GNP was constructed. To the National Science Foundation, such an alignment with the System of National Accounts was its way to relate R&D to economic output statistically, describing “the manner in which R&D expenditures enter the gross national product in order to assist in establishing a basis for valid
. It consisted of the sum of the results of the sectoral surveys for estimating national funds for R&D. The National Science Foundation calculated that the national budget for R&D amounted to $5.4 billion in 1953.
Capital and Personal Income Distribution, Journal of Political Economy, 66 (4), p. 281-302; T. W. Schultz (1959), Investment in Man: An Economist’s View, Social Service Review, 33 (2), p. 109-117; T. W. Schultz (1960), Capital Formation by Education, Journal of Political Economy, 68 (6), p. 571-583; T. W. Schultz (1961), Investment in Human Capital, American Economic Review, 51 (1), p. 1-17; T. W. Schultz (1961), Education and Economic Growth, in N. B. Henry (ed.), Social Forces Influencing American Education, Chicago: University of Chicago Press, p. 46-88; T. W. Schultz (1962), Reflections on Investment in Man, Journal of Political Economy, 70 (5), p. 1-8; G. S. Becker (1962), Investment in Human Capital: A Theoretical Analysis, Journal of Political Economy, 70 (5), p. 9-4; W. L. Hansen (1963), Total and Private Rates of Return to Investment in Schooling, Journal of Political Economy, 71, p. 128-140.
135 B. Godin (2005), Measurement and Statistics on Science and Technology: 1920 to the Present, London: Routledge.
136 National Science Foundation (1956), Expenditures for R&D in the United States: 1953, Reviews of Data on R&D, 1, NSF 56-28, Washington.

The Making of Science, Technology…, 2009 273
measures of the relationships of such expenditures to aggregate economic output”137
Machlup made wide use of the National Science Foundation’s data for his own accounting. As we saw earlier, and as R. N. Nelson once stated, “the National Science Foundation has been very important in focusing the attention of economists on R&D (organized inventive activity), and the statistical series the NSF has collected and published have given social scientists something to work with”
.
138. The organization’s numbers were one of many sources Machlup added together in calculating his estimate of the size of the knowledge economy. However, for most of his calculations, Machlup did not use the System of National Accounts as Porat would for his work on the information economy. Instead he looked liberally at the literature for available numbers, like the National Science Foundation data, and conducted many different calculations (summations, mathematical projections, estimations and computations of opportunity costs). Neither was Machlup addicted to accounting. Although he chose costs for his estimate of the knowledge economy, he discussed and suggested many other statistics. For media of communication, he looked at the number of books and periodicals, their circulation and content; for information, he collected numbers on types of technology, and use of technologies in households; on education, he recommended using numbers on attendance, years of schooling, achievement tests, number of class hours, amount of homework, and subject-matter requirements; for R&D, he proposed a list of measures on input and output (see Appendix 3), and relationships or ratios between the two139
137 National Science Foundation (1961), R&D and the GNP, Reviews of Data
on R&D, 26, NSF 61-9, p. 1.
.
138 R. R. Nelson (1962), Introduction, in National Bureau of Economic Research, The Rate and Direction of Inventive Activity, Princeton: Princeton University Press, p. 4.
139 For an in-depth discussion of Machlup on this topic, see: F. Machlup (1960), The Supply of Inventors and Inventions, Weltwirtschaftliches Archiv, 85, p. 210-254.

274 The Making of Science, Technology…, 2009
Machlup was realistic about his own accounting, qualifying some of his own estimates as being speculative140, that is, ideas of magnitude and trends based on conjecture rather than exact figures141, and he qualified some of his comparisons as requiring interpretation “with several grains of salt”142. To Machlup, it was the message rather than the statistical adequacy that was important. The very last sentence of the book reads as follows: “concern about their accuracy [statistical tables] should not crowd out the message it conveys”143
The Message
.
Apart from his theoretical borrowings from philosophy, mathematics, economics and national accounting, we can identify policy issues and even professional interests in Machlup’s analysis at several levels First, Machlup was concerned with the challenges facing the education and research system of which he was part. Second, he was concerned, as analyst, with the new information technology “revolution”.
For each of the components“operationalizing” his definition of knowledge, Machlup identified policy issues, and this partly explains the inclusion of the components in the measurement. The policy issues Machlup identified were mainly economic. To begin with education, the central question discussed was productivity. Machlup suggested compressing the curriculum to accelerate the production of well-trained brainpower and therefore economic growth. “We need an educational system that will significantly raise the intellectual capacity of our people. There is at present a great scarcity of brainpower in our labor force (…). Unless our labor force changes its composition so as to include a much higher share of well-trained
140 F. Machlup (1962), The Production and Distribution of Knowledge in the
United States, op. cit., p. 62. 141 Ibid., p. 103. 142 Ibid., p. 374. 143 Ibid., p. 400.

The Making of Science, Technology…, 2009 275
brainpower, the economic growth of the nation will be stunted and even more serious problems of employability will arise”144. Machlup also suggested considering (and measuring) education as an investment rather than as a cost, and as an investment not only with regard to the individual (for future earnings) but also to society (for culture), in line with studies on social rates of return on research145
As to the second component – R&D – Machlup confessed that “this subject was his first interest in the knowledge production industry. The temptation to expand the area of study to cover the entire industry came later, and proved irresistible”
.
146. To Machlup, the policy issues involving R&D were twofold. One was the decline of inventions. He wondered whether this was due to the patent system itself, or to other factors. In the absence of empirical evidence, he suggested that “faith alone, not evidence, supports” the patent system. To Machlup, it seems “not very likely that the patent system makes much difference regarding R&D expenditures of large firms”147. A second policy issue concerning R&D was the productivity of research on the economy and society, particularly basic research, as there was then a preference for applied research in America, claimed Machlup. Echoing V. Bush, according to whom “applied research invariably drives out pure” research148
144 F. Machlup (1962), The Production and Distribution of Knowledge in the
United States, op. cit., p. 135.
, Machlup argued that industry picks up potential scientists before they have completed their studies, and dries up the supply of research personnel (shortages). Furthermore, he argued that if investments in basic research remain too low (8% of
145 T. W. Shultz (1953), The Economic Organization of Agriculture, New York: McGraw-Hill, p. 114-122; Z. Griliches (1958), Research Costs and Social Returns: Hybrid Corn and Related Innovation, Journal of Political Economy, 46, p. 419-431.
146 Ibid., p. 48. 147 F. Machlup (1962), The Production and Distribution of Knowledge in the
United States, op. cit., p. 170. 148 V. Bush (1945) [1995], Science: The Endless Frontier, North Stratford
(N.H.): Ayer Company Publishers, p. xxvi.

276 The Making of Science, Technology…, 2009
total expenditures on R&D), applied research would suffer in the long run, since it depends entirely on basic research.
These were the main policy issues Machlup discussed. Concerning the last two components of his definition – communication and information – Machlup was very brief. In fact, his policy concern here was mainly with information technologies and the technological revolution. To Machlup, there was the danger of increasing unemployment among unskilled manual labour149. In the long run, “the demand for more information may partially offset the labor-replacing effect of the computer-machine”150
Machlup wrote on knowledge at a time when science, or scientific knowledge, was increasingly believed to be of central importance to society – and scientists benefited greatly from public investments in research. Economists, according to whom “if society devotes considerable amounts of its resources to any particular activity, economists will want to look into this allocation and get an idea of the magnitude of the activity, its major breakdown, and its relation to other activities”
.
151
THE KNOWLEDGE-BASED ECONOMY AT THE OECD
, started measuring the new phenomenon, and were increasingly solicited by governments to demonstrate empirically the contribution of science to society – a means of cost control on research expenditures not yet being in sight. Machlup was part of this “movement”, with his own intellectual contribution.
Machlup’s concept of a knowledge economy and its relationship to statistics was a concept originally supported by new trends in the economy. Its revival in the 1990s, however, has little to do with numbers and everything to do with politics. In fact, several authors
149 Ibid., p. 397. 150 Ibid., p. 321. 151 F. Machlup (1962), The Production and Distribution of Knowledge in the
United States, op. cit., p. 7.

The Making of Science, Technology…, 2009 277
argue that nothing really new has happened, at least with regard to the centrality of knowledge in the modern economy. I suggest that the concept of a knowledge-based economy at the OECD is simply a concept that serves to direct the attention of policy-makers to science and technology issues and to their role in the economy and, to this end, a concept that allows one to collect a large set of statistics under one roof. This kind of concept I will call an umbrella concept.
The concept of the knowledge-based economy at the OECD is a response to criticisms of the concept of the National Innovation System. The OECD used several strategies to revive the concept, one of them being enrolling the concept’s promoters as consultants. The second most important strategy was using statistics, which helped crystallize the concept by giving it empirical content.
As we have seen in the previous chapter, the OECD project on the National Innovation System flirted with the concept of a knowledge economy, having even temporarily redefined the initial objectives of the project around knowledge access and distribution, whereas the original aims concerned institutional factors explaining the efficiency of a National Innovation System. The project also flirted with indicators on knowledge distribution, but rapidly concluded that it was too difficult to measure. In the end, the concept of the knowledge-based economy instead served a rhetorical role in papers on the National Innovation System: in section titles and introductory texts.
The first step toward the generalized used of the concept of a knowledge-based economy at the OECD came in 1995, with a document written by the Canadian delegation for the ministerial meeting of the Committee on Science and Technology Policy. The paper, including the knowledge-based economy concept in its title, discussed two themes: new growth theory and innovation performance152. On the first theme, the Secretariat suggested153
152 OECD (1995), The Implications of the Knowledge-Based Economy for
Future Science and Technology Policies, OCDE/GD(95)136.
:

278 The Making of Science, Technology…, 2009
Economics has so far been unable to provide much understanding of the forces that drive long-term growth. At the heart of the old theory (neoclassical) is the production function, which says the output of the economy depends on the amount of production factors employed. It focuses on the traditional factors of labor, capital, materials and energy (…). The new growth theory, as developed by such economists as Romer, Grossman, Helpman and Lipsey, adds the knowledge base as another factor of production”.
On the second theme – innovation – a dynamic national innovation system was again suggested as the key to effectiveness. But understanding a national innovation system required “better measures of innovation performance and output indicators”154. “Most current indicators of science and technology activities, such as R&D expenditures, patents, publications, citations, and the number of graduates, are not adequate to describe the dynamic system of knowledge development and acquisition. New measurements are needed to capture the state of the distribution of knowledge between key institutions and interactions between the institutions forming the national innovation system, and the extent of innovation and diffusion”155. This message was carried over into the 1995 ministerial declaration and recommendations: “there is need for Member countries to collaborate to develop a new generation of indicators which can measure innovative performance and other related output of a knowledge-based economy”156
153 Ibid., p. 3.
. From then on, two conceptual frameworks competed at the OECD for the attention of policy-
154 Ibid., p. 5. 155 Ibid., p. 6. 156 OECD (1996), Conference on New Science and Technology Indicators
for a Knowledge-Based Economy: Background Document, DSTI/STP/NESTI/GSS/TIP (96) 2, p. 2,
The Making of Science, Technology…, 2009 279
makers: the National Innovation System together with the analysis of its components and their interrelationships, and the Knowledge-Based Economy with its emphasis on the production, distribution and use of knowledge, and on its measurement.
Soon, various committees, working groups and people at the OECD appropriated the concept of a knowledge-based economy: conferences were held that included the concept157, papers were published in the policy series (Science, Technology and Industry Outlook) that attempted to promote it158, and a whole program of work on new indicators was developed159, from which statistical scoreboards were produced160
Defining the Knowledge-Based Economy
.
In the mid-1990s, the knowledge-based economy was a fuzzy concept. At the OECD conference on employment and growth in the knowledge-based economy, Foray and Lundvall joined forces,
157 OECD (1996), Employment and Growth in the Knowledge-Based
Economy, Paris; OECD (1997), Industrial Competitiveness in the Knowledge-Based Economy: The New Role of Governments, Paris.
158 OECD (1996), Science, Technology and Industry Outlook, chapter 5, Paris; OECD (2000), Science, Technology and Industry Outlook, chapter 1, Paris; OECD (2002), Science, Technology and Industry Outlook, chapter 1, Paris.
159 A workshop and a conference on a new generation of indicators for the knowledge-based economy were organized in 1996 and 1998 (Blue Sky Project). See OECD (1996), Conference on New Indicators for the Knowledge-Based Economy: Summary Record, DSTI/STP/NESTI/GSS/TIP (96) 5; OECD (1997), Progress Report on the “New Science and Technology Indicators for the Knowledge-Based Economy” Activity, DSTI/EAS/STP/NESTI (97) 6; OECD (1998), Seminar on New Indicators for the Knowledge-Based Economy: Development Issues, CCNM/DSTI/EAS (98) 63; OECD (1998), New S&T Indicators for a Knowledge-Based Economy: Present Results and Future Work, DSTI/STP/NESTI/GSS/TIP (98) 1.
160 OECD (1999), STI Scoreboard: Benchmarking Knowledge-Based Economies, Paris; OECD (2001), Science, Technology and Industry Scoreboard: Towards a Knowledge-Based Economy, Paris.

280 The Making of Science, Technology…, 2009
arguing that the “economy is more strongly and more directly rooted in the production, distribution and use of knowledge than ever before”161. According to other authors, however, the concept was rather a rhetorical term, a metaphor “often used in a superficial and uncritical way”162
For a “systematic” definition of knowledge-based economies, we have to turn to the OECD Science, Technology and Industry Outlook series. In 1996, the OECD defined knowledge-based economies as: “economies which are directly based on the production, distribution and use of knowledge and information”
. Briefly stated, it can be said that the term knowledge-based economy referred to at least two (supposed) characteristics of the new economy. Firstly, knowledge would be more quantitatively and qualitatively important than before. Secondly, applications of information and communication technologies would be the drivers of the new economy.
163
In the course of its efforts to define the knowledge-based economy, the OECD invented two related concepts that gave it more substance. The first concerned “investment in knowledge”, and the definition was entirely statistical: “expenditures directed towards activities with the aim of enhancing existing knowledge and/or acquiring new knowledge or diffusing knowledge”
. A more or less identical definition has carried over into every subsequent OECD document dealing with the knowledge-based economy.
164
161 D. Foray and B.-A. Lundvall (1996), The Knowledge-Based Economy:
From the Economics of Knowledge to the Learning Economy, in OECD, Employment and Growth in the Knowledge-Based Economy, op. cit. p. 11-32.
. According to the OECD,
162 K. Smith (2002), What is the Knowledge Economy? Knowledge Intensity and Distributed Knowledge Bases, UNU/INTECH Discussion Paper, ISSN 1564-8370, p. 5.
163 OECD (1996), The Knowledge-Based Economy, in OECD, Science, Technology, and Industry Outlook, Paris: OECD, p. 3.
164 OECD (2001), Science, Technology, and Industry Scoreboard: Towards a Knowledge-Based Economy, op. cit. p. 14; M. Kahn (2001), Investment in Knowledge, STI Review, 27, p. 19-47.

The Making of Science, Technology…, 2009 281
investment in knowledge is the sum of expenditures on R&D, higher education and software. The second newly-coined concept was in fact a variation on the (controversial) indicator of high-technology intensity: knowledge-based industries. Knowledge-based industries were defined as those that had the following three characteristics: 1) a high level of investment in innovation, 2) intensive use of acquired technology, and 3) a highly-educated workforce165
But the main conceptual work on the subject at the OECD had to do with collecting a whole set of indicators under the concept of the knowledge-based economy. Recalling Foray and Lundvall’s comment that evidence documenting trends in the knowledge-based economy was in fact anecdotal
.
166, the OECD suggested five categories of indicators to measure the concept: inputs, stocks and flows, outputs, networks and learning167
Measuring the Knowledge-Based Economy
. The first measurement exercise, to which we now turn, appeared in 1999, in the form of a scoreboard of indicators.
In the mid-1990s, the Directorate for Science, Technology and Industry restructured its publication.168
165 C. Webb (2000), Knowledge-Based Industries, DSTI/EAS/IND/SWP
(2000)5; C. Webb (2001), Knowledge-Based Industries, DSTI/EAS/IND/SWP (2001)13.
Until then, four reviews and/or outlooks had been prepared. The Secretariat suggested merging the “Industrial” and “Science and Technology Policy” reviews into one (Science, Technology and Industry Outlook), to be
166 D. Foray and B.-A. Lundvall (1996), The Knowledge-Based Economy: From the Economics of Knowledge to the Learning Economy, op. cit. p. 16.
167 OECD (1996), The Knowledge-Based Economy, in OECD, Science, Technology, and Industry Outlook, op. cit. p. 20.
168 OECD (1994), Developing Science, Technology and Industry Review/Outlooks: A Proposal, DSTI/IND/STP/ICCP (94) 4; OECD (1995), Réunion ad hoc conjointe sur l’intégration des rapports relatifs aux perspectives, DSTI/IND/STP (95) 1.

282 The Making of Science, Technology…, 2009
published every two years. In the alternating year, a scoreboard of indicators would be published.
The idea of the scoreboard followed the construction of the STAN database (Structural Analysis) and its affiliates in the early 1990s. One of the first reports to come out of the new database was a scoreboard of sixteen indicators covering R&D, investment, international trade, employment and structural change169
From the scoreboards, the Directorate for Science, Technology and Industry also produced compendiums specifically designed for ministerial meetings: one in 1995
. Thereafter, starting in 1995, an Industry and Technology Scoreboard of Indicators was published every two years. It included a series of economic and science and technology indicators, graphically illustrated, ranking countries on different dimensions, and with a very brief analytical text (two to five paragraphs per indicator).
170, and another in 1999171. These documents were “synthetic and attractive” statistical and analytical documents that “tell a story readily understandable by generalists and the press”172
The 1999 issue of the compendium dealt with the knowledge-based economy. It collected 32 indicators
. It included a set of indicators, each presented on one page, with graphs and bullet points highlighting the main trends.
173
169 OECD (1993), Manufacturing Performance: A Scoreboard of Indicators
for OECD Countries, DSTI/EAS/IND/WP9 (93) 2.
, of which nine were specifically identified as measuring the knowledge-based economy (see Appendix 5). The indicators showed, among other things, that: 1) knowledge-based industries have been outpacing GDP growth (up
170 OECD (1995), Science and Technology Indicators, Meeting of the Committee for Scientific and Technological Policy at Ministerial Level, Paris.
171 OECD (1999), The Knowledge-Based Economy: A Set of Facts and Figures, Paris.
172 OECD (1998), Possible Meeting of the CSTP at Ministerial Level: Statistical Compendium, DSTI/EAS/STP/NESTI (98) 8, p. 3.
173 Including, for the first time in an OECD statistical publication, bibliometric indicators.

The Making of Science, Technology…, 2009 283
to 50% that of GDP growth), 2) OECD countries spend more and more resources on the production of knowledge (8% of GDP, a share as important as that on physical investments), 3) over 60% of the population aged 25-64 has completed upper secondary schooling, 4) OECD economies invested 7% of GDP in information and communication technologies, 5) R&D was expanding (US$500 billion in 1997), 6) the business sector was the main funder and performer of R&D (over 60%). The statistics were updated in 2000174, and the number of indicators increased in 2001 (see Appendix 6)175
The work behind the measurement of the knowledge-based economy was conducted in part by the group of National Experts on Science and Technology Indicators (NESTI), via a project called Blue Sky, launched in 1996
.
176
- Mobility of human resources,
. Six priority areas were identified for the development of a new generation of indicators:
- Patents,
- Innovation capabilities of firms,
- Internationalization of industrial R&D,
- Government support for innovation,
- Information technology.
174 OECD (2000), Progress Towards a Knowledge-Based Economy, in
OECD, STI Outlook, op. cit. 175 OECD (2001), Science, Technology and Industry Scoreboard: Towards a
Knowledge-Based Economy, op. cit. 176 OECD (1996), Conference on New Science and Technology Indicators
for a Knowledge-Based Economy: Summary Record of the Conference Held on 19-21 June 1996, op. cit.; OECD (1996), Conference on New S&T Indicators for a Knowledge-Based Economy: Background Document, op. cit.

284 The Making of Science, Technology…, 2009
The aim was to develop two types of statistical products177. The first were data and indicators, published on a regular basis, i.e.: yearly. The second were data sets for use in specific studies, like those on the knowledge-based economy. Two conferences were held, one in 1996 and another in 1998, where the six above areas were targeted and a program of work was developed for each, the various projects each being led by a specific country or group of countries. The criteria for the proposed topics were the following: they must 1) be relevant from a policy point of view, 2) be feasible in terms of methodology, 3) be not too resource-consuming, 4) refer to well-identified questions, and 5) be topics in which the OECD has a role to play and a comparative advantage. However, it was clearly mentioned that, “budget restrictions (and the burden for respondents) set strict limits on the possibility of developing new surveys. Against this background, the endeavor for building new data and indicators will consist mainly in extracting more and new information from the existing stock of data”178. This meant measuring new dimensions of science, technology and innovation using links between existing data rather than by producing new data, linking of existing data being far less expensive than developing brand-new surveys179
177 OECD (1996), Conference on New Science and Technology Indicators
for a Knowledge-Based Economy: Background Document, op. cit., p. 2.
.
178 OECD (1996), New Indicators for the Knowledge-Based Economy: Proposals for Future Work, DSTI/STP/NESTI/GSS/TIP (96) 6, p. 4.
179 See OECD (1996), Conference on New Science and Technology Indicators for a Knowledge-Based Economy: Summary Record of the Conference Held on 19-21 June 1996, op. cit.; OECD (1996), New Indicators for the Knowledge-Based Economy: Proposals for Future Work, op. cit.

The Making of Science, Technology…, 2009 285
AN UMBRELLA-CONCEPT
Did the new indicators measure up to their promise180
? The question can be answered by comparing the output to the recommendations of the promoters of the knowledge-based economy concept, among them the OECD itself, or by analyzing the definition and dimensions of the concept and measuring these dimensions. On the first comparison, it seems clear that everyone was dissatisfied with the existing indicators and early in the process suggested new measurements:
K. Smith181
- Inter-industry transactions embodying flows of technological knowledge,
- Patterns of use of formal scientific knowledge,
- Patterns of technological collaboration between firms, universities and research institutions,
- Measures of personnel mobility and related interactions.
D. Foray182
- Basic attributes of the knowledge base,
- Systems and mechanisms for transferring knowledge,
- Effectiveness of the knowledge base.
180 For an overview of the results of the expert group (NESTI) program, see
the special issue of STI Review, 27, 2002. 181 K. Smith (1995), Interactions in Knowledge Systems: Foundations,
Policy Implications and Empirical Methods, op. cit. 182 D. Foray (2000), Characterizing the Knowledge Base: Available and
Missing Indicators, in OECD, Knowledge Management in the Learning Society, Paris, p. 239-257.

286 The Making of Science, Technology…, 2009
OECD183
- Knowledge stocks and flows,
- Knowledge rates of return,
- Knowledge networks,
- Knowledge and learning.
183 OECD (1996), The Knowledge-Based Economy, in OECD, Science,
Technology, and Industry Outlook, op. cit.

The Making of Science, Technology…, 2009 287
On the other hand, from an analysis of the OECD scoreboards of indicators, one must conclude that the knowledge-based economy is above all a label. Most if not all of the indicators collected are indicators that the OECD had already been measuring for years or even decades, or are variations on old indicators that had suddenly become subsumed under the concept of the knowledge-based economy184
If we now look at the OECD definition of knowledge-based economies (“economies which are directly based on the production, distribution and use of knowledge and information”), we would expect to find indicators on the production as well as the distribution and diffusion of knowledge. And indeed, several indicators dealt with the production side of knowledge, as has always been the case with science and technology indicators (R&D, human resources, patents). But the few that concern distribution and diffusion either concentrated on information and communication technologies, or were still measured using input and activity indicators rather than outputs and impacts. It is clear that the indicators draw on available
. The documents simply aligned an existing series of indicators and fact-sheets under a new umbrella – the knowledge-based economy. In 1999, only nine of the thirty-two indicators were specifically located and analyzed under the concept – although the document as a whole was called The Knowledge-Based Economy. By 2001, there were twenty-five. In fact, a simple reorganization of categories (turning indicators from the 1999 category “science and technology policies”, as well as some from the “output and impact” category, into the “creation and diffusion of knowledge” category) was responsible for the increase. All 59 indicators from the scoreboard, however, were now analyzed in the introductory text as measuring the knowledge-based economy.
184 This is not peculiar to the OECD. Contrary to his claims, D. Foray did not
totally succeed in distinguishing the traditional economics of R&D and innovation from the knowledge-based economy, at least with regard to the policy issues. See: D. Foray (2000), L’économie de la connaissance, op. cit.

288 The Making of Science, Technology…, 2009
data sets, and that the knowledge-based economy is above all a rhetorical concept.
In fact, a critical analysis of the concept reveals the following three rhetorical moves. Firstly, the concept is justified with the same arguments as those used for frameworks on the National Innovation System, the information society or the New Economy: knowledge and information and communication technologies are said to be important factors that bring about important changes in the economy. One finds here a network of concepts that feed at the same source and which reinforce each other. Secondly, the content of the concept is composed of a synthesis or collection of recent ideas in the field of science and technology studies. Like the National Innovation System literature that brought together the latest ideas on tacit learning, learning-by-doing, user-producer interactions, diffusion of technologies, clusters and networks, the concept of the knowledge-based economy collected fashionable ideas from new growth theories, the National Innovation System and the information society. Thirdly, the two previous moves combine to make the concept an umbrella concept: the knowledge-based economy is a term that now covers statistics in all areas of science and technology, broadly defined – R&D, information and communication technologies, education, etc. Therefore, it is very fertile “theoretically” and empirically, and can be used for any issues in science and technology – and anywhere: titles of whole reports; chapters or introductory sections; lists of indicators; and … policies.
How can we explain this situation? How do we explain organizing and packaging the previous material into a conceptual framework with buzzwords and slogans as labels? Do we really need such fuzzy concepts as the knowledge-based economy? The pervasiveness and popularity of such concepts at the OECD is due to two institutional factors. First, frameworks are linked to the political process of the organization. A large part of the work of the OECD is for presentation to ministerial conferences. The Secretariat has to feed ministers regularly for their meetings, which meetings in turn ask for more studies. Using narratives and popular labels, the Secretariat

The Making of Science, Technology…, 2009 289
succeeds in influencing the political agenda, at least on paper (G-7 communiqués, national white papers and policy-makers’ discourses). The second institutional aspect of the production of frameworks at OECD is the publication process. The organization publishes reports by the hundred every year, many of a periodic nature. Again, labels are very fertile intellectually for their broadness or fuzziness, and because they are fashionable.
Numbers, figures and graphs are also used liberally in frameworks to facilitate reading. However, at several places in its documents, the OECD recognized that its indicators were “not adequate to describe the dynamic system of knowledge development and acquisition”185
It remains that the concept of the knowledge-based economy is actually a rhetorical concept. Certainly, important methodological difficulties await anyone interested in measuring intangibles like knowledge. But the objective of a policy organization is not, above all, accuracy, but influence. As Foray and Lundvall once suggested: “One function of the notion of the knowledge-based economy is to attract the attention of statisticians and other experts in the field of social and economic indicators”
. But they probably appeared sufficiently “objective”, simply because they were quantitative, to draw the attention of policy-makers, politicians and the general public to matters of science, technology and innovation.
186
185 OECD (1995), The Implications of the Knowledge-Based Economy for
Future Science and Technology Policies, op. cit. p. 6.
.
186 D. Foray and B.-A. Lundvall (1996), The Knowledge-Based Economy: From the Economics of Knowledge to the Learning Economy, in OECD, Employment and Growth in the Knowledge-Based Economy, op. cit. p. 18.

290 The Making of Science, Technology…, 2009
CONCLUSION
Machlup’s study on the knowledge economy accomplished three tasks. It defined knowledge, measured it and identified policy issues. The message was that knowledge was an important component of the economy, but that it does not completely respond to an economic logic. With The Production and Distribution of Knowledge, Machlup brought the concept of knowledge into science policies and science studies. His conception of knowledge was synthesized from three intellectual trends of the time: “disintellectualizing” and “subjectivizing” knowledge (ordinary knowledge), looking at knowledge as a communication process (production and distribution), and measuring its contribution to the economy (in terms of accounting).
In the early 1980s, Machlup began updating his study on the knowledge economy with a projected ten-volume series titled Knowledge: its Creation, Distribution, and Economic Significance1
1 F. Machlup (1980-84), Knowledge: its Creation, Distribution, and
Economic Significance, Princeton: Princeton University Press.
. He died after finishing the third volume. By then, he was only one of many people measuring the knowledge or information economy. With this new project, Machlup kept to his original method as developed in 1962: national accounting. This was a deliberate choice. In fact, there were two types of accounting measurement in the economic literature of the time. One was growth accounting. It used econometrics, and was the cherished method among quantitative economists. With the aid of equations and statistical correlations, economists tried to measure the role of knowledge in economic growth, following in Solow’s footsteps. Machlup did not believe in this method. The second method was national accounting. This method was not very attractive to economists – although developed by one of them (S. Kuznets). It relied on descriptive statistics rather than formalization. Its bad reputation and the reluctance of economists to use national accounting have a long tradition, going

The Making of Science, Technology…, 2009 291
back to the arguments of 18th century classical economists against political arithmetic2. It was a similar reluctance that economist R. R. Nelson expressed while reviewing Machlup’s book in Science in 1963. Nelson expressed his disappointment that Machlup had not studied the role and function of knowledge: “Machlup is concerned principally with identifying and quantifying the inputs and outputs of the knowledge-producing parts of the economy and only secondarily with analyzing the function of knowledge and information in the economic system”3
Today, the measurement of knowledge is often of a third kind. Certainly, knowledge is still, most of the time, defined as Machlup suggested (creation and use) – although the term has also become a buzzword for any writing and discourse on science, technology and education. But in the official literature, knowledge is actually measured using indicators. Such measurements are to be found in publications from the OECD and the European Union, for example. Here, knowledge is measured using a series or list of indicators gathered under the umbrella of “knowledge”
.
4
The methodology of indicators for measuring knowledge, information or simply science, comes partly from Machlup. We have seen how Machlup complemented his accounting exercise with discussions on various sorts of statistics, among them statistics on R&D organized into an input-output framework. In 1965, the British economist C. Freeman, as consultant to the OECD, would suggest
. There is no summation (or composite value), as in accounting, but a collection of available statistics on several dimensions of knowledge, that is, science and technology, among them that on information technologies.
2 K. Johannisson (1990), Society in Numbers: the Debate over
Quantification in 18th Century Political Economy, in T. Frangsmyr et al. (eds.), The Quantifying Spirit in the Eighteenth Century, Berkeley: University of California Press, p. 343-361.
3 R. R. Nelson (1963), Role of Knowledge in Economic Growth, Science, 140 (3566), May 3, p. 473-474.
4 B. Godin (2006), The Knowledge-Based Economy: Conceptual Framework or Buzzword?, op. cit.

292 The Making of Science, Technology…, 2009
such a collection of indicators to the organization5. In the 1970s, the National Science Foundation initiated such a series, titled Science Indicators, which collected multiple statistics for measuring science and technology. To statistics on input, among them money devoted to R&D, the organization added statistics on output like papers, citations, patents, high technology products, etc. The rationale behind the collection of indicators was precisely that identified by Machlup as a policy issue: the “productiveness”, or efficiency of the research system6
The knowledge-based economy is an umbrella concept: it allows one to gather existing ideas and concepts on science, technology and innovation, and any related indicators, into a conceptual framework, i.e.: all under one roof. This is a fertile strategy for rapidly producing new papers and discourses, and alerting policy-makers to new trends. But what impact has the concept had in recent history? There are two areas of possible influence to be explored.
.
The first is policy. The concept has probably helped to sustain, or at the very least give increased visibility to, science, technology and innovation policies. In a context of budget constraints, and after a
5 C. Freeman and A. Young (1965), The Research and Development Effort
in Western Europe, North America and the Soviet Union: An Experimental International Comparison of Research Expenditures and Manpower in 1962, Paris: OECD.
6 National Science Board (1973), Science Indicators 1972, Washington: National Science Foundation, p. iii.
The Making of Science, Technology…, 2009 293
decade of haphazard trends in R&D investments, buzzwords such as the knowledge-based economy helped re-launch discourses on science, technology and innovation. Several recent new science and technology policies now include the concept1
The second area of possible impact is statistics. To date, however, the concept of the knowledge-based economy has had a very limited impact on statistics. Traditional statistics and indicators, based on input and activity data sets, still dominate the measurement of science, technology and innovation, and above all the concept of the knowledge-based economy. Certainly there have been some efforts in new fields (i.e.: mobility of personnel) – although none really fruitful yet – but there has been far less effort on the central and new characteristics of the supposed knowledge-based economy, like tacit knowledge. The major innovation remains simply the collection of several indicators from different sources under a new label.
.
1 See, for example: European Commission (2000), Innovation in a
Knowledge-Driven Economy, COM (2000) 567; Commisariat du Plan (2002), La France dans l’économie du savoir: pour une dynamique collective, groupe de travail Vignier, Paris; Government of Canada (2002), Canada’s Innovation Strategy, I. Knowledge Matters: Skills and Learning for Canadians; II. Achieving Excellence: Investing in People, Knowledge and Opportunity, Ottawa: Industry Canada.


The Making of Science, Technology…, 2009 295
CHAPTER NINE
THE INFORMATION ECONOMY: THE HISTORY OF A FRAMEWORK
THROUGH ITS MEASUREMENT
For over fifty years, information and communication technologies have been everywhere in the literature, explaining changes in society and giving rise to many terms and buzzwords like the information economy1. Echoing early works, the OECD, in an influential study conducted in the 1960s, concluded that “the computer can be considered as the key to the second industrial revolution, just as the steam engine was the center of the first industrial revolution”. To the OECD, “the strategic significance of the computer is partly due to the fact that information is the key to management”2
This chapter documents the recent history of the concept of information and its framework through the lens of statistics. Many concepts depend on statistics for their definition. Such is the case for
. More recently, the organization has used new concepts and frameworks to explain changes in the economy: the new economy, the knowledge-based economy and the information society. All of these changes are explained, partly or wholly, by information technology. How did we get there? How did information and its technologies acquire such a central role in public discourses?
1 J. R. Beniger (1986), The Control Revolution: Technological and
Economic Origins of the Information Society, Cambridge (Mass.): Harvard University Press.
2 OECD (1969), Gaps in Technology: Electronic Computers, Paris, p. 26-27.

296 The Making of Science, Technology…, 2009
productivity3
In this chapter, I analyze official statistics and the role they play in official narratives on the information economy. The chapter looks at the measurement of information at the OECD from 1949 to 2005. In 1949, W. Schramm edited a much-quoted book of papers by C. E. Shannon and W. Weaver on communication theory
. We cannot discuss productivity without statistics and ratios, or at least a minimal idea of quantities. Information is different. It is not a concept of a quantitative nature. However, it is amenable to (imperfect) quantification, like many other concepts. In such a case, statistics often proves influential in focusing or crystallizing the attention of people on specific dimensions of the reality or phenomenon, and not on others.
4
The thesis of this chapter is that, over the past fifty years, the concept of information developed in three stages (Table 16). The first was characterized by information as knowledge. In the 1950s and after, scientists and governments became preoccupied with information growth and “explosion”. There was, so they argued, an explosion of literature, as measured by librarians and by historian D. J. D. Price. The computer was seen as the solution, but too-rapid development could complicate its use because of system incompatibility, thus the need for management of information and for appropriate technological systems to process it. Information-as-knowledge
, but that year also corresponds to the entry of the OECD into the field. As an early promoter of national science policy and as a think tank to its Member countries, the OECD is an ideal test case for understanding the way governments think about information. National delegates bring their ideas to the organization which, in turn, produces working papers and policy recommendations that feed national policy-makers.
3 B. Godin (2006), The Value of Science: Changing Conceptions of
Scientific Productivity, 1869-circa 1970, Communication presented to the international conference “The Future of Science, Technology and Innovation Policy: Linking Research and Practice”, SPRU, Brighton, Great Britain, September 11-13.
4 C. E. Shannon and W. Weaver (1949), Mathematical Theory of Communication, Urbana: University of Illinois Press.

The Making of Science, Technology…, 2009 297
carried a “restricted” definition of information: information was limited to scientific and technological information – although transfer to non-scientists, namely industry, was often the main objective of early policies. The statistics developed reflected this choice: information was measured as documentation.
This conception of information was followed by a second one: information as commodity or economic activity. Such a conception was developed by American economists F. Machlup and M. U. Porat, and became very popular in the late 1970s and early 1980s. What preoccupied policy-makers was structural change in the economy, namely the transition from a manufacturing economy to a service or information economy, and “information gaps” between countries. Information came to be defined very broadly. It included just about anything that was intangible. The statistics developed to measure information relied on the national accounts: aggregating expenditures for certain industrial activities to produce an information field or category.

298 The Making of Science, Technology…, 2009
Table 16. Evolving OECD Conceptions of Information
Information as knowledge Emblematic authors: Bernal and Price Issue: information explosion Restricted definition: scientific and technological information Statistics: documentation
Information as economic activity (or commodity) Emblematic authors: Machlup and Porat Issue: structural change Broad definition: information goods and services (industries) Statistics: accounting
Information as technology Emblematic authors: Freeman and Miles Issue: technological revolution Restricted definition: (information and communication) technologies Statistics: applications and uses
More recently, a third conception of information emerged: information as technology. Many analysts came to view information technologies, because of their widespread effects on the economy, as bringing forth a new techno-economic paradigm or technological revolution. The key issue was no longer identifying the sector producing the technologies, but rather mapping the applications of information technologies and their uses. The concept of information was thereafter restricted, at least in official circles, to what came to be called “information and communication technologies”, and measurements emphasized the diffusion and use of these technologies. C. Freeman and I. Miles, from SPRU, were influential in this reorientation of the concept of information. From the 1990s onward, the OECD turned entirely to such an approach to information.

The Making of Science, Technology…, 2009 299
This chapter argues that the interest in the information economy, contrary to what most authors who have studied the phenomenon have stated, predates the literature that uses the concept. Information was the concern of science policy (scientific and technical documentation) before it became a matter of economic policy (industries responsible for information goods and services) and then technology policy (promotion of information and communication technologies). The preoccupation with the growth and management of scientific publications was the very first step toward the construction of the concept of the information economy. This chapter also argues that the history of the concept is intimately linked to its measurement. At all three stages, the OECD and its member countries developed and initiated projects on a methodological manual to crystallize the meaning of the concept of information and standardize its measurement. The efforts failed until very recently, namely until information came to be identified with technology. A large part of this chapter analyzes the history of these projects, and looks at the factors – conceptual, methodological and political – behind the experiences.
THE ECONOMICS OF INFORMATION
The OECD’s concern with information goes back to 1949 when the OEEC) – the predecessor of the OECD – set up a working party on scientific and technical information (Working Party no. 3). According to A. King, head of the working party (and first head of the Directorate for Scientific Affairs at OECD), studying scientific and technical information was the means to get science policy considerations into the organization, an organization not very oriented toward science at the time5
5 A. King (1992), The Productivity Movement in Post-War Europe, mimeo,
p. 5-6.
. Science policies did not yet exist, and there was reluctance to look at a “cultural” good (science) from an economic point of view. Over its few years of existence, the
300 The Making of Science, Technology…, 2009
working party was concerned mainly with productivity, but it also dealt with the exchange of scientific and technical information between countries, particularly from the USSR to Western Europe and the United States, and set up a network of national centers for scientific and technical information. After two years, a Committee on Scientific and Technical Matters was finally set up that continued this work, and others. However, it was left to the European Productivity Agency, a body of the OEEC created in 1953, to conduct the first study on scientific and technical information. In 1955, under the coordination of the British Central Office of Information, the Agency conducted an international survey on the use made of scientific and technical information by more than 2,000 small and medium firms in five industries6
Then in 1961 the OECD was created, with a mandate focused on policies. Whereas its predecessor organization had operational responsibilities, the new organization was oriented toward helping member countries establish policies in many fields, among them science, technology and innovation. A Directorate for Scientific Affairs was set up, supported by committees composed of national delegates. It was in this Directorate that information policies came to be discussed, first of all at the Committee for Scientific Research.
. Although the literature was the main method identified for keeping abreast of information, the study found that contact with suppliers was the primary source for solutions to industrial problems.
6 EPA (1958), Technical Information and the Smaller Firm: Facts and
Figures on Practices in European and American Industry, Paris; EPA (1959), Technical Information and Small and Medium Sized Firms: Methods Available in Europe and the United States, Numbers and Facts, Paris. The survey was followed by another one in 1960 concerned with suppliers of information: EPA (1960), Technical Services to the Smaller Firm by Basic Suppliers: Case Studies of European and American Industry, Paris.

The Making of Science, Technology…, 2009 301
The Ad Hoc Group on Scientific and Technical Information (1962)
In 1962, the OECD Committee for Scientific Research produced the first reflections of the organization on scientific and technical information policy7. Echoing work conducted elsewhere in the Directorate for Scientific Affairs on research8 and on education9, the document looked at information from an economic point of view: information as an economic asset. To the Committee, economic growth depended on scientific research and “the effective and rapid transmission of research results”. The exchange of scientific and technical information concerned scientists themselves, but also transfers to the general public, which “is still not sufficiently science-conscious”, and to industry. Scientists, the public and industry were thus identified as the three targets of an information policy, particularly industry: “The constant growth of scientific knowledge demands a closer liaison between science and industry than ever before. Information is the pipeline through which discoveries and facts reach the technologist and engineer, as well as managers and skilled workers”10
To the committee, the problem of scientific and technical information was the vast volume and dispersion of scientific and technical output, hence the increasing need for fast and reliable abstracting and indexing services, and networks of communication centers. However, “the task of coping with the increasing volume and complexity of material is too great to be handled efficiently by individual countries. Therefore, the OECD needs to encourage and stimulate coordination
.
7 OECD (1962), The Function of OECD in the Field of Scientific and
Technical Information, SR(62)25. 8 OECD (1962), Economics of Research and Development, SR(62)15. 9 OEEC (1960), Investment in Education and Economic Growth, Paris;
OECD (1962), Policy Conference on Economic Growth and Investment in Education, Paris.
10 Ibid., p. 3.

302 The Making of Science, Technology…, 2009
among Member countries”11
The main task of the group, over the first years of its existence, was conducting reviews of information centers, facilities and exchanges in industrial sectors like ceramics and glass, shipbuilding, fuel and heat processes, textiles, pharmaceuticals, electronics and electrical engineering
. To this end, the Committee recommended the creation of an ad hoc group on scientific and technical information.
12. Then, in 1965, a more policy-oriented approach was suggested. “Most of the attention devoted by governments, or by national or international organizations to the problems of scientific and technical information has been detailed and piecemeal”13, commented the Committee for Scientific Research. The OECD itself had worked mainly on information for industry, with its sectoral reviews of facilities. Until then, “a scientific and technical information policy [was understood as] directed towards bridging the gap between science and industry”14. Now, the OECD was suggesting a “breath of approach”: the organization should concentrate on the study of national information systems, and its links to science and economic policies15. Information policy was defined as including “any aspect of government intervention in the management of national scientific and technical information matters”16
11 Ibid., p. 5.
.
12 OECD (1964), Sectoral Reviews of Scientific and Technical Information Facilities: Policy Note, SR(64)38.
13 OECD (1965), Ad Hoc Group for Scientific and Technical Information Policy, SR (65) 51, p. 2.
14 OECD (1962), The Function of OECD in the Field of Scientific and Technical Information, op. cit., p. 2.
15 OECD (1965), Sectoral Review of Scientific and Technical Information, SR(65)15.
16 OECD (1966), Résumé of the Principal Action Resulting from the London Meeting, Held on 21st and 22nd March, 1966, DAS/CSI/66.74. See also: OECD (1966), Scientific and Technical Information and the Policies of Governments: Revised Synopsis, DAS/CSI/66.298, p. 4.

The Making of Science, Technology…, 2009 303
The Ad Hoc Group on Information Policy (1965)
At the suggestion of the American delegate, the Committee for Scientific Research created an ad hoc group on scientific and technical information policy. To the OECD, “scientific and technical information plays an integral part not only in the conduct of research and development but also in their application, as a factor in the innovation process. The significance of this is, of course, widely realized and many countries are already paying special attention to improving the flow of information However, the magnitude of the costs involved raises important problems for government”17
To the OECD, the problem with scientific and technical information was twofold. First, there was what the organization called the information explosion (other terms used were information deluge, information confusion, and information chaos) (Table 17). To the OECD, “the number of scientists and the amount they publish are increasing dramatically. More than 50,000 scientific journals are published regularly, containing more than a million scientific articles (...). The situation is complicated further by the presence of an unknown but increasing (and increasingly important) number of unpublished reports (...). Hence the problem: to tame and organize this growing mass of words and paper into a form that facilitates the transfer of the information”
.
18
Table 17. OECD Vocabulary
.
Computer Revolution Information Deluge Information Economy
Information Age Information Explosion Information Society
Information Gaps Information Chaos Network Society
Awareness Gap Information Confusion Digital Economy
Information Pollution
17 OECD (1965), Ad Hoc Group for Scientific and Technical Information
Policy, op. cit., p. 2. 18 OECD (1966), Scientific and Technical Information and the Policies of
Governments: Revised Synopsis, op. cit., p. 2.

304 The Making of Science, Technology…, 2009
Information Overload
Overabundance of Information
The second part of the problem with information was technologies. Although “the computer provides the only possible means of bringing order out of the information chaos”19, the proliferation of information systems suggested the danger of an uncoordinated development: “A variety of local and national services have sprung up in particular fields to solve particular tactical problems (...)20. However, “the uneven development of the new systems in different countries is leading to a potential information gap”21. Therefore, “the development of a coherent system and a strategy is needed, and only governments have the breadth of responsibility and resources to attempt this”22. The OECD thus called for the development of national information policies where, “in each Member country, there should be one [and only one] office charged with the overall responsibility” of coordinating information development nationally23
Briefly stated, the rhetoric on scientific and technical information at the OECD was threefold: 1) there is an information explosion; 2) new technologies can help bring order; 3) but there is need for a common approach (system compatibility and standards) and a single body in
. For its part, the OECD should provide members with an “international mechanism to promote co-ordination and agreement in establishing comprehensive and compatible information systems”.
19 OECD (1967), Scientific and Technical Information Systems and
Policies, DAS/SPR/67.109, p. 7. 20 OECD (1966), Scientific and Technical Information and the Policies of
Governments: Revised Synopsis, op. cit., p. 2. 21 OECD (1967), Scientific and Technical Information Systems and
Policies, op. cit., p. 2. 22 OECD (1966), Scientific and Technical Information and the Policies of
Governments: Revised Synopsis, op. cit., p. 2. 23 Ibid., p. 5. This recommendation would be reiterated at the third
ministerial meeting on science in 1968.

The Making of Science, Technology…, 2009 305
member countries for national policy. “Failure to take such a co-ordinating action, besides the certainty of wasteful duplication of resources, will mean increased costs, reduced efficiency, delayed application and, above all, information gaps”24
The first step toward an OECD program of work was collecting information on international organizations active in the field,
.
25 and the different national systems of scientific and technical information, with indications on the flow of funds and sums of money26. Reviews of national information policies were also initiated27
The Economics of Information Panel (1965)
. The next step was developing statistics for policy-makers.
During its very first meeting in 1965, the ad hoc group decided to set up a panel of experts on the economics of information28. The group argued that data in the field were at present notoriously deficient, among them those on the inventory of national information facilities, their cost and their effectiveness. Already in 1963, the national delegates to the Committee for Scientific Research asked for a study on money devoted to scientific and technical information29
24 OECD (1967), Scientific and Technical Information Systems and
Policies, op. cit., p. 12.
, to be conducted in close liaison with the research and development (R&D) survey, as conventionalized in the OECD methodological manual
25 OECD (1965), Information Activities of Some Major International Organizations, SR(65)52.
26 OECD (1966), Organigrammes des systèmes nationaux d’information, DAS/CSI/66.81.
27 Canada (1970), Ireland (1972), Switzerland (1973), Spain (1973), Germany (1975).
28 OECD (1966), The Economics of Information, DAS/CSI/66.173. 29 OECD (1963), Minutes of the 7th Session, SR/M (63) 2. Once finalized,
the survey would be transferred to the statistical division of the Directorate for Scientific Affairs, and its results would provide a chapter in the biennial report on R&D.

306 The Making of Science, Technology…, 2009
known as the Frascati manual. Now, such economic studies were judged essential “for the efficient allocation of the national information budget”. “The task given to [the Economics of Information] panel is to provide, for these people (especially in government) who have to take decisions in the field of information, the economic elements which should form an important part of the bases for these decisions”30. A plan of action was drafted in 196631
The Secretariat recommended that governments give high priority to the task of measuring scientific and technical information and offered proposals for a specific survey “to supply governments with a solid statistical foundation on which to build their national policy”
, centered around two main components: 1) identifying the processes by which information is transferred from research to users and measuring cost and effectiveness, and 2) developing standards on data to be collected. To the OECD, the unit of information for measurement was defined as “a scientific article, an abstract or a report”, and the studies’ suggested coverage include all sectors of the economy: government, higher education, industry and non profit.
32. Until then, “several countries had expressed reluctance to make available figures of national expenditure on information, because of the lack of accepted definitions”33
30 OECD (1967), Scientific and Technical Information Policy Group:
Summary Record of the 7th Meeting Held in Paris on 26th and 37th June, 1967, RC (67) 15, p. 15.
. As a consequence, a model survey was sketched out with the aim of complementing “the data obtained by means of the R&D survey. The purpose was to show the relationship between research costs and information costs and served as a basis
31 OECD (1966), Plan of Action, DAS/CSI/66.209. 32 OECD (1968), Survey of Scientific and Technical Information Activities,
DAS/SPR/68.35, p. 2. 33 OECD (1967), Scientific and Technical Information Policy Group:
Summary Record of the 7th Meeting Held in Paris on 26th and 27th June, 1967, RC (67) 15, p. 5.

The Making of Science, Technology…, 2009 307
for a study of cost/effectiveness ratios of information facilities”. Data to be collected were34
- Total resources allocated to scientific and technical information.
:
- Allocation of resources by economic sector (business, government, non-profit and higher education).
- Distribution of resources by type of activity: publication and distribution, information and documentation services, symposia and audio-visual media, R&D in information.
- Services: function, resources, equipment and staff.
- Manpower employed by major professional category.
To conduct this work, two studies were contracted. One was to H. Paschen from the Heidelberg Studiengruppe fur Systemsforschung to measure the resources devoted to scientific and technical information (manpower and money), based on the model for R&D (Frascati manual), and another was to J. Wolfe from Edinburgh University on cost/effectiveness ratios of information services.
The task proved difficult. After two years of work, the OECD concluded that the compilation of data on manpower and money devoted to scientific and technical information had been harder than originally imagined: there was little experience for guidance, the field was vast, the transfer of information followed diverse routes, services were extremely diversified and therefore difficult to locate and classify, few countries (except the United States) possessed agencies which could provide information. Several national delegates criticized the first draft of a questionnaire (produced by the German Studiengruppe) because it seemed to them too detailed, answers difficult to find, and it was “not certain how far these would have a
34 OECD (1968), Survey on Scientific and Technical Information Activities,
op. cit., p.5.

308 The Making of Science, Technology…, 2009
direct bearing on government decisions”35. The Information Policy Group also “expressed its anxiety that progress seemed to be slow in the two studies, and that the Studiengruppe questionnaire seemed complex to the point that it might be difficult to apply in practice”36
The panel on the economics of information thus suggested a limited list of basic data for collection (see Appendix 7)
.
37. The Information Policy Group decided to continue with the cost/efficiency ratio study of Wolfe38, but gave priority to a methodological manual and recommended that some countries test the methodology39. The manual was finalized in 196940
35 OECD (1968), Scientific and Technical Information Policy Group:
Summary Record of the 9th Meeting Held in Paris on 17th and 18th July, 1968, RC(68)15, p. 16.
. It proposed a definition of scientific and technical information as R&D output and their applications, and defined scientific and technical information activities as “those involved in the transfer of scientific and technical information to the users”. They include “all management, administrative, and operational efforts directed to the planning, support, control, performance, and improvement of the functions or tasks which deal with the processing, handling and communication of scientific and technical information”. Having defined scientific and technical information and its activities, the manual identified four specific classes of scientific and technical information activities: 1) recording, 2) editing, revising, translating, etc. 3) distribution (including conferences), 4) collection, storage and processing, and
36 OECD (1968), Scientific and Technical Information Policy Group: Summary Record of the 9th Meeting, RC (68) 15, p. 6.
37 OECD (1969), Information Statistics and Policy: The Next Steps, DAS/STINFO/69.10.
38 Finalized in 1971. See: J. Wolfe (1971), The Economics of Technical Information Systems: A Study in Cost-Effectiveness, DAS/STINFO/71.17.
39 OECD (1969), Economics of Information Progress Report and Plan for Future Action, DAS/STINFO/69.25.
40 OECD (1969), Proposed Standard Practice for Surveys of Scientific and Technical Information Activities, DAS/STINFO/69.9.

The Making of Science, Technology…, 2009 309
5) acquisition. The manual recommended surveying institutions involved in activity 4 (Table 18). Finally, the manual proposed classifications for money and manpower involved in these activities (breakdown by economic sector41
The manual was tested in several countries, and vehemently criticized at a meeting held in Oslo in 1971
, discipline, aim or function, institution size, information system used and type of user), methodological guidelines and model questionnaires.
42. The manual was qualified as too complicated and too clumsy and not providing governments with basic statistical data to formulate a scientific and technical information policy43. In fact, many countries preferred to go with their own version of a questionnaire. The Scientific and Technical Information Policy Group concluded on the “lack of realism of the methodology proposed. An overall approach similar to that of the R&D surveys is practically unattainable”, but the methodology serves only as a starting point44
Table 18. Transfer Institutions to be Surveyed According to the OECD Draft Manual on Scientific
and Technical Information
.
Library General Special Technical
Document Center 41 With regard to the industrial sector, it was suggested excluding radio and
television because “little scientific and technical information is transferred”. Despite the recommendation, this industry would be included in the measurements of the 1970s.
42 OECD (1972), Notes on the Meeting of Countries Collecting Statistics on Resources Devoted to STI, DAS/STINFO/72.22.
43 OECD (1973), Collection of Statistical Data on STI, DAS/SPR/73.94; OECD (1973), Economics of Information: Summary Record of an ad hoc meeting held in Paris on 5th and 6th November, 1973, DAS/STINFO/73.18.
44 OECD (1972), Notes on the Meeting of Countries Collecting Statistics on Resources Devoted to STI, op. cit., p. 6.

310 The Making of Science, Technology…, 2009
Archives Abstract Service Technical Information Center Information Evaluation Center Data Center Referral Center Clearinghouse
By 1973, the panel on the economics of information itself concluded that the draft manual was “only an example: it should be modified for use, in the light of national needs”. It also added that data on manpower and money alone are insufficient. Other indicators should be identified and defined45. “Before fixing on a methodology, it is necessary to identify the essential data and to define the indicators that are needed”46. A steering group was thus created in 1974 to “identify the minimum data needed by countries to manage their information policies”47 and a first meeting was held in October of that year48
In the end, the two instruments – the methodological manual and the list of indicators –never were used to measure scientific and technical information at the OECD
. A list of elementary statistics, some of them already collected in member countries, was drawn up covering financial resources, manpower, information produced and used, computers and communications, and users (see Appendix 8).
49
45 OECD (1973), Economics of Information: Summary Record of an ad hoc
meeting held in Paris on 5th and 6th November, 1973, op. cit.
. Two factors explained the organization’s
46 Ibid., p. 3. 47 OECD (1974), Statistics, Time Series and Indicators for Scientific and
Technical Information, DAS/STINFO/74.16. 48 OECD (1974), Steering Group on Indicators for STI: Summary Record of
the first meeting of the Group Held on 24th and 25th October, 1974, DAS/STINFO/74.28.
49 A second manual was also envisaged on costs/effectiveness, but never developed. See: OECD (1975), STINFO: Summary Record of the 24th Meeting, DSTI/STINFO/75.19, p. 6; STINFO: Summary Record of the 25th Meeting, DSTI/STINFO/75.33, p. 7.

The Making of Science, Technology…, 2009 311
failure in measuring scientific and technical information. The first and most important was the absence of a conceptual framework to guide statisticians. Whereas other measurement exercises conducted in the Directorate were based on a framework that helped orient the collection of statistics, namely the highly-popular accounting framework50, statistics on information at the OECD were entirely driven by a rhetoric on the information explosion. The rhetoric relied on findings like those of D. D. S. Price on the exponential growth of the literature on the topic51, and the emerging literature on the growth of scientific publications52, of which the British left-wing scientist J. D. Bernal was an active advocate of the management53
50 The framework was already used at OECD in studies on R&D, where the
surveys were aligned with the System of National Accounts by way of the Frascati manual, and studies on education, which relied on the then-new theory on human capital.
. To Bernal, the system of scientific publications “was an enormous and chaotic
51 D. D. S. Price (1951), Quantitative Measures of the Development of Science, Archives internationales d’histoire des sciences, 5, p. 85-93; D. D. S. Price, (1956), The Exponential Curve of Science, Discovery, 17, p. 240-243; D. D. S. Price (1961), Science since Babylon, New Haven: Yale University Press; D. D. S. Price (1963), Little Science, Big Science, New York: Columbia University Press. In 1971, the OECD commissioned a study on forecasting growth in scientific and technical information (see G. Anderla (1973), Information in 1985: A Forecasting Study of Information Needs and Resources, Paris: OECD) which served as a basis for a workshop held in 1973, in which Price participated (see OECD (1974), Information in 1985: Notes on a Workshop Held in Paris, 101-12 December 1973, DAS/STINFO/74.2).
52 The first important conferences on the subject were: Royal Society (1948), The Royal Society Scientific Information Conference: Reports and Papers Submitted, London: Royal Society; National Academy of Sciences (1959), Proceedings of the International Conference on Scientific Information, Two volumes, Washington: National Academy of Sciences.
53 J. D. Bernal (1939) [1973], The Social Function of Science, Cambridge (Mass.): MIT Press, p. 292-308; J. D. Bernal (1948), Provisional Scheme for Central Distribution of Scientific Publications, in Royal Society, The Royal Society Information Conference, op. cit., p. 253-258.
312 The Making of Science, Technology…, 2009
structure”54, and a centralized institute was much needed. To Price, science was “near a crisis” because of the proliferation and superabundance of literature55, a monster as he called it56. “Some radically new technique must be evolved if publication is to continue as a useful contribution”57. The Information Policy Group listened, and flirted with the idea of a European clearinghouse as a single point of entry through which documents passed, discussed a network of referral centers and contracted studies on specialized information systems (physics, chemistry, medicine and social sciences). However, framed as it was, the issue was entirely concerned with science and scientists, not technology and innovation58
The second factor at the origin of the failure was the fuzziness of the concept of information itself. To mathematicians and physicists
. It was not enough to construct relevant and meaningful statistics for policies. Measuring the stock of information and its growth was only peripherally related to the needs of policy-makers…and those of an economic organization (the OECD).
59
54 Ibid., p. 117. This is the first occurrence in the literature of the term chaos
in this context.
,
55 D. D. S. Price (1961), Science since Babylon, op. cit., p. 124. 56 Ibid., p. 104. 57 D.D.S. Price (1956), The Exponential Curve of Science, op. cit., p. 524. 58 However, it gave rise to a literature on information flows in R&D and,
later, technology transfer. Pioneering studies were: Bureau of Applied Social Research (1958), The Flow of Information Among Scientists: Problems, Opportunities, and Research Questions, report prepared for the National Science Foundation, Columbia University; T. J. Allen (1966), Performance of Information Channels in the Transfer of Technology, Industrial Management Review, 8, p. 87-98; D. G. Marquis and T. J. Allen (1966), Communication Patterns in Applied Technology, American Psychologist, 21, p. 1052-1060; T. J. Allen (1969), The Differential Performance of Information Channels in the Transfer of Technology, in W. H. Gruber and D. G. Marquis (eds.), Factors in the Transfer of Technology, Cambridge (Mass.): MIT Press, p. 137-154.
59 N. Wiener (1948), Cybernetics: Or Control and Communication in the Animal and Machine, Cambridge (Mass.): MIT Press; C. E. Shannon (1948), The Mathematical Theory of Communication, Bell System Technical Journal, 27 (3-4), p. 379-423; C. E. Shannon and W. Weaver

The Making of Science, Technology…, 2009 313
biologists60 and economists61
(1949), The Mathematical Theory of Communication, op. cit.; N. Wiener (1950), The Human Use of Human Beings: Cybernetics and Society, Boston: Houghton Mifflin.
, to name just a few disciplines, information means different things, and is often a metaphor. In his pioneering work titled The Production and Distribution of Knowledge in the United States (1962), F. Machlup tried to make sense of the concept and distinguished knowledge from information with the verb form: “to inform is an activity by which knowledge is
60 H. Quastler (1953), Essays on the Use of Information Theory in Biology, Urbana: University of Illinois Press; J. D. Watson and F. Crick (1953), Genetical Implications of the Structure of Deoxyribonucleic Acid, Nature, 171, p. 964-967. For a contemporary debate on information and biology, see the paper from J. Maynard Smith and comments from K. Sterelny, P. Godfrey-Smith, and S. Sarkar in Philosophy of Science, 67 (2) 2000, p. 177-218.
61 On information as knowledge in economics, see: F. Hayek (1937), Economics and Knowledge, Economica, 4, p. 33-54; F. Hayek (1945), The Use of Knowledge in Society, American Economic Review, 35 (4), p. 519-530; F. Hayek (1978), Competition as a Discovery Procedure, in New Studies in Philosophy, Politics, Economics and the History of Ideas, London: Routledge, p. 179-190; G. J. Stigler (1961), The Economics of Information, Journal of Political Economy, LXIX (3), p. 213-225; J. E. Stiglitz (1974), Information and Economic Analysis, in M. Parkin and A. R. Nobay (eds.), Current Economic Problems, Cambridge: Cambridge University Press, p. 27-52; J. E. Stiglitz (1985), Information and Economic Analysis: A Perspective, Economic Journal, 95, p. 21-41; K. J. Arrow (1962), Economic Welfare and the Allocation of Resources for Invention, in NBER, The Rate and Direction of Inventive Activity, Princeton: Princeton University Press, p. 609-625; K. J. Arrow (1973), Information and Economic Behavior, Lecture Given at the 1972 Nobel Prize Celebration, Stockholm: Federation of Swedish Industries; K. J. Arrow (1974), Limited Knowledge and Economic Analysis, American Economic Review, 64, p. 1-10; K. J. Arrow (1979), The Economics of Information, in M. L. Dertouzos and J. Moses (eds.), The Computer Age: A Twenty-Year View, Cambridge (Mass.): MIT Press, p. 306-317; K. E. Boulding (1966), The Economics of Knowledge and the Knowledge of Economics, American Economic Review, 56 (1-2), p. 1-13; J. Marschak (1968), Economics of Inquiring, Communicating, Deciding, American Economic Review, 58 (2), p. 1-18; J. Marschak (1974), Economic Information, Decision and Prediction, Dordrecht: Reidel.

314 The Making of Science, Technology…, 2009
conveyed; to know may be the result of having been informed”62. One is a process, an activity, while the other is a state, a result. But, added Machlup, “information as that which is being communicated becomes identical with knowledge in the sense of that which is known”. Machlup therefore recommended, whenever possible, the use of the word knowledge63
At the OECD, early measurements of information had two characteristics. First, information was limited to scientific and technical information, and second, information was measured as documentation. This was a rather restrictive definition compared to Machlup’s five classes of information or knowledge: practical, intellectual, entertainment, spiritual and unwanted
. However, his suggestion did not resolve the issue. In the following decades, every measurement exercise that followed in Machlup’s footsteps used the terms information and knowledge interchangeably.
64. Defined as knowledge, the measurement of information included, to Machlup: education, R&D, media of communication (documentation, including audio-visual media), and information machines and services. Machlup’s measurement was based on a policy-oriented framework, namely an accounting framework, using the System of National Accounts classes and data to estimate money and manpower devoted to information activities. This was a far cry from OECD work on scientific and technical information and its specific surveys. From 1969 on, there had been frequent suggestions from national delegates to redirect the then-current work of the OECD statisticians65
62 F. Machlup (1962), The Production and Distribution of Knowledge in the
United States, Princeton: Princeton University Press, p. 15.
. The
63 Ibid., p. 8. 64 Ibid., p. 21-22. 65 OECD (1969), Draft Proposals for a Change in the Orientation of the
Programme of the Working Panel on the Economics of Information, DAS/STINFO/69.27; OECD (1969), Proposed Developments in the Programme of the Working Panel on Management/Economics of Information, DAS/STINFO/69.45; OECD (1971), New Activities in Management and Economics of Information, DAS/STINFO/71.27.
The Making of Science, Technology…, 2009 315
malaise was only partly understood and only partly explicit, and the critics had little success.
The OECD was not alone in experiencing limited success in measuring scientific and technical information. UNESCO was another organization that left the field after some preliminary work. In its efforts to extend the range of science, technology and innovation indicators in order to better cover developing countries’ activities, UNESCO drafted a methodological guide for measuring scientific and technical information and documentation (STID). The guide was tested in seven countries, and published in a provisional version in 198466. It was based on a study written for UNESCO in 1979 by D. Murphy from the Irish National Science Council67
- specialized libraries and centers;
. The guide defined scientific and technical information and documentation as “the collection, processing, storage and analysis of quantitative data concerning information activities (…)”. To UNESCO, the principal items to be measured were the institutions and individuals performing these activities, the amount of financial resources and physical facilities available, and the quantity of users. Three types of respondents were identified for surveying: 1) producers, 2) collectors, processors and disseminators, and 3) users. The first stage of measurement was to collect information on the second type of institutions only, namely:
- national libraries and libraries of higher education, referral centers;
- editing, publishing, printing, consulting and advisory services and enterprises.
66 UNESCO (1984), Guide to Statistics on Scientific and Technological
Information and Documentation (STID), ST-84/WS/18, Paris. 67 D. Murphy (1979), Statistics on Scientific and Technical Information and
Documentation, PGI-79/WS/5, Paris: UNESCO.

316 The Making of Science, Technology…, 2009
In the end, UNESCO never did collect data on information. In fact, few countries were interested in these activities. Measuring R&D remained the priority. A meeting of experts on the methodology of collecting data on scientific and technical information and documentation activities was held in 1985 to assess the lessons learned from the pilot surveys. It was reported that the activities were not deemed all that important or urgent, that the purpose for measuring them was not obvious, and that there were difficulties in interpreting the definition68
Both the OECD and UNESCO were preceded in their efforts by another organization, the US National Science Foundation. The Foundation, a pioneering agency in this field that produced work that greatly influenced the OECD
.
69, abandoned a similar methodology after twenty years of data collection. From its very beginning in the 1950s, the National Science Foundation conducted regular surveys of R&D, among them surveys on government research. The results were published in a document titled Federal Funds for Science70. R&D data included “other scientific activities” (later called related scientific activities), as did most surveys conducted at the time in other countries. But these activities were not separated from R&D activities. Then in 1958, the National Science Foundation published Funds for Scientific Activities in the Federal Government71
68 UNESCO (1985), Meeting of Experts on the Methodology of Data
Collection on STID Activities, 1-3 October 1985, Background Paper, ST-85/CONF.603/COL.1, Paris, p. 26-29.
. The
69 The ad hoc group on scientific and technical information (1962) was chaired by B. W. Adkinson from the National Science Foundation. The ad hoc group on information policy (1965) was created at the suggestion of the US delegate. The Foundation approach (definition and list of scientific and technical information activities) was adopted as a model by both the German Studiengruppe and the steering group on indicators.
70 National Science Foundation (1953), Federal Funds for Science, Government Printing Office: Washington.
71 National Science Foundation (1958), Funds for Scientific Activities in the Federal Government, Fiscal Years 1953 and 1954, NSF-58-14, Washington.

The Making of Science, Technology…, 2009 317
publication was, among other things, a re-analysis of the 1953-54 data. Scientific activities were presented as being broader than R&D alone, and were defined as the “creation of new knowledge, new applications of knowledge to useful purposes, or the furtherance of the creation of new knowledge or new applications” (no page number). The activities were broken down into seven classes, the first three, R&D, planning and administration, and plant defining R&D, and the last four, data collection, dissemination of scientific information, training, and testing and standardization defining “other scientific activities”. It was estimated that “other scientific activities” accounted for $199 million, or 7.8% of all scientific activities. Of these, data collection was responsible for nearly 70%, and information 6.5%, but the latter was said to be greatly underestimated, by a factor of at least three.
Subsequent editions of Federal Funds for Science (renamed in 1964 as Federal Funds for R&D and Other Scientific Activities) included data on scientific and technical information, and, for a shorter period, general-purpose data collection. Over time, detailed sub-classes were developed for each of these categories, reaching a zenith in 1978 when scientific and technical information alone had four subclasses which were in turn subdivided into eleven other subclasses (Table 19)72
The National Science Foundation stopped collecting data on “other scientific activities” with the 1978 edition of Federal Funds. Why did organization abandon the measurement of scientific and technical information activities? The first reason has to do with the magnitude of the activities. Over the period 1958-1978, the surveys reported that information and data collection represented only about 1% to 2% of
.
72 National Science Foundation (1978), Federal Funds for R&D and Other
Scientific Activities: Fiscal Years 1976, 1977, 1978, NSF-78-300, Washington.

318 The Making of Science, Technology…, 2009
federal government scientific activities. A survey of such a low volume of activities was not considered worth the effort73
Table 19. Scientific and Technical Information According to NSF (1978)
.
Publication and distribution Primary publication Patent examination Secondary and tertiary publication Support of publication Documentation, reference and information services Library and reference Networking for libraries Specialized information centers Networking for specialized information centers Translations Symposia and audiovisual media Symposia Audiovisual media R&D in information sciences
It was not worth the effort considering that, secondly, the National Science Foundation began publishing Science Indicators (SI) in 197374
73 A survey on scientific and technical information in industry was also
planned as early as 1964 but was never, to the best of my knowledge, conducted. In 1961, however, the NSF conducted the first survey on publication practices in industry. See: NSF (1961), Publication of Basic Research Findings in Industry, 1957-59, NSF 61-62, Washington.
. Everyone applauded the publication, including Congress and the press. Among the indicators that soon appeared in SI for measuring science, technology and innovation were what were considered to be good statistics on scientific information – at least as far as the United States was concerned: counting publications (bibliometric indicators). The National Science Foundation’s Division of Science Information had commissioned three studies “to develop and initiate a system of statistical indicators of scientific and technical communication”. One dealt with measuring scientific and
74 National Science Board (1973), Science Indicators: 1972, Washington: National Science Foundation.

The Making of Science, Technology…, 2009 319
technical information activities in the traditional sense (expenditures, products and services offered by libraries), plus some indicators on publications (growth of literature, citations)75. The other two focused on bibliometrics exclusively76
Such was the fate of the early measurements of information in public organizations. In the following decades, the measurement of scientific and technical information activities (manpower and money) in their survey of government R&D was limited to very few countries. Measuring information as documentation became the province of bibliometricians, whereas official statisticians were totally absent as producers of data, but were (reluctant) users. The revival of the measurement of information at the OECD was due to a factor external to the organization: an accounting framework developed by the American M. U. Porat from Stanford University.
. This last option prevailed at the National Science Foundation.
THE INFORMATION ECONOMY
In 1977, Porat, in collaboration with M. R. Rubin, published a nine-volume study titled The Information Economy as part of work done for the US Department of Commerce and its Office of Telecommunications77
75 King Research Inc. (1976), Statistical Indicators of Scientific and
Technical Communication: 1960-1980, three volumes, Washington: National Science Foundation. Some of the statistics from the report were included in National Science Foundation (1977), Science and Engineering Indicators: 1976, Washington, p. 59-63.
. Porat took the information economy for
76 F. Narin (1976), Evaluative Bibliometrics: The Use of Publications and Citation Analysis in the Evaluation of Scientific Activity, Report prepared for the National Science Foundation, New Jersey: Computer Horizons Inc.; National Federation of Abstracting and Indexing Services (1975), Science Literature Indicators Study, Report prepared for the National Science Foundation, Philadelphia: National Federation of Abstracting and Indexing Services.
77 M. U. Porat and M. R. Rubin (1977), The Information Economy, Office of Telecommunications, US Department of Commerce, Washington.

320 The Making of Science, Technology…, 2009
granted, and did not really develop a rationale for studying it. His aim was simply to measure it. Porat took for granted the fact that the United States has evolved “from an economy that is based primarily in manufacturing and industry to one that is based primarily in knowledge, communication and information”78. To Porat, the rationale for studying the information economy had already been offered by F. Machlup79, D. Bell80, and P. Drucker81, and Porat acknowledged his debt to these authors: “Most of the basic insights and concepts motivating this study were established in Fritz Machlup’s groundbreaking book on the knowledge industries. [Machlup] provides an empirical backdrop to subsequent work by Daniel Bell, Peter Drucker and others”82
To Porat, “information is data that have been organized and communicated. The information activity includes all the resources [capital and labor] consumed in producing, processing and distributing information goods and services”
.
83. Defined as such, information covered all kinds of information, not only scientific and technical information: “The end product of all information service markets is knowledge. An information market enables the consumer to know something that was not known beforehand: to exchange a symbolic experience; to learn or relearn something; to change perception of cognition; to reduce uncertainty; to expand one’s range of options; to exercise rational choice; to evaluate decisions; to control a process; to communicate an idea, a fact, or an opinion”84
78 M. U. Porat (1977), The Information Economy, volume 1, Office of
Telecommunications, US Department of Commerce, Washington, p. 1.
.
79 On Fritz Machlup, see: B. Godin (2007), The Knowledge Economy: Fritz Machlup’s Construction of a Synthetic Concept, forthcoming.
80 D. Bell (1973), The Coming of Post-Industrial Society: A Venture in Social Forecasting, New York: Basic Books.
81 P. Drucker (1968), The Age of Discontinuity: Guidelines to Our Changing Society, New York: Harper and Row.
82 M. U. Porat (1977), The Information Economy, op. cit., p. 44. 83 Ibid., p. 2. 84 Ibid., p. 22.
The Making of Science, Technology…, 2009 321
To Porat, measuring information was a difficult task, because information is not a sector per se but an activity: “Information is not a homogeneous good or service such as milk or iron ore. It is a collection or a bundle of many heterogeneous goods and services that together comprise an activity”85. To measure the information economy, Porat used an accounting framework, as first suggested by Machlup, aggregating different industrial classes into an information field. However, according to Porat, there existed significant methodological differences between Machlup’s approach and the one set forth in his work. Porat used value-added instead of final demand as indicator of the volume of information, and separated information into two sectors: primary (production) and secondary (consumption)86
Porat calculated two estimates, one for each sector, and added them to get a total value of information in the economy. The primary information sector was defined as being composed of eight broad categories of industries corresponding to many specific industrial classes
.
87, and was constructed from the System of National Accounts data and its derived input-output tables. Porat estimated that the information sector grew from around 18% of national income in 1929 to 25.1% in 196788. He also estimated the information workers involved in this activity. Using a typology consisting of five broad classes of workers and constructed from occupational classes used by the US Bureau of Labor Statistics, Porat estimated that the information sector increased from less than 10% of all of the workforce in 1860 to over 40% in 1970, representing 53% of all labour income89
85 Ibid., p. 2.
. With regard to the secondary information sector (which included information services produced by non-information
86 Ibid., p. 44. This kind of separation of activities in statistics was anticipated by Fritz Machlup. See F. Machlup (1962), The Production and Distribution of Knowledge in the United States, op. cit., p. VI.
87 Ibid., p. 27-28. 88 Ibid., p. 65. 89 Ibid., p. 119.

322 The Making of Science, Technology…, 2009
firms and public organizations and consumed internally), Porat used the Bureau of Labor Statistics classification of occupations, computing that it amounted to 21% of GNP in 196790
The Working Party on Information, Computer, and Communications Policy (1976)
. Overall, for the two sectors combined, the information economy amounted to 46% of GNP and 53% of labour income in the United States. These were the numbers that astonished the OECD bureaucrats.
The concept of an information economy and its accounting provided the OECD with a solution to the recurrent problem of defining information and imagining a field of action. In fact, from 1969 on, several review groups were set up to formulate recommendations and to reorient the work of the organization toward what was called an integrated approach to information, namely looking at more horizontal issues like management, economics, legal aspects and education91. Progress was slow, and information lacked recognition within the Committee for Scientific Affairs92
Then, in February 1975, the OECD held a conference on Computers and Telecommunications Policy. The idea of a conference had been first proposed in 1973 to look at the development of computer and
.
90 Ibid., p. 154. 91 OECD (1971), Information for a Changing Society, Paris, known as the
Piganiol report; OECD (1971), Report of the Ad Hoc Group on Information, Computer and Communication, SP(71)19, known as the Whitehead report; OECD (1973), Report of the Coordination of the Information Policy Group, the Computer Utilization Group, and Related Activities on Information, Computer, and Communication, SPT(73)6; OECD (1973), Information Technology: Some Policy Issues for Governments, SPT(73)7; OECD (1976), Task Force on Information, Computer and Communication Policy Programme, SPT(76)7; OECD (1976), First report of the Ad Hoc Group on Information, Computer, Communication Policy, SPT(76)25.
92 OECD (1972), STINFO: Summary Record of the 18th Meeting, DASA/STINFO/72.37; OECD (1975), A New Approach, DSTI/CUG/75.25, p. 15.

The Making of Science, Technology…, 2009 323
telecommunication technologies and their role (or promise) as a “key industry”. The objectives of the conference were to understand the economic and social implications of new technologies, identify policies, and promote international cooperation93. The conference took notice of a structural transition from an industrial society to a post-industrial society with a strong service economy that is basically information-oriented. Such was the message from E. B. Parker from Stanford University in a communication to the conference that included a contribution from Porat94. To the OECD, such structural change in the economy required new tools for rational management, namely for the allocation of resources. But there was a lack of statistics and indicators to this end95
In order to participate in the new economy, the Secretariat thus suggested a new approach to work. It recommended a horizontal approach or framework to information
.
96. Here, it meant defining more clearly the information sector and its contribution to GDP, trade and employment by way of accounting and input-output matrices, as Parker and Porat suggested. In 1976, the OECD Committee for Science and Technology Policy (or CSTP, formerly the Directorate for Scientific Affairs) thus created a Working Party on Information, Computer, and Communications Policy (ICCP)97
93 OECD (1973), Conference on Computers/Telecommunications Policies:
Alternatives for Policy Makers, DAS/SPR/73.105.
. The Working Party integrated work conducted in different groups, among them the
94 E. B. Parker (1975), Social Implications of Computer/Telecommunications Systems, DSTI/CUG/75.1.
95 OECD (1975), Conference on Computers and Telecommunications Policy, SPT(75)3.
96 OECD (1975), Information, Computer, Telecommunications: A New Approach to Future Work, DSTI/STINFO/75.22.
97 OECD (1976), Draft Mandate of the ICCP Group, SPT(76)40; OECD (1977), Final Mandate of the Working Party on Information, Computer and Communications Policy, DSTI/ICCP/77.58.

324 The Making of Science, Technology…, 2009
Information Policy Group98. According to the then-director of the Directorate for Science, Technology and Industry, D. Beckler, “One of the objectives of this new body would be to define new interrelationships between the various components of this field”, i.e.: develop an integrated approach99. The group started as a Working Party, and became a Committee in 1982100
The first thing the Working Party did was develop a project on the “information economy” (sic) titled Macro-Economic Analysis of Information Activities and the Role of Electronic, Telecommunications and Related Technologies, first sketched out in 1973. The aim of the project was to analyze and quantify information activities, assess their growth and innovation potential, and investigate their socio-economic consequences
.
101
98 As well as the Computer Utilization Group, created in 1969, and a Panel
on Information Technology and Urban Management. A Panel on Data Bank continued on its own for few more years.
. According to the Working Party, “the rapid development and diffusion of advances in electronics (micro-electronics, micro-processors, the computer-on-a-chip) and telecommunications (broadband cable, satellites, laser) and related physical technologies such as optical and video systems, are becoming of critical importance for the industrialized countries. Indeed, it is argued that these technologies are an emerging national
99 OECD (1977), Draft Summary Record of the First Session, DSTI/ICCP/77.17, p. 2.
100 In 1978, the Secretariat General’s budget proposal suggested elevating the status of the group to a Division in the Directorate for Science, Technology and Industry. See OECD (1978), Draft Summary Record of the Fourth Session, DSTI/ICCP/78.30, p. 3. Then, in 1980, the French delegate, supported by several countries, proposed that a committee be set up (on the “informatization of society”). See OECD (1980), High Level Conference on Information, Computer and Communication Policies for the 1980s, DSTI/ICCP/80.38, p. 34.). In 1981, the CSTP proposed elevating the Working Party to a Committee. The Working Party became a Committee on its own (no longer attached to the Committee on Science and Technology Policy) in 1982.
101 OECD (1977), Macro-Economic Analysis of Information Activities and the Role of Electronic, Telecommunications and Related Technologies, DSTI/ICCP/77.5.

The Making of Science, Technology…, 2009 325
resource and thus the basis for further economic and social development”102. Above all, “advanced information technologies promise to introduce productivity increases for most information goods and services and contribute to overall productivity of an economy”103
The project proposed to identify and measure the consequences of the information sector on economic growth (productivity and value-added), changes in employment (transition from an industrial to an information society, automation, division of labour) and determine whether there was “concentration of these technologies and relevant industries within a few countries only”
. It was no longer the information explosion that guided the efforts of the OECD, but rather technologies and the “technological revolution”.
104. The general objective was to find empirical evidence for the emerging “information economy”, and to suggest policies. To the OECD, technological policies would have to be “distinct from the past where the simple desire to promote prestige projects and/or the “technological gap” argument was often justification enough to provide resources”105
According to the Working Party, the design and methodology of the studies should rely on a macro-economic analysis of information activities. To this end, the project needed clear definitions and, above all, an empirical approach that started at the micro-level – the company – not a theoretical approach like input-output matrices, since these were qualified as too global with a too-high degree of aggregation. “This requires considerably more than the exploitation
. Four major sub-projects were proposed: estimate the size and growth of the information sector, study the innovation potential of the technologies, develop indicators of economic, industrial and social impacts, and offer policy guidance and strategies.
102 Ibid., p. 3. 103 Ibid., p. 4. 104 Ibid., p. 7. 105 Ibid., p. 8.

326 The Making of Science, Technology…, 2009
of existing measurement and analysis techniques”106
The group of experts was established by the Committee for Science, Technology and Industry in 1977
. An expert group was thus suggested to support this work.
107, and the first meeting was held in March that same year108. An action plan followed109. To the expert group, what one observes is a “transition from industrial economies towards a post-industrial society, where the relative importance of industrial production (in the classical sense) and the size of the labor force employed in this sector is diminishing while the processing of large volumes of information for the management of our increasingly complex society is quantitatively and qualitatively gaining momentum”110. These transformations suggested a need for a new terminology and a definition of the information sector. The information sector, however, cuts across all sectors of the economy and is difficult to measure. Following Porat, “the Group recommends work to extract the information sector from the conventional labor force statistics and national accounts”, plus micro-economic studies of specific industrial sectors111. The action plan was approved at the second meeting of the group of experts in June 1977112
106 Ibid., p. 12.
. At that meeting, Porat was invited to summarize his work and present a
107 OECD (1977), Mandate of the Group of Experts on Economic Analysis of Information Activities and the Role of Electronic, Telecommunications and Related Technologies, DSTI/ICCP/77.37.
108 OECD (1977), Working Party on ICCP: Draft Summary Report, DSTI/ICCP/77.17.
109 OECD (1977), Preliminary Project Outline, Terms of Reference and Action Plan, DSTI/ICCP/77.33.
110 Ibid., p. 1. 111 Ibid., p.2 . 112 OECD (1977), Draft Summary Record of the Second Session,
DSTI/ICCP/77.39.

The Making of Science, Technology…, 2009 327
practical guide, or cookbook as he called it, for building the information sector’s accounts113. For its part, the Secretariat proposed guidelines for measuring the sector, based on Porat’s work114
The next meeting (December 1977) studied the guidelines proposed
. A questionnaire was then sent to countries on the availability of the statistics required to construct a “Porat type” analysis.
115, particularly in light of the report by a consultant, S. Wall (University of Cambridge, UK), who looked at national data available for conducting a “Porat type” analysis116. Wall’s conclusions were that “few countries have a convenient and detailed single source of data as yielded by the United States input-output worktape. Even Porat had to carry out a considerable amount of search. (…) In the case of studies seeking to replicate Porat’s work, the conclusion must be drawn that national researchers need to engage in a considerable amount of search activity”117
113 M. U. Porat (1977), Building a Primary and Secondary Information
Sector: A National Income Accounts Manual, DSTI/ICCP/77.26. See also: M. U. Porat (1978), Policy Uses of a Macroeconomic Model of the Information Sector and of Microeconomic Production Functions, DSTI/ICCP/78.18.
. Still, some immediate work was possible using existing nomenclature: information occupations might reasonably be extracted, and measurement from the national accounts of the sector’s value-added was feasible, for the marketed goods and services at least. Wall then presented a program of work separating responsibilities among different countries for a final report to be finished in less than a year (October 1978). Members of the group agreed.
114 OECD (1977), Definitions and Data to Build Information Sector Accounts, DSTI/ICCP/77.40. The final guidelines can be found in OECD (1978), Work Programme for Deriving Comparative Information Sector Statistics, DSTI/ICCP78.4.
115 OECD (1978), Draft Summary Record of the Third Session, DSTI/ICCP/78.3
116 S. Wall (1977), A Preliminary Analysis of Country Replies to Questionnaire, DSTI/ICCP/77.52.
117 OECD (1978), Draft Summary Record of the Third Session, DSTI/ICCP/78.3, p. 5.

328 The Making of Science, Technology…, 2009
The results were presented at the High Level Conference on ICCP for the 1980s118, and published in two volumes in what was known as the Red ICCP reports series in 1981119. A major question, reported the document, “was to know whether these changes [information economy] occurred only in the United States or whether they constituted a more general trend”120. According to the OECD, “there [was] increasing concern in Europe about the so-called “information gap” between Europe and the United States”121. Nine countries for which data were available were studied122. Using Porat’s typologies, method and classifications, the OECD estimated that the primary sector of information amounted to 20.3% of total value-added, and that over a third of professions were concerned with information. Furthermore, 30% of trade in manufacturing goods was concerned with information commodities. To the OECD, the data confirmed that a structural change was happening in OECD economies: a progressive shift toward an information economy, at least on the supply side (production of goods and services). On the demand side, however, “consumption of information goods and services is still playing a fairly minor role in the budget of the average household”123
118 ICCP: Information, Computers, and Communication Policy.
.
119 OECD (1981), Information Activities, Electronic and Telecommunications Technologies: Impact on Employment, Growth and Trade, Paris.
120 Ibid., p. 3. 121 OECD (1978), Draft Summary Record of the Fourth Session,
DSTI/ICCP/78.30, p. 3. 122 Germany, Austria, Canada, United States, Finland, France, Japan, United
Kingdom and Sweden. 123 OECD (1981), Information Activities, Electronic and
Telecommunications Technologies, op. cit., p. 12.

The Making of Science, Technology…, 2009 329
The Group of Experts on ICC Statistics (1982)
The exercise on the information economy proved difficult124. According to the OECD, “the methodological problem stems from the fact that information, computers and communication (ICC) activities have to be considered as an object of study per se whereas general statistics pay them no special attention”125. “The current system of national accounts emphasizes older, mature or even declining economic activities and provides only little information on emerging new industries and new employment. The decision on what constitutes a major “industry” was made in the 1930s. This explains why agriculture and extracting industries are major industries. By contrast, digital computers which did not exist when the classification schemes were set up, appear as part of the non-electrical machinery group. Microprocessors do not have a code at all (…), software is not mentioned either”126. For these reasons, “it proved almost impossible to collect data on the growth of what was called the “information sector. It was only possible to extract from official sources a limited number of data on employment, output growth and trade in information technology goods and services to plot rough trends (…). These trends were much questioned and indeed were too weak for policy analyses and policy formulations”127
124 See Chapter 2 of OECD (1981), Information Activities, Electronics and
Telecommunications, Volume 2, Paris.
.
125 OECD (1982), Proposal for the development of a statistical system in the field of information, computer and communications, DSTI/ICCP/82.25, p. 1.
126 OECD (1984), Proposed Scope of Project on ICC-Statistics, ICCP (84) 6, p. 3.
127 Ibid., p. 4. An expert group on transborder data flows experienced similar problems. See: OECD (1979), Note on Approaches to the Quantification of Transborder Flows of Non-Personal Data, DSTI/ICCP/79.10; OECD (1979), Transborder Flows of Non-Personal Data: Questionnaire, DSTI/ICCP/79.18; OECD (1979), Replies to Questionnaire on Flows of Non-Personal Data, DSTI/ICCP/79.49.

330 The Making of Science, Technology…, 2009
The difficulties were discussed at length on several occasions at the OECD128. In 1982, the OECD Secretariat thus proposed to the Working Party on ICCP a statistical program and the creation of an ad hoc group of experts on statistics129. To the Secretariat, “the post-World War II period was characterized by sustained innovation, particularly in the field of electronics. In order to better encompass and monitor the structural changes, improved statistical concepts and data bases are needed, as well as a quantitative framework to better analyze and evaluate the importance of emerging changes related to the use of the new technology”. The Secretariat proposed the development of a conceptual framework for collecting statistical data and a methodology for assessing the impact of information, computer and communications technologies on the economy. The framework was built around three levels through which information technology enters the economy: production of components, systems, and use. The methodology consisted of developing a series of indicators based on internationally-agreed classifications130
At its 11th Session (April 1982), the national delegates endorsed an exploratory activity on statistics based on the Secretariat’s proposal. The Working Party called for a meeting of experts and users of statistics to study the required methodology. The first meeting, convened to develop “a coherent and reliable statistical database in the ICC field”, was held in September 1982. The suggested data collection would cover information goods, services and impacts
, and used an input/output model to measure the diffusion of technologies.
128 At the 1980 conference where the report on the information economy was
first presented, and again in October 1981 at a special session of the Working Party on Information Technology, Productivity and Employment which produced OECD (1982), Information Technology, Productivity and Employment, DSTI/ICCP/82.11. Published in 1981, in the Red ICCP series, as report no. 5.
129 OECD (1982), Information Technology Statistics: Draft Study Design, DSTI/ICCP/82.13.
130 R&D, supply of skilled labour, trade flow, ICC intensity (products, services, employment) by industrial sector, investment, household expenditures, stocks of products, new companies.
The Making of Science, Technology…, 2009 331
(diffusion). Two tasks were identified131
The Secretariat thus prepared a detailed proposal and submitted it to the ad hoc group
. The first was developing a framework for statistics; the second, collecting data for immediate use for policy-makers and other Working Parties, in line with the 1981 study on measuring the information economy.
132. The document reiterated that methodology should enable measuring the trends in the field of information and the impacts on economic variables such as growth, employment, consumption, investment and trade. It proposed 1) a statistical information system that would allow tracking of the ICC field based on a few simple indicators constructed from existing statistics for immediate use; 2) setting up a think tank within the OECD to develop “a methodological guide playing a similar role for this field to that of the Frascati Manual for research and development”. Then the document proposed a definition of the ICC field as consisting of five parts (electronic components, electronic equipment, communication systems, network and computer system management services, and information services) and suggested a preliminary series of indicators133
The next meeting of the group (June 1983) started defining the program of work, based on an updated plan submitted by the
. The aim of the statistics and indicators would be to analyze production and utilization by way of input-output tables to “show how the ICC field products (goods and services) are used by other industries to make final products”.
131 OECD (1982), Ah Hoc Meeting of Experts on Statistics on ICC: Draft
Summary Record, DSTI/ICCP/82.41. 132 OECD (1982), Proposal for the Development of a Statistical System in
the Field of Information, Computer and Communications, DSTI/ICCP/82.25.
133 Production (market volume/GDP, import rate, export rate, degree of foreign penetration, degree of concentration), utilization (users’ expenditures in relation to industry and field), environment.

332 The Making of Science, Technology…, 2009
Secretariat134
ICC-1
. The document suggested a new definition of ICC as composed of two sectors, plus context, or environment: information (ICC-1), in the sense of documentation; its production and distribution (ICC-2): hardware, software, networks and systems; environment (ICC-3). Indicators were suggested as follows:
Volume and value Trade (imports and exports) Costs of production Stocks ICC-2 Production and market
Value Market Labour Investments Stocks
Use Expenditures by type of user National expenditures Labour
ICC-3 Environment
R&D Patents Technological Balance of payment Public Expenditures on R&D
This division of the information field into sectors was adopted by the experts. The Secretariat’s program of work was also adopted, centered around three points: 1) updating previously-collected statistics like those of the report on measuring the information
134 OECD (1983), Plan de travail pour l’élaboration de statistiques relatives à
l’information, à l’informatique et aux communications, DSTI/ICCP/83.13.

The Making of Science, Technology…, 2009 333
economy, 2) working on a selected series of indicators for immediate use (6 months), and 3) initiating long-term work on ICC-1 and a manual (18-24 months).
A few months later, after the October 1983 meeting, the scope of the program was redefined. “A choice must be made”, stated the Secretariat, “between a total revision of the existing system and the more limited approach of collecting indicators relevant to the ICC field (…). While the total approach remains a long-term objective, it has been decided to concentrate on a modular approach”135
In 1984, the Committee on ICCP (formerly the Working Party) initiated the implementation of the program of development on indicators. A few months later, the Secretariat insisted again on collecting immediate statistics: “In the recent past, the ICCP Secretariat has made a number of proposals (…). At the three meetings held, it was argued that the scope and dimensions presented in these proposals were too ambitious, in particular given the amount of human and financial resources available in the ICCP Secretariat”
. Clearly stated, the OECD was abandoning the idea of a manual, and suggested preparing guidelines for a classification of the ICC field and developing indicators on the basis of existing statistics or ad-hoc surveys.
136. To the Secretariat, “preparing a Frascati-type manual might prove too time and resource consuming and might result in too rigid a system”137. Therefore, a “pragmatic” approach was proposed that “does not require the creation of entirely new classifications, but rather suggests building on the foundations of existing statistics”138
135 OECD (1984), Proposed Scope of Project on ICC-Statistics, ICCP (84) 6,
p. 4.
.
136 OECD (1985), Draft Scope and Structure for ICC Statistics, DSTI/ICCP/85.57, p.3.
137 Ibid., p. 4. 138 Ibid., p. 5.

334 The Making of Science, Technology…, 2009
The program of work suggested making little effort on ICC-1 but rather concentrating on ICC-2139
To a certain extent, the program produced results. As preliminary work, an inventory of available and planned national statistics on information, computers and communication was conducted
.
140, and an analysis of current classifications and databases was performed141. Statistics on the information economy were updated142, and a pilot survey on the production and trade of goods and services was conducted143, evaluated144
139 Recommendations were made to concentrate on only five classes of
goods (electronic components, data processing equipment, office equipment, industrial electronics, telecommunications) and the corresponding services (including software), on limiting the measurement of environment to its technological component, and prioritizing statistics on trade (because they allow tracking of products, and because trade was identified as the main issue in debates on information technology as well as for the Committee).
, and followed by two more data
140 Available in OECD (1985), Australian Proposal for a Work Programme for the Development of a Manual of ICC Statistics, DSTI/ICCP/85.49, p. 33s.
141 OECD (1985), An Inventory of ICC-Related Data Available at OECD, DSTI/ICCP/85.50. The analysis revealed that current classifications (on industries and trade) were not sufficiently detailed and did not cover the whole field of ICC activities.
142 OECD (1984), Update of Information Sector Statistics, ICCP (84) 19. Published as OECD (1986), Trends in the Information Economy, Paris. Four new countries participated: Australia, Denmark, Norway and New Zealand.
143 OECD (1986), Draft Questionnaire on ICC-Based Goods and Services, DSTI/ICCP/86.4.
144 OECD (1988), Questionnaire on ICC-Based Goods and Services: An Evaluation of the Results, DSTI/IP/88.7.

The Making of Science, Technology…, 2009 335
collections145. Data on trade were also extracted from the OECD Foreign Trade database146
However, it was the manual that interested the expert group most. Impatient, some members of the group pointed out in 1988 that “it was necessary to give it priority over data collection” which is usually out-of-date and deficient
.
147. The idea of a manual was originally suggested by the Australian delegate to the ICCP High Level Ministerial Meeting in 1980148, and integrated into the early program on ICC statistics in 1982, then abandoned. In 1985, at the same meeting where the program of work based on the Secretariat’s paper was adopted, Australia submitted a discussion paper summarizing the current position reached within the group of experts on ICC statistics and outlined a list of tasks to be undertaken, culminating in a workshop in September 1987 to review and finalize a draft version of the manual149
145 OECD (1989), Results of the Mini-Survey on ICC Goods, DSTI/IP/89.5;
OECD (1989), Revised Questionnaire, DSTI/IP/89.6. All in all, three data collection exercises were conducted (the database covered 1982-1989; data for the years 1986 and 1989 include services).
. The Australian document started as follows: “Lack of ICC data is something of a paradox, given the rapidly increasing importance of the storage and retrieval of information to support so many aspects of the workings of sophisticated industrialized countries”. Therefore, “the development of a manual for ICC statistics is seen as the most critical component
146 OECD (1985), Trade in ICC-Related Products and Systems as Reported in the OECD Trade File, DSTI/ICCP85.52. See also: OECD (1989), Report of the ICC Trade Database, DSTI/IP/89.7; OECD (1990), The Treatment of International Trade in Services in National Statistical Surveys, DSTI/IP/90.7.
147 OECD (1988), Group of National Experts on Statistics for ICC: Summary Record, ICCP (88) 19, p. 4.
148 OECD (1980), Statistics for ICCP: An Australian Action Paper, DSTI/ICCP/80.26; and intervention of J. D. Bell in OECD (1980), High Level Conference on Information, Computer and Communications Policies for the 1980s, Annex, DSTI/ICCP/80.38, p. 61-62.
149 OECD (1985), Australian Proposal for a Work Programme for the Development of a Manual of ICC Statistics, DSTI/ICCP/85.49.

336 The Making of Science, Technology…, 2009
of further work within the OECD in this field of statistics”150. The aim of the manual was to provide a conceptual framework, practical guidelines, and a basis for international statistical comparisons, “as with the Frascati manual for research and development”151
To this end, the Australian document discussed options for framing the measurement: a set of policy issues as identified previously by the Secretariat (see Appendix 9)
.
152 and organized around three broad categories (supply, application, and winners and losers), or an economic-oriented framework on trade, production and investment153. The proposal then analyzed the options available for defining the field of ICC and its boundaries: using Porat’s primary and secondary sectors, or the OECD definition of ICC-1 and ICC-2. Finally, the document recommended organizing the statistics to be collected154 into categories (supply, demand, population, labour, infrastructure, others). The document emphasized that “it is clear that modifications of a number of major international classifications will be a critical determinant of ICC data availability”155. It would have to relate the statistics to the System of National Accounts and other structural data in order “to understand the impact of ICC activities on the structure and performance of the economy as a whole”156
As discussed above, the Secretariat rejected the idea of a manual in 1985. Then, in 1988, the Secretariat re-examined the Australian
. The manual would also make recommendations on methodologies: guidelines for special surveys designed specifically to collect ICC data, and procedures for deriving indicators from available statistics.
150 Ibid., p. 6. 151 Ibid., p. 6. 152 OECD (1983), Policy Issues to Define the Scope of the Project, ICCP
(83) 9; OECD (1984), ICC Statistics Project, ICCP (84) 20. 153 As in OECD (1985), 1986 Work Program Proposal, ICCP (85) 4. 154 Those suggested in OECD (1984), Update of Information Sector
Statistics, op. cit. 155 OECD (1985), Australian Proposal for a Work Programme for the
Development of a Manual of ICC Statistics, op. cit., p. 15. 156 Ibid., p. 18.

The Making of Science, Technology…, 2009 337
proposal and suggested creating a small group of national experts to produce what it called an “interim” manual. “While the aim [of a manual] remains valid, it has become clear that the proposal needs to be reinterpreted in the light of a number of factors”157. These factors were, firstly, the continued resource constraints that favour more modest alternatives like using existing sources of data, adding questions to existing surveys, and a minimal set of guidelines. The second factor was progress made in the last few years in the revision of international classifications. The Secretariat suggested “the development of a basic manual of concepts and practical guidelines for the collection of ICC data primarily through the addition of new questions to existing surveys, but also the reworking of existing data sources”158. To the Secretariat, the manual should carry “a strong economic performance and structural adjustment perspective, reflecting the primary concern of policy makers”159. This meant that the framework should evolve around the pattern of ICC innovation and diffusion (growth and structural change) and its economic impacts160
These were only the first recommendations of the Secretariat. The paper continued as follows: “it is probable that the problem [of defining the boundaries of what constitutes ICC goods and services] has been overemphasized. In general, policy issues tend to be fairly narrowly focused on a limited range of ICC goods and services in
. From an indicators point of view, three broad policy goals were suggested: innovation and production (what goods and services are produced, their importance in terms of output, employment, trade, industries, market structure, investments), diffusion (demand, patterns of use within industries, investments), and environment (climate, infrastructure, impact on productivity, employment, competitiveness and trade).
157 OECD (1988), Revised Proposal for the Development of a Manual for
ICC Statistics, DSTI/IP/88.9, p. 2. 158 Ibid., p. 2. 159 Ibid., p. 5. 160 Ibid., p. 3.

338 The Making of Science, Technology…, 2009
relation to the economics of just one or a few sectors: the growing use of computers in financial business services, for example, or the nexus between new telecommunications technologies and regulation in the industry. For such analyses, a precise global definition of the ICC sector as a whole is unnecessary. There are few policy issues that need to address the entire sector. It is only in calculating the contribution of ICC as a whole to global GDP or employment that the question of a global boundary becomes important”161
In sum, the manual was to be developed in three stages: define the scope and structure of the field, establish detailed definitions and concepts, and develop methodologies. The meeting of experts on ICC statistics in June 1988 decided to go ahead with drafting “an interim manual on the model of the Frascati manual”
. Because “the focus of policy is almost exclusively on those ICC goods and services based on new computer or telecommunications technologies”, the interim manual should focus on 1) defining the ICC-2 sector alone, not ICC-1, and deal with the goods and services of major interest, 2) link these definitions to corresponding international classifications, 3) provide guidelines for existing surveys or for conducting ad-hoc surveys.
162, “aimed to be a comprehensive framework which would help the compilation of internationally comparable statistics”163
161 Ibid., p. 5.
. The committee recommended that a consultant be engaged to draft the outline of the manual in line with the revised proposal from the Secretariat for an interim manual. This was qualified as an “acceptable balance between the desirability of a clear conceptual framework accompanied by the appropriate definitions and recommendations for
162 OECD (1988), Group of National Experts on Statistics for ICC: Summary Record, ICCP (88) 19, p. 1.
163 OECD (1990), Draft Summary Record of the Fourth Session, DSTI/ICCP/M (90) 2, p. 11.

The Making of Science, Technology…, 2009 339
standard practices and the need to make rapid progress on a balanced programme of data-collection and methodological work”164
The plan and timetable for the manual were discussed and approved. As a first step, a discussion paper was prepared by R. Staglin and R. Filip-Kohn from the German Institute for Economic Research (DIW) and presented to the group of expert in May 1989
.
165. The paper had the structure of a manual, with sections dealing with aim and scope, basic definitions and conventions, statistics, collection and interpretation, and survey procedure, and it identified major issues for discussion and choices to be made. The Secretariat also produced a paper of the same type based on both its previous note for an interim manual and the German paper166. In it, we find expressed clearly the understanding of the Secretariat with regard to the manual. The interim nature of the manual meant that it was an initial standard practice methodology for reworking existing data for immediate use. The manual was defined as “an intermediate stage toward the longer term goal of a full manual”167. To the Secretariat, a full manual would have to go beyond the scope of the System of National Accounts, deal with socio-economic indicators, and cover other indicators like the economic climate or environment (regulatory and tax environment, investment climate standards, skill level of the workforce, foreign ownership, degree of competition, etc.) and social aspects168
164 OECD (1988), Group of National Experts on Statistics for ICC: Summary
Record, op. cit., p. 5.
. It would have to deal with both private sources of data and specific surveys. Briefly stated, it would have a broader coverage of variables, measurement units and sources. Actually, the interim
165 OECD (1989), Detailed Discussion Paper on a Proposed Interim ICC2 Manual, DSTI/IP/89.11.
166 OECD (1989), A Framework for an Interim ICC Manual, DSTI/IP/89.10. 167 Ibid., p. 4. 168 “Though social questions are of undoubted importance, given the limited
aims of the present proposal the focus will be on economic issues alone”. OECD (1988), Revised Proposal for the Development of a Manual for ICC Statistics, op. cit., p. 3.

340 The Making of Science, Technology…, 2009
manual was to 1) use a list-based approach to defining the field (list of products from the Central Product Classification used for trade statistics) with correspondence to other classifications of industrial activities and occupations, 2) be restricted to marketed production (ICC-2), 3) add questions to existing surveys and 4) be framed within the System of National Accounts.
Both drafts were discussed by the group of experts in detail in May 1989. The meeting gave tasks to five volunteering countries for drafting different parts of the manual169. The countries reported back for the next meeting of experts (April 1990)170. This was the last meeting of the group. Although a revised schedule for the production of the manual was adopted – Spring 1991 at the latest – the manual would never be completed. The Secretariat informed the group that “the ICC statistical programme was not universally supported in the Directorate for Science, Technology and Industry nor, apparently, among Member governments and that the continuation of the programme would be re-examined in the context of a) its perceived relevance and potential usefulness to the programme of work of the ICCP committee and b) the review of the whole statistical programme of the Directorate for Science, Technology and Industry to be carried out in the context of the Technology-Economy Program”171
169 OECD (1989), Meeting of Volunteer Experts on an Interim ICC Statistics
Manual, DSTI/IP/89.8.
. To the then-head of the ICCP Division, “the speed of the innovation push of the sector meant that it was difficult for official statistics to keep up [and] that the group was in a difficult competitive situation with respect to trade associations and private consultants (…). Maybe 10 years hence the field might have stabilized but for the moment it was extremely difficult to create and maintain up-to-date official statistics in the ICC area (…). The sector is a lot different from that of R&D statistics, which is more
170 OECD (1990), Ad Hoc Group of Experts on Statistics for ICC: Summary Record, ICCP (90) 15.
171 Ibid., p. 2.

The Making of Science, Technology…, 2009 341
aggregated (Frascati manual)”172. The director concluded that “it was arguable whether the ICC statistics manual was really useful” due to rapid change in the field173
The statistical database on ICC trade in goods was frozen in 1990
. Later during the meeting, he mentioned that data required for analytical purposes were indicators like value-added networks, information technology-usage indicators, telecommunication costs to users, and trade in ICC services and telecommunications equipment, but several of these indicators were criticized by the group.
174, statistical work was incorporated into other programs of work within the Directorate, namely the Group of Experts on Science and Technology Indicators (NESTI) and the Industry Committee175, and the interim manual was shifted to low-priority. The ICC statistics program was “no longer considered relevant from the point of view of its timeliness and focus”176
In the history of the OECD, this was the second failure of a statistical program on information, and of a manual – the first was on information as knowledge. The failure is surprising since, according to the OECD itself, “many countries [were] looking to the OECD for further work in this field”
.
177
172 Ibid., p. 2.
, since the work of the Working Party on ICCP and ICC statistics in general had received increased attention from other OECD Committees (Trade, Industry, Multinational
173 Ibid. 174 The database was criticized for the sparseness of the data and the
classifications used (not adapted to the developments in the field). OECD (1992), Activities of the OECD Sectoral Groups and Working Parties Relating to Services Statistics, DSTI/STII/IND/WP9 (92) 10.
175 OECD (1990), A Draft Medium Term Plan for the Work of the STIID, DSTI/IP (90) 22.
176 OECD (1991), Summary Record of the Meeting of Experts on the Consequence of the TEP Indicators Conference, DSTI/STII/IND/STP (91) 2.
177 OECD (1981), Draft Summary Record of the 9th Session, DSTI/ICCP/81.6, p. 3.
342 The Making of Science, Technology…, 2009
Enterprises)178, and since the Secretariat worked to strengthen the ICCP Division and broaden the scope of the Statistics groups to serve other divisions of the Directorate, namely Industry as well as Science and Technology Policy179. The causes of this failure were threefold. The first is methodological. The task of constructing an information sector account was too complex for the time: the field was evolving rapidly and no standardized classification was available. The scope of the project was too large and countries had no adequate statistics. The second factor responsible for the failure relates to the method of work, or to the expert group itself. The OECD explicitly refused to set up a standing working party180, preferring an informal expert group. Progress was slow and dynamism lacking, and the ICCP Committee never hesitated to comment on this181. There was also reluctance in the group to work with other units of Directorate. While a single division for statistical work was created in 1987 within the Directorate, the Committee itself did “not favor the creation of [a] joint Working Party” (ICCP, Science and Technology, Industry)182
THE INFORMATION SOCIETY
. Third, as discussed in the next section, other perspectives on measurement became available that proved more attractive.
After Porat, the work on information at the OECD was conducted according to a concept of information as a commodity or industrial activity: information is a good or service, produced by many
178 OECD (1980), Draft Summary Record of the 7th Session,
DSTI/ICCP/80.12, p. 3. 179 OECD (1984), Draft Summary Record of the Fifth Session, ICCP/M (84)
2, p. 17. 180 OECD (1983), Summary Record of the Second Session, ICCP/M(83)1,
p. 10. 181 OECD (1986), Meeting of Experts on Statistics for ICC: Summary
Record, DSTI/ICCP/86.15, p. 3. 182 OECD (1986), Draft Summary Record of the Eighth Session, ICCP/M
(86) 1, p. 10.

The Making of Science, Technology…, 2009 343
industries, consumed by other industries, and measured with accounting statistics (economic activities of sectors). Information was no longer restricted to science and technology, but concerned all sectors of the economy. At the OECD, such an orientation was in the air as early as 1970. The third ministerial meeting on science in 1968 invited the OECD to reinforce its action on information policies, and proposed setting up an ad hoc policy group to advise on future actions. The group, headed by P. Piganiol, produced its report in 1970183. Echoing the Brooks report on science and technology184, the group suggested integrating information policy into R&D policy, and extending the focus from information for scientists to transfers to government and non-specialists185. As a consequence, the Information Policy Group passed from working under the Committee for Scientific Research to the Committee for Science Policy in 1970. In the following years, several reviews of OECD activities in the field were conducted that urged closer coordination between the different expert groups, and a new mandate was proposed to the Information Policy Group in 1974186
A second shift in the use of the concept of information occurred in the 1990s. As we have seen, the first shift was from information as knowledge to information as commodity or industrial activity. Now, it was information technology per se that came to interest policy-
.
183 OECD (1970), Information for a Changing Society: Some Policy
Considerations, DAS/STINFO/70.30. Published as OECD (1971), Science, Growth, and Society: A New Perspective, Paris.
184 OECD (1972), Science, Growth, and Society: A New Perspective, Paris. 185 This argument was first offered in 1967 by the US delegate and submitted
to the third ministerial meeting: “Information for scientific research may be far too narrow (...). The Information Policy Group might do well to broaden its scope to examine all those resources that serve the economic development and welfare of the countries. See OECD (1967), Scientific and Technical Information Group: Summary Record of the 7th Meeting Held in Paris on 26th and 27th June, 1967, RC (67) 15, p. 10.
186 OECD (1974), The Information Policy Group: History, Programme and Mandate, DAS/STINFO/74.7.

344 The Making of Science, Technology…, 2009
makers and statisticians and to define what constitutes information187. With regard to technology specifically, the reorientation goes back to Porat once again. In concluding his report, Porat focused on technology: “we are just on the edge of becoming an information economy. The information technologies – computers and telecommunications – are the main engines of this transformation”188. “No portion of the US economy is untouched by information technology”189. To Porat, “information policy attends to the issues raised by the combined effects of information technologies (computers and telecommunications) on market and non-market events”190. Porat then suggested a policy framework and identified policy issues based on flows of information technology into society: production, application and impact191
Information technology was also the main focus of the OECD’s rhetoric on the information economy, as expressed in the work on ICC statistics. Yet the measurement did not revolve around technologies and specific surveys but, as with Porat, on information sectors and accounting. In the 1990s, however, information as technology came to define the core of the ICCP program of work. The new conception did not entirely replace the previous ones. All three conceptions of information overlapped. As we have seen, information as knowledge continued to be discussed within the conception of information as commodity (ICC-1). Equally, information as commodity continued to be measured in the new conception discussed in this section (information as technology). However, information as technology mainly added a new dimension to the measurements, with dedicated measurement instrument.
.
187 Indeed, the Committee for Scientific Affairs had changed its name in
1972 to the Committee for Scientific and Technological Policy. 188 M. U. Porat (1977), The Information Economy, op. cit., p. 204. 189 Ibid., p. 207. 190 Ibid. 191 See also: M. U. Porat (1978), Communication Policy in an Information
Society, in G. O. Robinsen (ed.), Communications for Tomorrow, New York: Praeger, p. 3-60.
The Making of Science, Technology…, 2009 345
At the OECD, the interest in information technology and the economy goes back to the late 1960s. In 1966, the OECD initiated a study on what was then called “technological gaps”. The organization looked at the disparities in economic performance between the United States and Europe, and the role of technologies in these disparities. The results were published in 1968 and 1970192. Among the technologies studied were electronic components and electronic computers193. To the OECD, the computer constituted a “key” industry: “because of its widespread use in commerce, industry and government (…), the computer is coming to play the role of a nervous system, and can be considered a key factor in the economic and social structure of a country; it is also of obvious strategic significance to countries with major defense capabilities”194
One conclusion of the study on gaps, with regard to statistics, was the poor quality of the data, or their absence: “Perhaps the main finding of the present survey of the computer industry is the existence of a major statistical gap”
. The OECD measured a “clear-cut lead of the United States” on every indicator studied: source of major inventions, technological balance of payments (or licensing agreements), market share and international trade.
195. Following Gaps in Technology and a request from the third ministerial meeting on science in 1968, a Group on Computer Utilization was set up in 1969 and a survey on computer use was conducted196. To the Group, “member countries have a vital interest in accelerating the use of computers in all segments of society and the economy”197
192 OECD (1970), Gaps in Technology: Comparisons Between Member
Countries in Education, Research & Development, Technological Innovation, International Economic Exchanges, Paris.
. In the following years, the Group on
193 OECD (1968), Gaps in Technology: Electronic Components, Paris; OECD (1969), Gaps in Technology: Electronic Computers, Paris.
194 OECD (1969), Gaps in Technology: Electronic Computers, op. cit., p. 8. 195 Ibid., p. 157. 196 OECD (1969), Questionnaire on Computer Utilisation, DAS/SPR/69.5. 197 OECD (1969), Outline of the Study, DAS/SPR/69.1, p. 3.

346 The Making of Science, Technology…, 2009
Computer Utilization studied many aspects of information technology. It was this group that first suggested the idea of a conference on Computers and Telecommunications Policy (1975), which launched the project on the information economy. The new understanding of information as technology also came from this group. This shift was not without its opponents at the OECD, first among them the Information Policy Group. To that group, which was more concerned with documentation and its computerized systems, a concentration on the technological aspects of the information economy meant “unbalance and incompleteness” and “failure to give due attention to the intellectual aspects of information and the needs of its users”198
The contribution to economic growth and productivity of technology, particularly information technology, became a major concern in member countries and at the OECD in the 1980s: technical change and economic policy, technology and structural change, technology and competitiveness, technical change and economic growth, and technology and the economy were the subjects of many projects carried out by the OECD during this period
. Eventually, the Computer Utilization Group won out over the Information Policy Group, and when the two groups merged into a working party on ICCP in 1976, the agenda of the Computer Utilization Group supplanted that of the Information Policy Group.
199
198 OECD (1975), IPG/CUG: Summary Record of the Joint Meeting,
DSTI/STINFO/75.25.
. This work was influenced and supported by C. Freeman, a consultant from the Science Policy Research Unit (SPRU), whose works developed the idea that “generic” technologies, because of their pervasive effects on the economy, ought to be the focus of policies. To Freeman, there have been five waves of innovation since the industrial revolution.
199 For published reports, see: OECD (1980), Technical Change and Economic Policy: Science and Technology in a New Socio-economic Context, Paris; OECD (1988), New Technologies in the 1990s: A Socio-Economic Strategy, Paris; OECD (1992), Technology and the Economy: the Key Relationships, Paris.

The Making of Science, Technology…, 2009 347
Only the last one, information technologies, qualified as a change of “techno-economic paradigm” or a technologic revolution200
From its very beginning in 1982, the ICCP Committee has studied several information technologies and their effects on the economy, and published its analyses in the Red ICCP series (see Appendix 10). The data used were rarely standardized, relying on different sources (official, academic and private). In 1988, the Committee then launched a project on the economic implications of information technologies
.
201. The project aimed to look at the socioeconomic impacts of information technology, construct a policy framework, and develop appropriate data and indicators. The declared focus of the project was not the production of technology that “in itself contributes little to economic growth”, but the broader contribution to economic development through the use of technologies202. This was the origin of a preoccupation for the so-called information society, rather than the information economy, at the OECD – although widespread use of the term information society came later, and the term information economy continued to be used203
200 C. Freeman, J. Clark and L. Soete (1982), Unemployment and Technical
Innovation, Connecticut: Greenwood Press; C. Freeman (1987), Information Technology and Change in Techno-Economic Paradigm, in C. Freeman and L. Soete (eds.), Technical Change and Full Employment, Oxford: Blackwell, p. 49-69; C. Freeman (1987), The Challenge of New Technologies, in OECD, Interdependence and Co-operation in Tomorrow’s World, Paris, p. 123-156; C. Freeman and C. Perez (1988), Structural Crises of Adjustment, Business Cycles and Investment Behavior, in G. Dosi et al. (eds.), Technical Change and Economic Theory, London: Pinter, p. 38-66.
. To study the
201 OECD (1988), Socio-economic Implications of Information and Communication Technology and Applications: Opportunities for Change, ICCP (88) 4.
202 OECD (1988), Economic Implications of Information Technologies: Draft Summary Record of the First Session, DSTI/ICCP/EIIT/88.4.
203 To the OECD, the term information economy refers to the implications of information technologies on the economy, on firms’ performance, (productivity, profitability and employment), while the information society refers to the social consequences of technologies (modes of behavior, relationships in and between communities). See: OECD (2003),

348 The Making of Science, Technology…, 2009
phenomenon, an expert group was created on Economic Implications of Information Technologies (EIIT).
The Working Party on Economic Implications of Information Technologies (1988)
In approving the project on the Economic Implications of Information Technologies, the ICCP Committee agreed on the importance of determining indicators, mainly on the use of information technology204. The first task of the group on Economic Implications of Information Technologies was therefore to develop indicators on information technology usage “as the foundation for the investigations on impacts”205. I. Miles from SPRU was invited as a consultant to present his Information Technology Accounting Framework (ITAF)206
A Framework Document for Information Society Measurements and Analysis, DSTI/ICCP/IIS (2003) 9, p. 7. “Tomorrow’s economy will be, to a great extent an information economy and society will be increasingly an information society. That is information will contribute in great part to the value added of most goods and services and information intensive activities will increasingly be carried out by households and citizens”. See: OECD (1998), The ICCP Ad Hoc Statistical Panel: A Proposal for a Programme of Work, DSTI/ICCP/AH/RD (98) 5, p. 2.
. Miles urged a change in both object and methodology: from measuring technology sectors to measuring the use of information technologies. “Most approaches to the information economy have been content to develop highly aggregated estimates of the size of an information sector”, with little attention to the use of
204 OECD (1989), Draft Summary Record of the Thirteenth Session, ICCP/M (88) 1, p. 8.
205 OECD (1989), Economic Implications of Information Technologies: Draft Summary Record of the Second Session, DSTI/ICCP/EIIT/89.1.
206 I. Miles (1989), The Statistical Analysis of the Information Economy: Why an Accounting Framework is Needed, OECD, DSTI/ICCP/89.2; I. Miles (1990), Mapping and Measuring the Information Economy, London: British Library; I. Miles (1991), Statistics and the Information Age, Futures, 23 (9), p. 915-934.

The Making of Science, Technology…, 2009 349
information technologies themselves, claimed Miles207
This “philosophy” was what the group on Economic Implications of Information Technologies adopted, but it did not adopt the methodological approach. Until full input-output information became possible, the Secretariat recommended, for example, that specific surveys on advanced manufacturing technologies be used to track the diffusion of information-technology-related goods
. To Miles, the information economy does not simply refer to information sectors, nor to information-technology producing sectors, but to the diffusion of information technology. Information technology, particularly microelectronics, is a pervasive technology across the whole economy and across a wide range of applications. To account for the diffusion of information technology, Miles suggested using existing but unexploited data and, above all, input-output tables to track the interrelationships between production and applications or uses.
208
207 I. Miles (1989), The Statistical Analysis of the Information Economy,
p. 2.
. At a meeting held in September 1988 in Stockholm, a questionnaire was prepared on the use of information technology and sent to member countries. Despite the absence of some data within member countries, a statistical analysis was conducted by I. Miles and D. Kimpel and
208 OECD (1988), Group of National Experts on Statistics for ICC: Summary Record, ICCP (88) 19, p. 5. As conducted in the United States, Canada and Australia. For the United States, see National Science Foundation (1991), Science and Engineering Indicators 1991, Washington, p. 154-157; National Science Foundation (1996), Science and Engineering Indicators 1996, Washington, p. 6-24 to 6-27; National Science Foundation (1998), Science and Engineering Indicators 1998, Washington, Chapter 8; National Science Foundation (2000), Science and Engineering Indicators 2000, Washington, Chapter 9. For Canada: Statistics Canada (1989), Survey of Manufacturing Technology: The Leading Technologies, Science Statistics, 88-001, 13 (9), October; Y. Fortier and L. M. Ducharme (1993), Comparaison de l’utilisation des technologies de fabrication avancées au Canada et aux États-Unis, STI Review, 12, p. 87-107. For Australia: B. Pattinson (1992), Survey of Manufacturing Technology – Australia, DSTI/STII/STP/NESTI (92) 8, OECD.

350 The Making of Science, Technology…, 2009
published in the Red ICCP series209
Then, in 1992, the expert group discussed a new project on developing new indicators and launching an “Information Economy Revisited” study. A special session on national information technology policies and structures was therefore held in October
. This kind of work, with its “pragmatic” approach, was a model often brought to the attention of the expert group on ICC statistics for emulation, but in vain.
210, while a project was identified to “map” the relationships between information technology and the economy, that is, to assess the impacts of information technology on the economy, and particularly on productivity211. To the group, such analysis “requires an enormous body of cross national information and databases. Unfortunately, the currently developed body of knowledge or data collection system is not sufficient to allow empirically convincing and scientifically valid conclusions about various aspects of information technology impacts on productivity”212. The group added, “the existing literature has had an opportunistic focus on case studies of small populations where data happens to be available or is easily gathered”213
209 OECD (1990), Indications and Analysis of Current and Emerging IT
Usage, DSTI/ICCP/EIIT/90.10. Published as report no. 31 in the ICCP Red series: OECD (1993), Usage Indicators: A New Foundation for Information Technology Policy, Paris.
. To establish the foundations for the task, a workshop was hosted by the National Science Foundation in the fall of 1993 to review the state of the art in productivity measurement methods, investigate cross-national studies, analyze available data sets and examine the feasibility of new
210 OECD (1992), Proposal for a First Special Session on Information Technology Policy, DSTI/ICCP (92)11; OECD (1993), Report on the Special Session on Information Technology Policies: New Challenges for Competition and Co-Operation, DSTI/ICCP (92) 13.
211 OECD (1992), Micro- and Macroeconomic Impacts of National IT Policies, DSTI/ICCP/EIIT (92) 11; OECD (1993), Micro- and Macroeconomic Impacts of IT and National Information Technology Policies and Programmes, DSTI/ICCP/EIIT (93) 1.
212 Ibid., p. 5. 213 Ibid., p. 6.

The Making of Science, Technology…, 2009 351
international statistical series214. The project became part of the Technology, Productivity and Job Creation Project, the first joint project of the Directorate for Science, Technology and Industry (combining ICCP, the Science and Technology Policy division and the Industry division)215 and a precursor to the Growth project of the late 1990s, where information technology appeared as central in explaining the performance of the New Economy216
As a follow-up to the session on information technology policies, a review group was set up to identify future directions of work on information, computer and communications policies – to identify issues and challenges of the group on Economic Implications of Information Technologies, elicit views on a future agenda, and renew and refocus the mandate of the group. The review reaffirmed the importance and relevance of the expert group on Economic Implications of Information Technologies, but expressed “concern about the lack of reliable statistical data in the area of usage statistics” and the “absence of appropriate methodologies and concepts quantifying intangible benefits”
.
217. The report also recommended elevating the status of the group to that of a Working Party. The Group on Economic Implications of Information Technologies then became the Working Party on Information Technology Policy in 1993218
214 OECD (1994), The Productivity Impacts of Information Technology
Investment, DSTI/ICCP (94)1. Some of the papers from the conference were published in Economics of Innovation and New Technology, 3 (3-4), 1995.
. By mid-1995, the group had not yet met. According to some, there were increasing difficulties in interesting member countries in the concept of the information
215 OECD (1994), STI Work on Technology, Productivity, and Employment, DSTI/IND/STP/ICCP (94) 2. Report published as OECD (1996), Technology, Productivity and Job Creation, Paris.
216 See Chapter 4 above. 217 OECD (1993), EIIT Review Report, DSTI/ICCP/EIIT (93) 2. 218 OECD (1993), Working Party on Information Technology Policy: Draft
Mandate, DSTI/ICCP (93) 6.

352 The Making of Science, Technology…, 2009
economy or society219. The OECD Council asked for cuts in the ICCP Committee budget: the 1993 program of work weakened ICCP by eliminating one post and reduced consultancy resources and the hosting of meetings by 30%. There was also a suggestion that the committee be terminated220
In an ultimate bid for survival, the ICCP Committee drafted a proposal on the Information Society to be included in the final communiqué of the May 1995 ministerial meeting (G-7)
and a proposed restructuring of the Directorate for Science, Technology and Industry: from 1994 onward, the ICCP committee would be served by a Science, Technology and Communications Policy Division.
221. The proposal dealt with the importance of information technology and the need for a policy framework. As a result, the ministers asked the OECD for a policy framework on the Information Society (Global Information Infrastructure/Global Information Society, or GII/GIS). “The world community needs to adapt [to the Global Information Infrastructure] in all the political, economic, social and cultural dimensions, thus establishing the basis for a new Global Information Society”222. But a common vision was lacking with regard to the Information Society concept223
219 There were already plenty of discourses and initiatives at other levels of
governments. For influential documents, see the EU Commission’s Bangemann report (European Commission (2004), Europe and the Global Information Society: Recommendations to the European Council, Brussels) and the US initiative for the Information Super Highway (Task Force on Information Infrastructure (1995), Global Information Infrastructure: Agenda for Co-Operation).
. Using available and recently completed work, the ICCP Secretariat produced, in a very short time, a policy framework in which the principle of market competition held
220 OECD (1994), Draft Summary Record of the 26th Session, ICCP/M (94) 2, p. 3.
221 OECD (1995), Draft Summary Record of the 27th Session, ICCP/M (95) 1, p. 5-6
222 OECD (1996), GII-GIS: Statement of Policy Recommendations Made by the ICCP Committee, DSTI/ICCP (96) 10, p. 2.
223 Ibid., p. 3.

The Making of Science, Technology…, 2009 353
preeminence, and where government’s role was that of a catalyst and facilitator for developing efficient markets, overcoming barriers and obstacles, promoting equal access to information, and protecting cultural and linguistic diversity in content products and services (software, multimedia, publishers, broadcasters, audio-visual and sound recording producers)224
These efforts from the ICCP Committee had two consequences. The first was reactivating the newly-created Working Party on Information Technology Policy (formerly the Working Party on Economic Implications of Information Technologies). The renewed mandate of the Working Party focused on developing a policy framework for the information economy centered around the demand or user side of technologies (diffusion and impacts) rather than the supply side, and with a specific mention of developing “methods and tools for measurement”. The Working Party was, for a second time in as many years, renamed the Working Party on Information Economy in 1995
. The report was submitted to a meeting of ICCP at the ministerial level in May 1996, and endorsed by the G-7 in May 1997.
225. The first task of the Working Party was organizing a series of six workshops (1995-1999) on the economics of the information society, a regular feature of which were sessions on data and indicators226
A relatively new series titled Information Technology Outlook became a top priority of the Working Party. The series was first
.
224 OECD (1996), GII-GIS: Policy Requirements, DSTI/ICCP (96) 24;
OECD (1996), GII-GIS: Policy Recommendations for Action, DSTI/ICCP (96) 25.
225 OECD (1995), Mandate and Activities of the Working Party on Information Technology Policy, DSTI/ICCP (95) 28; OECD (1996), Mandate, Terms of Reference and Name of the Working Party, DSTI/ICCP/IE (96) 2; OECD (1996), Proposed New Mandate of the Working Party, DSTI/ICCP/IE (96) 3.
226 OECD (1999), OECD Workshops on the Economics of the Information Society: A Synthesis of Policy Implications, DSTI/ICCP/IE (99) 1.

354 The Making of Science, Technology…, 2009
proposed in 1990227. It was created to cover both information technology and communication technology, and to collect data from any source (international organizations, directorates of the OECD, ICCP research projects, member countries and private consultants). The publication would not necessitate new data collection. The focus was rather on the analysis of existing data, and updated data on an ad hoc basis. The added value was to bring together data from diverse sources and present them in a common framework. The second objective was to “give a higher profile to the regular work of the ICCP” and “an enhanced sense of identity” to the Committee and the to work of its working parties. A Communication Outlook came first (from a Working Party on Telecommunications and Information Services Policies), as the consequence of a special session on telecommunications policy held in 1990. The first edition of Information Technology Outlook followed in 1992 (from the Working Party on Economic Implications of Information Technologies)228. The biennial series continues to this day – since 1997 with three sections (scoreboard of indicators, policies and issues) and more use of official statistics (than private sources)229
The series became the “showcase” for statistical work on the theme of the information economy. Editions carried results from work conducted on electronic commerce, software, skills and employment, and the so-called “digital divide” (the have and have-not of technologies). There had been suggestions to change the name of the series to Outlook for the Information Economy
.
230
227 OECD (1990), Information Technology and Communications (ITC)
Outlook: Proposal for a New ICCP Publication Project, DSTI (90) 9.
, but without success.
228 OECD (1991), Information Technology Outlook, DSTI/ICCP (91) 1. 229 OECD (1997), Recent Changes in the Information Technology Outlook
and Implications for Future Editions, DSTI/ICCP/IE (97) 2. 230 OECD (1996), Summary Record of the First Meeting of the Working
Party, DSTI/ICCP/IE (96) 1, p. 4.

The Making of Science, Technology…, 2009 355
The Working Party on Indicators for the Information Society (1999)
The second consequence of the ministerial meeting was the creation of another Working Party. At the suggestion of the ICCP Committee, in May 1996 the ICCP at the ministerial level suggested that the Secretariat develop “a common framework for indicators and standard definitions” for the information society and set up a statistical panel to develop “new indicators which identify, assess and monitor the emergence” of the information society231. A statistical panel was set up in 1997232
The statistical panel was chaired by F. Gault from Statistics Canada, and met for the first time in June 1997. From the start, and as a lesson from past experiences, a “pragmatic and concrete approach was emphasized which would produce tangible results in the near-term”
, and the ICCP Committee asked the panel to start its work by surveying existing data on both the supply and demand for information and communication technology, or ICT (the new term for ICC, as emblematic of the third conception of information). The work would have to be conducted in close cooperation with Eurostat and its Working Group on Statistics for the Information Society.
233
231 OECD (1996), Global Information Infrastructure-Global Information
Society: Statement of Policy Recommendations Made by the ICCP Committee, DSTI/ICCP (96) 10, p. 9; OECD (1996), GII-GIS: Policy Requirements, op. cit., p. 23.
. The group agreed to produce a survey of available data in member countries, as well as a preliminary ICT definition (industries) by June 1998. Work was also suggested on an ICT product-based or commodity-based definition and, once that was achieved, one definition on content (industries that create information). Eurostat suggested it would take the lead on the commodity-based definition, and France proposed to undertake the work on content. Finally, work
232 OECD (1997), The ICCP Statistical Panel: Mandate, Mission, Goals and Work, DSTI/ICCP/AH 97) 1.
233 OECD (1997), Summary Record of the Ad Hoc Meeting on Indicators for the Information Society, DSTI/ICCP/AH/M (97) 1, p. 3.

356 The Making of Science, Technology…, 2009
was envisaged to measure the use of ICT (in households, government and business).
The statistical panel, renamed the Working Party on Indicators for the Information Society in 1998, “has been able to provide a high quality response in a relatively short time span”234. It produced a definition of the ICT sector in less than a year235, from which a series of statistics were published236, and developed a list of ICT products237. It also developed model questionnaires on the use of ICT technologies in business238 and households239, including electronic commerce240
One area where results did not pan out was in measuring what was called “content”. From 1998 on, the working party succeeded in settling debates on definitions (conventions on boundaries), particularly for ICT products and e-commerce. Content was not that easy. As we have seen, from the very beginning of information statistics, there was hope of measuring information per se (knowledge or documentation). The idea came back on the agenda in the mid 1990s under the name “content”, those industries which produce and disseminate informational products. Defined as such,
.
234 OECD (2004), Policy Relevant Indicators and Empirical Analysis for the
Information Society: A Discussion of WPIIS Outputs and Ideas for Future Work, DSTI/ICCP/IIS (2004) 1, p. 9.
235 OECD (1998), Summary Record of the Second Ad Hoc Meeting on Indicators for the Information Society, DSTI/ICCP/AH/M (98)/REV1, p. 9. Revised in 2002: DSTI/ICCP/IIS (2002) 2.
236 OECD (2000), Measuring the Information Sector, Paris. 237 OECD (2003), A Proposed Classification of ICT Goods, DSTI/ICCP/IIS
(2003) 1/REV2. 238 OECD (2001), Measuring ICT Usage and Electronic Commerce in
Enterprises: Proposal for a Model Questionnaire, DSTI/ICCP/IIS (2001) 1/REV1.
239 OECD (2001), Measurement of ICT Usage in Households/By Individuals: Proposal for a Model Questionnaire, DSTI/ICCP/IIS (2001) 2 and DSTI/ICCP/IIS (2002) 1/REV1.
240 Work on electronic commerce was conducted jointly with the Working Party on Information Economy.

The Making of Science, Technology…, 2009 357
content was a sensitive political issue. While previous work of statisticians had concentrated on the knowledge and/or commodity side of information, content involved looking at, among others, culture and cultural industries.
The ministerial meeting of 1996 on the information society had called for economic efficiency and more equitable access to media and content resources. The Working Party on Indicators for the Information Society started work on content in 1999. France and Canada proposed a new definition of ICT that would include images, sound and text that are displayed, processed, stored and transmitted by ICT241. This category of goods and services was called “communication product”. It was not concerned, in the end, with the industries that create such products, but with the medium of diffusion, or technology. The suggested list of industrial classes included publishing, printing and media, but also radio and television, motion pictures, libraries, museums and services like marketing and advertising, education and health. Many believed that the concept was too broad, and requested a review of the principles outlined in the paper242, in line with the Canadian experience that limited content to industries engaged in disseminating and/or reproducing products by new electronic technologies243. Indeed, the meeting of the Working Party in November 1999 specified that the requirement was for electronic content, and the Secretariat produced a paper on defining and measuring (that small part of) the electronic content sector244
241 OECD (1999), Defining the Content Sector: A Discussion Paper,
DSTI/ICCP/IIS (99) 1.
. The French and Canadian delegates therefore produced a discussion paper that amended their first suggestion, proposing a
242 OECD (1999), Summary Record of the 3rd Ad Hoc Meeting of the Working Party on Indicators for the Information Society , DSTI/ICCP/IIS/M (99) 1, p. 3-4.
243 OECD (1999), NAICS, the ICT Sector and the Content Sector: the Canadian Experience and Proposed Approach, DSTI/ICCP/IIS/RD (99) 4.
244 OECD (2000), The Electronic Content Sector and Electronic Communication Products, DSTI/ICCP/IIS (2000) 1.

358 The Making of Science, Technology…, 2009
narrower definition that excluded marketing and advertising, libraries and museums, and education and health, the latter two because they targeted specific individuals or groups245. On the other hand, the United States delegate proposed keeping the set of industries larger, i.e.: education, health services and other industries where ICTs are having an impact on the way the product or service is delivered. In the end, delegates preferred to continue with France’s and Canada’s discussion paper as a framework. No agreement was reached, and the meeting ended with the suggestion to create an expert group and take a different approach that would include both traditional and electronic content246
What is not mentioned in the minutes of the Working Party (nor in the Guide discussed below) is the opposition of the United States to measuring informational (or cultural) content. As measured in a study by the Working Party on Information Economy on the content industry, the United States was the largest market for music and audio-visual sales and, above all, it dominated the European market
.
247. From the very beginning of the Working Party’s work on the ICT sector, the United States delegate refused to discuss and include content industries in the definition. The instructions to do so were given to him by the Department of Commerce, the Department of Trade and the State Department248
Despite the failure on content, the Working Party’s methodological outputs contributed to several statistical analyses by the Directorate for Science, Technology and Industry, firstly in terms of regular and
. As a consequence, two industries were eliminated from the 1998 ICT sector definition (reproduction of recorded media, and radio and television services).
245 OECD (2001), The Content Sector: Outline and Features, DSTI/ICCP/IIS
(2001) 5. 246 OECD (2000), Summary Record of the 4th Meeting of the Working Party
on Indicators for the Information Society, DSTI/ICCP/IIS/M (2000) 1, p. 5-6.
247 OECD (1996), Content as a New Growth Industry, DSTI/ICCP/IE (96) 6. 248 Confidential interview, 12 July 2004.

The Making of Science, Technology…, 2009 359
updated indicators on the information economy249 and the knowledge-based economy250, and secondly as contributions to projects like the Growth project (New Economy) which, according to the OECD, “with its fresh analysis and bold new conclusions [, made] quite a splash within the Organization”251
- A New Economy? The Changing Role of Innovation and Information Technology in Growth, 2000.
. Studies produced included:
- Drivers of Growth: Information Technology, Innovation and Entrepreneurship, 2001.
- Seizing the Benefits of ICT in a Digital Economy, 2003.
- ICT and Economic Growth: Evidence from OECD Countries, Industries and Firms, 2003.
- The Economic Impact of ICT: Measurement, Evidence and Implications, 2004.
How can we explain what enabled the Working Party on Indicators for the Information Society to succeed, whereas previous efforts had failed? Three factors can be identified. The first is history. The Working Party on Indicators for the Information Society worked at a time when industrial classifications, although still imperfect, had improved over the 1980s, and countries were able to deliver data more rapidly. The second reason is pragmatism, a lesson learned from the experiences of the 1980s. The Working Party developed a definition that could be implemented quickly and thus be of
249 OECD (2002), Measuring the Information Economy, Paris. From 1995, a
series of key Indicators plus metadata are published on http://www.oecd.org/document/23/0,2340,en_2649_34449_33987543_1_1_1_1,00.html.
250 See the OECD Science, Technology and Industry Scoreboard series for 2001 and after.
251 OECD (2000), Draft Summary Record of the 37th Session, DSTI/ICCP/M (2000) 1, p. 7.

360 The Making of Science, Technology…, 2009
immediate use to data users, and to this end it followed an industry definition252
The most recent output of the Working Party is a methodological guide published in 2005. Until 2001, the Working Party “agreed that standards and definitions will need to be revisited frequently in such a fast moving area. Rather than developing a manual on statistics for the information society, the group decided to continue with its approach of building blocks” (individual outputs accompanied by explanatory and methodological guidelines)”
. The most difficult tasks (content) were dealt with only when other work was finalized. The third factor has to do with the method of work. Unlike other Working Parties, such as the one on the Information Economy, here it was the Working Party on Indicators for the Information Society that conducted the work. Nearly all of the substantive work was done by the delegates, and not by the OECD.
253. Then, at the meeting in April 2001, the idea of a “manual collecting the definitional and methodological work carried out by the Working Party on Indicators for the Information Society” emerged: “the Working Party might want to consider whether to produce some synthesis of its definitional and methodological work, e.g. in the form of methodological guidelines for the measurement of statistics for the Information Society”254. By 2003, the Secretariat had produced an early draft of a guide that drew together the methodological decisions reached within the Working Party255. The guide was finalized for the 2005 World Summit on the Information Society held in Tunis256
252 OECD (1998), Summary Record of the Second Ad Hoc Meeting on
Indicators for the Information Society, DSTI/ICCP/AH/M (98)/REV1, p. 2.
.
253 OECD (2001), Summary Record of the Meeting of the Working Party on Indicators for the Information Society, DSTI/ICCP/IIS/M (2001) 1, p. 7.
254 OECD (2001), WPIIS Work Programme and Terms of Reference, DSTI/ICCP/IIS (2001) 6, p. 2.
255 OECD (2003), A Framework Document for Information Society Measurements and Analysis, DSTI/ICCP/IIS (2003) 9.
256 OECD (2005), Guide to Measuring the Information Society, DSTI/ICCP/IIS (2005) 6/FINAL.

The Making of Science, Technology…, 2009 361
The guide is a strange document. It is not really a methodological manual, but part of a new lot of documents not mature enough for international standards (see Appendix 2). The guide does not provide instructions and conventions for measuring the information economy or society. Essentially, it documents the statistical work of the Working Party on Indicators for the Information Society and related work done within the OECD on ICT:
- Products (goods and services),
- Infrastructure (telecommunications networks, Internet),
- Supply (industries)
- Demand (ICT and e-commerce) o Business o Households and Individuals
- Content
“The Guide describes areas of work sufficiently advanced in their conceptual and definitional underpinnings, and for which sufficient experiences have been accumulated”257, but it also discusses works in their early stages or works-in-progress. It includes discussions of debates that occurred during the development of that work and refers to OECD internal documents (not available for general distribution). The Guide is a “compilation (sic) of concepts, definitions, classifications and methods for the measurement of the information society”258. It is presented as a “living manual”, “open to receiving new components, as well as being subject to revision”259
Why had the Directorate for Science, Technology and Industry produced such a Guide – the third methodological document in the same year that did not deserve the name manual? At the OECD, it
.
257 OECD (2005), Guide to Measuring the Information Society, op. cit.,
p. 10. 258 Ibid. 259 Ibid., p. 6.

362 The Making of Science, Technology…, 2009
was hoped that the Working Party work “will become a standard reference”260, and help newcomers to the field to “progress more quickly”261. “It is hoped that the Guide will facilitate improved harmonization of practices (…). This, in turn, will enable better international comparability of data, a key requirement for benchmarking, identification of relative strengths and weakness, and tracking progress”262. Fine. However, there is a more political explanation, considering the past history of information statistics and the difficulties of the ICCP Committee in interesting people in its statistical output. On several occasions, the Working Party on Indicators for the Information Society congratulated itself that its work, as used in OECD studies, raised “the visibility of official ICT statistics”263 – as well as of the Information Technology Outlook series. This was also an important reason for the publication of an early Guide: increase the visibility of the Working Party on Indicators for the Information Society’s work and of the ICCP Committee264. Incidentally, the head of the Working Party himself (F. Gault) became head of a more visible group in 2002, namely the Group of Experts on Science and Technology Indicators (NESTI). A related factor in publishing an early Guide was “controlling” the field, namely extending the OECD standards to non-OECD countries265
260 Ibid.
. This factor, or task, was one to which the OECD devoted itself explicitly after the fall of the Berlin Wall. However, this was precisely what the OECD qualified as “empty internationalism” in the 1970s, when UNESCO tried to extend the measurement of
261 Ibid., p. 12. 262 Ibid. 263 OECD (2001), Summary Record of the Meeting of the Working Party on
Indicators for the Information Society, DSTI/ICCP/IIS/M (2001) 1, p. 8. 264 OECD (2001), WPIIS Work Programme and Terms of Reference,
DSTI/ICCP/IIS (2001) 6, p. 2. 265 OECD (2004), Policy Relevant Indicators and Empirical Analysis for the
Information Society: A Discussion of WPIIS Outputs and Ideas for Future Work, DSTI/ICCP/IIS (2004) 1, p. 9.

The Making of Science, Technology…, 2009 363
science, technology and innovation to Eastern countries, using new definitions developed specifically for this purpose266
CONCLUSION
.
Information has occupied a large part of the OECD’s work on science, technology and innovation. Since 1949, the organization has created as many as fifteen bodies specifically concerned with information policy, information technology and its measurement (see Appendix 11). These bodies have produced hundreds of working papers and notes. Over this period, the concept of information has shifted from an understanding concerned with knowledge, mainly scientific and technical knowledge, to technology. Two leitmotifs guided the efforts of the organization. The first was accounting. To the OECD, “it seems normal today, in statistical matters, to use an accounting framework based on the national accounts” (free translation)267. This was the model suggested in the United States by Machlup and Porat, and imitated in many other countries like France268
266 OECD (1977), Response by the Secretariat to the Questions of the Ad
Hoc Group, DSTI/SPR/77.52, p. 16.
, Great Britain (I. Miles), Germany and Australia. The second leitmotif was structural change. To the ICCP Committee, “the object of structural change has been on the policy agenda of OECD programmes for many years. In this context the transition of advanced economies from industrial societies to service and even information societies has gained particular momentum and attention. The Committee of ICCP has been attracted by such visions and [has]
267 “Il paraît aujourd’hui normal, en matière de systèmes statistiques, de se placer d’emblée dans un cadre de cohérence comptable inspiré de la comptabilité nationale.” OECD (1983), Plan de travail pour l’élaboration de statistiques relatives à l’information, à l’informatique et aux communications, DSTI/ICCP/83.13.
268 OECD (1982), The Statistical Information System on the Computer Sector: a French Proposal, DSTI/ICCP/82.22.

364 The Making of Science, Technology…, 2009
assessed the role of information technologies in this process of change”269
Over the whole period, a major objective, if not an ideal, of the OECD was measuring information and, to that end, developing a methodological manual. The cherished model for a manual was the Frascati manual, adopted in 1963 by member countries for surveying their R&D activities. Both for the Group on Information Policy and its project on a manual for Scientific and Technical Information Activities, and for the ICCP Committee and the manual for Information, Computers and Communication statistics, the proclaimed model to emulate was the Frascati manual. In the end, there has never been a Frascati-type manual produced for measuring information. The above two projects failed (as did a third on counting scientific papers, or bibliometrics: a manual was planned in the early 1990s
.
270, and drafted271, but then transformed into a working paper because its structure and coverage did not bear any relationship to a manual)272
How can we explain these failures? Apart from the conceptual, methodological and political factors as discussed in this chapter, the failure also has to do with the innovation capacities of the international organization. Although the OECD is a think tank for its member countries and produces papers by the thousand, the organization is rarely an innovator in the matter of theories and concepts. Generally, the organization needs exemplars or models.
. The only methodological guidelines on information available at the OECD appeared in 2005 in the form of a guide, not a manual.
269 OECD (1984), Update of Information Sector Statistics, op. cit., p. 3. 270 OECD (1991), Record of the NESTI Meeting, DSTI/STII/STP/NESTI/M
(91) 1; OECD (1997), Record of the NESTI Meeting, DSTI/EAS/STP/NESTI (97) 1.
271 OECD (1995), Understanding Bibliometrics: Draft Manual on the Use of Bibliometrics as Science and Technology Indicators, DSTI/STP/NESTI/SUR (95) 4.
272 Y. Okubo (1997), Bibliometric Indicators and Analysis of Research Systems: Methods and Examples, OECD/GD (97) 41.

The Making of Science, Technology…, 2009 365
This explains the success of the OECD Frascati manual. The manual rested entirely on the experience of the US National Science Foundation, itself the result of previous experiences since the 1920s273. This was also the case for the Oslo manual, a methodological manual for measuring innovation274, which benefited from a definition launched in the 1960s in a survey conducted by the US Department of Commerce275
The role of the OECD lies elsewhere. History shows that the OECD’s contribution to statistics is threefold. First, the organization selects a conceptual framework, generally a fashionable and recent one. This was the case for the information economy. Second, it adapts (often improves) a methodology (existing), and standardizes and conventionalizes it. This was the work of the Working Party on Indicators for the Information Society. Finally, the organization internationalizes early and “innovative” analyses (official and academic) conducted at the national level, as it did in studies on the role of information technology in productivity and on the emergence of a new economy.
, and a common understanding of what innovation was, at least among economists. The history of the failed manuals on information shows that in the absence of long experience and models, the OECD can proceed only slowly.
Despite the decades of work on the concept of information and its measurement, almost any kind of discourse can be, and is, conducted in an attempt to pin down the concept276
273 B. Godin (2005), Measurement and Statistics in Science and Technology:
1920 to the Present, London: Routledge.
. Even statistics, reputed for its power to crystallize and “objectivize” concepts, has failed to stabilize what information is or to produce a consensus operational
274 OECD (1991), OECD Proposed Guidelines for Collecting and Interpreting Innovation Data (Oslo Manual), DSTI/STII/IND/STP (91) 3. General distribution under catalog number OECD/GD (92) 26.
275 US Department of Commerce (1967), Technological Innovation: Its Environment and Management, USGPO, Washington.
276 F. Webster (2002), Theories of the Information Society, London: Routledge.

366 The Making of Science, Technology…, 2009
definition. Information remains a fuzzy concept, although many have jumped on the “bandwagon” of technology as a proxy for information in practice.

CONCLUSION


The Making of Science, Technology …, 2009 369
The measurement of science, technology and innovation is one hundred and fifty years old. Since the late 1860s, researchers have developed statistics, first on input, then on output1. Statistical bureaus followed after World War II2
Everyone wants evidence and indicators on impacts. As the OECD stated recently: “senior policymakers want and need to base their decisions upon more than advocacy, and upon more than indicators of inputs that have no established causal links to outcomes of research and development funding”
. As we have discussed in this book, the statistics served the many conceptual frameworks developed for policy purposes. What has proved more difficult is measuring the effects, or the impacts or outcomes, of science on society and on the economy. One would look in vain for a framework on the social impacts of science in the literature.
3. Recently, the OECD emphasized the “need for a better understanding of the links between public investments in basic research and their impacts on society”4
There has never been a conceptual framework constructed on the social impacts of science, technology and innovation. Certainly, history is full of discussions on the impacts of science, technology and innovation on society. And we owe to sociologists of the early 20th century the first systematic reflections on this subject. We also owe to them the first statistics developed for linking science, technology and innovation with their social impacts.
. But there are, so it is said, important conceptual and methodological challenges.
1 B. Godin (2007), From Eugenics to Scientometrics: Galton, Cattell and
Men of Science, Social Studies of Science, 37 (5), p. 691-728; B. Godin (2006), On the Origins of Bibliometrics, Scientometrics, 68 (1), p. 109-133.
2 B. Godin (2005), Measurement and Statistics on Science and Technology, London: Routledge.
3 OECD (2006), Summary of the Workshop on Science Policy: Developing our Understanding of Public Investment in Science, DSTI/STP/MS(2006)6, p. 2.
4 Ibid., p. 3.

370 The Making of Science, Technology…, 2009
If Karl Marx has been an early student of technology among the economists5, William J. Ogburn was the sociologist. Ogburn was one of those early researchers with an interest in the social impacts of science, technology and innovation6
Ogburn has been as important to introducing the subject of technology in sociology as Robert K. Merton has been for science. After Ogburn, however, sociologists turned to the internalist, or Mertonian, analysis of the scientific community. It was left to economists to develop the study of impacts. As to their contribution to the debates on technological unemployment in the 1930s, economists started measuring labor productivity (and, later, multifactor productivity) as the main statistics on the impacts of science, technology and innovation. Since then, economic growth, productivity and competitiveness have entirely defined officials’ understanding and measurement of the impacts of science, technology and innovation on society. Such impacts are many, but economists have focused, by definition, on economic ones, particularly economic growth, productivity and competitiveness. Governments followed. This happened from the very beginning of science policy in the 1960s, and acquired increased importance with new growth theories and discourses on the new economy in the
. Others were S. Colum Gilfillan, Hornell Hart and F. Stuart Chapin in the United States. In Europe, one can name the scientist J. D. Bernal. All shared an interest in science, technology and innovation and their impacts on society, and all five were quantifiers. Many theories, concepts and measurements yet to come in science, technology and innovation studies were already there (like the evolutionary nature of science, technology and innovation, exponential growth, the S-shaped curve). But Ogburn held a privileged place because of the volume and regularity of his writings over thirty years.
5 N. Rosenberg (1976), Marx as a Student of Technology, Monthly Review,
June-August, p. 56-77. 6 B. Godin (2008), Measuring the Social Impacts of Research: What
History Teaches Us, in S. Kuhlmann (ed.), Science Impact: Rethinking the Impact of Basic Research on Society and the Economy, Forthcoming.

The Making of Science, Technology …, 2009 371
1990s. This focus on economic growth, productivity and competitiveness as impact of science, technology and innovation we owe largely to the accounting framework used for measuring science. To “accounting”, the economics is what is significant, what is rendered visible and what becomes imperative for action. The social is the residual and is relegated to the periphery7
In the history of the OECD, there has been one and only one document centered on the social aspects of science, technology and innovation
.
8
In fact, it is organizations (and the economic sector to which they belong) that are the main actors of narratives on science, technology and innovation, above all firms (think of the innovation surveys), and not the individuals or groups who compose them, nor the people from society who are supposed to benefit from science, technology and innovation. Whereas early studies of science, technology and innovation, particularly sociological studies, were concerned with people and the varied impacts of science, technology and innovation on people’s lives, conceptual frameworks used in policy focus entirely on economic issues. Economic growth, productivity, competitiveness and profitability generally drive policies.
. It never led to a conceptual framework. The document was rather an erreur de parcours. The organization, as we have seen, entirely devoted its energies to documenting the economic aspects of science, technology and innovation, and used conceptual frameworks of an economically-oriented type to this end: accounting, economic growth, productivity and competitiveness. More recent frameworks are still of an economic kind: national innovation system, knowledge-based economy and information economy.
If conceptual frameworks can be compared, to a certain extent, to T. Kuhn’s paradigms in the sense that they serve as focusing devices for
7 A. G. Hopwood (1984), Accounting and the Pursuit of Efficiency, in A.
G. Hopwood and C. Tomkins (eds.), Issues in Public Sector Accounting, Oxford: Philip Allan, p. 167-187.
8 OECD (1971), Science, Growth, and Society: A New Perspective, Paris: OECD.

372 The Making of Science, Technology…, 2009
how to think about issues, there has been no revolution, or paradigm shift over the last sixty years. Certainly, the narratives have changed, as the emergence of new conceptual frameworks attests. But there has been no paradigm shift, only more economic obsession – under different guises9. The (official) statistics developed over history to support the frameworks are witness to this trend. Most are concerned with the economic dimensions of science. Thus, they have contributed to a specific understanding of science10. They are also responsible for the introduction into science studies and policies of concepts like scientific productivity11
A complete genealogy of the frameworks developed over the history of science policy waits to be written. Such a genealogy would certainly identify two broad types of frameworks: those concerned with accounting, and those based on economic performance. Under these two types, all the frameworks studied in this book fall, as well as narratives and statistics on science, technology and innovation.
.
Some authors often contrast science policies between two periods. The first period (policy for science) would have been concerned with funding science for its own sake, the golden age of university funding according to many researchers, while the second period (science for policy), in which we now live, is one where research is supported mainly for political and socioeconomic goals12
9 On how science policy is about how much rather that what for, see: D.
Sarewitz (2007), Does Science Policy Matter? Issues in Science and Technology, Summer, p. 31-38.
. Such a contrast is not
10 B. Godin (2005), Measurement and Statistics on Science and Technology: 1920 to the Present, London: Routledge.
11 B. Godin (2006). Statistics and STI Policy: How to Get Relevant Indicators. Communication presented at the OECD Blue Sky II Conference “What Indicators for Science, Technology and Innovation Policies in the 21st Century?” Canada: Ottawa. 25-27 September.
12 See, for example, the Piganiol report OECD (1963), Science and the Policies of Government, Paris, p. 18, and the Brooks report OECD (1972), Science, Growth and Society, Paris: OECD, p. 37. See also: A. Elzinga and A. Jamison (1995), Changing Policy Agenda in Science and

The Making of Science, Technology …, 2009 373
unlike a more recent one constructed by M. Gibbons et al. on the new production of knowledge, where Mode 2 (after 1945) is defined with characteristics totally opposed to Mode 1 (before 1945)13
Technology, in S. Jasanoff et al. (eds.), Handbook of Science and Technology Studies, Thousand Oaks (Calif.): Sage, p. 572-597.
. In fact, history is quite different. There has never been a “policy for science” period, as many authors argue, only a “science for policy” one, urging all sectors of society to contribute to innovation. Science policy has always been concerned with applying science to public goals. And from its very beginning, science policy, whether implicit or explicit, was constructed through reflections on accounting, economic growth, productivity, and competitiveness.
13 See B. Godin (1998), Writing Performative History: The New “New Atlantis”, Social Studies of Science, 28 (3), p. 465-483.


The Making of Science, Technology …, 2009 375
APPENDIX 1
LABELS USED FOR MODERN SOCIETAL TRANSFORMATIONS, 1950-1984
(Beniger, 1986) Year Transformation Source 1950 Lonely Crowd Riesman, 1950 Posthistoric Man Seidenberg ,1950 1953 Organizational Revolution Boulding, 1953 1956 Organization Man Whyte, 1956 1957 New Social Class Djilas, 1957; Gouldner, 1979 1958 Meritocracy Young, 1958 1959 Educational Revolution Drucker, 1959 Postcapitalist Society Dahrendorf, 1959 1960 End of Ideology Bell, 1960 Postmaturity Economy Rostow, 1960 1961 Industrial Society Aron, 1961; 1966 1962 Computer Revolution Berkeley, 1962; Tomeski, 1970;
Hawkes, 1971 Knowledge Economy Machlup, 1962; 1980; Drucker,
1969 1963 New Working Class Mallet, 1963; Gintis, 1970; Gallie,
1978 Postbourgeois Society Lichtheim, 1963 1964 Global Village McLuhan, 1964 Managerial Capitalism Marris, 1964 One-Dimensional Man Marcuse, 1964 Postcivilized Era Boulding, 1964 Service Class Society Dahrendorf, 1964 Technological Society Ellul, 1964 1967 New Industrial State Galbraith, 1967 Scientific-Technological Richta, 1967; Daglish, 1972;
Prague Revolution Academy, 1973 1968 Dual Economy Averitt, 1968 Neocapitalism Gorz, 1968

376 The Making of Science, Technology…, 2009
Postmodern Society Etzioni, 1968; Breed, 1971 Technocracy Meynaud, 1968 Unprepared Society Michael, 1968 1969 Age of Discontinuity Drucker, 1969 Postcollectivist Society Beer, 1969 Postideological Society Feuer, 1969 1970 Computerized Society Martin and Norman, 1970 Personal Society Halmos, 1970 Posteconomic Society Kahn, 1970 Postliberal Age Vickers, 1970 Prefigurative Culture Mead, 1970 Technetronic Era Brzezinski, 1970 1971 Age of Information Helvey, 1971 Communications Oettinger, 1971 Postindustrial Society Touraine, 1971; Bell, 1973 Self-Guiding Society Breed ,1971 Superindustrial Society Toffler, 1971 1972 Limits to Growth Meadows, 1972; Cole, 1973 Posttraditional society Eisenstadt, 1972 World without borders Brown, 1972 1973 New Service Society Lewis ,1973 Stalled Society Crozier, 1973 1974 Consumer Vanguard Gartner and Riessman, 1974 Information revolution Lamberton, 1974 1975 Communications Age Phillips 1975 Mediacracy Phillips, 1975 Third Industrial Revolution Stine, 1975; Stonier, 1979 1976 Industrial-Technological
Society Ionescu, 1976
Megacorp Eichner, 1976 1977 Electronics Revolution Evans, 1977 Information Economy Porat, 1977 1978 Anticipatory Democracy Bezold ,1978 Network Nation Hiltz and Turoff, 1978 Republic of Technology Boorstin, 1978 Telematic Society Nora and Minc, 1978; Martin, 1981 Wired Society Martin, 1978 1979 Collapse of work Jenkins and Sherman, 1979

The Making of Science, Technology …, 2009 377
Computer age Dertouzos and Moses, 1979 Credential society Collins, 1979 Micro millennium Evans, 1979 1980 Micro revolution Large 1980, 1984; Laurie, 1981 Microelectronics
revolution Forester, 1980
Third wave Toffler, 1980 1981 Information society Martin and Butler, 1981 Network market place Dordick, 1981 1982 Communications
revolution Williams, 1982
Information age Dizard, 1982 1983 Computer state Burnham, 1983 Gene age Sylvester and Klotz, 1983 1984 Second industrial divide Piore and Sabel ,1984


The Making of Science, Technology …, 2009 379
APPENDIX 2
METHODOLOGICAL DOCUMENTS FROM THE DIRECTORATE FOR SCIENCE,
TECHNOLOGY AND INDUSTRY (OECD)
(First edition) Manuals The Measurement of Scientific and Technical Activities: Proposed Standard Practice for Surveys of Research and Development (Frascati manual) (1962). Proposed Standard Practice for the Collection and Interpretation of Data on the Technological Balance of Payments (1990). Proposed Guidelines for Collecting and Interpreting Technological Innovation Data (Oslo manual) (1992). Data on Patents and Their Utilization as Science and Technology Indicators (1994). Manual on the Measurement of Human Resources in Science and Technology (Canberra manual) (1995). Measuring Productivity (2001). Handbook OECD Handbook on Economic Globalisation Indicators (2005). Framework A Framework for Biotechnology Statistics (2005). Guide Guide to Measuring the Information Society (2005). Statistics on the Careers of Doctorate Holders: Methodological Guidelines (2007). Others Bibliometric Indicators and Analysis of Research Systems: Methods and Examples (1997).

380 The Making of Science, Technology…, 2009
APPENDIX 3
Source: F. Machlup (1962), The Production and Distribution of Knowledge in the United States, Princeton: Princeton University Press, p. 180-181.
Appendix
The Flow of Ideas through the Stages of Research, Invention, and Development to Application
INPUT OUTPUT
Stage Intangible Tangible Measurable Intangible Measurable
I "Basic Research"
[Intended output: "Formulas"]
1. Scientific Knowledge (old stock and output from I-A)
2. Scientific problems and hunches (old stock and output from I-B, II-B and III-B)
ScientistsTechnical aidesClerical aides
Laboratories Materials, fuel, power
Men, man-hoursPayrolls, current and deflated
Outlays, current and deflatedOutlay per man
A. New scientific knowledge: hypotheses and theories
B. New scientific problems and hunches
C. New pratical problems and ideas
Research papers and memoranda; formulas
___
___
II"Inventive Work"(Including minor improvements but excluding further development of inventions)
[Intended output: "Sketches"]
1. Scientific Knowledge (old stock and output from I-A)
2. Scientific problems and hunches (old stock and output from II-A and III-A)
3. Practical problems and ideas (old stock and output from I-C, II-C, III-C and IV-A)
ScientistsNon-scientist inventorsEngineersTechnical aidesClerical aides
LaboratoriesMaterials, fuel, power
Men, man-hoursPayrolls, current and deflated
Outlays, current and deflatedOutlay per man
A. Raw inventions: technological recipes
a. Patented inventions b. Patentable inventions, not patended but published c. Patentable inventions, neither patented nor published d. Non-patentable inventions, published e. Non-patentable inventions, not published f. Minor improvements
B. New scientific problems and hunches
C. New pratical problems and ideas
a. Patent applications and patentsb. Technological papers and memorandac. ___d. Papers and memorandae. ___
f. ___
___
___
III"Development Work"
[Intended output: "Blueprints and Specifications"]
1. Scientific Knowledge (old stock and output from I-A)
2. Technology (old stock and output from III-A)
3. Practical problems and ideas (old stock and output from I-C, II-C, III-C and IV-A)
4. Raw inventions and improvements (old stock and output from II-A)
ScientistsEngineersTechnical aidesClerical aides
LaboratoriesMaterials, fuel, power
Pilot plants
Men, man-hoursPayrolls, current and deflated
Outlays, current and deflatedOutlay per man
Investment
A. Developed inventions: blueprints, specifications, samples
B. New scientific problems and hunches
C. New pratical problems and ideas
Blueprints and specifications
___
___
IV"New-type Plant Construction"
[Intended output:"New-type plant"]
1. Developed inventions (output from III-A)
2. Business acumen and market forecasts
3. Financial resources
4. Enterprise (venturing)
EntrepreneursManagersFinanciers and bankersBuilders and contractorsEngineers
Building materialsMachines and tools
$ investment in new-type plant
A. New pratical problems and ideas
New-type plant producing a. novel products b. better products c. cheaper products

The Making of Science, Technology …, 2009 381
APPENDIX 4
INDICATORS OF KNOWLEDGE FLOWS IN NATIONAL INNOVATION SYSTEMS
(National Innovation Systems, OECD, 1997)
Type of knowledge flow Main [source of] indicator
Industry alliances Inter-firm research cooperation Firm surveys Literature-based counting
Industry/university interactions Cooperative industry/university R&D university annual reports Industry/University co-patents patent record analysis Industry/University co-publications publications analysis Industry use of university patents citation analysis Industry/University information-sharing firm surveys
Industry/University institute interactions
Cooperative industry/institute R&D government reports Industry/institute co-patents patent record analysis Industry/institute co-publications publications analysis Industry use of research institute patents citation analysis Industry/institute information-sharing firm surveys
Technology diffusion Technology use by industry firm surveys Embodied technology diffusion input-output analysis
Personnel mobility Movement of technical personnel among labour market statistics Industry, university and research university/institute reports


The Making of Science, Technology …, 2009 383
APPENDIX 5
INDICATORS FROM THE KNOWLEDGE-BASED ECONOMY: A SET OF
FACTS AND FIGURES
(OECD, 1999)
1. Knowledge-based economy a. Investments in capital and knowledge b. Human resources (education) c. GERD d. Fundamental research e. Business R&D f. R&D in manufacturing industries g. R&D in services h. Innovation i. Venture capital
2. Information and communication technologies (ICT) a. ICT spending as a percentage of GNP b. Use of computers c. Internet and e-commerce d. ICT sector e. Innovation in ICT
3. S&T policies a. Public R&D/GNP b. Socio-economic objectives of R&D c. Share of public R&D d. R&D financial flows between sectors e. Public support to R&D

384 The Making of Science, Technology…, 2009
f. Business R&D by size g. Tax subsidies
4. Globalization a. R&D abroad b. Patent ownership c. Technological alliances d. Co-signatures and co-inventions
5. Output and impact a. Scientific publications b. Patents c. Innovation d. Productivity e. Share of knowledge industries in added value f. High technology trade g. Technological balance of payments

The Making of Science, Technology …, 2009 385
APPENDIX 6
INDICATORS FROM TOWARDS A KNOWLEDGE-BASED ECONOMY
(OECD, 2001)
A. Creation and Diffusion of Knowledge
Investments in knowledge
Domestic R&D expenditure
R&D financing and performance
Business R&D
Business R&D by industry
R&D in selected ICT industries and ICT patents
Business R&D by size classes of firms
Collaborative efforts between business and the public sector
R&D performed by the higher education and government sectors
Public funding of biotechnology R&D and biotechnology patents
Environmental R&D in the government budget
Health-related R&D
Basic research
Defence R&D in government budgets
Tax treatment of R&D
Venture capital
Human resources
Human resources in science and technology
Researchers
International mobility of human capital

386 The Making of Science, Technology…, 2009
International mobility of students
Innovation expenditure and output
Patent applications to the European Patent Office (EPO)
Patent families
Scientific publications
B. Information Economy
Investment in information and communication technologies (ICT)
Information and communication technology (ICT) expenditures
Occupations and skills in the information economy
Infrastructure for the information economy
Internet infrastructure
Internet use and hours spent on-line
Access to and use of the Internet by households and individuals
Internet access by enterprise size and industry
Internet and electronic commerce transactions
Price of Internet access and use
Size and growth of the ICT sector
Contribution of the ICT sector to employment growth
Contribution of the ICT sector to international trade
Cross-border mergers, acquisitions and alliances in the ICT sector
C. Global Integration of Economic Activity
International trade
Exposure to international trade competition by industry
Foreign direct investment flows
Cross-border mergers and acquisitions
Activity of foreign affiliates in manufacturing
Activity of foreign affiliates in services

The Making of Science, Technology …, 2009 387
Internationalization of industrial R&D
International strategic alliances between firms
Cross-border ownership of inventions
International co-operation in science and technology
Technology balance of payments
D. Economic Structure and Productivity
Differences in income and productivity
Income and productivity levels
Recent changes in productivity growth
Labour productivity by industry
Technology and knowledge-intensive industries
Structure of OECD economies
International trade by technology intensity
International trade in high and medium-high-technology industries
Comparative advantage by technology intensity


The Making of Science, Technology …, 2009 389
APPENDIX 7
BASIC DATA FOR INFORMATION POLICY
(From DAS/STINFO/69.10)
Characteristics of existing information sources and services:
(a) Type and number of primary services, volume of information, field, mode of financing services, etc.
(b) Type and number of secondary services, fields covered, services offered, number and qualifications of staff, equipment, performance, method of financing, etc.
Market for information:
(a) The various types of users, their present and potential specific needs;
(b) The foreseeable development of these needs;
(c) The relative efficiency of the various information services in the light of these needs;
(d) The identification of present and future needs to be met;
(e) The influence of promotion operations on the development of needs.
Role of information and its links with other activities:
(a) The educational role of information and the training facilities which the new information services need for their operators and users;
(b) The reciprocal relations and interaction of information and research;

390 The Making of Science, Technology…, 2009
(c) The contribution of information to the scientific, economic and social activities of the nation and how far would the development of certain information activities help the nation to achieve the goals it has set itself in these fields?
General economy of information activities:
(a) Cost of the main information services and their cost/efficiency ratios;
(b) The development prospects of certain services, enabling them to become self supporting;
(c) The general cost of information and its distribution among the different sectors of the economy;
(d) State finances assigned to these activities and the financial constraints applied;
(e) The foreseeable growth in costs and its distribution among the different sectors of the economy.
Characteristics of new systems:
(a) What are their technical characteristics and performances;
(b) How will they be integrated with existing services;
(c) What work of research, promotion and training will they need;
(d) What will they cost to install and operate and what commercial possibilities do they offer?

The Making of Science, Technology …, 2009 391
APPENDIX 8
BASIC STATISTICS FOR STI INDICATORS
(From DAS/STINFO/74.28)
Volume of information produced and used
Primary publications
a. number of publications (books, periodicals, etc.) produced by language
b. number of pages printed (number of pages x number of copies) by scientific disciplines and/or by mission
Secondary services
a. number of services by information activity
b. number of services by scientific discipline and/or mission
c. number of citations published
d. number of abstracts produced
e. number of existing databases by scientific discipline and/or mission
f. number of SDI profiles
g. number of retrospective searches
Libraries
a. number of libraries with number of books and number of periodicals held
b. number of books and periodicals lent
c. number of visitors or enquiries
d. number of photocopies and of microfiches produced
e. number of translations
Congress

392 The Making of Science, Technology…, 2009
a. number of national and international congresses, symposia, etc. by scientific discipline and/or mission
b. number of participants
Computer and communication
Computers used for STI activities
a. number of computers used full-time
b. number of computers used part-time
c. number of terminals
Volume of communication traffic
Potential users of STI
a. scientists and engineers by scientific discipline
b. scientists and engineers by sector of employment
c. R&D scientists and engineers by scientific activity
d. technicians by sector of employment

The Making of Science, Technology …, 2009 393
APPENDIX 9
POLICY ISSUES FOR ICC STATISTICS
(From ICCP (83) 9)
1. How fast are the information-technology-based activities being diffused in member countries? Is economic welfare related to the speed of diffusion?
2. What are the factors influencing the rate of diffusion? Are there any implications for policy formulation?
3. What have been and will be the likely effects of information technology on levels of employment (both direct and indirect)?
4. What have been and will be the likely effects of information technology on structures of employment? Which occupational groups are being made redundant; which new groups are being created; and which groups are being only marginally affected by the new technologies (to be broken down by industrial sector, sex, age, geographical location, etc.)?
5. Is information technology “neutral” or “biased” toward the relative saving of labor or capital?
6. What are the impacts of information technology on work and the home environment?
7. Will information technology affect income distribution between wages and profits, and if so, what remedial measures could be adopted?
8. Is information technology likely to initiate a new long-term cycle of investment and growth?
9. What are the factors fostering long-term business confidence and will information technology systems affect these factors?
10. Are existing financial mechanisms adequate to support the use of the new technologies and industries?

394 The Making of Science, Technology…, 2009
11. What are the effects of information technology on domestic and international market structures (e.g.: via scale economies, barriers to entry, etc.)?
12. What are the likely impacts of information technology goods and services on patterns of international specialization and trade flow?
13. Is information technology a useful medium for promoting “conservation” (e.g.: energy, materials, avoidance of pollution, etc.)?
14. Will information technology systems promote or retard the development of personal autonomy (privacy, etc.)?
The Making of Science, Technology …, 2009 395
APPENDIX 10
ICCP RED SERIES
1. Transborder Data Flows and the Protection of Privacy, 1979
2. The Usage of International Data Networks in Europe, 1979
3. Policy Implications of Data Network Developments in the OECD Area, 1980
4. Handbook of Information, Computer and Communications Activities of Major International Organisations, 1980
5. Microelectronics Productivity and Employment, 1981
6. Information Activities, Electronics and Telecommunications Technologies, Volume 1: Impact on Employment, Growth and Trade, 1981: Volume 2: Expert’s Report (“Background Papers” Series)
7. Microelectronics, Robotics and Jobs, 1982
8. An Exploration of Legal Issues in Information and Communication Technologies, 1983
9. Software: An Emerging Industry, 1985
10. Computer-Related Crime, Analysis of Legal Policy, 1986
11. Trends in Information Economy, 1986
12. Information Technology and Economic Prospects, 1987
13. Trends in Change in Telecommunications Policy, 1987
14. The Telecommunications Industry: The Challenges of Structural Change, 1988
15. Satellites and Fibre Optics - Competition Complementarity, 1988
16. New Telecommunications Services - Videotex Development Strategies, 1989
17. The Internationalization of Software and Computer Services, 1989

396 The Making of Science, Technology…, 2009
18. Telecommunication Network-Based Services: Policy Implications, 1989
19. Information Technology and New Growth Opportunities, 1989
20. Major R&D Programmes for Information Technology, 1989
21. Trade in Information, Computers and Communications Services, 1990
22. Performance Indicators for Public Telecommunications Operators, 1990
23. Universal Service and Rate Restructuring in Telecommunications, 1991
24. Telecommunications Equipment: Changing Materials and Trade Structures, 1991
25. Information Technology Standards: The Economic Dimension, 1991
26. Software Engineering: The Policy Challenge, 1991
27. Telecommunications Type Approval: Policies and Procedures for Material Access, 1992
28. Convergence Between Communications Technologies: Case Studies for North America and Western Europe, 1992
29. Telecommunications and Broadcasting: Convergence or Collision?, 1992
30. Information Networks and New Technologies: Opportunities and Policy Implications for the 1990s, 1992
31. Usage Indicators: A New Foundation for Information Technology Policies, 1993
32. Economy and Trade Issues in the Computerized Database Market, 1993
33. The Economics of Radio Frequency Allocation, 1993
34. International Telecommunications Tariffs: Charging Practices and Procedures, 1994

The Making of Science, Technology …, 2009 397
35. Telecommunications Infrastructure: The Benefits of Competition, 1995
36. International Telecommunications Pricing Practices and Principles: A Progress Review, 1995
37. Price Caps for Telecommunications: Policies and Experiences, 1995
38. Universal Service Obligations in a Competitive Telecommunications Environment, 1995
39. Mobile Cellular Communication: Pricing Strategies and Competition, 1996


The Making of Science, Technology …, 2009 399
APPENDIX 11
BODIES OF THE OEEC/OECD RESPONSIBLE FOR INFORMATION
OEEC Working Party on Scientific and Technical Information 1949 OECD (Directorate for Scientific Affairs, then Directorate for Science, Technology and Industry)
Committee for Scientific Research Ad Hoc Group on Scientific and Technical Information 1962 Ad Hoc Group on Information Policy 1965 Panel on the Economics of Information 1965 Committee on Science Policy (then Committee for Science and Technology Policy)
Group on Computer Utilization 1969 Working Party on Information, Computer, and Communications Policy
1977
Group of Experts on the Economic Analysis of Information Activities
1977
Division on Information, Computer, and Communications Policy
1978
Committee on Information, Computer, and Communications Policy
1982
Ad Hoc Group on Information and Communication Statistics
1982
Group of Experts on the Economic Implications of Information Technology
1988
Working Party on Information Technology Policy 1993 Wor king Party on the Information Economy 1995 Statistical Panel on GII/GIS 1996 Working Party on Indicators for the Information Society 1998