the labour market
TRANSCRIPT

Newham, London Local Economic Assessment
2010 to 20279
Newham - Economic Development


Page 1 London Borough of Newham
4. 3BThe Labour Market: Employment, Worklessness
and Skills
Summary
• Newham has a very low employment rate with particularly low employment rates for women and ethnic minorities.
• Over one-third of residents are economically inactive.
• JSA claimant rates are higher than the London average and the claimant count has increased rapidly as a result of the recession.
• The high rate of long-term IB/ESA claimants shows that many residents face significant multiple barriers to work and training.
• There are particularly high concentrations of out-of-work benefit claimants in the South West area of the Borough (Canning Town and Plaistow North), although all wards in Newham have higher than average claimant rates.
• A significant proportion of Newham residents have low or no skills.
• GCSE attainment in Newham is lower than the London average but almost 90% of Newham school leavers now go on to further and higher education, an increase since 2007.
4.1 This section of the Assessment examines the broader labour market context in
Newham before focusing on the work and skills challenge, including:
• Employment – employment and job density, productivity and earnings, and occupational structure;
• Worklessness – out-of-work benefit claimants, geographical concentrations of worklessness, young people not in education employment or training (NEETs); and,
• Skills – adult skills, and schools performance.
Jobs in Newham
4.2 As of 2008 there were approximately 69,860 jobs in Newham. Newham has fewer jobs per head of population than would be expected for a borough of its size and significance. Jobs density in Newham is less than half that of London. There are 0.5 jobs per working age resident compared with 0.88 in London as a wholeF
1F. This, in part, is representative of Newham’s role in relation to the
capital with significant numbers of people living in the Borough but commuting to work in central London. However, it is also representative of the historic decline of the Borough as an employment location due to the closure of the docks and a reduction in manufacturing, which has continued in recent decades.
1 ONS, Annual Business Inquiry (2008)

Page 2 London Borough of Newham
4.3 Between 2003 and 2008 jobs growth of 9.6% was recorded compared with 6.1% across London as a whole. However, this obscures the fact that employment declined from a peak of 72,508 in 2007 to less than 70,000 in 2008, equivalent to a 3.7% decline between the two years, whilst employment in London grew consistently over the period 2003 to 2008.
4.4 The main sectors where employment has been created in the last 10 years include distribution, retail, business services, and the public sector. In contrast, employment has continued to decline in manufacturing. Section 5 discusses the sectoral composition of Newham’s economy in detail.
Productivity and Earnings
4.5 Data on productivity and earnings suggests that on average people working in Newham earn higher wages than Newham residents. On average people working in Newham are earning £97 per week more than the working residents (see graph below) and worker wages in Newham are not dissimilar from the London average.
Gross Weekly Pay by Place of Residence and Place of Work (2009)F
2
£400
£450
£500
£550
£600
£650
£700
£750
£800
£850
£900
Newham Greenwich Hackney Tower
Hamlets
Waltham
Forest
London
Residents
Workers
Source: ONS, Annual Survey of Hours and Earnings (2009)
4.6 Further to the above, Gross Value Added (GVA) per employee (a measure of workforce productivity) in Newham is £47,035 which, while significantly lower than the Greater London average of £59,300, is higher than the UK average of £45,154 in the UKF
3F. This discrepancy may be because local residents do not
typically have sufficient skills to access the higher value jobs in Newham, with the result that they are occupied by people that live outside the Borough. This emphasises the importance of, and challenges associated with, ensuring local people have the necessary skills and qualifications to take advantage of the new job opportunities that become available in the Borough.
2 Note: All figures are medians. 3 Experian as reported in GVA Grimley on behalf of LB Newham (2010) London Borough of Newham Employment Land Review – Draft Final Report

Page 3 London Borough of Newham
4.7 While job growth was particularly strong in Newham between 1996 and 2007, the new jobs have not been particularly high value. In 2007 Newham’s GVA stood at £4.2 billion, an increase of 55% since 1992, which was lower than the Greater London increase of 68% and similar to the UK increase of 54%F
4F.
However during this same period, employment growth in Newham was higher than for Greater London or the UK, growing by 28% (1992-2006), compared with 19.5% across Greater London and 15% across the UK.
4.8 Returning to resident wages, Newham has the lowest average gross annual income of all London residents, with an average income of £24,958, compared to £37,622 for the London average and £33,163 for the host borough average. Between 2005 and 2009, average annual gross income within Newham increased by 16% from £21,570 to £24,958. This increase was above the London average, but below the growth experienced in Greenwich, Tower Hamlets and Waltham Forest.
Average Gross Annual Income (2005 – 2009)
2005 2006 2007 2008 2009
%
Change
2005 -
2009
Newham £21,570 £23,562 £23,621 £23,878 £24,958 16%
Greenwich £27,023 £31,140 £32,117 £37,871 £35,533 31%
Hackney £26,913 - - £32,195 £30,533 13%
Tower Hamlets £33,524 £35,963 £41,233 £41,594 £45,710 36%
Waltham Forest £24,205 £26,272 £27,839 £28,309 £29,080 20%
Host Borough
Average £26,647 £23,387 £24,962 £32,769 £33,163 24%
London £33,303 £34,598 £36,514 £37,759 £37,622 13%
Source: ONS, Annual Survey of Hours and Earnings (2008)
The distribution of income across the Borough is skewed heavily towards low incomes. 40% of residents earn less than £20,000 and 50% less than £25,000.
4 Experian as reported in GVA Grimley on behalf of LB Newham (2010) London Borough of Newham Employment Land Review – Draft Final Report

Page 4 London Borough of Newham
Distribution of household equivalised pay (2009)
0%
2%
4%
6%
8%
10%
12%
14%
16%
0-5k
5-10
k
10-1
5k
15-2
0k
20-2
5k
25-3
0k
30-3
5k
35-4
0k
40-4
5k
45-5
0k
50-5
5k
55-6
0k
60-6
5k
65-7
0k
70-7
5k
75-8
0k
80-8
5k
85-9
0k
90-9
5k
95-1
00k
100k
+
Newham London
Source: CACI, Paycheck (2009)
4.9 The greatest beneficiaries of rising average income levels within Newham have been full-time workers. Full-time workers have seen their average earnings grow by 17% between 2005 and 2009, from £24,798 to £29,025F
5F. In contrast,
part-time workers have seen their average incomes decline by 1.5% from £9,788 to £9,643F
6F.
4.10 Distribution of average annual income by gender is less diverse than other London Boroughs, with the difference between male and female earnings being £5,919, compared to an average of £19,703 for LondonF
7F. In recent years
growth in male average incomes has outpaced female incomes, widening the gap, while at the same time the gap has narrowed across London.
4.11 In terms of the geography of earnings, Green Street East ward has the lowest average household income with £22,561F
8F. Royal Docks with £40,721 has the
highest equivalised household incomeF
9F. The difference between the average
incomes of these two areas is £18,160, illustrating the level of income disparity within the Borough.
5 ONS (2009) Annual Survey of Hours and Earnings 6 ONS (2009) Annual Survey of Hours and Earnings 7 ONS, Gross Annual Income: Males and Females (2009) 8 CACI, Paycheck (2009) 9 CACI, Paycheck (2009)

Page 5 London Borough of Newham
Mean Income by Output Area (2009)
Source: CACI, Paycheck (2009)
Occupational Structure
4.12 According to the Annual Population Survey, residents in Newham are more likely to work in sales and customer services or elementary occupations, than in managerial and senior professional occupations. A significantly higher proportion of Newham residents are employed in elementary occupations – 20% compared with 14.2% across the host boroughs and just 9.7% across London as a whole. The importance of retail for the Borough is emphasised by the high proportion of residents employed in sales and customer service occupations. 16.2% of Newham residents are employed in such occupations compared to 8.5% and 6.8% respectively across the host boroughs and London as a whole.
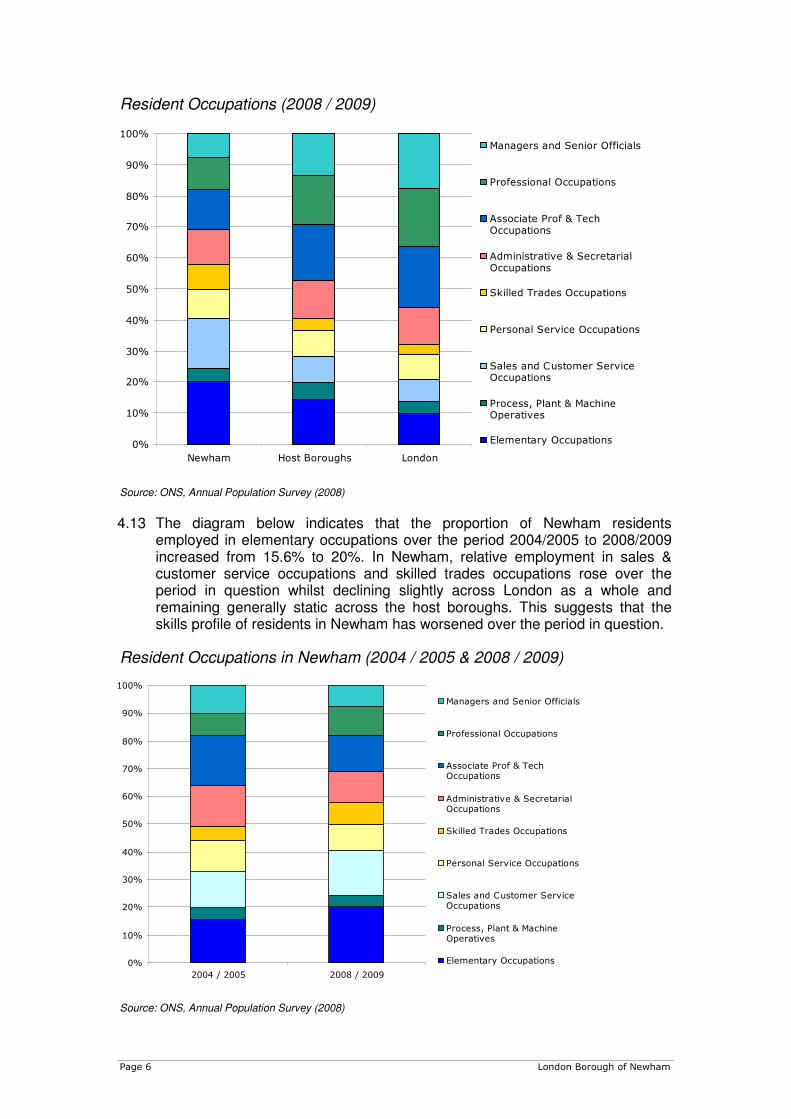
Page 6 London Borough of Newham
Resident Occupations (2008 / 2009)
0%
10%
20%
30%
40%
50%
60%
70%
80%
90%
100%
Newham Host Boroughs London
Managers and Senior Officials
Professional Occupations
Associate Prof & TechOccupations
Administrative & SecretarialOccupations
Skilled Trades Occupations
Personal Service Occupations
Sales and Customer ServiceOccupations
Process, Plant & MachineOperatives
Elementary Occupations
Source: ONS, Annual Population Survey (2008)
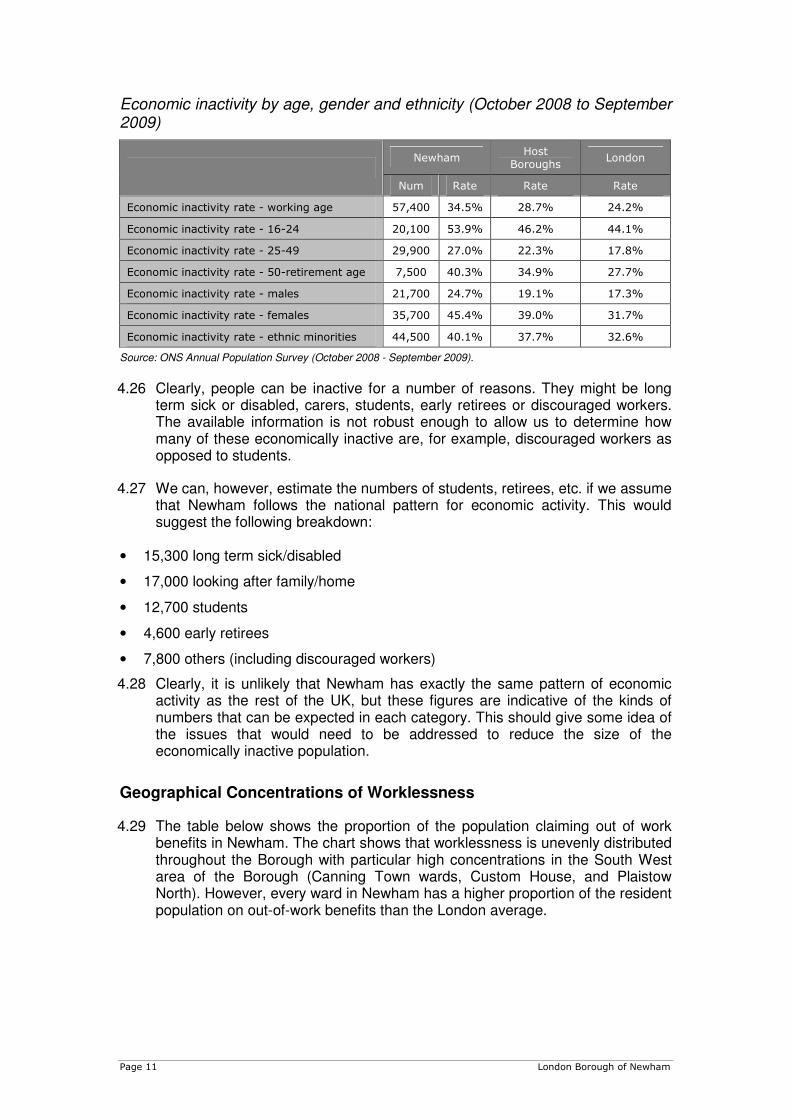
4.13 The diagram below indicates that the proportion of Newham residents employed in elementary occupations over the period 2004/2005 to 2008/2009 increased from 15.6% to 20%. In Newham, relative employment in sales & customer service occupations and skilled trades occupations rose over the period in question whilst declining slightly across London as a whole and remaining generally static across the host boroughs. This suggests that the skills profile of residents in Newham has worsened over the period in question.
Resident Occupations in Newham (2004 / 2005 & 2008 / 2009)
0%
10%
20%
30%
40%
50%
60%
70%
80%
90%
100%
2004 / 2005 2008 / 2009
Managers and Senior Officials
Professional Occupations
Associate Prof & TechOccupations
Administrative & SecretarialOccupations
Skilled Trades Occupations
Personal Service Occupations
Sales and Customer ServiceOccupations
Process, Plant & MachineOperatives
Elementary Occupations
Source: ONS, Annual Population Survey (2008)

Page 7 London Borough of Newham
Worklessness
4.14 Historically, Newham’s employment base has been characterised by low skills and low wages with local people reliant on the railways and Docks to the south of the Borough, and the manufacturing and other industries in sites across the Lea Valley. However as was the case across England, the docks and manufacturing industries began to dramatically decline in the post-war period. As a result of the decline of these traditional industries, Newham residents suffered high levels of worklessness and benefit dependency, leading to an increase in the numbers of people without work experience or skills appropriate to the changing labour market. The continuation of this situation has led to generational unemployment and high levels of poverty in Newham. In turn, poverty has a defining impact on a range of other issues such as health and educational attainment.
4.15 Despite recent progress in reducing worklessness, the Borough still faces considerable challenges. Worklessness in Newham has a number of complex and inter-connected roots. These include: lack of work experience and poor access to social networks, low skill levels, poor English language skills, childcare, health and mental health problems. Some residents lack motivation, aspiration and access to the appropriate information on opportunities available to them.
4.16 It is important to understand how worklessness is defined. Worklessness incorporates anyone who is unemployed or is economically inactive but seeking work. According to the standard International Labour Organisation (ILO) definition, unemployment applies to anyone over the age of 16 who is not in employment, education or on a government training scheme - if they have actively sought work within four weeks of the reference date and are available to commence work within the next two weeks.
4.17 By contrast, economic inactivity describes those who are not employed but are not defined as being unemployed due to lack of job search activity or availability criteria. Crucially, this can include those who are seeking work but do not fulfil the requisite criteria to be considered unemployed. However, it can also cover those who are of working age but do not wish to work for whatever reason (e.g. students.)
4.18 The chart below breaks down the labour force in Newham by economic activity and economic inactivity. The following section examines the number of people employed, unemployed and economically inactive.

Page 8 London Borough of Newham
Economic Activity and Inactivity in Newham (2008 - 2009)
Source: Working Age Population source ONS mid-year population estimates (2008); All remaining figures source Annual Population Survey (October 2008 - September 2009).
Employed Residents
4.19 In 2008 / 2009, there were approximately 93,700 Newham residents in employment out of a total working age population of 166,600. This amounted to 56.2% of the working age population compared to 63.5% and 69.3% for the host boroughs and London as a whole respectively. Employment rates varied enormously by gender with a male employment rate of 64.8% and a female employment rate of 46.6%, though in both cases this was significantly lower than the London average.
Employment Rate of Working Age Population by Gender (2008 / 2009)
0.0%
10.0%
20.0%
30.0%
40.0%
50.0%
60.0%
70.0%
80.0%
All People Males Females
Newham
HostBoroughs
London
Working Age Population
166,600
Economically Active
109,200 (65.5%)
Economically Inactive
57,400 (34.5%)
Employed 93,700 (56.2%)
Unemployed 15,500 (14.2%*)
*Percentage of
Economically Active
Want to work 9,200 (5.5%)
Not looking for work
49,000 (29.4%) Includes Carers,
Students, etc.

Page 9 London Borough of Newham
Source: ONS Annual Population Survey (October 2008 - September 2009).
4.20 Newham’s employment rate has consistently declined since 2005 / 2006, from 58.3% in that year to 56.2% today whilst over the same time period the host boroughs employment rate rose from 60.9% to 63.5% and the London average rose from 68.6% to 69.3%.
Unemployed Residents
4.21 Unemployment is exceptionally high in Newham, affecting 14.2% of the economically active working age population compared with 8.6% across LondonF
10F. This is equivalent to approximately 15,500 unemployed Newham
residents. The graph below illustrates that unemployment is significantly higher among males than females in Newham, which reflects the wider London trend and is primarily due to higher rates of female economic inactivity. However, for both males and females, unemployment is significantly higher in Newham than in the host boroughs or London as a whole.
Unemployment Rate of Working Age Population by Gender (2008 / 2009)
0.0%
2.0%
4.0%
6.0%
8.0%
10.0%
12.0%
All People Males Females
Newham
HostBoroughs
London
Source: ONS Annual Population Survey (October 2008 - September 2009).
Economically Inactive Residents
4.22 As with unemployment, levels of economic inactivity in Newham are much higher than the London and national averages. There were a total of 57,400 economically inactive residents in 2008/09, accounting for 34.5% of the working age population compared to host borough and London averages of 28.7% and 24.2% respectively.
10 ONS, Annual Population Survey (October 2008 - September 2009). Note: Proportions are a percentage of the working age population.

Page 10 London Borough of Newham
Economic Inactivity Rate of Working Age Population by Gender (2008 / 2009)
0.0%
5.0%
10.0%
15.0%
20.0%
25.0%
30.0%
35.0%
40.0%
45.0%
50.0%
All People Males Females
Newham
HostBoroughs
London
Source: ONS, Annual Population Survey (October 2008 - September 2009)
4.23 The proportion of the working age population who are economically inactive has risen over the last four years, again in contrast to regional and national trends.
4.24 Of those defined as economically inactive, 9,200 are recorded as wanting to work and 49,000 are recorded as not wanting to work. The 9,200 economically active residents who want to work and the 15,500 unemployed individuals form the official ‘workless’ population of Newham.
4.25 Understanding the economically inactive population is central to determining an effective worklessness strategy. One way we can analyse the economically inactive in Newham is by age, gender and ethnicity, as per the table below. This data shows that the gap with the London average is widest amongst females with economic inactivity rates 7% higher in Newham compared to London as a whole.
Page 11 London Borough of Newham
Economic inactivity by age, gender and ethnicity (October 2008 to September 2009)
Newham Host
Boroughs London
Num Rate Rate Rate
Economic inactivity rate - working age 57,400 34.5% 28.7% 24.2%
Economic inactivity rate - 16-24 20,100 53.9% 46.2% 44.1%
Economic inactivity rate - 25-49 29,900 27.0% 22.3% 17.8%
Economic inactivity rate - 50-retirement age 7,500 40.3% 34.9% 27.7%
Economic inactivity rate - males 21,700 24.7% 19.1% 17.3%
Economic inactivity rate - females 35,700 45.4% 39.0% 31.7%
Economic inactivity rate - ethnic minorities 44,500 40.1% 37.7% 32.6%
Source: ONS Annual Population Survey (October 2008 - September 2009).
4.26 Clearly, people can be inactive for a number of reasons. They might be long term sick or disabled, carers, students, early retirees or discouraged workers. The available information is not robust enough to allow us to determine how many of these economically inactive are, for example, discouraged workers as opposed to students.
4.27 We can, however, estimate the numbers of students, retirees, etc. if we assume that Newham follows the national pattern for economic activity. This would suggest the following breakdown:
• 15,300 long term sick/disabled
• 17,000 looking after family/home
• 12,700 students
• 4,600 early retirees
• 7,800 others (including discouraged workers)
4.28 Clearly, it is unlikely that Newham has exactly the same pattern of economic activity as the rest of the UK, but these figures are indicative of the kinds of numbers that can be expected in each category. This should give some idea of the issues that would need to be addressed to reduce the size of the economically inactive population.
Geographical Concentrations of Worklessness
4.29 The table below shows the proportion of the population claiming out of work benefits in Newham. The chart shows that worklessness is unevenly distributed throughout the Borough with particular high concentrations in the South West area of the Borough (Canning Town wards, Custom House, and Plaistow North). However, every ward in Newham has a higher proportion of the resident population on out-of-work benefits than the London average.

Page 12 London Borough of Newham
LSOAs in Newham out-of-work benefit claimant rates (2009)
Source: DWP
Out-of-Work Benefit Claimants
4.30 A large number of working age residents in the Borough are in receipt of one or more out of work benefits from the Department of Work and Pensions (e.g. Job Seekers Allowance, Incapacity Benefit/Employment Support Allowance, Lone Parent Benefit and Income Support). Many of these people may wish to work even though they may not actively be looking for employment. However, they can often face a number of barriers to employment (e.g. low skills, lack of availability of transport and childcare, effect of benefits system, poor health, and debt) and tend to be cut off from any opportunities that arise in the local labour market, finding it difficult to compete.
4.31 In August 2009 there were around 30,800 out-of-work benefit claimants in the Borough, representing 18.6% of the working age population. This figure was above the London average (13.7%) and the national rate (13.5%) and slightly higher than the host borough average (18.3%).
4.32 Prior to the recession the number of workless benefit claimants in Newham was falling and at a slightly faster rate than the London average. However, over the period August 2008 to August 2009 there was a rise in the total number of out-of-work claimants in the Borough. The increase in out-of-work benefit claimants in Newham has been below average. The number of out-of-work benefit

Page 13 London Borough of Newham
claimants rose by 7%, or 2,900 people, over the period - smaller than the 12% rise experienced across London as a whole.
4.33 However, this could have implications for those ‘furthest’ from the labour market who, because of the barriers they face, will find it increasingly hard to access employment in the face of growing competition for jobs.
Out of work benefit claimant rates (August 2003 to August 2009)
10.0%
11.0%
12.0%
13.0%
14.0%
15.0%
16.0%
17.0%
18.0%
19.0%
20.0%
2003 2004 2005 2006 2007 2008 2009
Newham
5 HostBoroughs
London
Source: DWP (August 2003 – August 2009)
4.34 The table below shows the breakdown of claimants by the main benefit claimed. In line with elsewhere Employment Support Allowance/Incapacity Benefit claimants make up the majority of benefit claimants in Newham, accounting for 43% of all out-of-work benefit claimants. Claimant rates in August 2009 for all benefit types were higher than the relevant London figures.
Benefit claimants in Newham by statistical group11 (August 2009)
Newham Host Boroughs London
Number Rate Rate Rate
Job Seeker 9,820 5.9% 5.9% 4.3%
ESA and incapacity benefits 13,150 7.9% 7.9% 6.2%
Lone Parent 6,460 3.9% 3.7% 2.7%
Carer 2,340 1.4% 1.2% 0.8%
Others on income related benefit 1,370 0.8% 0.8% 0.6%
Out-of-work benefits 30,810 18.6% 18.3% 13.7%
Source: DWP
11 Note: Rate is a percentage of the working age population.

Page 14 London Borough of Newham
Job Seekers Allowance Claimants (JSA)
4.35 In April 2010 (the latest JSA claimant data) there were a total of 10,170 JSA claimants in Newham or 6.1% of the working age population, above the regional average of 4.4% and in line with the host borough figure.
4.36 The table below sets out a snapshot of JSA claimant population in Newham and the host boroughs compared with London. In April 2010 over three fifths of claimants were aged 25-49 years, in line with the London average. However there was a greater proportion of younger claimants (18-24 yrs) than the London average and a slightly lower proportion of older (50 plus) claimants. Almost 70% of claimants were male, slightly above the regional average of 66%.
4.37 Newham has a slightly higher proportion of longer-term JSA claimants (one year and over) than the London average. The majority of local authority JSA claimants are from ethnic minority groups (64%) with just 27% of claimants coming of white ethnic origin. This broadly reflects the ethnic makeup of Newham’s population – 65% of the population was estimated to be of non-white ethnic origin in 2009F
12F.
Characteristics of JSA Claimants (% of total claimants) (April 2010)F
13
Newham Host
Boroughs London
Gender of claimant
Male 69% 68% 66%
Female 31% 32% 34%
Age of claimant
Aged 18-24 25% 24% 23%
Aged 25-49 61% 62% 62%
Aged 50 and over 13% 14% 15%
Duration of Claim
Up to 6 months 59% 60% 62%
Over 6 months up to 12 months 23% 23% 22%
1 yr and up to 2 yrs 14% 14% 13%
over 2 years 4% 3% 2%
Ethnicity of claimant
White 27% 80% 46%
Ethnic minority 64% 14% 44%
Prefer not to say 7% 5% 8%
Unknown 2% 1% 2%
Source: DWP
12 Source – ONS, APS 13 Note: Latest available data on ethnicity February 2010

Page 15 London Borough of Newham
4.38 The chart shows the trends in JSA claimant numbers over the period April 2008 to April 2010. The number of claimants rose by 48% (+3,300) below the rate of growth in London (+71%). Claimant numbers increased rapidly between October 2008 and October 2009, before peaking in February 2010 after which they began to fall.
Claimant Count in Newham (April 2008 to April 2010)
6,000
6,500
7,000
7,500
8,000
8,500
9,000
9,500
10,000
10,500
11,000
Apr-
08
May-
08
Jun-
08
Jul-
08
Aug-
08
Sep-
08
Oct-
08
Nov-
08
Dec-
08
Jan-
09
Feb-
09
Mar-
09
Apr-
09
May-
09
Jun-
09
Jul-
09
Aug-
09
Sep-
09
Oct-
09
Nov-
09
Dec-
09
Jan-
10
Feb-
10
Mar-
10
Apr-
10
Source: DWP (April 2008 to April 2010)
4.39 JSA claimants are disproportionately represented among elementary occupations. Elementary occupations make up 19% of employment in Newham and 25% of JSA claimants considered this as their ‘usual occupation’. This suggests that employees in low-skilled occupations are disproportionately represented amongst JSA claimants, a pattern which is also observed regionally and nationally.
4.40 The numbers of people entering and leaving Jobseekers Allowance (JSA) (on-flows and off-flows) is one of the indicators that can be used to determine the health of the labour market. The labour market is more buoyant if the off-flows (people leaving benefits) are higher than the on-flows (people taking up benefits).
4.41 The chart below shows that February 2009 marked the height of the current economic downturn when on-flows were at their highest and off-flows were significantly lower. Since then, the gap between on-flows and off-flows has closed and in both November and December 2009 the off-flows were higher than the inflows. This was the first time this had been the case over 2 consecutive months since November and December 2007.
4.42 The picture in 2010 has been more mixed. On-flows were higher than off-flows in January, February and May, though the situation was reversed in March and April with off-flows higher than on-flows. What is clear is that over the period in question there has been a general upward trend in both on-flows and off-flows, suggesting that the employment market is more volatile than it was in late 2007 prior to the recession.

Page 16 London Borough of Newham
JSA On-flows and Off-flows (September 2007 – May 2010)
0
500
1,000
1,500
2,000
2,500
3,000
Oct-0
7
Dec-07
Feb-08
Apr-0
8
Jun-08
Aug-08
Oct-0
8
Dec-08
Feb-09
Apr-0
9
Jun-09
Aug-09
Oct-0
9
Dec-09
Feb-10
Apr-1
0
On-Flow
Off-Flow
Source: ONS (2007 – 2010)
4.43 The graph below illustrates the same information for 18-24 year olds. The information demonstrates that the inflows were at their highest in March and August 2009. The August 2009 peak is likely to be due to school leavers making their first claim. As with other working aged claimants, the situation since October 2009 has improved with net off-flows in October to December 2009 and March to April 2010, though net on-flows in January, February and May 2010 suggest that the labour market is still precarious.
JSA On-flows and Off-flows, 18 – 24 year olds (September 2007 – May 2010)
0
200
400
600
800
1,000
1,200
Sep-07
Nov-07
Jan-08
Mar-0
8
May-08
Jul-0
8
Sep-08
Nov-08
Jan-09
Mar-0
9
May-09
Jul-0
9
Sep-09
Nov-09
Jan-10
Mar-1
0
May-10
On-Flow
Off-Flow
Source: ONS (2007 – 2010)

Page 17 London Borough of Newham
4.44 As of May 2008 an estimated 48.6% of Newham residents that left active jobseeking benefits returned within 6 months. This suggests that there is an issue of low job sustainability. This pattern of poor employment retention is repeated across London with the London average being 49.7% and similar or worse rates across all of the host boroughs.
Work Benefit / Employment Retention Indicators (May 2008)
0%
10%
20%
30%
40%
50%
60%
70%
80%
90%
Proportion of work benefit claimants
returning to benefits within six months of
leaving
Proportion of people of working age who
have been continuously employed for 12
months or more.
Percentage of Population
Newham
Greenwich
Hackney
Tower Hamlets
Waltham Forest
Source: LDA (2009) Staying In, Moving Up: Employment Retention and Progression in London
Incapacity/Employment Support Allowance Claimants
4.45 As previously highlighted, people on incapacity benefit comprise the largest single group in the workless population. In August 2009, 13,200 Newham residents were in receipt of Employment and Support Allowance, Severe Disablement Allowance (SDA) and other forms of incapacity benefit, representing 7.9% of the working age population, above the London (6.2%) figure and in line with the host borough average (7.9%).
4.46 Up until 2008 the numbers claiming IB/ESA in the Borough had been falling in line with regional trends. Over the period August 2003 to August 2008 the number of claimants fell by 1,400 (-10%) a faster rate of decline than the London (-2%) figures. However, between August 2008 to August 2009 there has been a slight increase of 3% in the number of claimants in line with the London position (+3%).
4.47 The table below sets out a snapshot of incapacity benefit claimants in Newham in August 2009. This data include claimants of the new ESA for every variable apart from medical condition. The key features of ESA/IB claimants in Newham include:
• 44% of claimants in Newham are aged under 44 years of age.
Page 18 London Borough of Newham
• A greater proportion of claimants are male rather than female in line with
the regional picture.
• Over three-quarters of claimants have been claiming for more than two
years, a similar proportion to the London average.
• A slightly smaller proportion of claimants in Newham (38%) claim for
reasons of mental ill health compared to regionally (46%).
Characteristics of ESA/IB Claimants (% of total claimants) (Aug 2009)F
14
Newham Host
Boroughs London
Gender of claimant
Male 57% 58% 57%
Female 43% 42% 43%
Age of claimant
aged under 25 7% 6% 6%
aged 25-34 13% 14% 14%
aged 35-44 25% 25% 25%
aged 45-54 33% 32% 32%
aged 55-59 16% 16% 16%
aged 60-64 7% 7% 8%
Duration of claim
up to 6 months 11% 10% 10%
6 months up to 1 year 6% 6% 5%
1 year and up to 2 years 7% 8% 8%
2 years and up to 5 years 17% 17% 18%
5 years and over 59% 59% 59%
Condition
disease - mental 38% 44% 46%
disease - nervous system 5% 5% 5%
disease - respiratory or circulatory 8% 7% 6%
disease - musculoskeletal 18% 16% 15%
disease - injury, poisoning 4% 4% 4%
disease - other 27% 25% 24%
Source: DWP
4.48 Given that incapacity benefit claimant levels have been persistently high throughout a period of low unemployment, and given that most claimants are long-term, the barriers to accessing paid work are obviously significant. Data on barriers to work is not systematically collected at local authority level, but
14 Note: Data on medical condition does not include Employment Support Allowance (ESA) claimants
Page 19 London Borough of Newham
national survey work undertaken within a limited number of local authority areas does highlight some of the barriersF
15F. Most significantly:
• Very long term detachment from the labour market is common: 30% of IB
claimants surveyed in 2007 had been claiming for over ten years.
• Qualifications levels among claimants are generally very low: 20% of
those surveyed in Newham had no formal qualifications (with higher
proportions in more deprived areas).
• Only 27% stated that they wanted a job, either now or in the future.
Lone parents on Income Support
4.49 In August 2009, 6,460 people in Newham were in receipt of Income Support for Lone Parents, 3.9% of the working age populationF
16F. This compares with 2.7%
in London and 1.9% nationally. Unsurprisingly, 96% of claimants are female and young (with over half aged under 34)F
17F.
Recipients of IS (LP) have fallen steadily in response to government policy over the past decade and continue to do so.
Skills
4.50 To understand how patterns of employment will change in the near future it is also important to understand the levels of academic achievement of young people in Newham. This will help assess likely future employability and help influence decisions on where best to deploy resources in order to reduce worklessness.
Qualifications of the Working Age Population
4.51 Newham has a large number of low skilled residents. One-fifth (20%) of residents lack any qualifications making them particularly disadvantaged in the labour market. This figure compares to just 12% in London.
4.52 In 2008 just 24.6% of Newham residents were qualified to NVQ Level 4 and above, a significantly smaller proportion than regionally (38.6%), and much lower than the host borough average (34.1%).
15 Sheffield Hallam University (2008), Women on Incapacity Benefits: New Survey Evidence 16 DWP (2009) 17 DWP (2009)

Page 20 London Borough of Newham
Qualifications by age group (January 2008 to December 2008)
0%
10%
20%
30%
40%
50%
60%
70%
80%
Newham 5 Host Boroughs London
No Quals
NVQ 1+
NVQ 2+
NVQ 3+
NVQ 4+
Source: ONS, Annual Population Survey (2008)
4.53 The chart below shows the proportion of residents with no qualifications by broad age groups in Newham, the host boroughs and London. Newham performs poorly across most age groups but the gap is widest with the regional average amongst the over 50s.
No qualifications by age group (January 2008 to December 2008)
0%
5%
10%
15%
20%
25%
30%
35%
40%
Newham Host Boroughs London
% with noqualifications -16-24
% with noqualifications -25-49
% with noqualifications -50-retirementage
Source: ONS, Annual Population Survey (2008)
4.54 The existing skills gap within the Borough is evident in the National Indicator on skills gaps in the current workforce, as reported by the Learning Skills Council (LSC). In 2009, 21% of establishments surveyed in Newham reported a skills

Page 21 London Borough of Newham
gap in their current workforce, an increase from 14% in 2005. This is compared to the London average of 17% and was the highest skills gap of the host boroughs. Despite this, the recorded increase between 2005 and 2007 was smaller in Newham than for any of the other host boroughs that experienced an increase in the skills gap over the same period. UK-wide data shows that the main reasons for skills gaps is due to a lack of experience or staff being recently recruited.
4.55 Further to the above, a recent surveyF
18F undertaken with businesses in the
Borough’s town centres (predominately retail and café / restaurant businesses) found that, of the 311 businesses interviewed, 43.4% reported skills gaps in their current workforce. The most frequently reported skills gaps were in communications and customer service skills (16.7% and 16.4% respectively).
4.56 On the positive side, Newham Further Education and Training Providers have secured a noticeably higher number of post-19 learner places than any other London Borough. This is true for all levels of learner including Skills for Life, full level 2 and full level 3. Within the host boroughs Newham has 7,300 more post-19 learner places than the next closest Borough Waltham ForestF
19F.
Qualifications of Young People - GCSE Attainment
4.57 Newham’s schools and colleges have achieved considerable year-on-year improvements in young people’s educational achievements and qualification rates. GCSE results for 2009 show a continuing upward trend. The percentage of young people achieving Level 2 qualifications by the age of 16 (i.e. five or more A*- C GCSEs or equivalent, including English and Maths) increased from 41% (London 45.8%) in 2006 to 48% (London 50%) in 2009.
4.58 Post GCSE (generally post year 11), young people in Newham have a wide choice of education and training opportunities. Quality of 16-19 provision is generally very high and its structure appropriate. Key providers include:
• Newham College of Further Education (NCFE);
• Newham Sixth Form College;
• St Angela’s and St Bonaventure’s Sixth Form Centre; and,
• A very large number of work-related and work-based training
organisations. Two significant providers are The Building Crafts College
and Landmark Training.
4.59 The data supplied by The Newham Connexions 2008 Activity Survey (or Destinations Survey)F
20F reveals that the overwhelming majority of Newham Year
11 school leavers progress to full-time education and training (3,307 in 2008). Of these 700 (18.6%) were in a school Sixth Form, 1,590 (42.2%) in a Sixth Form College and 1,017 (27.0%) in a Further Education (FE) college.
4.60 The Connexions Activity Survey also revealed that:
18 GVA Grimley (2010) London Borough of Newham Town Centre & Retail Study 19 Source: The Data Service – overall FE and Skills Participation 2005/06 to 2008/09 20 Connexions (2010)

Page 22 London Borough of Newham
• 89.9% of Year 11 leavers entered learning of one type or another, an
increase of 1.4% over 2007;
• 87.7% entered full time education or training, an increase from 84.4% in
2007;
• 62% of those remaining in education or training entered a Level 3
Programme;
• 56% of those remaining in education were studying in Newham;
4.61 The general challenges for Newham are to further build upon the Borough’s successes in raising Level 2 achievement at 16 years, by raising the proportion of young people engaged in education and training 16-18 years, and by raising both Level 2 and Level 3 achievement at 19 years. This will better equip young people in the Borough to succeed in gaining sustainable employment.
4.62 Newham is supported in this by the excellent higher education provision located within the Borough, in the form of the University of East London (UEL) and Birkbeck. UEL has campuses both at Stratford and the Royal Docks whilst Birkbeck offers a range of courses from UEL’s Stratford campus. These institutions are important stakeholders in Newham and offer significant potential to support upskilling of the Borough population.
Young people Not in Employment, Education or Training (NEET)
4.63 In Newham it was estimated that in 2008, 7.7% (640 young people) of 16-18 year olds were not in education, employment or training (NEET)F
21F. This rate is
above the London average of 5.8% and the 7th highest rate of any London borough. The NEET rate has fallen steadily over the past few years from a high of 10.8% in 2006. However, it should be noted that these figures do not take into account the impact of the recession and the current rate is likely to be higher.
4.64 In comparison, only 3.8% of year 11 school leavers in 2008 reported that they would not be entering either education, employment or training. The discrepancy between the number of people leaving school and becoming NEETs and the proportion of NEETs amongst 16-18 year olds is indicative of some individuals dropping out of education, employment or training. Helping these individuals back into education, employment or training is therefore a key priority to avoid longer term worklessness.
4.65 Although the actual numbers are small, many of those within the NEET category are likely to experience multiple forms of disadvantage and to face several barriers to employment.
Challenges
• Getting more people into work - raising the employment rate and reducing rates of economic inactivity.
• Raising skills of the adult population at all levels through education or in-work
21 Connexions; DCSF

Page 23 London Borough of Newham
training.
• Supporting young people into education, employment or training and preparing them for the world of work.
• Supporting unemployed parents to access work and opportunities.
• Creating the incentives to retain educated and entrepreneurial people in the borough.
• Raising productivity and average incomes.
• Maximising the benefits of high quality further and higher education institutions in preparing residents for employment.
Opportunities
• The presence of high quality further and higher education institutions in the Borough.
• Improving school results
• A high number of post-19 learner places.