the informal economy: statistical data and research
TRANSCRIPT

The Informal Economy:
Statistical Data and Research Findings
Country case study: South Africa
Contents
1. Introduction
2. The Informal Economy, National Economy, and Gender
2.1 Description of data sources
2.1.1 Labour force survey
2.1.2 Time use survey
2.2 The overall shape of the labour market
2.3 Share of informal employment in the labour force, and main regions and
sectors in which informal workforce is concentrated
2.3.1 The shape of the informal sector
2.3.2 Alternative definitions of the informal sector
2.3.3 Measuring the informal economy
2.4 Insights from the time use survey
2.5 Main export sectors in which informal workforce is concentrated
2.6 Contribution of the informal sector to gross domestic product
2.7 Enterprise level data on micro-unregistered enterprises in the national economy
3 Characteristics of Various Types of Informal Employment
3.1.1 Defining the scope
3.1.2 Informal sector vs informal economy
3.1.3 Gender
3.1.4 Foreign workers

3.2 Self-employed
3.3 Unpaid family workers
3.4 Domestic workers
3.5 Home-based workers
3.6 Street vendors
4 Additional topics
4.1 Household economy
4.2 Informality, Gender, and Poverty
5 Conclusion
6 References
1. Introduction
In late 2001, the International Labour Organisation (ILO) Task Force on the Informal
Economy commissioned the Women in the Informal Economy – Globalising and
Organising (WIEGO) network to collaborate with colleagues at the ILO to produce a
booklet of statistical data and relevant research findings on the informal economy. The
booklet is intended for dissemination in advance of the International Labour Conference
planned for June 2002.
Section 3 of the booklet will constitute the core, and will focus on empirical findings in
relation to the size, composition and characteristics of the informal economy. The section
will draw on case studies of selected countries from different regions of the world. This
report constitutes the South African case study.
The terms of reference for the case studies provided an outline, as well as definition of
terms. The South African case study has been formulated in accordance with the proposed
definitions. For the sake of brevity, the terms will not be redefined in the paper. However,
at the outset we note the distinction between two key concepts – informal sector and
informal economy. The term „informal sector‟ is used for the narrower conception,
defined by the nature of the enterprise. Even here, however, it will be shown that the
boundaries of the sector are fluid. The term „informal economy‟ is used for the wider
conception, which looks at the characteristics of the worker as well as those of the

enterprise in which they work.
2 The Informal Economy, National Economy, and Gender
2.1 Description of data sources
The two primary official sources of data on the informal economy are the Labour force
survey and the time use survey (TUS) of 2000. The September 2000 LFS (LFS2000:2) is
used in this paper. It was the first full-scale LFS in the country, following on from a
smaller pilot survey conducted in February 2000. The September sample covered 30 000
households spread throughout the country. The TUS was the first national study of this
type conducted in South Africa. Fieldwork occurred in February, June and October 2000.
Information was collected from over 14 000 individuals aged 10 years and above. The
sample was weighted to reflect the 12 026 men and 13 673 women aged 10 years and
above who were estimated to be in the sample.
2.1.1 Labour force survey
The LFS questionnaire is designed, among others, to provide insights into both the
informal sector and the broader concept of the informal economy. Section 4 of the
questionnaire is answered in respect of all individuals aged 15 years and over who were
working or absent from work in the previous seven days. It thus covers all working
respondents, irrespective of their status in employment. The prompts for employment are
detailed. The formulation is an attempt to „catch‟ as much employment as possible, and
avoid respondents failing to name work which they consider too minimal, or resulting in
too small a reward, to be worth mentioning.
Question 4.19 asks directly whether the business where the individual works is (a) in the
formal sector; or (b) in the informal sector. A third option provides for cases where the
respondent does not know whether the sector is formal or informal. A note – which may
or may not be read out – explains that formal sector employment is where the employer
(institution, business or private individual) is registered to perform the activity. This is the
question that Stats SA usually uses in classifying work as informal or formal.
Within the informal sector, Stats SA then uses the occupation of the worker to separate
out domestic workers from other informal sector workers. In most of the tables which
follow we distinguish between domestic workers and the rest of the informal sector as
they differ in important ways in terms of who works in them, employment status,
conditions of work, and the legal position which applies to them.
In this paper we compare responses to questions 4.19 with responses to alternative
approaches to defining the informal sector and the informal economy. In respect of the
informal sector, the alternative approach focuses on questions 4.16, 4.17, and 4.18. In
respect of the informal economy, as defined by employee characteristics, we use questions
4.6, 4.8 and 4.12.

Question 4.16 asks about the number of regular workers in the organisation, business,
enterprise or branch where the individual works. For the purposes of this paper, cases
where there were fewer than five regular workers were regarded as more likely to be in
the informal sector.
Questions 4.17 asks whether the organisation, business, enterprise or branch where the
individual works is (a) a registered company or close corporation and/or (b) deducting
unemployment insurance fund (UIF) contributions for the individual. Affirmative answers
to either of these were regarded as an indication that the enterprise was formal. One
weakness with part (a) of this question is that it restricts registration to companies or close
corporations. Any other form of registration will generate a negative answer. So, for
example, a registered medical practitioner with a private practice, who does not need to be
registered as a company or close corporation to operate, will be classified as informal.
Question 4.18 asks where the business, enterprise or branch is located. The options are:
In the owner‟s home/on the owner‟s farm
In someone else‟s home
Inside a formal business premises such as factory or office
At a service outlet such as a shop, school, post office, etc
At a market
On a footpath, street, street corner, open space or field
No fixed location
Other
Here the third and fourth options were taken as indicating a formal enterprise.
As noted, questions 4.6, 4.8 and 4.12 are used when defining informality on the basis of
employee characteristics rather than those of the enterprise:
Question 4.6 asks whether the person‟s work is (a) permanent; (b) a fixed
period contract; (c) temporary; (d) casual; or (e) seasonal. Here options (c), (d)
and (e) were taken as an indication of more informal economy employment,
whether or not the employing enterprise was formal or informal.
Question 4.8 asks whether the person has a written contract with the employer.
We regarded having a contract as a second characteristic of an informal
employee.
Question 4.12 asks whether the person gets any paid leave. We regarded not
getting paid leave as the third characteristic of an informal employee.
2.1.2 Time use survey
Stats SA used the trial United Nations (UN) classification as the basis of its activity
coding system. One important advantage of this system is that its ten categories can be put
into three divisions that correspond in large part to the distinctions between productive
work which is included in calculations of gross domestic product (GDP), productive work

which falls outside the production boundary of the System of National Account (SNA)
and is thus excluded from GDP calculations, and non-productive activity. Further, the
three categories making up GDP productive activities largely correspond to the division
between formal work, informal primary production, and other informal production.
For the purposes of this paper, three adjustments were made, as follows:
Paid domestic work was moved from category 1 (formal work) to category 3
(non-primary informal work). The activity was originally included in category
1 because the formal definition of the category was work in establishments,
and national accounts regards households which employ domestic workers as
establishments.
Searching for work, which is in category 1, was excluded completely as a non-
productive activity.
Collecting fuel and water, which are in category 2, were excluded completely
as most people would not regard them as employment.
The TUS provides information on activities of people aged ten years or more. The LFS
provides information only about those aged fifteen years or more. To facilitate
comparison, in this paper the TUS information is reported separately for those aged 10-14
years and those aged 15 years and above.
2.2 The overall shape of the labour market
Table 1 shows the distribution of the total population of the country by age, location and
sex. In terms of age, the table divides the population into those considered of working age
(15 to 65 years inclusive in South Africa), and those outside this age range. (In this table
and the others in this section, we exclude the very small number of observations for which
key information such as sex was not available.) Overall, 61% of the population falls
within the working age category, with very little difference between the male and female
percentages. The differences in terms of location are, however, significant. Two-thirds
(66%) of the urban population is of working age, compared to only 55% of the non-urban
population. As a result, while 55% of the total population resides in urban areas, these
areas contain 60% of people of working age.
Table 1: Population by age, location and sex (1 000)
Location Age group Male Female Total
Urban Non-working
age
4041 4174 8215
Working age 7756 8357 16113
All ages 11796 12531 24328
Non-
urban
Non-working
age
4374 4502 8876
Working age 4985 5849 10834
All ages 9360 10351 19710

Total Non-working
age
8415 8676 17091
Working age 12741 14206 26947
All ages 21156 22882 44038
Table 2 shows the distribution of the working age population by labour market status,
location and sex. Overall, 44% of the working age population is employed, but the
percentage is 50% for men and 38% for women. The percentage which is employed is
also much higher in urban areas, at 48%, than in non-urban, where it is 37%.
Table 2: Working age population by labour market status, location and sex (1 000)
Location Labour market
status
Male Female Total
Urban Not economically
active
2210 3409 5619
Employed 4273 3486 7758
Unemployed 1250 1440 2690
Total 7733 8335 16067
Non-
urban
Not economically
active
2185 3293 5478
Employed 2108 1846 3954
Unemployed 689 704 1393
Total 4982 5843 10824
Total Not economically
active
4395 6702 11097
Employed 6381 5331 11712
Unemployed 1939 2144 4082
Total 12714 14177 26891
The third table focuses in on employed people and illustrates their characteristics in terms
of broad industrial sectors, location, status in employment and sex. It reveals, as expected,
that agricultural employment is concentrated in non-urban areas while employment in the
other three broad areas is concentrated in urban areas. The table shows a clustering of
women in services, which accounts for 58% of all female employment compared to 39%
of male employment. Trade – a sector which is important when looking at the informal
economy – accounts for similar percentages of female and male employment (25% and
22% respectively). Agriculture – another important sector – accounts for 3% of both
female and male employment.
Table 3: Employed aged 15-65 years by industrial sector, location, status in

employment and sex (1 000)
Urban Non-urban
Employee Self-
employed
Unpaid
family
Total Employee Self-
employed
Unpaid
family
Total
Male
Agriculture 70 34 1 104 464 331 11 805
Industry 1383 134 3 1520 557 73 2 632
Trade 627 283 29 938 145 99 11 256
Services 1507 161 4 1672 357 47 3 407
Unknown 24 5 1 29 5 1 0 6
Total 3609 616 38 4264 1527 552 27 2106
Female
Agriculture 44 41 2 87 225 462 11 698
Industry 418 73 3 495 122 57 2 180
Trade 520 304 35 859 97 244 32 373
Services 1923 93 2 2017 560 23 2 584
Unknown 17 3 2 21 4 1 0 6
Total 2922 514 44 3479 1008 786 47 1841
Total
Agriculture 113 75 3 191 688 793 22 1503
Industry 1801 207 6 2014 678 130 4 812
Trade 1147 586 64 1797 242 343 43 629
Services 3429 254 6 3689 917 70 4 992
Unknown 41 8 2 51 9 2 0 11
Total 6531 1130 82 7742 2535 1338 74 3947
In terms of status in employment, Table 3 reveals that the 84% of employed people in
urban areas and 64% of non-urban employed are employees. The latter category includes
domestic workers. Self-employed account for only 15% of employed people in urban
areas, compared to 34% in non-urban areas. Only a very small number of South Africans
are reported to be working as unpaid family members. This status is, however, more
common for women than for men.
Table 4 describes the employed population in terms of industry, employment status and
sex. (The totals column of the table includes 22 000 employed people for whom
employment status was unknown. The rows will thus not always sum exactly to the totals
shown.). The table is further disaggregated into the three broad categories used in the later
analysis of the informal sector in this paper, namely formal, informal and domestic
employment. Domestic employment is considered to be part of the informal sector, but is
reported separately because of its significance in the South African economy.
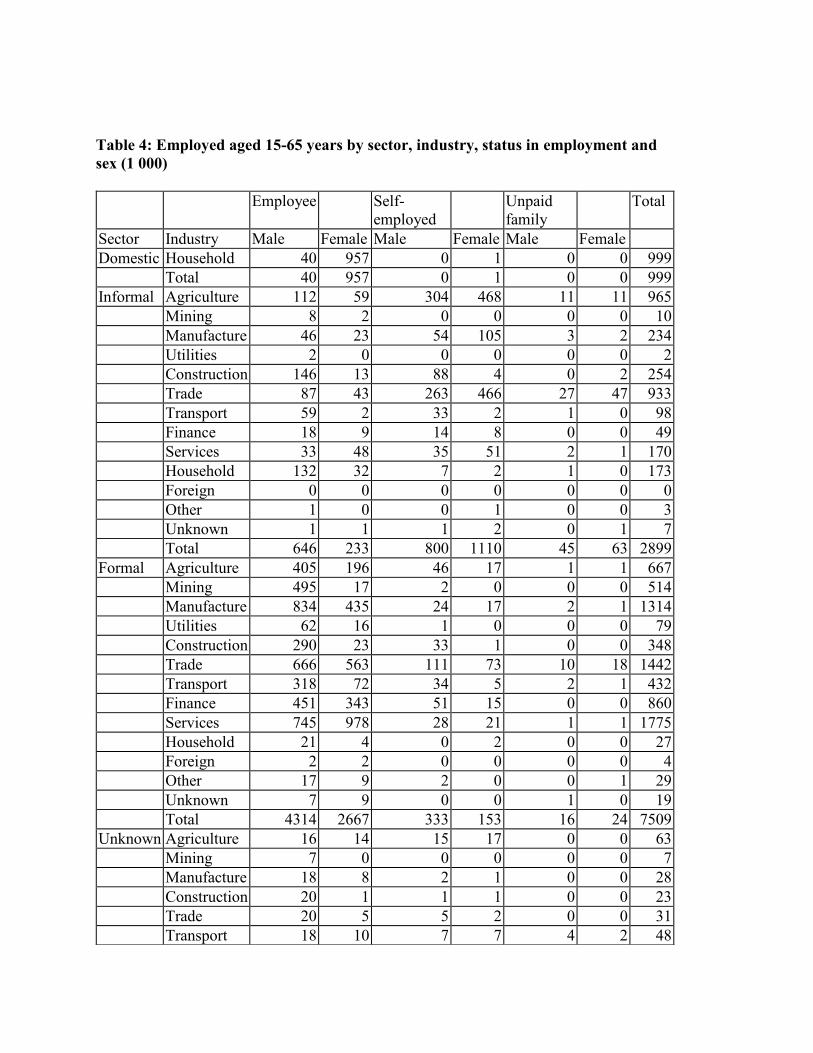
Table 4: Employed aged 15-65 years by sector, industry, status in employment and
sex (1 000)
Employee Self-
employed
Unpaid
family
Total
Sector Industry Male Female Male Female Male Female
Domestic Household 40 957 0 1 0 0 999
Total 40 957 0 1 0 0 999
Informal Agriculture 112 59 304 468 11 11 965
Mining 8 2 0 0 0 0 10
Manufacture 46 23 54 105 3 2 234
Utilities 2 0 0 0 0 0 2
Construction 146 13 88 4 0 2 254
Trade 87 43 263 466 27 47 933
Transport 59 2 33 2 1 0 98
Finance 18 9 14 8 0 0 49
Services 33 48 35 51 2 1 170
Household 132 32 7 2 1 0 173
Foreign 0 0 0 0 0 0 0
Other 1 0 0 1 0 0 3
Unknown 1 1 1 2 0 1 7
Total 646 233 800 1110 45 63 2899
Formal Agriculture 405 196 46 17 1 1 667
Mining 495 17 2 0 0 0 514
Manufacture 834 435 24 17 2 1 1314
Utilities 62 16 1 0 0 0 79
Construction 290 23 33 1 0 0 348
Trade 666 563 111 73 10 18 1442
Transport 318 72 34 5 2 1 432
Finance 451 343 51 15 0 0 860
Services 745 978 28 21 1 1 1775
Household 21 4 0 2 0 0 27
Foreign 2 2 0 0 0 0 4
Other 17 9 2 0 0 1 29
Unknown 7 9 0 0 1 0 19
Total 4314 2667 333 153 16 24 7509
Unknown Agriculture 16 14 15 17 0 0 63
Mining 7 0 0 0 0 0 7
Manufacture 18 8 2 1 0 0 28
Construction 20 1 1 1 0 0 23
Trade 20 5 5 2 0 0 31
Transport 18 10 7 7 4 2 48

Finance 9 4 2 2 0 0 17
Services 8 9 2 3 0 0 22
Domestic 15 20 0 4 0 0 39
Other 3 1 0 0 0 0 4
Unknown 2 0 2 0 0 0 23
Total 136 73 35 35 4 3 306
Total 5136 3930 1168 1300 65 90 11713
Table 4 reveals that the formal sector is substantially larger than the informal sector.
Within the informal sector, domestic work accounts for the most employment, closely
followed by agriculture and trade. Within the formal sector, services constitutes the
largest sector, followed by trade and manufacture. The pattern is thus not completely
different in terms of some of the largest sectors if we consider domestic work as part of
services. However, agriculture accounts for a much smaller proportion of the formal
sector than of the informal.
In terms of status in employment, while 93% of formal sector workers are employees, this
is the case for only 30% of workers in the informal sector excluding domestic work. If
domestic work is included, 48% of informal sector workers are employees.
2.3 Share of informal employment in the labour force, and main regions and sectors
in which informal workforce is concentrated
2.3.1 The shape of the informal sector
In this sub-section, we focus in on the informal sector. We first describe the
characteristics of the informal sector as traditionally defined by Stats SA. We examine
characteristics such as absolute and relative size, and breakdowns by sex, population
group, urban-rural, province, industry and occupation.
Table 5 shows the distribution of employed people between the formal and the two parts
of the informal sector – domestic work and the rest of the informal sector. This and later
tables, unless specified otherwise, include all employed people aged 15 years and above,
whether employees, self-employed or employers. Employed people are those who
engaged in some economic activity in the seven days preceding the interview as well as
those who were temporarily absent from work. The formal sector is defined on the basis
of the response to question 4.19 as to whether the business was formal or informal.
Table 5: Employed aged 15 years and above by population group, sex and sector
(1 000)

Population group and
sex
Formal Informal Domestic
workers
Unspecified Total
All population groups
Total 7568 3059 1004 315 11946
Male 4708 1572 41 190 6511
Female 2859 1486 963 125 5434
African
Total 4357 2695 901 212 8166
Male 2861 1348 39 131 4380
Female 1496 1347 862 80 3785
Coloured
Total 1041 185 97 30 1354
Male 585 120 1 20 725
Female 456 65 96 11 628
Indian/Asian
Total 377 30 2 9 418
Male 237 20 4 261
Female 140 10 2 5 157
White
Total 1769 143 2 64 1978
Male 1009 80 35 1124
Female 760 63 2 29 854
The table shows that, overall, more than one-third of employed people are in the informal
sector, with 8% of employed working as domestic workers and a further 26% elsewhere in
the informal sector. Women are significantly more likely than men to work in the informal
sector in that at least 45% of women employed compared to 25% of men are informal
sector workers. The large number of female domestic workers accounts for some of this
difference. If we exclude domestic workers, 25% of employed men and 34% of employed
women work in the informal sector.
The figures for the different population groups reveal that African people are more likely
than others to be in the informal sector, and Indian and white people least likely. The
overall pattern in respect of sex remains true for the African and coloured population
groups. Among Indian and white employed, however, there is very little difference in the
patterns for women and men. Again, this is largely explained by domestic workers, of
whom there are very few in the Indian and white groups.
Table 6 provides the urban-rural breakdown of employment. While close on three-
quarters (73%) of employment in urban areas is formal, this is the case in respect of only
46% of employment in non-urban areas. The percentage of domestic workers is very
similar (8-9%) across both non-urban and urban. It is thus other informal work which
accounts for the rural-urban difference in distribution.
Table 6: Employed aged 15 years and above by province, type of area and sector

(1 000)
Type of area Formal Informal Domestic
workers
Unspecified Total
Total 7568 3059 1004 315 11946
Urban 5697 1265 671 202 7835
Non-urban 1871 1794 333 113 4111
Western Cape
Total 1200 220 91 41 1552
Urban 1060 188 72 36 1356
Non-urban 140 32 19 5 196
Eastern Cape
Total 687 633 119 31 1470
Urban 479 134 61 13 687
Non-urban 209 499 58 18 783
Northern Cape
Total 177 42 34 9 261
Urban 105 26 20 6 156
Non-urban 73 16 13 3 105
Free State
Total 546 176 80 22 824
Urban 358 101 54 15 527
Non-urban 188 75 26 7 297
KwaZulu Natal
Total 1384 704 192 70 2351
Urban 1048 198 127 29 1402
Non-urban 336 506 66 41 949
North West
Total 561 186 89 25 861
Urban 275 53 41 13 382
Non-urban 287 133 47 12 479
Gauteng
Total 2051 472 274 83 2881
Urban 1961 449 244 77 2730
Non-urban 91 23 30 6 151
Mpumalanga
Total 484 251 59 16 810
Urban 247 79 34 8 369
Non-urban 237 172 24 8 441
Northern
Province
Total 477 375 66 18 936
Urban 165 37 17 6 226
Non-urban 312 337 49 12 710

South Africa has nine provinces. There are significant differences in employment and
other characteristics across the provinces, many of which reflect the country‟s apartheid
history in addition to factors such as poverty levels. In Eastern Cape and Northern
Province, the formal sector accounts for under half of employment. These two provinces
are generally regarded as the poorest provinces in the country, and are mainly comprised
of previous „homeland‟ areas. Conversely, in Western Cape and Gauteng, the two
wealthiest provinces, the formal sector accounts for about three-quarters of employment.
Eastern Cape and Northern Province are also among the provinces with the highest levels
of unemployment (27,0% and 27,6% respectively), while Western Cape and Gauteng
have the lowest (15,3% and 20,8%).
In the Western Cape, Northern Cape, Free State and Gauteng, there is very little
difference in the formal/informal split between urban and non-urban areas. It is thus
primarily in the provinces which consist largely of former „homeland‟ areas that the non-
urban areas have significantly larger informal sectors. A large part of the informal sector
in these areas will comprise subsistence agricultural workers.
Table 7 presents similar information, but separates out the agricultural sector from other
sectors. The table reveals that agriculture accounts for more than half of informal sector
employment in non-urban areas if one excluded domestic work. This is the case for both
women and men. For men, agriculture accounts for more than half of informal sector
employment in non-urban areas whether or not one includes domestic work.
Table 7: Employed aged 15 years and above, type of area, sex and sector (1 000)
Formal Informal Domestic
workers
Unspecified Total
Total
All Total 7568 3059 1004 315 11946
Male 4708 1572 41 190 6511
Female 2859 1486 963 125 5434
Urban Total 5697 1265 671 202 7835
Male 3441 729 25 127 4322
Female 2256 536 646 75 3512
Non-urban Total 1871 1794 333 113 4111
Male 1268 843 16 63 2189
Female 603 951 317 51 1921
Agricultural
All Total 686 1082 68 1836
Male 467 484 33 983
Female 219 598 35 853
Urban Total 95 95 14 204
Male 60 47 7 113
Female 36 48 7 91
Non-urban Total 591 987 54 1632

Male 407 437 26 870
Female 183 550 28 762
Non-agricultural
All Total 6882 1977 1004 247 10110
Male 4242 1089 41 157 5528
Female 2640 888 963 90 4581
Urban Total 5601 1170 671 189 7631
Male 3381 682 25 121 4209
Female 2220 488 646 68 3421
Non-urban Total 1281 807 333 59 2479
Male 861 406 16 36 1319
Female 420 401 317 22 1160
Table 8 looks at the formal/informal distribution by industry. Overall, the table reveals
mining, utilities, the financial sector and community and personal services (excluding paid
domestic work) to have very small informal components. If we exclude domestic service,
agriculture comprises the single largest component of the informal sector. In South Africa,
this mainly comprises subsistence farming rather than small-scale commercial agriculture.
Construction and trade also account for significant proportions of the informal sector. The
sex-disaggregated figures show that women, even more than men, are likely to be
employed in the informal sector of agriculture and trade. Women account for 60% of
informal trade workers, and 55% or more of informal sector workers in agriculture,
manufacturing and community and personal services.
Table 8: Employed aged 15 years and above by sex, industry and sector (1 000)
Sex and Industry Formal Informal Domestic
workers
Unspec Total
Total
Total 7568 3059 1004 315 11946
Agriculture, hunting, forestry and fishing 686 1082 68 1836
Mining and quarrying 514 10 7 532
Manufacturing 1319 238 28 1585
Electricity, gas and water supply 79 2 1 82
Construction 354 257 36 647
Wholesale and retail trade 1454 952 53 2459
Transport, storage and communication 432 100 22 553
Finance, insurance, real estate & business
services
865 52 20 938
Community, social and personal services 1785 178 49 2012
Private households with employed persons 27 175 1004 5 1212
Exterior organisations and foreign
government
4 4
Other activities not adequately defined 30 3 1 34
Unspecified 19 8 25 51

Male
Total 4708 1572 41 190 6511
Agriculture, hunting, forestry and fishing 467 484 33 983
Mining and quarrying 498 8 7 513
Manufacturing 865 105 19 989
Electricity, gas and water supply 64 2 1 66
Construction 329 237 34 601
Wholesale and retail trade 793 386 29 1209
Transport, storage and communication 355 95 17 468
Finance, insurance, real estate & business
services
505 34 11 550
Community, social and personal services 781 76 19 877
Private households with employed persons 21 141 41 4 207
Exterior organisations and foreign
government
2 2
Other activities not adequately defined 19 1 1 21
Unspecified 9 3 14 25
Female
Total 2859 1486 963 125 5434
Agriculture, hunting, forestry and fishing 219 598 35 853
Mining and quarrying 17 2 19
Manufacturing 454 133 9 596
Electricity, gas and water supply 16 16
Construction 25 20 2 47
Wholesale and retail trade 660 567 23 1250
Transport, storage and communication 77 4 4 86
Finance, insurance, real estate & business
services
360 18 9 388
Community, social and personal services 1003 102 30 1135
Private households with employed persons 6 35 963 1 1005
Exterior organisations and foreign
government
2 2
Other activities not adequately defined 11 1 1 13
Unspecified 10 5 11 26
Table 9 provides a breakdown by the occupation of the employed person rather than
industry. This table shows that clerks, professionals, technical people and operators are
least likely to be employed in the formal sector. Conversely, over four in every five (81%)
skilled agricultural workers, about a third of elementary workers (36%) and craft workers
(32%) and over a quarter (27%) of service and sales workers are employed in the informal
sector. In each of these categories, women are more likely than men to be employed in the
informal sector. Women account for 49% of the total non-domestic informal sector, but
67% of informal service and sales workers, 62% of informal sector clerks, 55% of
informal sector elementary workers and 53% of informal sector technical and associate

professionals and skilled agricultural workers.
Table 9: Employed aged 15 years and above by sex, occupation and sector (1 000)
Sex and occupation Formal Informal Domestic
workers
Unspec Total
Total
Total 7568 3059 1004 315 11946
Legislators, senior officials and
managers
493 66 9 568
Professionals 504 22 14 540
Technical and associate professionals 965 103 20 1088
Clerks 987 37 29 1053
Service workers and shop & market
sales workers
997 389 39 1425
Skilled agricultural and fishery workers 187 976 44 1207
Craft and related trades workers 993 492 49 1534
Plant and machine operators and
assemblers
987 137 26 1151
Elementary occupation 1431 829 64 2324
Domestic workers 1004 0 1004
Occupation not adequately defined 10 1 0 11
Unspecified 12 6 22 40
Male
Total 4708 1572 41 190 6511
Legislators, senior officials and
managers
372 44 7 423
Professionals 277 11 5 294
Technical and associate professionals 418 48 12 478
Clerks 323 14 8 345
Service workers and shop & market
sales workers
619 129 18 766
Skilled agricultural and fishery workers 148 459 21 628
Craft and related trades workers 877 379 44 1300
Plant and machine operators and
assemblers
836 115 24 974
Elementary occupation 825 370 38 1234
Domestic workers 41 0 41
Occupation not adequately defined 7 0 7
Unspecified 7 2 12 21
Female
Total 2859 1486 963 125 5434
Legislators, senior officials and
managers
121 22 2 146

Professionals 227 10 9 246
Technical and associate professionals 547 55 8 609
Clerks 664 23 21 708
Service workers and shop & market
sales workers
379 260 20 660
Skilled agricultural and fishery workers 39 517 23 579
Craft and related trades workers 116 113 5 234
Plant and machine operators and
assemblers
152 22 2 176
Elementary occupation 606 459 25 1090
Domestic workers 963 0 963
Occupation not adequately defined 3 1 0 4
Unspecified 5 4 10 19
Table 10 presents the same information, but this time excluding agriculture. As expected,
the biggest differences between this and the previous table are in respect of skilled
agricultural and elementary workers. In particular, the number of skilled agricultural
workers recorded in the informal sector falls from 976 000 to 156 000. The decrease is
particularly marked for women.
Table 10: Non-agricultural employed aged 15 years and above by sex, occupation
and sector (1 000)
Formal Informal Domestic
workers
Unspecified Total
Total
Total 6882 1977 1004 247 10110
Legislators, senior officials and
managers
477 64 9 550
Professionals 503 21 14 538
Technical and associate
professionals
960 102 20 1082
Clerks 975 35 28 1038
Service workers and shop and
market sales workers
990 386 38 1415
Skilled agricultural and fishery
workers
82 156 6 244
Craft and related trades workers 978 489 49 1516
Plant and machine operators and
assemblers
893 115 24 1032
Elementary occupation 1002 601 38 1640
Domestic workers 1004 0 1004
Occupation not adequately defined 10 1 0 11
Unspecified 12 6 22 40
Male

Total 4242 1089 41 157 5528
Legislators, senior officials and
managers
357 42 7 406
Professionals 277 10 5 293
Technical and associate
professionals
418 48 12 478
Clerks 317 14 8 339
Service workers and shop and
market sales workers
614 127 17 758
Skilled agricultural and fishery
workers
72 140 6 217
Craft and related trades workers 866 377 44 1287
Plant and machine operators and
assemblers
745 93 22 860
Elementary occupation 563 235 24 822
Domestic workers 41 0 41
Occupation not adequately defined 7 0 7
Unspecified 7 2 12 21
Female
Total 2640 888 963 90 4581
Legislators, senior officials and
managers
119 22 2 144
Professionals 226 10 9 245
Technical and associate
professionals
542 54 8 604
Clerks 658 21 20 699
Service workers and shop and
market sales workers
377 259 20 656
Skilled agricultural and fishery
workers
10 17 0 27
Craft and related trades workers 112 113 5 230
Plant and machine operators and
assemblers
148 22 2 172
Elementary occupation 439 365 13 818
Domestic workers 963 0 963
Occupation not adequately defined 3 1 0 4
Unspecified 5 4 10 19
The previous tables classify occupations into broad categories, largely according to the
first digit of the standard occupational classification. Table 11 disaggregates further in
terms of occupation. It lists all occupations, which, according to the LFS 2000:2,
constitute 2% or more of the informal sector. The table shows that women outnumber men
in all of the most common occupations except gardener, bricklayer and motor mechanic. It
also confirms the dominance of domestic workers, subsistence agriculture workers, and
different types of street vendors.

Table 11: Most common occupations in informal sector in LFS 2000:2 (1 000)
Occupation Male Female Total % of
male
% of
female
% of
total
Total informal sector 1531 2367 3898 100% 100% 100%
Domestic helper 41 962 1003 3% 41% 26%
Subsistence agriculture
worker
244 435 679 16% 18% 17%
Street vendor food 82 241 323 5% 10% 8%
Farm-hand & labourer 129 88 218 8% 4% 6%
Gardener/nursery grower 137 12 149 9% 1% 4%
Street vendor non-food 48 74 122 3% 3% 3%
Spaza shop operator 40 81 121 3% 3% 3%
Shebeen operator 26 65 90 2% 3% 2%
Bricklayer/stonemason 68 2 70 4% 0% 2%
Motor mechanic 60 1 61 4% 0% 2%
We must note, however, that a table constructed on official data of five or so years
previously would have presented a very different picture. Firstly, the LFS has proved far
more efficient than its predecessor, the October household survey (OHS), in capturing
subsistence agricultural workers. This can be explained by the LFS‟s explicit prompts for
work on own or family plot. Secondly, the LFS is picking up substantially more street
traders than previously. The table above, for example, shows 323 000 food vendors and
122 000 non-food vendors. The OHS of 1995 found a total of six individuals in the
sample, yielding a weighted population of 2 038 nation-wide, classified as street traders.
This phenomenal increase must be explained by a combination of factors, namely (a) an
improved instrument in terms of prompting and training of fieldworkers; (b) increased
awareness on the part of coders; and (c) a real-life increase due to relaxation of laws
combined with decreasing formal sector opportunities. It is also possible that some
informal spaza shop operators have been incorrectly classified as street traders as there is
sometimes a fine line between the two forms of operation. The uncertainty as to how
much of the shift is explained by methodology and how much by „real‟ changes means
that longitudinal analysis of the informal sector in South Africa is very difficult, if not
impossible.
Table 12 (from Statistics South Africa, March 2001) gives some ideas of the shifts over
time, but, as before, does not allow us to distinguish between the changes induced by
methodology and those induced by changes in the real situation. The figures for 1996 to
1999 are from the October household surveys of those years. The figures for 2000 are
from the pilot LFS of February 2000. The informal figures for 1996 are even lower than
those for other years because, up until that time, only employers and the self-employed
were asked whether they operated in the formal or informal sector. Informal sector
employees were thus excluded. The table shows a clear decline in the numbers employed
as recorded by the formal establishment surveys, from 5,2 million in 1996 to 4,8 million
in 2000. It also shows an apparent increase in employment in agriculture. However, the

2000 division into formal and informal suggests that much of this might reflect better
recording of informal agriculture rather than an actual increase. Employment in the non-
agricultural, non-domestic informal sector appears to have increased, at least up until
1999.
Table 12: Employment by sector of population aged 15-65 years, 1996-2000 (1 000)
Sector 1996 1997 1998 1999 2000
Total employed 9 287 9 247 9 390 10 369 11 880
Covered by formal establishment
survey
5 242 5 139 4 945 4 840 4 754
Agriculture formal 759 717 935 1 009 757
Agriculture informal 1 508
Domestic work 740 668 740 799 1 001
Other informal 996 1 136 1 316 1 907 1 821
Unspecified - - - - 115
2.3.2 Alternative definitions of the informal sector
As noted, South African uses a question on registration to distinguish between the forml
and informal sectors. Some other countries use other characteristics to define the informal
sector. The next set of tables looks at alternative definitions of the informal sector and
compares the resultant classifications with that obtained by the simple registration-related
formal/informal question. In ease case we also note the number of cases in which the
information on which both the official and alternative classifications could be based is
unknown.
Table 13 looks at the number of workers employed in the establishment. If we use a cutoff
of fewer than five workers, one in ten businesses classified as formal sector under the
conventional definition will be reclassified as informal. Part of this is easily explained, for
example by the existence of small but profitable professional firms. Conversely, 14% of
reportedly informal sector businesses have five or more workers. Overall, the number of
regular workers is reported as unknown in respect of 4% of employed people.
Table 13: Employed aged 15 years and above by number of regular workers and
sector (1 000)
Number of regular
workers
Formal
sector
Informal
sector
Unknown Total
One worker 307 2121 48 2476
2 - 4 workers 762 1240 51 2053
5 - 9 workers 1016 284 29 1330
10 or more 5177 279 110 5567
Unknown 394 35 91 520
Total 7658 3959 329 11946

Table 14 looks at the definition in terms of registration as a company or close corporation.
(The standard definition does not specify what form or registration is being referred to.)
Here again, 10% of workers in businesses conventionally classified as formal sector
would be in the informal sector under this definition. Conversely, 8% of informal sector
businesses are said to be registered companies or close corporations. The latter pattern
suggests that interviewers are not always reading out the definition of formal and informal
in the conventional question. About 4% of respondents either do not know or do not
specify whether the establishment is registered or not.
Table 14: Employed aged 15 years and above by sector and whether the enterprise is
a registered company or close corporation (1 000)
Registered Formal
sector
Informal
sector
Unknown Total
Yes 6 665 306 101 7 072
No 762 3 546 100 4 408
Unknown 231 107 128 466
Total 7 658 3 959 329 11
946
Table 15 reveals a very poor match between UIF deductions and the traditional formal
sector definition. Only 55% of workers reportedly working in the formal sector say that
the businesses deduct UIF for them. Only about a quarter of those not deducting are
explained by the worker‟s income being above the UIF limit. On the other hand, only 3%
of informal sector businesses are said to be deducting UIF. The mismatch with this
measure could partly reflect non-compliance with the Unemployment Insurance Act.
Again, for about 4% of workers there was no information as to whether UIF was deducted
or not.
Table 15: Employed aged 15 years and above by sector and whether the enterprise is
deducting UIF contributions (1 000)
Deduction of UIF contribution Formal
sector
Informal
sector
Don't
know
Total
Deducting UIF 4232 132 69 4434
Not deducting because income is
above limit
830 363 26 1220
Not deducting for other reason 2286 3380 137 5804
Unknown 309 83 97 489
Total 7657 3958 329 11946
The next alternative definition is based on the location of the business. Premises such as a
factory, office, shop, school or post office are taken as implying a formal business. Other
locations are interpreted as informal. The tabulation reveals that close on a quarter of

workers in reportedly formal enterprises report that they operate in informal premises. The
greatest discrepancy occurs in terms of the first location – in the owner‟s home or on the
owner‟s farm. This category accounts for 12% of the reportedly formal sector businesses.
Much of the mismatch is probably explained by having a single category for owner‟s
home, where the business will usually be informal, and owner‟s farm, which will often be
a formal, commercial farm. Part of the mismatch could also be explained by consultants
and other professional people working from a home base. Only 4% of the informal sector
businesses are said to operate from formal premises. The location is unknown in only 1%
of all cases.
Table 16: Employed aged 15 years and above by sector and location of enterprise
(1 000)
Location Formal
sector
Informal
sector
Unknown Total
Owner's home/ farm 897 2 544 64 3 506
Someone else's home 90 521 12 623
Formal business premises 4 749 102 65 4 915
Service outlet 1 153 74 18 1 245
Market 261 38 3 302
Footpath, street, corner, open
space
131 160 9 300
No fixed location 244 490 37 771
Other 104 26 19 149
Unknown 29 4 102 136
Total 7 658 3 959 329 11
946
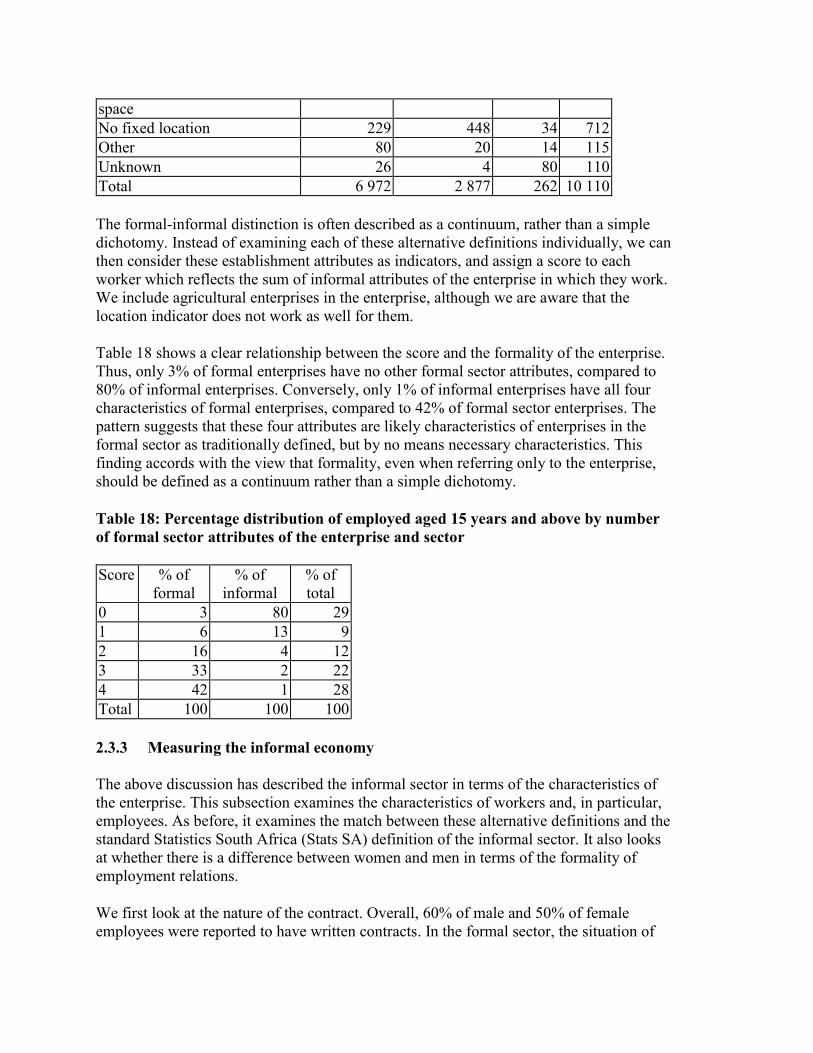
To circumvent the confusion around owner‟s home and farm, table 17 excludes the
agricultural sector. This time 16% of workers in reportedly formal businesses report that
they operate in informal premises. Conversely, 6% of the informal sector businesses are
said to operate from formal premises. The match is thus much improved, but still not all
that good.
Table 17: Non-agriculture employed aged 15 years and above by sector and location
of enterprise (1 000)
Location Formal sector Informal
sector
Unknown Total
Owner's home/ farm 398 1 592 33 2 023
Someone else's home 81 489 10 580
Formal business premises 4 649 95 61 4 805
Service outlet 1 150 73 18 1 241
Market 260 36 3 299
Footpath, street, corner, open 99 119 7 225
space
No fixed location 229 448 34 712
Other 80 20 14 115
Unknown 26 4 80 110
Total 6 972 2 877 262 10 110
The formal-informal distinction is often described as a continuum, rather than a simple
dichotomy. Instead of examining each of these alternative definitions individually, we can
then consider these establishment attributes as indicators, and assign a score to each
worker which reflects the sum of informal attributes of the enterprise in which they work.
We include agricultural enterprises in the enterprise, although we are aware that the
location indicator does not work as well for them.
Table 18 shows a clear relationship between the score and the formality of the enterprise.
Thus, only 3% of formal enterprises have no other formal sector attributes, compared to
80% of informal enterprises. Conversely, only 1% of informal enterprises have all four
characteristics of formal enterprises, compared to 42% of formal sector enterprises. The
pattern suggests that these four attributes are likely characteristics of enterprises in the
formal sector as traditionally defined, but by no means necessary characteristics. This
finding accords with the view that formality, even when referring only to the enterprise,
should be defined as a continuum rather than a simple dichotomy.
Table 18: Percentage distribution of employed aged 15 years and above by number
of formal sector attributes of the enterprise and sector
Score % of
formal
% of
informal
% of
total
0 3 80 29
1 6 13 9
2 16 4 12
3 33 2 22
4 42 1 28
Total 100 100 100
2.3.3 Measuring the informal economy
The above discussion has described the informal sector in terms of the characteristics of
the enterprise. This subsection examines the characteristics of workers and, in particular,
employees. As before, it examines the match between these alternative definitions and the
standard Statistics South Africa (Stats SA) definition of the informal sector. It also looks
at whether there is a difference between women and men in terms of the formality of
employment relations.
We first look at the nature of the contract. Overall, 60% of male and 50% of female
employees were reported to have written contracts. In the formal sector, the situation of

women and men is very similar, in that around two-thirds of both sexes have written
contracts. Among domestic workers and in the rest of the informal sector, written
contracts are much less common although, legally, employers of domestic workers are
obliged to give them a written contract. Among domestic workers, men are more likely to
have contracts than women, while the reverse situation pertains in the rest of the informal
sector. Overall, 11% of domestic workers and 16% of other informal sector workers are
reported to have contracts. There is thus a strong link between the formality of the sector
and this indicator, but by no means an exact match.
Table 19: Employees aged 15 years and above by whether they have written
contracts and sector (1 000)
Sex Whether contract Domestic
workers
Informal Formal Unknown Grand
Total
Male Written contract 6 97 2901 53 3057
No contract 33 526 1275 64 1897
Unknown 0 24 138 10 182
Total 40 646 4314 136 5136
Female Written contract 107 48 1773 34 1962
No contract 828 174 811 31 1844
Unknown 22 11 82 3 123
Total 957 233 2667 73 3930
Total Written contract 113 145 4675 87 5020
No contract 861 700 2086 95 3741
Unknown 23 34 221 13 305
Total 997 879 6982 209 9067
The second indicator of informality is the terms on which the worker is employed. Here
we regard casual, seasonal and temporary work as indicators of informality. Analysis of
table 20 reveals that, overall, 20% of male employees and 24% of female are found to be
part of the informal economy in terms of this indicator. In the formal sector, 14% of
employees are reported to be on casual, seasonal or temporary terms, compared to 41% of
domestic workers and 55% of employees in the rest of the informal sector. In the formal
sector, women are more likely than men to be on informal terms, while the reverse pattern
holds in both parts of the informal sector. Overall, again there is a clear relationship
between the degree of formality of the sector and formality of the terms of employment,
but far from a one-to-one correspondence.
Table 20: Employees aged 15 years and above by terms of employment and sector
(1 000)

Contract type Domestic
workers
Other
informal
Formal Unknown Total
Total
Permanent 537 342 5662 126 6667
A fixed period
contract
21 33 257 10 321
Temporary 243 257 578 34 1112
Casual 165 199 379 21 765
Seasonal 4 27 53 3 87
Unknown 27 20 53 14 115
Total 997 879 6982 209 9067
Male
Permanent 19 237 3508 79 3842
A fixed period
contract
1 28 189 8 225
Temporary 13 193 343 25 573
Casual 6 160 219 14 399
Seasonal 1 12 20 1 34
Unknown 1 17 36 9 62
Total 40 646 4314 136 5136
Female
Permanent 518 105 2154 47 2824
A fixed period
contract
19 6 68 3 96
Temporary 231 63 235 9 538
Casual 159 39 160 7 365
Seasonal 3 16 33 2 53
Unknown 26 4 18 5 53
Total 957 233 2667 73 3930
The third indicator of employee informality is entitlement to paid leave. The details of this
entitlement are recorded in table 21 below. Overall, 58% of male employees and 52% of
female are reported to be entitled to paid leave. Close on two-thirds (66%) of both male
and female formal sector employees have this entitlement. However, only one-fifth (21%)
of domestic workers, and an even lower 15% of other informal sector employees are
entitled to paid leave. Among domestic workers, men are more likely than women to be
entitled to paid leave, while the opposite pattern holds among other informal sector
employees. Again, this indicator is by no means an accurate indicator of the formality of
the sector in which an employee works.
Table 21: Employees aged 15 years or more by whether they get paid leave and
sector (1 000)

Sex Leave Domestic workers Informal Formal Unknown Total
Male Get paid leave 11 79 2839 50 2979
No paid leave 29 551 1363 69 2010
Unknown 1 17 113 17 147
Total 40 646 4314 136 5136
Female Get paid leave 198 49 1760 33 2040
No paid leave 738 177 843 30 1788
Unknown 21 7 64 102 10
Total 957 233 2667 73 3930
Total Get paid leave 208 128 4600 83 5020
No paid leave 767 728 2205 99 3798
Unknown 22 24 176 248 27
Total 997 879 6982 209 9067
If we regard the above three characteristics as inexact indicators, we can compute a new
variable which indicates the number of informal attributes of each worker in a similar
fashion to what we did for enterprise attributes. We can then compare the distribution of
workers with scores of 0, 1, 2 and 3 respectively across the formal and two informal sub-
sectors. The results, displayed in table 22 below, show a clear correlation between the
score and sector. For example, only 9% of all employees in the formal sector exhibit all
three informal attributes, compared to 36% of domestic workers and 50% of those in other
parts of the informal sector. Conversely, 55% of formal sector employees have no
informal attributes, compared to only 5% of domestic workers and 10% of other informal
sector employees. The same basic patterns hold in respect of male and female employees,
but with male employees in the informal sector being even more likely than female to
exhibit informal employee characteristics.
Table 22: Percentage distribution of employees aged 15 years and above by number
of informal sector attributes and sector
Score Domestic
workers
Other
informal
Formal Total
Total
0 6 10 55 45
1 19 13 24 22
2 39 27 12 17
3 36 50 9 16
Total 100 100 100 100
Male
0 12 9 55 49
1 18 12 24 22
2 27 27 12 14
3 43 52 9 15
Total 100 100 100 100
Female

0 6 14 54 40
1 19 15 24 22
2 40 25 13 20
3 35 45 10 18
Total 100 100 100 100
The final table based on the LFS adds employment status to the analysis of the
intersection of the informal economy and informal sector. The table confirms that the
variables we have used in arriving at our definition of an informal economy worker were
asked only of employees. The division in respect of informal and formal economy is thus
not available for the self-employed or unpaid family workers. The table is presented in
terms of actual numbers, rather than the percentages shown in table 16. The analysis is
also restricted to the age group 15-65 years so as to make the table comparable with those
presented in our initial analysis of the shape of the total economy. Both this and the
previous table provide a conservative estimate of the size of the informal economy, as
employees are only recorded as having a particular characteristic if the response is a
definite negative to the relevant question. Without doubt, some of those for whom this
information is unknown will also exhibit these characteristics.
Table 23: Employed population aged 15-65 years by sector, status in employment
and number of informal sector attributes (1 000)
Employees by number of
informal characteristics
Self-
employed
Unpaid
family
Unknown Total
0 1 2 3 Total Total Total Total
Domestic 62 187 392 356 997 1 0 1 999
Informal 89 113 233 444 879 1910 108 1 2898
Formal 3825 1653 862 641 6982 486 40 1 7509
Unknown 82 44 41 42 209 71 7 19 306
N/A 6 5 5 15 31 17 1 6 54
Total 4064 2004 1533 1498 9097 2486 156 28 11767
2.4. Insights from the time use survey
The LFS for the most part focuses on one form of work for each individual. The initial
prompts in respect of activities over the last seven days reveal whether the person engages
in more than one economic activity. After this, however, all the questions focus on the
main activity. In the time use survey, there are also questions about main activity in the
background question. In the diary, on the other hand, we obtain information on all
activities performed in the preceding 24 hours. This can include more than one form of
work. In the LFS, there are questions enquiring about usual normal and overtime hours
worked per week. From the time use survey, we can obtain more accurate information as
to the extent, in terms of time, that people doing informal work are engaged in these
activities.
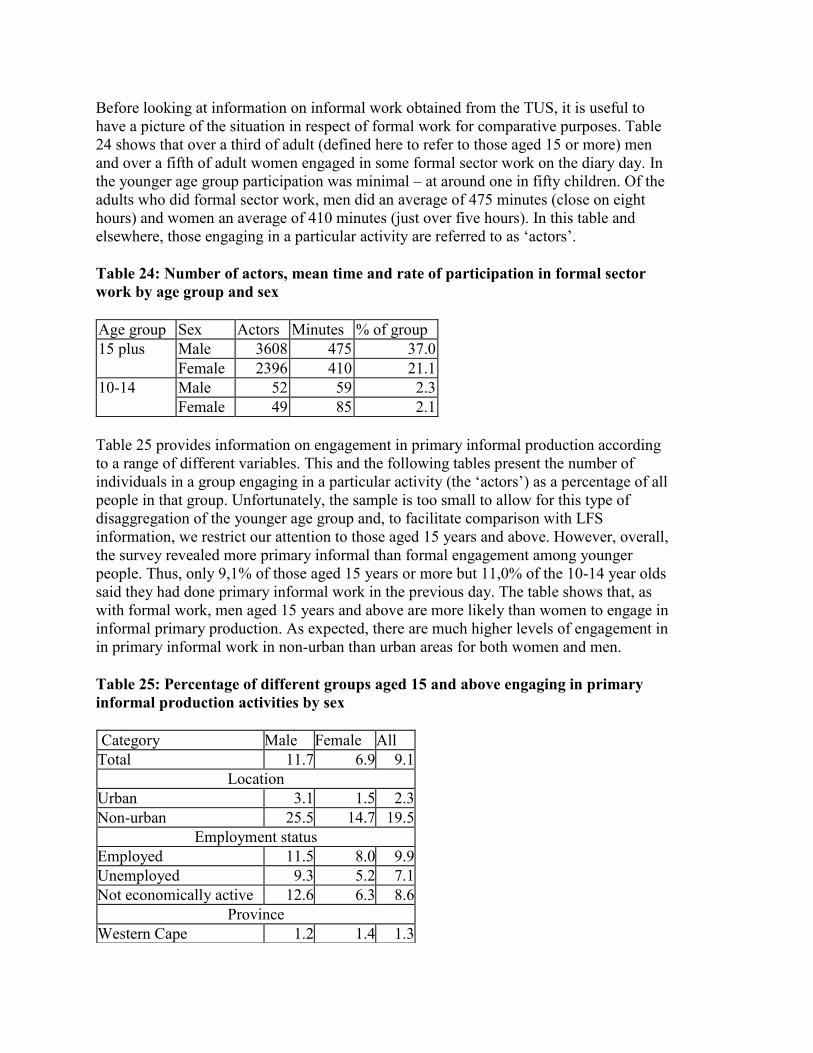
Before looking at information on informal work obtained from the TUS, it is useful to
have a picture of the situation in respect of formal work for comparative purposes. Table
24 shows that over a third of adult (defined here to refer to those aged 15 or more) men
and over a fifth of adult women engaged in some formal sector work on the diary day. In
the younger age group participation was minimal – at around one in fifty children. Of the
adults who did formal sector work, men did an average of 475 minutes (close on eight
hours) and women an average of 410 minutes (just over five hours). In this table and
elsewhere, those engaging in a particular activity are referred to as „actors‟.
Table 24: Number of actors, mean time and rate of participation in formal sector
work by age group and sex
Age group Sex Actors Minutes % of group
15 plus Male 3608 475 37.0
Female 2396 410 21.1
10-14 Male 52 59 2.3
Female 49 85 2.1
Table 25 provides information on engagement in primary informal production according
to a range of different variables. This and the following tables present the number of
individuals in a group engaging in a particular activity (the „actors‟) as a percentage of all
people in that group. Unfortunately, the sample is too small to allow for this type of
disaggregation of the younger age group and, to facilitate comparison with LFS
information, we restrict our attention to those aged 15 years and above. However, overall,
the survey revealed more primary informal than formal engagement among younger
people. Thus, only 9,1% of those aged 15 years or more but 11,0% of the 10-14 year olds
said they had done primary informal work in the previous day. The table shows that, as
with formal work, men aged 15 years and above are more likely than women to engage in
informal primary production. As expected, there are much higher levels of engagement in
in primary informal work in non-urban than urban areas for both women and men.
Table 25: Percentage of different groups aged 15 and above engaging in primary
informal production activities by sex
Category Male Female All
Total 11.7 6.9 9.1
Location
Urban 3.1 1.5 2.3
Non-urban 25.5 14.7 19.5
Employment status
Employed 11.5 8.0 9.9
Unemployed 9.3 5.2 7.1
Not economically active 12.6 6.3 8.6
Province
Western Cape 1.2 1.4 1.3

Eastern Cape 31.1 12.3 20.5
Northern Cape 7.0 3.0 4.6
Free State 10.3 5.4 7.7
KwaZulu-Natal 12.4 9.6 10.8
North West 9.3 3.5 6.4
Gauteng 1.8 1.1 1.4
Mpumalanga 13.9 9.5 11.6
Northern Province 18.2 12.4 15.0
Highest education level
None 20.4 17.7 18.7
Grade 6 and below 21.3 11.2 16.3
Less than matric 10.0 4.7 7.1
Matric and above 4.8 3.1 3.9
Population group
African 14.7 8.6 11.4
Coloured 1.9 1.6 1.7
Indian 1.4 0.8 1.1
White 3.9 2.5 3.2
Total 5.9 9.4 7.8
Also expected, levels of primary informal engagement are highest in the poorer and more
non-urban provinces such as Eastern Cape and Northern Province. This pattern holds for
both women and men.
In terms of education, there is a clear pattern of greater engagement of less educated
women and men in primary informal production than of more educated people. For both
women and men, African people are markedly more likely than those in other groups to
engage in primary informal production. Engagement is highest among African men.
The patterns in respect of employment status are less clear. Respondents were classified
as employed, unemployed and not economically active on the basis of their responses to a
set of questions about activity over the last seven days. The questions were very similar to
those used in the LFS. Strictly speaking, anyone who reported that they had undertaken
any economic activity in the previous 24 hours should also have reported some economic
activity for the past seven days, and thus have been classified as employed. In practice,
2% of people reporting economic activities answered the employment questions as if they
were unemployed, and a further 16% answered the questions as if they were not
economically active. This discrepancy suggests that despite a marked improvement in
Stats SA‟s ability to pick up economic activity in its household surveys, it is still not
capturing all activity.
Table 25 shows that, while those classified as employed are slightly more likely than
others to report primary informal work, the differences between employed and
unemployed and not economically active in this respect are very small. Among men, the
not economically active are more likely than the employed or unemployed to report
informal primary activity. When compared with the pattern in the next table, these
patterns suggest that it is mainly primary informal production that is being undercounted
by the standard employment questions.
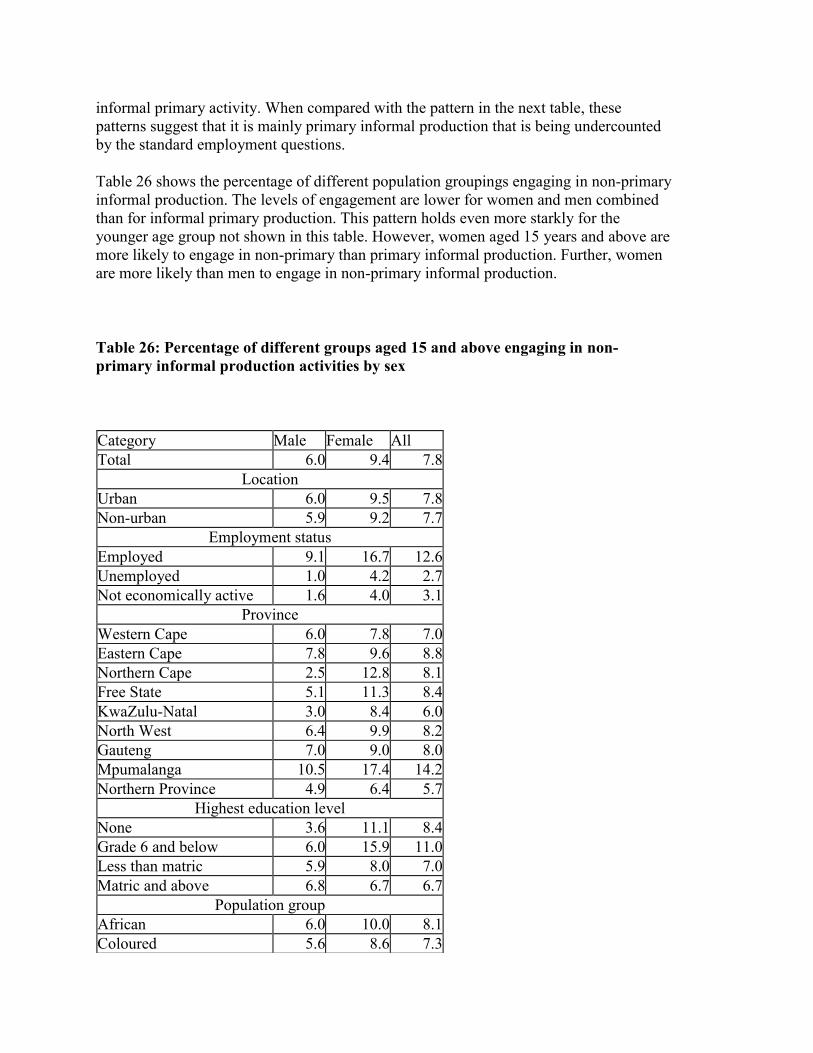
Table 26 shows the percentage of different population groupings engaging in non-primary
informal production. The levels of engagement are lower for women and men combined
than for informal primary production. This pattern holds even more starkly for the
younger age group not shown in this table. However, women aged 15 years and above are
more likely to engage in non-primary than primary informal production. Further, women
are more likely than men to engage in non-primary informal production.
Table 26: Percentage of different groups aged 15 and above engaging in non-
primary informal production activities by sex
Category Male Female All
Total 6.0 9.4 7.8
Location
Urban 6.0 9.5 7.8
Non-urban 5.9 9.2 7.7
Employment status
Employed 9.1 16.7 12.6
Unemployed 1.0 4.2 2.7
Not economically active 1.6 4.0 3.1
Province
Western Cape 6.0 7.8 7.0
Eastern Cape 7.8 9.6 8.8
Northern Cape 2.5 12.8 8.1
Free State 5.1 11.3 8.4
KwaZulu-Natal 3.0 8.4 6.0
North West 6.4 9.9 8.2
Gauteng 7.0 9.0 8.0
Mpumalanga 10.5 17.4 14.2
Northern Province 4.9 6.4 5.7
Highest education level
None 3.6 11.1 8.4
Grade 6 and below 6.0 15.9 11.0
Less than matric 5.9 8.0 7.0
Matric and above 6.8 6.7 6.7
Population group
African 6.0 10.0 8.1
Coloured 5.6 8.6 7.3

Indian 2.7 2.2 2.4
White 6.6 8.4 7.5
In terms of employment status, this time, as expected, employed people are markedly
more likely to engage in non-primary informal work than unemployed or not
economically active. Nevertheless, as many as 4,0% of women who are classified as not
economically active according to other questions reported some non-primary informal
work activity. This suggests some remaining gender bias in the way employment
questions are asked or understood.
Across provinces, Mpumalanga reports the highest levels of non-primary informal work
for both women and men, and all ages. It is not clear why this is the case.
In terms of education, the highest levels of engagement in non-primary informal work are
among women with only primary education. Among the men there is less variation, apart
from a lesser tendency of those with no formal education at all to engage in this work.
In terms of population group there are, overall, small differences except for much lower
engagement in informal non-primary production by Indian people than by those of the
other groups. Among women, the differences are somewhat greater, with African women
the most likely to engage in informal non-primary production. This latter pattern accords
with other evidence which suggests that much of the engagement in informal production
is driven by poverty, and lack of other income-earning opportunities.
Table 27 shows the mean minutes per day spent on informal work by those engaging in
the two broad categories of informal work. It shows that the time spent on both types of
informal activity is significantly less than the time spent on formal work for adult women
and men. However, for the younger age group the time spent on informal work is
significantly higher than that spent on formal work for boys, and slightly higher for girls.
This could, at least partly, reflect the better observance of the prohibition on economic
work for children under 15 years contained in the Basic Conditions of Employment Act
(BCEA) in respect of formal when compared with informal work. The table also reveals
that, while a slightly larger proportion of the population (see above) engaged in primary
than non-primary informal production, the average time spent on the former activity is
significantly less.
Table 27: Mean minutes per day spent on informal work by actors by sex and age
group
Age group Category Male Female Both
15 plus Informal primary production 170 145 160
Other informal production 290 260 270
10-14 Informal primary production 129 54 111
Other informal production 166 92 125
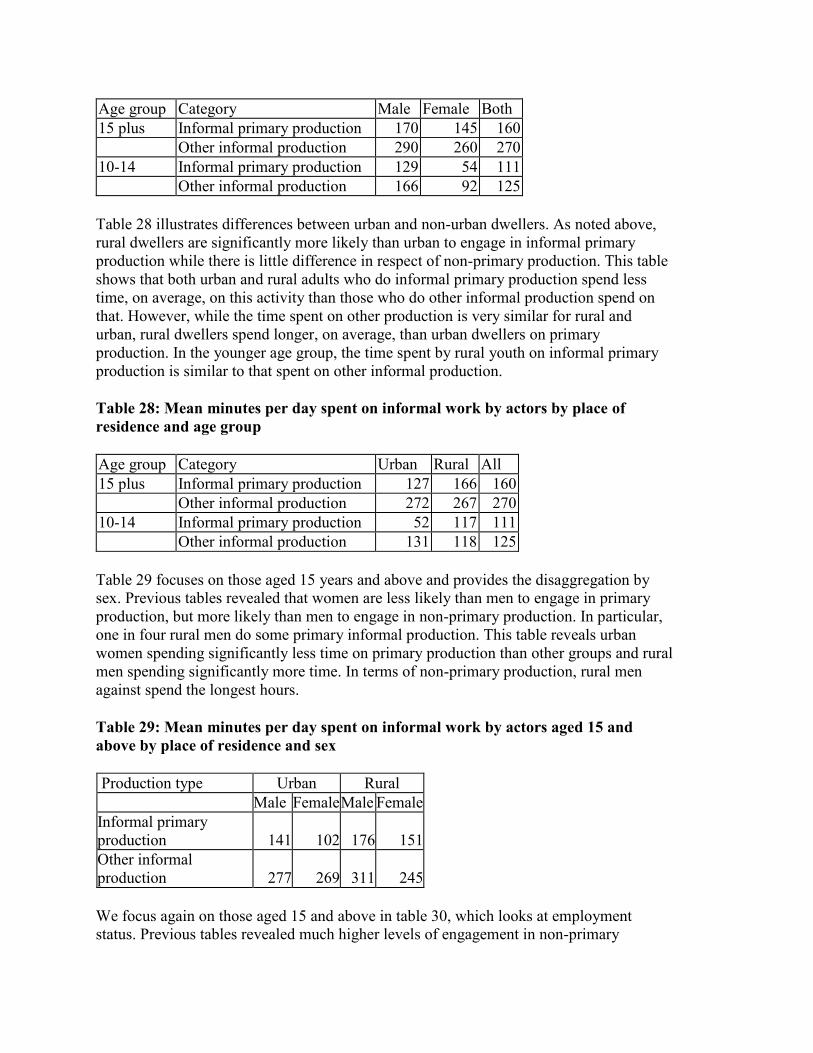
Table 28 illustrates differences between urban and non-urban dwellers. As noted above,
rural dwellers are significantly more likely than urban to engage in informal primary
production while there is little difference in respect of non-primary production. This table
shows that both urban and rural adults who do informal primary production spend less
time, on average, on this activity than those who do other informal production spend on
that. However, while the time spent on other production is very similar for rural and
urban, rural dwellers spend longer, on average, than urban dwellers on primary
production. In the younger age group, the time spent by rural youth on informal primary
production is similar to that spent on other informal production.
Table 28: Mean minutes per day spent on informal work by actors by place of
residence and age group
Age group Category Urban Rural All
15 plus Informal primary production 127 166 160
Other informal production 272 267 270
10-14 Informal primary production 52 117 111
Other informal production 131 118 125
Table 29 focuses on those aged 15 years and above and provides the disaggregation by
sex. Previous tables revealed that women are less likely than men to engage in primary
production, but more likely than men to engage in non-primary production. In particular,
one in four rural men do some primary informal production. This table reveals urban
women spending significantly less time on primary production than other groups and rural
men spending significantly more time. In terms of non-primary production, rural men
against spend the longest hours.
Table 29: Mean minutes per day spent on informal work by actors aged 15 and
above by place of residence and sex
Production type Urban Rural
Male Female Male Female
Informal primary
production 141 102 176 151
Other informal
production 277 269 311 245
We focus again on those aged 15 and above in table 30, which looks at employment
status. Previous tables revealed much higher levels of engagement in non-primary

informal work by employed than others, but little difference in terms of employment
status when it comes to primary informal work. This table shows, as expected, that
employed men and women spend longer than other groups on informal work. There is
very little difference between women and men in the relative length of time spent on
primary and other informal work. The table reveals significant time being worked by
those whose responses to other questions in the survey classified them as not
economically active. Among the unemployed group, men are recorded as spending more
time on average on informal primary production than employed males or females. This
occurs despite the special prompts for work on a family farm in the main questions
determining economic status. Overall, the table suggests that where there is a conflict
between responses to different questions, it is not explained by people spending a short
time on a particular activity.
Table 30: Mean minutes per day spent on informal work by actors aged 15 and
above by employment status and sex
Production type Employed Unemployed
Not economically
active
Male Female Male Female Male Female
Informal primary production 183 177 259 101 133 116
Other informal production 297 298 89 186 246 134
Disaggregation by age and population group in table 31 shows African men and women
of all ages spending longer, on average, than those of other population groups on most
types of informal work. The only exception occurs in respect of non-primary production,
where older coloured people record slightly more minutes per day than older African
people. A previous table shows that less than 2% of coloured people do this activity, and
the time pattern may, therefore, be unreliable.
Table 31: Mean minutes per day spent on informal work by actors by population
group and age group
Age group Category African Coloured Indian White
15 plus Informal primary production 162 130 111 137
Other informal production 284 299 168 170
10-14 Informal primary production 112 45 - 85
Other informal production 135 120 - 64
Disaggregation by sex and population group in table 32 reveals that the exception in
respect of coloured people is explained by the activity of coloured men rather than
coloured women. Within each population group, men spend longer than women on
informal work. There is thus a difference in the relative likelihood of women and men
engaging in an activity in the first place and, once engaged, how long they are likely to
spend on it. Some of this difference is probably explained by the longer time spent by
women on non-SNA reproductive tasks such as housework and childcare.

Table 32: Mean minutes per day spent on informal work by actors aged 15 and
above by population group and sex
Production type African Coloured Indian White
Male Female Male Female Male Female Male Female
Informal primary
production 170 150 237 29 120 97 168 92
Other informal production 302 275 342 277 276 66 198 149
The next set of tables disaggregates the primary and non-primary production categories
into the individual activities of the time use classification system. In terms of informal
primary production, table 33 reveals travel, tending of animals and crop farming as the
most common activities. As expected, it shows that men are most likely to engage in
tending of animals, while women are more likely to engage in crop farming. In terms of
non-primary production, the table shows travel as the most common activity, followed by
paid domestic work, making and selling of textiles, and petty trading. Women are far
more likely than men to engage in all three of these activities.
Table 33: Percentage of different groups aged 15 and above engaging in informal
work by sex and activity
Activity Male Female Both
Informal primary production
210 Crop farming 2.9 3.2 3.1
220 Tending animals & fish farming 7.2 1.2 4.0
230 Hunting & gathering wild products 0.3 0.3 0.3
240 Digging, stone cutting & carving 0.8 0.2 0.5
260 Purchase & sale primary production 0.2 0.2 0.2
280 Travel related to primary production 5.8 3.9 4.8
290 Primary production n.e.c 0.2 0.0 0.1
Informal non-primary production
113 Paid domestic work 0.5 3.1 1.9
310 Food processing & preservation 0.1 0.3 0.2
320 Preparing and selling food and beverages 0.3 1.1 0.7
330 Making & selling textiles 0.3 2.5 1.5
340 Building & extension of buildings 1.0 0.4 0.7
350 Petty trading & door to door 1.2 1.8 1.5
360 Fitting, maintaining tools & machinery 1.0 0.0 0.5
370 Provision of services for income 0.7 0.3 0.5
380 Travel related to non-establishments prod 2.2 2.8 2.0
390 Non-establishment production n.e.c 0.4 0.2 0.3
Table 34 shows that all three of the main primary production activities are far more
common in rural than urban areas. In contrast, the differences between urban and rural in
respect of the non-primary production activities are all very small.

Table 34: Percentage of different groups aged 15 and above engaging in informal
work by sex and place of residence
Activity Urban Rural Total
Informal primary production
210 Crop farming 0.9 6.4 3.1
220 Tending animals & fish farming 0.6 9.1 4.0
230 Hunting & gathering wild products 0.1 0.6 0.3
240 Digging, stone cutting & carving 0.2 0.9 0.5
260 Purchase & sale primary production 0.2 0.3 0.2
280 Travel related to primary production 1.0 10.6 4.8
290 Primary production n.e.c 0.0 0.2 0.1
Informal non-primary production
113 Paid domestic work 2.1 1.7 1.9
310 Food processing & preservation 0.2 0.2 0.2
320 Preparing and selling food and beverages 0.9 0.5 0.7
330 Making & selling textiles 1.3 1.8 1.5
340 Building & extension of buildings 0.3 1.2 0.7
350 Petty trading & door to door 1.5 1.6 1.5
360 Fitting, maintaining tools & machinery 0.5 0.4 0.5
370 Provision of services for income 0.7 0.1 0.5
380 Travel related to non-establishments prod 2.0 2.0 2.0
390 Non-establishment production n.e.c 0.3 0.2 0.3
Table 35 shows a higher level of engagement in crop farming by employed when
compared with unemployed and not economically active, but less clear patterns in terms
of other activities. With non-primary production, employed people show much higher
levels of engagement in respect of paid domestic work, petty trading, preparing and
selling food and beverages, and travel, but the patterns are again less clear with other
activities. These patterns provide clues as to the type of activities that are not being
recognised by either interviewers or interviewees when responding to the standard
employment questions.
Table 35: Percentage of different groups aged 15 and above engaging in informal
work by sex and employment status
Activity Employed Unemployed NEA Total
Informal primary production
210 Crop farming 3.9 2.1 2.3 3.1
220 Tending animals & fish farming 4.0 3.3 4.1 4.0
230 Hunting & gathering wild products 0.4 0.4 0.1 0.3
240 Digging, stone cutting & carving 0.7 0.4 0.2 0.5
260 Purchase & sale primary production 0.4 0.1 0.0 0.2
280 Travel related to primary production 4.7 3.6 5.2 4.8
290 Primary production n.e.c 0.2 0.0 0.1 0.1
Informal non-primary production
113 Paid domestic work 3.7 0.1 0.2 1.9
310 Food processing & preservation 0.3 0.1 0.0 0.2
320
Preparing and selling food and
beverages 1.3 0.2 0.2 0.7
330 Making & selling textiles 1.3 1.4 1.8 1.5
340 Building & extension of buildings 0.9 0.6 0.4 0.7
350 Petty trading & door to door 2.8 0.3 0.3 1.5
360
Fitting, maintaining tools &
machinery 0.9 0.1 0.1 0.5
370 Provision of services for income 0.8 0.0 0.1 0.5
380
Travel related to non-establishments
prod 3.5 0.9 0.4 2.0
390 Non-establishment production n.e.c 0.6 0.0 0.0 0.3
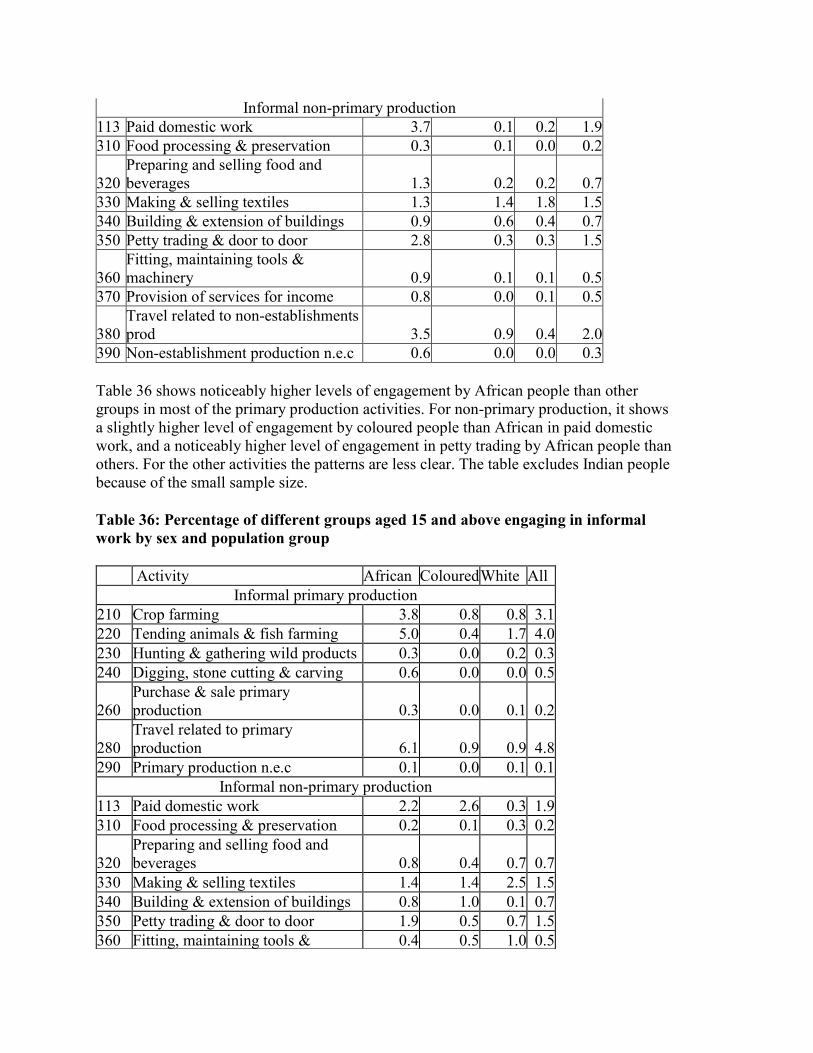
Table 36 shows noticeably higher levels of engagement by African people than other
groups in most of the primary production activities. For non-primary production, it shows
a slightly higher level of engagement by coloured people than African in paid domestic
work, and a noticeably higher level of engagement in petty trading by African people than
others. For the other activities the patterns are less clear. The table excludes Indian people
because of the small sample size.
Table 36: Percentage of different groups aged 15 and above engaging in informal
work by sex and population group
Activity African Coloured White All
Informal primary production
210 Crop farming 3.8 0.8 0.8 3.1
220 Tending animals & fish farming 5.0 0.4 1.7 4.0
230 Hunting & gathering wild products 0.3 0.0 0.2 0.3
240 Digging, stone cutting & carving 0.6 0.0 0.0 0.5
260
Purchase & sale primary
production 0.3 0.0 0.1 0.2
280
Travel related to primary
production 6.1 0.9 0.9 4.8
290 Primary production n.e.c 0.1 0.0 0.1 0.1
Informal non-primary production
113 Paid domestic work 2.2 2.6 0.3 1.9
310 Food processing & preservation 0.2 0.1 0.3 0.2
320
Preparing and selling food and
beverages 0.8 0.4 0.7 0.7
330 Making & selling textiles 1.4 1.4 2.5 1.5
340 Building & extension of buildings 0.8 1.0 0.1 0.7
350 Petty trading & door to door 1.9 0.5 0.7 1.5
360 Fitting, maintaining tools & 0.4 0.5 1.0 0.5

machinery
370 Provision of services for income 0.4 0.5 0.9 0.5
380
Travel related to non-
establishments prod 2.0 1.7 2.5 2.0
390 Non-establishment production n.e.c 0.3 0.2 0.1 0.3
Table 37 shows the mean minutes per day spent on individual activities. To avoid reliance
on small, and probably unreliable, numbers, only the main activities in each category are
included. The table records the longest time for paid domestic work – 350 minutes, or
close on six hours. This could be explained by this work more closely resembling formal
work, with set hours of work per day. The next longest time is recorded for petty trading,
followed by crop farming and making and selling textiles. The travel categories, while
engaged in by relatively large numbers of people, account for the least time of the more
common activities, but still average out at an hour or more a day.
Table 37: Mean minutes per day spent on informal production activities by actors
aged 15 and above by sex
Code Activity Male Female Both
210 Crop farming 154 190 174
220 Tending animals & fish farming 129 69 119
280 Travel related to primary production 69 61 65
113 Paid domestic work 304 357 350
330 Making & selling textiles 412 144 172
350 Petty trading & door to door 244 245 245
380 Travel related to non-establishments prod 85 79 82
The sex differences in time shown in the table above are not reliable when only a small
proportion of a particular sex is engaged in a particular activity. The table does, however,
again suggest more involvement by women than men in terms of both numbers of people
and time in crop farming and paid domestic work, and the opposite pattern in respect of
tending of animals.
2.5 Main export sectors in which informal workforce is concentrated
Section 2.2.1 above looks at the main economic sectors in which informal employment is
concentrated. The analysis reveals that domestic work, agriculture and trade account for
significant shares of informal sector employment. Conversely, the informal sector
accounts for a large proportion of employment in these sectors.
Early terms of reference for this study took this aspect further by asking for the main
export sectors in which the informal workforce is concentrated. Although the final terms
of reference omit this aspect, this section of the paper attempts, from data available at
Stats SA, to give some indications on this topic.

Stats SA‟s national accounts section does not work explicitly with foreign trade statistics.
However, the supply and use tables give some indication of the export of various
commodities. They thus point to the industries that produce goods that are exported.
Before examining the export contribution of the informal economy, it is useful to look at
official estimations of the contribution of the informal economy to different industry
sectors as a whole. At current prices for 1999, table 38 shows the value added in the
informal economy and the total economy, followed by the percentage contribution of the
informal economy. This differs from previous presentations which have looked at the
number and proportion of people employed in the different sectors. The table confirms the
relative importance of the informal economy in trade and construction noted above in
terms of employment. The contribution of the informal sector within agriculture is,
unfortunately, unknown as it is included in subsistence agriculture figures provided to
Stats SA by the national Department of Agriculture.
Table 38: Contribution of informal economy to value added, 1999 (R million)
Industry Informal Total Informal
as % of
total
Mining 89 44 186 0.2
Manufacturing 4 782 135 952 3.5
Construction 3 893 21 263 18.3
Trade 25 019 95 159 26.3
Transport 3 311 71 340 4.6
Business services 8 967 141 928 6.3
Community services 3 801 21 119 18.0
Table 39 is derived from the supply and use tables for 1998. It suggests that in South
Africa the industries in which the informal sector accounts for a larger percentages are
those in which a relatively small percentage of output is exported. The relatively high
percentage for trade is accounted for by accommodation (where the export percentage is
14,3%), rather than other trade services (where the export percentage is 0,7%). Exports
represent a relatively high proportion of supply in agriculture, but this would be largely
within commercial agriculture, rather than within agriculture which constitutes part of the
informal sector.
Table 39: Exports as a proportion of total supply by industry, 1998
Industry Total supply (Rm) Exports (Rm) Exports as
% of

supply
Agriculture 54 858 8 016 14.6
Mining 93 542 65 133 69.6
Manufacturing 713 028 91 762 12.9
Utilities 34 225 444 1.3
Construction 74 506 61 0.1
Trade 44 615 3 193 7.2
Transport 63 415 6 102 9.6
Business services 247 432 5 348 2.2
Community services 248 280 815 0.3
2.6 Contribution of the informal sector to gross domestic product
Stats SA does not ordinarily take sex into account when estimating the informal economy.
The estimates of value added in the informal sector are largely based on the household
surveys and population census without regard as to whether the workers concerned are
women or men. The calculations use the number of enterprises in the smallest size group
in the formal sector establishment surveys together with the number of employers and
self-employed recorded in the household survey to arrive at estimates. For the purposes of
this paper, we sex-disaggregate the resultant value added for each industry in two ways.
Firstly, we disaggregate on the basis of the ratio of total male to female informal
employee wages in each industry. Secondly, we disaggregate on the basis of the ratio of
total male to female informal employee hours in each industry. Both calculations are very
crude. In particular, we have confined our analysis to small size establishments.
Nevertheless, the calculations provide a rough indication.
Table 40 is based on the LFS and shows total weekly income of informal sector
employees by industry and sex. The informal sector is defined to include paid domestic
workers. The table suggests that manufacturing accounts for the largest proportion (44%)
of value added in the informal sector by this measure, followed by trade (20%) and paid
domestic work (12%). The emergence of manufacturing in this table, where it has not
been prominent in previous ones, is explained by the relatively higher wages paid in
manufacture, as well as its relative importance in the economy as a whole.
Table 40: Total weekly income of informal sector employees by industry and sex
(R1 000)
Industry Male Female Total %
female
Agriculture, hunting, forestry and fishing 34812 16035 50848 32
Mining and quarrying 2353 796 3149 25
Manufacturing 319414 192300 511714 38
Electricity, gas and water supply 350 56 406 14
Construction 67375 1310 68685 2
Wholesale and retail trade 131051 98768 229819 43

Transport, storage and communication 43045 1498 44543 3
Financial intermediation, insurance, real estate and
business services
14766 11199 25965 43
Community, social and personal services 25466 60198 85663 70
Private households with employed persons 20855 116775 137630 85
Exterior organisations and foreign government 74 74 100
Other activities not adequately defined 723 20 743 3
Unspecified 178 328 506 65
Total 660388 499357 1159745 43
In terms of sex, the table shows women‟s relative contribution being greatest in paid
domestic work (85%), followed by community, social and personal services (70%), trade
(43%) and finance (43%). Overall, women are seen to contribute 43% in terms of value
added in the informal sector.
The next calculation draws on the time use survey. Because a single individual can be
involved in more than one type of productive activity, we cannot rely on an individual‟s
occupation to allocate hours. Instead we allocate time according to activities. Table 41
shows the allocation of activities to industry. Unfortunately, the activity classification
does not allow a clear division between business and community services, and these are
therefore placed in a single services category. The travel activities are also included
because of uncertainty as to whether these should be considered as adding value or not.
Most travel activities would probably be excluded in GDP calculations, but their inclusion
should not make a big difference to the estimates.
Table 41: Allocation of activities to industry
Code Activity Industry
113 Domestic and personal services produced by (paid)
domestic work
Services
210 Crop farming and market/kitchen gardening Agriculture
220 Tending animals and fish farming Agriculture
230 Hunting, fishing, gathering of wild products and
forestry
Agriculture
240 Digging, stone cutting, splitting and carving Mining &
quarrying
310 Food processing and preservation activities Manufacturing
320 Preparing and selling food and beverage preparation Manufacturing
330 Making and selling textile, leather and related craft Manufacturing
340 Building and extensions of dwelling Construction
350 Petty trading, street/door-to-door vending Trade
360 Fitting, installing, maintaining and repairing tools &
machinery
Services
370 Provision of services for income Services
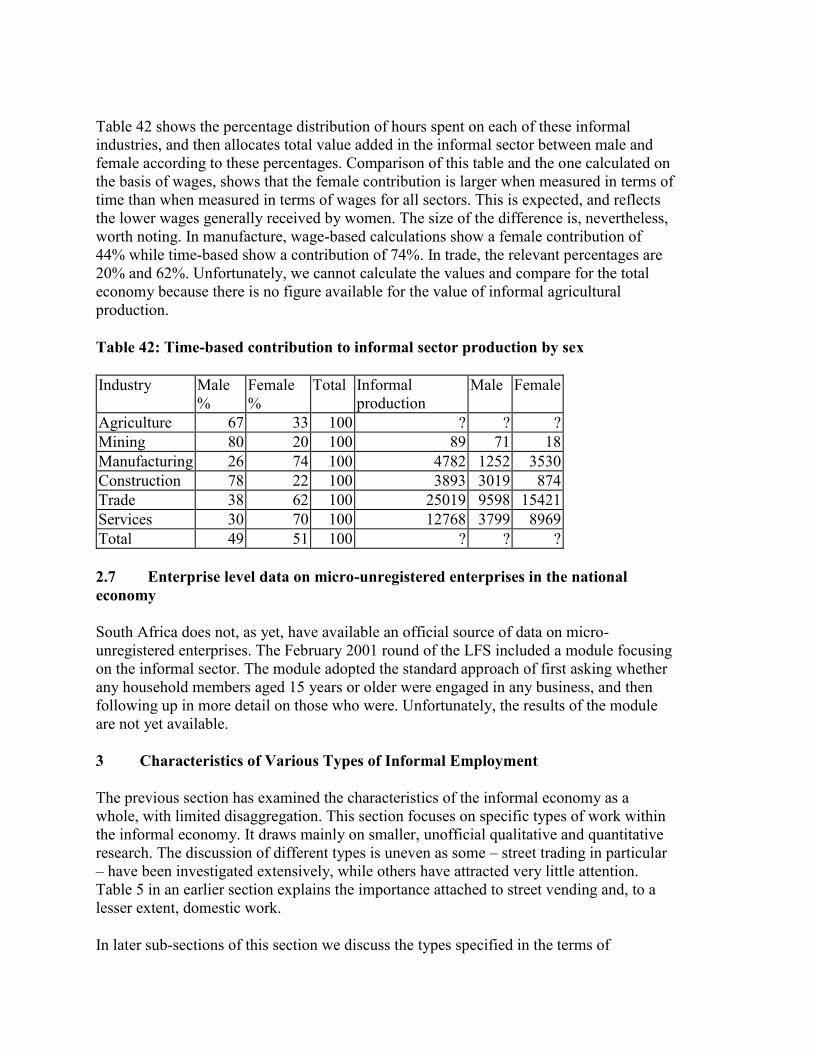
Table 42 shows the percentage distribution of hours spent on each of these informal
industries, and then allocates total value added in the informal sector between male and
female according to these percentages. Comparison of this table and the one calculated on
the basis of wages, shows that the female contribution is larger when measured in terms of
time than when measured in terms of wages for all sectors. This is expected, and reflects
the lower wages generally received by women. The size of the difference is, nevertheless,
worth noting. In manufacture, wage-based calculations show a female contribution of
44% while time-based show a contribution of 74%. In trade, the relevant percentages are
20% and 62%. Unfortunately, we cannot calculate the values and compare for the total
economy because there is no figure available for the value of informal agricultural
production.
Table 42: Time-based contribution to informal sector production by sex
Industry Male
%
Female
%
Total Informal
production
Male Female
Agriculture 67 33 100 ? ? ?
Mining 80 20 100 89 71 18
Manufacturing 26 74 100 4782 1252 3530
Construction 78 22 100 3893 3019 874
Trade 38 62 100 25019 9598 15421
Services 30 70 100 12768 3799 8969
Total 49 51 100 ? ? ?
2.7 Enterprise level data on micro-unregistered enterprises in the national
economy
South Africa does not, as yet, have available an official source of data on micro-
unregistered enterprises. The February 2001 round of the LFS included a module focusing
on the informal sector. The module adopted the standard approach of first asking whether
any household members aged 15 years or older were engaged in any business, and then
following up in more detail on those who were. Unfortunately, the results of the module
are not yet available.
3 Characteristics of Various Types of Informal Employment
The previous section has examined the characteristics of the informal economy as a
whole, with limited disaggregation. This section focuses on specific types of work within
the informal economy. It draws mainly on smaller, unofficial qualitative and quantitative
research. The discussion of different types is uneven as some – street trading in particular
– have been investigated extensively, while others have attracted very little attention.
Table 5 in an earlier section explains the importance attached to street vending and, to a
lesser extent, domestic work.
In later sub-sections of this section we discuss the types specified in the terms of

reference. The discussions often overlap because, for example, a large proportion of the
self-employed, which is the first category – and in particular women who are self-
employed – are street vendors, which is the fifth category. In the remainder of this sub-
section we provide a background to studies of the informal economy in South Africa.
In deciding which information to report, we have included aspects that are not available
from large-scale quantitative surveys, or not included in Stats SA questionnaires. We have
also considered aspects that we consider to have particular pertinence to women‟s
involvement in the informal economy.
3.1.1 Defining the scope
In selecting studies, we have focused on non-agricultural informal work. This is in line
with many other studies of the informal sector internationally. It differs from the
discussion in the sections above to the extent that we included informal agriculture in the
statistical analyses. We did not, however, include discussion of a special study done
several years ago by Stats SA focusing on agriculture in ex-homelands, i.e. primarily on
subsistence agriculture. The Rogerson and Preston-Whyte (1991) volume is unusual
among South African informal sector work because it includes some rural and peri-urban
studies.
Much of the relevant work for this paper has been summarised fairly recently by Lund
(1998) in her review of research on the informal economy, women in the informal
economy, and the working conditions of street traders conducted since 1990. Lund‟s focus
is of the urban situation. Further, the bulk of the studies in South Africa at the time of her
review had focused on KwaZulu-Natal, the most populous of the nine provinces, and one
if the poorest provinces. The KwaZulu-Natal bias in terms of research has probably
become even stronger since then as the local government of Durban, the provincial
capital, has taken a special interest in the informal economy.
As with most issues in South Africa, the informal economy cannot be understood outside
of the political background and its influence on economic, legal and social developments.
Lund‟s review includes a useful summary of these issues. The impact of politics had both
spatial and gender aspects. Under apartheid, most informal selling in urban centres was
defined as illegal and most black business completely illegal. In black urban townships,
business activities were also strictly circumscribed. Lund notes, in particular, that this has
resulted in significantly lower percentages of manufacturing and services within the
informal sector than in other African countries (Lund, 1998:17-18).
Women were more severely affected than men by apartheid spatial laws in that for those
not born there, residence in „white‟ urban areas was dependent on their relationship with a
man – a husband or father. Formal sector opportunities were also difficult to come by.
Factors such as these encouraged large numbers of African women to work as domestic
workers.
One result of the situation described above is confusion – and often a conflation – of

different economic categories. In particular, during apartheid, „informal‟, „black‟ and
„illegal‟ were often treated almost as synonyms in describing particular forms of
economic activity that were formally discouraged by the apartheid government, but arose
as an economic response by black people to apartheid policies.
In the years since the formal ending of apartheid, the economy has changed significantly.
The informal economy has grown due to a combination of several factors. These include
lesser restrictions on black business, relatively poor performance of the formal economy,
and formal encouragement of the growth of small (black) business. The changed reality
has brought with it new confusions. These are reflected in the literature in conflations of
discussion of black and informal businesses and small, medium and micro-enterprises
(SMMEs). Further, the category SMME itself, which spans anything from a survivalist
seller of fruit and vegetables to a formal company employing up to 150 workers, adds to
the confusion.
A further confusion occurs in respect of employment status and sector. The Stats SA
approach up until 1996, where only non-employees were asked whether they were in the
formal or informal sector, was mirrored in other studies. This confusion reinforced
confusion as to whether particular studies were focusing on the self-employed, or on (the
smaller end of) SMMEs.
Many of the documents discuss and dispute the definitions. Naidoo (1993) notes the
confusion when she refers to Peattie‟s assertion that „the “informal sector” is an “utterly
fuzzy” concept which can beguile and engulf innocent researchers into a “conceptual
swamp”‟.
Head (1998) uses a very wide definition of the informal sector based on the unregulated
nature of activities. Her scope includes subsistence agricultural workers, domestic
workers, home-based workers and commercial sex workers. Nevertheless, she
acknowledges that the „question whether women peasant producers should be counted as
part of the informal sector or not is … an unresolved issue‟. She also quotes the
observation of Du Toit and Bosch (1992): „Even the leading characteristics of the
informal sector – the absence of collective bargaining and non-observance of protective
regulation – are by no means confined to the informal sector alone.‟ This observation is
interesting in raising two factors that are not generally employed in defining the informal
sector for statistical purposes. It again points to the fact that some of the work discussed
will be using alternative definitions and conceptions of the informal economy.
3.1.2 Informal sector vs informal economy
Recent work, primarily by researchers associated with South Africa‟s WIEGO network,
has attempted to take the informal economy notion further. Motala (May 2000) presents a
useful conceptual model developed by John Cross that distinguishes between different
levels of dependence and, by implication, exploitation among traders. The model is
illustrated in table 43.

Table 43: The four poles of informal economy work in the trading sector
One supplier Multiple suppliers
One client Pole A: One client and one
supplier (disguised worker)
Pole B: Multiple clients but one
supplier (sales commission)
Multiple
clients
Pole C: One client but multiple
suppliers (sub-contractors)
Pole E: Multiple clients and multiple
suppliers (entrepreneurs)
(Reproduced in Motala, 2000:3).
All three poles of the model are commonly associated with the informal economy, but
they are often not sufficiently distinguished. Ignoring the distinctions has implications for
policy as well as statistics. Recent South African labour legislation has tried to avoid the
situation where employment is disguised so as to avoid labour laws. One of Motala‟s case
studies is a garment manufacturer who is a member of the Confederation of Employers of
South Africa (COFESA). COFESA is generally perceived as having been set up to assist
employers to avoid labour laws and the agreements of the legally established bargaining
councils. The employer‟s daughter explained that „contract workers are people who
voluntarily choose to take a contract with the firm to provide services and for which they
would receive a fee per unit of work done‟ (Motala, 2000:20). However, in this case the
workers all work on the employer‟s premises, use the employer‟s machines and materials,
had set hours of work and in many other ways are ordinary employees. The difference is
that they are not entitled to a number of benefits that they would receive if they were
„ordinary‟ workers.
Several studies note the links between the formal and informal sectors. Three World Bank
establishments surveys (Chandra et al, 2001a and 2001b) conducted in the Greater
Johannesburg metropolitan area provide some evidence about links between formal and
informal economies in the form of use of temporary labour and subcontractors.
The World Bank study of large firms (Chandra et al, 2001a) found a positive relationship
between firm size and the use of temporary labour and outsourcing. Over three-quarters of
firms using temporary labour said they did so in order to be able to expand the workforce
without hiring permanent workers, a reason categorised as „flexibility‟ in the report. The
three most commonly outsourced activities were general services, transport and training.
Again, the most common reason for outsourcing was flexibility in adapting to increased
workloads.
The World Bank‟s SMME survey (Chandra et al, 2001b) covered 792 firms across eight
sectors. All firms paid VAT and would thus be considered formal in statistical terms. In
analysis, the Bank distinguished between micro (1-5 employees), very small (6-20
employees) and small (21-49 employees) enterprises. The survey revealed that a third of
the micro firms and 60% of small firms hired temporary labour. Construction and
furniture were the greater utilisers of temporary labour. Even more than was the case with
larger firms, SMMEs cited the need for flexibility as the reason for using temporary
workers.

Both the large and small firm surveys were asked questions about the impact of changes
in labour laws. This is relevant in understanding the informal economy as some analysts
ascribe the increase in outsourcing and use of casual labour to attempts to avoid more
stringent post-apartheid labour legislation. The researchers report that changes in labour
legislation appeared to be less important for smaller than larger firms. One reason could
be that the smallest firms are afforded concessions in respect of some aspects of the Basic
Conditions of Employment Act through a special sectoral determination. However, the
lesser concern about labour regulations among smaller firms could, in fact, mean that
smaller firms are simply not complying with the law.
The third World Bank study (Chandra, 2001) covered 499 informal firms operating in the
Greater Johannesburg metropolitan area. The informal sector was defined as consisting of
firms which are not registered by VAT and also not subject to other formal regulation or
taxation. Retail and hawking accounted for 139 of the interviews. Each of the ten other
sectors accounted for fewer than 50 interviews. Firms were disaggregated into those with
one or no employees, and those with two or more.
The study found that 80% of the informal firms depended on formal firms for inputs, 36%
sold directly to formal firms, and over 50% competed with them. Only 14% of the firms
said that they had received sub-contracted work.
3.1.3 Gender
Like Lund, a significant proportion of the studies look at gender issues. Beavon &
Rogerson‟s (1986) is among the first work to look specifically at women in the informal
sector. Their work attempts to track the history of women‟s informal work in
Johannesburg since 1900. Street trading, shebeen work, prostitution and washing are all
seen as dating from as early as 1900. The authors note that, with the exception of
prostitution and home-brewing, women are involved in activities with limited prospects of
capital accumulation. The success of home-brewing was partly a result of apartheid laws
which either prohibited or strictly controlled the sale of alcohol by and to African people,
and limited the availability of other forms of leisure. The authors assert that in the mid-
1980s, around 20% of the dwellings in some parts of Soweto township might have been
housing a shebeen, and that two-thirds of the operators were women. Beavon & Rogerson
also chart how men took over certain forms of informal work as these became more
profitable. Friedman & Hambridge‟s (1991:163) chapter also discusses why women, in
particular, tend to dominate in activities such as street trading and shebeens.
May and Stavrou‟s (1989) relatively early study in the Greater Durban area does not touch
on the issue of gender, but nevertheless raises some interesting issues. The authors
estimate that about one-third of African urban households were involved in some form of
informal sector enterprise at the time of their study, with higher levels of involvement in
informal settlements. They argue, however, that a smaller percentage of households were
totally dependent on the informal sector.
Budlender (1994) summarises the then-existing literature on women and micro-enterprises

in South Africa. She illustrates different points with examples and quotes from the
fieldwork from the larger in-depth interview study of which the report formed part. This
paper also includes a discussion of the political impact of apartheid in the form of, for
example, business restrictions, population removals and laws regarding residence, limited
opportunities and violence.
Budlender (1994) notes that the Central Statistical Services‟ (now Stats SA) first attempt,
in 1991, to measure the size of the micro-enterprise sector found a slight preponderance of
men. She attributes this to both the international pattern of undercounting of women‟s
work, as well as the fact that women, because of fear of both officialdom and husbands,
may themselves „hide‟ their activity. The 1991 survey already found women
outnumbering men in homecrafts, trade, hawking and services.
Meshack Khosa focuses on gender relations in the taxi industry in Durban (Khosa, 1998).
His sample is small, but provides interesting qualitative materials about the conditions of
women in a male-dominated industry.
3.1.4 Foreign workers
Several of the studies either focus on, or discuss, the issue of foreign involvement in the
informal economy. Most reports on surveys that ask about foreign involvement note that
the figures are likely to be underestimates, as some foreigners will fear to reveal their
origins.
Perbedy & Crush‟s (1998) study focuses on handicraft and curio traders. South Africa is
seen as providing more opportunities for these traders because of greater tourist traffic
than other African countries. The study is based primarily on interviews with 107 non-
South African and 21 South African traders in Johannesburg and Cape Town. The authors
argue that more than one in five non-South African trader employs South Africans. All the
employees they identify are women (Perbedy & Crush, 1998:2; 26).
Perbedy and Crush find a dominance of male traders, and that where foreign women
trade, they often do so in a different way than men. For example, they are likely to be in
South Africa for shorter periods, and to work in less visible forms of trade such as selling
traditional dresses (Perbedy & Crush, 1998:15). The frequent shorter trips present
logistical problems in countries where the South African representatives will only issue
single entry visas.
Perbedy and Crush note that women traders are more likely than men traders to give the
need to earn income as the reason for engaging in trade rather than enjoyment of trade or
independence (Perbedy & Crush, 1998:17).
Hunt and Skinner (2001) report on a survey of 171 foreign informal traders working in
Durban‟s inner city. „Trader‟ is broadly defined, with 32% of the informants cutting hair,
15% repairing or making shoes, 1% welding gates and 4% supplying crafts rather than
simply selling goods. As with many other trader surveys, the snowball method was used
to find informants. The sample consisted predominantly of young single males. Only
seven (4%) of the interviewees were women. The overwhelming majority of those
interviewed (93%) were self-employed.
The informants originated from 17 different African countries. Throughout the paper,
there are comparisons of the 47% who were political refugees with those who came to
South Africa for other, often economic, reasons. The study also notes difference between
the foreign and local traders. For example, foreigners have reportedly never been granted
sites in the central business district. They have access to private markets, but the sites cost
much more than the government-run sites. Those who do not trade in official sites are
often subject to greater police harassment than locals.
Dodson (1998) looks at foreigners more broadly, rather than only those who are
economically active,. She finds that, while the main motivation for male migration is
economic, for women it is a mix of social, reproductive and economic factors. In terms of
work, men migrants are mainly employed in formal enterprises, while women are more
likely to trade. This difference has a geographical aspect, in that many men go to mining
areas, while women migrants congregate in the towns and cities (Dodson, 1998:1-2).
Women are thus, presumably, also more likely to be involved in informal sector activity.
3.2 Self-employed
In this sub-section we review the more general work on the informal sector i.e. work
which does not fall into any of the other specified categories. Because of differences in
definitions used by different studies, we include studies nominally focused on micro-
enterprises, survivalists, small business, SMME‟s, self-employed and „the informal
sector‟. The studies are presented more or less chronologically because of the significant
effects of the political changes in the country on the informal economy. All the studies are
chosen because they throw some light on the major themes of this report, and in particular
gender.
Where relevant, we note the size of the sample on which the different reports are based.
Lund (1998) notes that many studies of the informal economy are based on information
from a very limited number of workers. Where the snowballing technique is employed in
constructing the sample, further bias is introduced. In particular, this method could favour
the more articulate and better off operators.
Erasmus (1991) attempted to focus away from survivalist activities so as to assess
opportunities for, and constraints against, accumulation in informal enterprises, as well as
the nature of social differentiation in a community with high levels of informal sector
activity. Her target was clearly visible enterprises with fixed „abodes‟. Her work is
interesting for our purposes because it occurred before the formal ending of apartheid. As
will be seen, it provides evidence of both the dominance of survivalist activity in African
townships, and the dominance of women.
Erasmus‟ first study was conducted in Guguletu township in Cape Town after violence in
the taxi industry, another informal industry, prevented it taking place in the originally
chosen area. The study incorporated a census followed by 38 interviews. The census
found 162 enterprises, with 151 operators as some operators had more than one enterprise.
There were very few manufacturing enterprises. Most distributed goods and a relatively
small number provided services, with hairdressing the most common service.
The subsequent survey found more or less equal numbers of male and female operators.
Despite the original aim of the study, close on three-quarters were survivalists. All
interviewees were self-employed. Three-quarters did not hire non-family labour, but two-
thirds used family labour, including children.
Erasmus‟ later study (1992) for the ILO covered both African and coloured townships. In
(African) Khayelitsha Site C the target group was again clearly visible enterprises with
fixed abodes. The target group in the (coloured) Cape Flats area was clothing
manufacturers engaged in subcontracting. The latter enterprises are not clearly visible.
Informal sector enterprises were defined as those employing fewer than 50 workers and
which were unregulated or exempted from regulations.
In the clothing sector, 60 manufacturers were interviewed – 48 cut-make-and-trim
operators and 12 independent clothing manufacturers. The majority (50) operators were
women. Most previously worked in the formal sector clothing industry. Close on half left
their previous job because of child care and household responsibilities. Under a third lost
their jobs because of retrenchments. Employers reported a total of 110 employees, of
whom 98 were full-time and 85 were non-family employees. Eight workers – all women –
were unpaid. Fourteen employees – all female – were under 18 years of age.
Persad and May‟s (1995) paper draws on the 1993 Project for Statistics on Living
Standards and Development (PSLSD) general poverty survey, as well as a 1992 survey of
615 micro-enterprises in eight different regions of the country. The paper‟s discussion is
not framed in terms of formal and informal. The authors note, however, that of the 932
PSLSD black households (equivalent, when weighted, to over a million) who had
members involved in SMMEs, 59% were involved in survivalist enterprises and 39% in
micro-enterprises. Of the survivalist enterprises, defined as those involving only one
household member, 62% involved women. The micro-enterprises involved more or less
equal numbers of women and men. Of all survivalist enterprises, 29% involved selling
goods on the street, and 15% sewing and selling clothes.
Harrison (1993) focuses on a peri-urban African site and service scheme outside Cape
Town, shortly before the first democratic elections of 1994. She draws on previous survey
work in the area which found, among others, that while 98% of women said that they
would prefer to work outside the home and earn money, over a fifth of those with partners
said their partners did not approve of their working in the formal economy. She also
draws on interviews of 30 businesspeople conducted by project workers from non-
governmental organisations (NGOs). All but two of the interviewees were traders of some
sort or another. Spaza shops were more likely to be operated by married couples and were
seen as a relatively successful business. In over two-thirds of businesses operated by

married couples, the husband was said to be the owner. Women, on the other hand, were
almost always the primary workers in the business. Many of the men owners were
employed in the formal economy. Budlender (1996) quotes evidence from another study
that supports the view that many reportedly men-owned businesses rely heavily on the
work of women. Harrison quotes other work that suggests that some women were
choosing to remain single so as to retain greater control over their earnings, and avoid
wastage of the money by men.
All the businesses investigated by Harrison were based in the owners‟ shacks. The survey
exposed extremely long working hours which were necessary to accommodate customers
who were formally and informally employed as well as those who were unemployed. The
survey also exposed the transport problems experienced in obtaining goods, with most
women relying on supermarket trollies or their head and using public transport. This
obviously prevents their buying in bulk.
Bedford‟s (1995) report is based on analysis of a survey of 245 women members of the
Self-Employed Women‟s Union (SEWU). Close on three-quarters of the women were
street vendors and 28% were engaged in home-based activities. More than 60% of the
home-based workers were sewing or knitting. The sample would be biased by the
recruiting methods of the Union, but the survey nevertheless provides some interesting
comparisons between the two groups of workers. Street vendors clustered in the lowest
earning categories. As in other studies, the overwhelming majority of the workers said
they were not engaged in secondary income-earning activities. Where there were
secondary activities, these were mostly home-based.
Type of housing and facilities obviously affects the ease and profitability of doing home-
based work. Bedford found that street vendors were more likely to be living in shacks, and
home-based more likely to be living in houses. Half of the workers had running water in
their home, but only 41% had electricity.
Close on two-thirds (62%) of the vendors and 45% of the home-based workers said they
were the household head. Close on three-quarters were the main breadwinners in their
households. These figures imply that some were the main breadwinner although not
regarded as hosuehold head. Close on two-thirds said they were the only breadwinner in
the household.
Nunes (1998) focuses on „the role of woman as entrepreneur‟. Although the title of the
work is SMMEs, the paper largely seems to conflate SMMEs and the informal sector. For
the statistical section she draws on calculations from Stats SA databases (the methodology
is described in Ntsika (1997)) which show 60% of African women in the survivalist
category (no employees), while micro-enterprises (1-4 employees) account for 55-7% for
the other race groups. Overall women enterprises are reported to be concentrated in trade.
60% of women‟s survivalist enterprises are reported to be in rural areas.
Nunes discusses the legal, political and social reasons for women‟s relative disadvantage.
Among the issues she raises is violence. She refers for example to evidence that women

close their businesses early because of fear of being harassed. Other research confirms a
range of effects of violence on women‟s informal work. For example, Skinner (2000)
quotes 1997 research by Data Research Africa which found that 42% of women and 33%
of men traders named theft and criminal violence as among the main obstacles faced in
their business, while 12% of women and 18% of men named extortion and protection
payments.
The World Bank survey (Chandra, 2001) focuses on the informal sector, rather than the
self-employed. One of the major hypotheses is that the African (black) informal sector in
Johannesburg is a „special case‟. The paper argues that, while in other countries „informal
sectors … are the epitome of market forces‟, in Johannesburg, „even though its firm
owners do not presently face discriminatory policies, their characteristics show signs of
distortionis created by discriminatory economic policies in the recent past.‟ (Chandra,
2001:2)
Women accounted for 38% of all business owners interviewed. Women were less likely
than men to have employees. Women were more likely than men to have been
unemployed prior to starting the business. Unlike in many other developing countries, the
informal business represented the full-time job of 93% of owners, rather than a secondary
source of income.
The study provides useful comparisons between the informal firms and the formal
SMMEs covered in an earlier World Bank survey (Chandra et al, 2001b). For example, it
found that informal firms generate an average of three jobs, the same as formal sector
businesses of this size. Somewhat under half (44%) of the informal jobs generated were
performed by family labour. However, 93% of all jobs were fully remunerated, full time
and permanent. The informal firms thus appeared less likely than formal SMMEs to hire
temporary labour.
Informal employers paid significantly less than formal sector SMMEs. When compared
with national minima set by bargaining councils, the informal mean wages varied between
32% and 78% of these minima. Further, over half of the firms did not provide any benefits
such as paid holiday or sick leave, maternity leave or retrenchment benefits. Some sectors,
such as clothing, were more likely than others to provide these benefits.
Half the informal owners operated out of their homes. The other half did not have fixed
locations. The most common motivations for choosing the location were proximity to
customers, inability to afford rent for separate premises, and the attraction of being near to
home. Many of the firms did not have access to adequate services and basic infrastructure
such as water, sanitation, electricity, postal services, phones, public transport. One reason
for this pattern is the historical separation of black townships from non-black, and more
profitable, markets.
Finally, we return to Stats SA household survey data. In previous sections of this paper we
have drawn primarily on the LFS and noted problems in doing trend comparisons because
of changes in the instrument over the years. Casale and Posel (forthcoming) note the same

problems, but attempt, nevertheless, to compare information from the October household
surveys over the period 1995 to 1999. They find an increase in the number of female
informal self-employed from 178 000 in 1995 to 487 000 in 1999. Over the same period,
the number of male informal self-employed increased from 214 000 to 525 000. Increases
were thus enormous for both men and women, but bigger for women than men. Casale
and Posel acknowledge that some of this increase might be accounted for by change in
methods, but suggest that, nevertheless, a significant proportion if almost certainly „real‟.
Casale and Posel take the debate further by looking at likely reasons for a real increase in
women‟s economic activity, and particularly the increase in more informal types of work.
They suggest that one likely reason is „the erosion of male income support over the
period‟, as they find a significant decrease in the number of women of working age living
with at least one employed male in the household.
3.3 Unpaid family workers
There appears to be very little work on unpaid family workers in South Africa. Unlike in
other countries, the category is often not included as a specific category in survey
instruments when asking about employment status. Stats SA questionnaires used to ask
about the number of family and non-family members employed on a paid and unpaid
basis, but did not regard the responses as particularly reliable.
Several studies nevertheless refer, in passing, to paid or unpaid family workers. In their
study of Pietermaritzburg street traders, Mayrhofer et al (2001a) note that characteristics
of „non-entrepreneurial societies include, inter alia, the culturally and socially expected
practice of discriminatory pricing based on personal relationships and status, and the
practice of employment of too many relatives.‟ They suggest that the relative success of
the Indian traders they interviewed when compared with African traders was related to the
fact that the Indian businesses were family businesses, close to home and had mostly been
in operation for a relatively long time.
3.4 Domestic workers
The best current source of information on the situation of domestic workers in South
Africa is probably the report prepared by the Minimum Standards Division of the
Department of Labour for the Employment Conditions Commission (ECC) (Department
of Labour, 2001). The ECC is a statutory body constituted in terms of the Basic
Conditions of Employment Act. One of its primary tasks is to advise the Minister of
Labour on the setting of wages and conditions of work for vulnerable workers. The
Department‟s report is a background document prepared to elicit public comment and
assist the ECC in advising the Minister in respect of his desire to establish a sectoral
determination which will set minimum wages and other conditions for domestic workers.
The department drew on all the known work on domestic workers in compiling the report,
and also commissioned further studies. Information was collected through public
comment, a series of provincial workshops, 803 employer questionnaires completed by

employers at the workshops, a series of 64 hearings around the country, a telephone
survey of 300 predominantly urban households in Gauteng, 2 885 questionnaires
completed by domestic workers at taxi ranks, and a survey of 982 domestic workers
commissioned by the Department‟s Skills Development Division. The report also draws
on information from Stats SA. The report thus includes quantitative and qualitative
information.
By including a range of methods, the report covers both workers who live on the
employer‟s premises („live-in‟) and those who live elsewhere. The skills development
survey found that 36% of workers were living on the employer‟s property.
In terms of age, workers are found to be concentrated in the 30-49 age group, but by no
means confined to these ages. The Gauteng survey suggested that workers had worked an
average of 15,6 years as domestic workers – and more than half their life for older
workers. All the evidence points to the relatively low educational level of domestic
workers when compared to other workers. Nevertheless, there are significant numbers of
women who have a matriculation certificate but are doing domestic work in the absence
of other opportunities. In the skills development survey, 37% of workers said they were
doing this work because they did not have adequate skills for other occupations, and 34%
said it was easier to find work as a domestic worker. Only 14% said they did the work
because they enjoyed working as a domestic worker.
The skills development survey found that the main tasks of domestic workers were
general cleaning, washing and ironing. Just over a quarter reported that they took care of
employers‟ children, and much smaller proportions took care of ill or elderly household
members. About 7% said they helped with home-based businesses of their employers.
The report reveals discrepancies in reports of employers and employees. For example,
employers tend to report shorter working hours than employees. Employers also tended to
report higher wages than employees. The skills development survey report (Community
Agency for Social Enquiry, 2001) notes the difficulties experienced in even getting
employers to respond.
Evidence on wages varied widely between sources both for known reasons (e.g. area) and
for less explicable reasons. Analysis of Stats SA‟s household surveys suggested that a
domestic worker would earn about 20% of the mean or median wage of a clerk. This
figure is not directly comparable with some of the other sources, which exclude domestic
workers employed on farms. The latter will not, in fact, be covered by the proposed
domestic worker sectoral determination. They should, instead, be covered by a proposed
determination – also the first – for agricultural workers.
Most of the non-official research into domestic workers focuses on workers employed in
relatively affluent suburbs, where most employers are white. One exception is a small
investigation reported in Budlender (1997) that looked at employment of domestic
workers in African townships. The mini-survey was too small to be the basis of reliable
extrapolation, but suggested that the official household surveys were not picking up all

paid domestic work in these areas. Budlender also reports on interviews with managers of
employment agencies offering domestic workers or domestic work services. Some of
these were found to offer the services of very young girls brought in from impoverished
rural areas, often under very poor conditions.
3.5 Home-based workers
There is sometimes confusion between the terms „home-based worker‟ and „home-
worker‟. In this report we use the term „home-based worker‟ in its broad sense as referring
to all people operating from private homes. „Home-workers‟ are those who are contracted
by other enterprises to perform particular tasks, for example related to the clothing
industry, at home.
The Self Employed Women‟s Union (SEWU) study of 1995 (Budlender & Theron, 1995)
aimed to find out the extent of home-work but, in practice, revealed more about home-
based work more generally.
The sample involved 600 coloured, African and Indian home-based workers, half of
whom lived in Durban and the other half in Cape Town. In both cities areas were chosen
in which clothing and leather worker workers were known to live. This was done in the
belief that these areas were more likely to have home-workers. However, while the survey
found that there was at least one home-based workers in 69% of all households, only 20 of
the 601 workers interviewed were on contract to someone else, and could thus be regarded
as home-workers. None of the twenty were African. Proportionately more were women
than men. Fifteen were doing clothing-related work, and two selling-related.
Over 60% of all home-based workers were women. However, there were more or less
equal numbers of women and men workers in coloured and Indian households, while
women accounted for 71% of home-based workers in African households. The authors
note that this could be a result of both greater economic involvement of African women,
and fewer other opportunities available to them.
Fewer women, and fewer African people, had done previous regular work. Where women
had done previous work, most had done domestic work. The most common types of
current work for women were shops (34%), tailoring (28%) and hairdressing (5%). As in
the formal sector, women‟s activities had a smaller range than men. Over four-fifths
(82%) said they did not learn their job from anyone. Men were more likely than women to
have learnt from a previous employer, and women more likely to have learnt from a
family member.
All but one of the 111 home-based workers without access to electricity were African.
Over a third had no inside water source, of whom all but three were African. Women
(42%) were more likely than men (29%) to be working in houses without water.
The mean number of hours worked per weekday was 6,6 hours, with 5,3 hours on
Saturday and 3,9 on a Sunday. Only 14% of men but 75% of women said they spent some

time the previous day on housework and cooking. Women spent an average of 2,9 hours
compared to 0,3 hours for men. Over half (54%) of all the women and only 9% of the men
said they are the primary caregiver for at least one child. Overall, only 9% of men but
45% of women said they spent some time the previous day on unpaid childcare. Women
spent an average of 2,6 hours and men an average of 0,3 hours.
Women were more likely to work alone than men, while men were more likely to have
paid non-family members working for them.
A third (33%) of men, compared to 64% of women earned under R200 per week. African
operators tended to earn less than those in other population groups, but were responsible
for supporting more people. There was no difference in the mean number of people
supported by men and women workers.
High levels of home-based work are confirmed in other studies. Liedholm and McPherson
(1991, quoted in Lund, 1998: 16) note that the „vast majority‟ of the enterprises in
Mamelodi and Kwazakhele in Gauteng were „operated out of the home … typically
operating without any outward sign of activity. One must clearly penetrate the privacy of
the household if the full extent of small enterprise activity is to be illuminated‟. Their
study found that 70% of enterprises operated from home and only 11% were trading on
the streets. Table 11 confirms that this pattern, partly explained by apartheid, continues up
to the present.
3.6 Street vendors
We have already commented above on how official statistics have shown a phenomenal
increase in the number of street vendors operating in the country, some of which may be
real and some of which is a methodological artefact. The non-Stats SA work on traders
has been concentrated in the metropolitan areas of Durban, Cape Town and Johannesburg
but, as seen below, not totally confined to these areas.
There has long been an awareness of the importance of street trading as an economic
activity. Already in the late nineties, May & Stavrou (1989) were quoting the African
Council of Hawkers and Informal Businesses as estimating that there were 150 000
hawkers and vendors and 50 000 small shopkeepers (including spaza shops) in the
country. They estimated that there was an increase of 16% in the number of informal
sector operators between 1985 and 1988, with the most rapid increases in the informal
settlements.
One reason for non-reporting of activities and thus different estimates would be fear of
harassment. May & Stavrou quote other work which notes that officials estimate that
approximately one third of all operators were involved in illegal activities and a further
one third in „socially undesirable‟ activities. They add the caution that what is socially
undesirable or even illegal is a value judgment. As noted above, in South Africa these
judgements had political overtones.

Discrepancies due to non-reporting must be added to real differences in numbers over
small periods of time. Mayrhofer et al (2001a and 2001b) note the mobility of traders,
who may pitch their stall at a different place each day. The Community Agency for Social
Enquiry‟s (CASE) census of Johannesburg traders (Jennings et al, 1995) revealed great
variation in the number of traders in a particular area across three visits – from 3 167 to
6 893. This could be due to different days of the week or times of the month being more
favourable. Similarly, the Data Research Africa (DRA) study (quoted in Lund, 1998) of
Durban found, during check backs, that many of the traders were missing.
There would usually be further variations over the course of a single day. Naidoo (1993)
quotes an informant who notes that the most lucrative times are early morning, lunch time
and late afternoon. In terms of research, these findings points to the need for careful
thought around timing so as not to arrive at false conclusions. Lund (1998: 30)
summarises the findings of several studies by suggesting that the „busiest time of the day
is from 4pm onwards when commuters are on their way home. The busiest day of the
week is Friday. The busiest months of the year are around the major holiday seasons of
Christmas and Easter‟ (Lund, 1998: 30).
In terms of longer-term trends, the introduction to Jennings et al (1995a) implicitly makes
the link between an increase in trading and unemployment in the first sentences of the
executive summary when it notes that the city‟s economy „has, in recent years, been
unable to keep up with the demands being made on it for job creation in the formal
employment sector. There has been a proliferation of people trading on the streets of
Johannesburg.‟ In looking for reasons for this growth, the report points to different groups
– the city‟s own population which has been affected by recession and automation, internal
migrants, affected by factors in both commercial and subsistence farming, and
international migrants because of poverty in countries of origin.
Some of the differences in numbers thus reflect real differences and developments over
years or shorter periods. Some of the differences are accounted for by the political
motives of the reporter. Thus Witt notes the different estimates for Warwick Triangle in
Durban where a report commissioned by the City Council estimated some 1 500 legal and
200 illegal traders in that area, a senior Council employee had an estimate of 4 000-4 500,
while a census counted 4 010 traders (Lund, 1998:16). In 2000, Skinner wrote that
Warwick Junction was estimated to accommodate between 4 000 and 6 000 street traders.
A much earlier estimate cited in Naidoo (1993) put the number of traders in Warwick
Triangle at 450-500 traders each day.
Important quantitative sources on street vendors include two censi of street traders, in
Johannesburg central business district (CBD) (Jennings et al, 1994) and the Durban Metro
area (DRA, quoted in Lund, 1998) respectively, both of which were followed by more in-
depth surveys. The results of these censi and surveys are worth reporting in some detail
because of the size of the exercises, because much of the street trading in the country is
concentrated in these and similar metropolitan areas, and because other smaller surveys
often confirm their findings. (This summary draws heavily on Lund, 1998)

The Johannesburg census suggested that 48% of traders were women, and the subsequent
survey consisted of 52% women. The Durban census found 61% of traders to be women,
and the survey consisted of 63% women. The Durban census suggested that those selling
clothes were more likely to be employed by another person while those selling fresh
produce were mainly self-employed. The study found a small gender difference in terms
of employing others, with men more likely; women significantly more likely than men to
be employees; women more likely to be sellers only, and to sell fresh produce only; men
slightly more likely than women to purchase from a large dealer.
Both the Johannesburg and Durban studies found that more men than women were in the
21-30 age group and more women than men in 41-50 age group. These patterns
presumably relate to childbearing and rearing. All studies find low levels of education.
The educational patterns in terms of age and gender largely reflect those of the overall
population.
The Johannesburg survey found that 14% of interviewees were non-South African. The
foreign migrants were generally better educated than South Africans. They also tended to
be male. The Durban study suggested that many of the women were oscillating migrants,
migrating between urban Durban and rural areas on a regular basis.
More men than women had covered stalls in both cities. Both the Durban and
Johannesburg studies found that most traders sell a very limited range of goods, with food
by far the most common. This finding is repeated across smaller studies. These and other
studies suggest that foreign traders could be introducing some diversity in terms of
products.
The Johannesburg survey investigated children and child care responsibilities in some
detail. About half of those with children under six years did not have them living with
them. Of those that did, men could more regularly rely on wives or partners to care for the
children while women relied on other family members.
Over 80% of traders in the Johannesburg study started trading because they were
retrenched, had no other skills, or could not find other job. Men were more likely than
women to have previous work experience. Women reported that they were previously
unemployed, or worked as domestic workers, or start trading when widowed.
Silo et al (2001) focus on the much smaller city of Grahamstown, in the Eastern Cape.
The study is based on three methods. The main survey constitutes a near-census of the
relatively small number of traders operating in the central city. A second, much shorter,
survey focused on shoppers. The two surveys were complemented with interviews with
selected formal sector traders.
The trader survey found, like others, that traders were predominantly women, many of
whom were the main breadwinners for their households. Again, as with other surveys,
trading was seen more as a survival strategy than a way of earning a large income. A full
82% were found to sell the same goods as others trading next to them. Half of the vendors
sold foodstuffs, with clothing the next most common item. Most traders operated all year
round. Interviewees were more or less evenly divided between those who traded only on
weekdays and those who traded on both weekends and weekdays. Despite the distance
from the country‟s borders, 11% of the traders reported that they were foreigners, most of
whom had been trading since arriving in the city. Almost all products were produced in
South Africa, with close on half produced in Grahamstown.
Mayrhofer et al‟s (2001a and 2001b) paper is based on research in Pietermaritzburg, a
smaller city very close to Durban. As with other studies, the majority of traders were
women and black. Further, the overwhelming majority of traders said that this was their
only source of income, and that they had started the business to cope with poverty. In
particular, increasing unemployment was said to have resulted in a significant increase in
the number of traders over the last five years.
Mayrhofer et al focus, in particular, in the efficacy of business support services. To their
surprise, and contrary to the literature, they found that the majority (70%) of traders
declined business assistance programmes. The traders also did not suggest alternative or
additional areas in which they would like assistance or training. The researchers conclude
from this that „assistance programs need to focus on strengthening the traders‟
enterpreneurial understanding‟, but there could be other interpretations. The researchers
themselves note that traders felt they did not need business administration training
because they „were doing just fine‟ or the training modules were too advanced and
therefore not applicable to the enterprise size. Further, they did not see the value of
targeting or consumer research as they wanted to attract every person to become a
customer. Instead of training, they wanted assistance from local and other spheres of
government, for example in terms of providing shelters.
Mayrhofer et al‟s sample consists of four distinctly different groups of traders, allowing
comparison between locality, the degree to which trading status is legalised, and between
traders from different population groups. Of particular interest to this study, they found
equal numbers of women and men among the Indian traders, in contrast to the female
dominance among African traders.
Coming back to Durban, we find a range of smaller focus studies. For example, Naidoo
(1993) conducted her fieldwork in the popular trading area of Warwick Triangle on the
periphery of the central business district in Durban. Naidoo‟s work is interesting because
of the in-depth qualitative nature of the information she collected. At the outset, Naidoo
notes that for some of the women traders, the work space also constitutes home as they
sleep on the streets because of the time and monetary cost of transport, the difficulty of
finding other accommodation, and problems related to security of their stalls and goods.
Evidence from this sort of study provides a useful supplement to household surveys, as
the latter would not normally pick up homeless people. One particularly interesting
observation in Naidoo‟s report is that although vending licences and rules had been
introduced before her study commenced, few of the women interviewed had licences and
several gave reasons as to why they broke the rules.

Grest‟s much later study (2000) looks at how gender plays out for street traders in
Durban‟s Warwick Circle in respect of three particular issues – the use of electricity in the
streets, public toilets, and the activities of bovine head cookers. His main interest is an
examination of different concepts of citizenship, but the detailed examination of these
issues contrasts with the general assertions and recommendations put forward in much of
the research on street traders.
Motala (May 2000) focuses on the utilisation of public spaces in Durban in relation to
trading in ready-made clothing. The methodology was in-depth interviews rather than a
questionnaire survey. Informants included traders in imported goods, traders in second-
hand clothes, and traders of locally made goods. While Motala‟s focus is not central to
this report, her study reveals the linkages between different sorts of work. For example,
there are „boys‟ employed to collect and transport goods between traders and storage
depots, workers employed to manage and provide support services such as storage,
salespeople who sell on behalf of the owner, self-employed traders, manufacturers of the
goods, suppliers of imported goods, wholesalers of local and imported goods.
Finally, there are several studies that pick up on health issues. For example, respondents
to the Johannesburg survey (Jennings et al, 1995a) were asked a series of questions about
their health. Skinner (2000) quotes a street trader who reports that she is on the street
seven days a week because „the poor do not get sick‟.
Pick and his co-workers (1998 and forthcoming) have focused specifically on health
issues among women street traders, but has also collected a wealth of information not
directly related to health. The papers are based on research conducted in Hillbrow suburb
and the central business district of Johannesburg. One interesting gender aspect is that
Pick notes that, before conducting the survey, the researchers had to obtain permission
from „block captains‟. These are men who control trading in a particularly block. He cites
this as „a classic example of male domination in the informal trading sector‟.
Pick et al (forthcoming) report that, in terms of demographics, two-thirds of the
interviewees reported themselves as single, and 23% as married. However, despite the
reported marital status, 64% had a relationship with a man and most had been in the
relationship for longer than five years. In terms of age, the Johannesburg women were
younger than women involved in trading in Khayelitsha, an African township of Cape
Town. Pick suggests that „the urban informal trading sector attracts women who are less
handicapped by childcare and who can spend long hours trading in the streets.‟
Over a third (37%) of the women did not work for themselves. Those who worked for
others usually worked for a man, most often a family member. Younger women were less
likely than older to work for themselves. Over half (59%) of the sample came from
elsewhere in South Africa, 15% from outside the country, and only 26% were born in
Johannesburg. The majority of the women sold food (60%) and clothing (29%).
Pick (1998) describes the nature of the households in which the women traders live.
Nuclear households accounted for about a third, extended households for 3%, woman-

headed households (a woman with or without children and no male partners) for 15%, and
„alliance‟ households made up of combinations of family members, friends, lodgers and
others for close on a half.
3 Additional topics
3.1 Household economy
The LFS includes a question about the usual total income from work for employed people.
It does not, however, include a question on total household income. It is thus not possible
to calculate income of those working in the informal sector as a share of total household
income.
It would be possible to calculate informal sector income as a share of total earned income.
These calculations would, however, not be very accurate. For employees, informal sector
wages often fluctuate more than wages in the formal sector. For the self-employed,
determining the income amount is even more difficult. Firstly, by definition, informal
sector enterprises do not keep separate accounts from the household. Secondly, most
operators have a difficulty distinguishing between gross income, and income net of
expenses. We have thus not attempted the calculation.
The LFS of September 2000 included an income and expenditure module that asked more
detailed questions about money coming into and going out of the household. The data
from the module is not available as yet, but may, when it is, provide more accurate figures
on which to work.
3.2 Informality, Gender, and Poverty
There is no single accepted method of measuring poverty in South Africa. Some analysts
use relative methods, for example, the poorest 40% of households in the country. Others
use a variety of absolute cutoff points in terms of income. Still others construct indices
which include income and other variables. The LFS is not an ideal instrument for
measuring poverty because of the weaknesses in income data. All employed people are
asked how much they earn. As noted above, however, the data on self-employed income
is not very reliable. Further, there is no information about non-earned income.
The LFS does, however, include two questions on hunger within the household that can
be used as proxies for poverty. Question 7.27 asks whether, in the past year, there was
every a time when children under seven years of age went hungry because there was not
enough money to buy food. Question 7.28 asks a similar question in respect of other
members of the household. For the crude analysis presented below, we use the second
question as it covers households with and without young children.
Before presenting the analysis, we must note the limitations of this approach. In the first
place, the questions refer to the household as a whole. While the household, by definition,
„eats from a single pot‟, there is no guarantee that the available income is shared equally

between the members. Secondly, a household may contain several employed people, some
of whom work in the formal and some of whom work in the informal sector. Thus, even if
the informal sector tends to provide lower, „poverty-level‟ incomes, some informal sector
employed would live in households with formal sector earners and thus not necessarily be
poor. Thirdly, evidence from elsewhere in the world suggests that where women have
more control over household incomes, the available money is more likely to be spent on
food. These households would then, even at the same income, be less likely to have
hungry members. Fourthly, the fact that a significant proportion of (female) informal
sector operators are food vendors, might also mean that their households are less likely to
suffer hunger.
Table 36 presents the percentage of workers living in households which reported hunger
by sex and the sector in which the worker is employed. Overall, 14% of workers were
reported to be living in households experiencing hunger, with a slightly higher percentage
for women workers (16%) than men (13%). Hunger is much less likely for workers in
formal sector jobs, at 9% for both women and men. The likelihood of the household
experiencing hunger is fairly similar for domestic and other informal sector workers, at
20% or more. There is also a sex difference within the informal sector, with women more
likely than men to live in households experiencing hunger.
Table 36: Percentage of workers living in households experiencing hunger by sex
and sector of worker
Sex Domestic
workers
Other
informal
Formal
Total
All 22 25 9 14
Male 20 24 9 13
Female 22 25 9 16
Table 37 is based on the same information, but presents it in a different way. It focuses on
workers living in households experiencing hunger, and calculates the proportions of these
workers who work in different sectors and are male or female. The table shows the
biggest concentration (44%) of „poor‟ workers in the non-domestic informal sector, where
there are roughly equal numbers of women and men in this situation. The next biggest
concentration (40%) is in the formal sector, where there are significantly more men than
women. Domestic workers account for 13% of workers living in households experiencing
hunger. While this percentage appears to be low, it is higher than their percentage
contribution (8-9%) to the employed population as a whole. Women are also over-
represented, whether employed formally or informally, as they make up only 45% of the
employed workforce, but 51% of workers living in households experiencing hunger.
Conversely, formal sector workers are under-represented among the poor as measured
here.

Table 37: Workers living in households experiencing hunger by sex and sector
Sex Domestic
workers
Other
informal
Formal Unknown
Total
All 13% 44% 40% 3% 100%
Male 0% 22% 25% 2% 49%
Female 13% 22% 15% 1% 51%
4 Conclusion
The review reveals that there has been a significant amount of work on the informal
economy in South Africa recently. This has occurred in terms of official statistics, non-
official survey work and more qualitative studies. Much of the work has been driven by
the political and economic changes in the country over the last decade. These have
resulted in an increased focus on activities and areas in which black, poor and female
people are engaged. Political changes have also driven more policy-oriented work, for
example in relation to the informal economy in Durban, and in respect of micro-
enterprises more generally.
In terms of economic changes, there are many indications that the informal economy has
increased in recent years. Some of these changes are statistical artefacts, as methods of
picking up this sort of work improve. It seems clear, nevertheless, that statistical artefacts
cannot account for the full extent of the increase.
5 References
Beavon KSO & Rogerson CM (1986) „The changing role of women in the urban informal
sector of Johannesburg‟ in O Drakkas-Smith (ed) Urbanisation in the Developing World.
Croom Helm, Beckenham: 205-221.
Bedford L (November 1995) The Self Employed Women‟s Union Survey: Members and
their situation. Independent Development Research, Durban.
Budlender D (1997) „Domestic workers‟. Unpublished paper prepared for Department of
Labour, Community Agency for Social Enquiry, Cape Town.
Budlender D (1994) „Micro-enterprises and gender‟ in R Hirschowitz & M Orkin (eds).
Micro-enterprise development in South Africa. Community Agency for Social Enquiry,
Johannesburg.
Budlender D & Theron J (1995) Homework research project. Self Employed Women‟s
Union, Durban.
Casale D & Posel D (forthcoming) „The continued feminisation of the labour force in
South Africa: an analysis of recent data and trends‟ in South African Journal of
Economics.

Chandra V (September 2001) South Africa: Constraints to Growth and Employment in the
Informal Sector. Report No 3: Evidence from the 1999 informal firm survey. The World
Bank Southern Africa Department. Informal discussion papers on aspects of the economy
of South Africa.
Chandra V, Moorty L, Rajaratnam B & Schaefer K (June 2001a) Constraints to Growth
and Employment in South Africa. Report No 1: Statistics from the Large Manufacturing
Firm Survey. The World Bank Southern Africa Department. Informal discussion papers
on aspects of the economy of South Africa. Discussion paper 14.
Chandra V, Moorty L, Nganou J-P, Rajaratnam B & Schaefer K (June 2001b) Constraints
to Growth and Employment in South Africa. Report No 2: Evidence from the Small,
Medium and Micro Enterprise Survey. The World Bank Southern Africa Department.
Informal discussion papers on aspects of the economy of South Africa. Discussion paper
15.
Community Agency for Social Enquiry (May 2001). Results of the Baseline Survey on
the Profile and Training Needs of Domestic Workers. Commissioned by the Department
of Labour and German Technical Co-operation. Johannesburg.
Department of Labour (2001). Towards Determining Minimum Wages and Conditions of
Employment for Domestic Workers. Pretoria.
Dodson B (1998) Women on the move: Gender and cross-border migration to South
Africa. Southern African Migration Project, Migration policy series no 9, Institute for
Democracy in South Africa: Cape Town.
Erasmus Z (December 1991) Informal Economic Activities in the Western Cape, South
Africa. Final Report on Pilot Study.
Erasmus Z (November 1992) Unregulated economic activity in the Cape Peninsual, South
Africa. Final research report. Equality of Rights Branch. International Labour Office,
Geneva.
Friedman M & Hambridge M (1991) „The informal sector, gender, and development‟ in C
Rogerson & E Preston-Whyte (eds) South Africa’s Informal Economy. Oxford University
Press, Cape Town: 161-180.
Grest J (November 2000) Urban Citizenship: Governmance, regulation, development and
participation. Some thoughts on the Warwick Junction, Durban. Paper prepared for the
Three Cities Project Conference, University of Durban-Westville and University of Natal,
Durban.
Harrison K (April 1993) „Invisible working women‟: Constraints facing women entering
and within small business: A case-study in Griffiths Mxenge, Khayelitsha. Working paper
commissioned by Taskgro.

Head J (August 1998) A Review of the Literature on the Impact of Informal Sector Work
on Women‟s Reproductive Health in South Africa. Paper prepared for University of the
Western Cape Public Health Programme.
Hunter N & Skinner C (December 2001) Foreign Street Traders Working in Durban‟s
Inner City: Survey Results and Policy Dilemmas. Centre for Social & Development
Studies. Research Report No 47. University of Natal, Durban.
Jennings R, Hirschowitz R, Tshandu Z & Orkin M (May 1995a). Our daily bread: Earning
a living on the pavements of Johannesburg. Part I: The census. Community Agency for
Social Enquiry, Johannesburg.
Jennings R, Segel K, Hirschowitz R & Orkin M (May 1995b). Our daily bread: Earning a
living on the pavements of Johannesburg. Part II: The survey. Community Agency for
Social Enquiry, Johannesburg.
Lund F (September 1998) Women street traders in urban South Africa: A synthesis of
selected research findings. CSDS Research Report No 15. School of Development
Studies, University of Natal, Durban.
May JD & Stavrou SE (1989) The informal sector: Socio-economic dynamics and growth
in the Greater Durban Metropolitan Region. Centre for Social and Development Studies
Working Paper No 18, University of Natal Durban.
Mayrhofer AM, Hendriks SL & Green JM (2001b) Informal trader‟s perception of
training: Closing the gap? Paper presented at the international IntEnt conference, Kruger
National Park.
Mayrhofer AM, Hendriks SL & Green JM (2001b). Supporting informal traders through
local service provision: Experiences, requirements and policy recommendations.
Unpublished report.
Motala S (May 2000) An investigation of the links between formal and informal
businesses in the clothing industry in the Durban CBD. Research report for the process of
developing an effective and inclusive policy for theinformal economy for Durban‟s North
and South Central Local Councils. Study 2.2.
Naidoo K (1993) Work and life of women in the informal sector: A case study of the
Warwick Avenue Triangle. Thesis presented in partial fulfilment of M Soc Sc
requirements, University of Natal Durban.
Ntsika Enterprise Promotion Agency (1997) The state of small business in South Africa.
Nstika, Pretoria.
Nunes S (November 1998) Women and small business development. Paper prepared for
Ntsika Enterprise Promotion Agency and Friedrich Ebert Stiftung, Pretoria.

Peberdy S & Crush J (1998) Trading places: Cross-border traders and the South African
informal sector. Southern African Migration Project, Migration policy series no 6,
Institute for Democracy in South Africa: Cape Town.
Persad R & May J (1995) A demographic and socio-economic profile of survivalist, micro
and small enterprises, black professionals and managers. Data Research Africa, Durban.
Pick WM, Ross MH & Dada Y (forthcoming) „The reproductive and occupational health
of women street vendors in Johannesburg‟ in Social Science & Medicine 54(2): 193-204.
Pick WM, Dada Y & Ross M (1998) Household-related variables and reported illness in
street vendors and their children in a South African city‟ in Journal of Urban Health:
Bulletin of the New York Academy of Medicine 75(3): 535-549.
Rogerson C & Preston-Whyte E (eds) (1991) South Africa’s Informal Economy. Oxford
University Press, Cape Town.
Silo Z, Tobi A, Mnguni M & Moller V (February 2001) Street Trading in Grahamstown.
Institute of Social and Economic Research. Research Report series no 5.
Skinner C (November 2000) Securing Livelihoods: A gendered analysis of support
interventions available to street traders in the Durban Metropolitan Area. CSDS Research
Report No 34, School of Development Studies, University of Natal, Durban.
Statistics South Africa (March 2001) Discussion paper 1: comparative labour statistics.
Labour force survey: first round pilot. February 2000. Pretoria.