statistical update on e mployment in the informal economy · statistical update on e mployment in...
TRANSCRIPT
STATISTICAL UPDATE ON EMPLOYMENT IN THE INFORMAL ECONOMY
ILO DEPARTMENT OF STATISTICS
JUNE - 2011

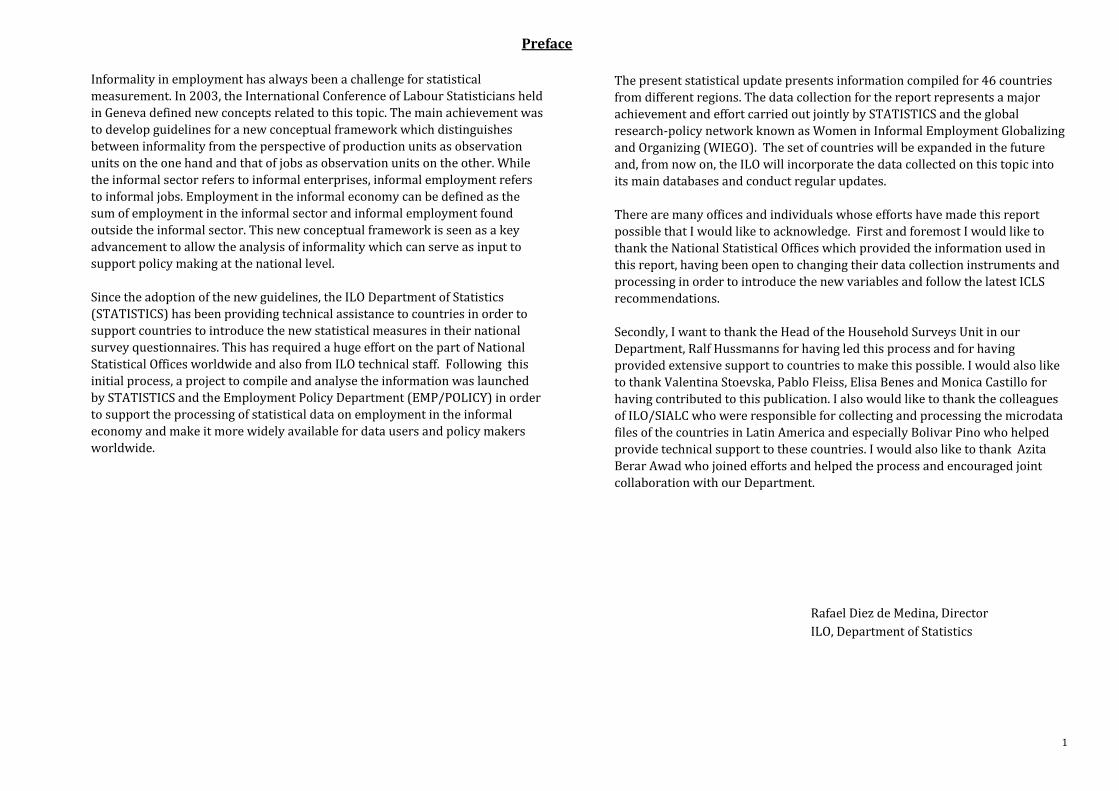
Rafael Diez de Medina, DirectorILO, Department of Statistics
1
Preface
The present statistical update presents information compiled for 46 countries from different regions. The data collection for the report represents a major achievement and effort carried out jointly by STATISTICS and the global research-policy network known as Women in Informal Employment Globalizing and Organizing (WIEGO). The set of countries will be expanded in the future and, from now on, the ILO will incorporate the data collected on this topic into its main databases and conduct regular updates.
There are many offices and individuals whose efforts have made this report possible that I would like to acknowledge. First and foremost I would like to thank the National Statistical Offices which provided the information used in this report, having been open to changing their data collection instruments and processing in order to introduce the new variables and follow the latest ICLS recommendations.
Secondly, I want to thank the Head of the Household Surveys Unit in our Department, Ralf Hussmanns for having led this process and for having provided extensive support to countries to make this possible. I would also like to thank Valentina Stoevska, Pablo Fleiss, Elisa Benes and Monica Castillo for having contributed to this publication. I also would like to thank the colleagues of ILO/SIALC who were responsible for collecting and processing the microdata files of the countries in Latin America and especially Bolivar Pino who helped provide technical support to these countries. I would also like to thank Azita Berar Awad who joined efforts and helped the process and encouraged joint collaboration with our Department.
Informality in employment has always been a challenge for statistical measurement. In 2003, the International Conference of Labour Statisticians held in Geneva defined new concepts related to this topic. The main achievement was to develop guidelines for a new conceptual framework which distinguishes between informality from the perspective of production units as observation units on the one hand and that of jobs as observation units on the other. While the informal sector refers to informal enterprises, informal employment refers to informal jobs. Employment in the informal economy can be defined as the sum of employment in the informal sector and informal employment found outside the informal sector. This new conceptual framework is seen as a key advancement to allow the analysis of informality which can serve as input to support policy making at the national level.
Since the adoption of the new guidelines, the ILO Department of Statistics (STATISTICS) has been providing technical assistance to countries in order to support countries to introduce the new statistical measures in their national survey questionnaires. This has required a huge effort on the part of National Statistical Offices worldwide and also from ILO technical staff. Following this initial process, a project to compile and analyse the information was launched by STATISTICS and the Employment Policy Department (EMP/POLICY) in order to support the processing of statistical data on employment in the informal economy and make it more widely available for data users and policy makers worldwide.
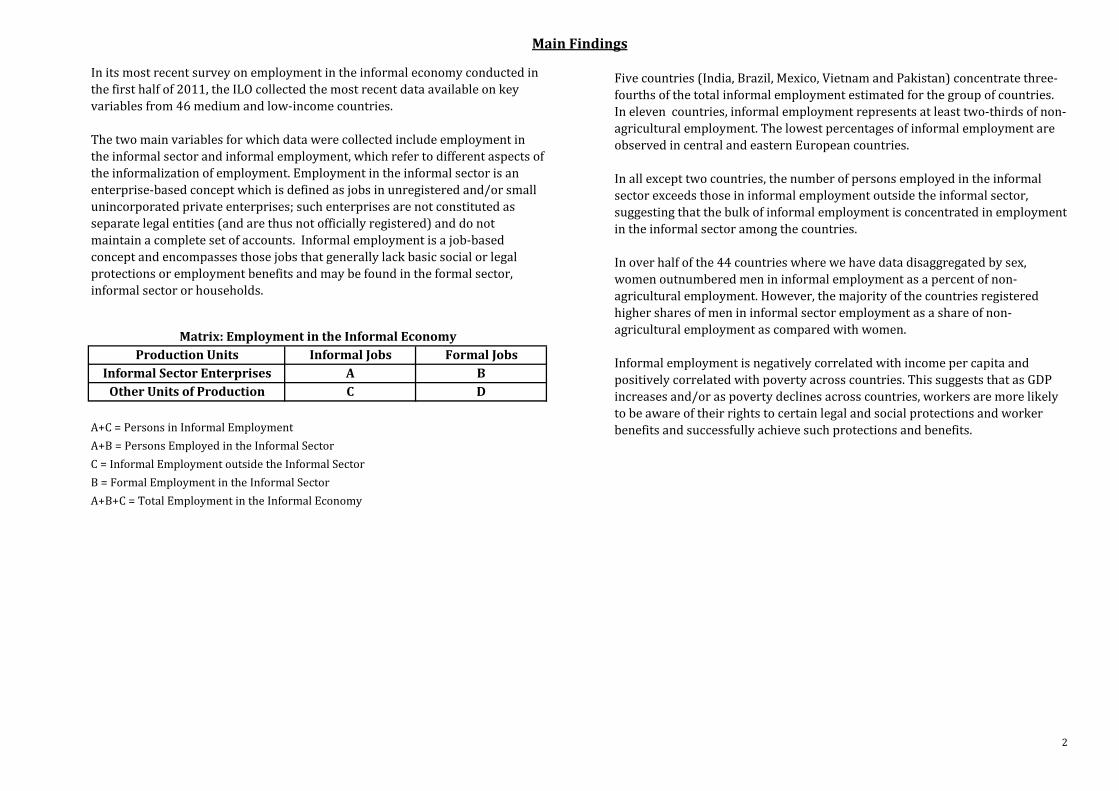
A+C = Persons in Informal EmploymentA+B = Persons Employed in the Informal SectorC = Informal Employment outside the Informal SectorB = Formal Employment in the Informal SectorA+B+C = Total Employment in the Informal Economy
2
Five countries (India, Brazil, Mexico, Vietnam and Pakistan) concentrate three-fourths of the total informal employment estimated for the group of countries. In eleven countries, informal employment represents at least two-thirds of non-agricultural employment. The lowest percentages of informal employment are observed in central and eastern European countries.
In all except two countries, the number of persons employed in the informal sector exceeds those in informal employment outside the informal sector, suggesting that the bulk of informal employment is concentrated in employment in the informal sector among the countries.
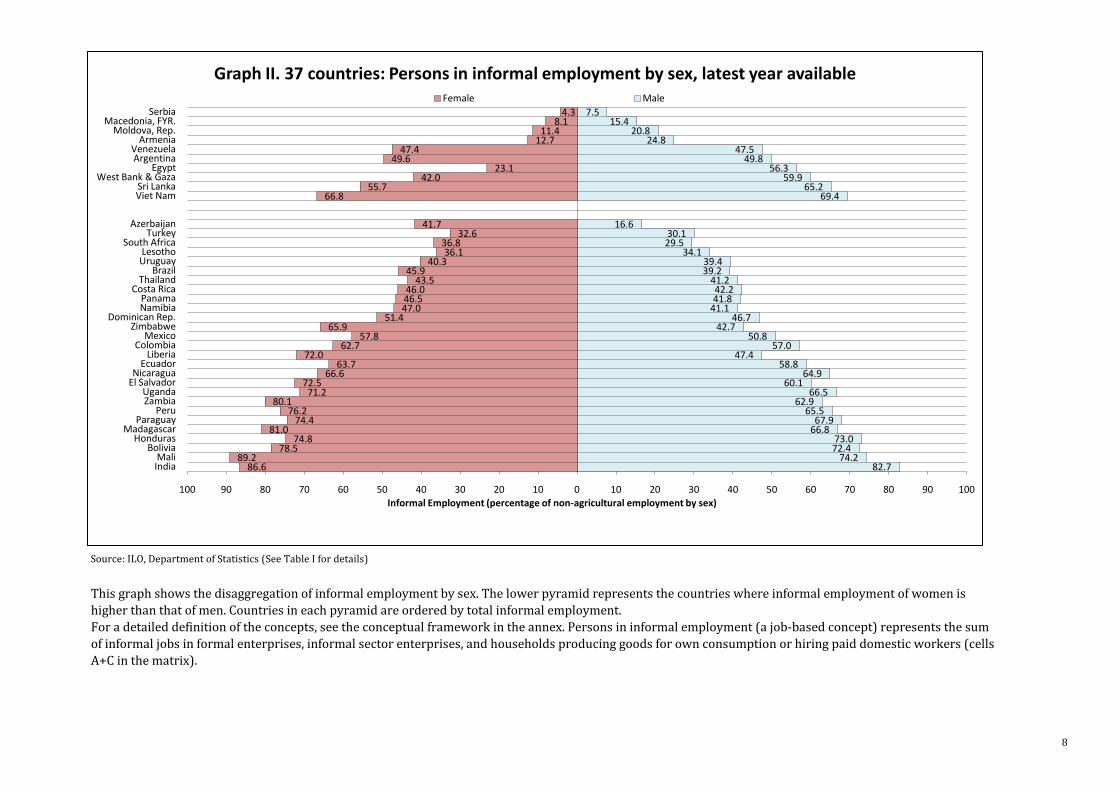
In over half of the 44 countries where we have data disaggregated by sex, women outnumbered men in informal employment as a percent of non-agricultural employment. However, the majority of the countries registered higher shares of men in informal sector employment as a share of non-agricultural employment as compared with women.
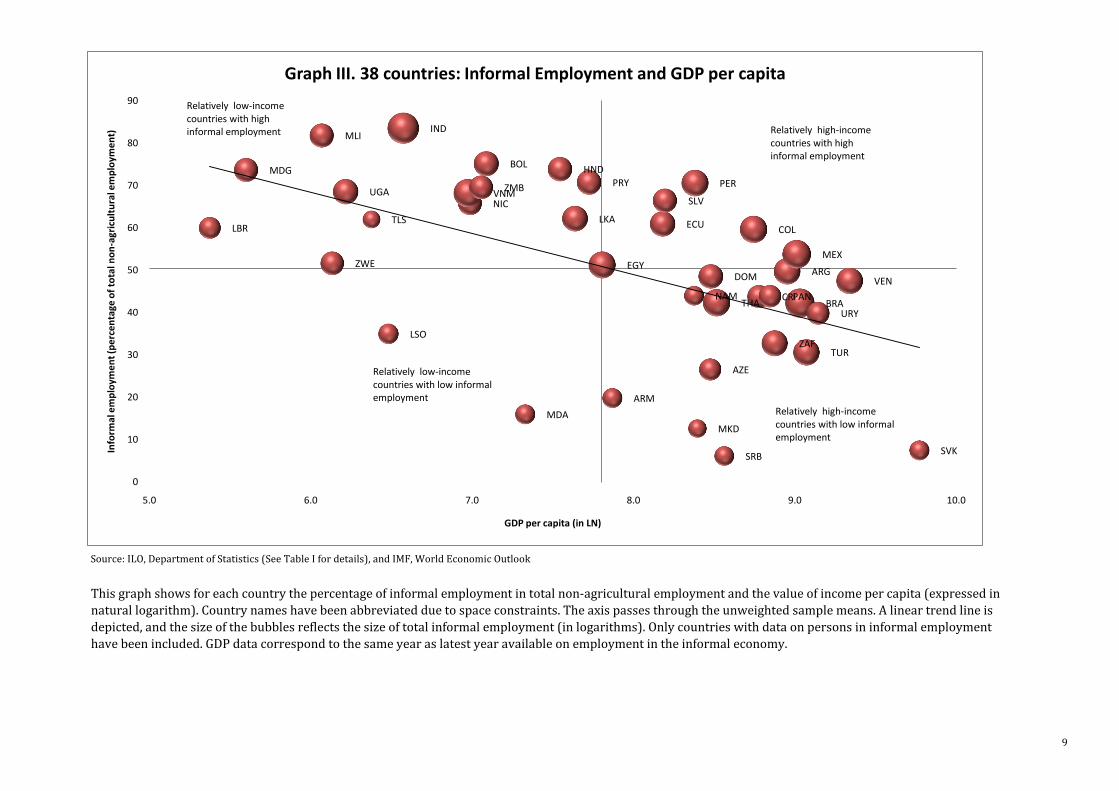
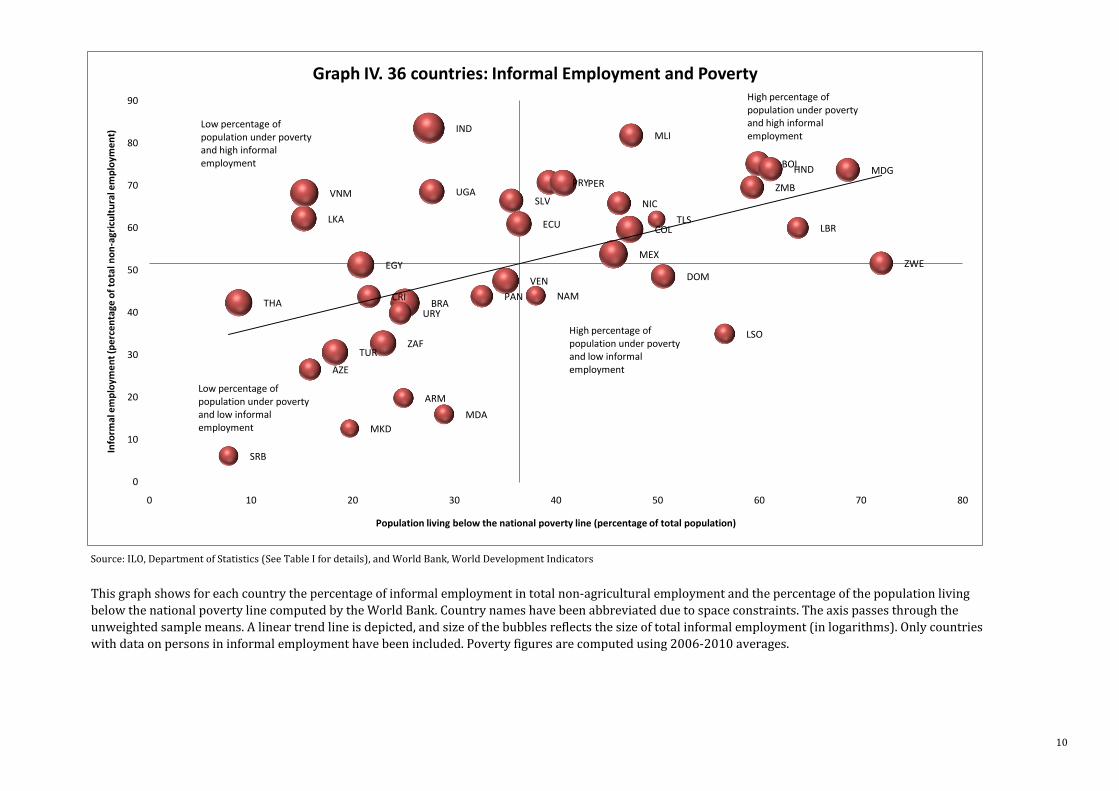
Informal employment is negatively correlated with income per capita and positively correlated with poverty across countries. This suggests that as GDP increases and/or as poverty declines across countries, workers are more likely to be aware of their rights to certain legal and social protections and worker benefits and successfully achieve such protections and benefits.
Main Findings
Informal Sector EnterprisesOther Units of Production
In its most recent survey on employment in the informal economy conducted in the first half of 2011, the ILO collected the most recent data available on key variables from 46 medium and low-income countries.
The two main variables for which data were collected include employment in the informal sector and informal employment, which refer to different aspects of the informalization of employment. Employment in the informal sector is an enterprise-based concept which is defined as jobs in unregistered and/or small unincorporated private enterprises; such enterprises are not constituted as separate legal entities (and are thus not officially registered) and do not maintain a complete set of accounts. Informal employment is a job-based concept and encompasses those jobs that generally lack basic social or legal protections or employment benefits and may be found in the formal sector, informal sector or households.
Matrix: Employment in the Informal Economy
AC
BD
Production Units Informal Jobs Formal Jobs
Argentina (2009 IV Qtr.) 5,138 49.7 3,317 32.1 1,850 17.9 Moldova, Rep. (2009) 136 15.9 62 7.3 73 8.6
Armenia (2009) 138 19.8 71 10.2 67 9.6 Namibia (2008) 121 43.9 n.a. n.a. n.a. n.a.
Azerbaijan* (2009 Oct.) 407 26.5 n.a. n.a. n.a. n.a. Nicaragua (2009) 1,024 65.7 847 54.4 234 15.0
Bolivia (2006) 2,069 75.1 1,436 52.1 647 23.5 Pakistan (2003/2004) n.a. n.a. 16,633 70.0 n.a.
Brazil (2009) 32,493 42.2 18,688 24.3 13,862 18.0 Panama (2009 Aug.) 517 43.8 327 27.7 192 16.3
Colombia (2010 II Qtr.) 9,307 59.6 8,144 52.2 1,444 9.3 Paraguay (2009) 1,473 70.7 790 37.9 683 32.8
Costa Rica (2009 July) 754 43.8 638 37.0 193 11.2 Peru (2009) 7,168 70.6 5,104 50.2 2,139 21.1
Cote d'Ivoire (2008) n.a. n.a. 2,434 69.7 n.a. n.a. Russian Fed. (2010) n.a. n.a. 7,785 12.1 n.a. n.a.
Dominican Rep. (2009) 1,484 48.5 898 29.4 593 19.4 Serbia (2010) 113 6.1 66 3.5 57 3.0
Ecuador (2009 IV Qtr.) 2,691 60.9 1,646 37.3 1,062 24.0 Slovakia* (2008) 139 7.4 n.a. n.a. n.a. n.a.
Egypt (2009) 8,247 51.2 n.a. n.a. n.a. n.a. South Africa (2010) 4,089 32.7 2,225 17.8 1,864 14.9
El Salvador (2009) 1,242 66.4 998 53.4 277 14.8 Sri Lanka (2009) 3,184 62.1 2,588 50.5 597 11.6
Ethiopia** (2004) n.a. n.a. 1,089 41.4 n.a. n.a. Thailand (2010) 9,642 42.3 n.a. n.a. n.a. n.a.
Honduras (2009) 1,454 73.9 1,146 58.3 334 17.0 Timor Leste* (2010) 44 62.0 n.a. n.a. n.a. n.a.
India (2004/2005) 163,014 83.5 134,347 68.8 30,055 15.4 Turkey (2009) 4,903 30.6 n.a. n.a. n.a. n.a.
Kyrgyzstan (2009) n.a. n.a. 887 59.2 n.a. n.a. Uganda (2010) 2,597 68.5 2,243 59.2 512 13.5
Lesotho (2008) 160 34.9 225 49.1 99 21.6 Ukraine (2009) n.a. n.a. 1,525 9.4 n.a. n.a.
Liberia (2010) 343 60.0 284 49.5 62 10.8 Uruguay (2009) 572 39.8 487 33.9 141 9.8
Macedonia, FYR. (2010) 65 12.6 39 7.6 27 5.2 Venezuela BR (2009 I Qtr.) 5,131 47.5 3,920 36.3 1,275 11.8
Madagascar (2005) 1,271 73.6 893 51.8 378 21.9 Viet Nam (2009) 17,172 68.2 10,948 43.5 6,303 25.0
Mali (2004) 1,180 81.8 1,029 71.4 163 11.3 West Bank & Gaza (2010) 375 58.5 140 23.2 235 37.2
Mauritius (2009) n.a. n.a. 57 9.3 n.a. n.a. Zambia (2008) 920 69.5 854 64.6 155 11.7
Mexico (2009 II Qtr.) 20,258 53.7 12,861 34.1 7,620 20.2 Zimbabwe (2004) 909 51.6 698 39.6 n.a. n.a.
3
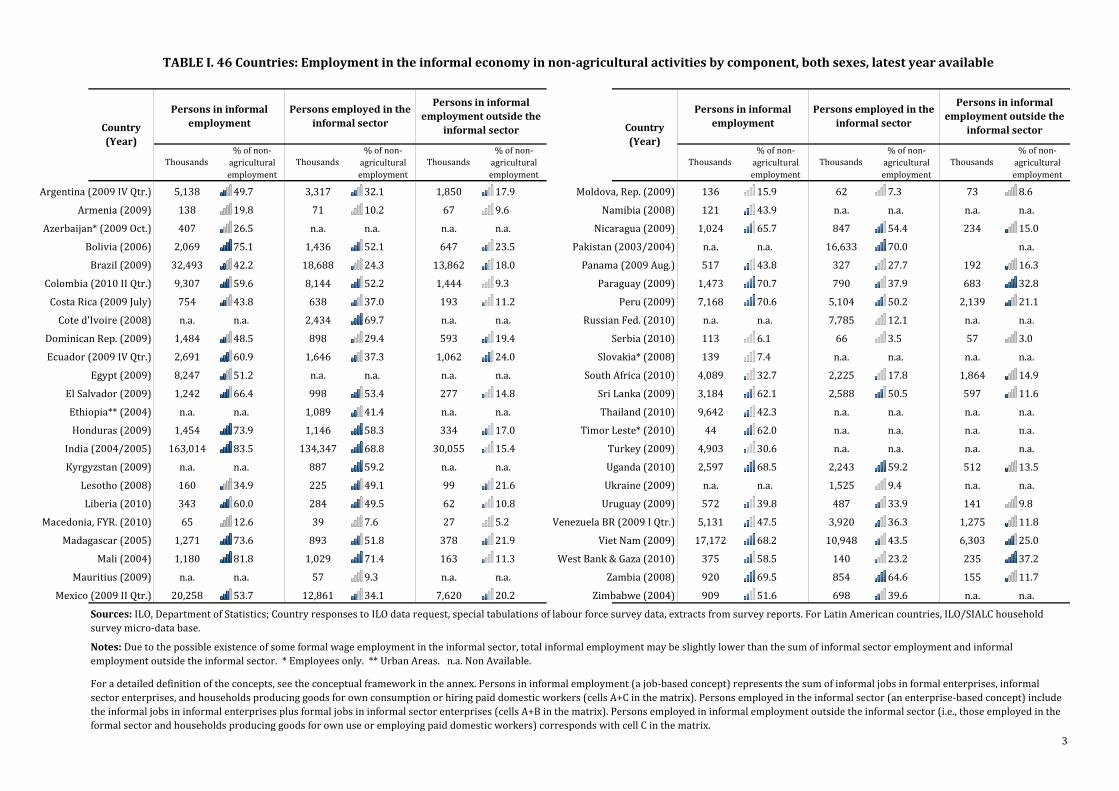
TABLE I. 46 Countries: Employment in the informal economy in non-agricultural activities by component, both sexes, latest year available
% of non-agricultural employment
Thousands
Persons in informal employment outside the
informal sector
Persons employed in the informal sector
Persons in informal employment
Thousands% of non-
agricultural employment
Thousands% of non-
agricultural employment
Country (Year)
Country (Year)
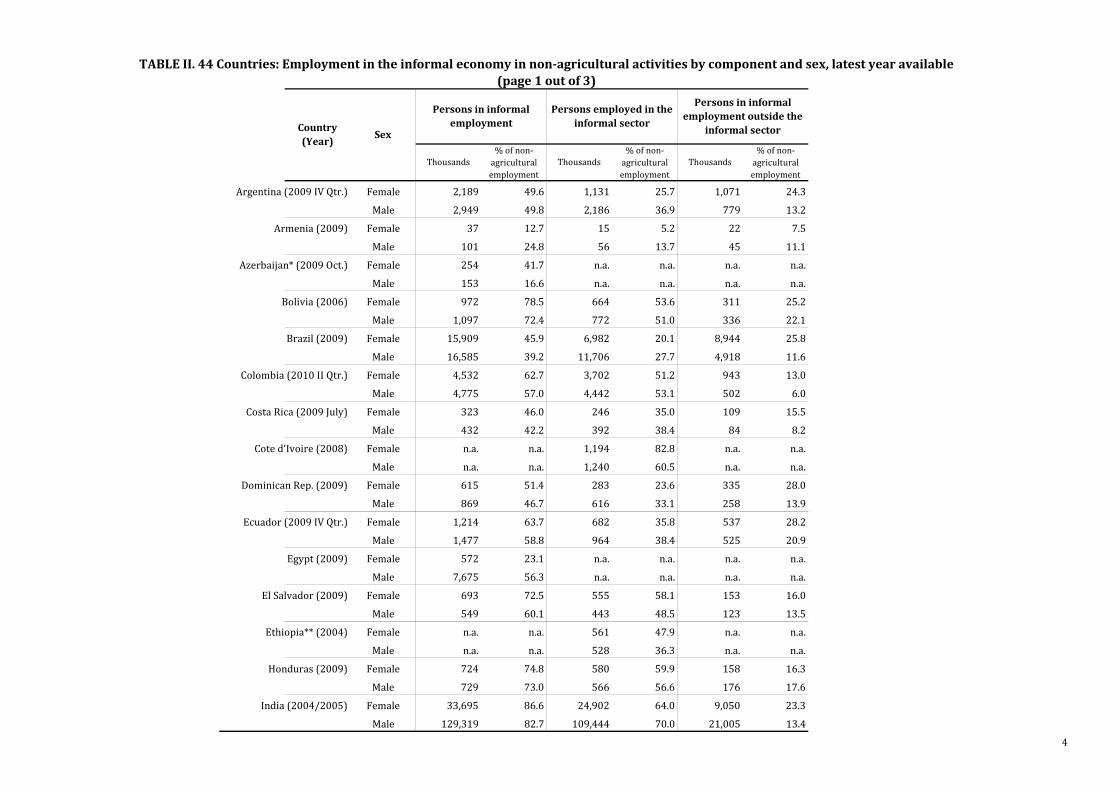
For a detailed definition of the concepts, see the conceptual framework in the annex. Persons in informal employment (a job-based concept) represents the sum of informal jobs in formal enterprises, informal sector enterprises, and households producing goods for own consumption or hiring paid domestic workers (cells A+C in the matrix). Persons employed in the informal sector (an enterprise-based concept) include the informal jobs in informal enterprises plus formal jobs in informal sector enterprises (cells A+B in the matrix). Persons employed in informal employment outside the informal sector (i.e., those employed in the formal sector and households producing goods for own use or employing paid domestic workers) corresponds with cell C in the matrix.
Notes: Due to the possible existence of some formal wage employment in the informal sector, total informal employment may be slightly lower than the sum of informal sector employment and informal employment outside the informal sector. * Employees only. ** Urban Areas. n.a. Non Available.
Sources: ILO, Department of Statistics; Country responses to ILO data request, special tabulations of labour force survey data, extracts from survey reports. For Latin American countries, ILO/SIALC household survey micro-data base.
Persons in informal employment
Persons employed in the informal sector
Thousands% of non-
agricultural employment
Thousands Thousands% of non-
agricultural employment
% of non-agricultural employment
Persons in informal employment outside the
informal sector
Argentina (2009 IV Qtr.) Female 2,189 49.6 1,131 25.7 1,071 24.3
Male 2,949 49.8 2,186 36.9 779 13.2
Armenia (2009) Female 37 12.7 15 5.2 22 7.5
Male 101 24.8 56 13.7 45 11.1
Azerbaijan* (2009 Oct.) Female 254 41.7 n.a. n.a. n.a. n.a.
Male 153 16.6 n.a. n.a. n.a. n.a.
Bolivia (2006) Female 972 78.5 664 53.6 311 25.2
Male 1,097 72.4 772 51.0 336 22.1
Brazil (2009) Female 15,909 45.9 6,982 20.1 8,944 25.8
Male 16,585 39.2 11,706 27.7 4,918 11.6
Colombia (2010 II Qtr.) Female 4,532 62.7 3,702 51.2 943 13.0
Male 4,775 57.0 4,442 53.1 502 6.0
Costa Rica (2009 July) Female 323 46.0 246 35.0 109 15.5
Male 432 42.2 392 38.4 84 8.2
Cote d'Ivoire (2008) Female n.a. n.a. 1,194 82.8 n.a. n.a.
Male n.a. n.a. 1,240 60.5 n.a. n.a.
Dominican Rep. (2009) Female 615 51.4 283 23.6 335 28.0
Male 869 46.7 616 33.1 258 13.9
Ecuador (2009 IV Qtr.) Female 1,214 63.7 682 35.8 537 28.2
Male 1,477 58.8 964 38.4 525 20.9
Egypt (2009) Female 572 23.1 n.a. n.a. n.a. n.a.
Male 7,675 56.3 n.a. n.a. n.a. n.a.
El Salvador (2009) Female 693 72.5 555 58.1 153 16.0
Male 549 60.1 443 48.5 123 13.5
Ethiopia** (2004) Female n.a. n.a. 561 47.9 n.a. n.a.
Male n.a. n.a. 528 36.3 n.a. n.a.
Honduras (2009) Female 724 74.8 580 59.9 158 16.3
Male 729 73.0 566 56.6 176 17.6
India (2004/2005) Female 33,695 86.6 24,902 64.0 9,050 23.3
Male 129,319 82.7 109,444 70.0 21,005 13.4
4
Thousands% of non-
agricultural employment
Country (Year)
Persons in informal employment
Persons employed in the informal sector
Persons in informal employment outside the
informal sector
Thousands% of non-
agricultural employment
Sex
TABLE II. 44 Countries: Employment in the informal economy in non-agricultural activities by component and sex, latest year available (page 1 out of 3)
Thousands% of non-
agricultural employment
Kyrgyzstan (2009) Female n.a. n.a. 321 50.7 n.a. n.a.
Male n.a. n.a. 566 65.4 n.a. n.a.
Lesotho (2008) Female 70 36.1 94 48.1 46 23.7
Male 90 34.1 131 49.9 53 20.0
Liberia (2010) Female 206 72.0 188 65.4 19 6.6
Male 136 47.4 96 33.4 42 14.6
Macedonia, FYR. (2010) Female 16 8.1 5 2.8 11 5.6
Male 49 15.4 33 10.7 16 5.0
Madagascar (2005) Female 671 81.0 528 63.8 143 17.2
Male 600 66.8 365 40.7 235 26.2
Mali (2004) Female 652 89.2 582 79.6 74 10.1
Male 528 74.2 447 62.9 89 12.6
Mauritius (2009) Female n.a. n.a. 14 6.7 n.a. n.a.
Male n.a. n.a. 43 10.6 n.a. n.a.
Mexico (2009 II Qtr.) Female 9,066 57.8 4,993 31.8 4,115 26.2
Male 11,192 50.8 7,868 35.7 3,504 15.9
Moldova, Rep. (2009) Female 50 11.4 11 2.6 39 8.8
Male 85 20.8 51 12.4 35 8.4
Namibia (2008) Female 62 47.0 n.a. n.a. n.a. n.a.
Male 59 41.1 n.a. n.a. n.a. n.a.
Nicaragua (2009) Female 505 66.6 400 52.7 130 17.2
Male 519 64.9 447 55.9 104 13.0
Pakistan (2003/2004) Female n.a. n.a. 1,515 65.7 n.a. n.a.
Male n.a. n.a. 15,118 70.4 n.a. n.a.
Panama (2009 Aug.) Female 232 46.5 130 26.0 103 20.6
Male 285 41.8 197 28.9 90 13.2
Paraguay (2009) Female 666 74.4 328 36.7 338 37.7
Male 806 67.9 462 38.9 345 29.1
Peru (2009) Female 3,668 76.2 2,685 55.8 1,022 21.2
Male 3,500 65.5 2,419 45.3 1,118 20.9
5
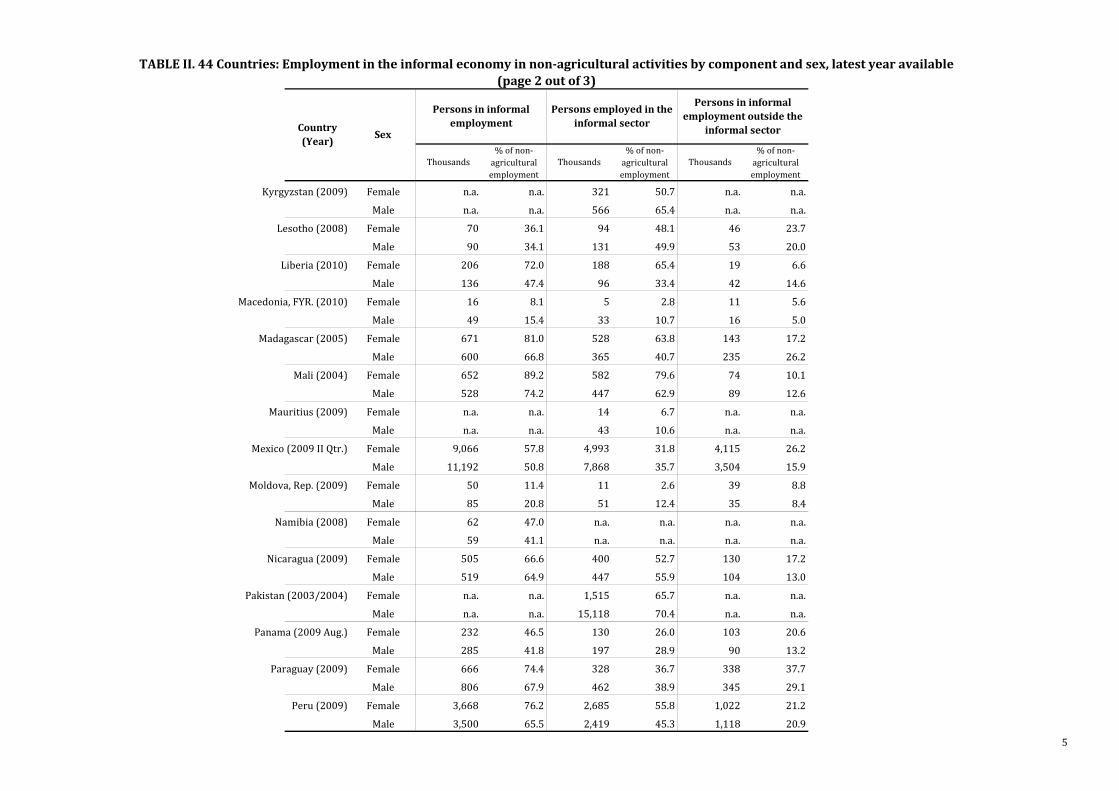
TABLE II. 44 Countries: Employment in the informal economy in non-agricultural activities by component and sex, latest year available (page 2 out of 3)
Country (Year)
Sex
Persons in informal employment
Persons employed in the informal sector
Persons in informal employment outside the
informal sector
Thousands% of non-
agricultural employment
Thousands% of non-
agricultural employment
Thousands% of non-
agricultural employment
Russian Fed. (2010) Female n.a. n.a. 3,536 10.9 n.a. n.a.
Male n.a. n.a. 4,249 13.3 n.a. n.a.
Serbia (2010) Female 35 4.3 17 2.1 21 2.6
Male 79 7.5 48 4.6 35 3.3
South Africa (2010) Female 2,018 36.8 922 16.8 1,096 20.0
Male 2,071 29.5 1,303 18.6 768 10.9
Sri Lanka (2009) Female 933 55.7 700 41.8 232 13.9
Male 2,252 65.2 1,888 54.7 364 10.6
Thailand (2010) Female 4,730 43.5 n.a. n.a. n.a. n.a.
Male 4,912 41.2 n.a. n.a. n.a. n.a.
Turkey (2009) Female 1,116 32.6 n.a. n.a. n.a. n.a.
Male 3,788 30.1 n.a. n.a. n.a. n.a.
Uganda (2010) Female 1,178 71.2 1,027 62.1 193 11.6
Male 1,419 66.5 1,216 57.0 319 14.9
Ukraine (2009) Female n.a. n.a. 518 6.4 n.a. n.a.
Male n.a. n.a. 1,006 12.4 n.a. n.a.
Uruguay (2009) Female 270 40.3 194 28.9 101 15.0
Male 302 39.4 294 38.3 41 5.3
Venezuela BR (2009 I Qtr.) Female 2,159 47.4 1,552 34.1 623 13.7
Male 2,972 47.5 2,367 37.8 652 10.4
Viet Nam (2009) Female 7,800 66.8 5,106 43.7 2,738 23.4
Male 9,372 69.4 5,842 43.3 3,565 26.4
West Bank & Gaza (2010) Female 42 42.0 14 14.0 28 28.0
Male 333 59.9 126 22.7 207 37.2
Zambia (2008) Female 407 80.1 357 70.3 63 12.4
Male 513 62.9 497 60.9 92 11.3
Zimbabwe (2004) Female 447 65.9 360 53.1 n.a. n.a.
Male 462 42.7 338 31.2 n.a. n.a.
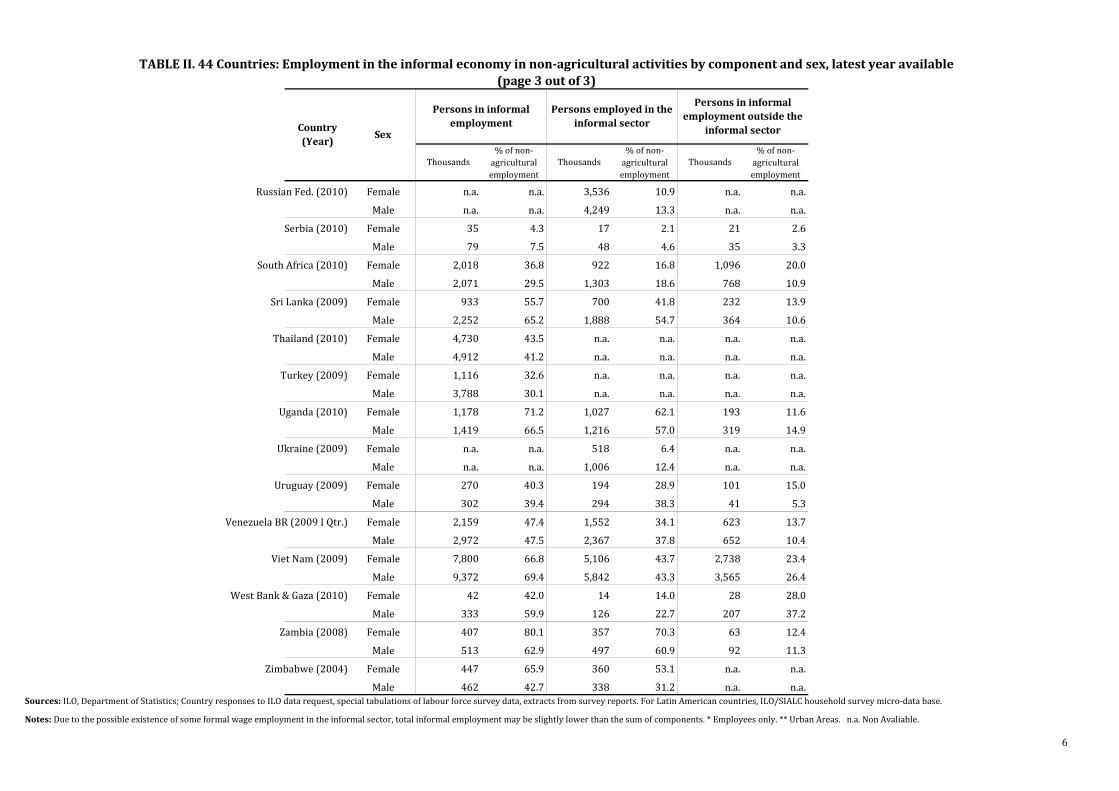
Notes: Due to the possible existence of some formal wage employment in the informal sector, total informal employment may be slightly lower than the sum of components. * Employees only. ** Urban Areas. n.a. Non Avaliable.
6
TABLE II. 44 Countries: Employment in the informal economy in non-agricultural activities by component and sex, latest year available (page 3 out of 3)
Sources: ILO, Department of Statistics; Country responses to ILO data request, special tabulations of labour force survey data, extracts from survey reports. For Latin American countries, ILO/SIALC household survey micro-data base.
% of non-agricultural employment
Persons employed in the informal sector
Persons in informal employment outside the
informal sector
Thousands% of non-
agricultural employment
Thousands% of non-
agricultural employment
Thousands
Country (Year)
Sex
Persons in informal employment

Source: ILO, Department of Statistics (See Table I for details)
7
This graph shows the disaggregation of employment in the informal economy by component. Countries are ordered by the sum of both components.For a detailed definition of the concepts, see the conceptual framework in the annex. Persons employed in the informal sector (an enterprise-based concept) include the informal jobs in informal enterprises plus formal jobs in informal sector enterprises (cells A+B in the matrix). Persons employed in informal employment (a job-based concept) outside the informal sector (i.e., those employed in the formal sector and households producing goods for own use or employing paid domestic workers) corresponds with cell C in the matrix.
68.871.4
64.652.1
58.351.8
59.250.2
37.949.1
54.443.5
53.450.5
52.237.3
23.249.5
34.132.1
29.437.036.3
27.733.9
24.317.8
10.27.37.6
3.5
15.4 11.3 11.7
23.5 17.0
21.9 13.5
21.1 32.8
21.6 15.0
25.0 14.8
11.6 9.3
24.0 37.2
10.8 20.2
17.9 19.4
11.2 11.8
16.3 9.8
18.0 14.9
9.6 8.6
5.2 3.0
75 65 55 45 35 25 15 5 5 15 25 35 45 55 65 75
IndiaMali
ZambiaBolivia
HondurasMadagascar
UgandaPeru
ParaguayLesotho
NicaraguaViet Nam
El SalvadorSri Lanka
ColombiaEcuador
West Bank & GazaLiberia
MexicoArgentina
Dominican Rep.Costa Rica
Venezuela, BR.PanamaUruguay
BrazilSouth Africa
ArmeniaMoldova, Rep.
Macedonia, FYRSerbia
Percentage of non-agricultural employment
Graph I. 31 countries: Persons employed in the informal economy by component,latest year available
Persons employed in the informal sector Persons in informal employment outside the informal sector
Source: ILO, Department of Statistics (See Table I for details)
8
This graph shows the disaggregation of informal employment by sex. The lower pyramid represents the countries where informal employment of women is higher than that of men. Countries in each pyramid are ordered by total informal employment. For a detailed definition of the concepts, see the conceptual framework in the annex. Persons in informal employment (a job-based concept) represents the sum of informal jobs in formal enterprises, informal sector enterprises, and households producing goods for own consumption or hiring paid domestic workers (cells A+C in the matrix).
86.689.2
78.574.8
81.074.4
76.280.1
71.272.5
66.663.7
72.062.7
57.865.9
51.447.046.546.0
43.545.9
40.336.1
36.832.6
41.7
66.855.7
42.023.1
49.647.4
12.711.4
8.14.3
82.7 74.2
72.4 73.0
66.8 67.9
65.5 62.9
66.5 60.1
64.9 58.8
47.4 57.0
50.8 42.7
46.7 41.1 41.8 42.2
41.2 39.2 39.4
34.1 29.5 30.1
16.6
69.4 65.2
59.9 56.3
49.8 47.5
24.8 20.8
15.4 7.5
100 90 80 70 60 50 40 30 20 10 0 10 20 30 40 50 60 70 80 90 100
IndiaMali
BoliviaHonduras
MadagascarParaguay
PeruZambiaUganda
El SalvadorNicaragua
EcuadorLiberia
ColombiaMexico
ZimbabweDominican Rep.
NamibiaPanama
Costa RicaThailand
BrazilUruguayLesotho
South AfricaTurkey
Azerbaijan
Viet NamSri Lanka
West Bank & GazaEgypt
ArgentinaVenezuela
ArmeniaMoldova, Rep.
Macedonia, FYR.Serbia
Informal Employment (percentage of non-agricultural employment by sex)
Graph II. 37 countries: Persons in informal employment by sex, latest year availableFemale Male
Source: ILO, Department of Statistics (See Table I for details), and IMF, World Economic Outlook
9
This graph shows for each country the percentage of informal employment in total non-agricultural employment and the value of income per capita (expressed in natural logarithm). Country names have been abbreviated due to space constraints. The axis passes through the unweighted sample means. A linear trend line is depicted, and the size of the bubbles reflects the size of total informal employment (in logarithms). Only countries with data on persons in informal employment have been included. GDP data correspond to the same year as latest year available on employment in the informal economy.
ARG
ARM
AZE
BOL
BRA
COL
CRI
DOM
ECU
EGY
SLV
HND
IND
LSO
LBR
MKD
MDG
MLI
MEX
MDA
NAM
NIC
PAN
PRY PER
SRB SVK
ZAF
LKA
THA
TLS
TUR
UGA
URY
VEN
VNMZMB
ZWE
0
10
20
30
40
50
60
70
80
90
5.0 6.0 7.0 8.0 9.0 10.0
Info
rmal
em
ploy
men
t (pe
rcen
tage
of t
otal
non
-agr
icul
tura
l em
ploy
men
t)
GDP per capita (in LN)
Graph III. 38 countries: Informal Employment and GDP per capita
Relatively high-incomecountries with low informal employment
Relatively high-incomecountries with high informal employment
Relatively low-incomecountries with high informal employment
Relatively low-incomecountries with low informal employment
Source: ILO, Department of Statistics (See Table I for details), and World Bank, World Development Indicators
10
This graph shows for each country the percentage of informal employment in total non-agricultural employment and the percentage of the population living below the national poverty line computed by the World Bank. Country names have been abbreviated due to space constraints. The axis passes through the unweighted sample means. A linear trend line is depicted, and size of the bubbles reflects the size of total informal employment (in logarithms). Only countries with data on persons in informal employment have been included. Poverty figures are computed using 2006-2010 averages.
ARM
AZE
BOL
BRA
COL
CRI
DOM
ECU
EGY
SLV
HND
IND
LSO
LBR
MKD
MDG
MLI
MEX
MDA
NAM
NIC
PAN
PRYPER
SRB
ZAF
LKA
THA
TLS
TUR
UGA
URY
VEN
VNM ZMB
ZWE
0
10
20
30
40
50
60
70
80
90
0 10 20 30 40 50 60 70 80
Info
rmal
em
ploy
men
t (pe
rcen
tage
of t
otal
non
-agr
icul
tura
l em
ploy
men
t)
Population living below the national poverty line (percentage of total population)
Graph IV. 36 countries: Informal Employment and Poverty
Low percentage of population under poverty and high informal employment
Low percentage of population under poverty and low informal employment
High percentage of population under poverty and low informal employment
High percentage of population under poverty and high informal employment
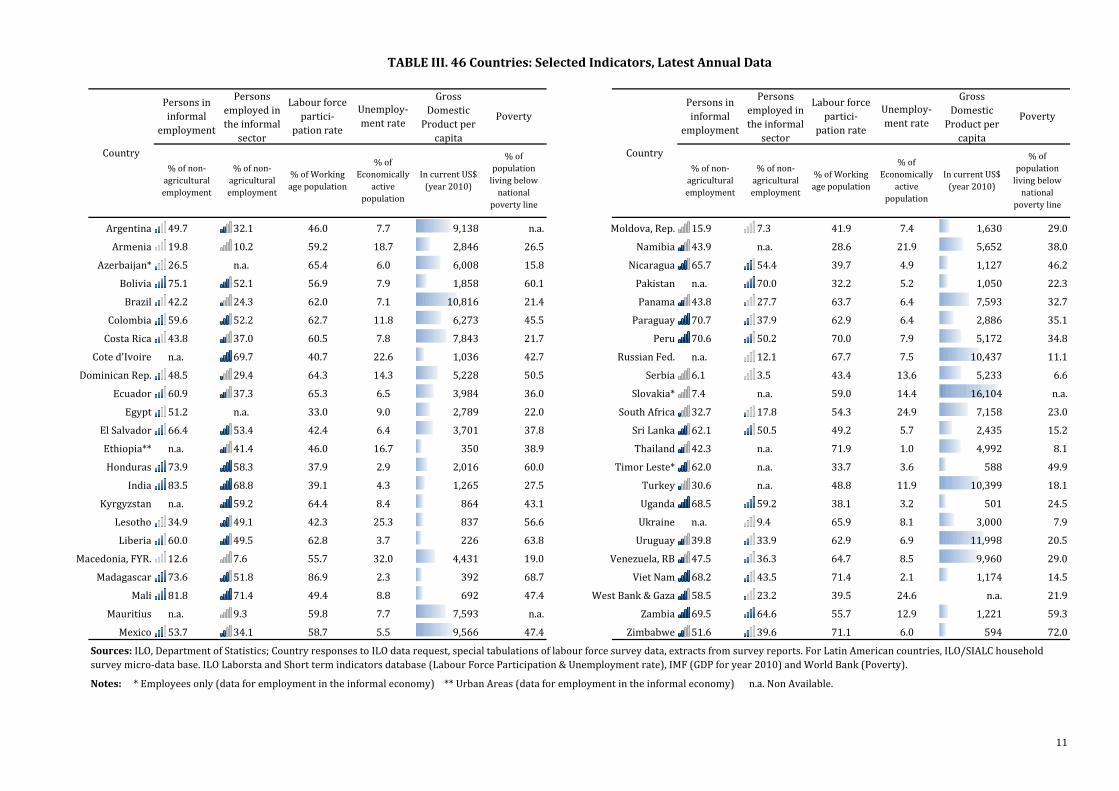
Argentina 49.7 32.1 46.0 7.7 9,138 n.a. Moldova, Rep. 15.9 7.3 41.9 7.4 1,630 29.0
Armenia 19.8 10.2 59.2 18.7 2,846 26.5 Namibia 43.9 n.a. 28.6 21.9 5,652 38.0
Azerbaijan* 26.5 n.a. 65.4 6.0 6,008 15.8 Nicaragua 65.7 54.4 39.7 4.9 1,127 46.2
Bolivia 75.1 52.1 56.9 7.9 1,858 60.1 Pakistan n.a. 70.0 32.2 5.2 1,050 22.3
Brazil 42.2 24.3 62.0 7.1 10,816 21.4 Panama 43.8 27.7 63.7 6.4 7,593 32.7
Colombia 59.6 52.2 62.7 11.8 6,273 45.5 Paraguay 70.7 37.9 62.9 6.4 2,886 35.1
Costa Rica 43.8 37.0 60.5 7.8 7,843 21.7 Peru 70.6 50.2 70.0 7.9 5,172 34.8
Cote d'Ivoire n.a. 69.7 40.7 22.6 1,036 42.7 Russian Fed. n.a. 12.1 67.7 7.5 10,437 11.1
Dominican Rep. 48.5 29.4 64.3 14.3 5,228 50.5 Serbia 6.1 3.5 43.4 13.6 5,233 6.6
Ecuador 60.9 37.3 65.3 6.5 3,984 36.0 Slovakia* 7.4 n.a. 59.0 14.4 16,104 n.a.
Egypt 51.2 n.a. 33.0 9.0 2,789 22.0 South Africa 32.7 17.8 54.3 24.9 7,158 23.0
El Salvador 66.4 53.4 42.4 6.4 3,701 37.8 Sri Lanka 62.1 50.5 49.2 5.7 2,435 15.2
Ethiopia** n.a. 41.4 46.0 16.7 350 38.9 Thailand 42.3 n.a. 71.9 1.0 4,992 8.1
Honduras 73.9 58.3 37.9 2.9 2,016 60.0 Timor Leste* 62.0 n.a. 33.7 3.6 588 49.9
India 83.5 68.8 39.1 4.3 1,265 27.5 Turkey 30.6 n.a. 48.8 11.9 10,399 18.1
Kyrgyzstan n.a. 59.2 64.4 8.4 864 43.1 Uganda 68.5 59.2 38.1 3.2 501 24.5
Lesotho 34.9 49.1 42.3 25.3 837 56.6 Ukraine n.a. 9.4 65.9 8.1 3,000 7.9
Liberia 60.0 49.5 62.8 3.7 226 63.8 Uruguay 39.8 33.9 62.9 6.9 11,998 20.5
Macedonia, FYR. 12.6 7.6 55.7 32.0 4,431 19.0 Venezuela, RB 47.5 36.3 64.7 8.5 9,960 29.0
Madagascar 73.6 51.8 86.9 2.3 392 68.7 Viet Nam 68.2 43.5 71.4 2.1 1,174 14.5
Mali 81.8 71.4 49.4 8.8 692 47.4 West Bank & Gaza 58.5 23.2 39.5 24.6 n.a. 21.9
Mauritius n.a. 9.3 59.8 7.7 7,593 n.a. Zambia 69.5 64.6 55.7 12.9 1,221 59.3
Mexico 53.7 34.1 58.7 5.5 9,566 47.4 Zimbabwe 51.6 39.6 71.1 6.0 594 72.0
Notes: * Employees only (data for employment in the informal economy) ** Urban Areas (data for employment in the informal economy) n.a. Non Available.
11
Country Country
Labour force partici-
pation rate
Unemploy-ment rate
Gross Domestic
Product per capita
Poverty
% of Economically
active population
In current US$ (year 2010)
% of population
living below national
poverty line
% of Economically
active population
In current US$ (year 2010)
% of population
living below national
poverty line
% of non-agricultural employment
% of non-agricultural employment
% of Working age population
Labour force partici-
pation rate
Unemploy-ment rate
Persons employed in the informal
sector
Persons in informal
employment
Persons in informal
employment
Persons employed in the informal
sector
Gross Domestic
Product per capita
Poverty
Sources: ILO, Department of Statistics; Country responses to ILO data request, special tabulations of labour force survey data, extracts from survey reports. For Latin American countries, ILO/SIALC household survey micro-data base. ILO Laborsta and Short term indicators database (Labour Force Participation & Unemployment rate), IMF (GDP for year 2010) and World Bank (Poverty).
TABLE III. 46 Countries: Selected Indicators, Latest Annual Data
% of non-agricultural employment
% of non-agricultural employment
% of Working age population
12
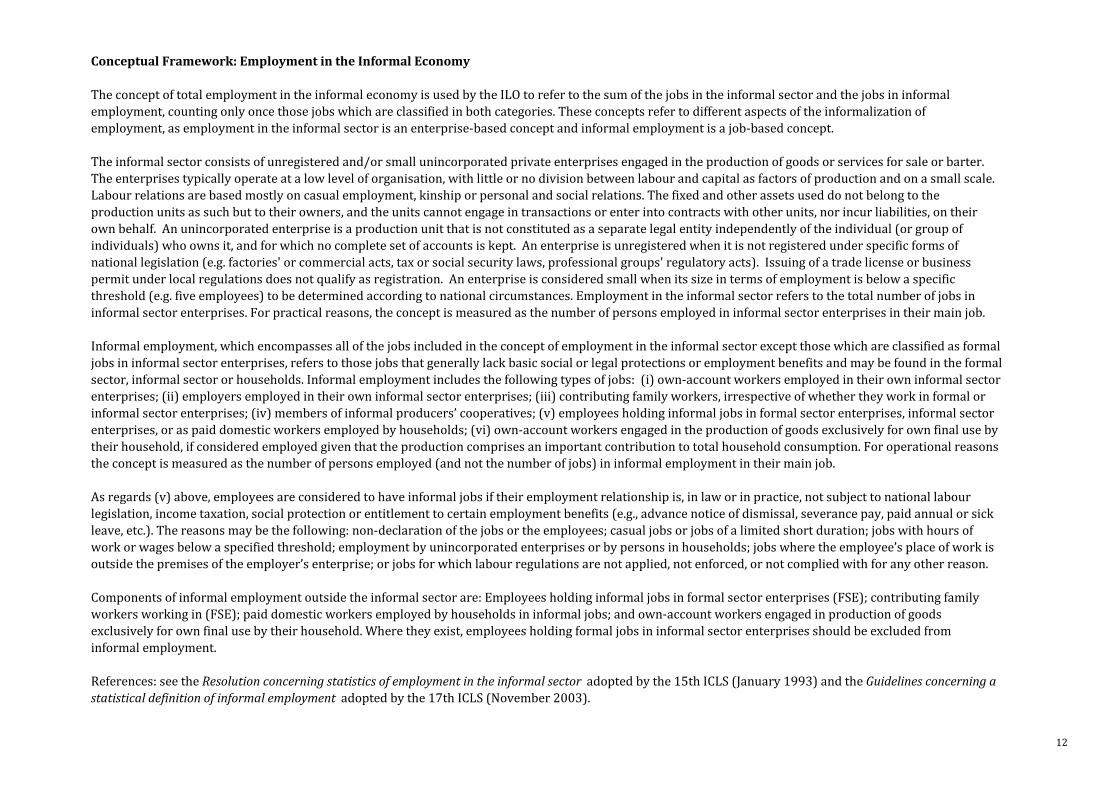
Conceptual Framework: Employment in the Informal Economy
The concept of total employment in the informal economy is used by the ILO to refer to the sum of the jobs in the informal sector and the jobs in informal employment, counting only once those jobs which are classified in both categories. These concepts refer to different aspects of the informalization of employment, as employment in the informal sector is an enterprise-based concept and informal employment is a job-based concept.
The informal sector consists of unregistered and/or small unincorporated private enterprises engaged in the production of goods or services for sale or barter. The enterprises typically operate at a low level of organisation, with little or no division between labour and capital as factors of production and on a small scale. Labour relations are based mostly on casual employment, kinship or personal and social relations. The fixed and other assets used do not belong to the production units as such but to their owners, and the units cannot engage in transactions or enter into contracts with other units, nor incur liabilities, on their own behalf. An unincorporated enterprise is a production unit that is not constituted as a separate legal entity independently of the individual (or group of individuals) who owns it, and for which no complete set of accounts is kept. An enterprise is unregistered when it is not registered under specific forms of national legislation (e.g. factories' or commercial acts, tax or social security laws, professional groups' regulatory acts). Issuing of a trade license or business permit under local regulations does not qualify as registration. An enterprise is considered small when its size in terms of employment is below a specific threshold (e.g. five employees) to be determined according to national circumstances. Employment in the informal sector refers to the total number of jobs in informal sector enterprises. For practical reasons, the concept is measured as the number of persons employed in informal sector enterprises in their main job.
Informal employment, which encompasses all of the jobs included in the concept of employment in the informal sector except those which are classified as formal jobs in informal sector enterprises, refers to those jobs that generally lack basic social or legal protections or employment benefits and may be found in the formal sector, informal sector or households. Informal employment includes the following types of jobs: (i) own-account workers employed in their own informal sector enterprises; (ii) employers employed in their own informal sector enterprises; (iii) contributing family workers, irrespective of whether they work in formal or informal sector enterprises; (iv) members of informal producers’ cooperatives; (v) employees holding informal jobs in formal sector enterprises, informal sector enterprises, or as paid domestic workers employed by households; (vi) own-account workers engaged in the production of goods exclusively for own final use by their household, if considered employed given that the production comprises an important contribution to total household consumption. For operational reasons the concept is measured as the number of persons employed (and not the number of jobs) in informal employment in their main job.
As regards (v) above, employees are considered to have informal jobs if their employment relationship is, in law or in practice, not subject to national labour legislation, income taxation, social protection or entitlement to certain employment benefits (e.g., advance notice of dismissal, severance pay, paid annual or sick leave, etc.). The reasons may be the following: non-declaration of the jobs or the employees; casual jobs or jobs of a limited short duration; jobs with hours of work or wages below a specified threshold; employment by unincorporated enterprises or by persons in households; jobs where the employee’s place of work is outside the premises of the employer’s enterprise; or jobs for which labour regulations are not applied, not enforced, or not complied with for any other reason.
Components of informal employment outside the informal sector are: Employees holding informal jobs in formal sector enterprises (FSE); contributing family workers working in (FSE); paid domestic workers employed by households in informal jobs; and own-account workers engaged in production of goods exclusively for own final use by their household. Where they exist, employees holding formal jobs in informal sector enterprises should be excluded from informal employment.
References: see the Resolution concerning statistics of employment in the informal sector adopted by the 15th ICLS (January 1993) and the Guidelines concerning a statistical definition of informal employment adopted by the 17th ICLS (November 2003).