the impact of stress tests on bank lending - fdic: … · · 2017-10-12the impact of stress tests...
TRANSCRIPT
The Impact of Stress Tests on Bank Lending William F. Bassett* Jose M. Berrospide*
Federal Reserve Board Federal Reserve Board
September 1, 2017
Abstract
We investigate one channel through which the annual bank stress tests, as part of the Federal Reserve’s
Comprehensive Capital Analysis and Review (CCAR) review, could unduly curtail the provision of bank
credit, or change the allocation of loan growth in unexpected ways. To quantify the impact of the stress
tests, we construct a measure of the extra capital implied by the supervisory stress tests relative to the level
of capital implied by the banks’ own models, which we call the capital gap. We then study the impact of
the capital gap on the loan growth of BHCs with more than $10 billion in assets. We find no evidence that
the higher capital implied by supervisory stress tests beyond capital levels suggested by the banks’ own
models is unduly restricting loan growth. Consistent with previous results in the bank capital literature, we
find some evidence that among the CCAR banks, more capital is actually associated with higher loan
growth.
JEL Classification Codes: G21, G28
Keywords: bank capital, bank lending, regulatory capital, stress tests
______________________________
* Email: [email protected] and [email protected]. We thank Saleem Bahaj, Eliana Balla, Beverly Hirtle, Lei Li, Ulas Misirli, Ralf Meisenzahl, Mihal Velikov, Cindy Vojtech, and participants at the Federal Reserve Board, Bank of England, Federal Reserve Bank of Richmond, and IFABS 2017 annual meeting for valuable comments. The views expressed are our own and do not necessarily reflect those of the Federal Reserve Board.
2
1. Introduction
The appropriate role and stringency of bank regulation worldwide continue to be highly debated among
academics, regulators, and banking industry representatives. Supervisory stress testing has become a
cornerstone approach to bank regulation and an important component of the post-crisis regulatory reform
in the U.S. (Tarullo, 2014). However, the banking industry and other stakeholders have claimed that the
stress testing exercises are having the unintended effect of limiting credit availability.1 In particular, and
despite its positive effects on the resilience and stability of the financial sector, a new concern has arisen
about whether stress tests might be impairing economic growth by curtailing the supply of bank credit to
households and businesses.
We study whether the capital requirements implicit in the annual stress tests, as part of the
Federal Reserve’s Comprehensive Capital Analysis and Review (CCAR), are restraining the provision of
bank credit to a greater degree than expected or changing the allocation of loan growth in ways that are
unwarranted. To quantify the effect of the additional capital required by the Federal Reserve’s stress tests,
we develop a counterfactual aimed at answering the following question: What would the regulatory
capital ratios look like in the absence of the supervisory stress tests, assuming that banks still used the
results of their own stress tests in their capital planning? To construct this counterfactual measure we
compare the minimum post-stress capital ratios implied by the Fed’s stress tests and the BHC’s own
stress tests, both using the CCAR scenarios. We call this difference the capital gap, which we interpret as
the additional capital that banks hold to comply with the supervisory stress tests relative to the capital
levels implied by their own models. We then study the impact of the capital gap on the loan growth of
BHCs across different loan categories.
We conduct our analysis following two approaches. First, we compare the impact of the capital
gap on the loan growth of the banks subject to the supervisory stress tests (CCAR banks) and the
relatively large regional banks that must run their own stress tests but are not subject to the supervisory
stress tests (non-CCAR banks).2 Supervisory stress tests tend to be more stringent than bank stress tests
1 Some of these quotes point to too much capital being held by banks and thus to the idea that banks could be using that capital to finance the economy. These type of arguments may be misleading as they could suggest that excess capital, which otherwise could be used to extend more credit, is kept as idle cash in banks’ vaults. Capital requirements do not force banks to immobilize capital in their balance sheets. Instead, capital requirements ensure that banks finance new loans with sufficient capital, rather than with less stable sources of funding that could dry up and exacerbate a nascent crisis (e.g. with 7 cents for each dollar of new loans). 2 The non-CCAR BHCs in our sample are the relatively large regional banks with assets between $10 billion and $50 billion. These BHCs are not subject to the Federal Reserve’s stress tests, but the Dodd-Frank Act mandates that they conduct their own annual company-run stress tests, submit their results to their banking regulators (FDIC and
3
and thus, on average, the capital gap is positive among CCAR banks. By construction, the capital gap is
zero for non-CCAR banks. We exploit this variation in our capital gap measure to study the lending
implications of the supervisory stress tests using panel data estimation. Furthermore, we refine this
analysis looking at a sample of banks that eliminates the largest and most complex banks as well as the
smaller regional banks, in order to focus on more comparable banks. That is, the BHCs that mostly
engage in traditional lending and deposit taking operations, and are close to the $50 billion size threshold
for participation in the stress test exercise. In our second approach, we study the impact of the severity of
the stress tests on loan growth among the CCAR banks only. We extend the analysis by examining the
impact of the capital gap on bank lending standards across multiple loan categories using the responses in
the Senior Loan Officer Opinion Survey (SLOOS) for both groups CCAR and non-CCAR banks.
We find no systematic evidence that the extra capital implied by the results of the supervisory
stress tests may be constraining bank loan growth or causing banks to tighten their lending standards. In
our first approach, which compares the loan growth between CCAR and non-CCAR banks, we conclude
that although loan growth by CCAR banks has been slower than loan growth by non-CCAR banks, the
difference in growth for loan categories such as residential and commercial real estate loans as well as
small business loans seems to be driven by factors beyond the stress tests such loan demand, and bank
specific characteristics such as risk aversion, credit quality, and funding sources. After we account for
those factors, we do not find evidence that the capital calculations associated with the supervisory stress
tests explain the loan growth differences. Faster loan growth by smaller non-CCAR banks in general is
not new. These banks had faster loan growth rates between 2001 and 2006 (Vojtech, 2017). In contrast,
and relative to non-CCAR banks, large CCAR banks faced significantly larger loan and securities losses
than non-CCAR banks during the financial crisis as they operated with more fragile funding structures
and vulnerable balance sheets. The crisis experience is another factor that may have contributed to
reshape CCAR banks’ business models and thus to moderate their loan growth during the post-crisis
period, even in the absence of stricter regulation and supervision.
Our results are consistent with previous findings in the academic literature supporting the view
that that more capital is associated with higher loan growth (Bernanke and Loan, 2000; Francis and
Osborne, 2009; Berrospide and Edge, 2010; Carlson, Shan, Warusawitharana, 2013; Chu, Zhang, and
Zhao, 2017). Our interpretation is that the higher capital buffers that result from the new regulatory
framework, which make banks safer and more resilient, altogether put banks in a better position to lend
more, at least across some loan categories. A similar interpretation is consistent with a recent theoretical
OCC) and make their results public (e.g. through their websites). Throughout the paper we use the terms bank and BHC interchangeably.
4
framework developed by Bahaj and Malherbe (2017). These authors show that the relationship between
lending and capital requirements follow a U-shaped pattern, that is, after sufficiently high capital, higher
capital requirements lead banks to increase their lending. This seems to be particularly the case during the
post-crisis period, that is, when banks had enough time to remove their legacy of bad loan portfolios and
thus potential debt overhang issues are less severe. In those cases, banks can enjoy profitable lending
opportunities as the benefit of additional capital (e.g. reduction in the probability of bank default) exceeds
the cost of raising new capital. As we discuss below, before the financial crisis, CCAR banks were
operating with historically lower capital ratios than smaller non-CCAR banks. The implementation of the
stress tests have led the CCAR banks to raise significantly large amounts of capital to meet the stricter
capital requirements which, according to our results, has not restricted but favored their lending capacity
and thus their contribution to the real economy.
The remainder of the paper is organized as follows. Section 2 provides the background on stress
testing in the U.S, section 3 revises the related literature. Section 4 describes our empirical methodology
and section 5 presents our econometric results. Section 6 concludes.
2. Background
Stress tests have become a key macroprudential tool for bank supervisors and regulators worldwide. In
the U.S., The Dodd-Frank Act (DFA) requires the Federal Reserve to conduct annual stress tests of BHCs
with total consolidated assets of at least $50 billion and all nonbank financial institutions designated by
the Financial Stability Oversight Council (FSOC) for Federal Reserve supervision.3 The Federal Reserve
started conducting Dodd-Frank Act supervisory stress tests (DFAST) in 2013 on the 18 largest BHCs that
were subject to the 2009 Supervisory Capital Assessment Program (SCAP). In 2016, 33 BHCs were
subject to DFAST, and that number is projected to increase in the coming years as intermediate holding
companies (IHCs) and other systemically important nonbank financial institutions are incorporated. The
analytical framework developed to conduct DFAST is the basis for the quantitative assessment
component of the Federal Reserve’s Comprehensive Capital Analysis and Review (CCAR) which started
in 2011. CCAR is the annual evaluation of individual BHC’s capital planning processes (risk
management, internal control practices, and planned capital distributions) and includes the quantitative
3 The Dodd Frank Act also mandates that BHCs conduct company-run stress tests using the same supervisory scenarios that the Federal Reserve designs. In addition to these scenarios, each BHC has to conduct a stress test based on its own scenarios, including at least one stress scenario and a baseline scenario. Individual BHCs then submit the results of their baseline scenario using their own planned capital actions and the results of their stress scenario(s) using any alternative capital actions (if applicable).
5
exercise (similar to DFAST, but with different capital distribution assumptions) and a qualitative
assessment.
The supervisory stress testing models developed by the Federal Reserve project losses, revenues,
expenses, and post stress capital ratios for each BHC over a nine-quarter planning horizon and under three
hypothetical scenarios (baseline, adverse, and severely adverse). The severely adverse scenario features a
deep recession in the U.S., characterized by a substantial increase in the unemployment rate, large
declines in asset prices, and increases in risk premia. In calculating post-stress capital ratios, capital
distribution assumptions are different in the DFAST and CCAR exercises. In DFAST, capital
distributions are assumed to be at a level similar to the quarterly average in the previous year (capital
repurchases and stock issuance are assumed to be zero, except for common stock issued as employee
compensation), whereas in CCAR, capital distributions are based on the BHC proposed capital plans.
Furthermore, upon disclosure of results, no specific supervisory actions are attached to DFAST results
beyond the requirement that BHCs take the results into account in their capital planning. However, in
CCAR the Federal Reserve may object to the BHC’s capital plan on either quantitative or qualitative
grounds, and thus may restrict the firm’s capital distributions included in its capital plan.4
Beyond its crucial role in bank supervision and regulation, stress tests are also a key risk
management tool for banks. Banks frequently complain that stress tests are expensive to implement, and
the exercise is usually seen by banks as another (more binding) capital requirement. However, stress tests
provide banks the correct incentives to monitor the risks inherent to their business in a forward-looking
basis and may also encourage them to undertake better risk measurement and management practices, and
to keep well-organized data and expertise to project revenues and losses under alternatives scenarios
(Liang, 2017).
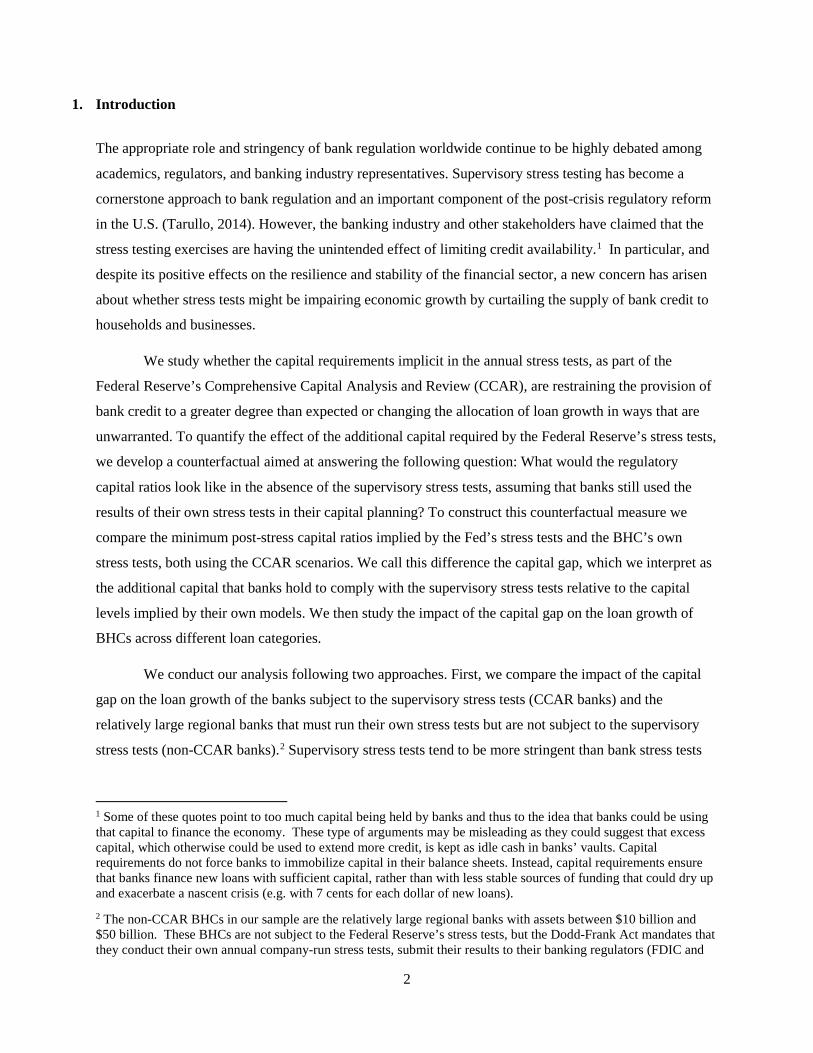
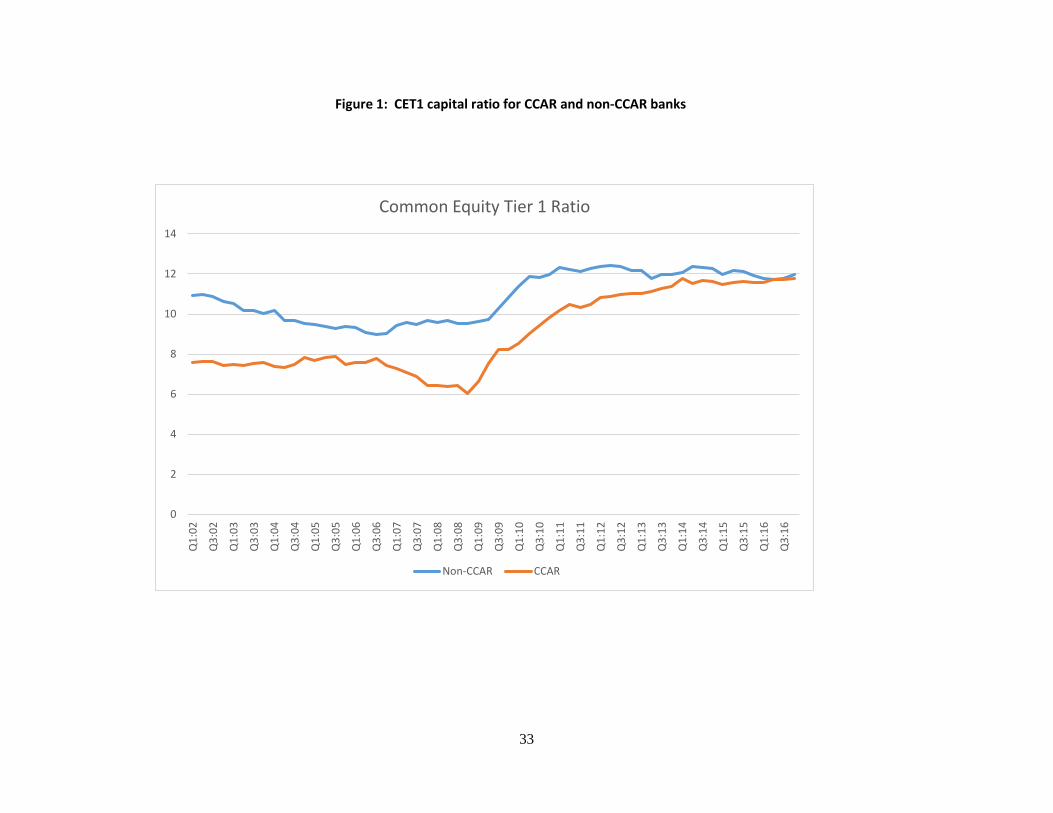
The implementation of supervisory stress tests has significantly improved the resilience of the
financial sector. By requiring the largest and complex BHCs to operate with sufficient capital to withstand
periods of severe financial and economic stress, and thus to continue functioning as viable financial
intermediaries, the supervisory stress tests have reduced systemic risks in the financial system (Tarullo,
2014). As shown in Figure 1, the largest banks historically have funded their balance sheets with less
capital than smaller banks. But, this difference in capital has narrowed recently, as the banks subject to
the supervisory stress tests (CCAR banks) have more than doubled their high-quality capital (e.g.
4 More specifically, the Federal Reserve could require the company to stop dividend payments and share repurchases entirely or could permit these actions within certain bounds. In general, in CCAR all participating BHCs receive extensive supervisory feedback on their capital planning processes, including identification of areas that require improvement (Hirtle and Lehnert, 2015).
6
Common Equity Tier 1 capital) ratios over the past seven years, converging to the capital levels
maintained by smaller banks (non-CCAR banks).
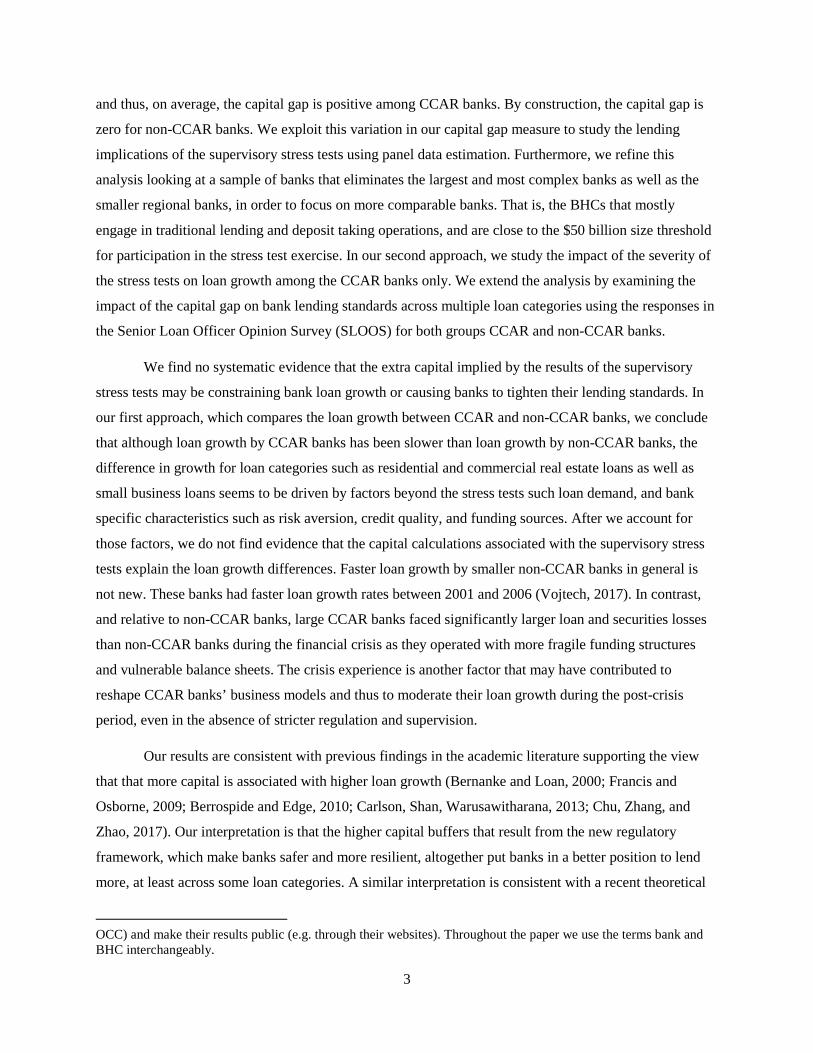
Stress tests may also influence banks’ decisions about the quantity or type of credit that they
extend, and that could have unintended consequences. One possible unintended consequence is that the
inclusion of certain salient risks in the scenarios could lead to less favorable credit allocation decisions,
because in adjusting their balance sheet to reduce projected losses, banks may end up reducing the credit
supply, for example to sectors with rapid debt growth.5 This is a concern recently highlighted by banking
industry representatives and other policymakers, and is part of the motivation for our study. Figure 2
shows the differences in loan growth between CCAR and non-CCAR banks over the past 6 years. Recent
loan growth at (large) CCAR banks has been slower than loan growth at their (small) non-CCAR
counterparts across different loan categories. Differences in loan growth are more evident for commercial
real estate (CRE), residential real estate (RRE) and small business loans, whereas the lending path for
consumer and industrial (C&I) and consumer loans look similar between the two groups of banks.
Differences in loan growth may be explained by factors beyond regulation and stress tests such as
changes in business models, credit quality, risk aversion, and different crisis experience. Moreover, faster
loan growth by smaller banks in general is not new. On the one hand, these banks also had faster growth
rates between 2001 and 2006 (Vojtech, 2017). On the other hand, given their complexity and
interconnectedness, CCAR banks had more fragile funding structures and vulnerable balance sheets, and
faced significantly larger loan and securities losses than non-CCAR banks during the financial crisis. This
crisis experience may have reshaped CCAR banks’ business models and thus may have moderated their
loan growth in the post-crisis period even in the absence of new regulations or heightened supervision.
Furthermore, slower loan growth at some large banks and across certain loan types may be consistent
with the macroprudential objective of having banks internalize whether the loans that they are extending
remain sustainable through an economic downturn. As we show below, after accounting for these
additional factors we do not find systematic evidence that supervisory capital stress tests unduly restrict
bank credit supply.
3. Related literature
Our paper is related to the two strands of the literature studying the relationship between bank capital and
lending. The first strand considers the impact of minimum capital requirements on bank credit supply.
5 As Liang (2017) points out, a current practice within the Fed’s stress tests that may prevent this unintended risk from materializing is that supervisory scenarios with salient risks vary over time.

7
Empirical work in this literature finds that changes in minimum capital requirements reduce bank lending
(Brinkmann and Horvitz 1995, Peek and Rosengreen 1997, Gambacorta and Mistrulli 2004, Aiyar,
Calomiris, and Wieladek 2014, Mésonnier and Monks 2015, and Berrospide and Edge, 2017). Estimates
of the impact of a one percentage point increase in capital requirements on loan growth over a one-year
horizon range widely and show reductions in lending between 1 to 10 basis points and/or changes in
interest rates faced by borrowers of between +3 and -15 basis points. The second strand considers the
impact of bank capital more generally on lending. Empirical papers in this strand of the literature find a
positive relationship of bank capital (and capital ratios) on lending, though the estimates of the size of the
effect are also less clear. For example, Bernanke and Lown (1999) find sizable effects for the lending of
U.S. banks in the early 1990s, whereas Francis and Osborne (2009) for U.K. banks and Berrospide and
Edge (2010), and Carlson, Shan, and Warusawitharana (2013) for U.S. banks find modest effects using
more recent data.
The implication of the positive impact of capital on loan growth is consistent with the former
result of a negative effect of higher capital requirements as raising capital requirements relative to
existing capital ratios would lower lending, all else equal. Thus, combining these strands of research, the
important financial stability implication is that banks with large buffers of capital relative to their
regulatory minimums are most likely to maintain credit supply through a downturn. Ensuring that banks
maintain a buffer over the regulatory minimum even during a protracted and severe downturn is precisely
the goal of the stress tests.
More recent empirical papers in this literature take advantage of the availability of micro, loan-
level data of the largest U.S. BHC collected for supervisory purposes. Calem, Correa, and Lee (2017)
study the impact of prudential policies on the credit supply of U.S, banks. In particular, they examine the
impact of CCAR stress tests on the jumbo mortgage market, the impact of the interagency guidance on
leverage lending (IGLL), and the follow-up publication by supervisors of Frequently Asked Questions
(FAQ) on the guidance related to syndicated loan markets. They find that the 2011 CCAR stress test
exercise reduced jumbo mortgage originations and approval rates, possibly due to the generally-weak
capital positions at CCAR banks. Their findings indicate that while the IGLL, which sets minimum
standards for safe and sound practices of supervised institutions, had no impact on speculative-grade loan
originations, the publication of the FAQs in 2014 led to a significant decline in banks’ originations of
speculative loans.
On a similar vein, Berrospide and Edge (2017) examine the impact of the U.S. post-crisis
regulatory reform on the lending of both BHCs subject to the Basel III capital standards and the largest
BHCs subject to the CCAR stress tests. Using matched firm-level data across the largest banks to separate
the impact of credit supply shocks implied by the supervisory stress tests from loan demand changes at
8
the firm level, they find that the unanticipated reduction in regulatory capital implied by the stress tests,
made public for the first time in the 2012 CCAR exercise, led to a significant reduction in C&I lending.
Similarly, and using a separate analysis on smaller banks subject to Basel III capital rules, they find that
that the reduction in capital implicit in the announcement of Basel III rules in June 2012 and July 2013
led to a reduction in lending across multiple loan categories.
Our paper is also related to recent work analyzing specifically the impact of stress tests on bank
lending. Acharya, Berger and Roman (2017) study the lending implications of the U.S. supervisory stress
tests. Using micro-level data for syndicated loans, the authors find that stress-tested banks reduce credit
supply to manage their credit risk. The effect seems stronger for riskier borrowers, safer banks, banks that
pass the stress tests, and the earlier stress tests. Similarly, using micro-level data from syndicated loan
markets Chu, Zhang, and Zhao (2017) find a positive relationship between bank capital and lending.
Our paper also examines the lending implications of the Fed’s stress tests but rather than looking at banks
that pass or fail the stress tests, we examine the implications of the higher capital implied by the stress test
relative to the level of capital in the banks’ own stress tests. Another important difference with their paper
is that we follow a broader approach by studying the lending implications of stress tests on different loan
categories.
Another closely related work to ours is the recent research note by The Clearing House (TCH),
which also considers the impact of the Fed’s stress tests on bank lending and argues that the stress tests
impose granular capital requirements that force banks to curtail and distort the provision of credit. The
note points specifically to adverse effects of the stress tests on residential mortgages and small business
loans. The TCH note derives implicit risk weights for different asset classes by comparing the post-stress
capital ratios produced by the supervisory stress tests and the banks’ own stress tests. However, this
interpretation of the post-stress capital ratios as implicit risk weights for individual loan categories fails to
account for the differential revenue generated by different loan categories. We also compare post-stress
capital ratios between the Fed’s and the banks’ stress tests to construct a measure of the extra capital
(capital gap) that banks have to hold to meet the capital requirements implied by the stress test exercise.
Our findings, however, suggest that the larger capital implied by the stress tests, rather than restraining,
may actually be boosting bank lending for certain types of loans. Unlike the TCH note, we examine the
determinants of bank loan growth across different loan categories and account for differences in risk
characteristics. This omission on the TCH note could be particularly problematic for their conclusion on
residential mortgage lending since part of the reduction in residential mortgage lending may be explained
by conservative lending practices in light of remaining credit quality issues, given that a number of banks
still face large delinquency rates on legacy portfolios of mortgages during our sample period.

9
4. Methodology
4.1 Regulatory capital ratios in the absence of stress tests
As noted above, we assess the impact of stress tests on BHC lending by developing a counterfactual
aimed at answering the following question: What would regulatory capital ratios look like in the absence
of the supervisory stress tests? Because stress testing has become a best practice in risk management, we
assume that banks would still be required by regulators to run their own stress tests and to use the results
in their risk management framework. According to claims in recent commentary from politicians and
banking industry representatives, the banks would indeed heed the capital ratios determined by the banks’
own models.6 To maintain comparability, we use the results of the bank-run stress tests using the Fed’s
CCAR scenarios.
Thus, using publicly available data, we construct the counterfactual by comparing the minimum
capital ratios in the supervisory and the BHC’s own stress test exercises.7 We call this difference the
“capital gap”. This capital gap can be thought of as the regulatory capital buffer (e.g. extra capital) that
each BHC holds over the capital estimated using their models, as a result of the supervisory stress tests
being more stringent.8 Thus, the capital gap represents the capital ratio that banks would hold if no
supervisory stress testing were required. The counterfactual, that is, the capital ratios in the absence of the
Fed’s stress tests, is then calculated as the difference between the actual capital ratio (Common Equity
Tier 1 or CET1 capital ratio) at the start of the stress test exercise and the capital gap.
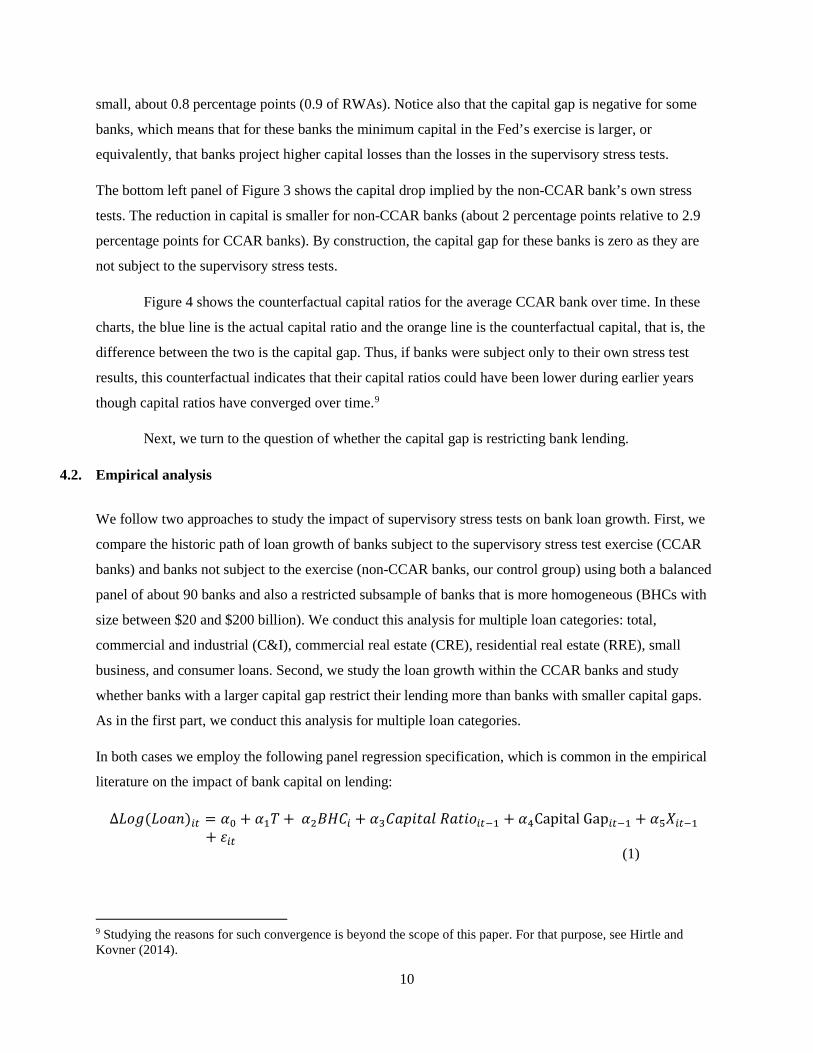
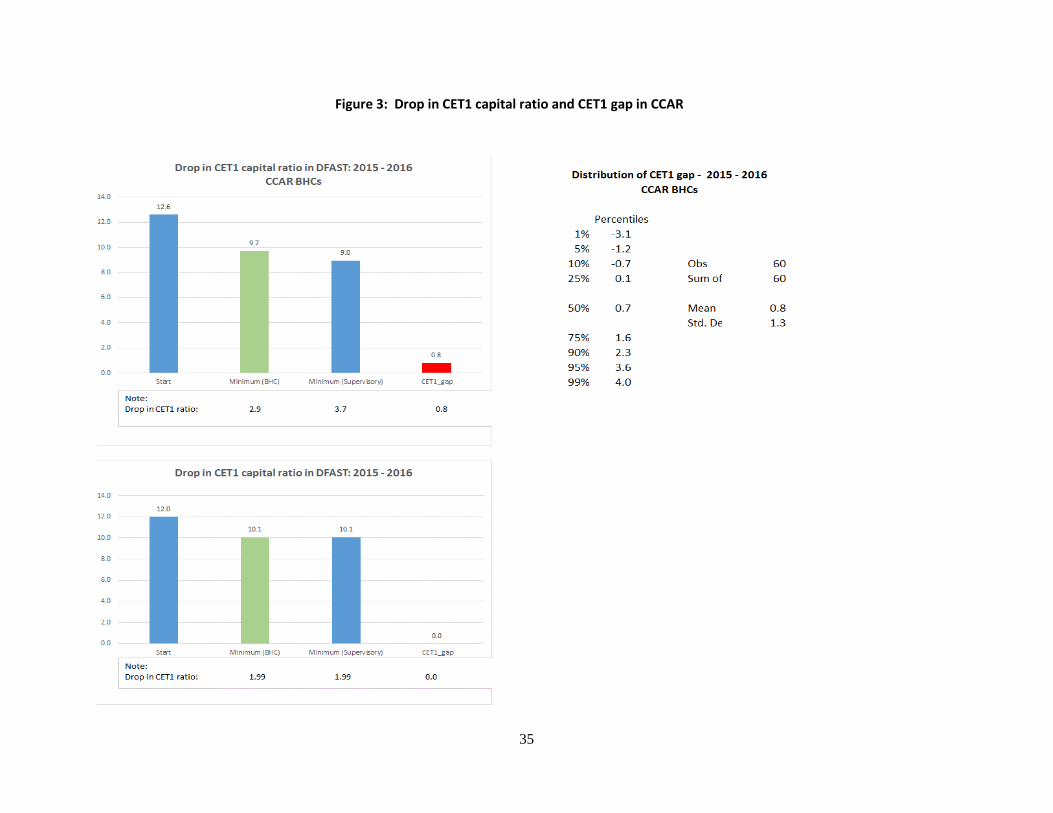
Figure 3 illustrates the calculation of the capital gap for the CCAR banks. The top left chart
shows the average drop in the CET1 capital ratio implied by both the supervisory and the BHC’s own
exercises. As shown in the figure, the supervisory exercise seems more severe as, on average, the implied
capital drop is larger than in the banks’ stress tests, or equivalently, banks estimate higher post-stress
CET1 ratios in their exercise. The capital gap (CET1 gap), shown as the red bar, is the difference between
the minimum ratios in the supervisory and the BHC’s exercises. The chart on the top left depicts the
distribution of the CET1 gap for the CCAR banks between 2015 and 2016. The capital gap is relatively
6 For example, during Chair Yellen’s Congressional Testimony on February 14, 2017, Senator Toomey argued that CCAR may be somewhat duplicative considering that banks do their own stress testing. 7 Notice that the minimum capital ratios in both exercises are comparable as they are both intended to meet the DFA requirements. For example, in the Fed’s exercise and the BHC’s exercise capital ratios are calculated using the same individual capital distribution assumptions (e.g. DFAST) under the same supervisory scenarios published by the Federal Reserve.
8 Flannery, Hirtle, and Kovner (2016) use a relatively similar idea of a gap between the Federal Reserve’s and each BHC’s projected loan losses and pre-tax net income. Using data between 2013 through 2015, they report insignificant coefficients in a regression of the growth rate of different loan categories on these gap measures.
10
small, about 0.8 percentage points (0.9 of RWAs). Notice also that the capital gap is negative for some
banks, which means that for these banks the minimum capital in the Fed’s exercise is larger, or
equivalently, that banks project higher capital losses than the losses in the supervisory stress tests.
The bottom left panel of Figure 3 shows the capital drop implied by the non-CCAR bank’s own stress
tests. The reduction in capital is smaller for non-CCAR banks (about 2 percentage points relative to 2.9
percentage points for CCAR banks). By construction, the capital gap for these banks is zero as they are
not subject to the supervisory stress tests.
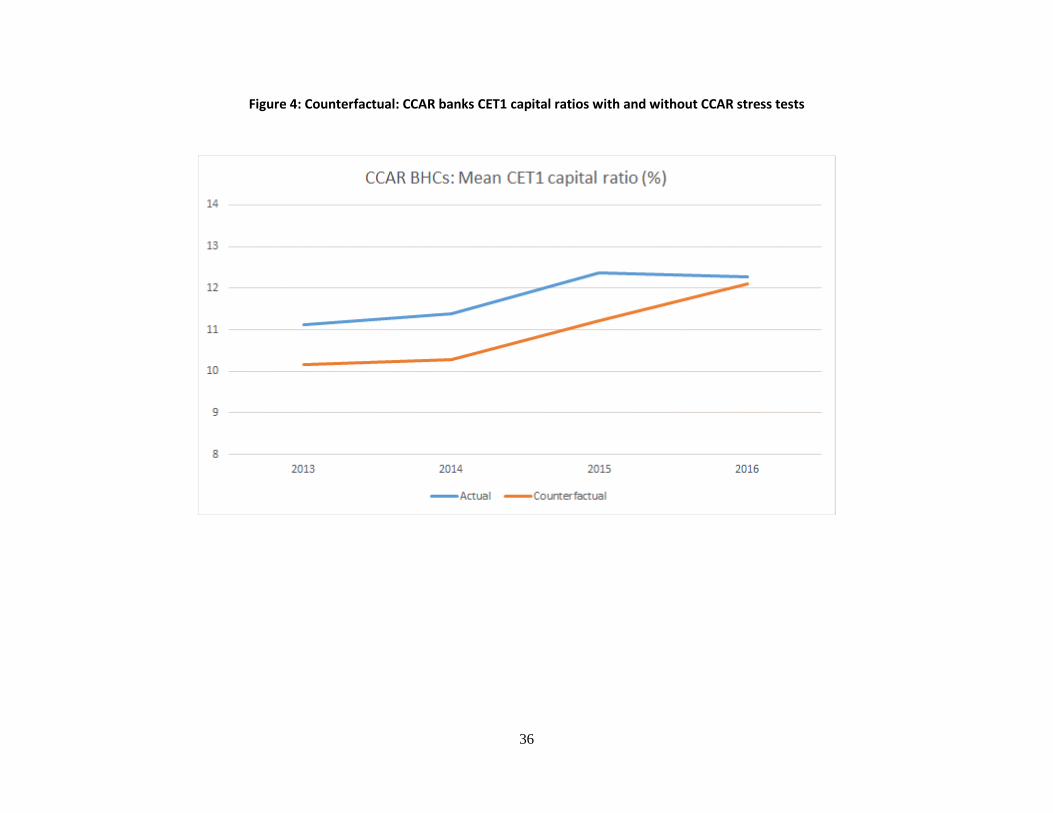
Figure 4 shows the counterfactual capital ratios for the average CCAR bank over time. In these
charts, the blue line is the actual capital ratio and the orange line is the counterfactual capital, that is, the
difference between the two is the capital gap. Thus, if banks were subject only to their own stress test
results, this counterfactual indicates that their capital ratios could have been lower during earlier years
though capital ratios have converged over time.9
Next, we turn to the question of whether the capital gap is restricting bank lending.
4.2. Empirical analysis
We follow two approaches to study the impact of supervisory stress tests on bank loan growth. First, we
compare the historic path of loan growth of banks subject to the supervisory stress test exercise (CCAR
banks) and banks not subject to the exercise (non-CCAR banks, our control group) using both a balanced
panel of about 90 banks and also a restricted subsample of banks that is more homogeneous (BHCs with
size between $20 and $200 billion). We conduct this analysis for multiple loan categories: total,
commercial and industrial (C&I), commercial real estate (CRE), residential real estate (RRE), small
business, and consumer loans. Second, we study the loan growth within the CCAR banks and study
whether banks with a larger capital gap restrict their lending more than banks with smaller capital gaps.
As in the first part, we conduct this analysis for multiple loan categories.
In both cases we employ the following panel regression specification, which is common in the empirical
literature on the impact of bank capital on lending:
∆𝐿𝐿𝐿𝐿𝐿𝐿(𝐿𝐿𝐿𝐿𝐿𝐿𝐿𝐿)𝑖𝑖𝑖𝑖 = 𝛼𝛼0 + 𝛼𝛼1𝑇𝑇 + 𝛼𝛼2𝐵𝐵𝐵𝐵𝐵𝐵𝑖𝑖 + 𝛼𝛼3𝐵𝐵𝐿𝐿𝐶𝐶𝐶𝐶𝐶𝐶𝐿𝐿𝐶𝐶 𝑅𝑅𝐿𝐿𝐶𝐶𝐶𝐶𝐿𝐿𝑖𝑖𝑖𝑖−1 + 𝛼𝛼4Capital Gap𝑖𝑖𝑖𝑖−1 + 𝛼𝛼5𝑋𝑋𝑖𝑖𝑖𝑖−1+ 𝜀𝜀𝑖𝑖𝑖𝑖
(1)
9 Studying the reasons for such convergence is beyond the scope of this paper. For that purpose, see Hirtle and Kovner (2014).

11
The dependent he dependent variable is the annual growth rate of loans of BHC i in year t, expressed as a
function of bank capital (e.g. regulatory capital ratios) and other bank controls. To address the concern of
whether stress tests may restrict loan growth we employ our counterfactual and decompose the actual
regulatory capital ratio into the Capital Ratio (CET1 ratio) of each BHC at the beginning of the stress test
(according to their own models) and the Capital Gap, also measured at the beginning of the stress test
exercise. These two are the main variables of interest in our analysis. We include lagged bank-specific
controls in vector Xit-1, which include size (log of total assets), the ratio of nonperforming loans to total
loans (and, alternatively, net charge-offs to total assets ratio), return on assets (ROA), and the share of
deposits in total assets. In our first approach, we also include both bank fixed effects to account for time-
invariant and unobserved heterogeneity across banks and time dummies (T) to account for time effects in
lending, such as seasonal effects or any other macroeconomic changes that affect all banks equally and
simultaneously (e.g. loan demand changes), respectively.
Notice that we use roughly the same regression specification to study loan growth determinants
across different loan categories. This may be a limitation as other factors specific to each loan type may
not be captured in our regression analysis and this may lead to potential omitted variable problems. Bank
fixed effects should help ameliorate this concern, in cases where banks specialized in different loan types.
Some bank controls in the regression such as the nonperforming loan ratio (and net charge-offs ratio) are
calculated for different loan categories, which also helps to alleviate the concern.
Notice also that in our first approach the capital gap is zero for non-CCAR banks and thus
captures the impact of supervisory stress tests on loan growth. In our second approach, we exploit the
heterogeneity in the capital gap measure to capture the impact of the severity of the supervisory stress
tests on individual CCAR-banks. Our regression analysis under this approach is somewhat constrained by
the number of observations as we have data for about 30 BHCs during 4 years (about 102 observations).
For that reason, our specification will still include year fixed effects but not firm fixed effects.
We expect a positive coefficient on the capital ratio and a negative coefficient on the capital gap
if the claims that stress tests may be restricting bank lending are correct.
4.3 Data and Summary Statistics
We use publicly available data for our empirical analysis. We collect annual balance sheet information
from regulatory filings (FR-Y9C) for BHCs with total assets of at least $10 billion, as these are the firms
subject to stress tests requirements mandated by the Dodd Frank Act. We combine this information with
data on both supervisory stress tests results from the Federal Reserve’s DFAST disclosure documents for

12
2013 through 2016, and bank’s own stress tests results for both CCAR and non-CCAR banks.10 We
control for mergers and acquisitions and also winsorize our data at the 1st and 99th percentiles to deal
with potential outliers. After some data cleaning we end up with 288 observations for 91 BHCs.11
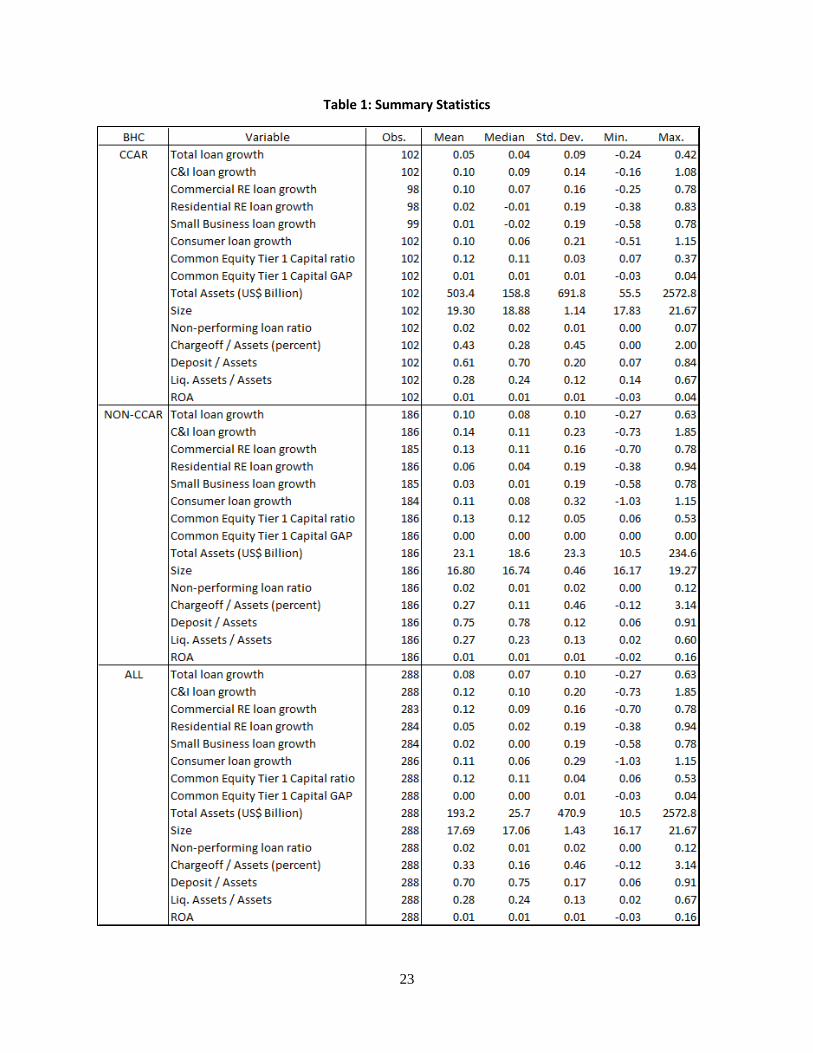
Table 1 provides summary statistics for the variables in our regression analysis and for 31 CCAR
and 60 non-CCAR banks. As seen in this table, CCAR banks are the largest and most complex U.S.
BHCs (about $500 billion in total assets for the median bank). Compared to their non-CCAR
counterparts, CCAR banks hold slightly smaller capital ratios (CET1 capital ratio) and on average exhibit
smaller annual loan growth rates (measured as the log change in outstanding amounts) in total loans (5
percent versus 10 percent) and across different loan categories. The average CCAR bank also exhibits
larger net charge-offs (0.43 percent) than non-CCAR banks (0.27 percent) and lower share of deposits
funding total assets (61 percent) relative to their non-CCAR counterparts (75 percent). There are not
significant differences between the two groups in terms of liquid assets and return on assets (ROA).
4.4 Univariate Analysis
We start investigating the impact of stress tests on the lending of banks by comparing the annual loan
growth between 2013 and 2016 for different loan categories: commercial and Industrial (C&I),
commercial real estate (CRE), residential real estate (RRE), small business, and consumer loans for both
CCAR and non-CCAR banks and also by splitting them into groups based on complexity measures and
existing regulatory capital ratios.
Table 2 shows these results. The top left panel shows the comparison between the CCAR banks
and non-CCAR banks. Non-CCAR banks have slightly higher capital ratios than CCAR banks and the
growth rate of total loans for these banks doubles that of their CCAR counterparts, a statistically
significant difference. The non-CCAR banks also exhibit faster growth in each of the disaggregated loan
categories, consistent with Figure 2, but these differences in loan growth are not statistically significant.
Thus, the more highly capitalized regional banks exhibited faster loan growth.
The other 3 panels in Table 2 examine loan growth differences across different bank groups
within the 31 CCAR banks. The top right panel compares the average loan growth rates between the
10 Supervisory stress tests results (DFAST) are available at the Federal Reserve’s website: https://www.federalreserve.gov/supervisionreg/dfa-stress-tests.htm. Despite the fact that we refer to banks subject to the supervisory stress tests as CCAR BHCs, we use DFAST and not CCAR post-stress capital ratios as banks only disclose publicly their DFAST capital ratios. Furthermore, we restrict our analysis to this four-year period as DFAST results have been publicly available only since 2013.
11 Of the 33 CCAR BHCs in 2016, we exclude 2 custodian banks with minimal lending exposures.
13
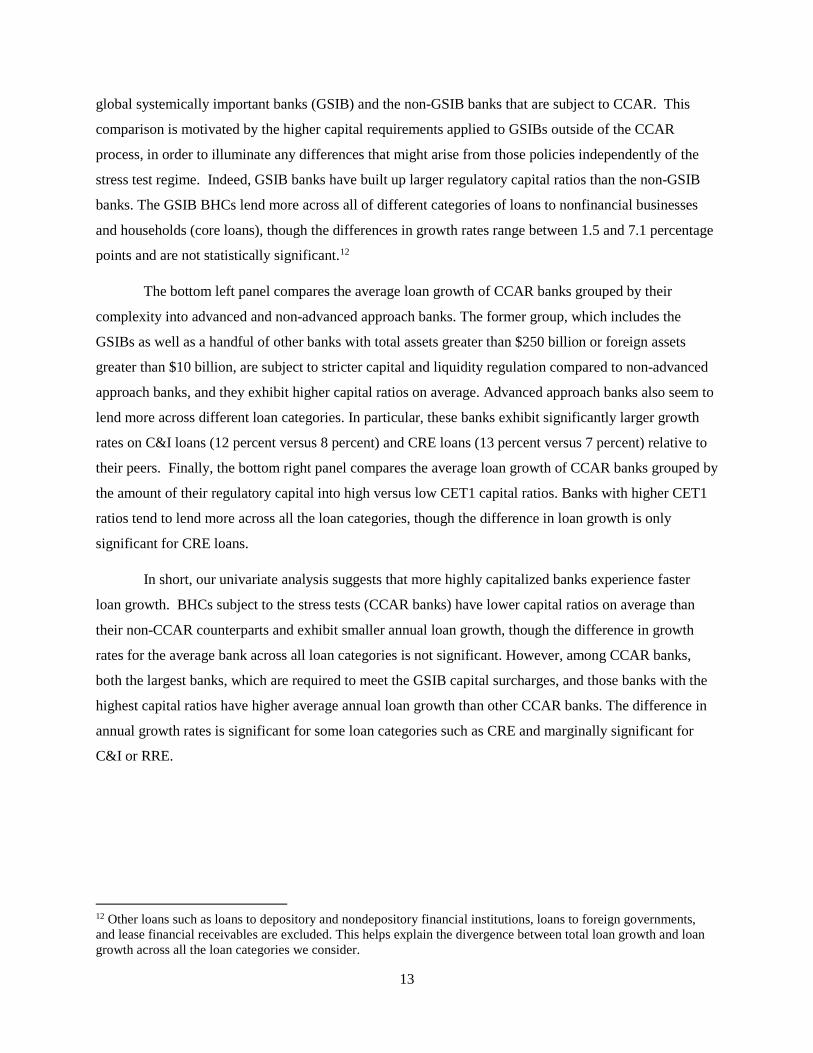
global systemically important banks (GSIB) and the non-GSIB banks that are subject to CCAR. This
comparison is motivated by the higher capital requirements applied to GSIBs outside of the CCAR
process, in order to illuminate any differences that might arise from those policies independently of the
stress test regime. Indeed, GSIB banks have built up larger regulatory capital ratios than the non-GSIB
banks. The GSIB BHCs lend more across all of different categories of loans to nonfinancial businesses
and households (core loans), though the differences in growth rates range between 1.5 and 7.1 percentage
points and are not statistically significant.12
The bottom left panel compares the average loan growth of CCAR banks grouped by their
complexity into advanced and non-advanced approach banks. The former group, which includes the
GSIBs as well as a handful of other banks with total assets greater than $250 billion or foreign assets
greater than $10 billion, are subject to stricter capital and liquidity regulation compared to non-advanced
approach banks, and they exhibit higher capital ratios on average. Advanced approach banks also seem to
lend more across different loan categories. In particular, these banks exhibit significantly larger growth
rates on C&I loans (12 percent versus 8 percent) and CRE loans (13 percent versus 7 percent) relative to
their peers. Finally, the bottom right panel compares the average loan growth of CCAR banks grouped by
the amount of their regulatory capital into high versus low CET1 capital ratios. Banks with higher CET1
ratios tend to lend more across all the loan categories, though the difference in loan growth is only
significant for CRE loans.
In short, our univariate analysis suggests that more highly capitalized banks experience faster
loan growth. BHCs subject to the stress tests (CCAR banks) have lower capital ratios on average than
their non-CCAR counterparts and exhibit smaller annual loan growth, though the difference in growth
rates for the average bank across all loan categories is not significant. However, among CCAR banks,
both the largest banks, which are required to meet the GSIB capital surcharges, and those banks with the
highest capital ratios have higher average annual loan growth than other CCAR banks. The difference in
annual growth rates is significant for some loan categories such as CRE and marginally significant for
C&I or RRE.
12 Other loans such as loans to depository and nondepository financial institutions, loans to foreign governments, and lease financial receivables are excluded. This helps explain the divergence between total loan growth and loan growth across all the loan categories we consider.
14
5. Econometric Results
5.1 Comparing loan growth between CCAR and Non-CCAR banks
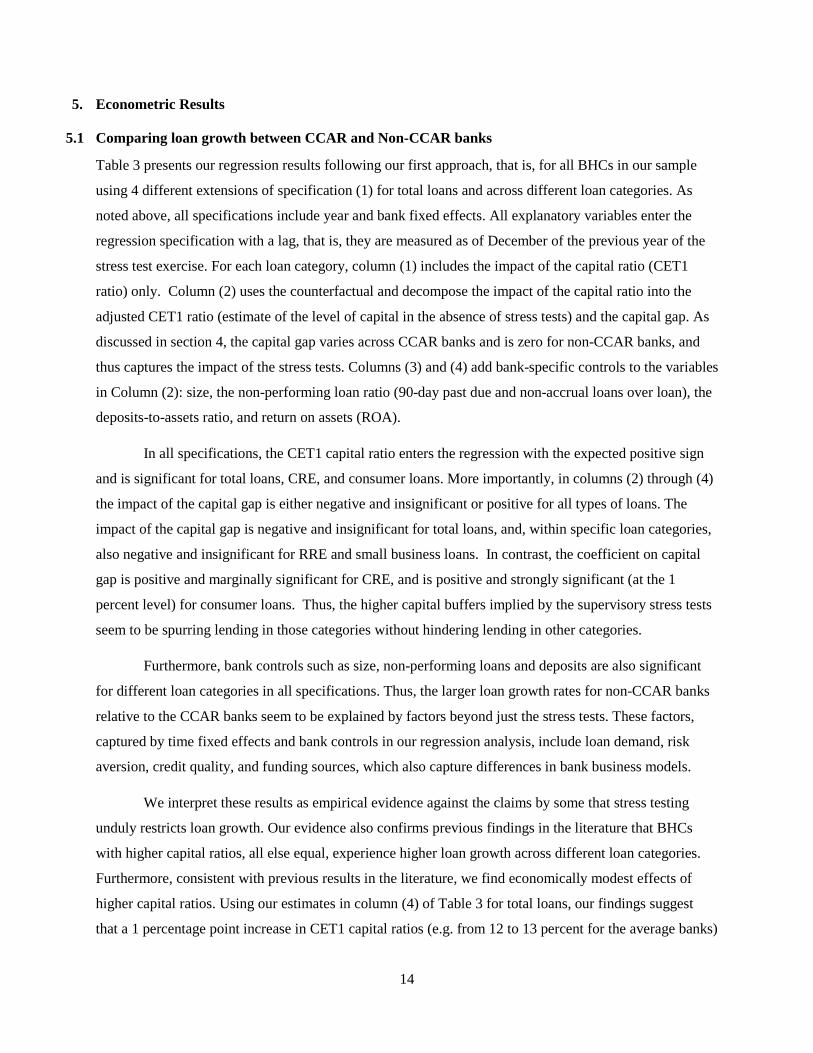
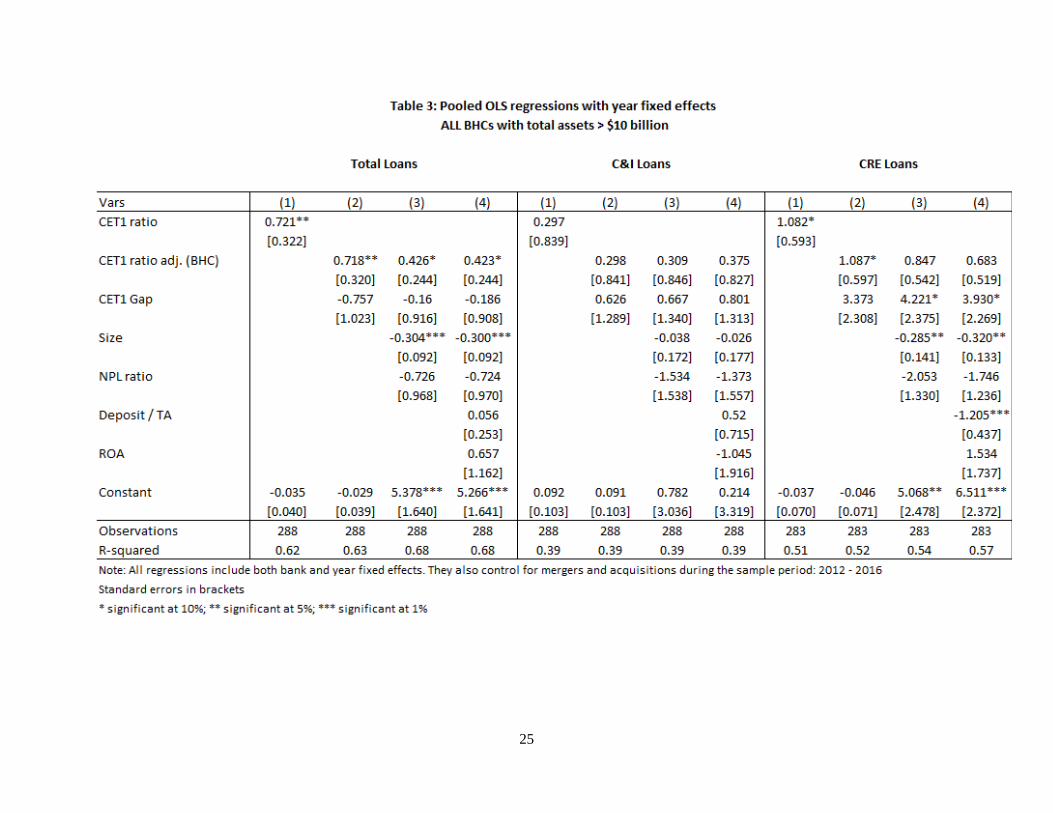
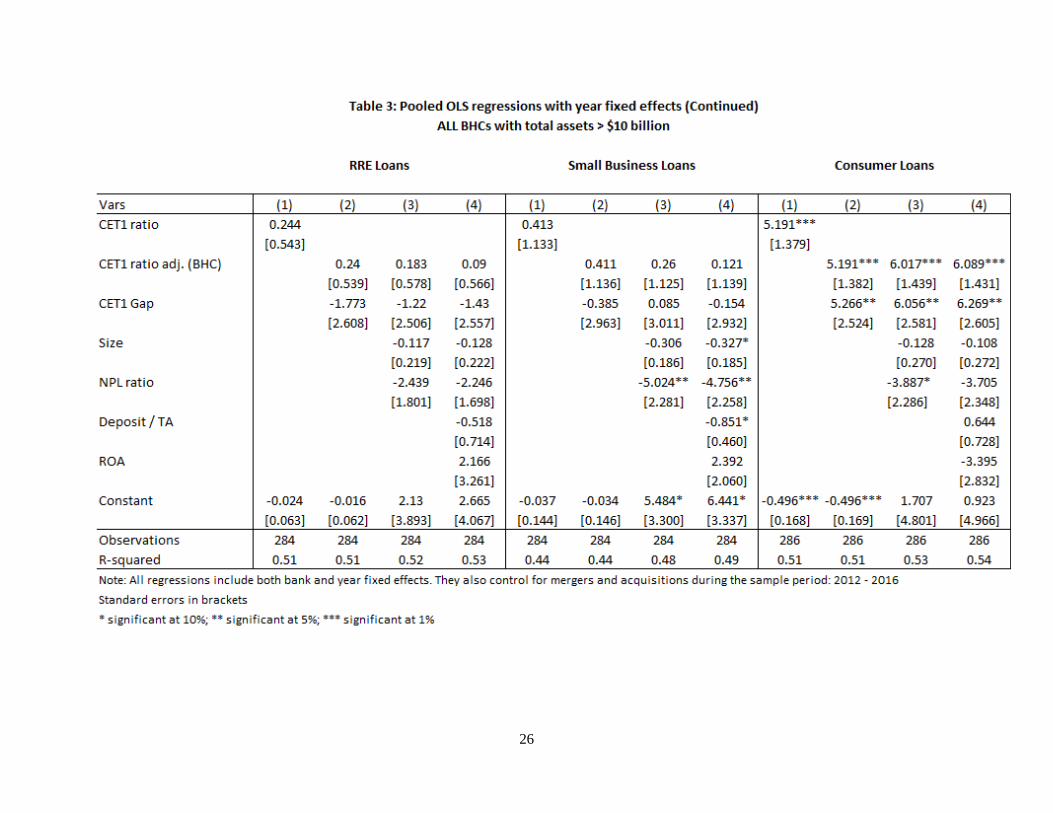
Table 3 presents our regression results following our first approach, that is, for all BHCs in our sample
using 4 different extensions of specification (1) for total loans and across different loan categories. As
noted above, all specifications include year and bank fixed effects. All explanatory variables enter the
regression specification with a lag, that is, they are measured as of December of the previous year of the
stress test exercise. For each loan category, column (1) includes the impact of the capital ratio (CET1
ratio) only. Column (2) uses the counterfactual and decompose the impact of the capital ratio into the
adjusted CET1 ratio (estimate of the level of capital in the absence of stress tests) and the capital gap. As
discussed in section 4, the capital gap varies across CCAR banks and is zero for non-CCAR banks, and
thus captures the impact of the stress tests. Columns (3) and (4) add bank-specific controls to the variables
in Column (2): size, the non-performing loan ratio (90-day past due and non-accrual loans over loan), the
deposits-to-assets ratio, and return on assets (ROA).
In all specifications, the CET1 capital ratio enters the regression with the expected positive sign
and is significant for total loans, CRE, and consumer loans. More importantly, in columns (2) through (4)
the impact of the capital gap is either negative and insignificant or positive for all types of loans. The
impact of the capital gap is negative and insignificant for total loans, and, within specific loan categories,
also negative and insignificant for RRE and small business loans. In contrast, the coefficient on capital
gap is positive and marginally significant for CRE, and is positive and strongly significant (at the 1
percent level) for consumer loans. Thus, the higher capital buffers implied by the supervisory stress tests
seem to be spurring lending in those categories without hindering lending in other categories.
Furthermore, bank controls such as size, non-performing loans and deposits are also significant
for different loan categories in all specifications. Thus, the larger loan growth rates for non-CCAR banks
relative to the CCAR banks seem to be explained by factors beyond just the stress tests. These factors,
captured by time fixed effects and bank controls in our regression analysis, include loan demand, risk
aversion, credit quality, and funding sources, which also capture differences in bank business models.
We interpret these results as empirical evidence against the claims by some that stress testing
unduly restricts loan growth. Our evidence also confirms previous findings in the literature that BHCs
with higher capital ratios, all else equal, experience higher loan growth across different loan categories.
Furthermore, consistent with previous results in the literature, we find economically modest effects of
higher capital ratios. Using our estimates in column (4) of Table 3 for total loans, our findings suggest
that a 1 percentage point increase in CET1 capital ratios (e.g. from 12 to 13 percent for the average banks)
15
leads to a 0.4 percentage point increase in total annual loan growth (e.g. from 8 to 8.4 percent for the
average bank). The effect seems significantly larger for consumer loans (about 6 percentage points).
One potential drawback in this analysis is that the CCAR and non-CCAR bank comparison may
be less relevant for the largest CCAR banks. In other words, the CCAR bank group includes the largest
and most complex banks (e.g. GSIB), whose size and business models are very different than those of the
smaller and less complex non-CCAR banks. In order to alleviate this concern, we extend our analysis by
looking only at the subset of banks that are most similar in size and business models, that is, the sample of
BHCs with total consolidated assets between $20 and $200 billion.13
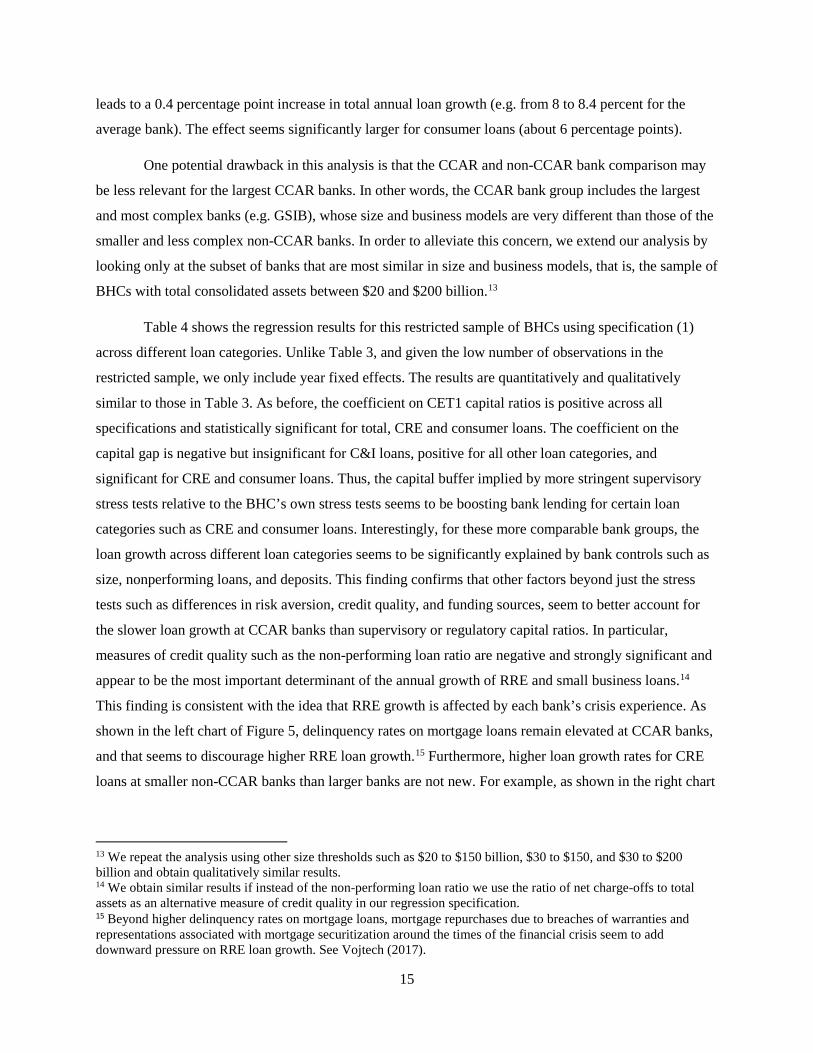
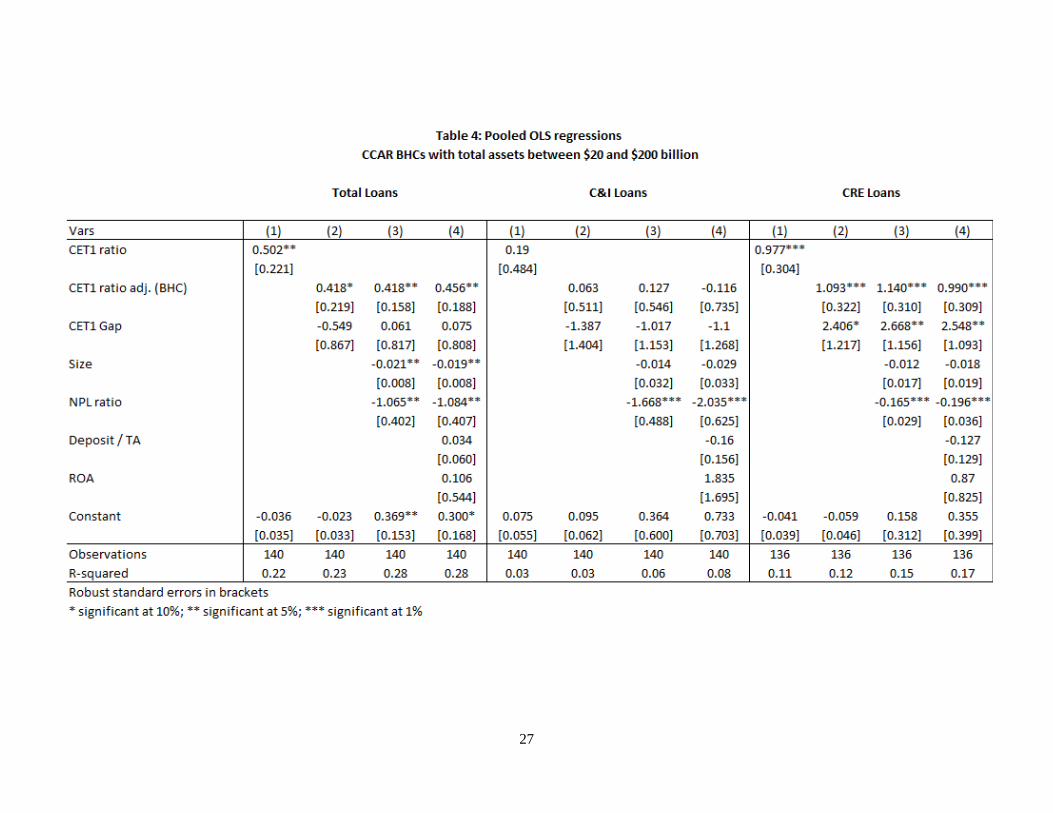
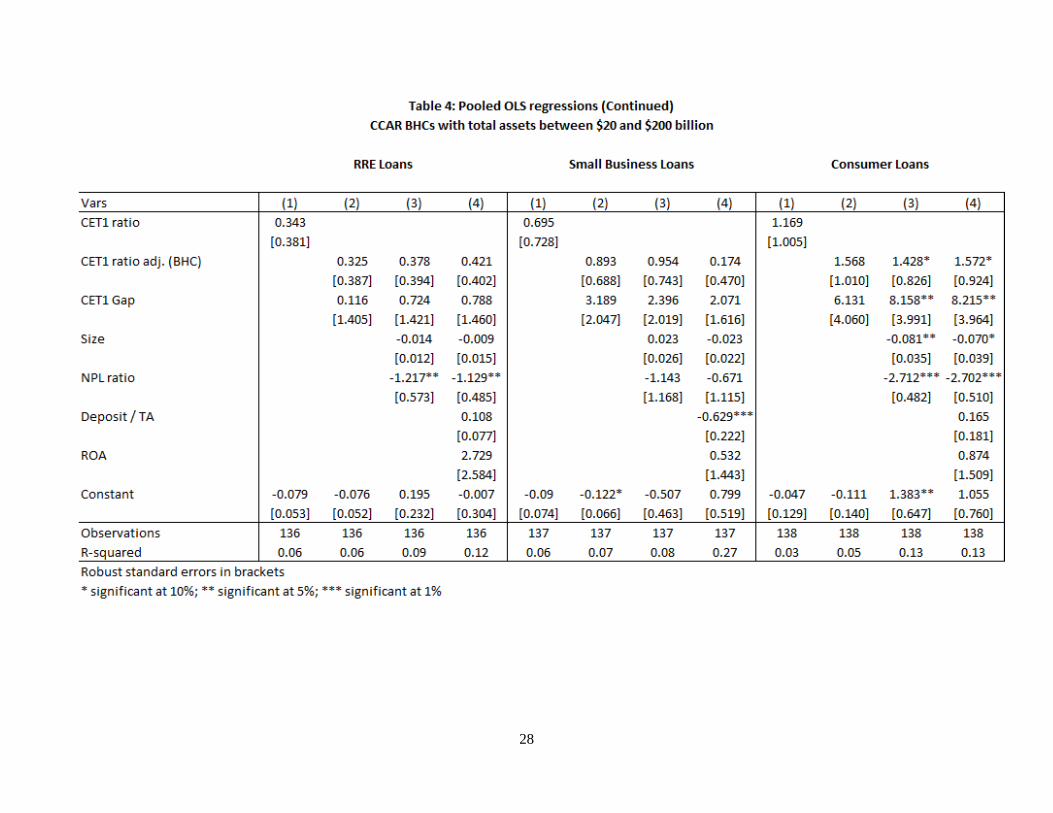
Table 4 shows the regression results for this restricted sample of BHCs using specification (1)
across different loan categories. Unlike Table 3, and given the low number of observations in the
restricted sample, we only include year fixed effects. The results are quantitatively and qualitatively
similar to those in Table 3. As before, the coefficient on CET1 capital ratios is positive across all
specifications and statistically significant for total, CRE and consumer loans. The coefficient on the
capital gap is negative but insignificant for C&I loans, positive for all other loan categories, and
significant for CRE and consumer loans. Thus, the capital buffer implied by more stringent supervisory
stress tests relative to the BHC’s own stress tests seems to be boosting bank lending for certain loan
categories such as CRE and consumer loans. Interestingly, for these more comparable bank groups, the
loan growth across different loan categories seems to be significantly explained by bank controls such as
size, nonperforming loans, and deposits. This finding confirms that other factors beyond just the stress
tests such as differences in risk aversion, credit quality, and funding sources, seem to better account for
the slower loan growth at CCAR banks than supervisory or regulatory capital ratios. In particular,
measures of credit quality such as the non-performing loan ratio are negative and strongly significant and
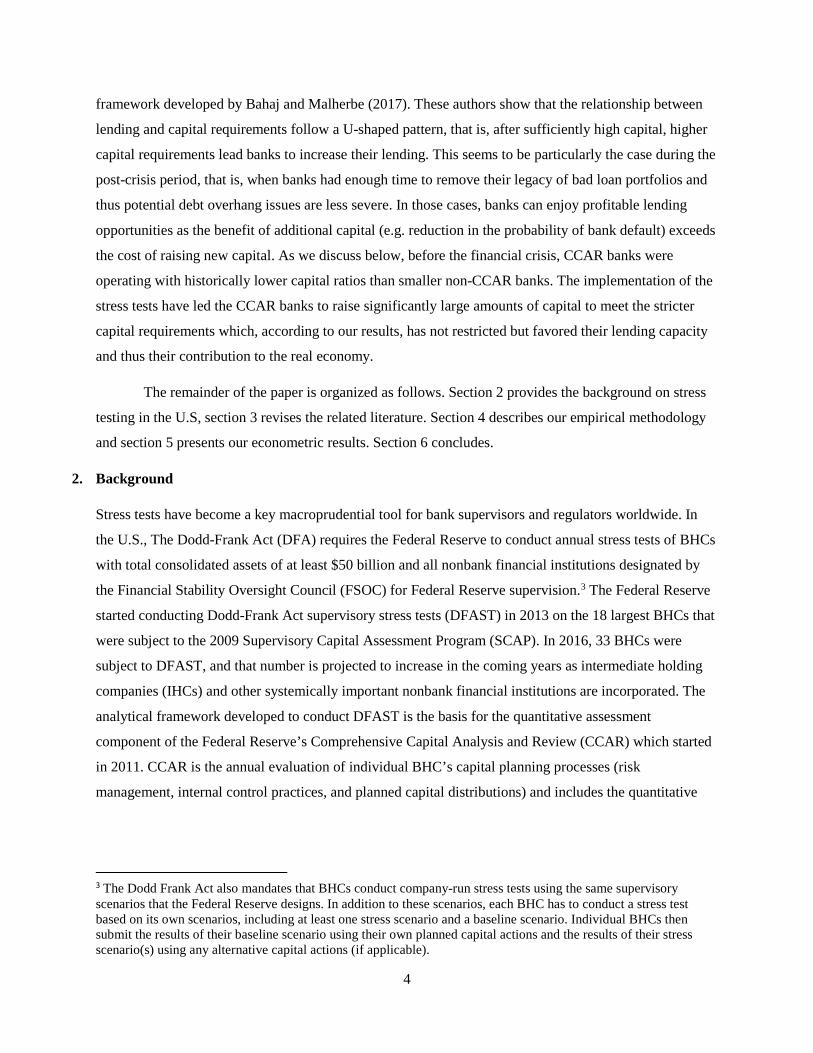
appear to be the most important determinant of the annual growth of RRE and small business loans.14
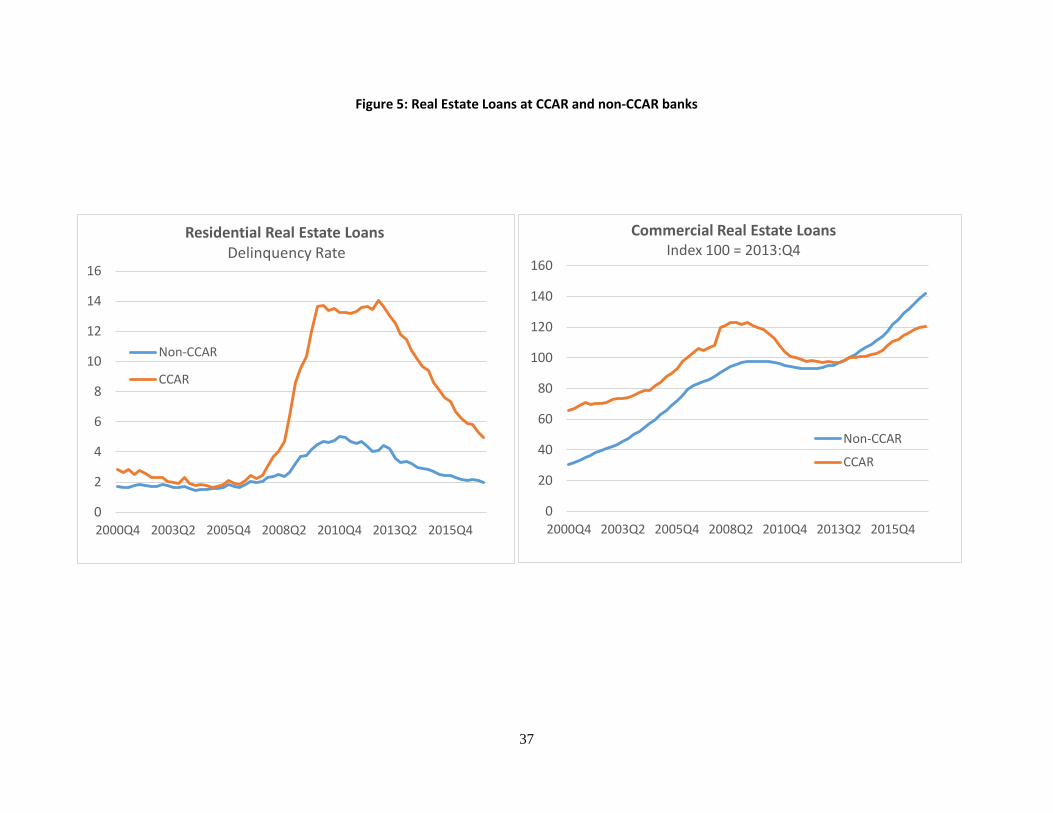
This finding is consistent with the idea that RRE growth is affected by each bank’s crisis experience. As
shown in the left chart of Figure 5, delinquency rates on mortgage loans remain elevated at CCAR banks,
and that seems to discourage higher RRE loan growth.15 Furthermore, higher loan growth rates for CRE
loans at smaller non-CCAR banks than larger banks are not new. For example, as shown in the right chart
13 We repeat the analysis using other size thresholds such as $20 to $150 billion, $30 to $150, and $30 to $200 billion and obtain qualitatively similar results. 14 We obtain similar results if instead of the non-performing loan ratio we use the ratio of net charge-offs to total assets as an alternative measure of credit quality in our regression specification. 15 Beyond higher delinquency rates on mortgage loans, mortgage repurchases due to breaches of warranties and representations associated with mortgage securitization around the times of the financial crisis seem to add downward pressure on RRE loan growth. See Vojtech (2017).
16
of Figure 5, cumulative growth for CRE loans banks (red line) had been larger at non-CCAR between
2001 and 2006.
Loan growth among CCAR banks
In our second approach, we focus on CCAR banks only and exploit the heterogeneity in the CET1 capital
gap to study whether supervisory stress tests restrain loan growth. The main idea behind this analysis is
that even among banks subject to the supervisory stress tests, the difference in minimum capital ratios
between BHCs’ stress tests and the Fed’s stress tests convey information about the severity of the stress
tests on individual banks and thus also captures the differential impact of the stress tests on individual
banks’ lending decisions.
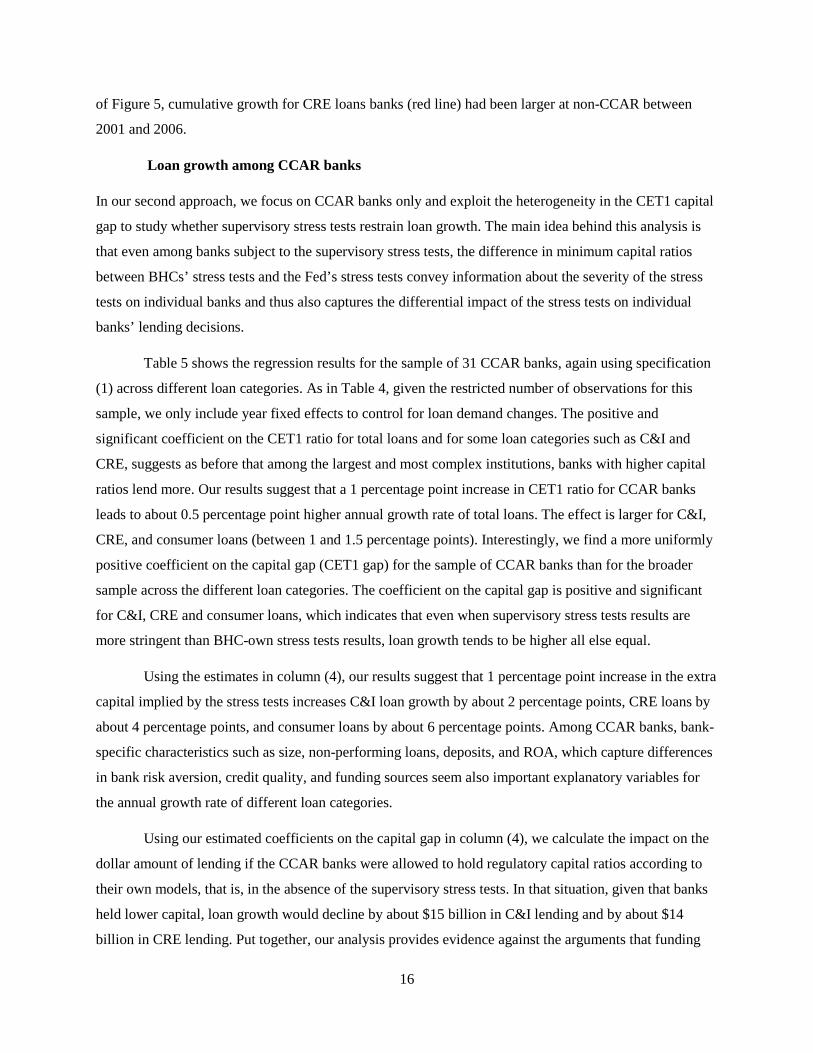
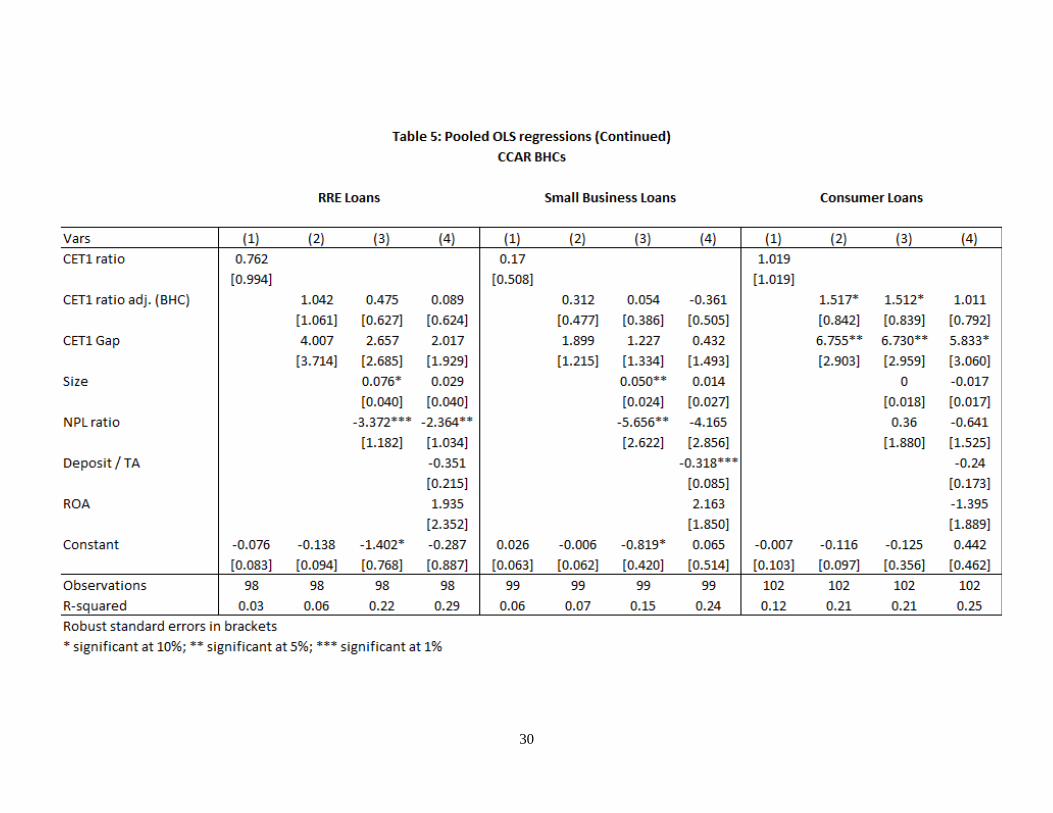
Table 5 shows the regression results for the sample of 31 CCAR banks, again using specification
(1) across different loan categories. As in Table 4, given the restricted number of observations for this
sample, we only include year fixed effects to control for loan demand changes. The positive and
significant coefficient on the CET1 ratio for total loans and for some loan categories such as C&I and
CRE, suggests as before that among the largest and most complex institutions, banks with higher capital
ratios lend more. Our results suggest that a 1 percentage point increase in CET1 ratio for CCAR banks
leads to about 0.5 percentage point higher annual growth rate of total loans. The effect is larger for C&I,
CRE, and consumer loans (between 1 and 1.5 percentage points). Interestingly, we find a more uniformly
positive coefficient on the capital gap (CET1 gap) for the sample of CCAR banks than for the broader
sample across the different loan categories. The coefficient on the capital gap is positive and significant
for C&I, CRE and consumer loans, which indicates that even when supervisory stress tests results are
more stringent than BHC-own stress tests results, loan growth tends to be higher all else equal.
Using the estimates in column (4), our results suggest that 1 percentage point increase in the extra
capital implied by the stress tests increases C&I loan growth by about 2 percentage points, CRE loans by
about 4 percentage points, and consumer loans by about 6 percentage points. Among CCAR banks, bank-
specific characteristics such as size, non-performing loans, deposits, and ROA, which capture differences
in bank risk aversion, credit quality, and funding sources seem also important explanatory variables for
the annual growth rate of different loan categories.
Using our estimated coefficients on the capital gap in column (4), we calculate the impact on the
dollar amount of lending if the CCAR banks were allowed to hold regulatory capital ratios according to
their own models, that is, in the absence of the supervisory stress tests. In that situation, given that banks
held lower capital, loan growth would decline by about $15 billion in C&I lending and by about $14
billion in CRE lending. Put together, our analysis provides evidence against the arguments that funding

17
loans with additional capital in order to satisfy the requirements of supervisory stress tests is restricting
lending.
5.3 Effect of Capital on Lending Standards
One channel through which higher capital requirements or the stringency of the stress tests could affect
loan growth is through changes in lending standards. That is, the policies that banks apply to their
decisions to approve credit for households and business, such as credit score cutoffs, documentation
requirements, and guarantor requirements. Since 2010, the July edition of the Federal Reserve’s SLOOS
has included a set of questions in which banks are asked to provide, for a range of loan categories, the
current level of their lending standards relative to the tightest or easiest they have been since 2005.
These responses take one of 7 values: 1) easiest, 2) significantly easier than the midpoint, 3)
somewhat easier than the midpoint, 4) about at the midpoint, 5) somewhat tighter than the midpoint, 6)
significantly tighter than the midpoint, 7) tightest. Due to the relatively few responses in the tightest and
easiest baskets for most loan categories, categories 1 and 2 are combined, as are categories 6 and 7, for a
total of 5 categories. We use these ordinal response as the dependent variable in a set of ordered logit
regressions and test for whether the capital gap affects the level of lending standards. The categories
change slightly from year to year, but consistent series exist for 12 different loan categories, including,
non-investment-grade syndicated loans, small business loans, three types of commercial real estate loans
(construction and land development, backed by nonfarm, nonresidential properties, backed by multifamily
properties), prime jumbo residential mortgages, home equity loans and lines of credit, credit cards (prime
and subprime), auto loans (prime and subprime), and other consumer loans. In addition to the CET 1
ratio and the capital gap, the regressions include bank and year fixed effects, the ratio of nonperforming
loans to total loans for the associated category, and the reported average change in demand over the
preceding year for that bank and that loan category from SLOOS.
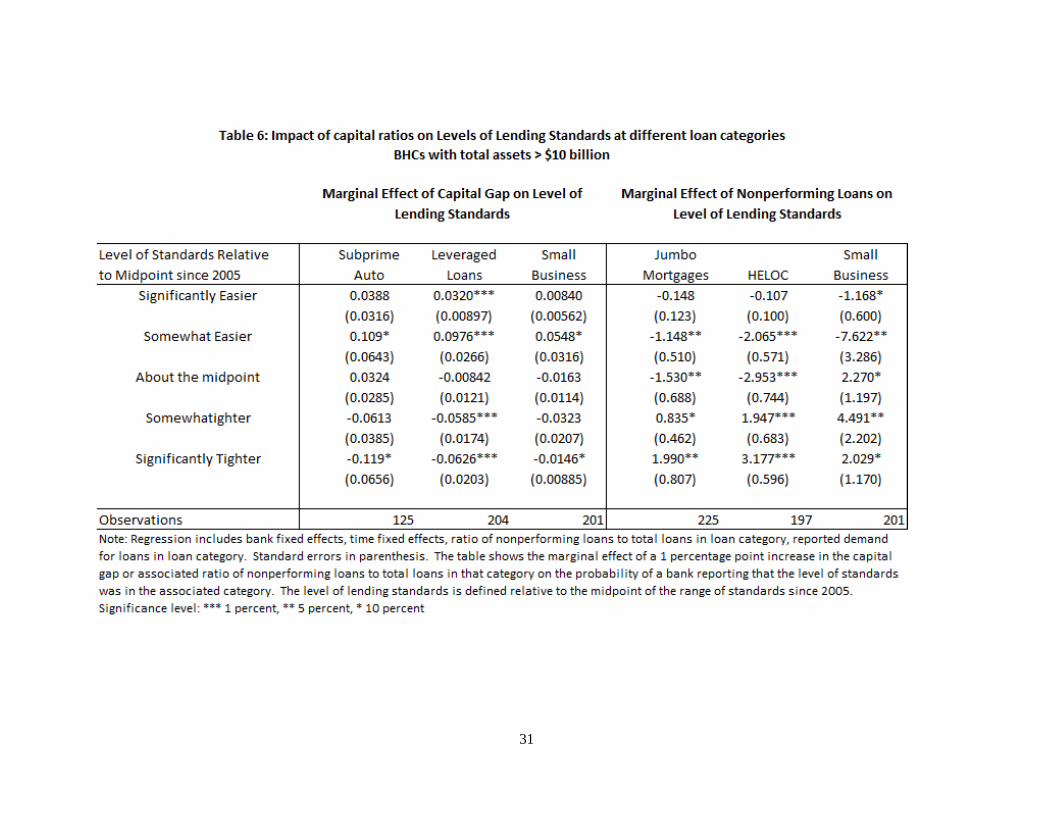
The left panel of Table 6 reports the marginal effect on the probability of being in each of the five
categories of lending standard stringency defined above of a 1 percentage point increase in the capital
gap. For most loan categories listed above, the effect of the capital gap on lending standards is not
statistically significant. However, for two categories of C&I loans—leveraged syndicated loans and small
business loans—a larger capital gap is associated with a significantly higher probability of having
standards that are easier than the midpoint since 2005, and a significant lower probability of having
standards that are tighter than the midpoint. For instance, a 1 percentage point increase in the capital gap
is associated with a nearly 10 percentage point increase in the probability that the bank has eased its
lending standards. The only other category where a statistically significant relationship exists between the
capital gap and lending standards, subprime auto lending, shows a similar pattern.
18
These regressions can also reinforce the restraining effect of a legacy portfolio of nonperforming
loans on certain types of lending, especially residential mortgages. As shown in the right panel of the
table, a larger ratio of nonperforming mortgage loans to total mortgage loans held by a bank is associated
with a higher probability of maintaining standards for mortgage loans that are tighter than the midpoint
and a lower probability of having standards for such loans that are easier than the midpoint.
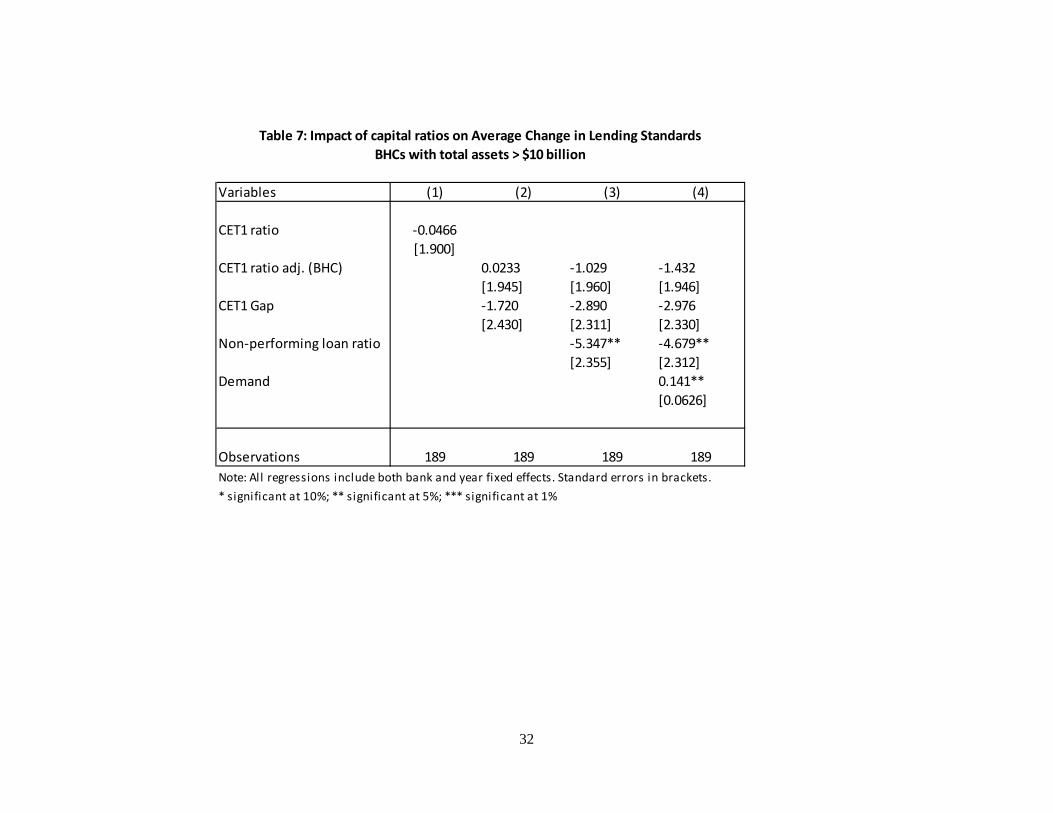
The exercise can also be conducted at the aggregate level using an index of the quarterly changes
in standards across all loan categories, as in Bassett et al. (2014). Both the levels and the changes in
standards can convey important independent information about the state of credit availability (Bassett and
Rezende, 2015). We run a regression of the average change in the index of standards over the year
following the stress tests on the capital gap and other controls (bank and time fixed effects, the CET1
ratio, an analogous index of demand, and ratio of total nonperforming loans to total loans). As shown in
Table 7 a higher capital gap is associated with a statistically insignificant tightening in lending standards
over the subsequent year. Once again, the statistically significant effect of nonperforming loans in driving
the tightening of lending standards is evident.
In short, we find no evidence that the extra capital implied by the results of the supervisory stress
tests (capital gap) is causing banks to tighten their lending standards. If something, the results seem to
suggest that relative to their non-CCAR counterparts, CCAR banks tend to ease their lending standards on
some loan categories.
5.4 Discussion
Our results are consistent with previous findings in the academic literature supporting the view that higher
capital is positively associated with stronger loan growth. Our interpretation is that the higher capital
buffers that result from the new regulatory framework, which make banks safer and more resilient,
altogether put banks in a better position to lend more, at least for some loan categories.
We argue that the loan growth differences for loan categories such as RRE, CRE and small
business loans between CCAR and non-CCAR banks observed in the data seem to be explained by
factors beyond the stress tests. After we account for those factors (e.g., loan demand and bank specific
characteristics such as risk aversion, credit quality, and funding sources) we do not find systematic
evidence that the capital calculations associated with the supervisory stress tests explain the loan growth
differences. Moreover, part of the slower loan growth at some CCAR banks and across certain loan
categories may reflect the goal of the post-crisis regulatory reform to limit the buildup of systemic risks in
the financial sector by better incentivizing banks to develop lending operations that are sustainable
through an economic downturn. Our findings of the impact on lending standards are also consistent with
19
little change in credit availability as a result of stress testing as banks with higher a capital gap tend to
maintain the same, or in some cases easier lending standards across loan categories.
A typical concern in the approach we follow to identify the impact of capital regulation is the
potential endogeneity issues in our identification strategy. We partially alleviate endogeneity issues by
lagging our explanatory variables (e.g. using predetermined bank controls). One could argue that our
capital gap measure is endogenous to the extent that banks adjust their behavior and try to mimic the
stress testing exercise over time. Figure 4 shows the potential learning and convergence of the regulatory
capital ratio. We think that it is reasonable to interpret the capital gap as exogenous. The capital gap
depends on differences between the Federal Reserve’s models—which are not fully disclosed—and the
bank’s own models. Moreover, each year, the scenario includes an emphasis on different “salient risks”
which are determined by the Federal Reserve and not revealed to banks until after the date for which
stress test data are collected. Therefore, banks cannot adjust their portfolios in order to improve their
performance on the stress tests by minimizing exposure to salient risks or by optimizing their portfolio to
exploit specific modeling assumptions. Further, we believe the capital gap captures unanticipated effects
because any learning takes time and convergence towards the Fed’s stress tests numbers may only be
achieved over time.
Another endogeneity concern arises from the possibility that the positive correlation between
bank capital (and the capital gap) and loan growth we observed in the data may be caused by shifts in loan
demand, which we may fail to identify using bank-level data. For example, strong demand may lead
banks to increase their lending and to look better capitalized at the same time if indeed the strong lending
driven by higher loan demand comes with higher retained earnings that also increase banks’ capital
positions. We believe that our analysis across different loan categories and the use of year fixed effects
somewhat alleviates the endogeneity concern to the extent that shifts in loan demand are not correlated
and thus are less likely to occur simultaneously across multiple loan categories. Using micro-level data on
corporate C&I loans that match the CCAR banks with their borrowers, and following an approach similar
to previous studies that use credit registry data to account for changes in loan demand, Berrospide and
Edge (2017) also find strong positive effects of bank capital on lending. Similarly, using loan-level data
from syndicated loan markets Chu, Zhang, and Zhao (2017) find a positive relationship between bank
capital and lending. This empirical evidence conforms to our results and provides additional validation for
the identified effects in our study.
20
6. Concluding remarks
We study the impact of the Federal Reserve’s stress tests on the lending of U.S. BHCs. Motivated by
recent claims by various stakeholders, we address the question of whether the annual supervisory stress
tests may be causing an unwarranted reduction in bank credit, or changing the allocation of loans in
unintended ways. To quantify the impact of the supervisory stress tests, we construct a measure of the
extra capital implied by the supervisory stress tests relative to the banks’ own models (capital gap). We
find no systematic evidence that the capital gap may be may be constraining bank loan growth or causing
bank to tighten their lending standards.
Although loan growth at CCAR banks has been slower than loan growth at their non-CCAR
counterparts, growth differences observed in the data seem to be driven by factors beyond the stress tests
such as loan demand, credit quality, and tolerance for risk. After controlling for these factors we find that
the capital gap is positively related to the growth of certain loan categories such as CRE and consumer
loans. Furthermore, consistent with previous results in the bank capital literature, we find that more
capital is associated with higher loan growth. We interpret our results as evidence that the increased level
of capital and the higher capital buffers brought by the post-crisis regulatory reform, which make banks
safer and more resilient, altogether put banks in a better position to lend more.

21
References
Acharya, V., Berger, A. and R. Roman (2017). “Lending Implications of U.S. Bank Stress Tests: Costs or
Benefits?” Working Paper.
Aiyar, S., Calomiris, C.W., and T. Wieladek (2014). “Does Macro-Prudential Regulation Leak? Evidence
from a UK policy experiment,” Journal of Money, Credit, and Banking 46(1), 181-214
Bassett, W.F. and M. Rezende (2015). "Relation between Levels and Changes in Lending Standards
Reported by Banks in the Senior Loan Officer Opinion Survey on Bank Lending Practices," FEDS Notes
2015-01-16. Board of Governors of the Federal Reserve System.
Bassett, W. F., M. B. Chosak, J. C. Driscoll, and E. Zakrajsek (2014). "Changes in Bank Lending
Standards and the Macroeconomy," Journal of Monetary Economics, vol. 62, 23-40.
Bahaj, S. and F. Malherbe (2016). “A Positive Analysis of Bank Behaviour Under capital Requirements,”
CEPR Discussion Paper No. DP11607. Available at SSRN: https://ssrn.com/abstract=2865877
Bernanke, B., and C. Lown (1991). “The Credit Crunch.” Brookings Papers on Economic Activity 2, 205-
247.
Berrospide, J. M., and R. M. Edge (2010). “The Effects of Bank Capital on Lending: What Do We Know,
and What Does it Mean?” International Journal of Central Banking 6 (4), 5-54.
Berrospide, J. M., and R. M. Edge (2017). “The Effects of Bank Capital Requirements on Lending”.
Working Paper. https://www.aeaweb.org/conference/2017/preliminary/1773?page=3&per-page=50
Brinkmann, E. and Horvitz, P. (1995). “Risk-based capital standards and the credit crunch,” Journal of
Money, Credit, and Banking 27, 848-863.
Calem, P., Correa, R., and S.J. Lee (2016). “Prudential policies and their impact on credit in the U.S.,”
International Finance Discussion Papers 1186. Board of Governors of the Federal Reserve System.
https://www.federalreserve.gov/econresdata/ifdp/2016/files/ifdp1186.pdf
Carlson, M., H. Shan, H. and M. Warusawitharana (2013). “Capital ratios and Bank Lending: A Matched
Bank Approach,” Journal of Financial Intermediation 22, 663-687.
Chu, Y., Zhang, D. and Zhao, Y. (2017). “Bank Capital and Lending: Evidence from Syndicated Loans”
Working Paper. https://ssrn.com/abstract=2462377

22
Flannery, M., Hirtle B., and A. Kovner (2016) “Evaluating the information in the Federal Reserve Stress
Tests,” Federal Reserve Bank of New York Staff Report No. 744.
Francis, W., and M. Obsorne (2009). “Bank Regulation, Capital and Credit Supply: Measuring the Impact
of Prudential Standards,” Occasional Paper No. 36, UK Financial Services Authority, London, UK.
Gambacorta, L. and P.E. Mistrulli (2004). “Does bank capital affect lending behavior?” Journal of
Financial Intermediation 13, 436-457.
Hirtle, B. and A. Lehnert (2015). “Supervisory Stress Tests” The Annual Review of Financial Economics
7, 339-55.
Hirtle B, and A. Kovner (2014). “Comparing bank and supervisory stress test projections.” Liberty Street
Economics Blog, http://libertystreeteconomics.newyorkfed.org/2014/01/comparing-bank-and-
supervisory-stress-testing-projections.html
Liang, Nellie (2017) “Higher Capital is not a substitute for stress tests” The Brookings Institution.
Mésonnier, J.S. and A. Monks, (2015). “Did the EBA Capital Exercise cause a credit crunch in the Euro
Area?” International Journal of Central Banking 11(3), 75-117.
Peek, J. and E. Rosengren (1995). “Bank Regulation and the Credit Crunch,” Journal of Banking and
Finance 19, 679-692.
Peek, J. and E. Rosengren (1997). “The International Transmission of Financial Shocks: The Case of
Japan,” American Economic Review 87, 495-505
Tarullo, Daniel (2014) “Stress Testing after Five Years” Remarks at the Federal Reserve Third Annual
Stress Test Modeling Symposium.
The Clearing House (2017) “The capital allocation inherent in the Federal Reserve’s capital stress test”
https://www.theclearinghouse.org//media/tch/documents/tch%20weekly/-
2017/20170130_tch_research_note_implicit_risk_weights_in_ccar-final.pdf?la=en
Vojtech, Cindy (2017). “Post-Crisis Lending by Large Bank Holding Companies” FEDS Notes, 2017-07-
06. Board of Governors of the Federal Reserve System.
https://www.federalreserve.gov/econres/notes/feds-notes/post-crisis-lending-by-large-bank-holding-
companies-20170706.htm
23
Table 1: Summary Statistics

24
Table 2: Univariate Analysis
25
26
27
28

29
30
31
32
Variables (1) (2) (3) (4)
CET1 ratio -0.0466[1.900]
CET1 ratio adj. (BHC) 0.0233 -1.029 -1.432[1.945] [1.960] [1.946]
CET1 Gap -1.720 -2.890 -2.976[2.430] [2.311] [2.330]
Non-performing loan ratio -5.347** -4.679**[2.355] [2.312]
Demand 0.141**[0.0626]
Observations 189 189 189 189Note: All regressions include both bank and year fixed effects. Standard errors in brackets.* significant at 10%; ** significant at 5%; *** significant at 1%
BHCs with total assets > $10 billionTable 7: Impact of capital ratios on Average Change in Lending Standards
33
Figure 1: CET1 capital ratio for CCAR and non-CCAR banks
0
2
4
6
8
10
12
14
Q1:
02
Q3:
02
Q1:
03
Q3:
03
Q1:
04
Q3:
04
Q1:
05
Q3:
05
Q1:
06
Q3:
06
Q1:
07
Q3:
07
Q1:
08
Q3:
08
Q1:
09
Q3:
09
Q1:
10
Q3:
10
Q1:
11
Q3:
11
Q1:
12
Q3:
12
Q1:
13
Q3:
13
Q1:
14
Q3:
14
Q1:
15
Q3:
15
Q1:
16
Q3:
16
Common Equity Tier 1 Ratio
Non-CCAR CCAR

34
Figure 2: Loan growth across different loan categories: CCAR and non-CCAR banks
50
70
90
110
130
150
170
2011:Q1 2012:Q1 2013:Q1 2014:Q1 2015:Q1 2016:Q1
Total Loan Growth(2011:Q1=100)
CCAR Non-CCAR
50
70
90
110
130
150
170
2011:Q1 2012:Q1 2013:Q1 2014:Q1 2015:Q1 2016:Q1
CRE Loan Growth(2011:Q1=100)
CCAR Non-CCAR
50
70
90
110
130
150
2011:Q1 2012:Q1 2013:Q1 2014:Q1 2015:Q1 2016:Q1
Small Business Loan Growth(2011:Q1 = 100)
CCAR Non-CCAR
507090
110130150170190
2011:Q1 2012:Q1 2013:Q1 2014:Q1 2015:Q1 2016:Q1
C&I Loan Growth(2011:Q1=100)
CCAR Non-CCAR
50
70
90
110
130
150
170
2011:Q1 2012:Q1 2013:Q1 2014:Q1 2015:Q1 2016:Q1
RRE Loan Growth(2011:Q1=100)
CCAR Non-CCAR
50
70
90
110
130
150
2011:Q1 2012:Q1 2013:Q1 2014:Q1 2015:Q1 2016:Q1
Consumer Loan Growth(2011:Q1=100)
CCAR Non-CCAR
35
Figure 3: Drop in CET1 capital ratio and CET1 gap in CCAR
36
Figure 4: Counterfactual: CCAR banks CET1 capital ratios with and without CCAR stress tests
37
Figure 5: Real Estate Loans at CCAR and non-CCAR banks
0
2
4
6
8
10
12
14
16
2000Q4 2003Q2 2005Q4 2008Q2 2010Q4 2013Q2 2015Q4
Residential Real Estate LoansDelinquency Rate
Non-CCAR
CCAR
0
20
40
60
80
100
120
140
160
2000Q4 2003Q2 2005Q4 2008Q2 2010Q4 2013Q2 2015Q4
Commercial Real Estate LoansIndex 100 = 2013:Q4
Non-CCAR
CCAR