assessing the impact of north carolina’s predatory lending law
TRANSCRIPT

Assessing the Impact of NorthCarolina’s Predatory Lending LawRoberto G. Quercia, Michael A. Stegman, and Walter R. Davis
University of North Carolina at Chapel Hill
AbstractThis article examines changes in subprime mortgage originations before
and after the implementation of North Carolina’s Predatory Lending Law.Previous studies have noted a decline in overall subprime lending. This was tobe expected, since the law was intended to reduce the number of predatory orabusive subprime loans. But which components of subprime lending declined,which remained stable or increased, and what happened to those loans that thelaw defines as predatory?
Using a database of 3.3 million loans from 1998 to 2002, we find that thereduction that occurred after the law took effect was entirely due to a declinein refinancing loans and that almost 90 percent of this decline can be traced toa reduction in predatory loans. The law is doing what it was intended to do:eliminate abusive loans without restricting the supply of subprime mortgagecapital for borrowers with blemished credit records.
Keywords: Mortgages; State and local governments; Subprime and predatorylending
Introduction
The 1990s were characterized by the aggressive expansion of home mort-gage lending to traditionally underserved populations, including those withlimited or impaired credit histories, minorities, and recent immigrants. Financialinstitutions became more active in this so-called subprime segment of themarket as a result of technological changes, a robust economy, and the need fornew markets. Subprime borrowers have benefited from this expansion of credit,and institutions have seen profits increase (Harvey and Nigro 2002).
HOUSING POLICY DEBATE
The Impact of North Carolina’s Predatory Lending Law 573
HOUSING POLICY DEBATE VOLUME 15 ISSUE 3© FANNIE MAE FOUNDATION 2004. ALL RIGHTS RESERVED.
19120_6_QUERCIA 10/27/04 1:49 AM Page 573

This market sector grew significantly over a very short period of time.Across the country, subprime mortgage originations grew six-fold, from $35billion to about $213 billion, in just eight years (1994 to 2002) (2003Mortgage Market Statistical Annual 2003). This increase reflects the growinginvolvement of Fannie Mae and Freddie Mac in the acquisition and securiti-zation of subprime mortgages and in the securitization of subprime loans thatfail to meet government-sponsored enterprise (GSE) purchase criteria. Duringthis period, the volume of all securitized subprime mortgage loans increased14-fold, from $11 billion (Harvey and Nigro 2002) to at least $143 billion;this accounts for more than two-thirds of all subprime lending (“Fannie,Freddie Continue” 2004).
Subprime loans serve a wide range of borrowers, from those with minorcredit imperfections to those with serious credit problems. Often, these areborrowers with credit scores below 660, two or more 30-day, or one or more60-day, delinquencies in the past two years, a judgment or foreclosure in thepast two years, or a bankrupcy in the past five years (Expanded Guidance forSubprime Lending Programs 2001). In addition, the subprime market alsoserves borrowers who have good credit, but who still represent additional riskfor lenders because of higher loan-to-value (LTV) ratios, higher payment-to-income ratios, low or limited documentation of income, unstable income, orsome combination of these features.1
In both theory and practice, the cost of borrowing should increase as thequality of a borrower’s credit declines, with the highest effective rates chargedto borrowers with the lowest-quality credit. However, some unscrupulouslenders charge fees and rates that are substantially higher than are justified bythe elevated risk of default, fail to advise their clients of the least expensivealternatives, or offer products and services without fully disclosing all of theirterms and conditions.
The term “predatory lending” generally refers to subprime lending prac-tices that are considered to be so detrimental to borrowers as to be consideredabusive. While there is no universal agreement on what practices should beconsidered predatory, those most often cited include making unaffordableloans based on the collateral rather than on the borrower’s ability to repay theloan, inducing a borrower to repeatedly refinance a mortgage for no otherreason than to generate additional points and fees (this is called “loan flip-ping”), and engaging in fraud and deception to conceal from unsuspecting orunsophisticated borrowers the true nature and cost of a loan (Gramlich 2000).
FANNIE MAE FOUNDATION
574 Roberto G. Quercia, Michael A. Stegman, and Walter R. Davis
1 These are commonly termed “Alt-A borrowers.”
19120_6_QUERCIA 10/27/04 1:49 AM Page 574

HOUSING POLICY DEBATE
The Impact of North Carolina’s Predatory Lending Law 575
In addition, making loans with certain proscribed characteristics, such aslengthy and costly prepayment penalties that prevent borrowers from refi-nancing when interest rates fall, very high LTV ratios, excessive interest rates,and single-premium credit insurance that further increases total debt on whichhigh interest rates are paid, is also considered predatory.2
For service providers, regulators, and legislators, dealing with predatorylending requires a delicate touch, because curbing abusive practices too aggres-sively could restrict the flow of legitimate subprime loans to higher-riskborrowers. Also, because some predatory lending regulations prevent certainpeople from entering into transactions that they freely choose, it has beenargued that these public actions reduce consumer sovereignty and are patentlypatronizing. However, the reality is that some who seek mortgage credit maybe so uncreditworthy that the only loan they can qualify for has predatoryterms, in which case a predatory lending law might reduce the supply of creditto them. Historically, government has acted to curb abusive lending practices,even when doing so limits the flow of certain kinds of credit to consumers whoseek it.
Given the recent explosion in subprime lending, there has been a prolifer-ation of state predatory lending laws and calls for congressional action becausepredatory mortgage practices can devastate families and communities. A refi-nancing loan made without regard to whether the borrower can meet thepayments is likely to strip away a homeowner’s equity. This is especially truefor minority and low-income homeowners, for whom equity comprises over60 percent of their net worth (Joint Center for Housing Studies 2002). In addi-tion, most older homeowners depend on equity to supplement other retire-ment savings (Quercia 1997). The importance of home equity for thesefinancially unsophisticated or vulnerable populations makes them potentialtargets of predatory practices (Carr and Kolluri 2001).
In the absence of direct measures, the potential and extent of predatorylending, which is largely a subset of subprime lending, can be indirectlydeduced by observing overall subprime lending patterns and changes overtime. For instance, subprime mortgage originations are three times morecommon in low-income neighborhoods than in high-income neighborhoodsand five times more common in black neighborhoods than in white ones.Furthermore, homeowners in high-income black neighborhoods are twice aslikely as homeowners in low-income white neighborhoods to have subprime
2 These practices (e.g., making loans based exclusively on the collateral and loan flipping)suggest that predatory practices are likely to be concentrated in the refinancing market.Empirical evidence supports this contention (HUD 2000).
19120_6_QUERCIA 10/27/04 1:49 AM Page 575

loans. Similarly, subprime loans are three times more likely to be found amongolder borrowers than among younger ones (U.S. Department of Housing andUrban Development [HUD] 2000; Walters and Hermanson 2002). All of thesefigures suggest that the negative impact of abusive or predatory subprime prac-tices may fall most heavily on those who have less access to prime credit (HUD2000).
Although there is no agreed-upon definition of what constitutes predatorylending, the controlling federal law is the Home Ownership and EquityProtection Act of 1994 (HOEPA), implemented by Section 226.32 of federalRegulation Z. Under the 2002 revisions to Regulation Z, high-cost loans aredefined as those with either (1) interest rates eight percentage points higherthan comparable treasuries (for first-lien loans) or (2) total points and feesexceeding 8 percent of the total loan amount or $400 (subject to annual index-ing), whichever is greater. (Points and fees are defined to include most financecharges; brokers’ fees; closing costs paid for optional life, accident, health, orloss-of-income insurance; and other credit-protection products, such as debt-cancellation coverage, whether paid at or before closing).
The revised regulation limits the refinancing of a HOEPA loan withanother HOEPA loan within the first year unless the refinancing is “in theinterest” of the borrower (Dreher, Langer, and Tomkies 2004). In 2000, onlyabout 1 percent of all subprime mortgage loans were estimated to fall underHOEPA (Gramlich 2000).3 However, empirical estimates of abusive lendingpractices and the nature of class action settlements agreed to by large subprimelenders involved in predatory lending litigation suggest that the actual inci-dence may be considerably higher (for example, see Richardson 2003). Alongthese lines, the Reinvestment Fund estimates that in low-income black commu-nities in Philadelphia, close to half of all subprime loans involve loan flipping(2004).
Since 1994, several states and a few local jurisdictions have enactedanti–predatory lending laws that generally set a much lower trigger thanHOEPA and/or require fuller disclosure or ban a broader array of abusivepractices (Mortgage Bankers Association 2004). Although prohibitions mayvary, state laws generally define high-cost or predatory mortgages as loans thatfeature such things as excessive points and fees, balloon payments, lengthyprepayment penalties, loan flipping, single-premium life insurance policies,interest rates for real estate–secured loans that approach or exceed rates thatare typically charged for unsecured credit card debt, and failure to requiredocumentation of the ability to repay. In 2003 alone, 16 states enacted preda-
FANNIE MAE FOUNDATION
576 Roberto G. Quercia, Michael A. Stegman, and Walter R. Davis
3 Senate Bill 1149, codified at N.C. Gen. Stat. §§ 24-1.1E, 24–10.2; effective July 1, 2000.
19120_6_QUERCIA 10/27/04 1:49 AM Page 576

HOUSING POLICY DEBATE
The Impact of North Carolina’s Predatory Lending Law 577
tory lending legislation in an attempt to deal with the proliferation of abusivelending in their respective jurisdictions (Mortgage Bankers Association 2004).4
Critics of state anti–predatory lending laws argue that this kind of legisla-tion essentially throws the baby out with the bath water—that in their effortsto curb the most abusive practices, these laws curtail the supply of subprimecredit for all borrowers (Elliehausen and Staten 2002, 2003). Because NorthCarolina was the first state to enact such legislation (in 1999), this law hasreceived a great deal of attention. Examinations of its impact to date have hadvaried results. This article attempts to clarify conflicting findings by using adatabase of subprime loans licensed to us by Loan Performance, Inc., to exam-ine changes in subprime mortgage originations before and after the law wasimplemented in 1999 and 2000.
The North Carolina law: What do we think we know?
North Carolina’s Predatory Lending Law (hereinafter referred to as theNC Act) prohibits certain types of lending activities that are consideredabusive.5 (The Appendix summarizes the key provisions.) The NC Act wasimplemented in two phases. Two elements took effect in the fourth quarter of1999: a ban on prepayment penalties for loans of $150,000 or less and a banon flipping, in which a lender repeatedly refinances an existing home loan withup-front fees that cannot be shown to provide a net benefit to the consumer.The remaining provisions took effect on July 1, 2000.
We have identified five studies that, to varying degrees, have examined theimpact of the NC Act. The first, conducted by the trade publication InsideB&C Lending (“Lenders Will Try to Pin Down” 2001), reviewed the ratesheets of several top subprime lenders to assess the range of products andprices offered in North Carolina after the law was enacted. The review foundthat subprime lenders there were continuing to offer a full array of productsand that there was little or no variation in the rates charged. Moreover, whilesome companies opted to leave the market, the study could not determinewhat role, if any, the NC Act played in those decisions.
4 About 10 states have moderate to strong anti–predatory lending laws: Arkansas,California, Georgia, Illinois, New Jersey, New Mexico, New York, North Carolina, SouthCarolina, and West Virginia. Massachusetts also has strong anti–predatory lending regulations,but it has not yet enacted legislation. Another 11 states have enacted versions of existing federallaw or industry bills. These offer no meaningful new protections for consumers.
5 Additional elements include (1) strengthening the prohibition against making HOEPAloans without regard to the borrower’s ability to repay by adding a presumptive violation if thecreditor has not documented the borrower’s repayment ability, (2) limiting due-on-demandprovisions, and (3) prohibiting the structuring of a home equity loan as “open-end” unless theRegulation Z definition of open-end is met (Dreher, Langer, and Tomkies 2004).
19120_6_QUERCIA 10/27/04 1:49 AM Page 577

Elliehausen and Staten (2002, 2003) used loan-level data from ninemembers of the American Financial Services Association (AFSA), an industrytrade group, to compare subprime lending originations in North Carolina withthose in the neighboring states of South Carolina, Tennessee, and Virginia.They found that the NC Act resulted in an overall decline in subprime origi-nations in North Carolina relative to the comparison states, as well as a declinein originations to low-income borrowers (defined as those having a householdincome of $50,000 or less).
Ernst, Farris, and Stein (2002) examined the volume of subprime origina-tions before and after the NC Act by using Home Mortgage Disclosure Act(HMDA) data to compare 1999 and 2000 subprime originations for NorthCarolina with those for the rest of the nation. They found that although therewas an overall decline in the subprime market in North Carolina betweenthose two dates, that state was still among the most active subprime origina-tion markets in the nation. They also found that despite the overall decline insubprime lending in North Carolina, the percentage of all subprime origina-tions to lower-income borrowers remained unchanged. On the basis of thisfinding, the authors conclude that the overall decline was not just in the lower-income portion of the market but was distributed across the spectrum. Theyalso calculated that the NC Act saved borrowers an estimated $100 millionover the study period.
Morgan Stanley (2002) surveyed 280 subprime branch managers andbrokers from four companies (Household, Citigroup, Wells Fargo, andWashington Mutual) to assess the impact of predatory lending laws on lend-ing activity across the country and found that subprime residential lendingvolumes were not reduced in any significant way. The report states, “Even thetoughest new laws, in states like North Carolina for example, do not seem tobe affecting branch volumes” (Morgan Stanley 2002, 2).6
Finally, Harvey and Nigro (2002) used 1998–2000 HMDA data to exam-ine loan application and denial rates in North Carolina and neighboring states.They found that the NC Act reduced the overall level of subprime mortgagelending activity in North Carolina relative to Georgia, South Carolina,
FANNIE MAE FOUNDATION
578 Roberto G. Quercia, Michael A. Stegman, and Walter R. Davis
6 It should be noted that the study sample was stratified based on the U.S. population.While the author analyzed results for a group of states deemed to have instituted tougher lend-ing restrictions (California, Connecticut, Florida, Georgia, New York, North Carolina, andPennsylvania), the sample is said to be too small to draw statistically significant observationsfrom any single state. Edward Moulin, Morgan Stanley’s executive director, issued a memo onSeptember 17, 2002, stating that the analysis and conclusions in this report represent the viewsof the author, Kenneth A. Posner, a company analyst, and should not be taken as MorganStanley’s view on existing or proposed legislation.
19120_6_QUERCIA 10/27/04 1:49 AM Page 578

HOUSING POLICY DEBATE
The Impact of North Carolina’s Predatory Lending Law 579
Tenessee, and Virginia. However, they also reported that the decline was dueto a reduction in subprime loan applications rather than an increase in denialrates. This suggests that the reduction in loan volume resulted from lessdemand rather than less credit. They also reported that the relative share ofboth prime and subprime mortgage loans to low-income7 and minorityborrowers in North Carolina increased after the act was implemented.
Limitations of existing data sets
To a large extent, the conflicting assessments of the NC Act and the impactof other predatory lending laws are related to the differences in the databasesresearchers use for their analyses. Simply put, there is no comprehensive,broadly accessible census of subprime lending available to the research andlending communities. Three of the studies mentioned (Elliehausen and Staten2002, 2003; “Lenders Will Try to Pin Down” 2001; Morgan Stanley 2002)rely on proprietary data. Except for what the authors of these works includein their published reports and articles, little is known about the compositionof their data sets, which are not available to the wider research community forvalidation or replication.
The other two studies (Ernst, Farris, and Stein 2002; Harvey and Nigro2002) rely on publicly available data collected under HMDA, but whileHMDA is an excellent database for some studies of the mortgage market andthe variations in the lending behavior of individual reporting institutions, itleaves much to be desired when it comes to analyzing subprime and predatorylending. This is primarily due to the way HUD uses HMDA to identifysubprime lenders and, therefore, subprime loans. HUD designates lenders assubprime or manufactured housing lenders if at least half of their total origi-nations are subprime or manufactured housing loans.
Since the current HMDA database contains no field designating an indi-vidual loan application as either prime or subprime, by convention, 100percent of all loan applications for a HUD-identified subprime lender aretallied as subprime, even if just 51 percent of those applications were actuallyfor subprime loans.8 Conversely, none of the applications for subprime loans
7 These are households with incomes at or below $25,000.8 Under regulations published by the Board of Governors of the Federal Reserve System on
February 2 and June 21, 2002, beginning January 1, 2004, lenders covered by HMDA mustreport the amount by which a loan’s interest rate exceeds the interest rate on a comparableTreasury security for loans with rates at least three percentage points higher than the Treasuryinterest rate for first mortgages and at least five percentage points higher for second mortgages.Lenders must also identify loans whose interest rates and/or fees are high enough to make themsubject to HOEPA.
19120_6_QUERCIA 10/27/04 1:50 AM Page 579

submitted to prime lenders whose subprime lending volume accounts for lessthan half of their total business are identifiable in HMDA as subprime loans.Because it both understates and overstates the subprime lending activities ofdifferent lenders with no way of estimating whether the errors offset andbecause it contains fewer loan-level variables of interest to researchers onpredatory lending, we do not share other researchers’ enthusiasm for HMDAas the subprime database of choice.
Our data source
To address the data shortcomings in previous work, our study uses whatwe believe to be a superior database for subprime and predatory lendingresearch and policy analysis. This database is widely recognized and used bythe segment of the financial services industry that originates and securitizeslarge numbers of subprime loans, but heretofore has not been used byacademic researchers. This source, containing loan-level data on more than 4million securitized subprime loans, is licensed to the Center for CommunityCapitalism, a research center based in the Kenan Institute of Private Enterpriseat the University of North Carolina at Chapel Hill, by Loan Performance, Inc.(formerly the Mortgage Information Corporation), a private company formedmore than 20 years ago to provide large regional banks with mortgage marketresearch. Over the years, the company put in place a system to track theperformance of agency and nonagency loans and securities and, in 1997,started tracking subprime loans. These data have been widely used by theOffice of Thrift Supervision (OTS), as well as by Freddie Mac and Fannie Maeeconomists and many others in the industry in analyzing market dynamics andmortgage performance.
The data for this analysis come from the company’s Asset Based Securities(ABS) master loan-level database (the LP database) (period #178, November2003). The data for our analysis is a subset of this database consisting of loan-level information on more than 3 million subprime loans originated from 1998through 2002.
The LP database represents a significant share of the overall subprimemarket, ranging from approximately 39 percent in 1998 to about 67 percentin 2002 (table 1) (2003 Mortgage Market Statistical Annual 2003). There issome overlap between the LP database and HMDA, although we cannotdefine it with certainty. Many ABS lenders and issuers that report data to LoanPerformance, Inc., also report data under HMDA, including eight issuers onHUD’s list of subprime lenders (HUD 2001) and a major lender active in boththe prime and subprime mortgage markets. Eleven of the top 25 ABS home
FANNIE MAE FOUNDATION
580 Roberto G. Quercia, Michael A. Stegman, and Walter R. Davis
19120_6_QUERCIA 10/27/04 1:50 AM Page 580

HOUSING POLICY DEBATE
The Impact of North Carolina’s Predatory Lending Law 581
equity issuers for 2002, including the top 4, report to Loan Performance, Inc.(Koren 2003).
Our LP database is twice as big as Elliehausen and Staten’s 1998 databaseof about 300,000 subprime originations from nine AFSA members (2002,2003) and contains approximately 600,000 loans for 1998 and 3.65 millionsubprime loans for the overall study period covering the first quarter of 1998through the third quarter of 2002.
It should be noted that the LP database includes a wide range of subprimeloans, including loans for investor-owned properties that are not part of theowner-occupied stock. We excluded all investor-owned properties from oursubsequent analysis.
The LP database also includes so-called Alt-A loans, which some haveargued should not be included in our analysis because they are not riskyenough to be classified as subprime mortgages. A total of 7 percent of allNorth Carolina subprime originations between 1998 and 2002 were Alt-Aloans, accounting for less than 1 percent of all 2002 originations. Relative toprime loans, Alt-A loans carry additional risk for lenders—higher LTV orpayment-to-income ratios, low or limited documentation of borrower income,unstable income, or some combination of these features—so we believe thatincluding them in our subprime database is justified. Nevertheless, to test theproposition that including them somehow biases our results, we removedthem, replicated our analysis, and confirmed our findings. We do not know theextent to which Elliehausen and Staten’s (2002, 2003) AFSA portfolio contains
Table 1. Subprime Loans in the National LP Database,Number and Volume, United States 1998 to 2002
LPTotal Total Database
Volume, National as aNumber LP Subprime Percentageof Loans, Database Volume of All
LP Percent (Billions of Percent (Billions of Percent SubprimeYear Database Change Dollars) Change Dollars) Change Loans
1998 601,491 $59.0 $150.0 39.31999 704,201 17.1 $65.4 10.8 $160.0 6.7 40.92000 621,019 –11.8 $62.1 –5.0 $138.0 –13.8 45.02001 734,775 18.3 $92.5 49.0 $173.3 25.6 53.52002 992,948 35.1 $143.0 54.6 $213.0 22.9 67.1
Source: LP database (period #178) and 2003 Mortgage Market Statistical Annual 2003.
19120_6_QUERCIA 11/3/04 4:16 PM Page 581
investor-owner or Alt-A loans, nor is it possible to account for these types ofloans in HMDA-based analysis.9
We should note that a widely circulated first draft of this article (Quercia,Stegman, and Davis 2003) was severely criticized in some quarters, largelybecause of our use of LP data. We feel that a response is in order. To the bestof our knowledge, the LP database, which is produced by a company that hasbeen providing financial institutions with mortgage market data for 20 years,contains the most comprehensive loan-level data available on the subprimemortgage market.
Given the robustness of the LP data, we are baffled by the criticism anddisappointed by the confusion that has arisen over the mistaken interpretationof our data. In August 2003, the authors of a Comptroller of the CurrencyWorking Paper (2003) criticized our data while uncritically accepting the dataand findings of the Georgetown Credit Research Center’s (CRC’s) study(Elliehausen and Staten 2002, 2003) showing the NC Act to have adverseeffects. The CRC study used a data set that included 1.4 million loans nation-ally from 1995 through 2000 but analyzed less than 145,000 of the ones thatwere originated in four states by nine AFSA lender members. Compared withour LP database, CRC’s data set represents a smaller segment of the subprimemarket, covers substantially fewer lenders, ends before many of the NC Act’sprovisions took effect, and is not available to other researchers for indepen-dent analysis. Shortly afterward, Robert E. Litan, director of the AEI–Brookings Joint Center on Regulation, was equally critical of the LP database,arguing, ineffectively in our view, that HMDA is the better database foranalyzing predatory lending (2003a).
Litan also faulted our analysis because all of the subprime loans in ourdatabase were securitized in the secondary market (2003b). However, securi-tization is typical in the subprime market (Litan 2003a). Inside B&C Lending(“Fannie, Freddie Continue” 2004) reports that nearly two-thirds of allsubprime loans were securitized in 2002. We know of no evidence suggestingthat securitized subprime loans are fundamentally different from unsecuritizedones.10 Moreover, our calculations suggest that most of the loans made by
FANNIE MAE FOUNDATION
582 Roberto G. Quercia, Michael A. Stegman, and Walter R. Davis
9 The LP database is not, however, without limitations. It includes only securitized loans;and like the HMDA-based subprime list, it does not include loans sold to the GSEs. It also lacksimportant borrower information (race and income).
10 An anonymous reviewer referred us to Phillips-Patrick et al. (2000), who conclude thatthe LP database is not representative of the subprime market. However, this paper reviewed an earlier version of the database that bears no resemblance to the LP data set we use for ouranalysis. For example, Phillips-Patrick et al. (2000) found no loans in their LP database forNorth Carolina, South Carolina, Tennessee, or several other states and no loans with LTV ratiosover 90 percent. They also found that 90 percent of the loans were for home purchase. As weindicated earlier, these findings do not apply to our LP database.
19120_6_QUERCIA 10/27/04 1:50 AM Page 582

HOUSING POLICY DEBATE
The Impact of North Carolina’s Predatory Lending Law 583
subprime lenders that are members of AFSA—the data source for the CRCstudy—are also securitized (Elliehausen and Staten 2002, 2003).
While recognizing that there is no perfect database for studying subprimeand predatory lending in North Carolina or in the country,11 we would arguethat the LP database, while far from perfect, has been shown to be at least asgood as and, in our view, significantly better than those used by others whohave criticized the NC Act. However, we do agree with the larger point thatthe mix of loans and lenders included in the various databases can affect analysis and outcomes.
In this article, we address many such issues: subprime loans to absenteeowners and mortgages on second homes; separate analyses of purchase andrefinancing loans; and separate analyses of fixed-rate loans, adjustable-rateloans, and loans with balloon payments. We simply request that critics turntheir attention with equal vigor to the databases used in studies claiming thatthe NC Act has curtailed the supply of subprime credit and increased costs toconsumers with blemished credit.
We begin our assessment of the impact of the law by comparing subprimelending activities in the United States, neighboring southern states, and theremainder of the South over our study period. We examine changes in thenumber of subprime loans, both purchase and refinancing, before and after theNC Act was implemented. We also examine two of the most serious concernsraised about it: (1) whether it reduced access to subprime loans for potentialborrowers with the poorest credit and (2) whether it reduced the flow ofnonpredatory subprime credit to all North Carolina borrowers, thereby rais-ing local interest rates relative to other states. During the time covered by ourstudy, no other southern state had an anti–predatory lending law. Our analy-sis concludes with an assessment of the impact of the NC Act on the origina-tion of predatory and abusive loans before and after full implementation. Inthe last section, we discuss the implications of our study for future researchand for predatory lending policies.
Finally, we should note that while we consider our examination to becomprehensive and analytical, we do not model the law’s impact within amultivariate framework that can account for potentially confounding factorssuch as variations in state economic environments. Therefore, we consider ourfindings strongly suggestive and await future research by us and others to moredefinitively identify the effects of the law on subprime lending.
11 Nor is it known the extent to which any of the data sets (AFSA, HMDA, or LP) arerepresentative of the bottom of the subprime market; of subprime originations in general; ofstate-level subprime activity; or of the consistency with which changes in state-by-state report-ing coverage occur over time. There are no publicly available benchmarks against which tocompare these data.
19120_6_QUERCIA 10/27/04 1:50 AM Page 583

Our research framework
As noted earlier, the NC Act was implemented in two phases that wereseparated by three quarters, which we refer to as the transition period. Thefirst phase of the law became effective for loans originated on or after October1, 1999 (at the start of the fourth quarter), while the second phase becameeffective on July 1, 2000 (at the start of the third quarter). Because this was atime of uncertainty and adjustment for market participants, we discount anychanges in subprime lending that occurred during this transition period andfocus our analysis on differences in subprime lending before initial implemen-tation and after full implementation. Because the LP database does not haveadequate market coverage before 1998, we limited our analysis to the sevenquarters immediately before initial implementation (the first quarter of 1998through the third quarter of 1999) and the first seven quarters after full imple-mentation (the third quarter of 2000 through the first quarter of 2002).
While previous work on the impact of the NC Act has focused on theoverall subprime market, we focus on its impact on specific market segmentsand on the supply of subprime credit with abusive or predatory terms. Topreview our empirical results, our analysis indicates that there was a decreasein subprime activity after the NC Act was implemented, but it was concen-trated in the refinancing sector, not the home purchase sector. Since mostpredatory lending involves refinancing existing mortgage debt, such a declinewould be expected. As we would also expect, a significant share of the declinein refinancing is in the subset of loans with abusive or predatory features, suchas loans with extended prepayment penalties, balloon payments, and very highLTV ratios that exceed the encumbered home’s market value.12 We find thatthese results were achieved without a differential impact on the lowest-creditborrowers or an increase in interest rates.
FANNIE MAE FOUNDATION
584 Roberto G. Quercia, Michael A. Stegman, and Walter R. Davis
12 Lengthy prepayment penalties and balloon clauses, which limit the ability to refinance,are two of the abusive characteristics identified in the NC Act. Repeated refinancing of firstmortgages with financed loan fees secured by second liens is common to loan flipping and islikely to result in high combined LTV ratios in the range of 110 percent or more. The fact thatvery high combined LTV ratios are indicative of abusive lending practices is suggested in, amongothers, a recent report from the State of Washington, Department of Financial Institutions,where the state regulator criticized one subprime lender for “steering borrowers into larger firstmortgages” and “situations where the borrowers were required to take out a second mortgageprimarily to pay points on the first mortgage” (2002, 59). The NC Act aims to reduce thispredatory practice through its prohibition on originating refinance loans that do not provide theborrower with a net tangible benefit. High combined LTV ratios also serve as a deterrent toprepayment, locking a borrower into loans with high interest rates by making it economicallyinfeasible for a responsible lender to offer a refinancing loan (State of Washington 2003).
19120_6_QUERCIA 10/27/04 1:50 AM Page 584

HOUSING POLICY DEBATE
The Impact of North Carolina’s Predatory Lending Law 585
Changes in the national subprime market from
1998 through 2002
Nationally, the volume of subprime originations in 2000 was $138 billion,compared with $160 billion a year earlier; this is a decline of 14 percent (seetable 1).13 Starting in 2000, total subprime originations increased steadily,reaching $213 billion in 2002; this is a two-year increase of 54 percent (2003Mortgage Market Statistical Annual 2003). Our LP database shows a similarpattern, declining 12 percent from 1999 to 2000, and more than doubling overthe next two years.
The reason for the greater relative increase in total subprime originationsmeasured by the LP database relates to its growing market coverage over time.Benchmarking our database against independent measures of the size of thenational subprime market indicates that LP’s market coverage has grown overour study period from about 39 percent of the total subprime market in 1998to about 67 percent in 2002. While this greater coverage is good for exploringmany lending issues, it complicates time series analysis of changes in subprimelending before and after the NC Act was implemented.
For this reason, our impact analysis will focus more on relative changes inlending over time in North Carolina and in comparison states, rather than onabsolute changes.14 Since we have no reason to believe that LP’s growth innational market coverage varies significantly from state to state, this shouldnot prove to be a problem. Moreover, when we find the number of origina-tions of loans with abusive features to have declined more in North Carolina
13 Readers familiar with an earlier version of this article may notice that we are reportinga slightly smaller number of loans in the earlier period. This is because Loan Performance, Inc.,removed 101,611 loans from the database over concerns about the reliability of the informa-tion from a particular source. All of these loans, which were included in that earlier analysis,were in the prelaw period, and many were in North Carolina and comparison states. However,because of the missing data in these loans, very few appeared in tables other than those thatlooked at the overall market, so their removal has no substantive impact.
14 To our knowledge, there are no annual estimates of subprime volume by state, nor arethere quarterly estimates of subprime volume. Consequently, we are unable to precisely estimatethe coverage of the LP data in each state or in the pre- and postlaw periods. Using numbers fromtable 1, our best estimate is that LP covers about 40 percent of the market in the prelaw periodversus about 53 percent in the postlaw period. Consequently, increases in the number of loanswould be around 30 to 35 percent in a perfectly stable market with no differences among states.
19120_6_QUERCIA 10/27/04 1:50 AM Page 585
than in comparison states in the postlaw period, our estimates of the positiveimpact of the NC Act are most likely understated because of LP’s growingmarket share.15
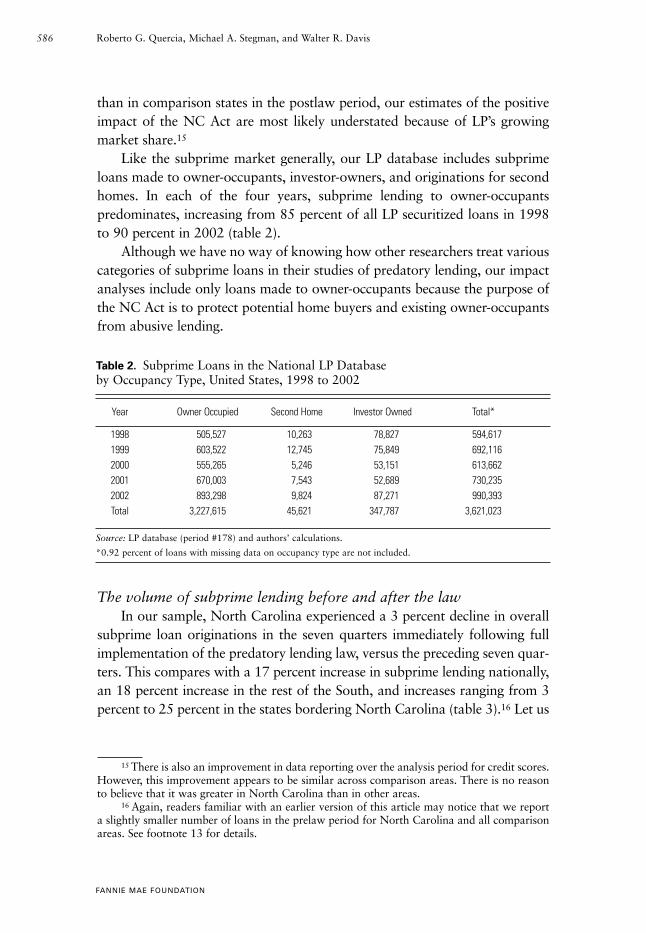
Like the subprime market generally, our LP database includes subprimeloans made to owner-occupants, investor-owners, and originations for secondhomes. In each of the four years, subprime lending to owner-occupantspredominates, increasing from 85 percent of all LP securitized loans in 1998to 90 percent in 2002 (table 2).
Although we have no way of knowing how other researchers treat variouscategories of subprime loans in their studies of predatory lending, our impactanalyses include only loans made to owner-occupants because the purpose ofthe NC Act is to protect potential home buyers and existing owner-occupantsfrom abusive lending.
The volume of subprime lending before and after the lawIn our sample, North Carolina experienced a 3 percent decline in overall
subprime loan originations in the seven quarters immediately following fullimplementation of the predatory lending law, versus the preceding seven quar-ters. This compares with a 17 percent increase in subprime lending nationally,an 18 percent increase in the rest of the South, and increases ranging from 3percent to 25 percent in the states bordering North Carolina (table 3).16 Let us
FANNIE MAE FOUNDATION
586 Roberto G. Quercia, Michael A. Stegman, and Walter R. Davis
15 There is also an improvement in data reporting over the analysis period for credit scores.However, this improvement appears to be similar across comparison areas. There is no reasonto believe that it was greater in North Carolina than in other areas.
16 Again, readers familiar with an earlier version of this article may notice that we reporta slightly smaller number of loans in the prelaw period for North Carolina and all comparisonareas. See footnote 13 for details.
Table 2. Subprime Loans in the National LP Databaseby Occupancy Type, United States, 1998 to 2002
Year Owner Occupied Second Home Investor Owned Total*
1998 505,527 10,263 78,827 594,6171999 603,522 12,745 75,849 692,1162000 555,265 5,246 53,151 613,6622001 670,003 7,543 52,689 730,2352002 893,298 9,824 87,271 990,393Total 3,227,615 45,621 347,787 3,621,023
Source: LP database (period #178) and authors’ calculations.
*0.92 percent of loans with missing data on occupancy type are not included.
19120_6_QUERCIA 11/3/04 12:29 PM Page 586

HOUSING POLICY DEBATE
The Impact of North Carolina’s Predatory Lending Law 587
underscore the point that the emphasis here should be placed not on the rawpercentage changes, which are influenced by the increased national marketshare of our database in the postlaw period, but on the change in NorthCarolina relative to the nation and the comparison states. Using this criterion,we conclude that North Carolina’s overall level of subprime lending activityfell relative to that of other states. This postlaw decline has been well docu-mented in other studies.
However, this is only the beginning of the story, because there was a post-law growth of 72 percent in the number of subprime home purchase loans inNorth Carolina; this equals or exceeds the growth in some of the neighboringstates and in the rest of the country. This is an important finding because wecan then reasonably conclude that access to subprime credit for home buyerswas not limited by the implementation of the NC Act. This growth occurreddespite the fact that many or all provisions of the law also apply to purchasemoney mortgages.
If overall subprime lending in our North Carolina sample fell by 3 percentin the postlaw period while purchase loans increased significantly, then itstands to reason that subprime refinance lending fell dramatically after fullimplementation. In fact, the number of refinancing loans fell by 20 percent inNorth Carolina, while most comparison states experienced more modestlosses or small gains. Rather than bad news, we believe that this represents a
Table 3. Number of and Relative Change in Subprime Loans for Owner-OccupiedHomes by Purchase (First Lien) and Refinancing, Seven Quarters before and after the NC Act: Selected Southern States, the Remainder of the South, and theUnited States
Purpose of Loan
Purchase, First Lien Refinancing All*Percent Percent Percent
Prelaw Postlaw Change Prelaw Postlaw Change Prelaw Postlaw Change
North Carolina 4,429 7,612 71.9 19,551 15,575 –20.3 25,427 24,640 –3.1South Carolina 2,278 4,118 80.8 10,545 9,622 –8.8 13,787 14,261 3.4Virginia 3,773 6,715 78.0 14,565 15,341 5.3 19,913 26,158 31.4Tennessee 3,860 6,186 60.3 14,733 14,009 –4.9 19,687 21,871 11.1Georgia 8,312 10,781 29.7 20,941 24,081 15.0 30,966 38,759 25.2Rest of the South 56,351 78,397 39.1 130,258 136,748 5.0 198,649 233,381 17.5Entire United States 224,386 322,444 43.7 682,472 701,719 2.8% 959,917 1,119,594 16.6
Source: LP database (period #178) and authors’ calculations.
Note: The prelaw period runs from the first quarter of 1998 through the third quarter of 1999; the postlaw periodruns from the third quarter of 2000 through the first quarter of 2002.
*Second-lien purchase loans and loans with missing purchase/refinancing information are also included in theAll columns.
19120_6_QUERCIA 10/27/04 1:50 AM Page 587

positive impact of the NC Act, whose purpose is to discourage abusive lend-ing practices. Since most abusive subprime lending involves refinancing exist-ing loans, we would expect a good law to result in a decline in homerefinancing loans generally and in predatory refinancing loans in particular.The more detailed analysis presented next confirms that this is largely the case.
Access to loans and the cost of credit to high-risk borrowersConcerns have been raised about the potential of the NC Act to curtail
access to credit for high-risk borrowers. Using low income as a proxy for high-risk borrowers, Elliehausen and Staten (2002, 2003) found a decrease in thenumber of subprime loans to North Carolina borrowers with incomes of$50,000 or less. However, Ernst, Farris, and Stein (2002) found no change inlow-income borrowers’ access to subprime credit, and Harvey and Nigro(2002) found that the NC Act had no differential impact on borrowers withincomes of $25,000 or less.
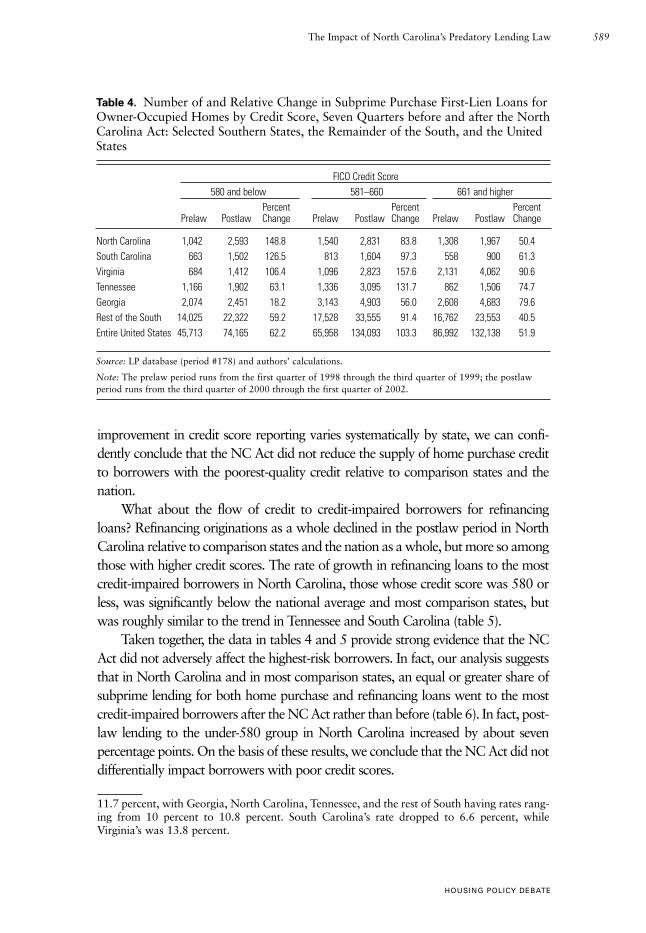
Rather than use income as a proxy for high-risk borrowers, we use theborrower’s credit score, a better measure of risk, to determine whether the NCAct curtailed the supply of credit to the least creditworthy borrowers, thosewith a credit score below 580 (Roche 2000).17 With respect to first mortgageloans for home purchase, the postlaw experience of North Carolina borrow-ers with low credit scores is equal to or significantly better than that of equallycredit-impaired borrowers in other states and regions. In our sample, homepurchase loans to North Carolina borrowers with credit scores below 580more than doubled since the NC Act was fully implemented, compared witha 62 percent increase nationally and smaller increases in all of the othercomparison states (table 4).
Postlaw purchase loans to borrowers in the middle credit score category(581 to 660) almost doubled in North Carolina, and those to borrowers withstrong credit scores of 661 or higher increased by more than 50 percent.Because of the growth in market coverage of the LP database and morecomplete reporting of credit scores in more recent years, we cannot put toomuch faith in the absolute numbers in table 4.18 However, as stated earlier,since there is no reason to believe that this growing market coverage or
FANNIE MAE FOUNDATION
588 Roberto G. Quercia, Michael A. Stegman, and Walter R. Davis
17 Borrowers with credit scores below 580 are generally considered B– and C– borrowers(Calomiris and Mason 1999).
18 Credit score reporting improved in all the comparison states and regions. In the prelawperiod, 20.5 percent of loans nationally had missing credit scores. For North Carolina, SouthCarolina, Tennessee, and the rest of the South, missing data rates range from 21.9 percent to22.8 percent. Only Georgia and Virginia had substantively different rates at 16.3 percent and17.3 percent, respectively. In the postlaw period, the national rate for missing credit scores was
19120_6_QUERCIA 10/27/04 1:50 AM Page 588
HOUSING POLICY DEBATE
The Impact of North Carolina’s Predatory Lending Law 589
improvement in credit score reporting varies systematically by state, we can confi-dently conclude that the NC Act did not reduce the supply of home purchase creditto borrowers with the poorest-quality credit relative to comparison states and thenation.
What about the flow of credit to credit-impaired borrowers for refinancingloans? Refinancing originations as a whole declined in the postlaw period in NorthCarolina relative to comparison states and the nation as a whole, but more so amongthose with higher credit scores. The rate of growth in refinancing loans to the mostcredit-impaired borrowers in North Carolina, those whose credit score was 580 orless, was significantly below the national average and most comparison states, butwas roughly similar to the trend in Tennessee and South Carolina (table 5).
Taken together, the data in tables 4 and 5 provide strong evidence that the NCAct did not adversely affect the highest-risk borrowers. In fact, our analysis suggeststhat in North Carolina and in most comparison states, an equal or greater share ofsubprime lending for both home purchase and refinancing loans went to the mostcredit-impaired borrowers after the NC Act rather than before (table 6). In fact, post-law lending to the under-580 group in North Carolina increased by about sevenpercentage points. On the basis of these results, we conclude that the NC Act did notdifferentially impact borrowers with poor credit scores.
11.7 percent, with Georgia, North Carolina, Tennessee, and the rest of South having rates rang-ing from 10 percent to 10.8 percent. South Carolina’s rate dropped to 6.6 percent, whileVirginia’s was 13.8 percent.
Table 4. Number of and Relative Change in Subprime Purchase First-Lien Loans forOwner-Occupied Homes by Credit Score, Seven Quarters before and after the NorthCarolina Act: Selected Southern States, the Remainder of the South, and the UnitedStates
FICO Credit Score580 and below 581–660 661 and higher
Percent Percent PercentPrelaw Postlaw Change Prelaw Postlaw Change Prelaw Postlaw Change
North Carolina 1,042 2,593 148.8 1,540 2,831 83.8 1,308 1,967 50.4South Carolina 663 1,502 126.5 813 1,604 97.3 558 900 61.3Virginia 684 1,412 106.4 1,096 2,823 157.6 2,131 4,062 90.6Tennessee 1,166 1,902 63.1 1,336 3,095 131.7 862 1,506 74.7Georgia 2,074 2,451 18.2 3,143 4,903 56.0 2,608 4,683 79.6Rest of the South 14,025 22,322 59.2 17,528 33,555 91.4 16,762 23,553 40.5Entire United States 45,713 74,165 62.2 65,958 134,093 103.3 86,992 132,138 51.9
Source: LP database (period #178) and authors’ calculations.
Note: The prelaw period runs from the first quarter of 1998 through the third quarter of 1999; the postlawperiod runs from the third quarter of 2000 through the first quarter of 2002.
19120_6_QUERCIA 10/27/04 1:50 AM Page 589

Changes in the postlaw cost of creditAs mentioned earlier, critics have argued that in attempting to filter out
abusive loans, state predatory lending laws also curtail the flow of subprimemortgage credit generally, thereby causing interest rates to rise above prelawrates. Elliehausen and Staten (2002, 2003), for example, make this case specif-ically with reference to the NC Act. Our analysis disputes their findings. If thedecline in subprime originations had been due to the reduced supply of capi-
FANNIE MAE FOUNDATION
590 Roberto G. Quercia, Michael A. Stegman, and Walter R. Davis
Table 6. Credit Score Distribution for All Subprime Loans for Owner-OccupiedHomes, Seven Quarters before and after the NC Act: Selected Southern States, theRemainder of the South, and the United States
FICO Credit Score
Prelaw Postlaw580 and Above 580 and AboveUnder 581–660 660 Under 581–660 660
North Carolina 31.4 40.5 28.1 38.2 37.1 24.6South Carolina 35.0 40.5 24.5 39.0 38.8 22.2Virginia 20.3 33.1 46.6 22.0 31.9 46.2Tennessee 34.5 41.4 24.1 33.9 42.7 23.4Georgia 27.8 39.5 32.7 29.4 39.6 31.1Rest of the South 31.8 37.3 30.9 32.7 38.3 29.0Entire United States 26.9 34.8 38.4 29.5 37.2 33.3
Source: LP database (period #178) and authors’ calculations.
Note: The prelaw period runs from the first quarter of 1998 through the third quarter of 1999; the postlawperiod runs from the third quarter of 2000 through the first quarter of 2002.
Table 5. Number of and Relative Change in Subprime Refinancing Loans forOwner-Occupied Homes by Credit Score, Seven Quarters before and after the NCAct: Selected Southern States, the Remainder of the South, and the United States
FICO Credit Score580 and below 581–660 661 and higher
Percent Percent PercentPrelaw Postlaw Change Prelaw Postlaw Change Prelaw Postlaw Change
North Carolina 4,950 5,867 18.5 6,213 5,335 –14.1 4,072 3,115 –23.5South Carolina 2,962 3,683 24.3 3,356 3,523 5.0 1,920 1,900 –1.0Virginia 2,564 3,519 37.2 4,229 4,283 1.3 5,386 5,762 7.0Tennessee 3,989 4,691 17.6 4,884 5,178 6.0 2,775 2,862 3.1Georgia 4,973 7,754 55.9 6,884 8,806 27.9 5,716 5,790 1.3Rest of the South 33,702 45,799 35.9 38,730 45,946 18.6 30,036 34,631 15.3Entire United States 153,618 216,093 40.7 192,402 230,917 20.0 199,506 186,230 –6.7
Source: LP database (period #178) and authors’ calculations.
Note: The prelaw period runs from the first quarter of 1998 through the third quarter of 1999; the postlawperiod runs from the third quarter of 2000 through the first quarter of 2002.
19120_6_QUERCIA 10/27/04 1:50 AM Page 590
HOUSING POLICY DEBATE
The Impact of North Carolina’s Predatory Lending Law 591
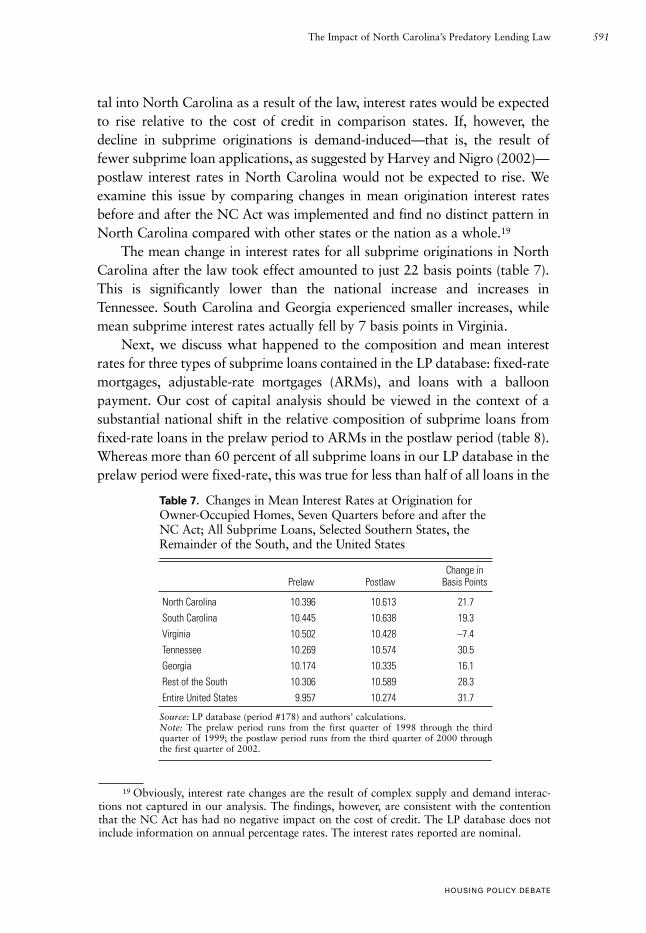
tal into North Carolina as a result of the law, interest rates would be expectedto rise relative to the cost of credit in comparison states. If, however, thedecline in subprime originations is demand-induced—that is, the result offewer subprime loan applications, as suggested by Harvey and Nigro (2002)—postlaw interest rates in North Carolina would not be expected to rise. Weexamine this issue by comparing changes in mean origination interest ratesbefore and after the NC Act was implemented and find no distinct pattern inNorth Carolina compared with other states or the nation as a whole.19
The mean change in interest rates for all subprime originations in NorthCarolina after the law took effect amounted to just 22 basis points (table 7).This is significantly lower than the national increase and increases inTennessee. South Carolina and Georgia experienced smaller increases, whilemean subprime interest rates actually fell by 7 basis points in Virginia.
Next, we discuss what happened to the composition and mean interestrates for three types of subprime loans contained in the LP database: fixed-ratemortgages, adjustable-rate mortgages (ARMs), and loans with a balloonpayment. Our cost of capital analysis should be viewed in the context of asubstantial national shift in the relative composition of subprime loans fromfixed-rate loans in the prelaw period to ARMs in the postlaw period (table 8).Whereas more than 60 percent of all subprime loans in our LP database in theprelaw period were fixed-rate, this was true for less than half of all loans in the
19 Obviously, interest rate changes are the result of complex supply and demand interac-tions not captured in our analysis. The findings, however, are consistent with the contentionthat the NC Act has had no negative impact on the cost of credit. The LP database does notinclude information on annual percentage rates. The interest rates reported are nominal.
Table 7. Changes in Mean Interest Rates at Origination forOwner-Occupied Homes, Seven Quarters before and after theNC Act; All Subprime Loans, Selected Southern States, theRemainder of the South, and the United States
Change inPrelaw Postlaw Basis Points
North Carolina 10.396 10.613 21.7South Carolina 10.445 10.638 19.3Virginia 10.502 10.428 –7.4Tennessee 10.269 10.574 30.5Georgia 10.174 10.335 16.1Rest of the South 10.306 10.589 28.3Entire United States 9.957 10.274 31.7
Source: LP database (period #178) and authors’ calculations.Note: The prelaw period runs from the first quarter of 1998 through the third quarter of 1999; the postlaw period runs from the third quarter of 2000 throughthe first quarter of 2002.
19120_6_QUERCIA 10/27/04 1:50 AM Page 591
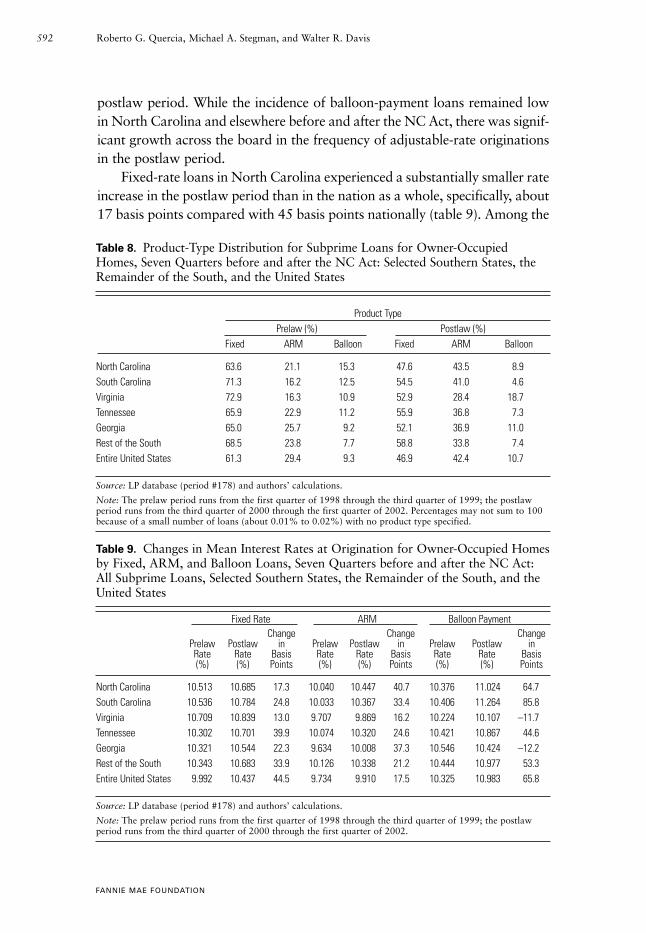
postlaw period. While the incidence of balloon-payment loans remained lowin North Carolina and elsewhere before and after the NC Act, there was signif-icant growth across the board in the frequency of adjustable-rate originationsin the postlaw period.
Fixed-rate loans in North Carolina experienced a substantially smaller rateincrease in the postlaw period than in the nation as a whole, specifically, about17 basis points compared with 45 basis points nationally (table 9). Among the
FANNIE MAE FOUNDATION
592 Roberto G. Quercia, Michael A. Stegman, and Walter R. Davis
Table 8. Product-Type Distribution for Subprime Loans for Owner-OccupiedHomes, Seven Quarters before and after the NC Act: Selected Southern States, theRemainder of the South, and the United States
Product TypePrelaw (%) Postlaw (%)
Fixed ARM Balloon Fixed ARM Balloon
North Carolina 63.6 21.1 15.3 47.6 43.5 8.9South Carolina 71.3 16.2 12.5 54.5 41.0 4.6Virginia 72.9 16.3 10.9 52.9 28.4 18.7Tennessee 65.9 22.9 11.2 55.9 36.8 7.3Georgia 65.0 25.7 9.2 52.1 36.9 11.0Rest of the South 68.5 23.8 7.7 58.8 33.8 7.4Entire United States 61.3 29.4 9.3 46.9 42.4 10.7
Source: LP database (period #178) and authors’ calculations.
Note: The prelaw period runs from the first quarter of 1998 through the third quarter of 1999; the postlawperiod runs from the third quarter of 2000 through the first quarter of 2002. Percentages may not sum to 100because of a small number of loans (about 0.01% to 0.02%) with no product type specified.
Table 9. Changes in Mean Interest Rates at Origination for Owner-Occupied Homesby Fixed, ARM, and Balloon Loans, Seven Quarters before and after the NC Act:All Subprime Loans, Selected Southern States, the Remainder of the South, and theUnited States
Fixed Rate ARM Balloon PaymentChange Change Change
Prelaw Postlaw in Prelaw Postlaw in Prelaw Postlaw inRate Rate Basis Rate Rate Basis Rate Rate Basis(%) (%) Points (%) (%) Points (%) (%) Points
North Carolina 10.513 10.685 17.3 10.040 10.447 40.7 10.376 11.024 64.7South Carolina 10.536 10.784 24.8 10.033 10.367 33.4 10.406 11.264 85.8Virginia 10.709 10.839 13.0 9.707 9.869 16.2 10.224 10.107 –11.7Tennessee 10.302 10.701 39.9 10.074 10.320 24.6 10.421 10.867 44.6Georgia 10.321 10.544 22.3 9.634 10.008 37.3 10.546 10.424 –12.2Rest of the South 10.343 10.683 33.9 10.126 10.338 21.2 10.444 10.977 53.3Entire United States 9.992 10.437 44.5 9.734 9.910 17.5 10.325 10.983 65.8
Source: LP database (period #178) and authors’ calculations.
Note: The prelaw period runs from the first quarter of 1998 through the third quarter of 1999; the postlawperiod runs from the third quarter of 2000 through the first quarter of 2002.
19120_6_QUERCIA 10/27/04 1:50 AM Page 592

HOUSING POLICY DEBATE
The Impact of North Carolina’s Predatory Lending Law 593
comparison states, only Virginia experienced a smaller increase (13 basispoints). Conversely, North Carolina experienced the highest mean rateincrease for ARMs, about 41 basis points, although Georgia and SouthCarolina (37 and 33 basis points, respectively) were close behind. Finally, themean interest rate on postlaw loans with balloon payments rose in NorthCarolina by about 65 basis points, the same as in the country as a whole.Virginia and Georgia experienced modest reductions in interest rates onballoon loans during the postlaw period.
The bottom line: The postlaw decline in predatory lending in North Carolina
To summarize, after the law was implemented, North Carolina experi-enced a sharper decrease in subprime lending than occurred in neighboringstates, with virtually all of the decline in the refinancing market. This patternis generally consistent with the intent of the law, which was to purge themarket of predatory loans, or seriously reduce their number, and predatorypractices are largely limited to the refinancing sector (ACORN 2000).
We systematically examine postlaw changes in refinancing originations intwo steps. First, we identify changes in the number of subprime refinancingoriginations for loans having at least one of three predatory features identifiedby the NC Act: loans with prepayment penalty terms of three years or more,loans with balloon payments, and loans with an LTV ratio of 110 percent ormore (which we use as a proxy for loans that provide no “net tangible bene-fits” to borrowers). If the NC Act is effective, we would expect to find agreater postlaw decline in abusive refinancing originations in North Carolinathan in comparison states. Next, we examine changes in the number of loanswith at least one of these predatory features.
During the postlaw period, refinancing loans with prepayment penalty termsof three years or more fell in North Carolina, while increasing in all comparisonstates (table 10). There was a 75 percent decline in extended-prepayment loans inNorth Carolina, compared with a 30 percent increase nationally. Comparisonstates and the remainder of the South all saw substantial increases, with extended-prepayment loans increasing by 271 percent in South Carolina.20
20 We should mention, though, that South Carolina still has a very low incidence of origi-nations with long prepayment penalties. For example, before the NC Act, only 5 percent ofSouth Carolina’s subprime originations had a three-year prepayment penalty or more. After thelaw, 16.6 percent of South Carolina’s originations had such penalties—this compares favorablywith a national average of 46.4 percent and with Virginia, Tennessee, and Georgia, which allaveraged over 60 percent.
19120_6_QUERCIA 10/27/04 1:50 AM Page 593
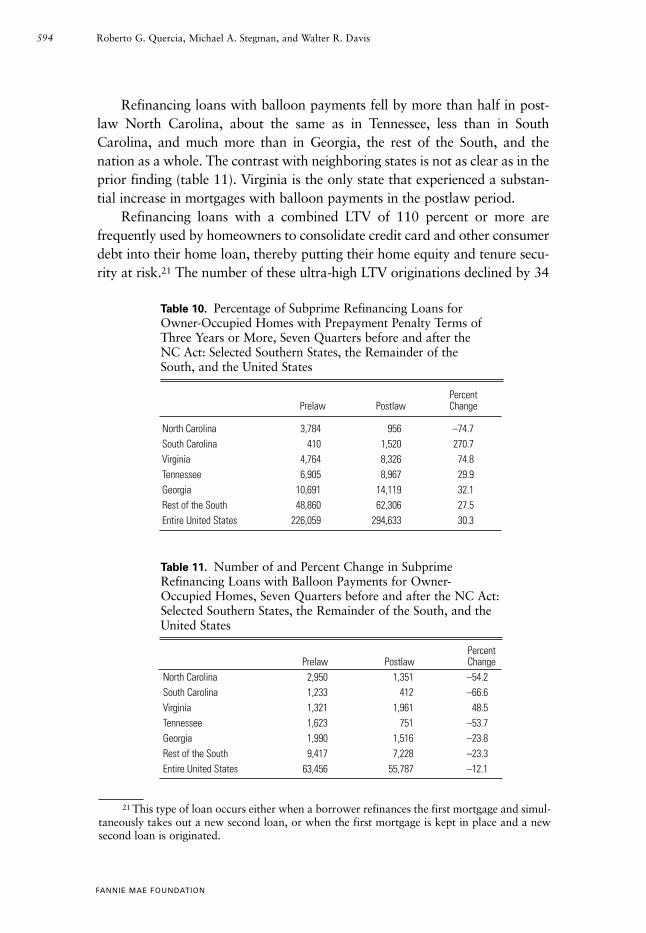
Refinancing loans with balloon payments fell by more than half in post-law North Carolina, about the same as in Tennessee, less than in SouthCarolina, and much more than in Georgia, the rest of the South, and thenation as a whole. The contrast with neighboring states is not as clear as in theprior finding (table 11). Virginia is the only state that experienced a substan-tial increase in mortgages with balloon payments in the postlaw period.
Refinancing loans with a combined LTV of 110 percent or more arefrequently used by homeowners to consolidate credit card and other consumerdebt into their home loan, thereby putting their home equity and tenure secu-rity at risk.21 The number of these ultra-high LTV originations declined by 34
FANNIE MAE FOUNDATION
594 Roberto G. Quercia, Michael A. Stegman, and Walter R. Davis
21 This type of loan occurs either when a borrower refinances the first mortgage and simul-taneously takes out a new second loan, or when the first mortgage is kept in place and a newsecond loan is originated.
Table 10. Percentage of Subprime Refinancing Loans forOwner-Occupied Homes with Prepayment Penalty Terms ofThree Years or More, Seven Quarters before and after theNC Act: Selected Southern States, the Remainder of theSouth, and the United States
PercentPrelaw Postlaw Change
North Carolina 3,784 956 –74.7South Carolina 410 1,520 270.7Virginia 4,764 8,326 74.8Tennessee 6,905 8,967 29.9Georgia 10,691 14,119 32.1Rest of the South 48,860 62,306 27.5Entire United States 226,059 294,633 30.3
Table 11. Number of and Percent Change in SubprimeRefinancing Loans with Balloon Payments for Owner-Occupied Homes, Seven Quarters before and after the NC Act:Selected Southern States, the Remainder of the South, and the United States
PercentPrelaw Postlaw Change
North Carolina 2,950 1,351 –54.2South Carolina 1,233 412 –66.6Virginia 1,321 1,961 48.5Tennessee 1,623 751 –53.7Georgia 1,990 1,516 –23.8Rest of the South 9,417 7,228 –23.3Entire United States 63,456 55,787 –12.1
19120_6_QUERCIA 10/27/04 1:50 AM Page 594
HOUSING POLICY DEBATE
The Impact of North Carolina’s Predatory Lending Law 595
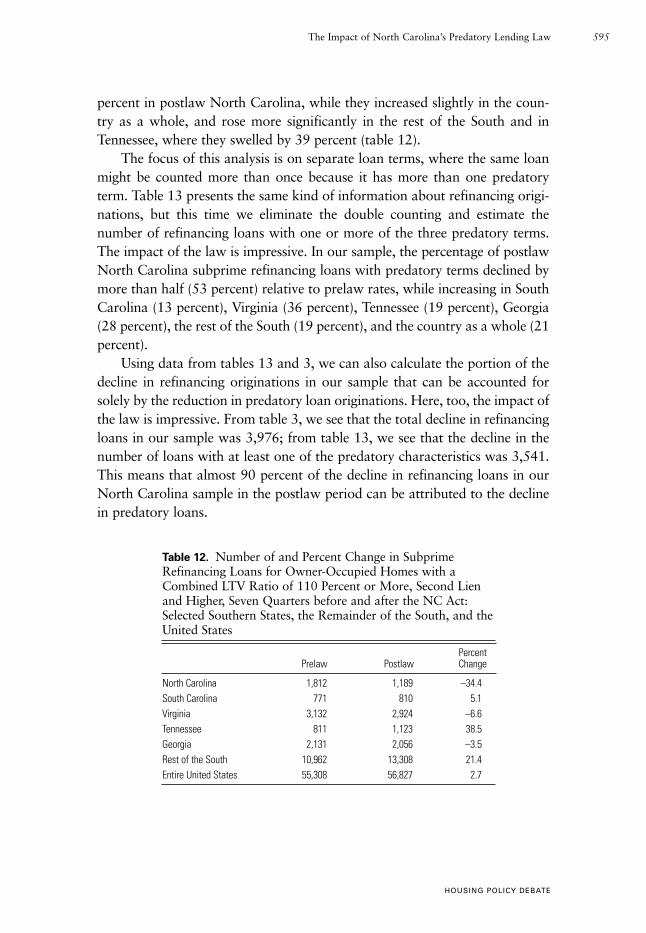
percent in postlaw North Carolina, while they increased slightly in the coun-try as a whole, and rose more significantly in the rest of the South and inTennessee, where they swelled by 39 percent (table 12).
The focus of this analysis is on separate loan terms, where the same loanmight be counted more than once because it has more than one predatoryterm. Table 13 presents the same kind of information about refinancing origi-nations, but this time we eliminate the double counting and estimate thenumber of refinancing loans with one or more of the three predatory terms.The impact of the law is impressive. In our sample, the percentage of postlawNorth Carolina subprime refinancing loans with predatory terms declined bymore than half (53 percent) relative to prelaw rates, while increasing in SouthCarolina (13 percent), Virginia (36 percent), Tennessee (19 percent), Georgia(28 percent), the rest of the South (19 percent), and the country as a whole (21percent).
Using data from tables 13 and 3, we can also calculate the portion of thedecline in refinancing originations in our sample that can be accounted forsolely by the reduction in predatory loan originations. Here, too, the impact ofthe law is impressive. From table 3, we see that the total decline in refinancingloans in our sample was 3,976; from table 13, we see that the decline in thenumber of loans with at least one of the predatory characteristics was 3,541.This means that almost 90 percent of the decline in refinancing loans in ourNorth Carolina sample in the postlaw period can be attributed to the declinein predatory loans.
Table 12. Number of and Percent Change in SubprimeRefinancing Loans for Owner-Occupied Homes with aCombined LTV Ratio of 110 Percent or More, Second Lienand Higher, Seven Quarters before and after the NC Act:Selected Southern States, the Remainder of the South, and theUnited States
PercentPrelaw Postlaw Change
North Carolina 1,812 1,189 –34.4South Carolina 771 810 5.1Virginia 3,132 2,924 –6.6Tennessee 811 1,123 38.5Georgia 2,131 2,056 –3.5Rest of the South 10,962 13,308 21.4Entire United States 55,308 56,827 2.7
19120_6_QUERCIA 10/27/04 1:50 AM Page 595

Conclusion
Our study posed the important question that other studies of the NC Actfailed to ask: Was the decline in overall subprime lending that occurred inNorth Carolina due to a decline in legitimate loans or to a decline in loans withabusive terms and features? To answer this question, we used loan-level datafrom the LP database to examine specific market segments and prevalent prac-tices in the subprime market. Studying loans down to their very terms (such asprepayment penalties of a certain length and balloon payments) gave us astrong indication of the frequency of predatory characteristics before and afterthe law was implemented.
Our analysis revealed that although the total volume of subprime origina-tions in North Carolina declined, the number of home purchase loans wasunaffected. While refinancing originations did fall, about 90 percent of thedecline was in predatory loans. These findings suggest strongly that the NCAct is doing what it is supposed to do.
These results also have policy significance beyond North Carolina. First,we have demonstrated that a carefully crafted law can selectively filter out themost egregious kinds of subprime loans without having to resort to punitiveenforcement provisions that increase the cost of securitization and otherwisecomplicate evaluation by Wall Street rating agencies. Despite having a form ofassignee liability, the NC Act has passed muster with Standard & Poor’s,which recently announced its intention to continue to rate structured finance
FANNIE MAE FOUNDATION
596 Roberto G. Quercia, Michael A. Stegman, and Walter R. Davis
Table 13. Number of and Percent Change in SubprimeRefinancing Loans for Owner-Occupied Homes with at LeastOne Predatory Characteristic,* Seven Quarters before andafter the NC Act: Selected Southern States, the Remainder of the South, and the United States
PercentPrelaw Postlaw Change
North Carolina 6,723 3,182 –52.7South Carolina 2,337 2,648 13.3Virginia 7,484 10,191 36.2Tennessee 8,088 9,598 18.7Georgia 11,944 15,225 27.5Rest of the South 60,230 71,939 19.4Entire United States 290,545 351,224 20.9
Source: LP database (period #178) and authors’ calculations.
Note: The prelaw period runs from the first quarter of 1998 through the third quar-ter of 1999; the postlaw period runs from the third quarter of 2000 through the firstquarter of 2002.
*Includes at least one of the following: a prepayment penalty of three or more years,a balloon payment, or a combined LTV of 110 percent or more.
19120_6_QUERCIA 10/27/04 1:50 AM Page 596

HOUSING POLICY DEBATE
The Impact of North Carolina’s Predatory Lending Law 597
transactions that include covered loans (“Standard & Poor’s Addresses”2004).
Although we do not take a position on the need for national legislation,the Comptroller of the Currency’s recent order exempting national banks andtheir operating subsidiaries from state and local predatory lending laws, whilenot having the resources in place to effectively police the market, suggests tous that the move toward national legislation may gain momentum(Comptroller of the Currency 2004). However, in the event that Congress doesdecide to act, we worry most about the possibility of ending up with a federalpredatory lending law that has no teeth and that preempts state and local lawswithout banning the kinds of abusive lending practices with which this articledeals. Of most concern would be provisions that would raise HOEPAinterest-rate and points-and-fees thresholds that define high-cost loans, waterdown disclosure requirements, or considerably weaken existing prepaymentpenalty protections. In our view, American home buyers who depend on thesubprime market for their mortgage loans would be better served by existingstate predatory lending laws than they would be by watered-down federallegislation. We would argue that the NC Act serves as a good template fornational legislation because it protects consumers against the harshest andmost abusive market practices without unduly restricting the flow of subprimemortgage credit.
AppendixKey features of the NC Act
The law amends N.C. Gen. Stat. § 24–1 et seq. to
• Prohibit prepayment penalties for home mortgage loans of $150,000 orless
• Prohibit flipping, where a lender repeatedly refinances an existing homeloan with new up-front fees
• Prohibit financing of up-front, single-premium insurance (monthlypayment insurance is still permitted)
• Prohibit, in high-cost home loans, the financing of fees, balloon payments,negative amortization, and lending without regard to a homeowner’s abil-ity to repay, where high-cost was defined generally as loans with fees inexcess of 5 percent or annual percentage rates over the federal law triggerlevel, which is currently more than 8 percent above comparable U.S.Treasury securities
19120_6_QUERCIA 10/27/04 1:50 AM Page 597
• Create a new section dealing with high-cost home loans—residential homeloans of $300,000 or less with
High fees—Loans for which the borrower is charged more than 5percent of the loan amount in up-front points, fees, or other charges.This 5 percent
Does not include escrow fees collected at closing or fees forappraisal, attorneys, credit reports, etc., that are paid to thirdparties
Does include fees paid directly by the borrower to mortgagebrokers, but does not include the back-end payments to brokersby lenders (yield spread premiums)
High interest rates—Loans for which the borrower is charged an inter-est rate that is 10 percent more (this was dropped to 8 percent morein October 2002) than the comparable Treasury bond rate or
Prepayment penalties longer than 30 months or more than 2 percentof the amount prepaid
• Restrict the terms of high-cost home loans to protect consumersNo refinancing of up-front fees and insurance premiumsCounseling for high-cost home loan borrowers required before closing
No balloon payments, where the borrower owes a large lump sum atsome point during the loan
No loans with negative amortization, where the loan amountincreases because the monthly payments do not cover the costs
No lending without consideration of the consumer’s ability to repay
Signed into law by Governor Jim Hunt on July 22, 1999. Most sections ofthe law went into effect on July 1, 2000. The prepayment penalty and flippingprohibitions went into effect on October 1, 1999.
Source: N.C. Session. Law 1999–332 §5.
Authors
Roberto G. Quercia is associate professor in the Department of City and RegionalPlanning and a senior research fellow at the Center for Community Capitalism in the KenanInstitute for Private Enterprise at the University of North Carolina at Chapel Hill. MichaelA. Stegman is MacRae Professor of Public Policy, Planning, and Business and Director ofthe Center for Community Capitalism at the University of North Carolina at Chapel Hill.
FANNIE MAE FOUNDATION
598 Roberto G. Quercia, Michael A. Stegman, and Walter R. Davis
19120_6_QUERCIA 10/27/04 1:50 AM Page 598

HOUSING POLICY DEBATE
The Impact of North Carolina’s Predatory Lending Law 599
Walter R. Davis is research director at the Center for Community Capitalism at theUniversity of North Carolina at Chapel Hill.
The authors acknowledge financial support from the Center for Responsible Lending(CRL). However, the views expressed here are those of the authors and do not necessarilyrepresent the views of CRL.
References
ACORN (Association for Community Organizations for Reform Now). 2000. Separateand Unequal: Predatory Lending in America. World Wide Web page <http://www. acorn.org/acorn10/predatorylending/plreports/separate.htm> (accessed February 19, 2004).
Calomiris, Charles W., and Joseph P. Mason. 1999. High Loan-to-Value MortgageLending: Problem or Cure? Washington, DC: AEI.
Carr, James H., and Lopa Kolluri. 2001. Predatory Lending: An Overview. Washington,DC: Fannie Mae Foundation.
Comptroller of the Currency. 2003. Economic Issues in Predatory Lending. OCC WorkingPaper.
Comptroller of the Currency. 2004. OCC Issues Final Rules on National Bank Preemptionand Visitorial Powers; Includes Strong Standard to Keep Predatory Lending out of NationalBanks. World Wide Web page <http://www.occ.treas.gov/scripts/NewsRelease.aspx?Doc=ZN9I8H7T.xml (accessed July 16, 2004).
Dreher, Langer, and Tomkies. 2004. Alerts. World Wide Web page <http://www.dltlaw.com/CM/Alerts/Alerts137.asp> (accessed June 3).
Elliehausen, Gregory, and Michael E. Staten. 2002. The Regulation of Subprime MortgageProducts: An Analysis of North Carolina’s Predatory Lending Law. Working Paper No. 66.Georgetown University, McDonough School of Business, Credit Research Center. WorldWide Web page <http://www.msb.edu/prog/crc/pdf/RevisedWP66.pdf> (accessed July 16,2004).
Elliehausen, Gregory, and Michael E. Staten. 2003. An Update on North Carolina’s High-Cost Mortgage Law. Unpublished paper. Georgetown University, McDonough School ofBusiness, Credit Research Center.
Ernst, Keith, John Farris, and Eric Stein. 2002. North Carolina’s Subprime Home LoanMarket after Predatory Lending Reform. A Report from the Center for ResponsibleLending. Durham, NC. Mimeo.
Expanded Guidance for Subprime Lending Programs. 2001. OCC Bulletin No. 2001–6.Washington, DC: Office of the Comptroller of the Currency.
Fannie, Freddie Continue to Eat Large Slice of the Subprime Pie. 2004. Inside B&CLending 9(2):2.
Gramlich, Edward M. 2000. Remarks at the Federal Reserve Bank of Philadelphia,Community and Consumer Affairs Department Conference on Predatory Lending.Philadelphia, December 6.
19120_6_QUERCIA 10/27/04 1:50 AM Page 599

Harvey, Keith D., and Peter J. Nigro. 2002. Do Predatory Lending Laws InfluenceMortgage Lending? An Analysis of the North Carolina Predatory Lending Law. Paperpresented at the Credit Research Center Conference on Subprime Lending, Washington,DC. September 17.
Joint Center for Housing Studies. 2002. State of the Nation’s Housing. Cambridge, MA:Harvard University.
Koren, Imma. 2003. Unprecedented Issuance and Strong Credit Performance Have Beenthe Dominant Themes in the Home Equity Sector in 2002; 2003 Is Shaping Up to Be Moreof the Same. Wachovia Securities Structured Products Research, March 4. World Wide Webpage <http://www.absnet.net/search/globalsearch.asp?global=1&q1=Unprecedented+Issuance+and+Strong+Credit+> (subscription required, accessed March 8).
Lenders Will Try to Pin Down Effects of NC Mortgage Law. 2001. Inside B&C Lending6(5):3.
Litan, Robert E. 2003a. North Carolina Predatory Lending Law: Still a Problem despiteNew Study. Regulatory Analysis 03–9. Washington, DC: AEI–Brookings Joint Center forRegulatory Studies.
Litan, Robert E. 2003b. Unintended Consequences: The Risks of Premature StateRegulation of Predatory Lending. World Wide Web page <http://www. aba.com/NR/rdonlyres/D881716A-1C75-11D5-AB7B-00508B95258D/28871/PredReport200991.pdf>(accessed August 18).
Morgan Stanley. 2002. Channel Check: Surprisingly Strong Subprime Growth. DiversifiedFinancials. August 1. World Wide Web page <http://www.butera-andrews.com/legislative-updates/directory/Media/other/MS-SubPrime.pdf> (accessed July 16, 2004).
Mortgage Bankers Association. 2004. Latest State Legislative and Regulatory News. WorldWide Web page <http://www.mortgagebankers.org/state_update/states.asp> (accessedFebruary 9).
Phillips-Patrick, Fred, Eric Hirschborn, Jonathan Jones, and John LaRocca, for the Officeof Thrift Supervision. 2000. What about Subprime Mortgages? Mortgage Market Trends4(1):1–21.
Quercia, Roberto G. 1997. House Value Appreciation among Older Homeowners:Implications for Reverse Mortgage Programs. Journal of Housing Research 8(2):201–23.
Quercia, Roberto G., Michael A. Stegman, and Walter R. Davis. 2003. The Impact ofNorth Carolina’s Anti–Predatory Lending Law: A Descriptive Assessment. Chapel Hill,NC: Center for Community Capitalism.
Reinvestment Fund. 2004. Predatory Lending: An Approach to Identify and UnderstandPredatory Lending. World Wide Web page <http://www.trfund.com/policy/predatory.lending.htm> (accessed June 4).
Richardson, Christopher A. 2003. Predatory Lending and Housing Disinvestment.Unpublished paper. World Wide Web page <http://wwwcpr.maxwell.syr.edu/seminar/spring 03/richardson.pdf> (accessed June 23).
FANNIE MAE FOUNDATION
600 Roberto G. Quercia, Michael A. Stegman, and Walter R. Davis
19120_6_QUERCIA 10/27/04 1:50 AM Page 600

HOUSING POLICY DEBATE
The Impact of North Carolina’s Predatory Lending Law 601
Roche, Ellen P. 2000. Statement of Ellen P. Roche [Director of Corporate Relations, FreddieMac]. Profitwise 10(3):8–9.
Standard & Poor’s Addresses North Carolina Anti–Predatory Lending Law. 2004. BusinessWire. World Wide Web page <http://home.businesswire.com/portal/site/google/index.isp?ndmViewId=news_view&newsId=20040218005778&newsLang=en> (accessed July16, 2004).
State of Washington. 2003. World Wide Web page <http://www.wa.gov/ago/householdfinance/terms.shtml> (accessed June 20, 2003).
State of Washington, Department of Financial Institutions. 2002. Expanded Report ofExaminations for Household Finance Corporation III as of April 30, 2000. World WideWeb page <http://news.bellinghamherald.com/downloads/hfc-document.pdf> (accessedJuly 16, 2004).
The 2003 Mortgage Market Statistical Annual. 2003. Washington, DC: Inside MortgageFinance Publications, Inc.
U.S. Department of Housing and Urban Development. 2000. Unequal Burden: Income andRacial Disparities in Subprime Lending in America. Washington, DC.
U.S. Department of Housing and Urban Development. 2001. Subprime and ManufacturedHome Lender List, 2001. World Wide Web page <http://www.huduser.org/datasets/manu.html> (last modified November 7, 2003).
Walters, Neal, and Sharon Hermanson. 2002. Older Subprime Refinance MortgageBorrowers. Washington, DC: AARP Public Policy Institute. World Wide Web page<http://research.aarp.org/consume/dd74_finance.html> (accessed June 20, 2003).
19120_6_QUERCIA 10/27/04 1:50 AM Page 601