the healthy farmland diet - ucsusa.org · the healthy farmland diet 3 farm landscape looks the way...
TRANSCRIPT
How Growing Less Corn Would Improve Our Health and Help America’s Heartland
THE HEALTHY FARMLAND DIET

2 UNION OF CONCERNED SCIENTISTS
While the federal government and leading nutrition experts call on Americans to adopt a healthier diet,
including more fruits and vegetables and less red meat, the nation’s massive agricultural land base today is not producing that healthy mix. Much of the food grown on U.S. farms takes the form of crops—largely corn and soybeans—that become processed food ingredients, feed for livestock, and raw materials for energy production. Corn alone is grown on 97 million acres, or nearly one-fourth of the nation’s agricultural land, and is responsible for
well over one-third of total U.S. food production by calorie content (Kirk 2011). Fruits and vegetables, by contrast, account for just a small fraction of U.S. farm acreage. Meanwhile, skyrocketing rates of diet-related illnesses are cutting lives short, reduc-ing our quality of life, and driving up our national health care bill.
Aligning U.S. farm production with nutritional objectives would make far greater sense. But if the majority of Americans started consuming more fruits and vegetables and less junk food and meat, would U.S. farmers and farmland be able to adjust? What would it take to spur the requisite changes in supply
and demand? And beyond improved nutrition, would any other benefits accrue from such a shift?
This report uses an economic model of global trade flows to investigate how the U.S. farm land-scape would be altered if Americans started eating more healthfully. To our knowledge, this is the first time that such an economic model has been so applied. We estimate how changes in demand for certain kinds of foods, and associated price shifts, could affect the supply and demand for other goods and food products, both domestically and through international trade.
Our analysis finds that transitioning the American diet to one that includes less processed food and meat, and more fruits and vegetables, would significantly shift today’s corn- and soybean-dominated farm landscape to one that is more diversified. In turn, a landscape that produces a healthier mix of crops and livestock for local and regional markets can have positive effects—not only in improved nutrition and health for consumers but also in the form of significant benefits for the environment and farm country’s local economies. It will take forward-looking policies to facilitate such a conversion, however, as it is no accident that our
Most Americans, including children, are not eating enough fruits and vegetables to meet daily dietary recommendations. ©
US
DA
/Lan
ce C
heun
g
3THE HEALTHY FARMLAND DIET
farm landscape looks the way it does. Decades of short-sighted decision making have created our current entrenched agricultural system. A new approach to farm policy—one that prioritizes the nation’s nutritional goals as well as its environmen-tal, land use, and rural economic goals—is needed to help us change course.
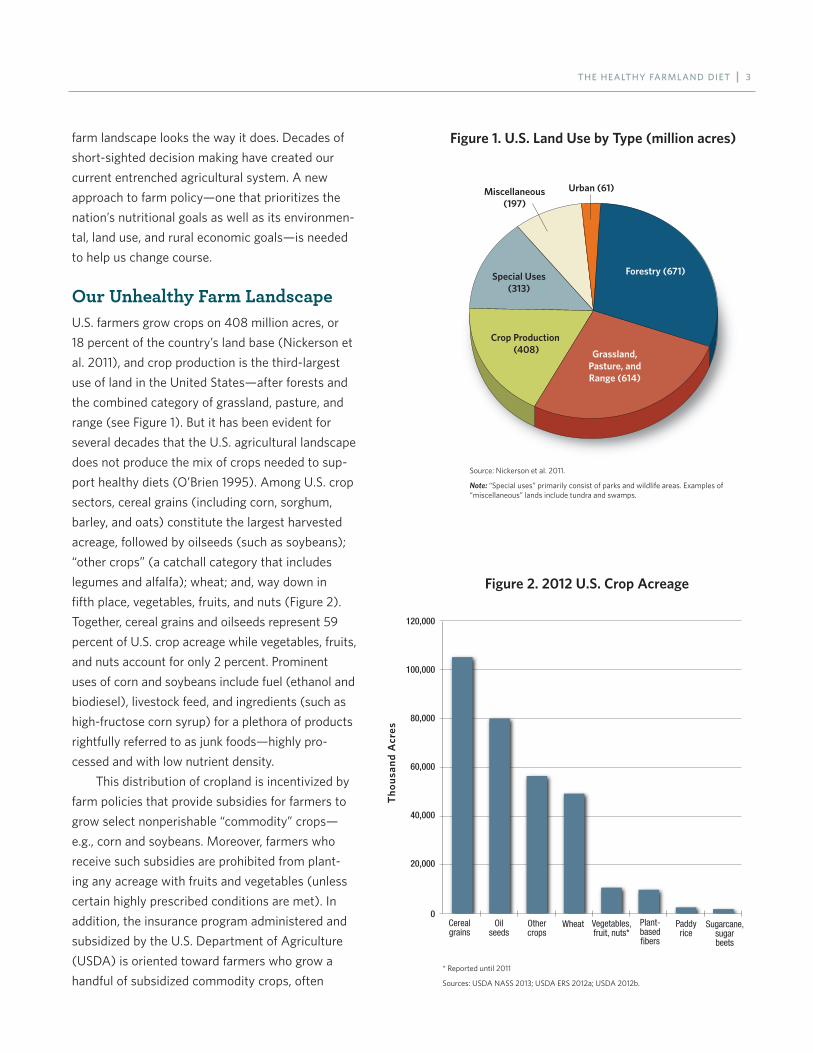
Our Unhealthy Farm LandscapeU.S. farmers grow crops on 408 million acres, or 18 percent of the country’s land base (Nickerson et al. 2011), and crop production is the third-largest use of land in the United States—after forests and the combined category of grassland, pasture, and range (see Figure 1). But it has been evident for several decades that the U.S. agricultural landscape does not produce the mix of crops needed to sup-port healthy diets (O’Brien 1995). Among U.S. crop sectors, cereal grains (including corn, sorghum, barley, and oats) constitute the largest harvested acreage, followed by oilseeds (such as soybeans); “other crops” (a catchall category that includes legumes and alfalfa); wheat; and, way down in fifth place, vegetables, fruits, and nuts (Figure 2). Together, cereal grains and oilseeds represent 59 percent of U.S. crop acreage while vegetables, fruits, and nuts account for only 2 percent. Prominent uses of corn and soybeans include fuel (ethanol and biodiesel), livestock feed, and ingredients (such as high-fructose corn syrup) for a plethora of products rightfully referred to as junk foods—highly pro-cessed and with low nutrient density.
This distribution of cropland is incentivized by farm policies that provide subsidies for farmers to grow select nonperishable “commodity” crops—e.g., corn and soybeans. Moreover, farmers who receive such subsidies are prohibited from plant-ing any acreage with fruits and vegetables (unless certain highly prescribed conditions are met). In addition, the insurance program administered and subsidized by the U.S. Department of Agriculture (USDA) is oriented toward farmers who grow a handful of subsidized commodity crops, often
Figure 1. U.S. Land Use by Type (million acres)
Figure 2. 2012 U.S. Crop Acreage
Urban (61)
Forestry (671)
Grassland,Pasture, andRange (614)
Crop Production (408)
Special Uses(313)
Miscellaneous(197)
Source: Nickerson et al. 2011.
Note: “Special uses” primarily consist of parks and wildlife areas. Examples of “miscellaneous” lands include tundra and swamps.
* Reported until 2011
Sources: USDA NASS 2013; USDA ERS 2012a; USDA 2012b.
Cerealgrains
120,000
100,000
80,000
60,000
40,000
20,000
0
Tho
usan
d A
cres
Oilseeds
Othercrops
Vegetables,fruit, nuts*
Plant-basedfibers
Paddyrice
Sugarcane,sugarbeets
Wheat

4 UNION OF CONCERNED SCIENTISTS
leaving many fruit and vegetable farmers (par-ticularly those growing a variety of crops) without access to adequate insurance and thus poorly posi-tioned to obtain needed credit (O’Hara 2012).
Shifts in U.S. Eating Habits Would Change Our Farm LandscapeThree previous studies have estimated changes in U.S. crop acreage that would result if Americans’ eating habits aligned with federal dietary guidelines (Ribera, Yue, and Holcomb 2012; Buzby, Wells, and Vocke 2006; Young and Kantor 1999). These studies assumed that fruit and vegetable acreage would rise in proportion to hypothetical increases in demand, and one of them also estimated changes in crop acreage resulting from decreased meat and processed food consumption under a healthy diet scenario. Other studies have examined either the
economic or landscape impacts of changes in diet (Mukhopadhyay and Thomassin 2012; Arnoult et al. 2010; Lock et al. 2010; Wirsenius, Azar, and Berndes 2010; Rickard and Gonsalves 2008), but until now, no study of which we are aware has used sophisticated economic modeling to estimate the changes in U.S. crop acreage that would result from shifts in the U.S. diet.
With the aid of such a model,1 we estimated the market changes that would result from Americans’ healthier food choices. To present a range of possible outcomes, we constructed sce-narios of diverse U.S. food consumption patterns (summarized in Table 1) that reflected either the federal dietary guidelines or the alternative rec-ommendations developed by nutrition experts at Harvard University (Harvard School of Public Health 2011; USDA and HHS 2010). We then estimated how the outputs of various food sectors would change in response to the scenarios’ hypothetical consumption changes. We further modeled how production choices would affect the use of inputs in these sectors, such as farmland and, in the case of meat or dairy products, animal feed. For example, a reduction in beef consumption would decrease the demand for grains, such as corn, that are used in cattle feed.
Table 1. Food Consumption Scenarios (in percentage changes from present overall demand)
Scenario“F&V”
(Scenario 1)“Harvard Dairy”
(Scenario 2)“MyPlate Dairy”
(Scenario 3)
“Harvard Protein”
(Scenario 4)
“MyPlate Protein”
(Scenario 5)“Harvard P&D”
(Scenario 6)“MyPlate P&D”
(Scenario 7)
Fruits and Vegetables
173%
Dairy -33% 100% -33% 100%
Red Meat -88% -50% -88% -50%
Poultry 8% -40% 8% -40%
Seafood 149% 260% 149% 260%
F&V = fruits, vegetables, and nutsP&D = protein and dairy
Our analysis finds that transitioning the American diet to one that includes less processed food and meat, and more fruits and vegetables, would significantly shift today’s corn- and soybean-dominated farm landscape to one that is more diversified.
5THE HEALTHY FARMLAND DIET
Further details about the model and our methodology are available online in the techni-cal appendices at www.ucsusa.org/hfdappendices. Appendix A provides a detailed overview of the model, and Appendix B presents a description of the relationship between the different model sec-tors and dietary guidelines. Detailed descriptions of the scenarios and of our simulation are given in Appendices C and D, respectively.
Findings Finding #1: If Americans ate fruits and vegetables
at recommended levels, U.S. farmers would grow
a lot more of these foods. We consider a scenario
that models a hypothetical 173 percent increase in overall U.S. demand for fruits, vegetables, and nuts (F&V), which we refer to as our F&V scenario. By our calculations, this is the percentage by which consumption of fresh fruits, vegetables, and nuts would need to increase in order for Americans to meet MyPlate dietary recommendations.2 Such an increase in consumer demand would have the fol-lowing impacts, as shown in Table 2 (p. 6):•ProductionofF&VonU.S.farmswouldincrease
by 88 percent.
•U.S.farmacreagedevotedtoF&Vwouldincrease by 50 percent, from 10.7 million acres to 16.1 million acres.
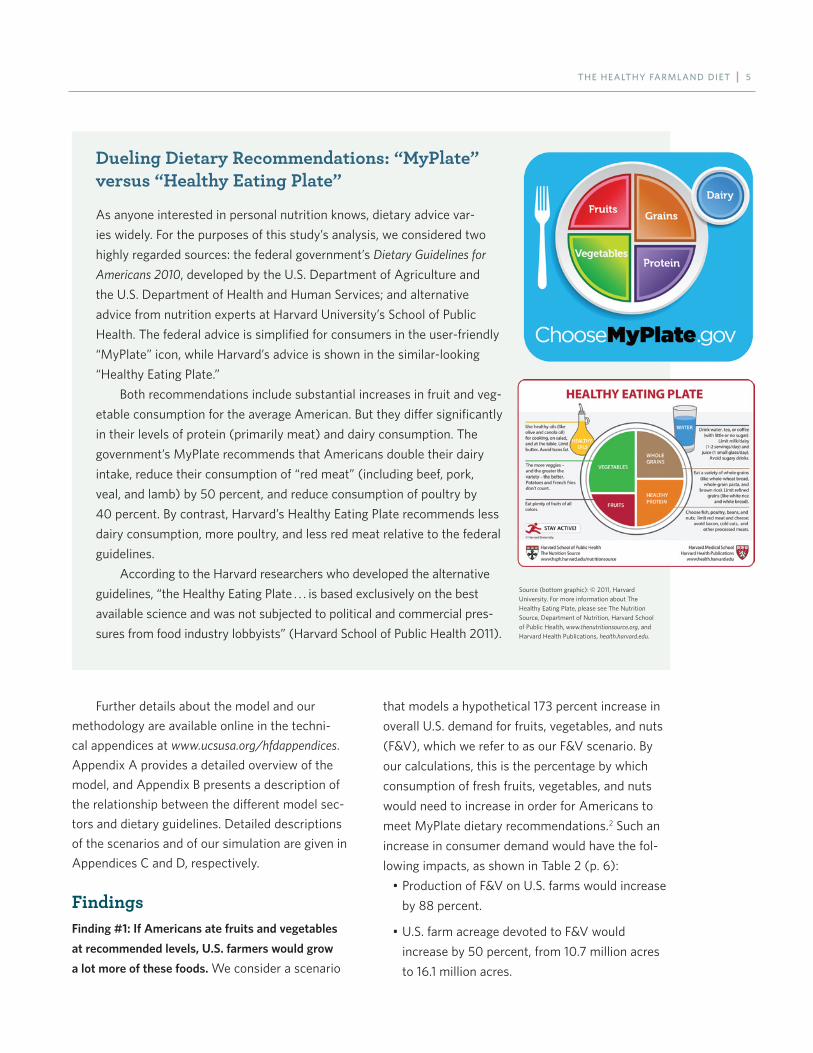
As anyone interested in personal nutrition knows, dietary advice var-ies widely. For the purposes of this study’s analysis, we considered two highly regarded sources: the federal government’s Dietary Guidelines for Americans 2010, developed by the U.S. Department of Agriculture and the U.S. Department of Health and Human Services; and alternative advice from nutrition experts at Harvard University’s School of Public Health. The federal advice is simplified for consumers in the user-friendly “MyPlate” icon, while Harvard’s advice is shown in the similar-looking “Healthy Eating Plate.”
Both recommendations include substantial increases in fruit and veg-etable consumption for the average American. But they differ significantly in their levels of protein (primarily meat) and dairy consumption. The government’s MyPlate recommends that Americans double their dairy intake, reduce their consumption of “red meat” (including beef, pork, veal, and lamb) by 50 percent, and reduce consumption of poultry by 40 percent. By contrast, Harvard’s Healthy Eating Plate recommends less dairy consumption, more poultry, and less red meat relative to the federal guidelines.
According to the Harvard researchers who developed the alternative guidelines, “the Healthy Eating Plate . . . is based exclusively on the best available science and was not subjected to political and commercial pres-sures from food industry lobbyists” (Harvard School of Public Health 2011).
Dueling Dietary Recommendations: “MyPlate” versus “Healthy Eating Plate”
Source (bottom graphic): © 2011, Harvard University. For more information about The Healthy Eating Plate, please see The Nutrition Source, Department of Nutrition, Harvard School of Public Health, www.thenutritionsource.org, and Harvard Health Publications, health.harvard.edu.
6 UNION OF CONCERNED SCIENTISTS
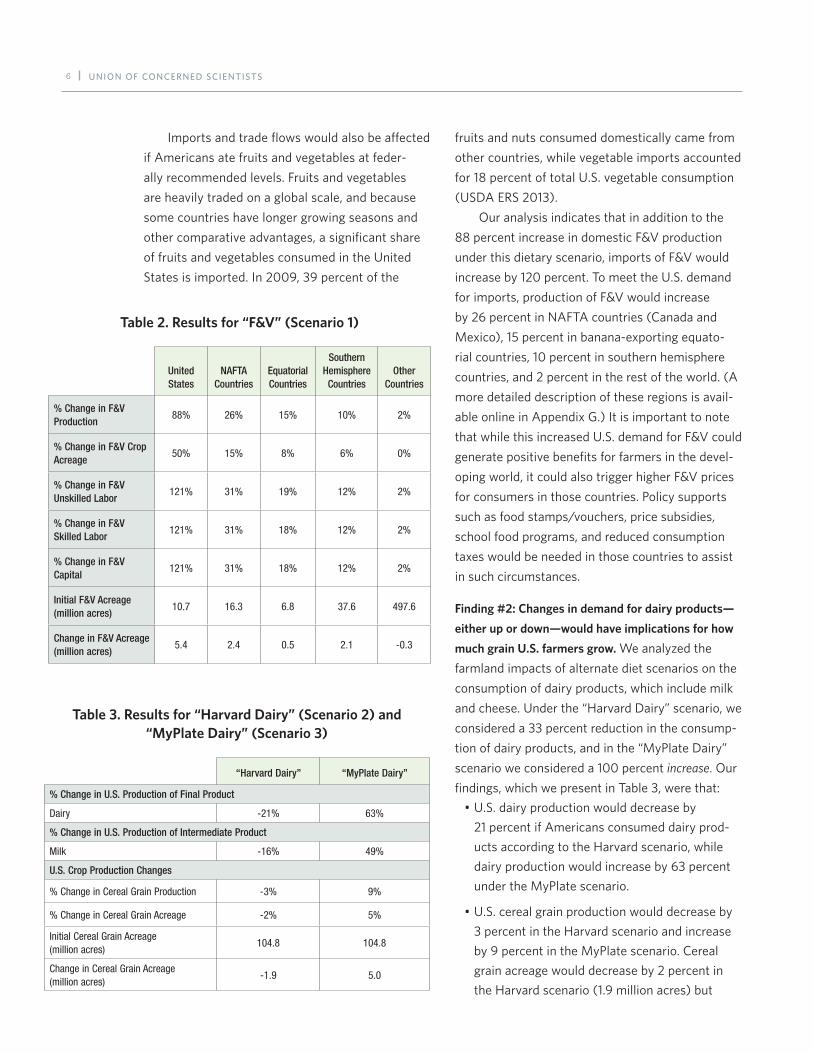
Imports and trade flows would also be affected if Americans ate fruits and vegetables at feder-ally recommended levels. Fruits and vegetables are heavily traded on a global scale, and because some countries have longer growing seasons and other comparative advantages, a significant share of fruits and vegetables consumed in the United States is imported. In 2009, 39 percent of the
fruits and nuts consumed domestically came from other countries, while vegetable imports accounted for 18 percent of total U.S. vegetable consumption (USDA ERS 2013).
Our analysis indicates that in addition to the 88 percent increase in domestic F&V production under this dietary scenario, imports of F&V would increase by 120 percent. To meet the U.S. demand for imports, production of F&V would increase by 26 percent in NAFTA countries (Canada and Mexico), 15 percent in banana-exporting equato-rial countries, 10 percent in southern hemisphere
countries, and 2 percent in the rest of the world. (A more detailed description of these regions is avail-able online in Appendix G.) It is important to note that while this increased U.S. demand for F&V could generate positive benefits for farmers in the devel-oping world, it could also trigger higher F&V prices for consumers in those countries. Policy supports such as food stamps/vouchers, price subsidies, school food programs, and reduced consumption taxes would be needed in those countries to assist in such circumstances.
Finding #2: Changes in demand for dairy products—
either up or down—would have implications for how
much grain U.S. farmers grow. We analyzed the farmland impacts of alternate diet scenarios on the consumption of dairy products, which include milk and cheese. Under the “Harvard Dairy” scenario, we considered a 33 percent reduction in the consump-tion of dairy products, and in the “MyPlate Dairy” scenario we considered a 100 percent increase. Our findings, which we present in Table 3, were that: •U.S.dairyproductionwoulddecreaseby
21 percent if Americans consumed dairy prod-ucts according to the Harvard scenario, while dairy production would increase by 63 percent under the MyPlate scenario.
•U.S.cerealgrainproductionwoulddecreaseby3 percent in the Harvard scenario and increase by 9 percent in the MyPlate scenario. Cereal grain acreage would decrease by 2 percent in the Harvard scenario (1.9 million acres) but
Table 2. Results for “F&V” (Scenario 1)
United States
NAFTA Countries
Equatorial Countries
Southern Hemisphere Countries
Other Countries
% Change in F&V Production
88% 26% 15% 10% 2%
% Change in F&V Crop Acreage
50% 15% 8% 6% 0%
% Change in F&V Unskilled Labor
121% 31% 19% 12% 2%
% Change in F&V Skilled Labor
121% 31% 18% 12% 2%
% Change in F&V Capital
121% 31% 18% 12% 2%
Initial F&V Acreage (million acres)
10.7 16.3 6.8 37.6 497.6
Change in F&V Acreage (million acres)
5.4 2.4 0.5 2.1 -0.3
Table 3. Results for “Harvard Dairy” (Scenario 2) and “MyPlate Dairy” (Scenario 3)
“Harvard Dairy” “MyPlate Dairy”
% Change in U.S. Production of Final Product
Dairy -21% 63%
% Change in U.S. Production of Intermediate Product
Milk -16% 49%
U.S. Crop Production Changes
% Change in Cereal Grain Production -3% 9%
% Change in Cereal Grain Acreage -2% 5%
Initial Cereal Grain Acreage (million acres)
104.8 104.8
Change in Cereal Grain Acreage (million acres)
-1.9 5.0
7THE HEALTHY FARMLAND DIET
increase by 5 percent in the MyPlate scenario (5 million acres).
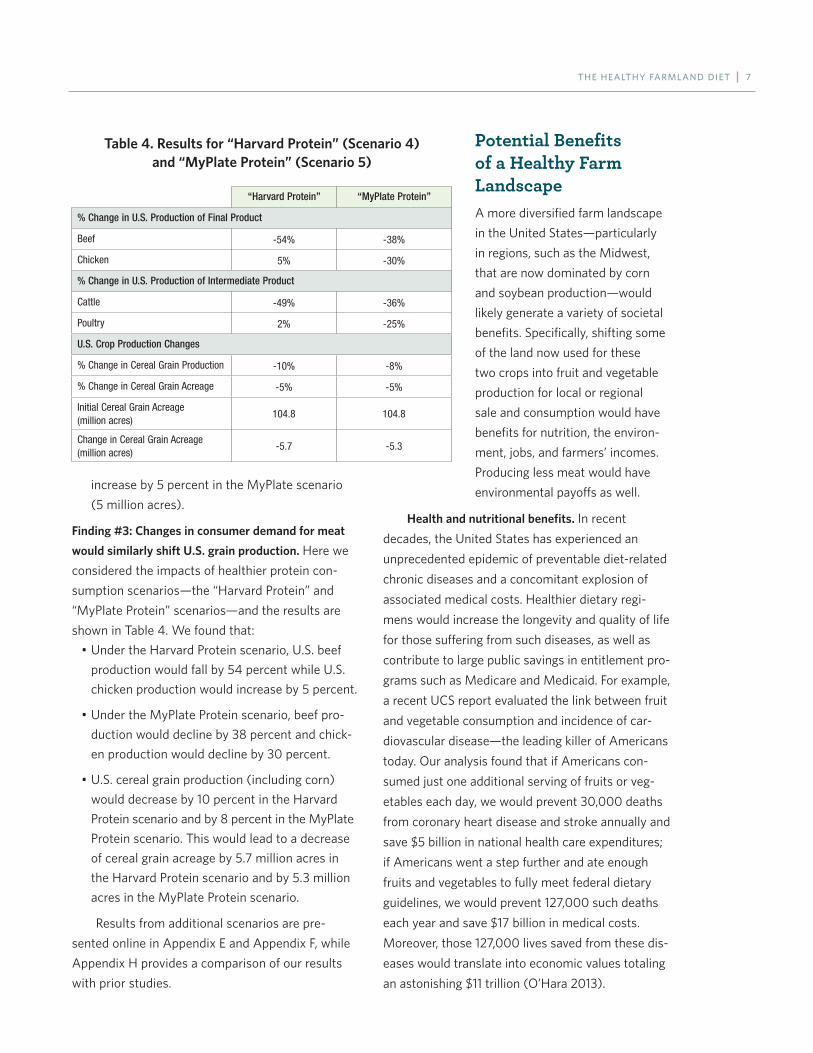
Finding #3: Changes in consumer demand for meat
would similarly shift U.S. grain production. Here we considered the impacts of healthier protein con-sumption scenarios—the “Harvard Protein” and “MyPlate Protein” scenarios—and the results are shown in Table 4. We found that:•UndertheHarvardProteinscenario,U.S.beef
production would fall by 54 percent while U.S. chicken production would increase by 5 percent.
•UndertheMyPlateProteinscenario,beefpro-duction would decline by 38 percent and chick-en production would decline by 30 percent.
•U.S.cerealgrainproduction(includingcorn)would decrease by 10 percent in the Harvard Protein scenario and by 8 percent in the MyPlate Protein scenario. This would lead to a decrease of cereal grain acreage by 5.7 million acres in the Harvard Protein scenario and by 5.3 million acres in the MyPlate Protein scenario.
Results from additional scenarios are pre-sented online in Appendix E and Appendix F, while Appendix H provides a comparison of our results with prior studies.
Potential Benefits of a Healthy Farm LandscapeA more diversified farm landscape in the United States—particularly in regions, such as the Midwest, that are now dominated by corn and soybean production—would likely generate a variety of societal benefits. Specifically, shifting some of the land now used for these two crops into fruit and vegetable production for local or regional sale and consumption would have benefits for nutrition, the environ-ment, jobs, and farmers’ incomes. Producing less meat would have environmental payoffs as well.
Health and nutritional benefits. In recent
decades, the United States has experienced an
unprecedented epidemic of preventable diet-related
chronic diseases and a concomitant explosion of
associated medical costs. Healthier dietary regi-
mens would increase the longevity and quality of life
for those suffering from such diseases, as well as
contribute to large public savings in entitlement pro-
grams such as Medicare and Medicaid. For example,
a recent UCS report evaluated the link between fruit
and vegetable consumption and incidence of car-
diovascular disease—the leading killer of Americans
today. Our analysis found that if Americans con-
sumed just one additional serving of fruits or veg-
etables each day, we would prevent 30,000 deaths
from coronary heart disease and stroke annually and
save $5 billion in national health care expenditures;
if Americans went a step further and ate enough
fruits and vegetables to fully meet federal dietary
guidelines, we would prevent 127,000 such deaths
each year and save $17 billion in medical costs.
Moreover, those 127,000 lives saved from these dis-
eases would translate into economic values totaling
an astonishing $11 trillion (O’Hara 2013).
Table 4. Results for “Harvard Protein” (Scenario 4) and “MyPlate Protein” (Scenario 5)
“Harvard Protein” “MyPlate Protein”
% Change in U.S. Production of Final Product
Beef -54% -38%
Chicken 5% -30%
% Change in U.S. Production of Intermediate Product
Cattle -49% -36%
Poultry 2% -25%
U.S. Crop Production Changes
% Change in Cereal Grain Production -10% -8%
% Change in Cereal Grain Acreage -5% -5%
Initial Cereal Grain Acreage (million acres)
104.8 104.8
Change in Cereal Grain Acreage (million acres)
-5.7 -5.3
8 UNION OF CONCERNED SCIENTISTS
Shifting land into fruit and vegetable produc-tion in the Midwest and other agricultural regions could help achieve such health benefits by boosting the supply of these foods in local markets. Because shorter supply chains—such as direct farm-to- consumer sales—require minimal processing, they are an advantageous way to distribute fresh produce. Research also shows that compared with supermar-kets, local food markets promote increased con-sumption of fresh fruits and vegetables (Freedman et al. 2013; Evans et al. 2012; Herman et al. 2008; Anderson et al. 2001). Even now, fruits, vegetables, and nuts constitute 65 percent of local food sales (Low and Vogel 2011). These facts suggest that bol-stering local markets would help improve nutrition and thus lead to better health outcomes.
Environmental benefits. The present farming situation, in which corn and soybeans dominate the landscape of the nation’s agricultural heartland in monocultures or near-monocultures, has a variety of environmental consequences. Monocrop systems are ideal incubators for pest and weed proliferation, which in turn necessitates extensive use of toxic insecticides and herbicides. Monocropping also reduces soil fertility (UCS 2013). Corn in particular is a nutrient-hungry crop and requires intensive
application of fertilizer. The resulting runoff or leaching of fertilizer into streams and rivers leads
to fish-killing “dead zones,” localized drinking water
pollution, and emissions of nitrous oxide—a heat-
trapping gas with a large global warming potential
(Gurian-Sherman 2011; UCS 2011).
Today’s excess consumption of meat also has
environmental implications. U.S. livestock produc-
tion is increasingly taking place in large and crowd-
ed CAFOs (confined animal-feeding operations),
which rely on heavy use of antibiotics (thereby
reducing their effectiveness for human medical
treatment), cause significant air and water pollu-
tion, and through their foul odors reduce the quality
of life and property values in nearby neighborhoods
(Gurian-Sherman 2008). Beef production in partic-
ular is a significant source of global warming emis-
sions: cattle require large areas of pasture to feed
and grow, and clearing land to develop pasture for
beef production is a driver of deforestation in some
countries—another contributor to global climate
change (Boucher et al. 2012; Boucher et al. 2011).
Moreover, beef and dairy cows emit significant
amounts of methane—itself a potent global warm-
ing gas (Gurian-Sherman 2011).
A farm landscape that included less corn and
less meat production would avoid some of these
negative environmental impacts.
Local economic benefits. Numerous studies
have indicated that a shift to healthier diets could
provide important economic opportunities for
farmers, including those that sell “locally” through
shorter supply chains (Tootelian, Mikhailitchenko,
and Varshney 2012; Conner et al. 2008; Rickard
and Gonsalves 2008; Cantrell et al. 2006). One
recent study specifically estimated the economic
impacts if farmers in six Midwestern states—
Illinois, Indiana, Iowa, Michigan, Minnesota, and
Wisconsin—shifted some of their corn and soybean
cropland to seasonal production of fresh fruits
and vegetables. Evaluating a scenario in which
farmers within each state satisfied its in-season
consumer demand for fresh produce, the research-
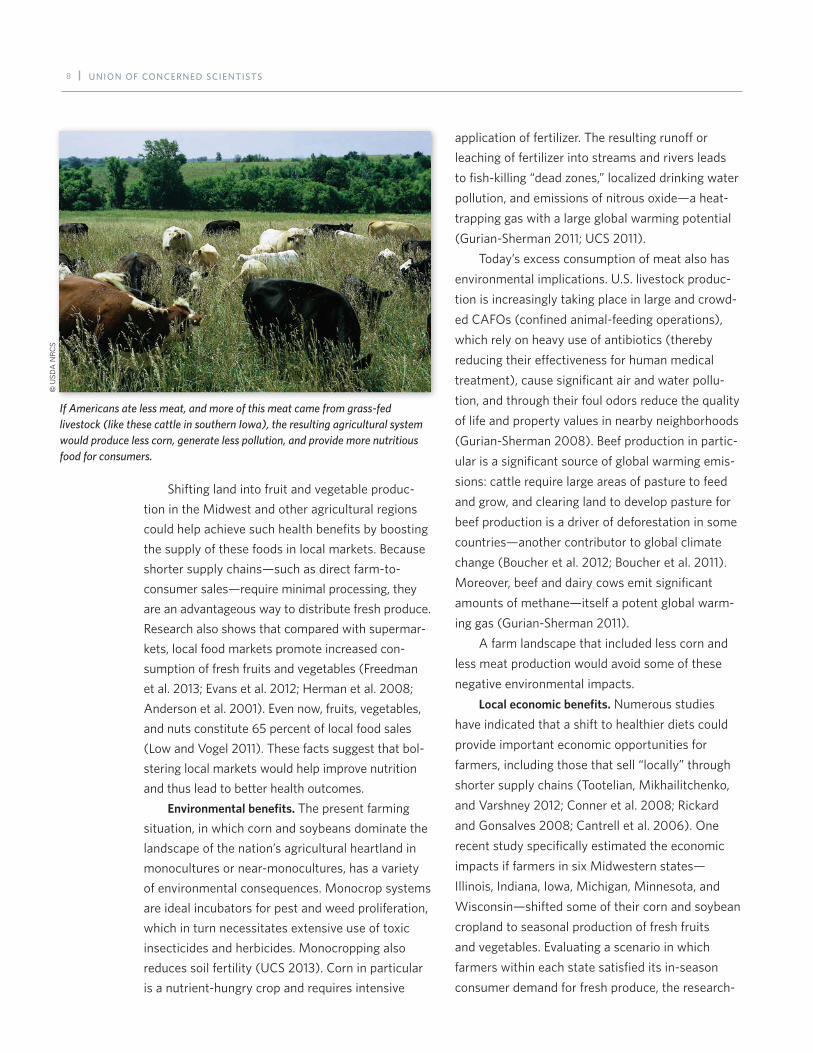
If Americans ate less meat, and more of this meat came from grass-fed livestock (like these cattle in southern Iowa), the resulting agricultural system would produce less corn, generate less pollution, and provide more nutritious food for consumers.
© U
SD
A N
RC
S
9THE HEALTHY FARMLAND DIET
ers found that such a shift would generate 6,724
new jobs and $336 million in additional income for
farmers. This fruit and vegetable production resulted in a 6.7-fold increase in labor income and a 3.6-fold increase in jobs, compared with an equivalent acreage of cropland in corn and soybean production (Swenson 2010).
Local food systems also have an economic rip-ple effect. Farmers who sell locally are more likely to purchase intermediate inputs and equipment from local companies and hire local labor, spur-ring further economic development in the region
(Schmit, Jablonksi, and Mansury 2013). In addition, local foods can provide market access and busi-ness opportunities that enable new farmers to get started. Given the aging of U.S. farmers—their aver-age age in 2007 was 57 (USDA NASS 2009)—and the high fixed costs associated with acquiring land and machinery, selling locally will be an important way to get a new generation into the business of farming. Moreover, selling locally can help foster entrepreneurship among farmers and enable their development of business skills that increase their chances of success (Feenstra et al. 2003; Lyson, Gillespie, and Hilchey 1995).
Conclusions and RecommendationsDedicating more agricultural land across the United States to healthy food produc-tion would further the expansion of local and regional food systems, which have already seen rapid growth in recent years. For example, there has been a remarkable increase in the number of U.S. farmers’ markets, from 340 in 1970 to 8,144 in 2013 (USDA AMS 2013; Brown 2001); and the number of farm-to-school programs has grown from six in 2001 to more than 10,000 today (National Farm to School Network 2013). As our analysis sug-gests, the United States has the potential to further diversify its farming systems to produce the variety of healthy foods its people need.
Transitioning from the current U.S. farm landscape to one that produced this healthy mix would have potential benefits not just for public health and nutrition; the shift would also reduce agriculture’s environmental footprint and provide new opportuni-ties for American farmers and farm communities. Such a transition could set the stage for a new era of prosperity built around produce-heavy regional food systems and fewer but more efficient livestock-production systems generating higher-quality meat.
This goal of aligning U.S. agricultural produc-tion with healthy eating habits can be attained with targeted, smart, and relatively low-cost farm-policy investments that rectify shortcomings along the U.S. fruit and vegetable supply chain. Reshaping farm policy for this purpose has considerable public sup-port—84 percent of U.S. adults endorse government policies that improve the affordability of fruits and vegetables (Morain and Mello 2013).
One study found that if farmers in six Midwestern states shifted some of their cropland to fruits and vegetables, it would generate 6,724 new jobs and $336 million in additional income.
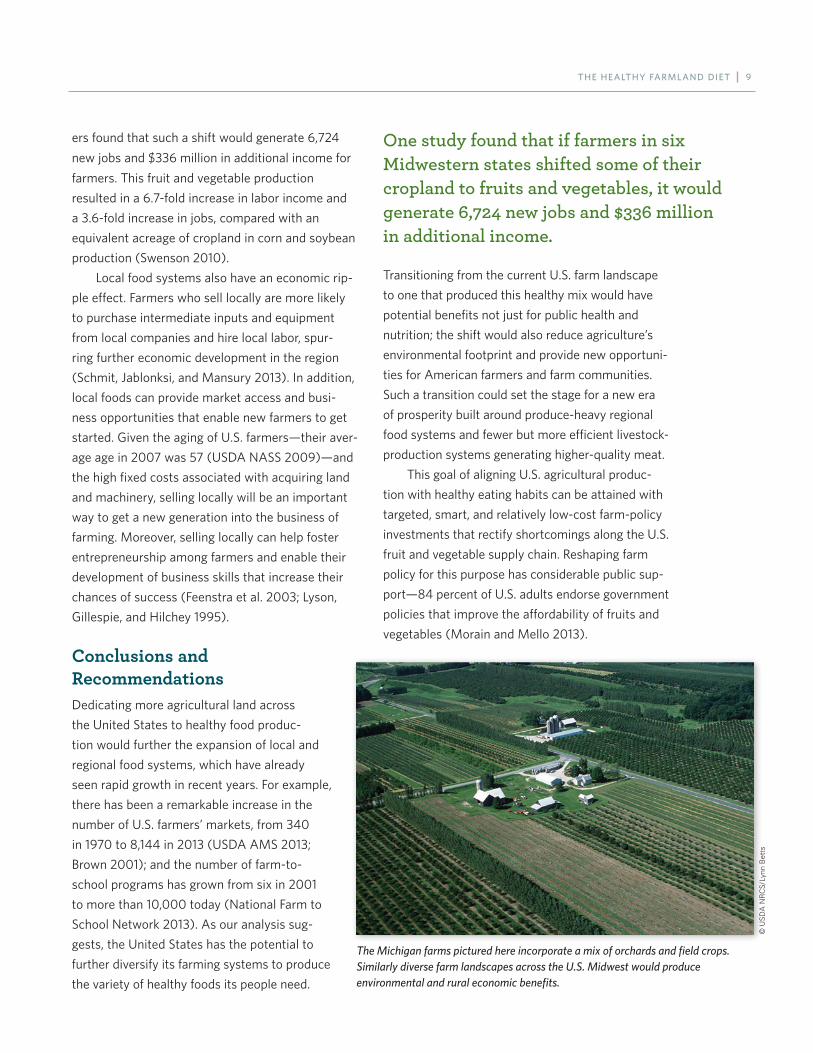
The Michigan farms pictured here incorporate a mix of orchards and field crops. Similarly diverse farm landscapes across the U.S. Midwest would produce environmental and rural economic benefits.
© U
SD
A N
RC
S/L
ynn
Bet
ts
10 UNION OF CONCERNED SCIENTISTS
Our recommendations for spurring this transi-tion are straightforward:
Congress should fund, and the USDA should
implement, programs that help farmers grow more
fruits and vegetables. There are several ways this can be accomplished:
•Removefruitandvegetableplantingrestrictionsfrom federal commodity subsidy programs that disqualify farmers for growing these healthy foods.
•Developeffectivecropinsuranceprogramsgeared for diversified farms—particularly those growing a variety of fruits and vegetables—to help those establishments’ farmers manage their risks and induce them to sell in local markets (O’Hara 2012).
•Investinpubliclyfundedresearchaimedatpro-ducing higher-yielding fruit and vegetable crops, generating new varieties and adapting them to local conditions, and rendering fruits and veg-etables more resilient to adverse weather events and other farming challenges.
Congress and the USDA should also fund and
implement policies to improve consumer access to
fruits and vegetables. In particular, they should:•Bolsterprogramsthatprovidegrantsandloans
to help build market infrastructure such as food retailers, farmers’ markets, and food hubs.
•Reduceobstaclesfacingconsumerswhowishtoredeem nutrition-assistance benefits at local food markets. One way to do this is to provide matching financial incentives for those hoping to use their benefits when buying food directly from farmers.
Congress should curb subsidies that promote
production of ingredients for unhealthy processed
food and instead make modest but increased invest-
ments in programs, such as those listed above, that
help farmers grow the foods Americans need.
The goal of aligning U.S. agricultural production with healthy eating habits can be attained with targeted, smart, and relatively low-cost farm-policy investments.
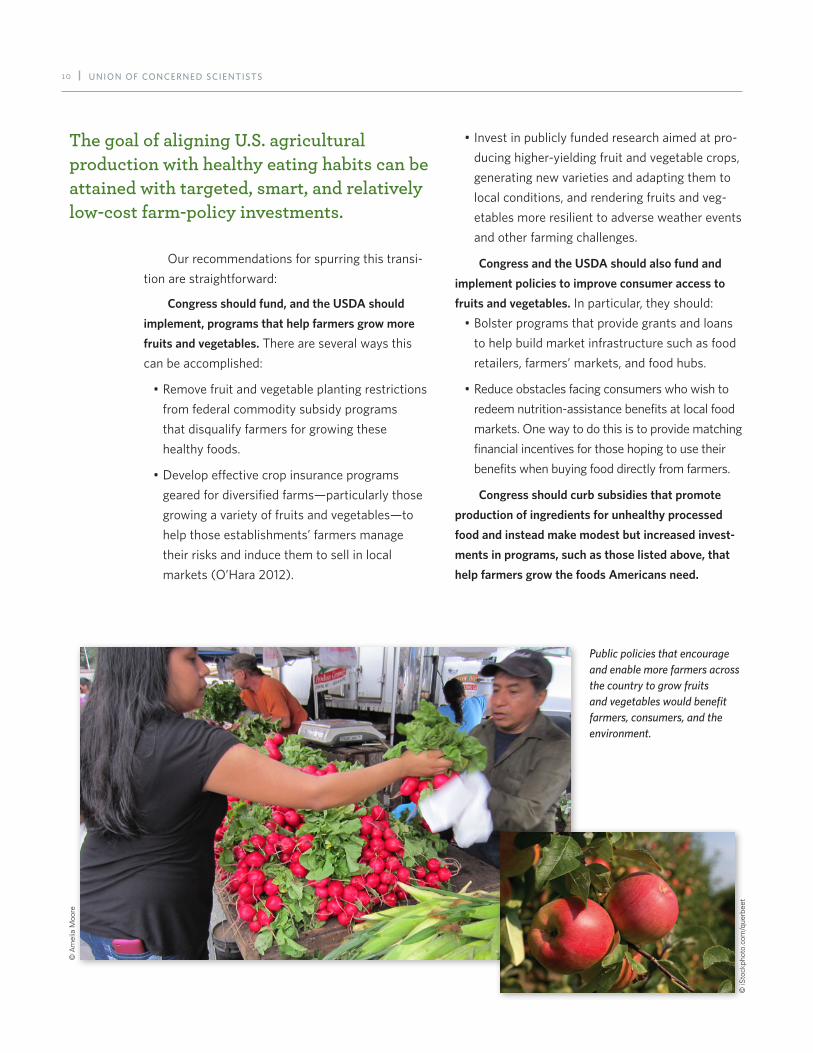
Public policies that encourage and enable more farmers across the country to grow fruits and vegetables would benefit farmers, consumers, and the environment.
© A
mel
ia M
oore
© iS
tock
phot
o.co
m/q
uerb
eet

11THE HEALTHY FARMLAND DIET
Anderson, J.V., D.I. Bybee, R.M. Brown, D.F. McLean, E.M. Garcia, L.M. Breer, and B.A. Schillo. 2001. 5 a day fruit and vegetable intervention improves consumption in a low income population. Journal of the American Dietetic Association 101(2):195–202.
Arnoult, M.H., P.J. Jones, R.B. Tranter, R. Tiffin, W.B. Traill, and J. Tzanopoulos. 2010. Modelling the likely impact of healthy eating guidelines on agricultural production and land use in England and Wales. Land Use Policy 27(4):1046–1055.
Boucher, D., P. Elias, L. Goodman, C. May-Tobin, K. Mulik, and S. Roquemore. 2012. Grade A choice? Solutions for deforestation-free meat. Cambridge, MA: Union of Concerned Scientists.
Boucher, D., P. Elias, K. Lininger, C. May-Tobin, S. Roquemore, and E. Saxon. 2011. The root of the problem: What’s driving tropical deforestation today? Cambridge, MA: Union of Concerned Scientists.
Brown, A. 2001. Counting farmers markets. The Geographical Review 91(4):655–674.
Buzby, J.C., H.F. Wells, and G. Vocke. 2006. Possible implications for U.S. agriculture from adoption of select dietary guidelines, Economic Research Report Number 31. Washington, DC: U.S. Department of Agriculture.
Cantrell, P., D. Conner, G. Erickcek, and M.W. Hamm. 2006. Eat fresh and grow jobs, Michigan. Traverse City, MI: Michigan Land Use Institute.
Conner, D.S., W.A. Knudson, M.W. Hamm, and H.C. Peterson. 2008. The food system as an economic driver: Strategies and applications for Michigan. Journal of Hunger & Environmental Nutrition 3(4):371–383.
Evans, A.E., R. Jennings, A.W. Smiley, J.L. Medina, S.V. Sharma, R. Rutledge, M.H. Stigler, and D.M. Hoelscher. 2012. Introduction of farm stands in low-income communities increases fruit and vegetable [consumption] among community residents. Health and Place 18(5):1137–1143.
Feenstra, G.W., C.C. Lewis, C.C. Hinrichs, G.W. Gillespie Jr., and D. Hilchey. 2003. Entrepreneurial outcomes and enterprise size in U.S. retail farmers markets. American Journal of Alternative Agriculture 18(1):46–55.
Freedman, D.A., S.K. Choi, T. Hurley, E. Anadu, and J.R. Hébert. 2013. A farmers’ market at a federally qualified health center improves fruit and vegetable intake among low-income diabet-ics. Preventive Medicine 56(5):288–292.
Gurian-Sherman, D. 2011. Raising the steaks: Global warming and pasture-raised beef production in the United States. Cambridge, MA: Union of Concerned Scientists.
Gurian-Sherman, D. 2008. CAFOs uncovered: The untold costs of confined animal feeding operations. Cambridge, MA: Union of Concerned Scientists.
Harvard School of Public Health. 2011. Healthy eating plate: Har-vard’s new guide to healthy eating. Online at http://www.hsph.harvard.edu/nutritionsource/healthy-eating-plate, accessed on August 13, 2013.
Herman, D.R., G.G. Harrison, A.A. Afifi, and E. Jenks. 2008. Effect of a targeted subsidy on intake of fruits and vegetables among low-income women in the special supplemental nutrition program for women, infants, and children. American Journal of Public Health 98(1):1–8.
Kirk, R. 2011. Stock market notes. Online at http://stockmarketnotes. blogspot.com/2011/04/which-country-is-worlds-largest-food.html, accessed on August 13, 2013.
Lock, K., R.D. Smith, A.D. Dangour, M. Keogh-Brown, G. Pigatto, C. Hawkes, R.M. Fisberg, and Z. Chalabi. 2010. Health, agricultural, and economic effects of adoption of healthy diet recommendations. Lancet 376(9753):1699–1709.
Low, S.A., and S. Vogel. 2011. Direct and intermediated marketing of local foods in the United States, Economic Research Report Number 128. Washington, DC: U.S. Department of Agriculture, Economic Research Service.
Lyson, T.A., G.W. Gillespie, Jr., and D. Hilchey. 1995. Farmers markets and the local community: Bridging the formal and informal economy. American Journal of Alternative Agriculture 10(3):108–113.
Morain, S., and M.M. Mello. 2013. Survey finds public support for legal interventions directed at health behavior to fight non-communicable disease. Health Affairs 32(3):486–496.
Mukhopadhyay, K., and P.J. Thomassin. 2012. Economic impact of adopting healthy diet in Canada. Journal of Public Health 20:639–652.
National Farm to School Network. 2013. Nourishing kids and community. Online at http://www.farmtoschool.org/aboutus.php, accessed on May 31, 2013.
Nickerson, C., R. Ebel, A. Borchers, and F. Carriazo. 2011. Major uses of land in the United States, 2007, Economic Information Bulletin Number 89. Washington, DC: U.S. Department of Agriculture.
O’Brien, P. 1995. Dietary shifts and implications for U.S. agriculture. American Journal of Clinical Nutrition 61(6 Suppl.):1390S–1396S.
O’Hara, J.K. 2013. The $11-trillion reward: How simple dietary chang-es can save lives and money, and how we get there. Cambridge, MA: Union of Concerned Scientists.
O’Hara, J.K. 2012. Ensuring the harvest: Crop insurance and credit for a healthy farm and food future. Cambridge, MA: Union of Concerned Scientists.
Ribera, L.A., C. Yue, and R. Holcomb. 2012. Geographic impacts on U.S. agriculture of the 2010 dietary nutrition guidelines. Choices: The Magazine of Food, Farm, and Resource Issues 27(1).
Rickard, B.J., and J.L. Gonsalves. 2008. How would compliance with dietary recommendations affect revenues for agricultural producers? Food Policy 33:422–433.
Schmit, T.M., B.B.R. Jablonski, and Y. Mansury. 2013. Impacts of local food system activities by small direct-to-consumer producers in a regional economy: A case study from upstate NY. Ithaca, NY: Cornell University, Charles H. Dyson School of Applied Economics and Management.
Endnotes1 We used a model developed by the Global Trade Analysis Project (GTAP), based at Purdue University.
2 Like MyPlate, the Harvard Healthy Eating Plate guidelines encourage increased consumption of fruits and vegetables. However, unlike MyPlate, the
Harvard guidelines recommend limited consumption of potatoes. Because of the difficulty of separating potatoes from other F&V in our model, we did not
simulate a specific increase in F&V consumption that would meet the Healthy Eating Plate guidelines.
References
12 UNION OF CONCERNED SCIENTISTS
National Headquarters:TwoBrattleSquare,Cambridge,MA02138-3780•Phone:(617)547-5552•Fax:(617)864-9405Washington, DC, Office: 1825KSt.NW,Ste.800,Washington,DC20006-1232•Phone:(202)223-6133•Fax:(202)223-6162West Coast Office: 2397ShattuckAve.,Ste.203,Berkeley,CA94704-1567•Phone:(510)843-1872•Fax:(510)843-3785Midwest Office: OneN.LaSalleSt.,Ste.1904,Chicago,IL60602-4064•Phone:(312)578-1750•Fax:(312)578-1751
This report is available on the UCS website at www.ucsusa.org/healthyfarmlanddiet.
© October 2013 Union of Concerned Scientists
Printed on recycled paper using vegetable-based inks
The Union of Concerned Scientists puts rigorous, independent science to work to solve our planet’s most pressing problems. Joining with citizens across the country, we combine technical analysis and effective advocacy to create innovative, practical solutions for a healthy, safe, and sustainable future.
AcknowledgmentsThis report was written by Kranti Mulik, senior economist, and Jeffrey K. O’Hara, agricultural economist, in the Union of Concerned Scientists (UCS) Food and Environment Program.
It was made possible in part through the generous support of the Clif Bar Family Foundation, the Deer Creek Foundation, the Food and Farm Communications Fund, the David B. Gold Foundation, the W.K. Kellogg Foundation, the Tomchin Family Charitable Foundation, and UCS members.
For their reviews of the report, the authors would like to thank Ruben Lubowski of the Environmental Defense Fund, Dawn Thilmany of Colorado State University’s Agricultural and Resource Economics Department; and Marinos Tsigas of the U.S. International Trade Commission. The time they spent review-ing the manuscript was considerable, and their comments and suggestions greatly improved it. At UCS, the authors thank Doug Boucher, Doug Gurian-Sherman, Jeremy Martin, Margaret Mellon, Ricardo Salvador, Karen Perry Stillerman, and David Wright for their help in developing and refining this report.
The information contained in this report is the sole responsibility of the authors, and does not necessarily reflect the opinions of the foundations that supported it or the individuals who reviewed and commented on it.
Swenson, D. 2010. Selected measures of the economic values of increased fruit and vegetable production and consumption in the upper Midwest. Ames, IA: Leopold Center for Sustainable Agriculture.
Tootelian, D.H., A. Mikhailitchenko, and S.B. Varshney. 2012. Can producing and marketing healthy foods create a healthy economy? Journal of Food Products Marketing 18(3):242–256.
Union of Concerned Scientists (UCS). 2013. The healthy farm: A vision for U.S. agriculture. Policy brief. Cambridge, MA.
Union of Concerned Scientists (UCS). 2011. The energy-water collision: Corn ethanol’s threat to water resources. Cambridge, MA.
U.S. Department of Agriculture, Agricultural Marketing Service (USDA AMS). 2013. National count of farmers market directory listings. Online at http://www.ams.usda.gov/AMSv1.0/ams. fetchTemplateData.do?template=TemplateS&leftNav=Wholesale andFarmersMarkets&page=WFMFarmersMarketGrowth&description =Farmers%20Market%20Growth, accessed on August 8, 2013.
U.S. Department of Agriculture, Economic Research Service (USDA ERS). 2013. Import share of consumption. Online at http://www.ers.usda.gov/topics/international-markets-trade/ us-agricultural-trade/import-share-of-consumption.aspx#. Ufk9MG3QvJs, accessed on July 31, 2013.
U.S. Department of Agriculture, Economic Research Service (USDA ERS). 2012a. Vegetable and pulses. Table 1. Online at http://www.ers.usda.gov/media/970492/vgs352.pdf, accessed on September 17, 2013.
U.S. Department of Agriculture, Economic Research Service (USDA ERS). 2012b. List of tables. Table A2. Online at http://usda01.library.cornell.edu/usda/ers/89022/FTS2012.pdf, accessed on September 17, 2013.
U.S. Department of Agriculture, National Agricultural Statistics Service (USDA NASS). 2013. Crop production historical track records. Online at http://usda01.library.cornell.edu/usda/current/htrcp/htrcp-04-12-2013.txt, accessed on September 17, 2013.
U.S. Department of Agriculture, National Agricultural Statistics Service (USDA NASS). 2009. 2007 census of agriculture: United States summary and state data. Volume 1, Geographic Area Series, Part 51, AC-07-A-51. Washington, DC.
U.S. Department of Agriculture and U.S. Department of Health and Human Services (USDA and HHS). 2010. Dietary Guidelines for Americans 2010, 7th Edition. Washington, DC: U.S. Govern-ment Printing Office.
Wirsenius, S., C. Azar, and G. Berndes. 2010. How much land is needed for global food production under scenarios of dietary changes and livestock productivity increases in 2030? Agricul-tural Systems 103(9):621–638.
Young, C.E., and L.S. Kantor. 1999. Moving toward the food guide pyramid: Implications for U.S. agriculture, Agricultural Report Number 779. Washington, DC: U.S. Department of Agriculture.
© iS
tock
phot
o.co
m/c
arte
rday
ne
Cover photo: © AgStock Images/Curt Maas