the geology of radon - usgspreface radon gas, a radioactive product of uranium, can reach high...
TRANSCRIPT

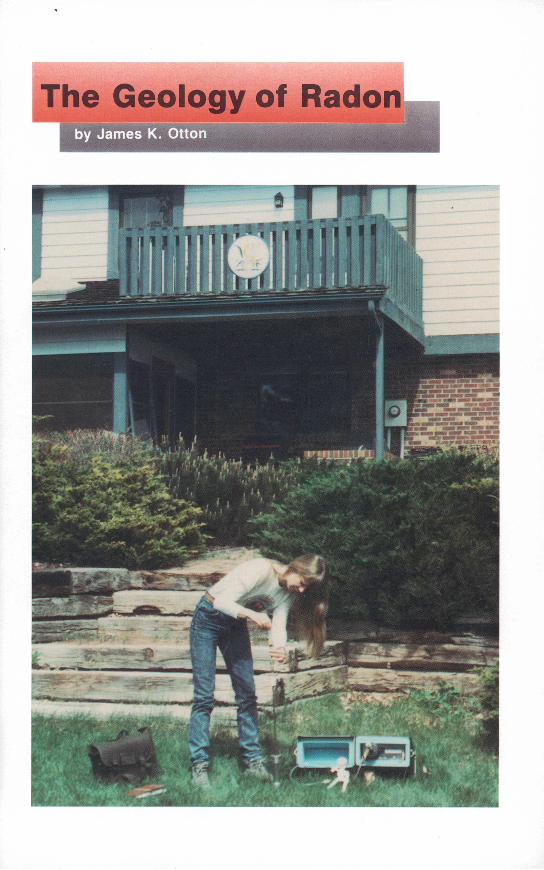
The Geology of Radon
Preface
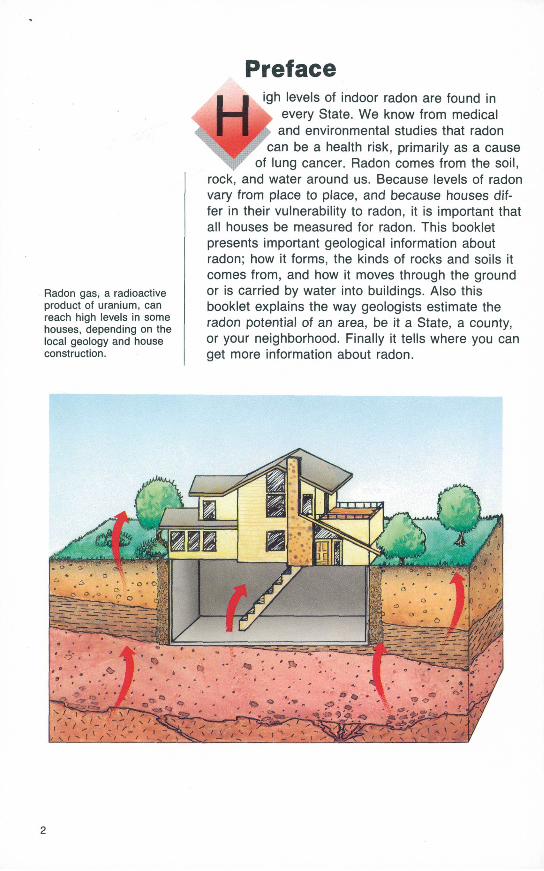
Radon gas, a radioactive product of uranium, can reach high levels in some houses, depending on the local geology and house construction.
igh levels of indoor radon are found in every State. We know from medical
and environmental studies that radon can be a health risk, primarily as a cause
of lung cancer. Radon comes from the soil, rock, and water around us. Because levels of radon vary from place to place, and because houses dif fer in their vulnerability to radon, it is important that all houses be measured for radon. This booklet presents important geological information about radon; how it forms, the kinds of rocks and soils it comes from, and how it moves through the ground or is carried by water into buildings. Also this booklet explains the way geologists estimate the radon potential of an area, be it a State, a county, or your neighborhood. Finally it tells where you can get more information about radon.
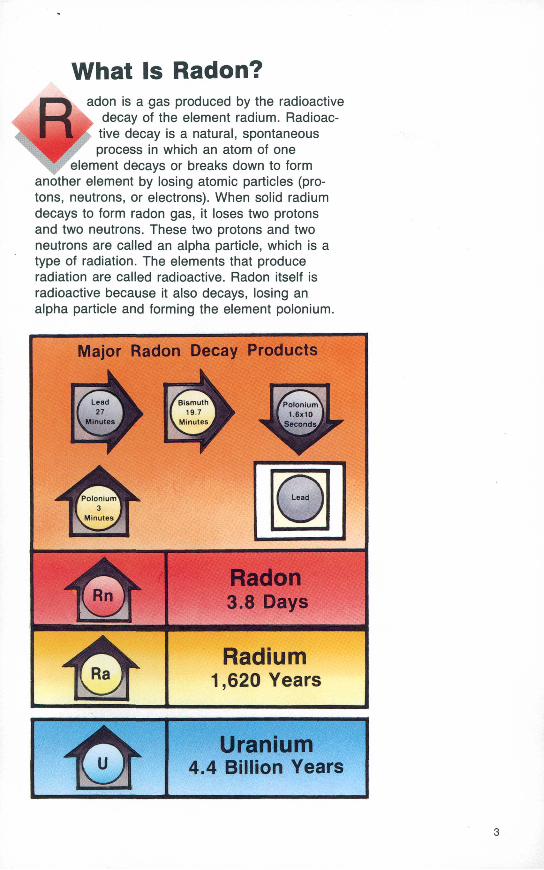
What Is Radon?adon is a gas produced by the radioactive
decay of the element radium. Radioac tive decay is a natural, spontaneous process in which an atom of one
element decays or breaks down to form another element by losing atomic particles (pro tons, neutrons, or electrons). When solid radium decays to form radon gas, it loses two protons and two neutrons. These two protons and two neutrons are called an alpha particle, which is a type of radiation. The elements that produce radiation are called radioactive. Radon itself is radioactive because it also decays, losing an alpha particle and forming the element polonium.
Major Radon Decay Products
Radon3.8 Days
Radium1,620 Years
Uranium4.4 Billion Years
0.1
10
100
1,000
100,000
1,000,000
33o>Q.o
3 g o' o oc
10,000 jj;- w
T3 CD
CD
10,000,000
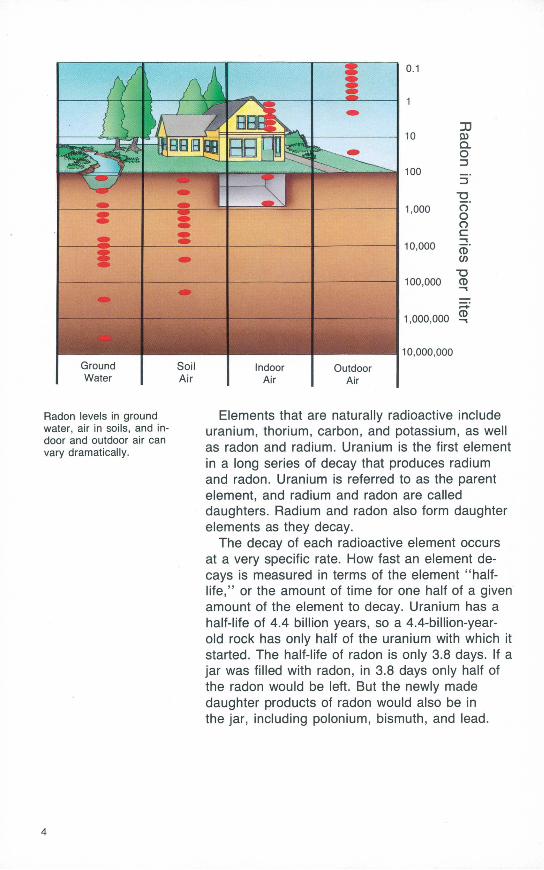
Radon levels in ground water, air in soils, and in door and outdoor air can vary dramatically.
Elements that are naturally radioactive include uranium, thorium, carbon, and potassium, as well as radon and radium. Uranium is the first element in a long series of decay that produces radium and radon. Uranium is referred to as the parent element, and radium and radon are called daughters. Radium and radon also form daughter elements as they decay.
The decay of each radioactive element occurs at a very specific rate. How fast an element de cays is measured in terms of the element "half- life," or the amount of time for one half of a given amount of the element to decay. Uranium has a half-life of 4.4 billion years, so a 4.4-billion-year- old rock has only half of the uranium with which it started. The half-life of radon is only 3.8 days. If a jar was filled with radon, in 3.8 days only half of the radon would be left. But the newly made daughter products of radon would also be in the jar, including polonium, bismuth, and lead.
Polonium is also radioactive; it is this element, which is produced by radon in the air and in peo ple's lungs, that can hurt lung tissue and cause lung cancer.
Radioactivity is commonly measured in pico- curies (pCi). This unit of measure is named for the French physicist Marie Curie, who was a pioneer in the research on radioactive elements and their decay. One pCi is equal to the decay of about two radioactive atoms per minute.
Because the level of radioactivity is directly re lated to the number and type of radioactive atoms present, radon and all other radioactive elements are measured in picocuries. For instance, a house having 4 picocuries of radon per liter of air (4 pCi/L) has about 8 or 9 atoms of radon decaying every minute in every liter of air inside the house. A 1,000-square-foot house with 4 pCi/L of radon has nearly 2 million radon atoms decaying in it every minute.
Radon levels in outdoor air, indoor air, soil air, and ground water can be very different. Outdoor air ranges from less than 0.1 pCi/L to about 30 pCi/L, but it probably averages about 0.2 pCi/L. Radon in indoor air ranges from less than 1 pCi/L to about 3,000 pCi/L, but it probably averages be tween 1 and 2 pCi/L. Radon in soil air (the air that occupies the pores in soil) ranges from 20 or 30 pCi/L to more than 100,000 pCi/L; most soils in the United States contain between 200 and 2,000 pCi of radon per liter of soil air. The amount of radon dissolved in ground water ranges from about 100 to nearly 3 million pCi/L.
Why do radon levels vary so much between in door air, outdoor air, soil air, and ground water? Why do some houses have high levels of indoor radon while nearby houses do not? The reasons lie primarily in the geology of radon the factors that govern the occurrence of uranium, the forma tion of radon, and the movement of radon, soil gas, and ground water.
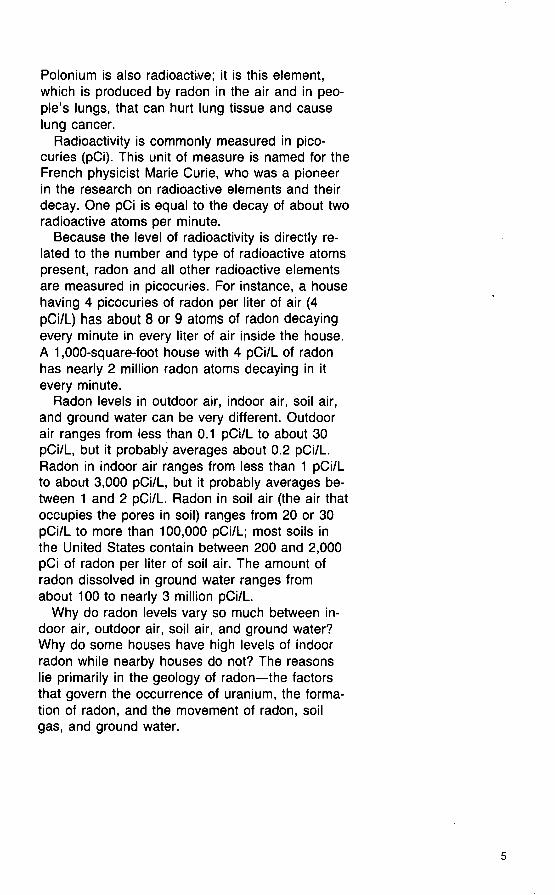
The bright-yellow mineral tyuyamunite is one of the most common uranium ore minerals. This specimen, which is less than 3 inches across, came from the Ridenour mine, Arizona, near the Grand Canyon (photograph by Karen Wenrich).
The Geology of Radontudies of the geology of radon include
" research into how uranium and radonsources are distributed in rocks and
soils, how radon forms in rocks and soils, and how radon moves. Studying how radon
enters buildings from the soil and through the water system is also an important part of the geology of radon.
Uranium: The sourceTo understand the geology of radon where it
forms, how it forms, how it moves we have to start with its ultimate source, uranium. All rocks contain some uranium, although most contain just a small amount between 1 and 3 parts per mil lion (ppm) of uranium. In other words, a million pounds (500 tons) of rocks generally will have 1 to 3 pounds of uranium scattered through it.
Rocks break down mechanically and chemically to form soils at the Earth's surface. It is not sur prising, therefore, that most soils also contain small amounts (1 to 3 ppm) of uranium. In gener al, the uranium content of a soil will be about the same as the uranium content of the rock from which the soil was derived.
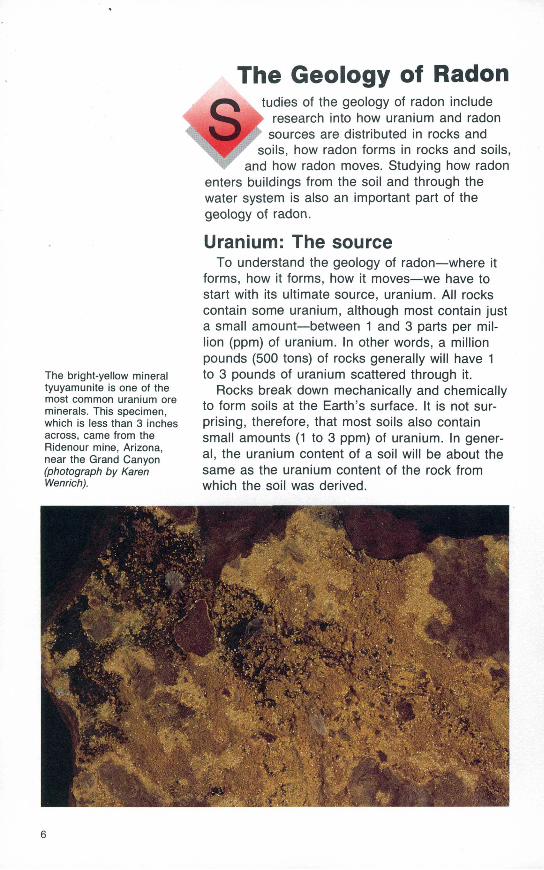
Igneous
Sedimentary
The three major rock types.Metamorphic
Some types of rocks have higher than average uranium contents. These include light-colored vol canic rocks, granites, dark shales, sedimentary rocks that contain phosphate, and metamorphic rocks derived from these rocks. These rocks and their soils may contain as much as 100 ppm uranium. Layers of these rocks underlie various parts of the United States.
The higher the uranium level is in an area, the greater the chances are that houses in the area have high levels of indoor radon. But some houses in areas with lots of uranium in the soil have low levels of indoor radon, and other houses on uranium-poor soils have high levels of indoor radon. Clearly, the amount of radon in a house is affected by factors in addition to the presence of uranium in the underlying soil.
Radon formationJust as uranium is present in all rocks and
soils, so are radon and radium because they are daughter products formed by the radioactive decay of uranium.
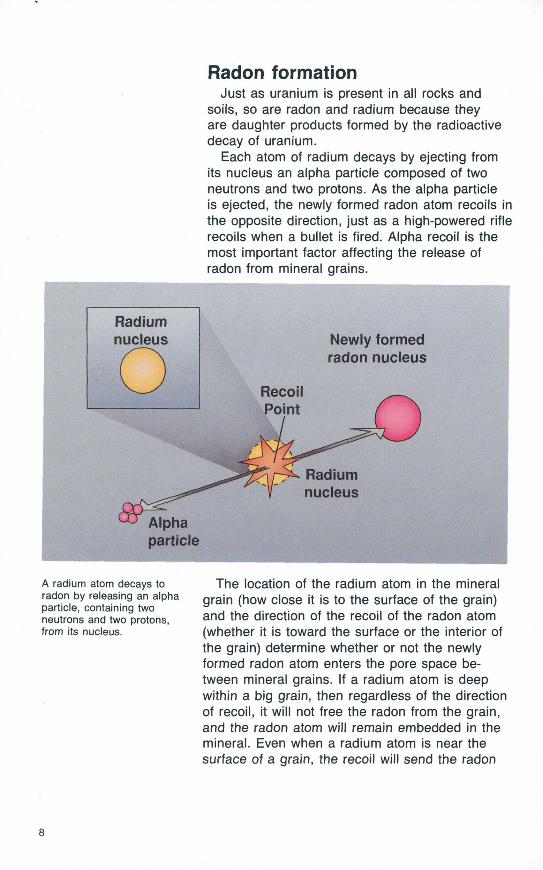
Each atom of radium decays by ejecting from its nucleus an alpha particle composed of two neutrons and two protons. As the alpha particle is ejected, the newly formed radon atom recoils in the opposite direction, just as a high-powered rifle recoils when a bullet is fired. Alpha recoil is the most important factor affecting the release of radon from mineral grains.
Newly formed radon nucleus
Radium nucleus
Alpha particle
A radium atom decays to radon by releasing an alpha particle, containing two neutrons and two protons, from its nucleus.
The location of the radium atom in the mineral grain (how close it is to the surface of the grain) and the direction of the recoil of the radon atom (whether it is toward the surface or the interior of the grain) determine whether or not the newly formed radon atom enters the pore space be tween mineral grains. If a radium atom is deep within a big grain, then regardless of the direction of recoil, it will not free the radon from the grain, and the radon atom will remain embedded in the mineral. Even when a radium atom is near the surface of a grain, the recoil will send the radon
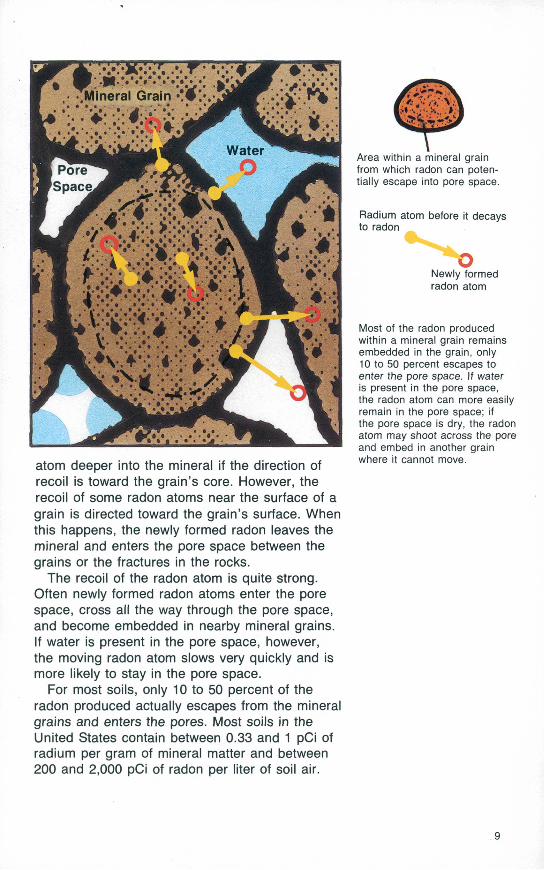
atom deeper into the mineral if the direction of recoil is toward the grain's core. However, the recoil of some radon atoms near the surface of a grain is directed toward the grain's surface. When this happens, the newly formed radon leaves the mineral and enters the pore space between the grains or the fractures in the rocks.
The recoil of the radon atom is quite strong. Often newly formed radon atoms enter the pore space, cross all the way through the pore space, and become embedded in nearby mineral grains. If water is present in the pore space, however, the moving radon atom slows very quickly and is more likely to stay in the pore space.
For most soils, only 10 to 50 percent of the radon produced actually escapes from the mineral grains and enters the pores. Most soils in the United States contain between 0.33 and 1 pCi of radium per gram of mineral matter and between 200 and 2,000 pCi of radon per liter of soil air.
Area within a mineral grain from which radon can poten tially escape into pore space.
Radium atom before it decays to radon
oNewly formed radon atom
Most of the radon produced within a mineral grain remains embedded in the grain, only 10 to 50 percent escapes to enter the pore space. If water is present in the pore space, the radon atom can more easily remain in the pore space; if the pore space is dry, the radon atom may shoot across the pore and embed in another grain where it cannot move.
.9
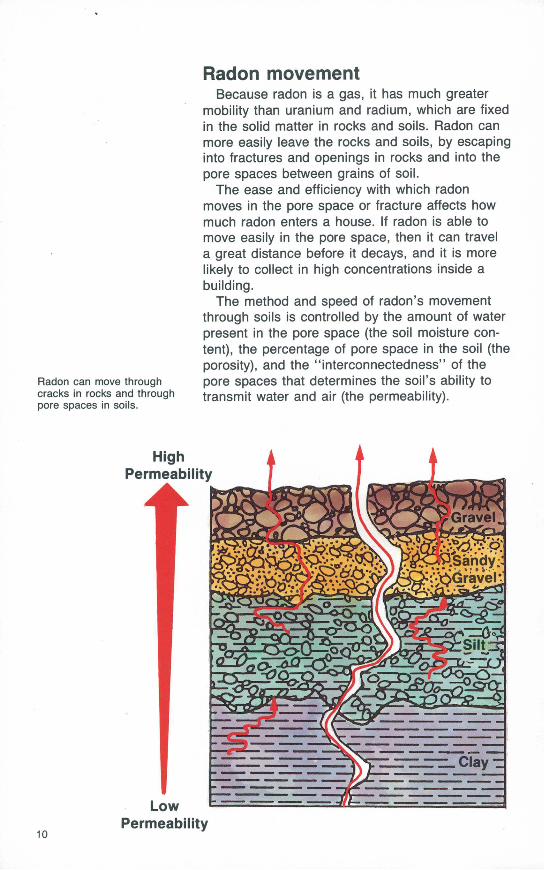
Radon can move through cracks in rocks and through pore spaces in soils.
Radon movementBecause radon is a gas, it has much greater
mobility than uranium and radium, which are fixed in the solid matter in rocks and soils. Radon can more easily leave the rocks and soils, by escaping into fractures and openings in rocks and into the pore spaces between grains of soil.
The ease and efficiency with which radon moves in the pore space or fracture affects how much radon enters a house. If radon is able to move easily in the pore space, then it can travel a great distance before it decays, and it is more likely to collect in high concentrations inside a building.
The method and speed of radon's movement through soils is controlled by the amount of water present in the pore space (the soil moisture con tent), the percentage of pore space in the soil (the porosity), and the "interconnectedness" of the pore spaces that determines the soil's ability to transmit water and air (the permeability).
High Permeability
10
Low Permeability
rr ̂ i Eiactured_Ciay
,'|F ' - > v/ v "'AFractured Bedrock
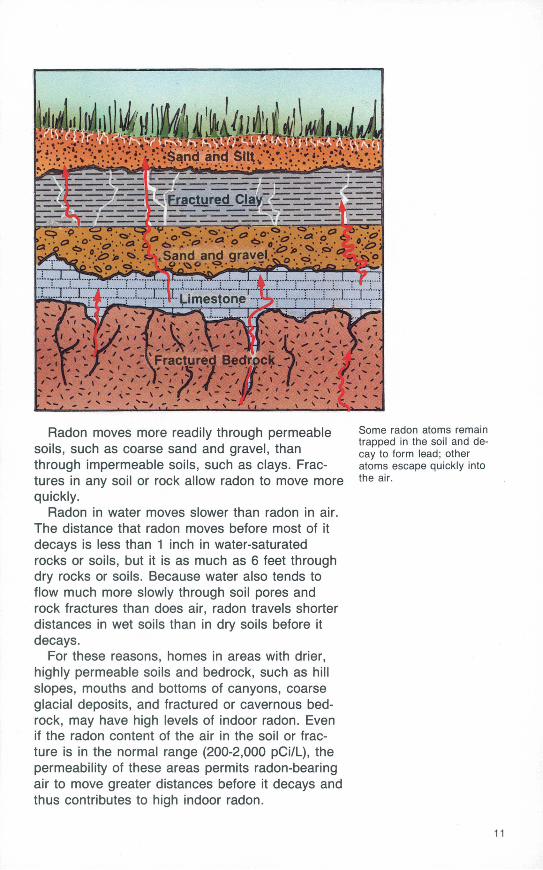
Radon moves more readily through permeable soils, such as coarse sand and gravel, than through impermeable soils, such as clays. Frac tures in any soil or rock allow radon to move more quickly.
Radon in water moves slower than radon in air. The distance that radon moves before most of it decays is less than 1 inch in water-saturated rocks or soils, but it is as much as 6 feet through dry rocks or soils. Because water also tends to flow much more slowly through soil pores and rock fractures than does air, radon travels shorter distances in wet soils than in dry soils before it decays.
For these reasons, homes in areas with drier, highly permeable soils and bedrock, such as hill slopes, mouths and bottoms of canyons, coarse glacial deposits, and fractured or cavernous bed rock, may have high levels of indoor radon. Even if the radon content of the air in the soil or frac ture is in the normal range (200-2,000 pCi/L), the permeability of these areas permits radon-bearing air to move greater distances before it decays and thus contributes to high indoor radon.
Some radon atoms remain trapped in the soil and de cay to form lead; other atoms escape quickly into the air.
11
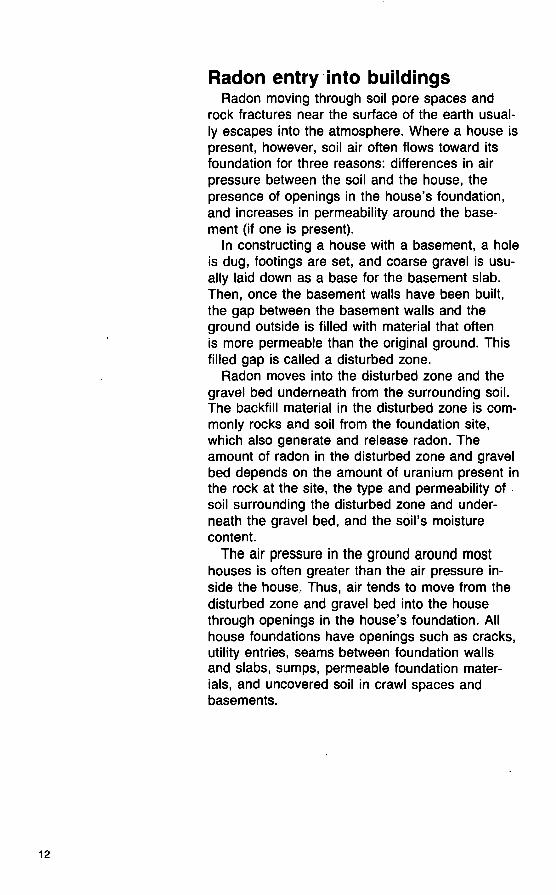
Radon entry into buildingsRadon moving through soil pore spaces and
rock fractures near the surface of the earth usual ly escapes into the atmosphere. Where a house is present, however, soil air often flows toward its foundation for three reasons: differences in air pressure between the soil and the house, the presence of openings in the house's foundation, and increases in permeability around the base ment (if one is present).
In constructing a house with a basement, a hole is dug, footings are set, and coarse gravel is usu ally laid down as a base for the basement slab. Then, once the basement walls have been built, the gap between the basement walls and the ground outside is filled with material that often is more permeable than the original ground. This filled gap is called a disturbed zone.
Radon moves into the disturbed zone and the gravel bed underneath from the surrounding soil. The backfill material in the disturbed zone is com monly rocks and soil from the foundation site, which also generate and release radon. The amount of radon in the disturbed zone and gravel bed depends on the amount of uranium present in the rock at the site, the type and permeability of soil surrounding the disturbed zone and under neath the gravel bed, and the soil's moisture content.
The air pressure in the ground around most houses is often greater than the air pressure in side the house. Thus, air tends to move from the disturbed zone and gravel bed into the house through openings in the house's foundation. All house foundations have openings such as cracks, utility entries, seams between foundation walls and slabs, sumps, permeable foundation mater ials, and uncovered soil in crawl spaces and basements.
12

Most houses draw less than one percent of their indoor air from the soil; the remainder comes from outdoor air, which is generally quite low in radon. Houses with low indoor air pressures, poorly sealed foundations, and several entry points for soil air, however, may draw as much as 20 per cent of their indoor air from the soil. Even if the soil air has only moderate levels of radon, levels inside the house may be very high.
Radon can enter a house through many paths.
13
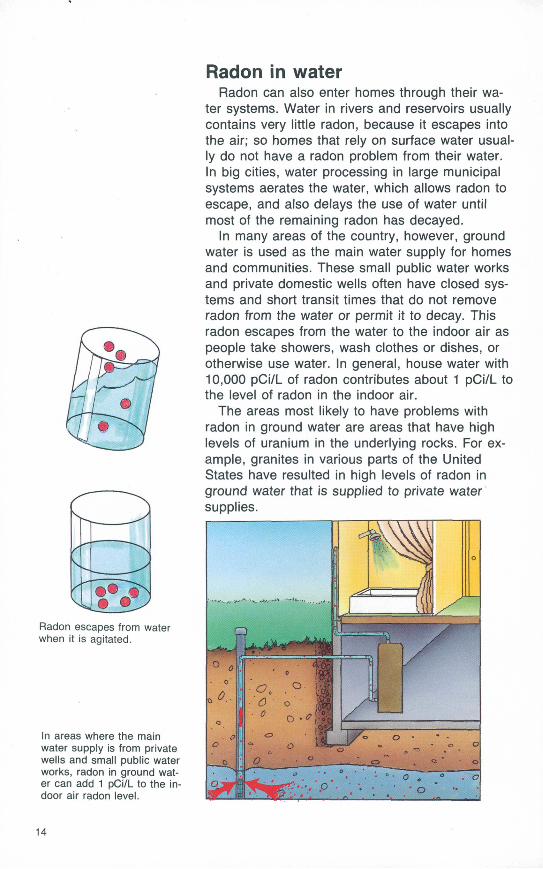
Radon escapes from water when it is agitated.
In areas where the main water supply is from private wells and small public water works, radon in ground wat er can add 1 pCi/L to the in door air radon level.
Radon in waterRadon can also enter homes through their wa
ter systems. Water in rivers and reservoirs usually contains very little radon, because it escapes into the air; so homes that rely on surface water usual ly do not have a radon problem from their water. In big cities, water processing in large municipal systems aerates the water, which allows radon to escape, and also delays the use of water until most of the remaining radon has decayed.
In many areas of the country, however, ground water is used as the main water supply for homes and communities. These small public water works and private domestic wells often have closed sys tems and short transit times that do not remove radon from the water or permit it to decay. This radon escapes from the water to the indoor air as people take showers, wash clothes or dishes, or otherwise use water. In general, house water with 10,000 pCi/L of radon contributes about 1 pCi/L to the level of radon in the indoor air.
The areas most likely to have problems with radon in ground water are areas that have high levels of uranium in the underlying rocks. For ex ample, granites in various parts of the United States have resulted in high levels of radon in ground water that is supplied to private water supplies.
14
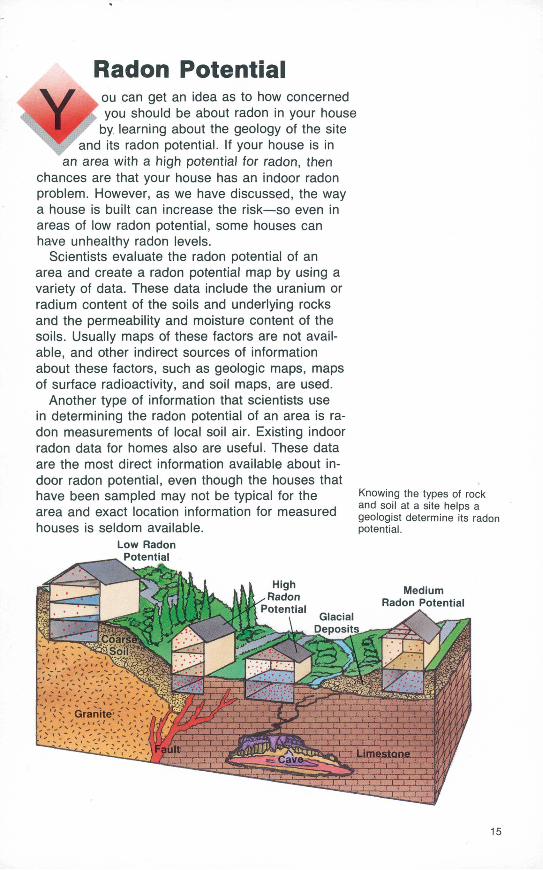
Radon Potentialou can get an idea as to how concerned you should be about radon in your house
by learning about the geology of the site and its radon potential. If your house is in
an area with a high potential for radon, then chances are that your house has an indoor radon problem. However, as we have discussed, the way a house is built can increase the risk so even in areas of low radon potential, some houses can have unhealthy radon levels.
Scientists evaluate the radon potential of an area and create a radon potential map by using a variety of data. These data include the uranium or radium content of the soils and underlying rocks and the permeability and moisture content of the soils. Usually maps of these factors are not avail able, and other indirect sources of information about these factors, such as geologic maps, maps of surface radioactivity, and soil maps, are used.
Another type of information that scientists use in determining the radon potential of an area is ra don measurements of local soil air. Existing indoor radon data for homes also are useful. These data are the most direct information available about in door radon potential, even though the houses that have been sampled may not be typical for the area and exact location information for measured houses is seldom available.
Low Radon Potential
Knowing the types of rock and soil at a site helps a geologist determine its radon potential.
Medium Radon Potential
15
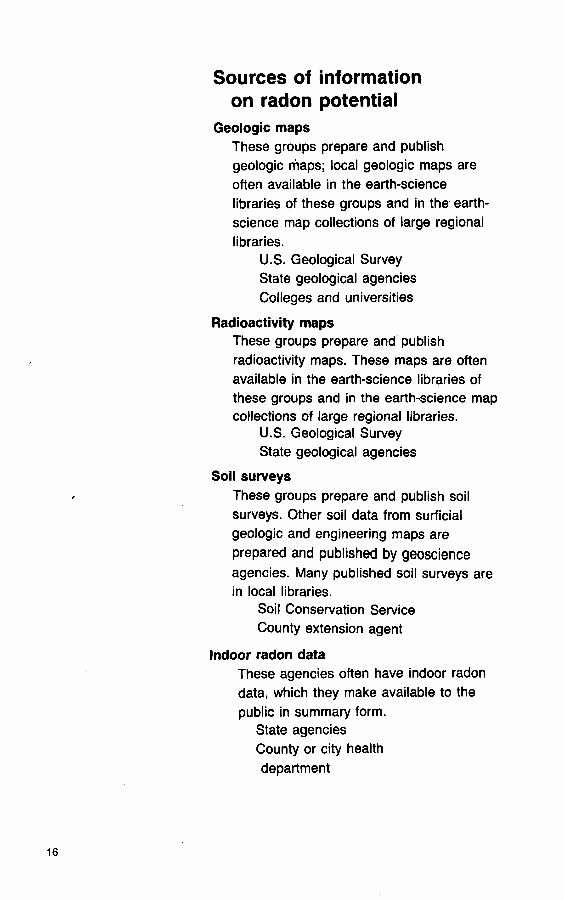
Sources of information on radon potential
Geologic mapsThese groups prepare and publish geologic maps; local geologic maps are often available in the earth-science libraries of these groups and in the earth- science map collections of large regional libraries.
U.S. Geological SurveyState geological agenciesColleges and universities
Radioactivity mapsThese groups prepare and publish radioactivity maps. These maps are often available in the earth-science libraries of these groups and in the earth-science map collections of large regional libraries.
U.S. Geological SurveyState geological agencies
Soil surveysThese groups prepare and publish soil surveys. Other soil data from surficial geologic and engineering maps are prepared and published by geoscience agencies. Many published soil surveys are in local libraries.
Soil Conservation ServiceCounty extension agent
Indoor radon dataThese agencies often have indoor radon data, which they make available to the public in summary form.
State agenciesCounty or city healthdepartment
16
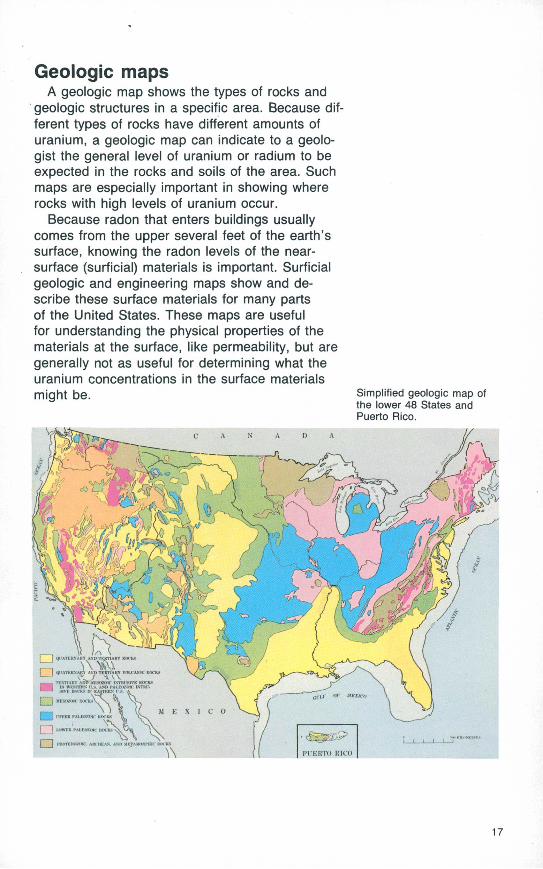
Geologic mapsA geologic map shows the types of rocks and
geologic structures in a specific area. Because dif ferent types of rocks have different amounts of uranium, a geologic map can indicate to a geolo gist the general level of uranium or radium to be expected in the rocks and soils of the area. Such maps are especially important in showing where rocks with high levels of uranium occur.
Because radon that enters buildings usually comes from the upper several feet of the earth's surface, knowing the radon levels of the near- surface (surficial) materials is important. Surficial geologic and engineering maps show and de scribe these surface materials for many parts of the United States. These maps are useful for understanding the physical properties of the materials at the surface, like permeability, but are generally not as useful for determining what the uranium concentrations in the surface materials might be. Simplified geologic map of
the lower 48 States and Puerto Rico.
17
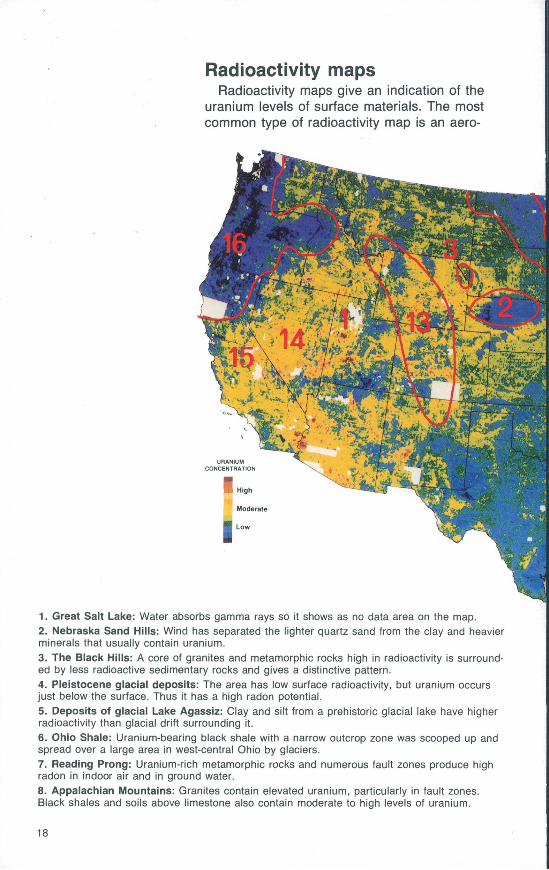
Radioactivity mapsRadioactivity maps give an indication of the
uranium levels of surface materials. The most common type of radioactivity map is an aero-
1. Great Salt Lake: Water absorbs gamma rays so it shows as no data area on the map.2. Nebraska Sand Hills: Wind has separated the lighter quartz sand from the clay and heavier minerals that usually contain uranium.3. The Black Hills: A core of granites and metamorphic rocks high in radioactivity is surround ed by less radioactive sedimentary rocks and gives a distinctive pattern.4. Pleistocene glacial deposits: The area has low surface radioactivity, but uranium occurs just below the surface. Thus it has a high radon potential.5. Deposits of glacial Lake Agassiz: Clay and silt from a prehistoric glacial lake have higher radioactivity than glacial drift surrounding it.6. Ohio Shale: Uranium-bearing black shale with a narrow outcrop zone was scooped up and spread over a large area in west-central Ohio by glaciers.7. Reading Prong: Uranium-rich metamorphic rocks and numerous fault zones produce high radon in indoor air and in ground water.8. Appalachian Mountains: Granites contain elevated uranium, particularly in fault zones. Black shales and soils above limestone also contain moderate to high levels of uranium.
18
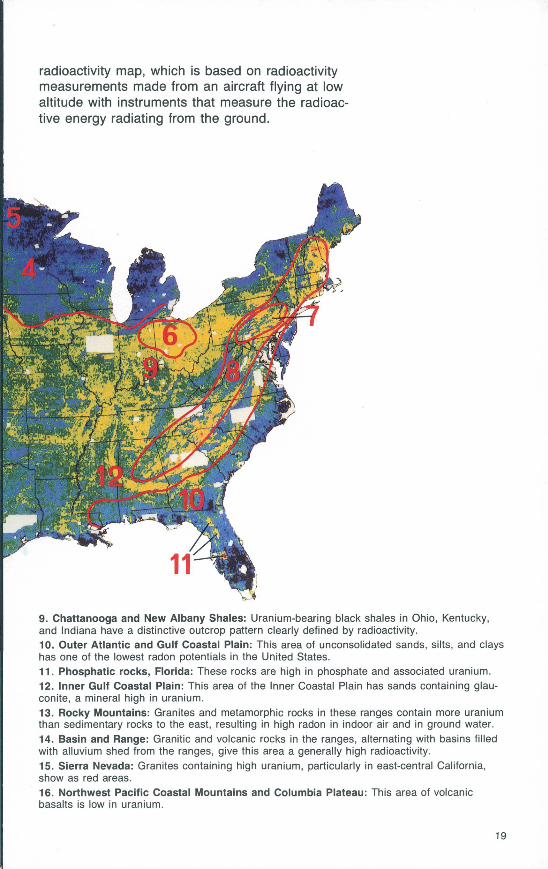
radioactivity map, which is based on radioactivity measurements made from an aircraft flying at low altitude with instruments that measure the radioac tive energy radiating from the ground.
9. Chattanooga and New Albany Shales: Uranium-bearing black shales in Ohio, Kentucky, and Indiana have a distinctive outcrop pattern clearly defined by radioactivity.10. Outer Atlantic and Gulf Coastal Plain: This area of unconsolidated sands, silts, and clays has one of the lowest radon potentials in the United States.11. Phosphatic rocks, Florida: These rocks are high in phosphate and associated uranium.12. Inner Gulf Coastal Plain: This area of the Inner Coastal Plain has sands containing glau- conite, a mineral high in uranium.13. Rocky Mountains: Granites and metamorphic rocks in these ranges contain more uranium than sedimentary rocks to the east, resulting in high radon in indoor air and in ground water.14. Basin and Range: Granitic and volcanic rocks in the ranges, alternating with basins filled with alluvium shed from the ranges, give this area a generally high radioactivity.15. Sierra Nevada: Granites containing high uranium, particularly in east-central California, show as red areas.16. Northwest Pacific Coastal Mountains and Columbia Plateau: This area of volcanic basalts is low in uranium.
19
There is a good match between areas identified on aeroradioactivity maps as having high levels of surface uranium and areas for which high levels of indoor radon have been reported. In some parts of the country, however, swamps and marshes are abundant. Over many of these areas, the soils at the surface are full of water, which blocks the ra diation of energy. The average amount of radiated energy detected for these areas is lower than it would be if the soils were dry, and the uranium content of the soils and the radon potential are likely to be underestimated in these areas.
A large amount of aeroradioactivity data was collected as part of a Department of Energy pro gram to evaluate the uranium resources of the United States. Most of the energy detected during these flights was from rocks and soils within 800 feet of flight lines that were spaced 1 to 6 miles apart. Many major metropolitan areas were not covered by the survey because of flight restric tions. Therefore, only a small part of the surface of the United States was measured. The data from this survey, however, give a good indication of the background uranium concentration of soils and rocks underlying most of the United States.
The digital data from the survey were processed by the U.S. Geological Survey to produce a map showing the uranium content of surface materials in the conterminous United States (the lower 48 States). The smallest data point on the map cov ers about 1.6 by 1.6 miles, limiting the amount of detail that can be seen. (You can tell how parts of a region, a State, or possibly a county vary in sur face uranium concentration, but you can't tell how uranium varies from neighborhood to neighbor hood or from house to house.)
20
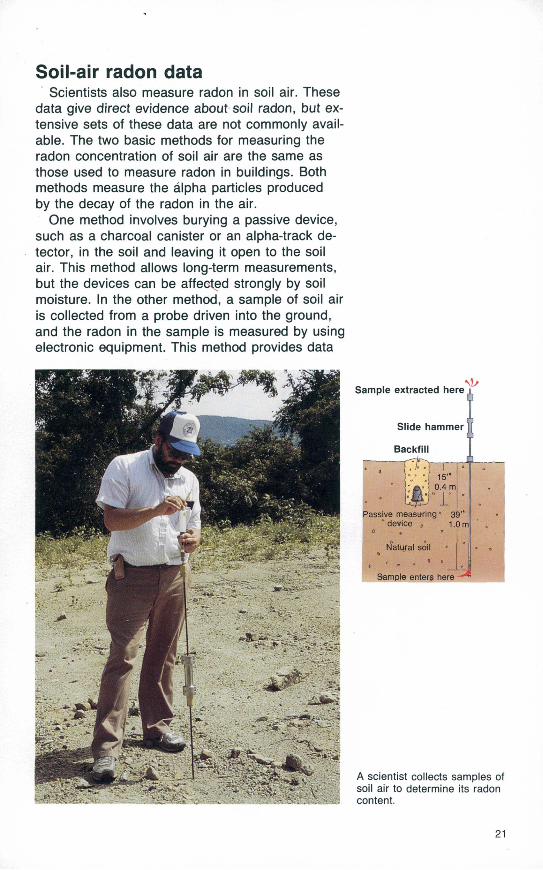
Soil-air radon dataScientists also measure radon in soil air. These
data give direct evidence about soil radon, but ex tensive sets of these data are not commonly avail able. The two basic methods for measuring the radon concentration of soil air are the same as those used to measure radon in buildings. Both methods measure the alpha particles produced by the decay of the radon in the air.
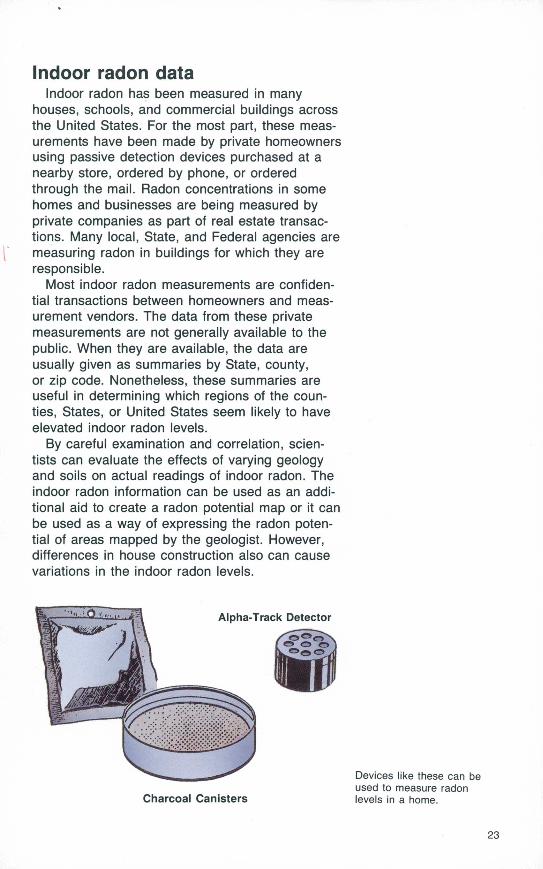
One method involves burying a passive device, such as a charcoal canister or an alpha-track de tector, in the soil and leaving it open to the soil air. This method allows long-term measurements, but the devices can be affected strongly by soil moisture. In the other method, a sample of soil air is collected from a probe driven into the ground, and the radon in the sample is measured by using electronic equipment. This method provides data
Sample extracted here JL
Slide hammer
Backfill
I15"
0.4 m
IPassive measuring 3)''
" device , 1.0 mO o "I
Natural soil
,' - * °ASample enters here - 1
A scientist collects samples of soil air to determine its radon content.
21
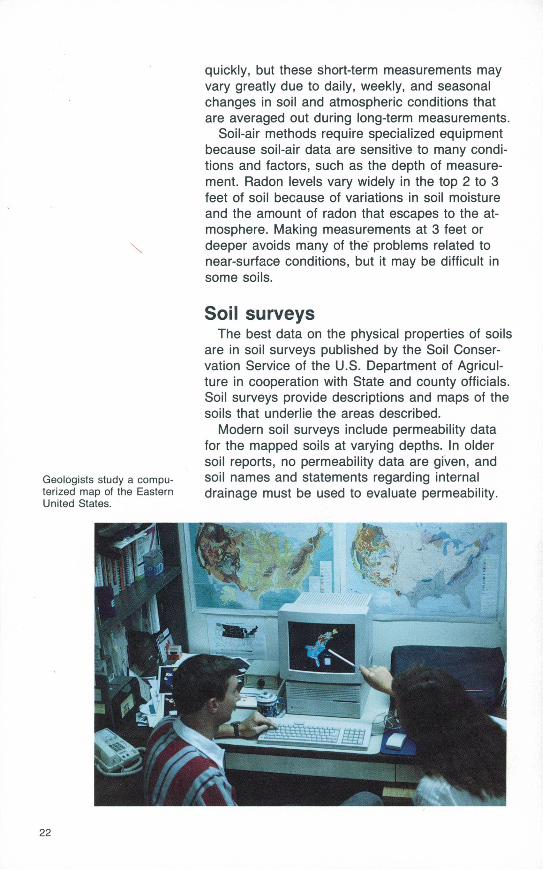
Geologists study a compu terized map of the Eastern United States.
quickly, but these short-term measurements may vary greatly due to daily, weekly, and seasonal changes in soil and atmospheric conditions that are averaged out during long-term measurements.
Soil-air methods require specialized equipment because soil-air data are sensitive to many condi tions and factors, such as the depth of measure ment. Radon levels vary widely in the top 2 to 3 feet of soil because of variations in soil moisture and the amount of radon that escapes to the at mosphere. Making measurements at 3 feet or deeper avoids many of the problems related to near-surface conditions, but it may be difficult in some soils.
Soil surveysThe best data on the physical properties of soils
are in soil surveys published by the Soil Conser vation Service of the U.S. Department of Agricul ture in cooperation with State and county officials. Soil surveys provide descriptions and maps of the soils that underlie the areas described.
Modern soil surveys include permeability data for the mapped soils at varying depths. In older soil reports, no permeability data are given, and soil names and statements regarding internal drainage must be used to evaluate permeability.
22
Indoor radon dataIndoor radon has been measured in many
houses, schools, and commercial buildings across the United States. For the most part, these meas urements have been made by private homeowners using passive detection devices purchased at a nearby store, ordered by phone, or ordered through the mail. Radon concentrations in some homes and businesses are being measured by private companies as part of real estate transac tions. Many local, State, and Federal agencies are measuring radon in buildings for which they are responsible.
Most indoor radon measurements are confiden tial transactions between homeowners and meas urement vendors. The data from these private measurements are not generally available to the public. When they are available, the data are usually given as summaries by State, county, or zip code. Nonetheless, these summaries are useful in determining which regions of the coun ties, States, or United States seem likely to have elevated indoor radon levels.
By careful examination and correlation, scien tists can evaluate the effects of varying geology and soils on actual readings of indoor radon. The indoor radon information can be used as an addi tional aid to create a radon potential map or it can be used as a way of expressing the radon poten tial of areas mapped by the geologist. However, differences in house construction also can cause variations in the indoor radon levels.
Alpha-Track Detector
Charcoal Canisters
Devices like these can be used to measure radon levels in a home.
23
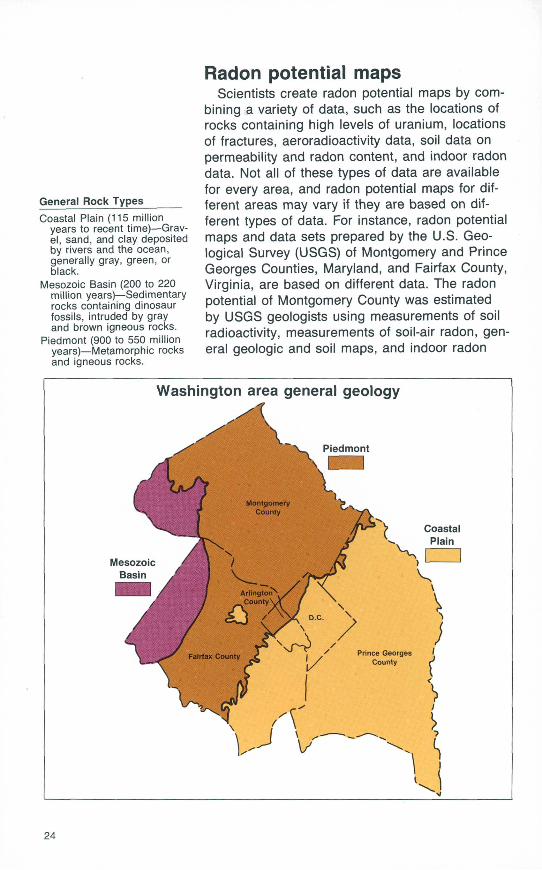
General Rock Types____
Coastal Plain (115 million years to recent time) Grav el, sand, and clay deposited by rivers and the ocean, generally gray, green, or black.
Mesozoic Basin (200 to 220 million years) Sedimentary rocks containing dinosaur fossils, intruded by gray and brown igneous rocks.
Piedmont (900 to 550 million years) Metamorphic rocks and igneous rocks.
Radon potential mapsScientists create radon potential maps by com
bining a variety of data, such as the locations of rocks containing high levels of uranium, locations of fractures, aeroradioactivity data, soil data on permeability and radon content, and indoor radon data. Not all of these types of data are available for every area, and radon potential maps for dif ferent areas may vary if they are based on dif ferent types of data. For instance, radon potential maps and data sets prepared by the U.S. Geo logical Survey (USGS) of Montgomery and Prince Georges Counties, Maryland, and Fairfax County, Virginia, are based on different data. The radon potential of Montgomery County was estimated by USGS geologists using measurements of soil radioactivity, measurements of soil-air radon, gen eral geologic and soil maps, and indoor radon
Washington area general geology
24
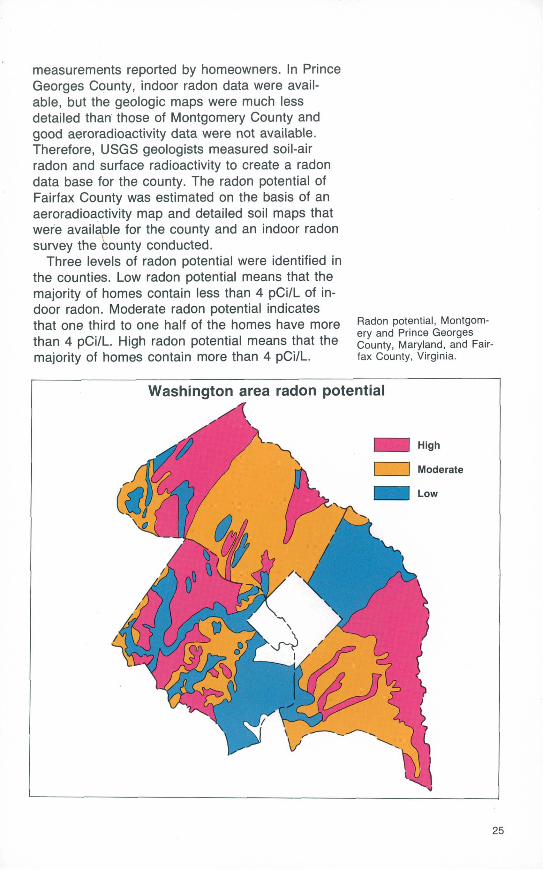
measurements reported by homeowners. In Prince Georges County, indoor radon data were avail able, but the geologic maps were much less detailed than those of Montgomery County and good aeroradioactivity data were not available. Therefore, USGS geologists measured soil-air radon and surface radioactivity to create a radon data base for the county. The radon potential of Fairfax County was estimated on the basis of an aeroradioactivity map and detailed soil maps that were available for the county and an indoor radon survey the county conducted.
Three levels of radon potential were identified in the counties. Low radon potential means that the majority of homes contain less than 4 pCi/L of in door radon. Moderate radon potential indicates that one third to one half of the homes have more than 4 pCi/L. High radon potential means that the majority of homes contain more than 4 pCi/L.
Radon potential, Montgom ery and Prince Georges County, Maryland, and Fair fax County, Virginia.
Washington area radon potential
25
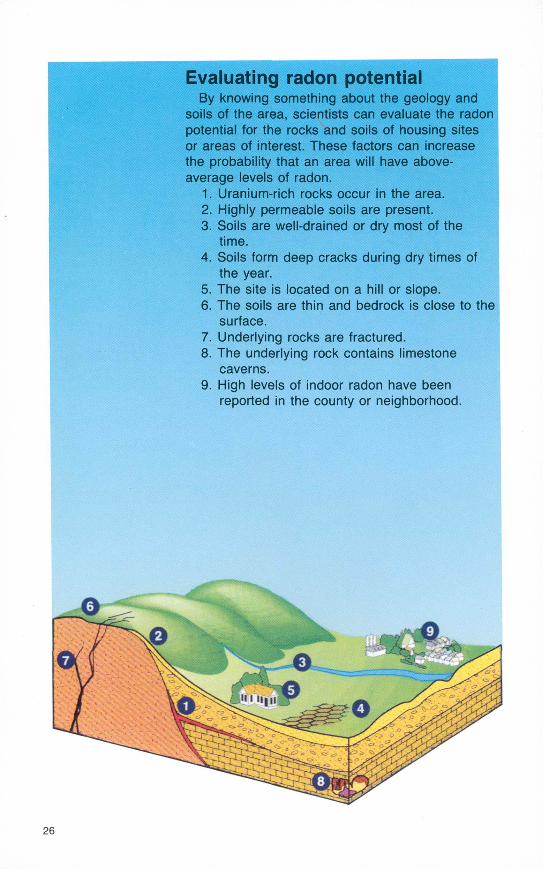
Evaluating radon potentialBy knowing something about the geology and
soils of the area, scientists can evaluate the radon potential for the rocks and soils of housing sites or areas of interest. These factors can increase the probability that an area will have above- average levels of radon.
1. Uranium-rich rocks occur in the area.2. Highly permeable soils are present.3. Soils are well-drained or dry most of the
time.4. Soils form deep cracks during dry times of
the year.5. The site is located on a hill or slope.6. The soils are thin and bedrock is close to the
surface.7. Underlying rocks are fractured.8. The underlying rock contains limestone
caverns.9. High levels of indoor radon have been
reported in the county or neighborhood.
26
Sources of Radon Information
tate geological surveys are good sources of information (geologic maps and radioactivity surveys) on the geology of
the States. For information on soils in your area, the first place to start is the county
agricultural extension agent. Telephone numbers and addresses for these State and county govern ment agencies are in the phone book.
State health departments often have radon con tact agencies. These agencies and the regional of fices of the U.S. Environmental Protection Agency (USEPA) are good sources of general information about the health risks of radon, radon measure ments in your house, and corrections of radon problems. The publications listed under Suggested Readings General References are among those available from USEPA. Many State radon agencies have these or similar State publications available. For technical information on the geology of radon, look at the publications listed under Suggested Readings Technical References.
EPA Region 1JFK Federal BuildingBoston, MA 02203
EPA Region 2 26 Federal Plaza New York, NY 10278
EPA Region 3841 Chestnut StreetPhiladelphia, PA 19107
EPA Region 4345 Courtland St. N.E.Atlanta, GA 30365
EPA Region 5230 South Dearborn StreetChicago, IL 60604
EPA Region 6 1445 Ross Avenue Dallas, TX 75202-2733
EPA Region 7726 Minnesota AvenueKansas City, KS 66101
EPA Region 8One Denver Place, Suite 1300999 18th StreetDenver, CO 80202-2413
EPA Region 9215 Fremont StreetSan Francisco, CA 94105
EPA Region 10 1200 Sixth Avenue Seattle, WA98101
27
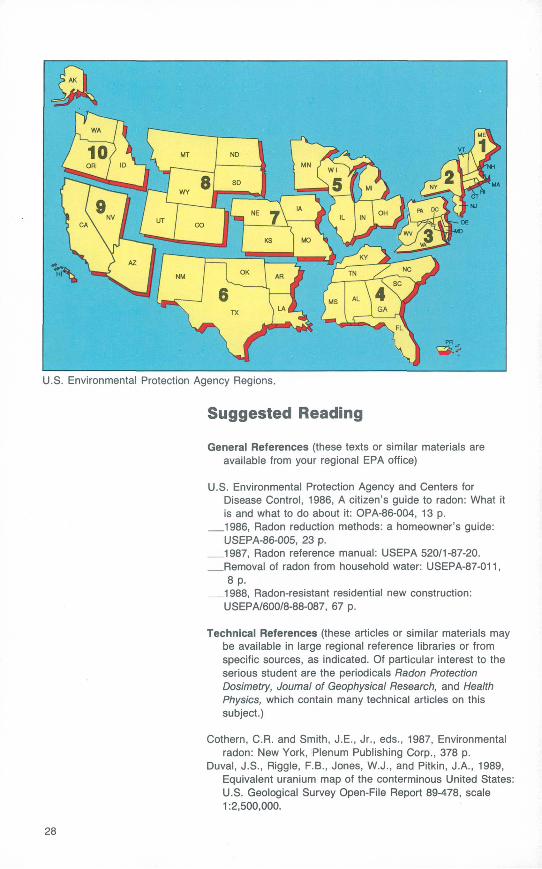
U.S. Environmental Protection Agency Regions.
Suggested Reading
General References (these texts or similar materials are available from your regional ERA office)
U.S. Environmental Protection Agency and Centers for Disease Control, 1986, A citizen's guide to radon: What it is and what to do about it: OPA-86-004, 13 p.
_1986, Radon reduction methods: a homeowner's guide: USEPA-86-005, 23 p.
_1987, Radon reference manual: USEPA 520/1-87-20._Removal of radon from household water: USEPA-87-011,
8 p._1988, Radon-resistant residential new construction:
USEPA/600/8-88-087, 67 p.
Technical References (these articles or similar materials may be available in large regional reference libraries or from specific sources, as indicated. Of particular interest to the serious student are the periodicals Radon Protection Dosimetry, Journal of Geophysical Research, and Health Physics, which contain many technical articles on this subject.)
Cothern, C.R. and Smith, J.E., Jr., eds., 1987, Environmental radon: New York, Plenum Publishing Corp., 378 p.
Duval, J.S., Riggle, F.B., Jones, W.J., and Pitkin, J.A., 1989, Equivalent uranium map of the conterminous United States: U.S. Geological Survey Open-File Report 89-478, scale 1:2,500,000.
28
Gundersen, L.C.S., Reimer, G.M., Wiggs, C.R., and Rice, C.A., 1988, Map showing radon potential of rocks and soils in Montgomery County, Maryland: U.S. Geological Survey Miscellaneous Field Studies Map MF-2043, scale 1:48,000.
Marikos, M.A., and Hansman, R.H., eds., 1988, Geologic causes of natural radionuclide anomalies: Proceedings of the GEORAD Conference, April 21-22, 1987, St. Louis, Missouri: Missouri Department of Natural Resources, Special Pub. 4, 186 p.
Nazaroff, W.W., and Nero, A.V., Jr., eds., 1988, Radon and its decay products in indoor air: New York, John Wiley and Sons, Inc., 518 p.
Nielson, K.K., Rogers, V.C., and Gee, G.W., 1984, Diffusion of radon through soils: a pore distribution model: Soil Science Society of America Journal, v. 48, no. 3, p. 482-487.
Otton, J.K., Schumann, R.R., Owen, D.E., Thurman, Nelson, and Duval, J.S., 1988, Map showing radon potential of rocks and soils in Fairfax County, Virginia: U.S. Geological Survey Miscellaneous Field Studies Map MF-2047, scale 1:62,500.
Sachs, H.M., Hernandez, T.L, and Ring, J.W., 1982, Regional geology and radon variability in buildings: Environment In ternational, v. 8, no. 1-6, p. 97-103.
Schumann, R.R., and Owen, D.E., 1988, Relationships be tween geology, equivalent uranium concentration, and radon in soil gas, Fairfax County, Virginia: U.S. Geological Survey Open-File Report 88-18, 28 p.
Sextro, R.G., Moed, B.A., Nazaroff, W.W., Revzan, K.L., and Nero, A.V., 1987, Investigations of soil as a source of in door radon, in Hopke, P.K., ed., Radon and its decay prod ucts; Occurrence, properties and health effects: Washing ton, Am. Chemical Society Symposium Series 331, p. 10-29.
Tanner, A.B., 1980, Radon migration in the ground: a sup plementary review, in Gesell, T.F., and Lowder, W.M., eds., Natural Radiation Environment III: Springfield, NTIS, U.S. Department of Energy Report CONF-780422, v. 1, p. 5-56.
_1986, Indoor radon and its sources: U.S. Geological Survey Open-File Report 86-222, 6 p.
This publication is one of a series of general interest publications prepared by the U.S. Geological Survey to provide information about the earth sciences, natural resources, and the environment. To obtain a catalog of additional titles in the series "General Interest Publica tions of the U.S. Geological Survey," write:
Book and Open-File Report SalesU.S. Geological SurveyFederal Center, Box 25425Denver, CO 80225
*U.S. Government Printing Office: 1992 0-326-248
For sale by the U.S. Government Printing OfficeSuperintendent of Documents, Mail Stop: SSOP, Washington, DC 20402-9328
ISBN 0-16-037974-1
As the Nation's principal conservation agency, the Department of the Interior has responsibility for most of our nationally owned public lands and natural and cultural resources. This includes fostering wise use of our land and water resources, protecting our fish and wildlife, preserving the environmental and cultural values of our national parks and historical places, and providing for the enjoyment of life through outdoor recreation. The Department assesses
our energy and mineral resources and works to assure that their development is in the best interests of all our people. The Department also promotes the goals of the Take Pride in America campaign by encouraging stewardship and citizen responsibility for the public lands and promoting citizen participation in their care. The Department also has a major respon sibility (or American Indian reservation communities and for people who live in Island Territo ries under U.S. Administration.