the emerging risk environment in china dr. guangping (peter g.) zhang deputy director general china...
Post on 21-Dec-2015
213 views
TRANSCRIPT
The Emerging Risk Environment in China
Dr. Guangping (Peter G.) ZhangDeputy Director General
China Banking Regulatory CommissionShanghai Bureau
Asia-Pacific Finance and Development CenterJune 18, 2008
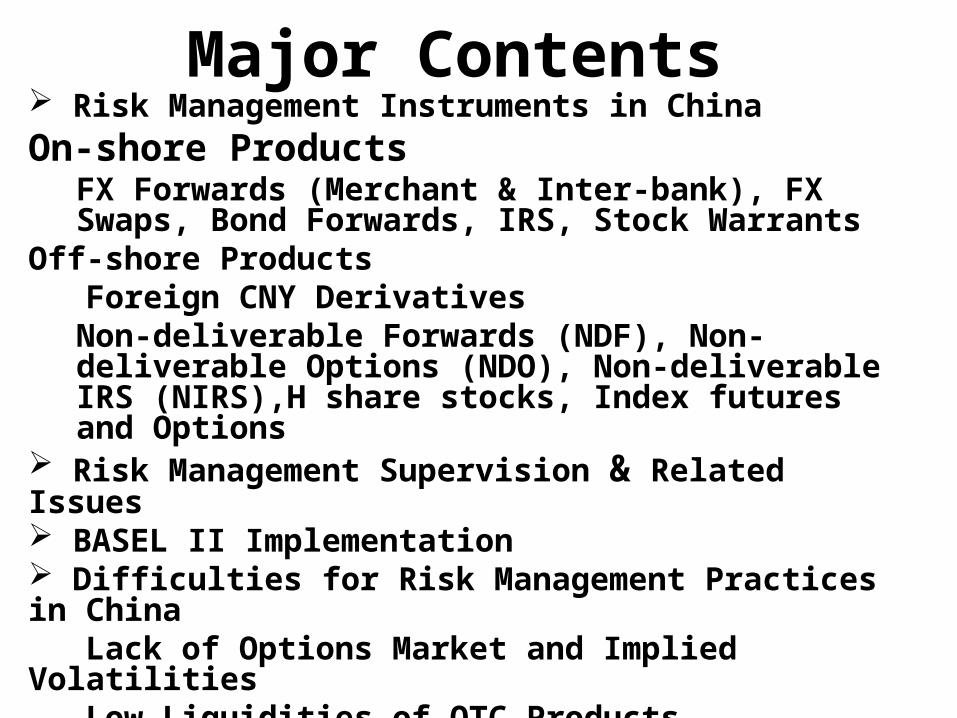
Major Contents Risk Management Instruments in ChinaOn-shore Products
FX Forwards (Merchant & Inter-bank), FX Swaps, Bond Forwards, IRS, Stock Warrants
Off-shore Products Foreign CNY Derivatives
Non-deliverable Forwards (NDF), Non-deliverable Options (NDO), Non-deliverable IRS (NIRS),H share stocks, Index futures and Options
Risk Management Supervision & Related Issues BASEL II Implementation Difficulties for Risk Management Practices in China Lack of Options Market and Implied Volatilities Low Liquidities of OTC Products Product Design & Pricing
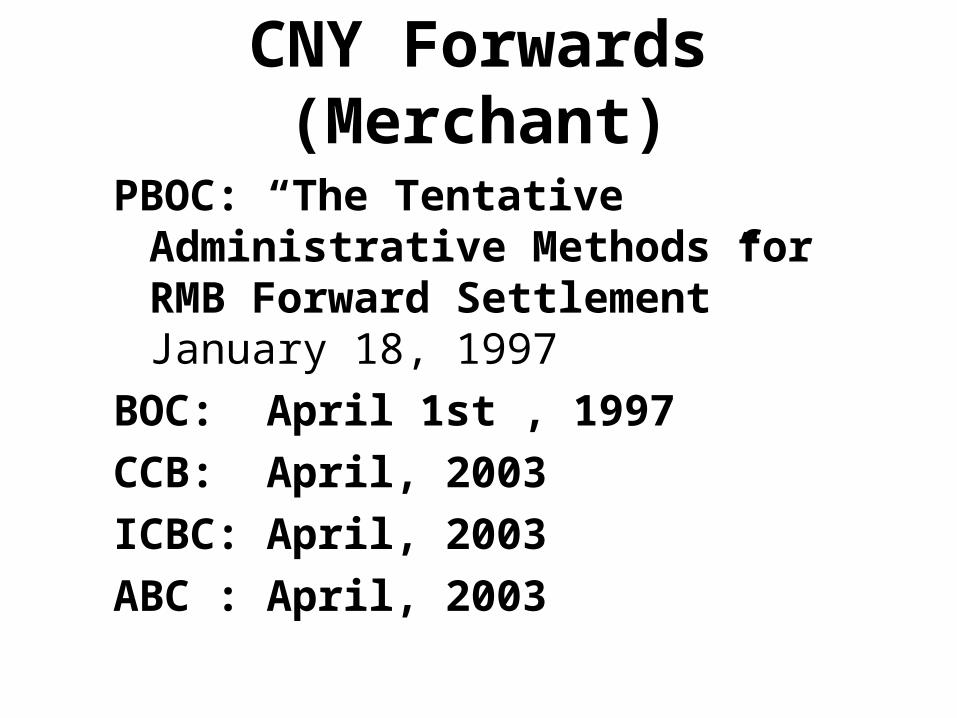
CNY Forwards (Merchant)
PBOC: “The Tentative Administrative Methods for RMB Forward Settlement” January 18, 1997
BOC: April 1st , 1997
CCB: April, 2003
ICBC: April, 2003
ABC : April, 2003
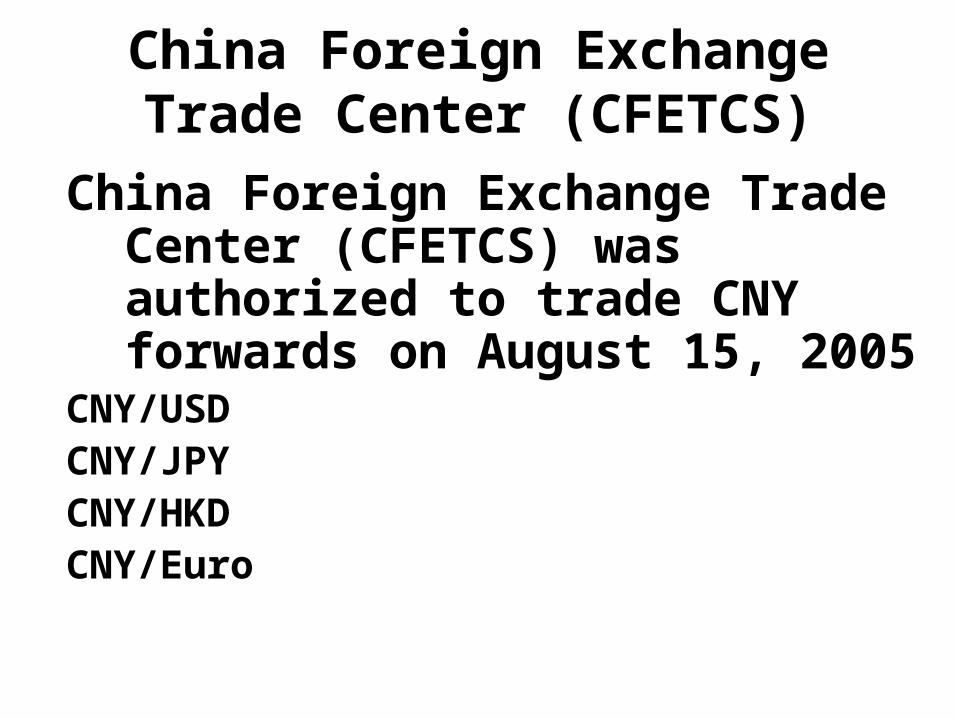
China Foreign Exchange Trade Center (CFETCS)
China Foreign Exchange Trade Center (CFETCS) was authorized to trade CNY forwards on August 15, 2005
CNY/USDCNY/JPYCNY/HKDCNY/Euro
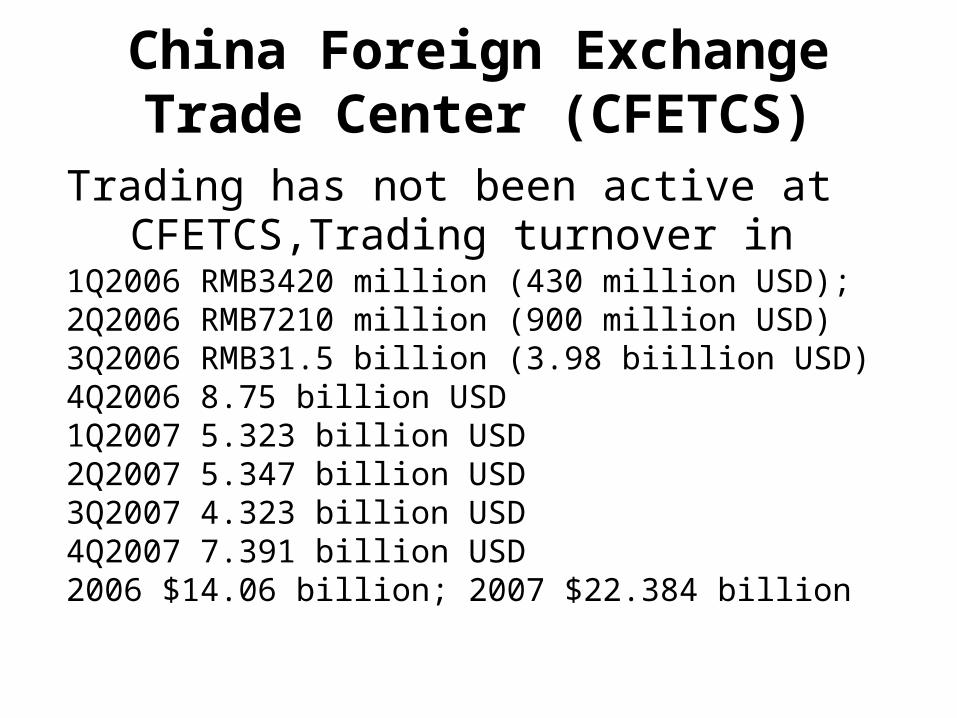
China Foreign Exchange Trade Center (CFETCS)
Trading has not been active at CFETCS,Trading turnover in
1Q2006 RMB3420 million (430 million USD); 2Q2006 RMB7210 million (900 million USD)3Q2006 RMB31.5 billion (3.98 biillion USD)4Q2006 8.75 billion USD1Q2007 5.323 billion USD 2Q2007 5.347 billion USD3Q2007 4.323 billion USD4Q2007 7.391 billion USD2006 $14.06 billion; 2007 $22.384 billion
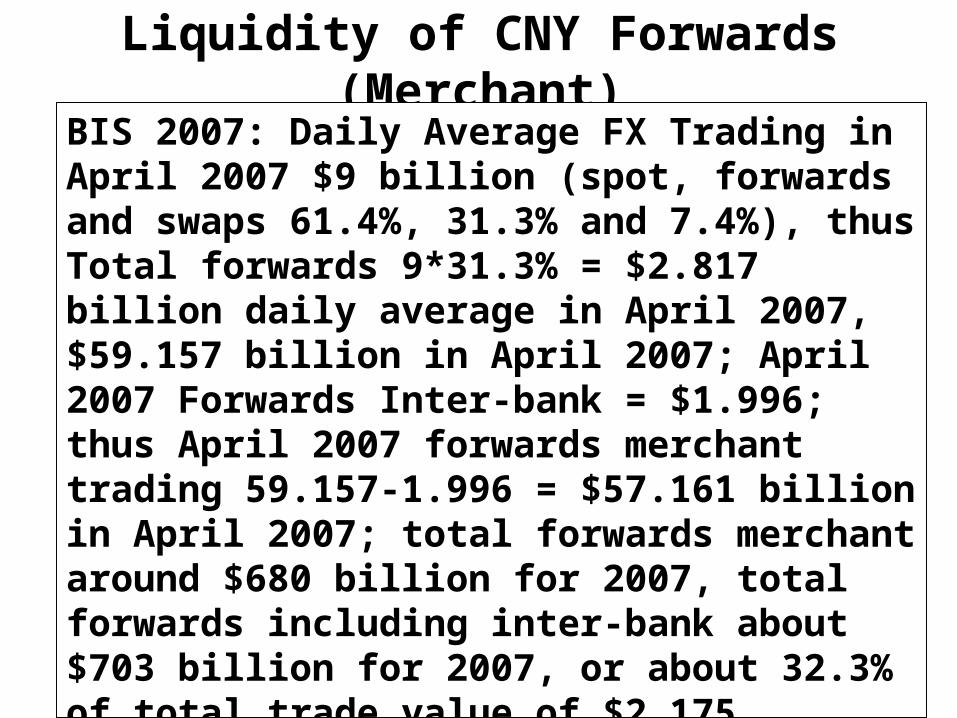
Liquidity of CNY Forwards (Merchant)BIS 2007: Daily Average FX Trading in April 2007 $9 billion (spot, forwards and swaps 61.4%, 31.3% and 7.4%), thusTotal forwards 9*31.3% = $2.817 billion daily average in April 2007, $59.157 billion in April 2007; April 2007 Forwards Inter-bank = $1.996; thus April 2007 forwards merchant trading 59.157-1.996 = $57.161 billion in April 2007; total forwards merchant around $680 billion for 2007, total forwards including inter-bank about $703 billion for 2007, or about 32.3% of total trade value of $2.175 trillion in 2007, compared to international ratio around 150%
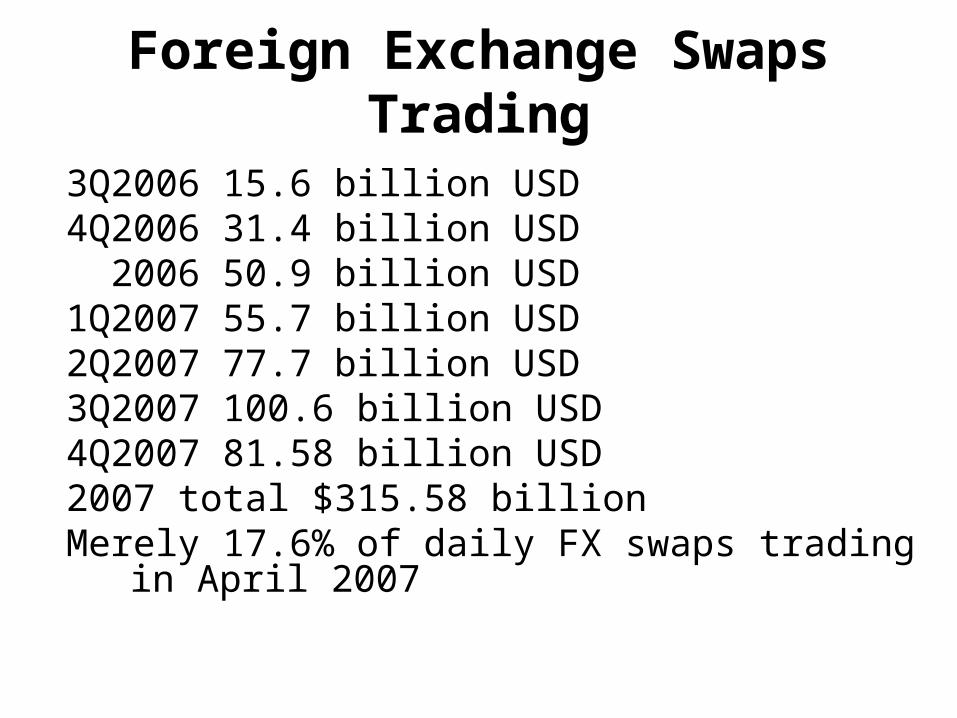
Foreign Exchange Swaps Trading
3Q2006 15.6 billion USD4Q2006 31.4 billion USD 2006 50.9 billion USD1Q2007 55.7 billion USD 2Q2007 77.7 billion USD3Q2007 100.6 billion USD4Q2007 81.58 billion USD2007 total $315.58 billionMerely 17.6% of daily FX swaps trading
in April 2007
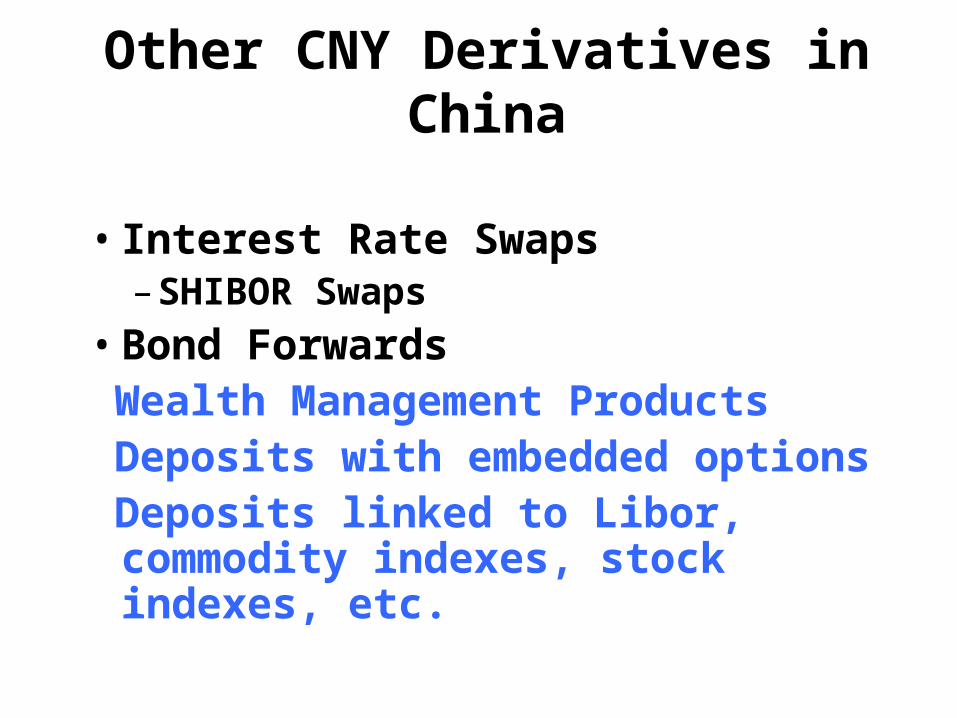
Other CNY Derivatives in China
• Interest Rate Swaps– SHIBOR Swaps
• Bond Forwards Wealth Management Products Deposits with embedded options Deposits linked to Libor, commodity
indexes, stock indexes, etc.
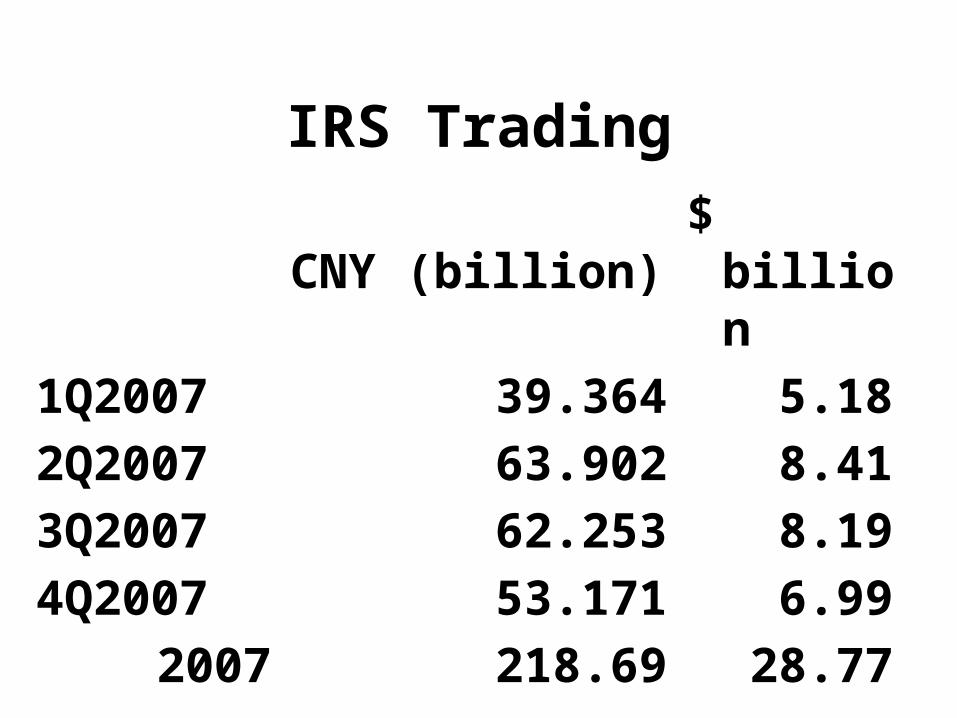
IRS Trading
CNY (billion) $ billion
1Q2007 39.364 5.18 2Q2007 63.902 8.41 3Q2007 62.253 8.19 4Q2007 53.171 6.99
2007 218.69 28.77
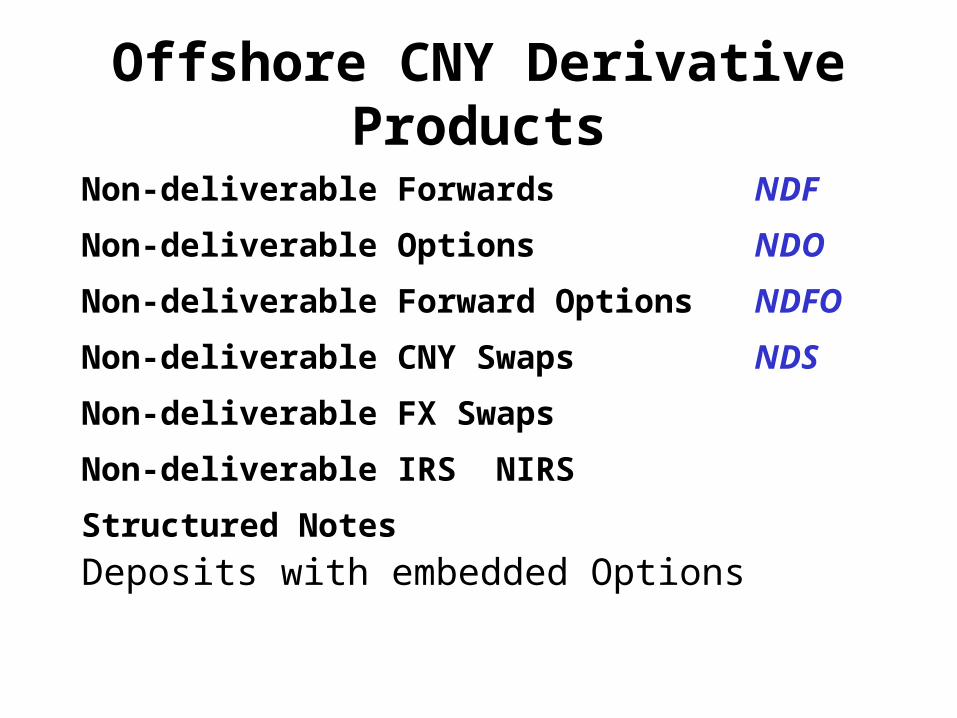
Offshore CNY Derivative Products
Non-deliverable Forwards NDF
Non-deliverable Options NDO
Non-deliverable Forward Options NDFO
Non-deliverable CNY Swaps NDS
Non-deliverable FX Swaps
Non-deliverable IRS NIRS
Structured Notes
Deposits with embedded Options

CNY NDF-most Popular Product offshoreCame into existence in 1996 before Asian financial crisis, yet liquidity was extremely low
Liquidity began to pick up late in 2002
Trading turnover estimated around US$150- 180 billion in 2003 & 2004!
around US$250 billion in 2005
around US$300 billion in 2006
around US$360 billion in 2007
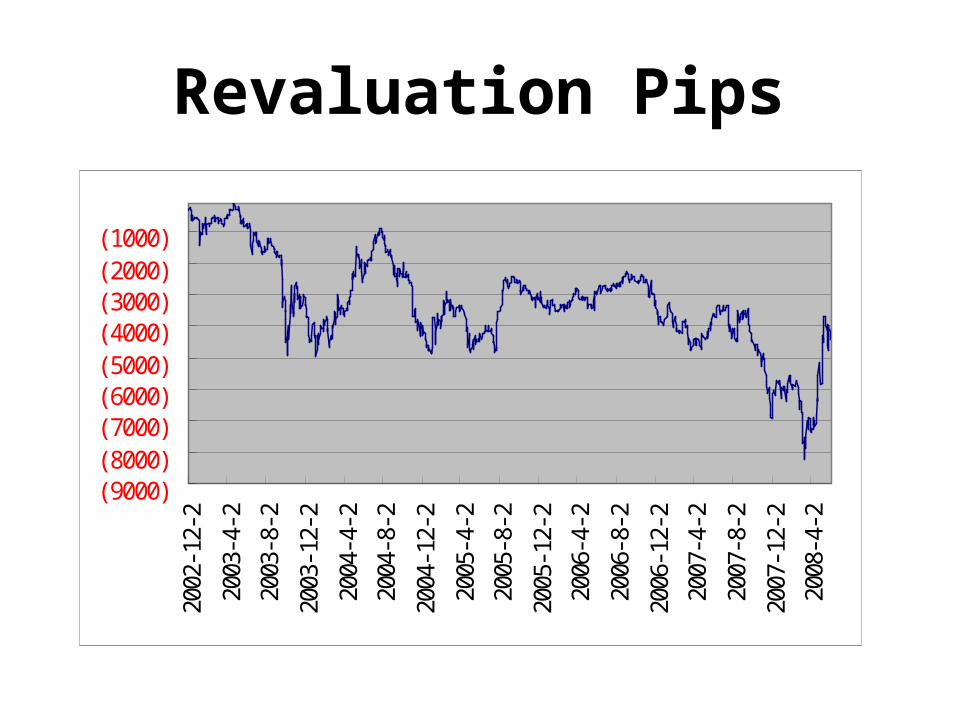
Revaluation Pips
(9000)(8000)(7000)(6000)(5000)(4000)(3000)(2000)(1000)
2002
-12-
2
2003
-4-2
2003
-8-2
2003
-12-
2
2004
-4-2
2004
-8-2
2004
-12-
2
2005
-4-2
2005
-8-2
2005
-12-
2
2006
-4-2
2006
-8-2
2006
-12-
2
2007
-4-2
2007
-8-2
2007
-12-
2
2008
-4-2
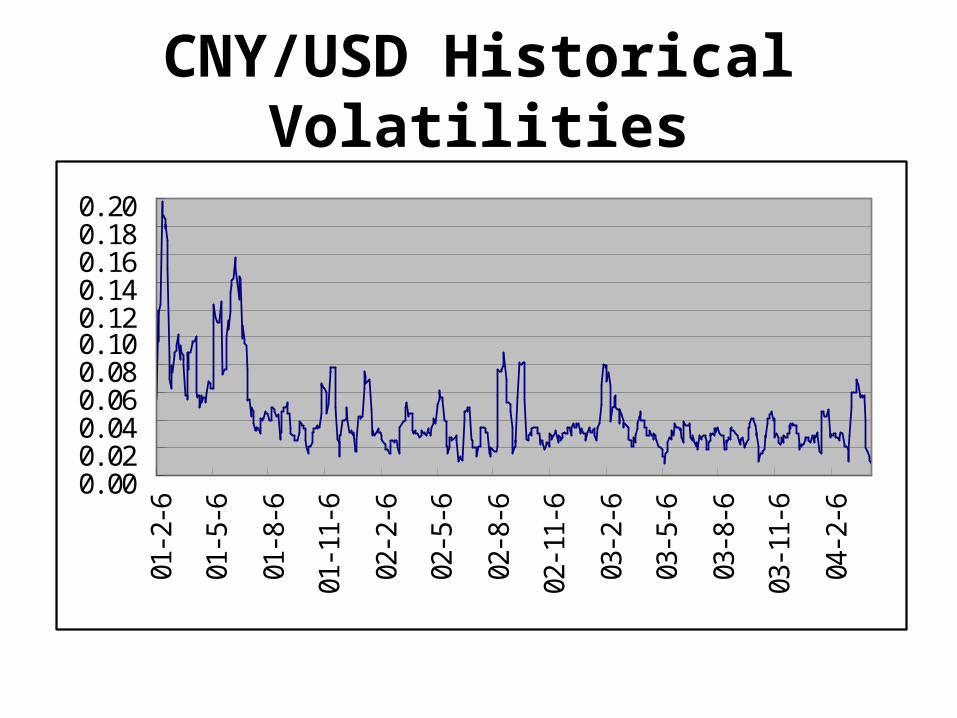
CNY/USD Historical Volatilities
0. 000. 020. 040. 060. 080. 100. 120. 140. 160. 180. 20
01-2
-6
01-5
-6
01-8
-6
01-1
1-6
02-2
-6
02-5
-6
02-8
-6
02-1
1-6
03-2
-6
03-5
-6
03-8
-6
03-1
1-6
04-2
-6
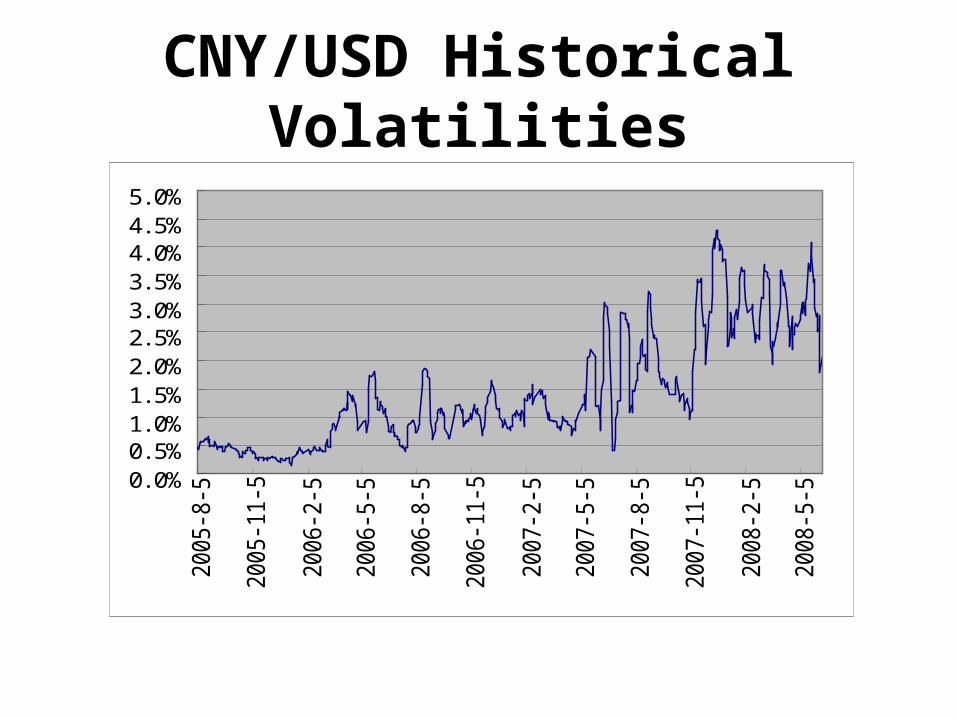
CNY/USD Historical Volatilities
0. 0%0. 5%1. 0%1. 5%2. 0%2. 5%3. 0%3. 5%4. 0%4. 5%5. 0%20
05-8
-5
2005
-11-
5
2006
-2-5
2006
-5-5
2006
-8-5
2006
-11-
5
2007
-2-5
2007
-5-5
2007
-8-5
2007
-11-
5
2008
-2-5
2008
-5-5
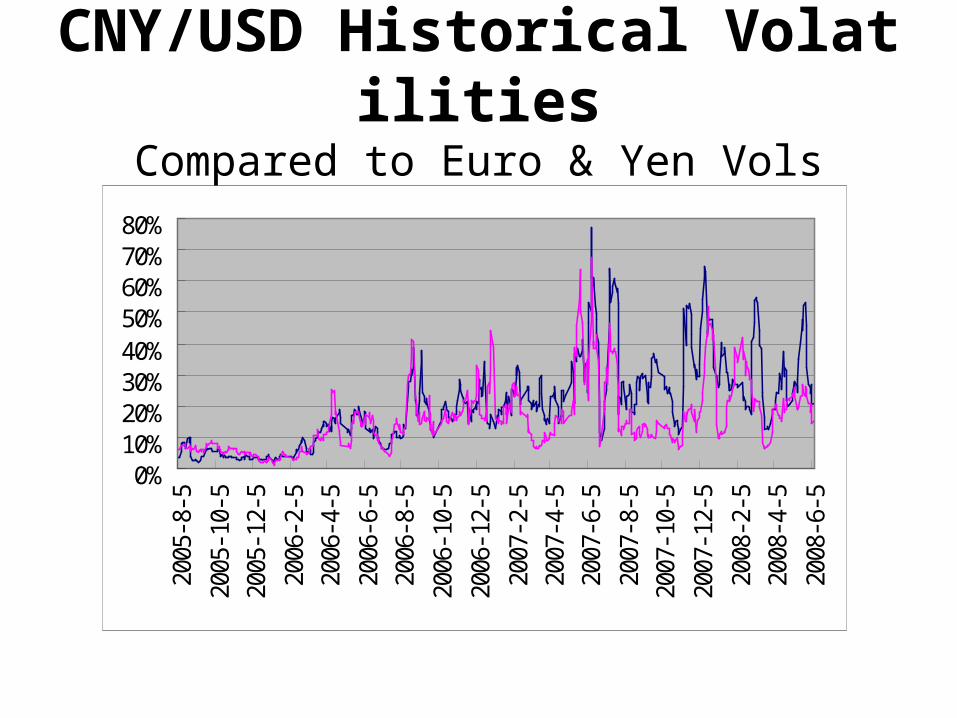
CNY/USD Historical VolatilitiesCompared to Euro & Yen Vols
0%10%20%30%40%50%60%70%80%
2005
-8-5
2005
-10-
5
2005
-12-
5
2006
-2-5
2006
-4-5
2006
-6-5
2006
-8-5
2006
-10-
5
2006
-12-
5
2007
-2-5
2007
-4-5
2007
-6-5
2007
-8-5
2007
-10-
5
2007
-12-
5
2008
-2-5
2008
-4-5
2008
-6-5

Appreciation and Further Expectation for RMB
2%4%6%8%
10%12%14%16%18%20%22%24%26%28%30%
2005
-8-1
2005
-10-
1
2005
-12-
1
2006
-2-1
2006
-4-1
2006
-6-1
2006
-8-1
2006
-10-
1
2006
-12-
1
2007
-2-1
2007
-4-1
2007
-6-1
2007
-8-1
2007
-10-
1
2007
-12-
1
2008
-2-1
2008
-4-1
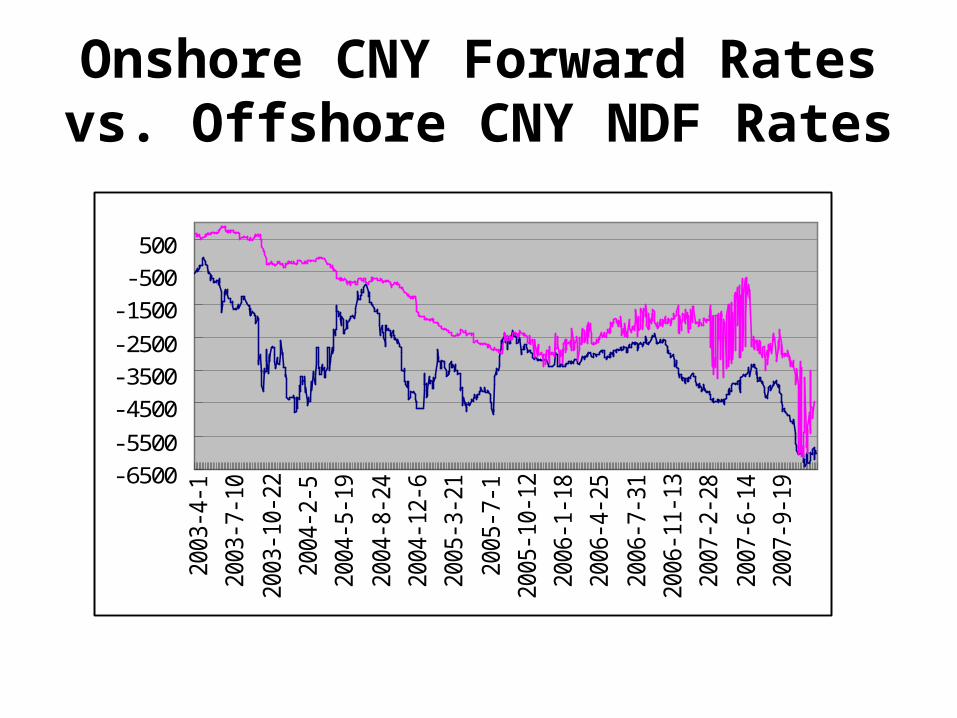
Onshore CNY Forward Rates vs. Offshore CNY NDF Rates
-6500-5500
-4500-3500-2500
-1500-500500
2003
-4-1
2003
-7-1
0
2003
-10-
22
2004
-2-5
2004
-5-1
9
2004
-8-2
4
2004
-12-
6
2005
-3-2
1
2005
-7-1
2005
-10-
12
2006
-1-1
8
2006
-4-2
5
2006
-7-3
1
2006
-11-
13
2007
-2-2
8
2007
-6-1
4
2007
-9-1
9

BASEL II Implementation in China
Major Chinese Banks are Required to Implement BASEL II by 2010
Market Risk Management
Credit Risk Management
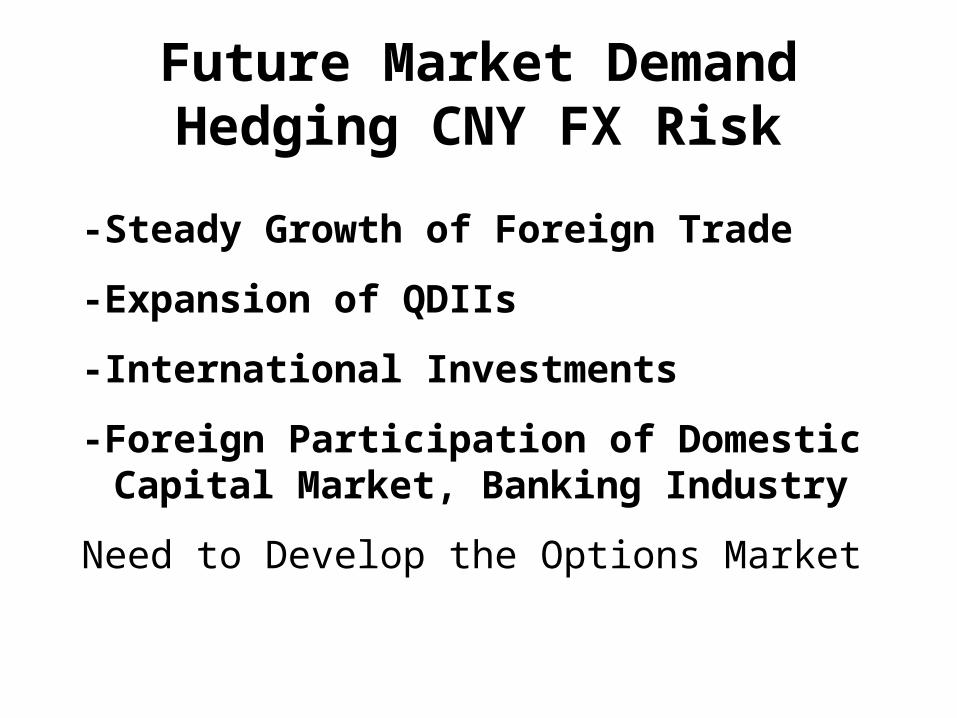
Future Market DemandHedging CNY FX Risk
-Steady Growth of Foreign Trade
-Expansion of QDIIs
-International Investments
-Foreign Participation of Domestic Capital Market, Banking Industry
Need to Develop the Options Market
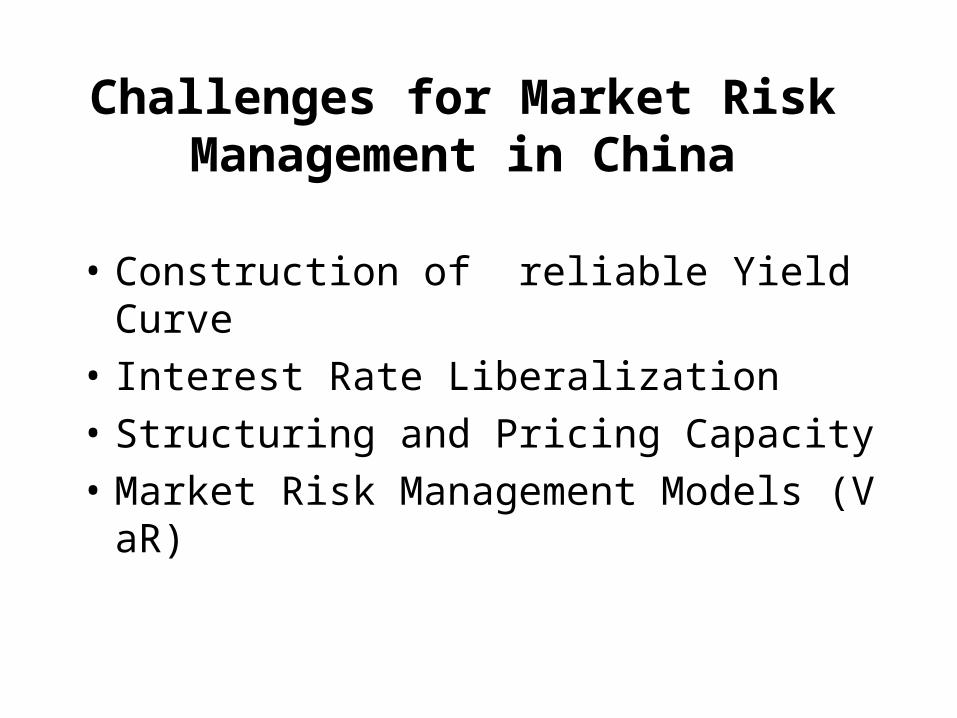
Challenges for Market Risk Management in China
• Construction of reliable Yield Curve
• Interest Rate Liberalization
• Structuring and Pricing Capacity
• Market Risk Management Models (VaR)
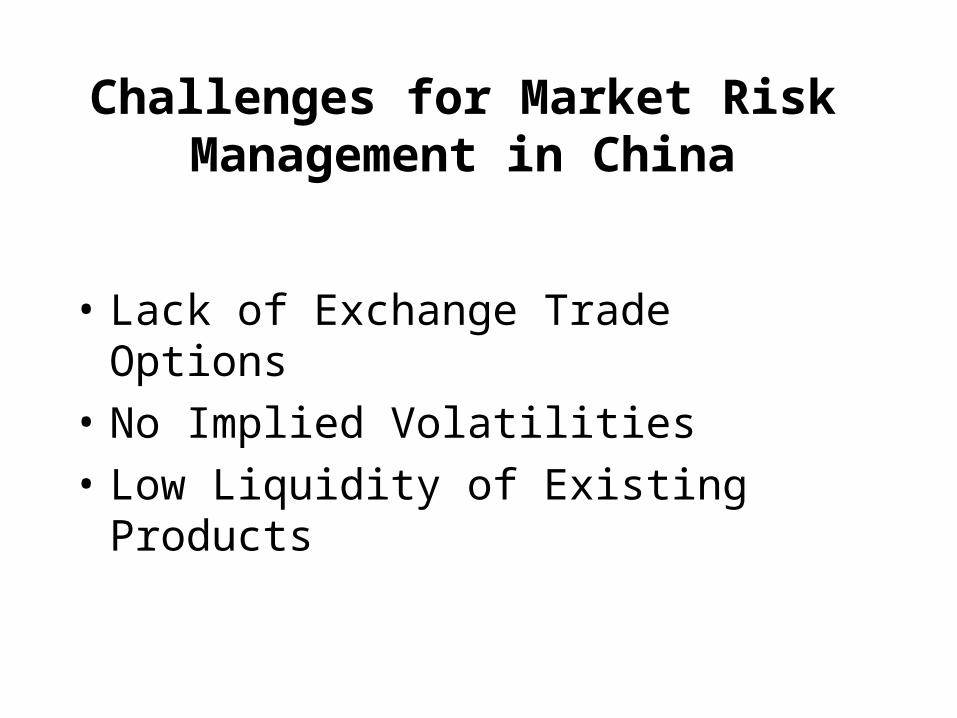
Challenges for Market Risk Management in China
• Lack of Exchange Trade Options
• No Implied Volatilities
• Low Liquidity of Existing Products

Comparisons with Indian Rupee Derivatives Markets
Average Daily Trading Value of Foreign Exchange in China & India
Foreign Exchange Trading ($billion)
SpotsOutright
Forwards
Foreign Exchan
ge Swaps
China 9 5.53 2.82 0.67
India 34 14.48 9.35 10.13
China 61.4% 31.3% 7.4%
India 42.6% 27.5% 29.8%
Word 3210 32.6% 11.7% 55.6%
Average Daily IR derivatives in April$ 1 billion in 2004 and $ 3 billion in 2007, India,
---in China
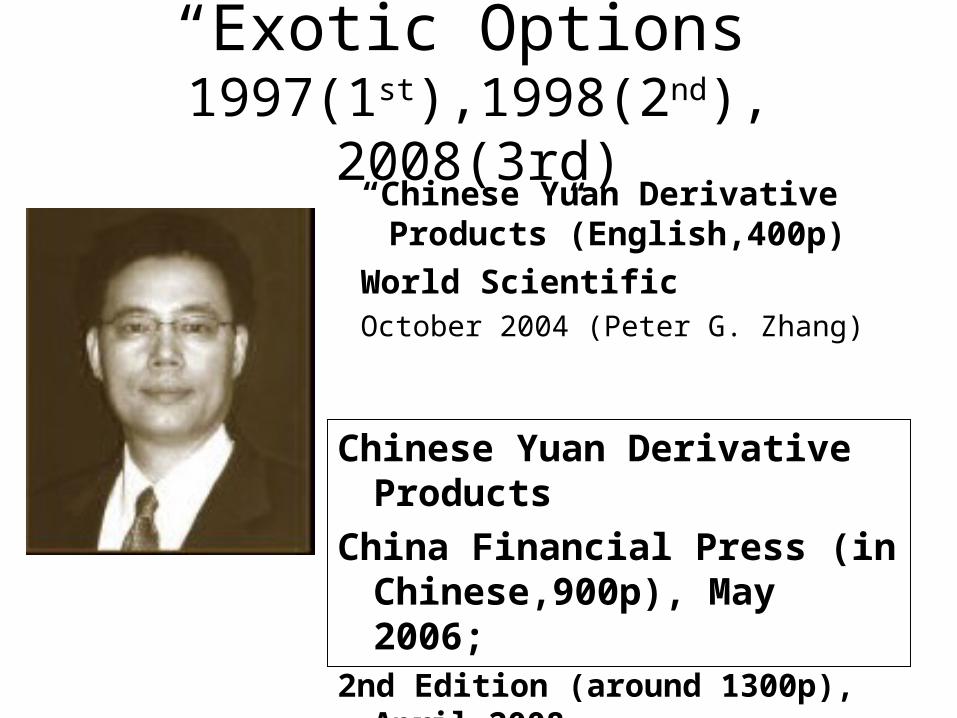
“Exotic Options” 1997(1st),1998(2nd), 2008(3rd)
“Chinese Yuan Derivative Products”(English,400p)
World ScientificOctober 2004 (Peter G. Zhang)
Chinese Yuan Derivative Products
China Financial Press (in Chinese,900p), May 2006;
2nd Edition (around 1300p), April 2008

Thank You!