the emergence of sub-replacement family size ideals in … · the emergence of sub-replacement...
TRANSCRIPT

The Emergence of Sub-Replacement Family Size Ideals in Europe
Joshua Goldstein Wolfgang Lutz
Maria Rita Testa
Wolfgang Lutz heads the Population Project at the International Institute for Applied Systems Analysis in Laxenburg, Austria, and is the director of the Vienna Institute of Demography at the Austrian Academy of Sciences. Joshua Goldstein is associate professor of sociology and public affairs at Princeton University and a faculty associate of the Office of Population Research. Maria Rita Testa is research scientist at the Vienna Institute of Demography. Authors arranged in alphabetical order.

Abstract
While period fertility started to drop significantly below replacement in most Western European countries during the 1970s and 1980s, most fertility surveys, value studies and opinion polls have found that the number of children considered ideal for society or for one’s own family has remained above two children per woman. These surveys have led to the expectation that – sooner or later – period fertility would recover in Europe. The most recent data from the Eurobarometer 2001 survey, however, suggest that in the German-speaking parts of Europe the average ideal family sizes given by younger men and women have fallen as low as 1.7 children. This paper examines the consistency and the credibility of these new findings, which – if they are indeed indications of a new trend – may alter the current discussion about future fertility trends in Europe.
European Demographic Research Papers are working papers that deal with all-European issues or with issues that are important to a large number of European countries. All contributions have received only limited review.
* * * This material may not be reproduced without written permission from the authors.
2

INTRODUCTION
The persistence of high family size ideals has remained a puzzle for demographers in the industrial world. Despite declines in period fertility well below replacement level in many European countries, women and men have consistently responded to surveys saying they would ideally like to have at least two or more children. For some, the high ideal has implied unmet demand for children and an opportunity for pro-natalist public policies to increase achieved fertility (Chesnais, 1996 and 2000). For others, the continuation of high ideal family size suggests that period fertility will eventually rise, if and when the tempo-depressing effects of delayed childbearing come to an end (Bongaarts 2001). Even sceptics of the predictive power of stated fertility wonder at the normative strength of the two-child ideal (Livi Bacci 2001).
In this note, we report evidence that the two-child ideal may be beginning to change in several European countries. The latest round of the Eurobarometer survey (2001) shows that while in most countries women of all ages still have family size ideals above replacement, national averages in Austria and Germany have fallen well below replacement. Younger cohorts in Austria and Germany report even lower ideal family sizes, averaging 1.7 children. Both Austria and Germany were also among the first countries to experience declines in period fertility well below replacement levels. It appears that changing actual family sizes are, at last, beginning to have an effect on the ideals of the next generation.
The emergence of below-replacement ideal fertility, if it persists, may mark a new stage in below-replacement fertility regimes. In a recent paper Bongaarts (2001:276) writes: “whether desired family size remains at or drops below two is the most crucial issue determining post-transitional fertility.“ This paper presents the first evidence of the beginning of a decline in ideal family size below the two-child norm.
3

BACKGROUND
Fertility preferences have been gathered as part of surveys for several decades now. However, initial hopes that reported family size ideals and intentions would lead to improved accuracy of fertility forecasts were soon disappointed. Earlier reports have shown that family size ideals have fallen little or slowly in the face of substantial fertility declines. In high fertility countries, stated fertility preferences tend to be lower than the actual figures, an indication to some of an “unmet need“ for contraception. In low fertility countries, however, just the opposite pattern has held. For the last several decades, aggregate fertility levels have fallen well short of stated ideals.
Explanations for the divergence of attitudes and behaviour have taken several forms. Westoff and Ryder (1977) argued that respondents are simply not in a position to anticipate the future course of their lives and in particular the period conditions which may or may not make childbearing more or less propitious. Even when aggregate fertility matches well with aggregate expectations, individuals are not able to anticipate their own fertility very well (Westoff 1981)
Nambodiri (1983) emphasizes that preferences themselves change over the life cycle and the decision to have a child has to be considered in a sequential and conditional process. Monnier (1987), following the approach of rational choice theories (Yamaguchi and Ferguson 1995), argues that fertility intentions have to be examined at different parities, because conditions and individual plans may change after each new birth.
Finally, many have argued that fertility ideals reported on surveys reflect societal norms and the respondent’s expectation of what surveyors want to hear (Livi Bacci 2001; Livi Bacci and De Santis 2001). Indeed, the two-child family – one boy and one girl – has long been considered the ideal family structure in Western European countries.
4
Despite measurement difficulties, changes in fertility preferences still play a causal role in most theories of fertility decline (Lesthaeghe and Surkyn 1988, Van de Kaa 2001). Recent research on the dynamics of behavioural diffusion establishes a strong relation between desired and achieved fertility (National Research Council 2001). Theoretical models such as that built by Kohler (2001) assume a strong connection between the achieved fertility of others and one’s own desired fertility.
Sociological theory sees changing ideals as a precursor to changing behaviour (Ajzen and Fishbein 1980; Rindfuss et al. 1988; Shoen et al. 1997). In contrast, in his modelling of the dynamics of changing preferences, Lee (1980) has shown that under many conditions changing intentions will lag behind period fertility as a result of compositional effects within the population.
SURVEY METHODOLOGY
The Eurobarometer survey is designed for comparative analysis among national populations. Stratified sampling assured nearly equal probability samples of about 1,000 respondents in each of the 15 EU nations. The sample size allows equally precise estimates for small and large countries, as well as some comparison between sub-groups broken down by sex, age, and educational attainment.
The survey used a single uniform questionnaire design, with particular attention being paid to equivalent question wording across languages. Question wording is of particular importance in measuring fertility intentions, as responses depend significantly on how the questions are phrased, even small differences in wording leading to considerable differences in stated intentions. The comparability of the results across nations was also enhanced by the use of a single multilingual survey collection team.
5
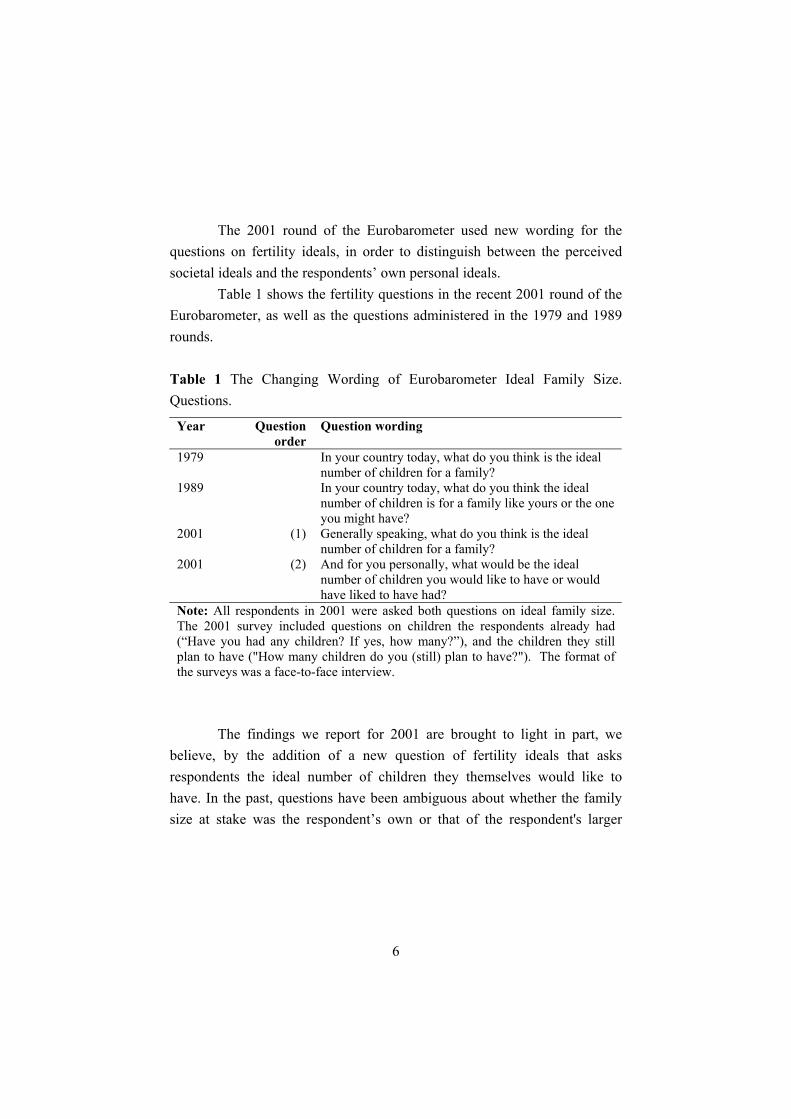
The 2001 round of the Eurobarometer used new wording for the questions on fertility ideals, in order to distinguish between the perceived societal ideals and the respondents’ own personal ideals.
Table 1 shows the fertility questions in the recent 2001 round of the Eurobarometer, as well as the questions administered in the 1979 and 1989 rounds. Table 1 The Changing Wording of Eurobarometer Ideal Family Size. Questions.
Year Question order
Question wording
1979 In your country today, what do you think is the ideal number of children for a family?
1989 In your country today, what do you think the ideal number of children is for a family like yours or the one you might have?
2001 (1) Generally speaking, what do you think is the ideal number of children for a family?
2001 (2) And for you personally, what would be the ideal number of children you would like to have or would have liked to have had?
Note: All respondents in 2001 were asked both questions on ideal family size. The 2001 survey included questions on children the respondents already had (“Have you had any children? If yes, how many?”), and the children they still plan to have ("How many children do you (still) plan to have?"). The format of the surveys was a face-to-face interview.
The findings we report for 2001 are brought to light in part, we
believe, by the addition of a new question of fertility ideals that asks respondents the ideal number of children they themselves would like to have. In the past, questions have been ambiguous about whether the family size at stake was the respondent’s own or that of the respondent's larger
6
society. In this note, we report answers from the personal ideals item1 (question 2001 (2) in Table 1), as this is the most direct measure of the respondent’s own attitudes.
The results from the 1979 and 1989 round questions are not strictly comparable to the latest round. In the 1979 and 1989 the average societal ideal family size of Europeans was 2.37 and 2.16 respectively, but the two rounds did not include the same list of countries2. Individual countries clustered around this average. Ireland had the highest preferences, with average ideals of 3.62 and 2.79 children per family, respectively in 1979 and 1989. Germany and Luxembourg showed the lowest desired family size in both surveys, with an ideal number of children just below two in 1989. The results from the earlier surveys are broadly consistent with the question on the generally ideal number of children for a family asked in 2001 (question 2001 (1) in Table 1). Ireland and Greece have the highest ideals and Germany is the last country on the list, showing together with Austria societal childbearing ideals just below 2.
In addition to the items on ideal family size, the Eurobarometer questionnaire includes items that allow the calculation of expected family size. This is computed by adding the number of children that respondents already have to the number they still plan to have. The intentions question, which follows the item on the actual number of children, as well as several items asking about childbearing goals at age 20 and possible reasons why these goals might not have been achieved3, encourages respondents to think
1 Changes in question wording make it difficult to compare different rounds of the survey. In particular, there was no question on personal ideals in the past. 2 The 1979 round is referred to EU-9, and that of 1989 is referred to EU-12. The EU-9 includes Belgium, Germany, Denmark, France, Italy, Ireland, Luxembourg, Netherlands, and the United Kingdom. The EU-12 encompasses the nine countries mentioned plus Spain, Greece and Portugal. The Eurobarometer 2001 was carried out in the EU-15, consisting of EU-12 as well as Austria, Finland and Sweden. 3 The question on desired fertility at age 20 appears to have been difficult for respondents to answer. Only 60% responded by giving a specific number of desired
7
even more concretely about their own situation, taking into account not only their ideals, but also the obstacles that might interfere with achieving ideal family size. RESULTS
We now present the results of the 2001 Eurobarometer round. We focus on women aged 20 to 34 years. The cross-national differences in ideal family size for women are broadly consistent with the differences observed for men. However, men’s responses show greater variability, as do those of women aged 15-19, perhaps because family size questions are more abstract for these youngest cohorts. We divide the population at age 35 in order to distinguish between women who had largely finished childbearing and those who had not yet begun or were still in the middle of their childbearing career. The 35-year age division provided us with sufficient sample sizes to estimate the two age groups separately.
children. Among these, the answers tended to be low, suggesting that some may have understood the question to refer to the number of births they would have liked to have during their early twenties rather than over their entire reproductive career.
8
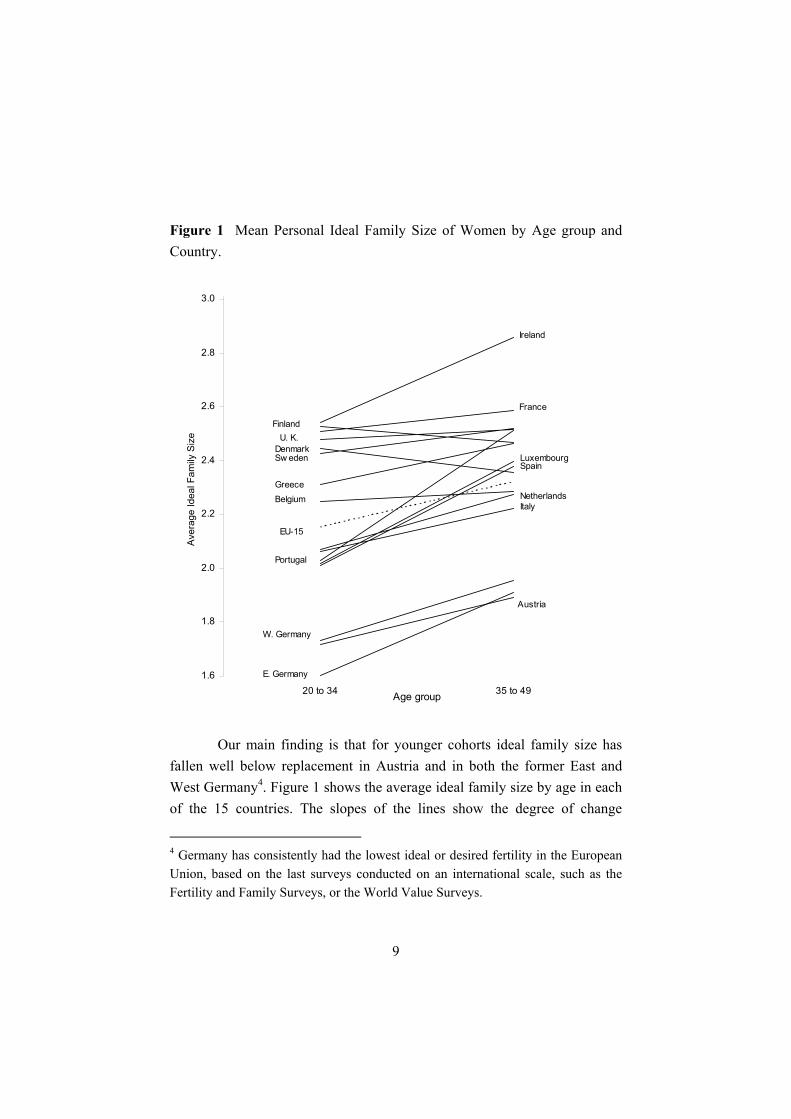
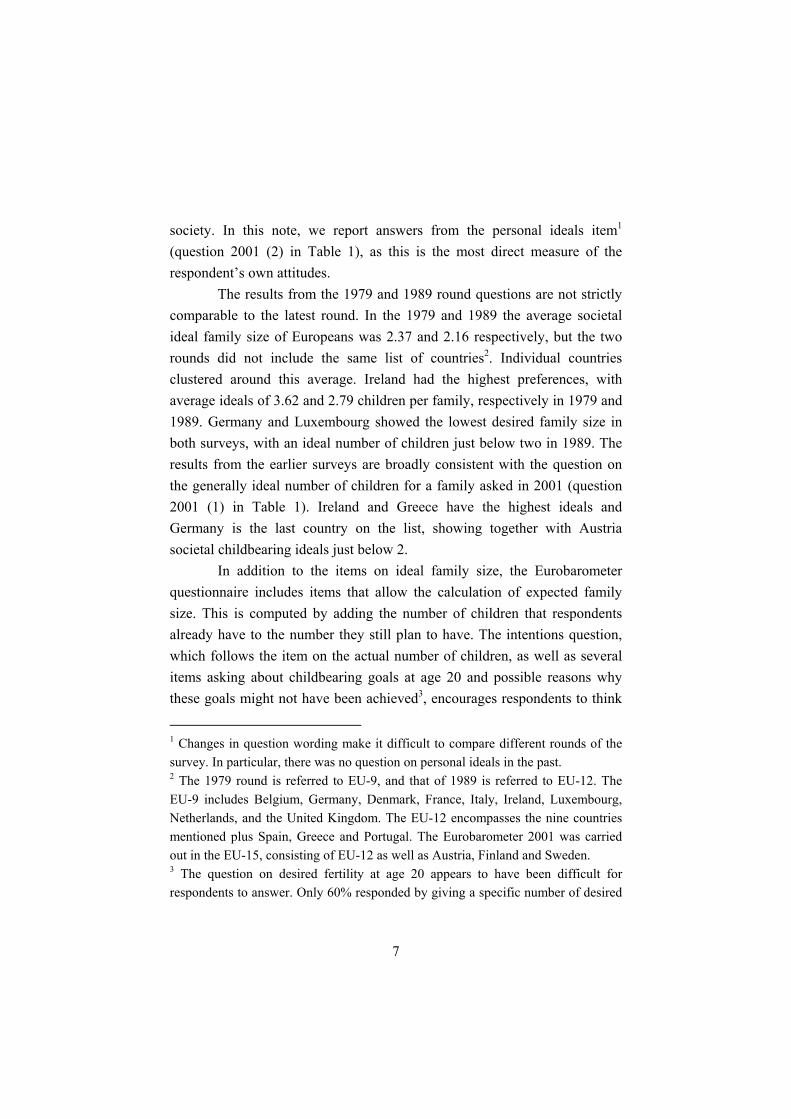
Figure 1 Mean Personal Ideal Family Size of Women by Age group and Country.
1.6
1.8
2.0
2.2
2.4
2.6
2.8
3.0
20 to 34 35 to 49Age group
Aver
age
Idea
l Fam
ily S
ize
Ireland
France
Finland
E. Germany
Austria
W. Germany
Denmark
GreeceBelgium
EU-15
ItalyNetherlands
SpainLuxembourg
U. K.
Sw eden
Portugal
Our main finding is that for younger cohorts ideal family size has
fallen well below replacement in Austria and in both the former East and West Germany4. Figure 1 shows the average ideal family size by age in each of the 15 countries. The slopes of the lines show the degree of change
9
4 Germany has consistently had the lowest ideal or desired fertility in the European Union, based on the last surveys conducted on an international scale, such as the Fertility and Family Surveys, or the World Value Surveys.
between younger and older generations. Looking at the younger cohorts, we see that the three German-speaking regions form their own cluster of low fertility ideals, with ideal family size averaging 1.6 in the former East Germany, and about 1.7 in both Austria and the former West Germany. No other European country in the Eurobarometer has family size ideals that average below two5. In fact, ideals in other low fertility countries like Italy, Spain and Greece are all well above two children6.
As the figure shows, younger cohorts generally preferred smaller family sizes than older ones. Although the sampling errors for each sub-group are fairly large, on the order of 0.07-0.17, we still see evidence of rapidly declining preferences in Germany and Austria, as well as Italy, Portugal, Spain, Ireland, and the Netherlands. The EU average is also declining7. This comparison between age groups probably reveals both temporal and life-cycle influences: the older cohorts both grew up in a different time and were surveyed at an older age. It may be that the ideals of the younger cohorts will approach those of the older cohorts as they age. However, this would run counter to the general tendency of cohorts, whose ideals fall slightly as they converge towards achieved fertility levels that are typically well below the ideals expressed at younger ages.
5 Non-response rates for the whole population across countries ranged from 0 to about 20 percent. Non-response levels were not associated with differences in ideal family size. For example, Austria had a high non-response rate and West Germany had one of the lowest. Non-respondents were less likely to already be parents. However, they differed little in other characteristics. Non-responses have been excluded from all the statistics reported here, except where noted. 6 The German mean personal ideal family size is statistically different from that of the other countries (apart from Austria). 7 The decline in the mean personal ideal family size across cohorts is statistically significant for the European Union as a whole, and for several individual countries, such as: Germany, Austria, Portugal, Spain, and Ireland, while for Italy and the Netherlands the statistical evidence of such a decline is weaker (only 10% level).
10

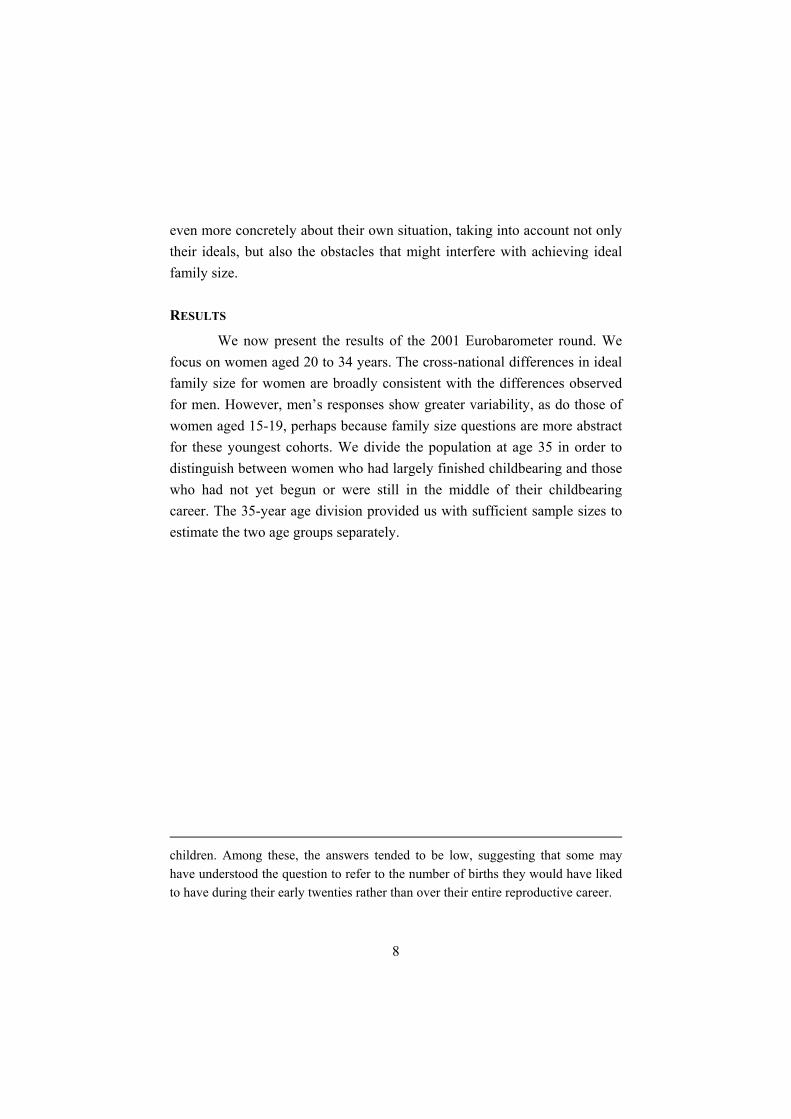
Figure 2 Distribution of Personal Ideal Family Size, Women aged 20 to 34.
54
57
41
46
59
52
54
56
53
53
54
55
52
53
51
49
42
40
0% 20% 40% 60% 80% 100%
Germany
W. Germany
E. Germany
Austria
Spain
Portugal
Luxembourg
Italy
Netherlands
EU-15
Belgium
Greece
United Kingdom
Denmark
Sw eden
France
Ireland
Finland
Cumulative Percentage
2.5
less than 2 exactly 2 children more than 2 Mean
2.5
2.5
2.4
2.4
2.5
2.3
2.2
2.1
2.1
2.1
2
2
2
1.7
1.6
1.7
1.7
The average is a summary of the entire distribution of ideal family sizes. Countries with similar average ideals can well have quite different distributions of ideal family sizes. Figure 2 shows the distribution of women
11

in each country, distinguishing those above, below, and at the two-child ideal8.
In the figure, countries are ordered by the proportion of women with family size ideals above two children, an ordering that corresponds well to mean ideal family size, shown in the right hand margin. The figures within the middle sub-section of each bar give the percentages preferring exactly two children.
A notable feature of the distribution of ideal family size is the substantial proportions with ideals of three or more children in some countries. In Italy and Greece, countries with current period total fertility of about 1.2 and 1.3 respectively, well over one quarter of younger women say they would like to have three or more children. By contrast, only about 10 percent of German women in this age group would prefer such large families.
Interestingly, we see that the two-child ideal is not less common in the German-speaking countries than in most other European countries. The lower averages in Austria and Germany instead stem from lower proportions wanting big families and higher proportions wanting small families. The two-child ideal is least common in Finland and Ireland, not because of lower fertility preferences, but rather because so many women prefer more than two children that the proportion preferring exactly two is actually smaller than in the countries with lower average ideal family sizes.
8 This categorization allows us to see the differences in the pattern of ideal family size within each country. Further breakdowns distinguishing between those who prefer no and one child or those who prefer three or four children tend to be unstable because of small sample sizes.
12

Table 2 Mean Personal Ideal and Expected Family Sizes of Younger European Women (20 to 34 years).
Average Countries with this average Countries with this average Ideal Family Size Expected Family Size 2.5 Finland, France, U. Kingdom, Ireland 2.4 Denmark, Sweden 2.3 Greece, United Kingdom, 2.2 Belgium, France, Finland 2.1* Netherlands, Italy Greece, Ireland 2.0 Portugal, Spain, Luxembourg Belgium, Sweden 1.9 Luxembourg, Portugal 1.8+ Netherlands, 1.7 Austria, West Germany Spain, 1.6 East Germany 1.5 Austria, Italy 1.4 West Germany 1.3 East Germany * EU-15 average Ideal Family Size + EU-15 average Expected Family Size
The relative positioning of national populations according to
expected family size tells a very similar story. Expected family size is the sum of the number of children a woman has already had at the time of the survey and the number of children the respondent “still plan[s] to have“. It is considered a more accurate, and constraint-influenced measure than “ideal“ family size. Table 2 shows that the number of children a woman actually expects is universally smaller than her stated ideal. For nearly all of the countries, average expected family sizes are 0.2-0.4 smaller than average ideal family sizes. The exceptions are interesting. Italian women, who live in a country in which current period fertility is only slightly more than half of the “ideal“ family size reported here, expect 0.6 children less than their (perhaps unrealistically high) childbearing ideals.
13

In Austria and Germany expected family sizes of 1.5 and 1.4 respectively, are quite close to current period total fertility. This is an indication that completed cohort fertility of these younger cohorts will be substantially below replacement. The expectations of the younger cohorts are lower than the tempo-adjusted period total fertility rates, which suggest that in the absence of postponement of births at all ages the period TFR would be about 1.89 (Bongaarts 2001).
EXPLANATIONS
What could explain the unusually low ideal family sizes among young Austrians and Germans? At this early time, it is not possible to give a definitive answer, but the explanation that seems most compelling to us is that family size ideals have fallen as part of societal shifts toward low-fertility norms. This shift occurs about one generation after below-replacement fertility ideals were reached, when new cohorts have been thoroughly submerged in a culture of small family sizes.
We first discuss two alternative explanations for the extremely low fertility ideals of Germany and Austria, and then turn to the possibility of generational lags and their implications.
A demographically uninteresting explanation is that “ideal family size“, as reported by Germans and Austrians in the survey, means something different than it does for other nationalities. If this were the case, the low ideals of German-speaking women would just be due to a different interpretation of the questionnaire rather than to a true difference in underlying family size ideals. While we cannot rule out the possibility that Germans simply responded differently to the survey instrument, this seems
9 A full assessment of the reliability of women’s expectation is beyond the scope of our paper. However, a comparison between birth expectations and subsequent behaviour, from recent follow-up surveys carried out in some European countries such as Greece and Italy, has shown high consistency between expected and achieved fertility (Symeonidou 2000, Menniti 2001).
14
rather unlikely to us. The question wordings in the Eurobarometer items on ideal family sizes are similar not only in their dictionary definitions, but also in their connotations. The word “ideal” has very similar connotations in German and English, as well as in the Romance languages.
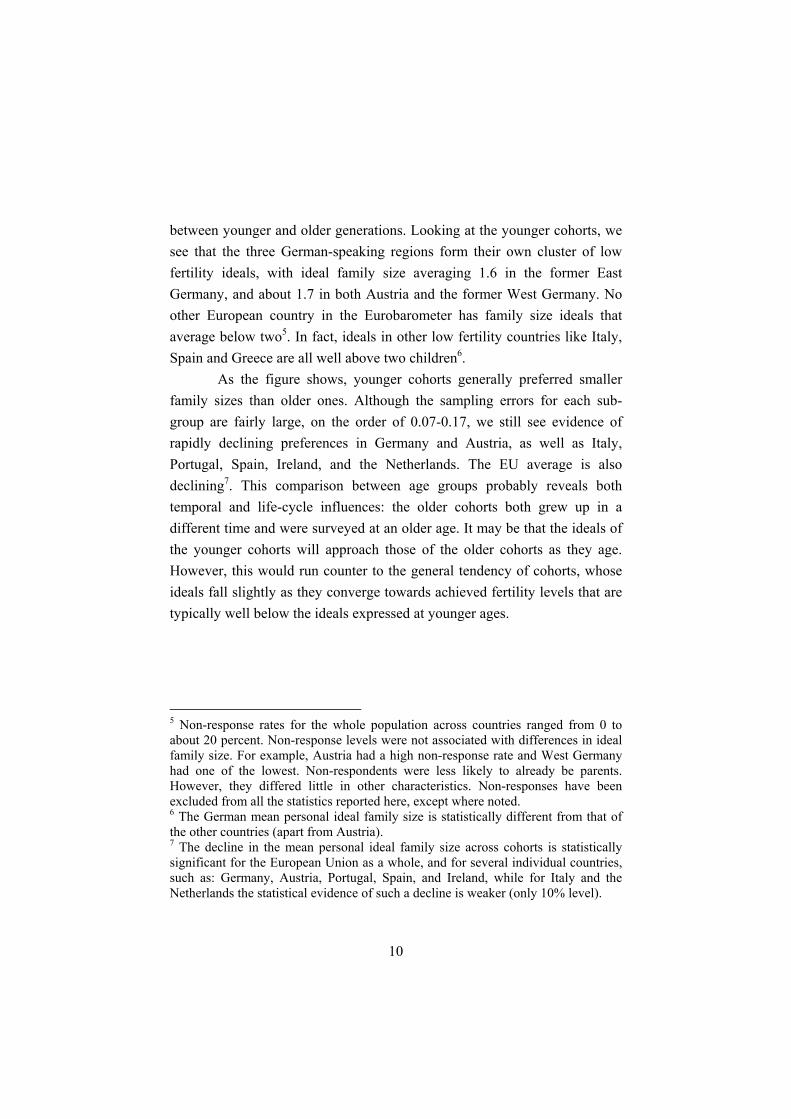
Table 3 Selected Economic and Demographic Indicators for Europeans.
COUNTRIES Unemployment
rates, 2001
Average annual growth
rates 1999-2001
(percentage)
Mean age at 1st Birth
2000
Total Fertility
Rate, 2000
Year in which TFR
fell Total Youth Total Youth <2 <1.5
Austria 3.6 6.0 -3.3 0.6 26.3 1.34 1973 1985 Belgium 6.6 15.3 -7.8 -10.8 26.9 * 1.66 1973 – Denmark 4.3 8.3 -3.5 -5.7 27.5 + 1.77 1973 – Finland 9.1 19.9 -3.6 -2.5 27.4 1.73 1969 – France 8.6 18.7 -6.5 -9.8 28.7 " 1.89 1975 – Germany 7.6 8.4 -3.9 0.8 28.0 " 1.36 1971 1983 W. Germany – – – – 28.0 1.38 1970 1975 E. Germany – – – – 27.6 1.22 1972 1991 Greece 7.9 28.0 -4.1 -3.9 27.3 " 1.29 1983 1989 Ireland 3.8 6.2 -10.7 -9.0 27.8 1.89 1992 – Italy 9.5 27.0 -5.1 -4.4 28.7 ° 1.23 1977 1984 Luxembourg 2.4 6.7 0.0 -0.5 28.4 1.79 1970 – Netherlands 2.4 4.4 -8.3 -13.5 28.6 1.72 1973 – Portugal 4.1 9.2 -3.0 1.9 26.4 1.50 1984 1994 Spain 13.0 20.8 -5.9 -8.8 29.0 " 1.24 1982 1988 Sweden 5.1 11.8 -9.7 -5.6 27.9 1.54 1969 – United Kingdom 5.0 10.5 -5.1 -4.9 29.1 1.65 1974 –
EU-15 7.6 13.9 -5.2 -6.6 27.8 1.53 1975 – Note: When indicated, data refer to (* ) 1993, (+) 1996, (º) 1997 and (") 1999. The TFR was below 1.5 in Denmark and Luxembourg during the mid-1980s. It was exactly 1.5 in Portugal in 2000, higher than 2 in Sweden again in 1989-92, and slightly less than 1.5 in the EU-15 in the second half of the 1990s. The EU-15 mean age at first birth is just the average value of all the EU countries. Source: for Economic Indicators: OECD, 2002; for Demographic Indicators: Council of Europe, 2001, and EUROSTAT 2001, for the EU-15 average.
15

An alternative explanation would be that lower fertility ideals reflect a difference in contemporary socio-economic or demographic conditions. For example, poor economic conditions, especially for the young, may depress family size ideals, making the young more pessimistic about their ability to find a partner and to afford having children. Taking unemployment levels, both for the total work force and for people under age 25, as an indicator of general economic conditions, however, we see that this explanation does not hold for the German-speaking countries. As seen in Table 3, poorer economic conditions do not appear to be depressing fertility ideals. If anything, the association is in the opposite direction: Austria and Germany have low unemployment rates and low ideal family sizes, while in Spain and Greece both unemployment and family size ideals are relatively high.
Table 3 also shows some other factors that could account for differences in family size ideals for the young. Timing of family formation might explain differences in ideals, particularly among the broad age group 20 to 34, which mixes women who may be well into their childbearing years with those who have not yet found a partner and for whom family size ideals remain abstract. Austria and Germany are not unusual in either the mean age at first birth, the median age at first union, or the proportion aged 20 to 30 that are married. It therefore does not appear that lower family sizes are due to Austrian and German respondents being at different stages of their childbearing career than in other countries. Lower expressed ideals might reflect less childbearing in the year the survey was taken. The period fertility rate of Austria and German, however, while low, is not lower than in Italy, Greece, or Spain, all countries with higher ideal family sizes.
To us, the most appealing explanation is that sub-replacement fertility ideals in Austria and Germany have emerged as a natural consequence of a history of low-fertility. Young cohorts in Germany and Austria have witnessed below-replacement fertility for their entire lives, not just the last few years. The influences of a cohort’s experience on their present fertility ideals are probably numerous. Young Austrians and
16

Germans are not only more likely than other Europeans to have grown up in smaller families; they are more and more likely to have had friends, classmates, and cousins in smaller families as well10.
More broadly, it may be that a culture of low fertility has emerged in German-speaking Europe. Changes in achieved family sizes may not persist without eventually inspiring broader cultural changes. TV soaps featuring large families are not a feature of German or Austrian television (except through American imports). By contrast, in Italy there is the hit sitcom “Un Medico in Famiglia”, featuring a doctor living in a three-generation family with his three children. This anecdotal evidence suggests that a more systematic study of media and culture might be productive.
There is other survey evidence that the importance of family and having children has changed substantially with recent cohorts. In Austria, a long time-series of youth surveys has recently shown a significant discontinuity with respect to the importance of having children. While in 1990 50 percent of young men and women aged 16-24 said that it was very important for a couple to have children, the percentage answering in this way had fallen to 27 percent in 2000 (Friesl 2001).
10 Average family size of children is greater than average family size of parents, because children from bigger families are “over-represented” (Preston 1976). It would be interesting to see if the trends in average family size (from the children’s point of view) are consistent with the period fertility rates given here, which give the parents’ point of view.
17
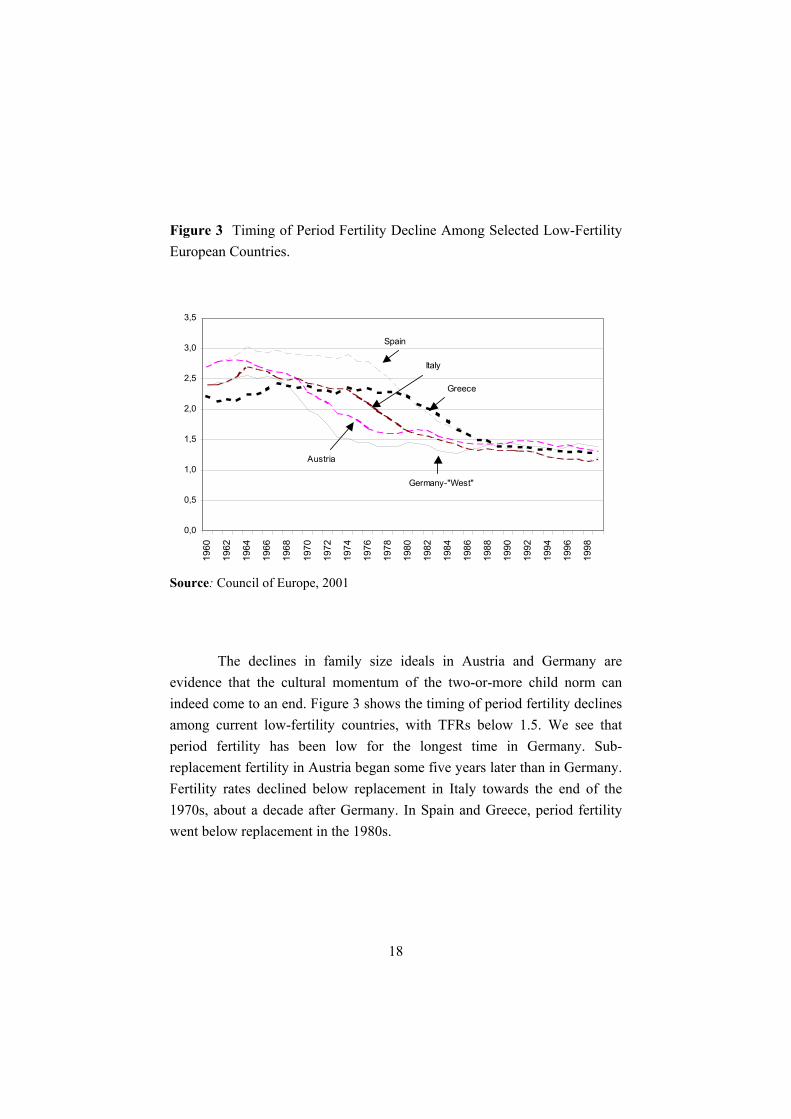
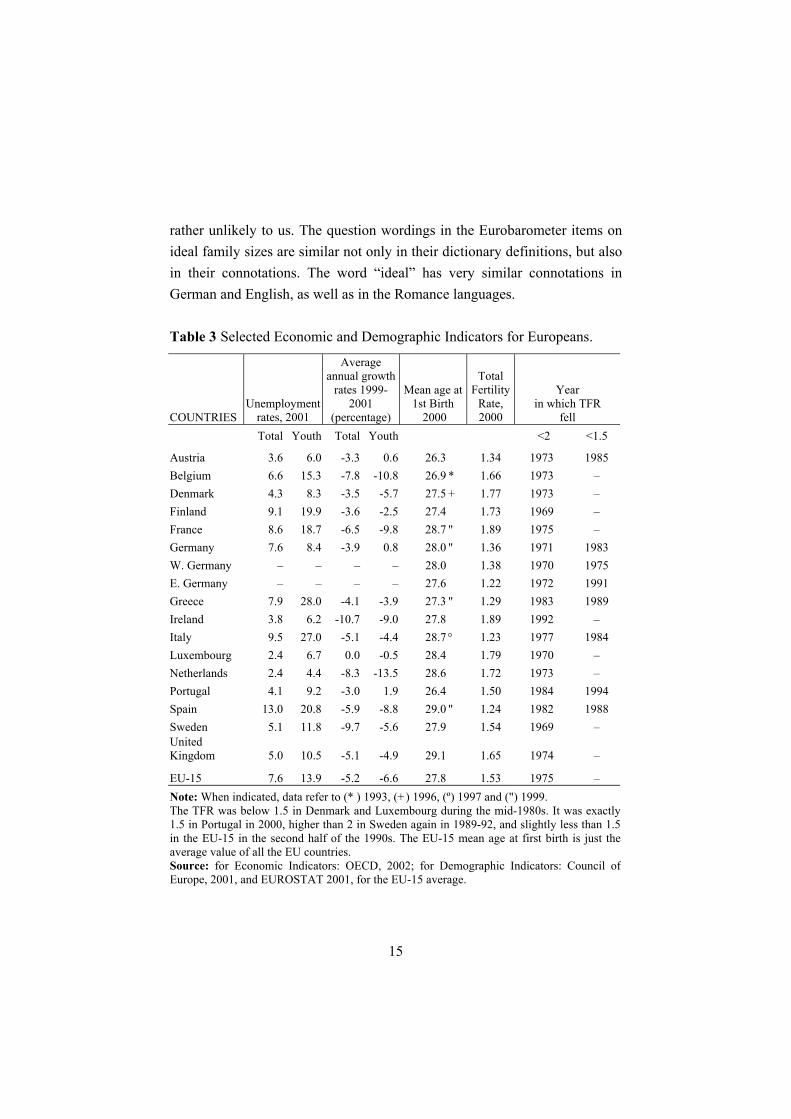
Figure 3 Timing of Period Fertility Decline Among Selected Low-Fertility European Countries.
0,0
0,5
1,0
1,5
2,0
2,5
3,0
3,5
1960
1962
1964
1966
1968
1970
1972
1974
1976
1978
1980
1982
1984
1986
1988
1990
1992
1994
1996
1998
Spain
Greece
Germany-"West"
Italy
Austria
Source: Council of Europe, 2001
The declines in family size ideals in Austria and Germany are evidence that the cultural momentum of the two-or-more child norm can indeed come to an end. Figure 3 shows the timing of period fertility declines among current low-fertility countries, with TFRs below 1.5. We see that period fertility has been low for the longest time in Germany. Sub-replacement fertility in Austria began some five years later than in Germany. Fertility rates declined below replacement in Italy towards the end of the 1970s, about a decade after Germany. In Spain and Greece, period fertility went below replacement in the 1980s.
18

IMPLICATIONS
On average, achieved fertility has always been slightly less than ideal family size in industrial countries. The unexpected obstacles of life, the coordination of couples, career surprises, health difficulties, problems with conception, all combine in a way that populations on average rarely have as many children as their members say they prefer. Does this mean that the achieved fertility of young German-speaking cohorts will also be less than their stated ideals? If so, we should perhaps expect further declines in cohort fertility. On the other hand, it may be that the shortfall does not carry-over into cohorts with sub-replacement ideals, who may be more realistic about their actual family-size prospects.
Another implication of a generational transmission mechanism is that other countries should soon follow the German-speaking countries in their preference for below-replacement families. Venturing a prediction, we expect ideal family size in Italy to drop below replacement in the next decade, and to drop in Spain and Greece in the subsequent decade. We may be wrong. Perhaps in the intervening years there will actually be an increase in achieved fertility. Or, it may be that the Austrian and German experience is not culturally transferable to other countries, particularly to Mediterranean countries with a long history of large-family norms (Reher 1998).
It is worth considering that in an extreme form generational conditioning could cause a downward spiral of fertility. The family size ideals of each generation would be influenced by the fertility regime in which they grew up, but their own fertility would fall short of this ideal, pushing ideal family size of the next generation ever lower. However, it is premature to assert that such a dynamic will actually take place. The TFR has been declining in the European countries for several decades now and we have not yet seen a decline in ideal family size in any countries other than Germany and Austria. Furthermore, even if conditioning has some influence, the period factors, which have played such a strong role in the past (Ní Bhrolcháin 1987), can be expected to continue to play a strong role in
19

the future. Still, the theory does imply that, other things being equal, fertility may continue to decline.
CONCLUSIONS
In the larger debate about below-replacement fertility, childbearing intentions have been largely ignored because they have seemed to be such an unresponsive indicator of changing behaviour. Now, for the first time, we see that fertility ideals really do seem to be changing. Demographers have placed great emphasis on the importance of tempo effects, delayed childbearing, in producing low period fertility rates. The survey results we present here, however, indicate a deeper and more durable societal change, a decline in family size ideals.
What does this imply about future fertility? First of all, it would suggest to us that we should not be surprised if fertility declines further in Germany – or fails to increase, as Bongaarts and others have argued. Expected fertility averages 1.5 children per women among the younger cohorts in Austria and Germany. It would not surprise us if cohort fertility does not surpass these levels. Second, low family size-ideals may create a momentum of their own making it more difficult for pro-natalist policy makers to raise fertility levels in the future. Finally, if the generational lag in fertility preferences is correct, this would imply that we will see falling family size ideals in other low-fertility countries, like Italy and Spain, in the decade or so ahead.
The below-replacement ideals prevalent among young Austrians and Germans may or may not be a sign of the future in low-fertility populations. But it is notable that for the first time people’s stated preferences have deviated from the two-child ideal that has held such sway since the end of the baby boom. It is hard to imagine that this reconceptualization of family life will be without any consequences, just as it is hard to imagine that low fertility can persist indefinitely without being accompanied by a change in ideals.
20

The emergence of below-replacement ideals among Austrians and Germans in the Eurobarometer survey should focus renewed attention on family size ideals. We will want to keep our eyes on the preferences that are revealed in the years to come.
21
References
Ajzen, Icek, and Martin Fishbein. 1980. Understanding attitudes and predicting behaviour, Englewood Cliffs, Prentice and Hall.
Bongaarts, John. 1998. Fertility and reproductive preferences in Post-transitional societies, Population Council, Policy Research Division, Working Paper, No. 114.
Bongaarts, John. 2001. Fertility and reproductive preferences in post-transitional societies, Global fertility transition, Supplement to Population and Development Review, Vol.27, pp.260-281.
Billari, Francesco C., and Chris Wilson. 2001. Convergence toward diversity? Cohort dynamics in the transition to adulthood in contemporary Western Europe, Max Planck Institute for Demographic Research, Working Paper, 39.
Bulatao, Rodolfo A., and Ronald D. Lee 1983. Determinants of fertility in developing countries, Vol.1, London, Academic Press.
Chesnais, Jean-Claude. 1996. Fertility, family and social policy, Population and Development Review, Vol.22, No. 4, pp.729-739.
Chesnais, Jean-Claude. 2000. Determinants of below replacement fertility, in: Below replacement fertility, Population Bulletin of the United Nations, Special Issue 1999, No. 40/41, pp.126-136.
Coleman, David. 1996. New patterns and trends in European Fertility: international and sub-national comparisons. David Coleman (ed.). Europe’s Population in the 1990s, Oxford, Oxford University Press.
Council of Europe. 2001. Recent demographic development in Europe, Strasbourg, Council of Europe Publishing.
European Commission. 1979. The Europeans and their children, Eurobarometer 11, organised and supervised by DG Press and Communication, Brussels.
22

European Commission. 1990. Family and the desire for children, Eurobarometer 32, organised and supervised by DG Press and Communication, Brussels.
EUROSTAT. 2001. Europäische Sozialstatistik Bevölkerung, Luxembourg, European Communities.
Freedman, Ronald, Deborah S. Freedman, and Arland Thornton. 1980. Changes in fertility expectations and preferences between 1962 and 1977: their relation to final parity, Demography, Vol.17, No. 1, pp.1-11.
Frejka, Tomas, and John Ross. 2001. Paths to sub-replacement fertility: the empirical evidence, Global fertility transition, Supplement to Population and Development Review, Vol.27, pp.213-254.
Friesl, Christian. 2001. Experiment Jung-Sein. Die Wertewelt Österreichischer Jugendlicher, Vienna, Czernin Verlag.
Gauthier, Anne H. 2001. The impact of public policies on families and demographic behaviour, paper presented at the ESF/EURESCO Conference on The Second Demographic Transition in Europe, Bad Herrenhalb, Germany, June 23-28 (available at http://www.demogr.mpg.de/Papers/workshops).
Hendershot, Gerry E., and Paul J. Placek 1981. Predicting fertility, Lexington, MA: Lexington Books.
Inglehart, Ronald. 1990. Culture shift in advanced industrial society, Princeton, Princeton University Press.
Kohler, Hans-Peter. 2001. Fertility and social interaction: an economic perspective, New York, Oxford University Press.
Lee, Ronald. 1980. Aiming at moving target: period fertility and changing reproductive goals, Population Studies, 34, pp.205-226.
23
Lesthaeghe, Ron, and Johan Surkyn. 1988. Cultural dynamics and economic theories of fertility change, Population and Development Review, Vol. 14, No. 1, pp.1-45.
Livi Bacci, Massimo. 2001. Comment: Desired Family size and the future course of fertility, Global fertility transition, Supplement to Population and Development Review, Vol.27, pp.282-289.
Livi Bacci, Massimo, and Gustavo De Santis. 2001. Reflections on the economics of the fertility decline in Europe, Paper presented at the ESF/EURESCO Conference on The Second Demographic Transition in Europe, Bad Herrenhalb, Germany, June 23-28.
Menniti, Adele. 2001. Fertility intentions and subsequent behaviour: first results of a panel study, paper presented to the EAPS, European Population Conference, Helsinki, June 7-9.
Miller, Warren B., and David J. Pasta. 1995. How does childbearing affect fertility motivations and desires? Social Biology, Vol.42, No. 3-4, pp.185-198.
Monnier, Alain. 1987. Projects de fécondité et fécondité effective. Une enquête longitudinale: 1974, 1976, 1979, Population, No. 6, pp.819-842.
Morgan, Philip S. 1982. Parity-specific fertility intentions and uncertainty: the United States, 1970 to 1976, Demography, Vol.19, No. 3, pp.215-334.
Nambodiri, Krishnan. 1983. Sequential fertility decision making and the life course. Rodolfo A. Bulatao, and Ronald D. Lee (eds.). Determinants of fertility in developing countries, Vol.2, New York, Academic Press.
National Research Council. 2001. Diffusion Processes and fertility transition: selected perspectives, Committee on Population. John B.
24

Casterline, (ed.). Division of Behavioural and Social Sciences and Education. Washington, DC, National Academy Press.
Ní Bhrolcháin, Márie. 1987. Period parity progression ratios and birth intervals in England and Wales, 1941-1971: a synthetic life table analysis, Population Studies, Vol.41, No. 1, pp.103-125.
OECD 2002. Labour force statistics, 1981-2001, Paris.
Preston, Samuel H. 1976. Family size of children, family size of women, Demography, Vol.31, pp.105-114.
Pritchett, Lant H. 1994. Desired fertility and the impact of population policies, Population and Development Review, Vol.20, No. 1, pp.1-55.
Reher, David Sven. 1998. Family ties in Western Europe: persistent contrasts, Population and Development Review, Vol.24, No. 2, pp.203-234.
Rindfuss, Ronald R., Philip S. Morgan, and Gray Swicegood. 1988. First births in America: changes in the timing of parenthood, Berkeley and Los Angeles, University of California Press.
Ryder, Norman B. 1981. Changes in parity orientation from 1970 to 1975. Hendershot, Gerry E., and Paul J. Placek. Predicting fertility, Lexington, MA: Lexington Books.
Schoen, Robert, Young. J. Kim, Constance A. Nathanson, Jason Fields, and Nan Marie Astone. 1997. Why do Americans want children? Population and Development Review, Vol.23, No. 2, pp.333-358.
Schoen, Robert, Nan Marie Astone, Young J. Kim, and Constance A. Nathanson. 1999. Do fertility intentions affect fertility behavior? Journal of Marriage and the Family, Vol.61, No. 3, pp.790- 799.
Schoenmaeckers, Ronald C., and Edith Lodewijckx. 1999. Demographic behaviour in Europe: some results from FFS country reports and
25

suggestions fro further research, European Journal of Population, Vol.15, pp.207-240.
Symeonidou, Haris. 2000. Expected and Actual Family Size in Greece: 1983-1997, European Journal of Population, Vol. 16, No. 4, pp.335-352.
Toulemon, Laurent. 2001. Why fertility is not so low in France, paper presented at the IUSSP – International Union for Scientific Study of Population - Seminar on International perspectives on Low fertility: trends, theories and policies, Tokyo, March 21-23.
United Nations. 1999. Dictionary of demographic and reproductive health terminology, POPIN, Population Information Network (available at: http://www.popin.org).
Van de Giessen, Hans. 1992. Using birth expectations information in national population forecasts. Nico Keilman, and Harri Cruijsen, (eds.). National population forecasting in industrialized countries, NIDI and CBGS publications.
Van de Kaa, Dirk J. 2001. Postmodern fertility preferences: from changing value orientation to new behaviour, Global fertility transition, Supplement to Population and Development Review, Vol.27, pp.290-331.
Van Hoorn, Wim, and Nico Keilman. 1997. Births expectations and their use in fertility forecasting, EUROSTAT Working Paper.
Westoff, Charles F., and Norman B. Ryder. 1977. The predictive validity of reproductive intentions, Demography, Vol.14, pp.431-453.
Westoff, Charles F. 1981. The validity of birth intentions: evidence from U.S. longitudinal studies. Gerry E. Hendershot, and Paul J. Placek. Predicting fertility, Lexington, MA: Lexington Books, pp.51-74.
26

Yamaguchi, Kazuo, and Linda R. Ferguson. 1985. The stopping and spacing of childbirths and their birth-history predictors: rational-choice theory and event-history analysis, American Sociological Review, Vol.60, No. 2, pp.272-298.
27