the electrocardiogram in … electrocardiogram in cardiovascular epidemiology: problems in...
TRANSCRIPT

T H E ELECTROCARDIOGRAM IN CARDIOVASCULAR EPIDEMIOLOGY: PROBLEMS IN STANDARDIZED
APPLICATIONS
Henry Blackburn Laboratory of Physiological Hygiene
U n iuersity of Minnesota
The electrocardiogram (ECG) is employed in cardiovascular population studies because a ) an objective record is obtained of a bio-electrical signal characteristic of the individual, b) it is of proven, if limited, value in diagnosis of certain specific and many non-specific anatomic and functional derange- ments of the heart muscle, c) its crude but significant predictive value is es- tablished for risk of future cardiac events and mortality, d ) the information contained in the ECG is of a different nature from, and largely independent of that obtained by the medical history and physical examination, e) and the total yield of events relevant to the study of heart disease is increased by ECG recording.
These characteristics of the ECG suggest a particular suitability for appli- cation to cardiovascular epidemiology. In fact, however, conventional applica- tion of the ECG is in a quite primitive state. Problems basic to ECG theory as well as practical difficulties in instrumentation and method seriously limit its exploitation as an epidemiological study tool. Direct confrontation of these problems is required with attention both to broad concept and to fine detail.
INSTRUMENTATION
Direct paper-writing, amplifier-type electrocardiographs, internationally used, have differing fidelity of response, stability, speed and characteristics of writing which affect measurements and interpretation.' Minimum specifi- cations for frequency response' ' are often not met by apparatus in use.'' These minimum standards are themselves not always adequate for faithful reproduction of the ECG in lower frequencies which contain known diag- nostic information (i.e. the S-T segment and T wave).' Frequencies exist above those obtained with these apparatus, but the amount and diagnostic significance of the information contained is uncertain."
In multichannel apparatus which employ a common central terminal, little consideration has been made for accommodating high impedance sources a t the skin- electrode contact, with attendant possibilities for noise, attenuation, and distortion.'.' Other instrumentation problems exist, and provision is
$The material reported here was obtained with the support of grants from the U.S. Public Health Service (HE 03088, HE 04697, HE 04997), from the American Heart Asso- ciation and the Minnesota Heart Association, and from the U.S. Public Health Service to the U. of Minnesota Medical School (HE 06314).
882

Blackburn: ECG in Epidemiology 883
made in no type of recorder for simple built-in testing routines capable of operation by a technician.
In the dawning modern era of biomedical recording on magnetic tape, ac- quisition of good and faithful ECGs still presents many problems. Instruments and procedures in this field are inadequate and non-standard. Considerations preliminary to acquisition of ECG data on magnetic tape have been provided in outline by the Research Committee of the International Society of Cardiology.'$
The American Heart Association and the International Society of Cardi- ology have recognized the importance of good records both to clinical and epi- demiologic practice and are now preparing recommendations intended to improve the quality of the machines and methods for their testing and to bring reason and standards into the field of instrumentation and procedure.
In the interim, a few constructive suggestions are possible concerning apparatus available for epidemiological use, though no instrument is satisfac- tory in all respects: 1) multichannel research-type direct-writer instruments contain higher grade components than the single channel machine produced for a mass market, and provide greater efficiency, fidelity, and stability, in recording. 2) Their frequency response, stability, behavior when overloaded, paper speed, and ruggedness in operation should be tested, independently of the supplier, as a routine prior to field use, with special attention given to frequency response a t the lower end. 3) Collaborative studies seeking fullest opportunity for data comparison should employ the same model instrument. 4) Simultaneity of channels is required for orthogonal lead records. 5 ) The possibilities and difficulties of faithful recording of ECG's on magnetic tape
.
$(1) Competent engineering aid is required to set up and operate biomedical tape systems. (2) Control units for tape recorders must be designed in collaboration with those who will process the data. (3) Instrumentation in this field is still in development, no apparatus is entirely satisfactory, and many have serious limitations. (4) Specifications by suppliers, especially regarding noise level, are expressed variously and may be misin- terpreted, while important characteristics may be omitted from descriptions. Satisfactory performance for the needs of the investigator, in testing after delivery, should be pre- requisite to purchase. ( 5 ) All apparatus available give problems with noise, and methods for their solution involve sacrifices in data and may be costly. (6) All biomedical tape recorders available have satisfactory frequency response characteristics, a t different costs, for electrocardiographic work, and most allow analysis of high frequency ECG compo- nents. (7) Time required for the machine to get up to operating speed must be considered in the light of the data processing method used and tape costs. (8) IRIG standard tape head configuration is a great practical advantage to collaborative collection- analysis programs. (9) Density of data recording a t different sensitivities relates to the research needs and tape cost. (10) Preamplifiers designed for operation with specific tape units are unavailable a t this time. (11) Input-output range of the recorder is im- portant in regard to the type of data involved, as is behavior of the instrument when loads are imposed which exceed its operating range. (12) Input-output impedance, unity gain calibration, and an external calibration source are important concerns. (13) The number of channels, the ability to expand the system, and loss of data channels for noise compensation should be considered. (14) Magnetic tape of quality adequate for programs of automated computer recognition should be used.

884 Annals New York Academy of Sciences
and their subsequent classification should be explored by those commencing large population studies.
TECHNIQUE
Extraordinary demands on ECG technique are imposed by epidemiological application because of the necessity to record accurately and efficiently in large groups under restrictions of time and access to the subjects and to process masses of data. The most important characteristic of a technically good elec- trocardiogram, beyond that of fidelity, is freedom from baseline fluctuation and electrical “noise.” Routine and newer procedures for reducing noise are provided in the appendix to this article and elsewhere’ bu t the most impor- tan t single factor is preparation of the skin-electrode contact which need be standard only to the extent of being effective in reducing skin electrical impedance.
Recording Conditions
Some conditions of recording which affect the ECG are not susceptible of standardization in population studies. For example, meal effect on the S-T and T amplitude may be important and may be non-random, according to the total amount of coronary disease in a population.”’ However it should be feasible in most surveys to minimize the acute effects of cold, smoking and heavy physical activity on heart rate and S-T and T wave amplitude by appropriate arrangement of the examination schedule and situation.
ECG recording supine is standard practice in dealing with sick patients, and ECG “normal standards” are hased largely on supine records. This pos- ture creates problems, to be discussed, in accurate siting of electrode positions and for the rationale in using orthogonal ECG leads and performing exercise ECG tests. However, complete information is required before there can be consideration of standard positions other than supine. Clearly, repetitions should be made in identical postures.
The Record Itself
At least three technically good complexes per lead, both a t 25 and 50 mm. per second paper speed, are suggested for the resting ECG, and longer strips are obtained if the baseline is not stable or an arrhythmia is present. Duplicate records are desirable; a 1 mv. calibration should appear on each complete trac- ing, and serial number, study number, name and date are recorded on each. Measuring or reading time is reduced more than half by convenient mounting on stationery size cardboard (21.5 x 28 cm.), and pressure sensitive papers should be covered with cellophane. Records are best filed numerically and separately from other survey data.
Blackburn: ECG in Epidemiology 885
Electrode Positions
All lead systems are sensitive to non-standard placement of chest elec- trodes, a source of inter-individual variation and of variation within subjects undergoing repeat procedures. The most common errors of placement in the “conventional” chest leads V1 - Vs are a ) spacing between V1 and V2, usually too wide, b) misjudging the vertical references for V4.~.6 often due to applying electrodes in the supine position, and c) placing Vs and V6 along the 5th inter- costal space rather than in the horizontal plane of V,. Special chest calipers, protractors, and templates are available to reduce variation in electrode placement.ll.’’.l~’
LEAD SYSTEMS
The widely used 12 lead “conventional” recording a t rest ( I , 11, 111, aVR, aVL, aVF, V,,2.:f,4.3,6) is now regarded as a minimum standard for epidemiologi- cal use.”.’4 This fact presents as many problems as i t solves. The conven- tion is not accepted in a few countries, the number of leads is inconvenient, and the information contained in them is redundant and internally inconsist- ent. However, details concerning redundancy and wider evaluation of systems based on fewer leads are needed before the conventional one can be replaced. Improvement of the diagnostic power of the 12 lead arrangement obtains, even when conventionally recorded without benefit of phase relationships or high fidelity, if precise measurements are possible.I5
The potential of systems with 3 orthogonal leads based on theoretical models has been effectively demonstrated, including the possibility of reduced variability and sharpening of discriminative power.I6 Their relevance to the problem of standard application in epidemiology is obvious, and adequate validation is awaited. The crucial pragmatic confrontation has not occurred between the results of accurate computer-assisted measurements and analysis of data from the same populations recorded both with conventional and or- thogonal systems. Such studies are underway.
Standardization of orthogonal lead systems based on the equivalent dipole concept, is, for cardiovascular epidemiology, based on practical considera- tions. These systems, all imperfect, are not amenable to quantitative trans- formation into t,erms of each other, and their comparability in discrimination or classification in group studies is uncertain. One system is in widest use due primarily to its simple configuration of the smallest number of electrodes.”
MEASUREMENT
Human measurement of even limited numbers of amplitudes and durations in scalar ECG tracings is quite impractical for epidemiological purposes. Me- chanical attempts to digitize such records have not shown promise of accuracy

886 Annals New York Academy of Sciences
or efficiency. The only possibility for a standard base of precise, reproducible, efficacious measurement, and optimal use of detailed information in the con- tinuous distributions of ECG values, lies in the computer methods described elsewhere in this symposium. When reliable measurements are obtained, ade- quate techniques are available to handle the numbers. ECG application to epidemiology would then need be concerned only with validation of the crite- ria for classification.
PATTERN RECOGNITION
Problems encountered in systematic study of human recognition and measurement of ECG waves are relevant both to current clinical ECG reading practice and to programming of computers for these purposes. Consider a few examples in definition, measurement and classification of diagnostic informa- tion in the ECG:
Q and QS Waves
The scalar and non-simultaneous time-based display of ECG potential changes was early accorded arbitrary labels in which the initial vectors in one lead were called a Q wave if the deflection was negative, whereas simultaneous forces in another lead, opposite in direction, were called an R wave. In the standard arrangements of leads I , 11, and 111, empirical observations led to an association of wide and deep Q waves in lead I with “anterior” infarction and in lead 111 with “posterior” infarction of the myocardium. Definition of Q, R, and S waves of the scalar display are the basis for conventional criteria of ECG diagnosis of myocardial infarction. The deflections, of course, are functions of the frequency response and paper speed of the recording system and their measurement is greatly affected by artefacts of the system. A sharp deflection is rendered a gradual one by the simple expedient of increasing the paper speed above the common 25 mm./sec., or by modifying the frequency response. FIGURE l a indicates “ideal” measurement of a Q wave. Definition of these waves is arbitrary and empirical because the ECG baseline contains “noise” and is not a straight line. FIGURE l b shows the logical bu t impractical alterna- tive for measuring Q duration in writing systems in which the width of the trace baseline is important, here determined by the velocity of the deflection. The wide baseline may contain electrical “noise,” but here it is wide for no other reason than custom (a wide hot stylus was early employed to mimic the wide baselines obtained with photographic records of the string galvanome- ter). The common practical manner of measuring Q duration in conventional records is seen in FIGURE lc.
Minimum criteria are not established for the “simple” decision about presence or absence of a wave. Absence of a small initial R wave in chest leads V2 to Vq is associated with great probability of infarction of the heart. How high, how persistent, and a t what slope must an initial deflection be to be

Blackburn: ECG in Epidemiology 887
FIGURE la,b,c Problem of Q wave duration measurement.
FIGURE ld,e Problem of presence or absence of an R wave
FIGURE lf,j Problems of S-T junction definition and measurement of segment depression.
called an R wave? This sort of problem, illustrated in FIGURES Id and e, is responsible for much observer variation. Beat-to-beat variation in the total presence or absence of a wave is unaccounted for in human or machine diag- nostic criteria.
S-T J Recognition
The termination of QRS is another source of measurement error as the return to “resting state” is more gradual than depolarization and may actually

888 Annals New York Academy of Sciences
overlap with rising potential differences of repolarization of the heart muscle. The junction (J point) between QRS and the S-T (or R-T) segment lies along a gradual slope (FIGURE If). Since ischemic muscle repolarizes early, there is diagnostic information in this area of the trace but it is difficult to measure quantitatively. Examples of uncertainties in S-T segment and J point recogni- tion are seen in FIGURES If, g , h, i, and j . FIGURE If is a common difficulty. Clearly all portions of the S-T are depressed below the P-R baseline, but the curvature of the segment nowhere allows consistent recognition of a junction by the human operator. FIGURE l g appears to be a downward “sagging” S-T, but classification based on slope depends on where the J point is selected, whether a t the sharp break near the base of the descending limb of R , or a t a less distinct point. .08 sec. later. I n FIGURE l h the S-T-T has a distinctly “ischemic” appearance, but the two slopes, one positive, one negative, present problems in classification and in measurement of the appropriate negative dis- placement. FIGURE l i illustrates at least four alternatives for location of the J point depending on definition of the end of QRS. FIGURE l j is a particularly perplexing problem as this type of S-T segment is more often associated with “normal” than “abnormal” subjects, and correct measurement and classifica- tion require more precise definition of the end of QRS and of the contour
Most of these problems may be reduced by clear procedural rules for the coder, but the detail required for successful standard application, for this and any clinical technique, is quite imposing.
of S-T.
CLASSIFICATION
Abundant evidence exists that agreement between clinical interpretations of the ECG for the frequency of “coronary heart disease,” or for presence or absence of ECG “abnormality,” is low, seriously limiting the clinical method for epidemiological application.18 L4 The human interpretive process com- bines ECG forms and values in an unpredictable way so that comparisons, the essence of epidemiology, are frustrated. Recognition of these facts led to de- velopment of a system for classification of the conventional scalar ECG which aimed to state simply what is found in the record, concerning findings believed to be relevant to the epidemiology of heart disease.’;’ There is good general agreement about what items in the ECG to look for, but no previous attempt made to define them precisely.
THE MINNESOTA CODE
The attempt was made to codify departures of various types and degrees from ECG values determined from distributions in normal and abnormal subjects.” The classes are based on clearly defined cut-off points which are the basis of commonly employed diagnostic criteria and provide a

Blackburn: ECG in Epidemiology
I1
2 N
Li al
0, In 2 3
8 0
T
889
13 13
10 4 14
7 3 10
1 2 1636 1639
13 11 9 1643 1676
reference frame applicable to the usual technique of the cardiographic reader. Actual coding of individual ECG items, requires, however, no diagnostic interpretation.
Other requisites of a useful classification scheme were partically met in the homogeneous groupings of items, a coding procedure giving mutually ex- clusive subclasses, and by extensive testing for reliability and yield of reason- able distributions in well-defined and in unknown populations.
The system has many weaknesses above those inherent in the redundancy and distortion and poor validation of conventional electrocardiography itself. The nature of such a clinical reading process necessitates loss of much informa- tion contained in detailed distributions of ECG values. Graphic illustrations were not provided of coding points and problem areas. Though the criteria are reasonable and generally accepted, coding rules and procedures are apparently inadequate for dealing with situations not clearly black or white, i.e. values around a cut-off level or tracings with beat-to-beat variation. As an individual may have several codable ECG findings, it is cumbersome to identify and tally numbers of persons; the axis of classification is around ECG items. Finally, an important degree of human observer variation persists even in such an “objective” attempt to characterize the “abnormal ECG,” and even among trained coders.Ys ’’
T A B L E 1
BY MINNESOTA CODE A M O N ( ; 1676 M E N AGES 40-60 BY T W O EXPEKIENCEI) R E A I ) E R S I N ORE LAHOKATOHI:
WITH E S C E L I . E N T Q[’AI,ITY RECORDS
INTER-OREHSVER A G R E E M E X T o s Q W A V E COI)IW;
Observer 1
11 2 3 0 T
890
15
4 14 1
11
1 12 8
20 26 20
Annals New Y ork Academy of Sciences
1
8
4
2079
2092
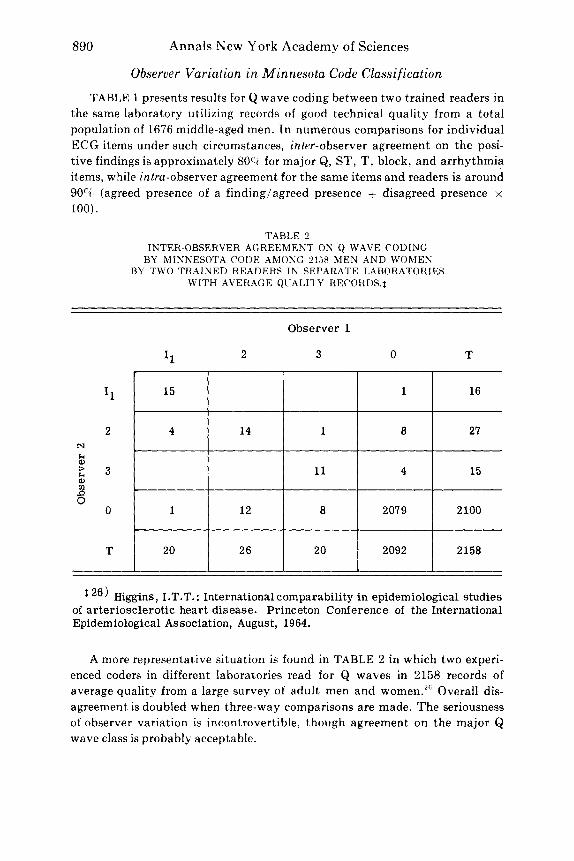
Observer Variation in Minnesota Code Classification
TABLE 1 presents results for Q wave coding between two trained readers in the same laboratory utilizing records of good technical quality from a total population of 1676 middle-aged men. In numerous comparisons for individual ECG items under such circumstances, inter-observer agreement on the posi- tive findings is approximately 80% for major Q, ST, T, block, and arrhythmia items, while intru-observer agreement for the same items and readers is around 90(71 (agreed presence of a finding/agreed presence + disagreed presence x 100).
TABLE 2 INTER-OBSERVER AGREEMENT ON Q WAVE C O D I N G
BY MINNESOTA CODE AMONG 21.58 MEN AND WOMEN BY T W O TRAINED READERS IN SEPAHATE LABORATORIES
WITH AVERAGE QUALITY REC0RDS.t
N
I.r a, + a, $ 0
I1
2
3
0
T
Observer 1
I1 2 3 0 T
16
27
15
2 100
2158
26) Higgins, I.T.T.: International comparability in epidemiological studies of arteriosclerotic heart disease. Princeton Conference of the International Epidemiological Association, August, 19 64.
A more representative situation is found in TABLE 2 in which two experi- enced coders in different laboratories read for Q waves in 2158 records of average quality from a large survey of adult men and women.2fi Overall dis- agreement is doubled when three-way comparisons are made. The seriousness of observer variation is incontrovertible, though agreement on the major Q wave class is probably acceptable.

Blackburn: ECG in Epidemiology
Q waves
891
S-T depression Negative T waves
TABLE 3 INTER-OBSERVER VARIATION IN ECG CODING BY MINNESOTA CODE
AMONG TRAINED PHYSICIAN, TRAINED CLERK, AND UNTRAINED CARDIOLOGIST GROUPS OF 3 OBSERVERS
WITH ORDINARY QLlALITY RECORDS.$
Clerk Coders
Cardiologists
60 15 0
94 24 63 1
MD Coders I 74 47 25
TABLE 3 is a study of intra-group variation among trained physician readers, trained non-medical clerks, and untrained readers who are expert cardiologists, in a test series of ECG photocopies of average technical quality sent out by W. H. 0.27 A crude statistic is derived from the number of dis- agreements divided by the total of agreements and disagreements among the groups, according to the ECG item considered. Interesting findings of this detailed study are that training affects the consistency of coding practice and that trained female clerks with no knowledge of electrocardiography are more reliable readers in the sense of being reproducible than physicians who, i t seems, know too much about the ECG to be reliable.
The phenomenon of like results, despite observer variation in classification of individuals, is illustrated in TABLE 4, in which independently assigned prevalence rates are given for individual ECG items in a large population, under the same conditions as those of TABLE 1. The generally similar frequen- cies obtained lead some to consider the classification system a useful epi- demiological tool.
Application of the Minnesota Code continues, in the absence of better pro- cedures, in many epidemiological study programs. Work is in progress, under auspices of W.H.O., the University Group Diabetes Program, the London School of Tropical Medicine and Hygiene, and others, t o identify and correct for sources of observer variation in ECG coding with the system and to estab- lish training and testing methods.
W.H.O. training and test records are now available from the Cardiovascu- lar Section, W.H.O., Palais des Nations, Geneva along with detailed coding

892 Annals New York Academy of Sciences
TABI,E 4 INDEPENDENTLY ASSIGNED PREVALENCE RATES ( P E R 1000 MEN1
FOR ECG ITEMS I N A TOTAL POPCTLATION OF 1676 MEN. AGES 40.61) YEARS BY T&’O TRAINED HEADERS
ECG Item
Large deep Q waves
Smaller Q waves
Left axis deviation 5 - 30”
High R waves (left)
S-T depression (rest)
Negative T waves
Prolonged P-R interval
Ventricular blocks
Significant arrhythmia
S-T depression (post-exercise)
Minnesota Code
I1
I1 1
273 I
I11
“1-4
5 - 2
v13
v111,2 ,4
v1112-6
x1-4
Observer
7 .2
11.3
40.6
128.9
38.8
24.5
22.1
10.7
8.4
40.6
7.2
14.3
38.2
142.6
31.6
23.3
26.3
10.1
5.4
40.0
procedures with illustrations, and suggestions for systematic continuous quality control among collaborating centers attempting to compare data. Absence of a calibrated standard for ECG and other clinical methods against which readers can be tested is unfortunate. A simple test-retest situation re- veals only trends or systematic variations in classification. An attempt is in progress to provide an approximation to a standard with records of goad quality in which reliable and precise wave measurements have been made by computer.
Application of the code has facilitated comparisons of rates of ECG ab- and pointed up some areas worthy of special attention
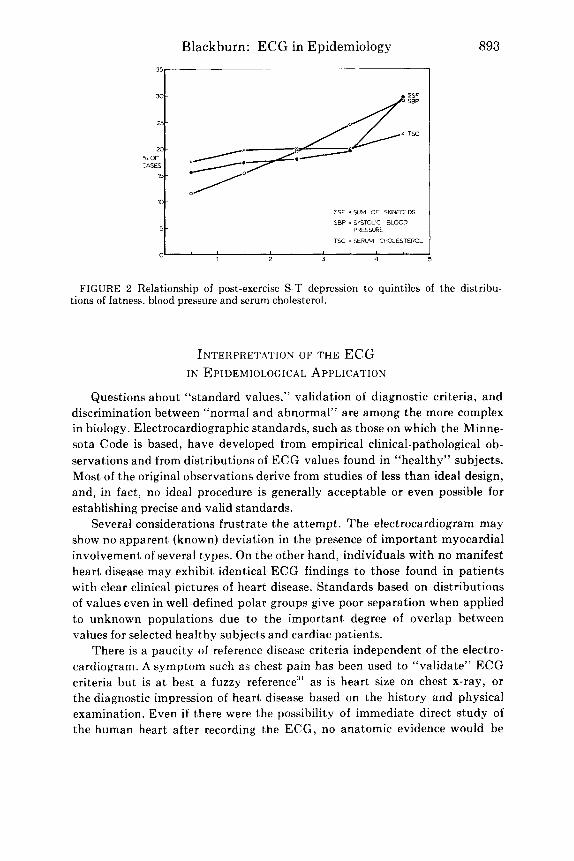
as a result of “unexpected” findings. “Revalidation” of the criteria employed has been, in a sense, obtained by establishing their individual predictive power for future cardiac events and mortality in the Framingham study material.’g Study of the inter-relations between ECG phenomena and other physical characteristics as seen in FIGURE 2 is rendered less cumbersome by such a classification scheme.””
normalities, I ~ l , 2 ~ ~ 1 , ? 8 , 2 ! 4
Blackburn: ECG in Epidemiology
m-
5 -
I S F = SUM O F SKINFOLDS
SBP i SYSTOLIC BLOOD PRESSURE
TSC i SERUM CHOLESTEROL
893
FIGURE 2 Relationship of post-exercise S-T depression to quintiles of t,he distribu- tions of fatness, blood pressure and serum cholesterol.
INTERPRETATION OF THE ECG IN EPIDEMIOLOGICAL APPLICATION
Questions about “standard values,” validation of diagnostic criteria, and discrimination between “normal and abnormal” are among the more complex in biology. Electrocardiographic standards, such as those on which the Minne- sota Code is based, have developed from empirical clinical-pathological ob- servations and from distributions of ECG values found in “healthy” subjects. Most of the original observations derive from studies of less than ideal design, and, in fact, no ideal procedure is generally acceptable or even possible for establishing precise and valid standards.
Several considerations frustrate the attempt. The electrocardiogram may show no apparent (known) deviation in the presence of important myocardial involvement of several types. On the other hand, individuals with no manifest heart disease may exhibit identical ECG findings to those found in patients with clear clinical pictures of heart disease. Standards based on distributions of values even in well-defined polar groups give poor separation when applied to unknown populations due to the important degree of overlap between values for selected healthy subjects and cardiac patients.
There is a paucity of reference disease criteria independent of the electro- cardiogram. A symptom such as chest pain has been used to “validate” ECG criteria but is a t best a fuzzy reference” as is heart size on chest x-ray, or the diagnostic impression of heart disease based on the history and physical examination. Even if there were the possibility of immediate direct study of the human heart after recording the ECG, no anatomic evidence would be

894 Annals New York Academy of Sciences
found for the majority of ECG anomalies which relate to myocardial function-including arrhythmias, conduction defects and negative S-T and T waves. Dead, injured, scarred and hypertrophied muscle, to a lesser extent coronary arterial occlusive lesions, are the only anatomic end points, and their classifications, in turn, are far from being reliable or quantitative. The distribution of ECG values found in well-described clinical heart disease classes is being established with large pathological studies using better, more standard methods, and there is some promise of useful independent references from cardiac catheterization and angiography in studies among living subjects.
Prospective epidemiological studies allow validation in both directions, i.e. assessing the predictive value of known ECG items for subsequent cardiac events and mortality, and also, looking backward after the event for clues in the characteristics of the earlier record. Newer computer-assisted techniques such as those reported in this meeting are finding diagnostic relationships in parts of the ECG complex not previously used in diagnosis. Auto- and cross- correlation studies are strengthening the power of electro~ardiography.~~~~‘ 3 3
Most reliance in ECG differentiation of “normal and abnormal” is now placed on ranges of values found in small, healthy, usually younger, groups. Some contribution to understanding of these problems with improvement in available standard values has been made by Simonson, with others from this l a b ~ r a t o r y . ~ ~ J6 Despite questionable assumptions and theses, an approach was obtained to useful standard values by starting 1) with records from large groups of working people-large enough to be “reasonably represent- ative” and to allow subsamples of sufficient size for statistical treatment- then 2) eliminating by methods independent of the ECG those physical condi- tions known to affect the ECG, and f i n d y , 3) excluding rare “healthy” subjects with clear though “silent” patterns of ECG abnormality.
The ECG distributions obtained are often ~ k e w e d . ” ~ Skewness to the right is characteristic of many biological distribution curves. This does not necessarity mean tha t separate populations exist in the group but rather that there are more rigid biological restraints a t one end of the distribution than a t the other. However, the skewness in ECG distributions prevents effective use of measures of central tendency as standards. Simonson’s approach has been to employ the 2.5 and 97.5%. range limits, rather than standard deviations, found in clincially “healthy” subjects, after brute force treatment of stray values. By definition, the extremes among the healthy subjects are abnormal. The greater probability of future disease among those a t the extremes of the “normal” ECG distribution is borne out in follow-up study of minor non- specific Q, ST, and T findings.” ”
But such standards applied for individual ECG items can result in unten- able classifications in populations, since there is a strong chance tha t a healthy subject will have a t least one ECG item, out of many dozens for which standards exist, exceeding the “normal” 95‘% limits. For example, in a recent national experiment, “healthy” subjects were excluded from participation

Blackburn: ECG in Epidemiology 895
on the basis of “abnormal” right or left axis deviation of a degree representing approximately the upper 2.5% limits in existing “standard values.” Of course, it was found that approximately 5% of the apparently healthy men had to be eliminated at the outset since these two ECG items are completely indepen- dent. When similar upper limits are used for eight major classes of ECG find- ing, (including Q waves, axis, amplitudes, block patterns, S-T and T depression, conduction defects and arrhythmias) from 25 to 60% of total populations of middle-aged working men, depending on age and area, will be found to have “abnormal ECGs.”
Finally a virtually untouched and complex problem in epidemiologic appli- cation of the ECG arises in attempts to evaluate changes for better or worse in heart patients on experimental secondary attack prevention programs. There is no guide to valid criteria for meaningful changes in an an already abnormal baseline record.
THE EXERCISE ELECTROCARDIOGRAM
Separate consideration is given to standardization of the exercise electro- cardiogram because of the special problems and extraordinary confusion which exist in the field. The role of the exercise ECG in cardiovascular epidemiology is not established, as the method is inconvenient and time-consuming, and many questions remain about the methodology of the test and the significance of the stress response. Application has been made in group studies because of evidence that the post-exercise ECG response relates t o subsequent disease riskJ8 and from interest in characterizing the circulatory fitness of popula- tions. Experience about the safety of the various submaximal tests is now considerable.8
Quite different methodologies have developed among and between those concerned with work physiology and those primarily interested in diagnostic use of the ECG response to work. In addition, recent claims, inadequately supported, that characteristics of the ECG recorded during a step test are of greater value than those after standard exercise have served to complicate further both methods and i n t e r p r e t a t i ~ n . ~ ~ Monitoring during ECG stress tests has been widely utilized for many years, and is highly recommended as a safety factor in earlier detection of gross arrhythmia or S-T segment depres- sion while such tests are being applied in population studies8
Because of its frequency, the principal stress ECG response of known interest is behavior of the S-T segment and T wave. However, S-T and T amplitude and configuration, recognition, and interpretation are strongly de- pendent on 1) the fidelity of the recording instrument, 2) the ECG display in relation to baseline fluctuation and noise, 3) the lead configuration, 4) the type, amount, and duration of the work load imposed, 5) the period during and after the effort in which records are made, and on 6) the classification criteria or standards. The special problem lies in the fact that none of these variables is standardized.

CM,C
M,C
M6
CS,
CS, C
S,
O
X A
B
CN,
CN, C
N,
4 V5
FIG
UR
E 3
. D
iffe
renc
es i
n m
agni
tude
and
con
tour
of
S-T
seg
men
t de
pres
sion
in
one
case
rec
orde
d w
ith
diff
eren
t le
ad c
onfi
gura
tions
(4
1). C
H:
fore
head
to
ches
t, C
R:
righ
t ar
m t
o ch
est,
CC
: ri
ght
to l
eft
ches
t, C
B:
righ
t ba
ck t
o ch
est,
CM
: st
ernu
m t
o ch
est,
CS:
rig
ht
subc
lavi
cle
to c
hest
, 0
: ri
ght
subc
lavi
cle
to l
eft
back
, X
: ri
gh t
o le
ft c
hest
, A
: m
anuh
rium
to
sacr
um,
B:
righ
t lo
wer
to
left
low
er c
hest
, C
N:
low
er n
eck
to c
hest
, V
: W
ilson
lea
ds,
RV
: m
odif
ied
Wils
on l
eads
, R: r
ight
to
left
che
st,
L: e
ar-e
nsif
orm
-pre
cord
ial s
yste
m.
m
W
Q,

Blackburn: ECG in Epidemiology 897
The S-T and T diagnostic information is contained in the slower compo- nents of the ECG close to the range of the DC potential differences produced by motion a t the electrode-skin contact. As previously mentioned, existing ECG apparatus may give unfaithful accords a t these lower frequencies and most F M radio-telemetry devices on the market give stable records precisely because they are unresponsive to these slower components near the DC level.’ Non-linear “corrections” are employed in telemetry devices with short time-constants and distortions which may occur are unpredictable; the true curves cannot be re-synthesized. Solution to the problem of skin-electrode contact will allow in turn, improvement in instrument fidelity, and these are the first requisites to a standardized approach in this area. Meanwhile, cable- coupled recording on tested direct-writing apparatus is the safest policy for comparative studies.
Lead systems for exercise electrocardiography are almost as numerous as investigators in the field. In FIGlJRE 3 the simple self-evident demonstra- tion is made that the display of diagnostic S-T segment information is depend- ent on the number of leads recorded and on location both of reference and exploring electrodes. Some systems appear more sensitive, perhaps more optimally distorted, for S-T display than others, and there are distinct dif- ferences between lead systems in regard to freedom from interference and motion artefact during work performance.””” Special electrodes and proce- dures are becoming available for reducing “noise” and for extracting the ECG signal from the “noise” of work records.’.‘’
The most appropriate time intervals to record during and after work per- formance are not known and effective reduction of the vast amounts of data obtained from continuous recording is not yet attained. Solution of one prob- lem relates to and awaits solution of another.
I t would be desirable of course, to render similar both the aims and meth- ods of those concerned with testing work performance and those interested in diagnostic comparisons and prognostic evaluation. There are differences in concept, however, which lead some investigators to an interest in the circulatory response to a given standard external work load, and others to concern with characterizing the ECG response to a standard physiological load imposed on the heart.
Bicycle work, or a step test “corrected” for body weight, defines the exter- nal work load but not the cardiac stress, does not allow standardized charac- terization of the ECG response of a population, and selectively “penalizes” the small individual. Constant rate step tests or treadmill work in a sense standardize for heart and body size but complicate the description of the physical work performed, and still yield considerable variability in energy cost between subjects, calculated as oxygen consumption per mass of heart muscle. A stress in the form of a particular submaximal procedure may re- present little challenge to the heart in one population, while in another popula- tion a substantial number of men could not complete the same test.
’
898 Annals New Y ork Academy of Sciences
A more rational basis for evaluating stress effects on the heart and circula- tion is provided by work against the individual’s own weight a t aerobic work levels about his maximal O2 c o n ~ u m p t i o n . ~ ~ However, application of such strenuous tests in large population surveys is not yet adequately tested and is subject to the same problems and variations as submaximal tests in regard to graded versus fixed work loads, continuous versus discontinuous procedure, different lead systems, postures, classification criteria, etc.
It seems clear that such maximal tests increase the yield of ECG events of undoubted diagnostic and prognostic import over submaximal effort test^.^',^' Whether they significantly improve standardization for comparison of ECG response characteristics depends, among other things, on the selection involved (i.e. on the investigator’s judgment) in excluding subjects from the heavy test procedure and on the end points used for determining the maximum performance and for terminating the test procedure.
Broad discussions are now underway among several agencies to consider the current possibilities for standardization of exercise testing, and to point up the areas requiring study before more ideal standards are applicable. Rea- sonable and feasible first steps leading toward standardized application of the exercise electrocardiogram in descriptive and experimental cardiovascular epidemiology include:
1) A standard posture, preferably erect, throughout the baseline, work, and recovery periods.
2) A standard lead configuration throughout the baseline, work, and recovery periods, irrespective of the lead system chosen.
3) A graded procedure of submaximal work to include levels within the capacity of most subjects free of manifest heart disease.
4) Constant ECG monitoring with recording a t intervals a t most of one minute throughout and up t o 4 minutes post-exercise.
5 ) Discussion leading to agreed criteria for exclusion from and termination of exercise tests, separately for diagnostic studies and for cardiac work evaluation studies.
6) A minimum criterion for a significantly positive ECG response of 3 0.1 mv. horizontal or downward sloping S-T segment depression in any lead a t any post-exercise interval recorded on an instrument with a minimum decay time constant of 2 seconds in a subject with no such finding in the baseline tracing.
Work required for a more rational basis for standardization in this area includes study of:
1) The relative ability of conventional ECG leads, orthogonal VCG leads, and highly distorted leads to display S-T depression and to discriminate be- tween specified groups, i.e. “standards.”
2) The relative performance of the above leads during work procedures in regard to technical quality of the records.

Blackburn: ECG in Epidemiology 899
3) The relative yield of events, discriminative and prognostic, employing single versus multiple work loads up to maximal tolerance.
4) Methods for extracting and reducing the amount of useful ECG infor- mation from inevitably noisy and prolonged work records.
5) Methodsof analysis to improve the power of the test as an epidemi- ological tool.
6) Fundamental determinants of the ischemic electrocardiographic re- sponse, including the relationships to coronary flow, cardiac output, work, and oxygen consumption, and the role of physical conditioning.
Appendix A : Abstract and summary of reading and coding rules for the ECG in population studies ($A.H.A. recommendations Circulation 10:564, 1954).
Definitions and Baseline Reference
1)$ The P wave is normally the gradual initial deflection of any group, and may be a summit or a depression. The level or reference from which its voltage is measured is the isoelectric level (T-P or U-P interval).
2)$ The voltage of an upward QRS deflection is determined by measur- ing the vertical distance between the upper edge of the trace a t the beginning of the QRS interval and the upper edge of the trace a t the apex of the deflec- tion. The voltage of a downward deflection is determined by measuring the vertical distance between the lower edge of the trace a t the beginning of the QRS interval and the lower edge of the trace a t the bottom of the deflection.
3)$ The earliest QRS deflection which lies above the reference level should be labelled R. Any downward deflection which precedes R should be labelled Q. The first of any downward deflections which may follow R should be labelled S. The first of any upward deflections which may follow S should be labelled R’, etc.
4)$ When R is absent and the QRS complex consists of a single down- ward deflection, this deflection should be labelled QS. I n statistical studies QS, Q, and S deflections should be considered separately.
5 ) $ When the trace is descending it crosses the reference level a t the instant when its lowest margin reaches a position below that which it occupied at the beginning of the QRS interval. When the trace is ascending, it crosses the reference level a t the instant when its upper margin reaches a position above that which it occupied a t the beginning of the QRS interval.
6)$ When the form of the QRS complex varies from moment to moment because of the effect of respiratory movements on the position of the heart or for some similar reason, the classification of this complex should be deter- mined by the variety of complex which is most abundant, or, if no type is nu- merically predominant, by the outline of the complexes which are of interme- diate form.
900 Annals New York Academy of Sciences
7)$ The term “S-T junction” or “J” (RS-T junction) should be used to indicate the point or shoulder which marks the end of the QRS complex, the point where the steep slopes of the QRS deflections are more or less abruptly replaced by the more gradual slopes which precede or comprise the first limb of the T wave.
8)$ The reference level for the measurement of the displacement of the S-T junction (or J) should be the P-R segment at the beginning of QRS. The level of reference for the measurement of the S-T segment, the T wave and the U wave should be the isoelectric level (T-P or U-P interval) when this can be determined; otherwise it should he the level of the trace a t the beginning of the QRS interval.
9)$ The term “diphasic T waves” should be applied to those final ventricular deflections which present two distinct turning points, one on each side of the level of reference.
lo )$ The P -R interval is measured from the beginning of the P wave t o the beginning of QRS whether this be represented by a Q wave or an R wave. I t is recommended that the longest P-R interval found in the bipolar or uni- polar extremity leads be regarded as the P-R interval.
11)$ The QRS interval is measured from the beginning (Q or R ) to the end of the QRS group of deflections. The longest QRS interval found in the bipolar or unipolar extremity leads is regarded as most nearly correct.
When i n doubt, code to the less abnormal category. If there is a reason- able possibility tha t an abnormality may be artefactual, do not code it. Presence or absence of an item should be determined by the finding in the majority of recorded beats.
QS versus RS. At 25 mm./sec. paper speed with conventional appara- tus an initial spike or sharp deflection of ,025 mv. (114 mm.) or more is taken a san R. Examples of an acceptable R , and an unacceptable R, are given in FIGURES Id and e in the test.
For coding, a Q wave must be 0.1 mv. in amplitude associated with an R wave of 0.1 mv.
S-T depression is placed in a questionable category or not tabulated when found in less than majority of beats in a lead, when the baseline is swing- ing wildly or sloping up or down, and when the S-T segment describes an arc with no clear junction with QRS. If the baseline is stable over three complexes take these in precedence over others. Post-exercise S-T depression is taken as the absolute value, not as a change relatike to the resting level.
If more than one change of slope makes S-T, J point determination arbi- trary, choose the latest one. Measure S-T, J and segment depression from the level of a horizontal tangent to the upper edge of baseline a t the onset of QRS to the upper edge of S-T. S-T cannot be considered horizontal or downward sloping if any part of it slopes upward.
T wave is coded as positive i f it is not definitely flat or negative. Negative T amplitude is measured from the lower edge of baseline a t T - T P
12)
13)
14)
15)
16)
Blackburn: ECG in Epidemiology 901
junction. Where S-T-T demarcation is not clear, measure the amplitude of T inversion to the lowest level of the S-T-T segment. The positive phase of negative-positive diphasic T waves is ignored in coding.
17) R peak duration is measured from the onset of QRS (whether a Q or R) to the peak of the R wave.
18) For heart rate, average the R-R intervals from leads I and VS, or the first and last resting leads recorded.
19) If in the majority of beats in any bipolar or unipolar limb lead P -R is 0.22 seconds or over, code prolonged P-R.
20) If in the majority of beats in any bipolar or unipolar limb lead QRS is 0.12 seconds or more, a ventricular conduction defect is coded.
A technical manual on “Cardiovascular Techniques in Population Studies” by G. A. Rose and Henry Blackburn is available from the Cardio- vascular Section, W.H.O., Palais des Nations, Geneva. I t contains more detailed coding procedures along with illustrations.
Precordial Lead Placement
Subscript 1 (V,) shall be used for a lead from the right sternal margin a t the fourth intercostal space; subscript 2 for a lead from the left sternal margin a t the fourth intercostal space; subscript 4 for a lead from the fifth intercostal space where it is crossed by the midclavicular line; subscript 3 for a lead from a point midway between points 2 and 4; subscript 5 for a lead from the junction of the left anterior axillary line with the horizontal position of position 4; subscripts 6, 7, and 8 are for leads on the same horizontal level but a t the left midaxillary line (6), the left posterior axillary line (7) and the left midscapular line (8), respectively.
A p p e n d i x B ; Outline of Routine for Noise Reduction in ECG-VCG and Magnetic Tape Recordings. (Report to the Research Committee, Interna- tional Society of Cardiology, Makarska, Yugoslavia, 1963.4fi
CAPACITIVE INTERFERENCE
1) Electrode - Skin Preparation:
hyperemia, cleaning and drying with alcohol-ether or acetone.
resistance measurements if newer creme type pastes used).
Careful preparation of all skin-electrode contacts, rubbing to skin
Application of “good quality” electrolyte jelly or paste (based on
Good, stable mechanical contacts. Electrodes cleaned with sandpaper and solvents, never steel wool. (High impedance a t one electrode-skin contact can cause A-C pickup
and baseline fluctuations.) 2) Lead Cables:
often due to loose or broken contacts in lead cables.) Daily check of cables with an Ohmmeter. (Intermittent problems

902 Annals New York Academy of Sciences
3) Preamplifiers: Use differential preamplifiers for common mode rejection. (Tran-
sistorized pre-amplifiers tend to be unstable if D.C. drifts or source resist- ance are great.) 4) Grounding:
cable from subject to system ground. Concentric grounding, avoiding ground loops. Use separate ground
Ground system to good earthy ground. Check tha t zero line of AC power line is connected.
5) Shielding: Recording room containing or adjacent to as few power lines as pos-
sible, symmetric location of subject with respect to sources of interference (equidistant to electrodes).
When necessary use shielding blanket (inside insulator, outside good conductor) under mattress and over subject. Ground conducting layer to system ground.
Faraday cage is optimal protection from AC pick-up.
INDUCTIVE INTERFERENCE
Avoid cable coiling a t input side, and place patient cables in straight lines
Use shielded cables. Careful selection of recording area, as far from disturbance as possible (i.e.
along the subject.
magnetic fields from transformers, etc.).
INTERFERENCE FROM MUSCLE ACTION POTENTIALS, TREMORS, AND RESPIRATION
Conventional techniques are applied. For records during exercise, selection is made of contact sites relatively free
of muscle movement and contact with moving extremities, clothing, etc. (Quiet areas are the sternum, and immediately medial to deltoid below clavicles. Intercostal spaces may be superior to over-the-rib position.)43
FILTERING
Use of low pass filters in commercial electrocardiographs is inadvisable as they cause distortion of high frequency components and attenuated QRS amplitude. If used, record a few beats unfiltered.
AVERAGING To “SMOOTH OUT” NOISE
Several techniques are available including small computers for average transients. Use should not replace efforts for best recording technique.

Blackburn: ECG in Epidemiology 903
NOISE PECULIAR To MAGNETIC TAPE RECORDINGS
Careful check-out that recorders meet all specifications. Basic noise level
Quality tape is required. Temperature and humidity control and dust-free conditions are sought. Clean recording heads frequently.
of many commerical systems is far from satisfactory.
Bibliography
1. LEPESCHKIN, E. 1963. Electrocardiographic instrumentation. Progress in Cardio- vascular Diseases 5: 498.
2. COUNCIL ON PHYSICAL MEDICINE AND REHABILITATION. 1950. Minimum re- quirements for acceptable electrocardiographs. J.A.M.A. 143: 654
3. WILSON, F. N., ET. AL. 1954. Recommendations for standardization of electrocardio- graphic and vectorcardiographic leads. Circulation 10: 564.
4. DOWER, G. E., A. D. MOORE, W. G. ZIEGLER, & J . A. OSBORNE. 1963. On QRS ampli- tude and other errors produced by direct-writing electrocardiographs. Am. Heart J. 65: 307.
5. KERWIN, A. J. 1953. The effect of the frequency response of electrocardiographs on the form of electrocardiograms and vectorcardiograms. Circulation 8: 98.
6. LANGNER, P . H., D. B. GESELOWITZ, R. & F. T. MANSLIRE. 1961. High frequency components in the electrocardiogram of normal subjects and of patients with coronary heart disease. Am. Heart J. 62: 746.
7. SCHMITT, 0. H., M. OKAJIMA, & M. BLAUG. 1961. Skin preparation and electro- cardiographic lead impedance. Digest of the 1961 International Conference on Medical Electronics, page 236.
8. REPORT OF T H E RESEARCH COMMITTEE. 1964. International Society of Cardi- ology. Jap. Heart J. 5: 195. Acta Cardiologica 14: 305. Brit. Heart J. 26: 558. Malattie Cardiov. 5: 301-317. Z. Kreislauff. 53: 762-764.
9. RAUTAHARJU, P. M. & H. BLACKBURN. 1965. The exercise electrocardiogram. Ex- perience in analysis of “noisy” cardiograms with a small computer. Am. Heart J. 69: 515.
10. OSTRANDER, L. D. J R . & B. J . WEINSTEIN. 1964. Electrocardiographic changes after glucose ingestion. Circulation 30: 67.
11. ROSE, G.A. 1961. A caliper for siting the precordial leads in electrocardiography. Lancet 280 31.
12. McFEE, R. &A. PARUNGAO. 1961, An orthogonal lead system for clinical electrocar- diography. Am. Heart J. 62: 93.
13. RAUTAHARJU, P. M., N. OKAMOTO, & H. BLACKBURN. A protractor for standard positioning of electrodes in the Frank orthogonal electrocardiogram. Unpublished data.
14. BURGESS, A. M., JR., 2. FEJFAR, & A. R. KAGAN. 1963. Arterial hypertension and ischemic heart disease: Comparison in epidemiologic studies. W.H.O. Chronicle 17: 15,55,97.
15. RIKLI, A. E., C. A. CACERES. D. J. COLEMAN, S. ABRAHAM, & 0. HAYES. 1964. Metrology in cardiac disease detection. Ann. N. Y. Acad. Sci. 115: 1049.
16. PIPBERGER, H . V. & F. W. STALLMANN. 1964. Computation of differential diagnosis in electrocardiography. Ann. N. Y. Acad. Sci. 115: 1115.
17. FRANK, E. 1956. An accurate, clinically practical system for spatial vectorcardiog- raphy. Circulation 13: 737.
18. THOMAS,A. J., A. L. COCHRANE, & I. T. T. HIGGINS. 1958. The measurement of the prevalence of ischemic heart disease. Lancet 2 540.
19. DAVIS, L. G. 1958. Observer variation in reports on electrocardiograms. Brit. Heart J. 20 153.
904 Annals New York Academy of Sciences
20. ACHESON, R. M. 1960. Observer error and variation in interpretation of electro- cardiograms in epidemiological study of coronary heart disease. Brit. J. Prev. Soc. Med. 14: 99.
21. EPSTEIN, F. H.,d. T. DOYLE, A. A. POLLACK, H . POLLACK, G. P. ROBB, & E . SIMON- SON. 1961. Observer variation in interpretation of electrocardiograms. J.A.M.A. 175: 847.
22. SEGALL, H. N. 1960. Electrocardiogram and its interpretation: Study of reports by 20 physicians on a set of 100 electrocardiograms. Canad. Med. Ass. J. 82: 2.
23. HIGGINS, I. T. T.. A. L. COCHRANE. & A. J . THOMAS. 1963. Epidemiological studies of coronary heart disease. Brit. J.P.s. Med. 17: 153.
24. GORMAN, P. A,, J. B. CALATAYUD, S. ABRAHAM, & C. A. CACERES. 1964. Observer variation in interpretation of the electrocardiogram. Med. Annals Dist. Columb. 33: 97.
25. BLACKBURN. H. .A. KEYS, E. SIMONSON. P . RAUTAHARJU,& S. PUNSAR. 1960. The electrocardiogram in population studies. A classification system. Circulation 21: 1160.
26. HIGCINS. I . T . T. 1965. International comparability in epidemiological studies of arteriosclerotic heart disease. Princeton Conference of the International Epidemi- ological Association, August 1964, Milbank Memorial Fund Quarterly. In press.
27. KAGAN, A. R. 1965. Comparison of electrocardiographic data with particular refer- ence to the W.H.O. Minnesota Code trial. Princeton Conference of the Interna- tional Epidemiological Association, August 1964, Milbank Memorial Fund Quarterly. In press.
28. RAUTAHARJU. P. M . , M. J . KARVONEN. & A. KEYS. 1961. The frequency of arterio- sclerotic and hypertensive heart disease among ostensibly healthy working popula- tions in Finland. J. Chron. Dis. 13: 426.
29. HIGGINS. I. T . T.. W. B. KANNEL, & T. R. DAWBER. 1963. The prospective value of the electrocardiogram in epidemiological studies. Report to the A.H.A. Committee on Epidemiology. Chicago, January 1964.
30. BLACKBURN. H., H. L. TAYLOR. T. PUCHNER, & A. KEYS. 1961. Relationship of resting and post-exercise electrocardiographic abnormalities to obesity, hyperten- sion, and hypercholesteremia in working men. (Abstract) Circulation 24: 887.
31. ROSE, G., 1965. Cardiovascular diagnosis by questionnaire. Princeton Conference of the International Epidemiological Association, August, 1964, Milbank Memorial Fund Quarterly. In press.
32. FREIMAN. A. H. & C. A. STEINBERG. 1964. The analysis of simultaneously recorded cardiovascular data with the digital computer, 1964. Ann. N. Y. Acad. Sci. 115: 1091.
33. SHAPIRO, H.. E. SIMONSON, & L. D. CADY. JR . 1964. Electrocardiographic correla- tions in normal patients. Am. tJ . Med. Electron. 3: 41.
34. SIMONSON, E. 1961. Differention between normal and abnormal in electrocardiog- raphy. C. V. Mosby, St. Louis.
35. SIMONSON, E . & H. BLACKBURN. 1960. Comparison of age differences in the electro- cardiogram of men and women. Mal. Cardiovas. 1: 311.
36. SIMONSON.E., H. BLACKBURK. T. C. P U C H N E H . P. EISENREKG. F. RlBEIRO & hl . MEJA. 1960. Sex differences in the electrocardiogram. Circulation 22: 598.
37. KIESSLING, C. E. , R. S. SCHAAF, & A. M. LYLE. 1964. A study of T wave changes in the electrocardiograms of normal individuals. Am. J. Cardiol. 13: 598.
38. ROBB, G. P . & H. H. MARKS. 1964. Latent coronary artery disease. A. J. Cardiol. 13: 603.
39. BELLET, S., S. DELIYIANNIS, & M. ELIAKIM. 1961. The electrocardiogram during exercise as recorded by radio-electrocardiography. Am J. Cardiol. 8: 385.
40. BLACKBURN, H. & R. KATIGBAK. 1964. What electrocardiographic leads to take after exercise? Am Heart tJ. 67: 184.
41. BLACKBURN. H.. H . L. TAYLOR. N. OKAMOTO, P. L. MITCHELL, & A. KERKHOF. 1965. The exercise electrocardiogram. A systematic comparison of lead configura- tions used for monitoring during work performance. In: Physical Activity and the Heart, Ed. M. Karvonen and Ancel Keys. C. C. Thomas, Springfield, in press.

Blackburn: ECG in Epidemiology 905
42. BLOMQVIST, G., P. HALL, & I. ASTRAND. 1964. Vectorcardiographic changes during and after exercise in patients with coronary disease and in normal subjects, analysed by electronic computer. Abstracts. Prague 4th European Congress of Cardiology. Page 38.
43. MASON, R. E.. I. N. LIKAR. & R. S. ROSS. 1964. New system of multiple leads in exercise electrocardiography. Abstract. Circulation 30 I11 - 123.
44. BRUCE,R.A., N. TING, E. A. DOAN, E. R. ALEXANDER, J. R. BLACKMAN. Y. B. LI, D. R . PETERSON, J. T. GRAYSTON. d. A. MAZZARELLA. & J. <JORDAN. 1965. Com- parative prevalence of segmental S-T depression after maximal exercise in middle- aged American and Chinese men. In: Physical Activity and the Heart, Ed. M. Karvonen and Ancel Keys. C. C. Thomas. Springfield, Ill., in press.
45. SHEFFIELD. L. T. 1964. Comparison of exercise tests and heart rate. Presented to the American Heart Association Annual Meeting, October 25, 1964.
46. RAUTAHARJU, P. M. & H. BLACKBIJRN. 1963. Report to the Research Committee, International Society of Cardiology, Makarska. Yugoslavia, Sept. 18 - 23. 1963.