the effects of nutrient supplementation on cd4 t …
TRANSCRIPT

THE EFFECTS OF NUTRIENT SUPPLEMENTATION ON CD4+ T CELL
SUBSETS IN ZAMBIAN ADULTS
By
Caroline Cleopatra Chisenga
The University of Zambia,
Lusaka
A thesis submitted to the University of Zambia in fulfillment of the requirements of the
degree (Doctor of Philosophy–Ph.D.) in Immunology
2015

ii
Copyright
All rights reserved; no part of this thesis may be produced, stored in a retrieval system or
transmitted in any form or by other means, electronic, mechanical, photocopy or
recoding without prior consent of author.

iii
Statement of Own Work
I, Caroline Cleopatra Chisenga, confirm that the work presented in this thesis is my
own.
It has been done in accordance with the guidelines for the theses for the University of
Zambia and it has not been submitted elsewhere for a degree at this or another
University. Where information has been derived from other sources, I confirm that this
has been indicated in the thesis.
Signature: …………………………………
Date: ……………………………………….

iv
Dedication
It is with my deepest gratitude and warmest affection that I dedicate this thesis to my
loving husband
Mr. Abraham Chansa Chisenga,
Who for all his sacrifices too numerous to point out has been a constant pillar for my
encouragement and wisdom.
To you I say may God continue to prosper and richly bless you.

v
Quote
“Even though it is the case that poverty is linked to AIDS, in the sense that Africa is
poor and they have a lot of AIDS, it's not necessarily the case that improving poverty -
at least in the short run, that improving exports and improving development - it's not
necessarily the case that that's going to lead to a decline in HIV prevalence.”- Emily
Oster

vi
Certificate of Completion of Thesis
This thesis is submitted with the approval of the following supervisors:
Professor Paul Kelly MD FRCP
Blizard Institute
Barts & The London School of Medicine
Queen Mary University of London
4 Newark Street, London E1 2AT, UK
Tel: +44 20 7882 2643
and
Tropical Gastroenterology and Nutrition Group
Department of Internal Medicine
University of Zambia School of Medicine
Nationalist Road, Lusaka, Zambia
Date: ……………………………………………
Signature: .………………………………………
vii
Second Supervisor:
Dr. Andrew Prendergast MA DPhil MRCPCH
Wellcome Trust Senior Clinical Fellow
Senior Lecturer in Paediatric Infection and Immunity
Honorary Consultant Paediatrician
Queen Mary, University of London.
Blizard Institute, Newark Street, London E1 2AT, UK.
Zvitambo Institute for Maternal and Child Health Research
16 Lauchlan Avenue, Meyrick Park, Harare, Zimbabwe
Date: ……………………………………………
Signature: .………………………………………

viii
Certificate of Approval
This thesis of Caroline Cleopatra Chisenga has been approved as fulfilling the
requirements for the award of Doctor of Philosophy in Immunology by the University of
Zambia.
……………………… ………………. …………………
Examiner 1 Signature Month/Date/Year
……………………… ………………….. …………………..
Examiner 2 Signature Month/Date/Year
………………………… ..…………………. ………………..
Examiner 3 Signature Month/Date/Year
Assistant Dean-Post Graduate
Dr. Selestine Nzala
Department of Public Health
School of Medicine
University of Zambia
Lusaka
Date: ………………………………..
Signature: ………………………….

ix
Abstract
Background: Although human immunodeficiency virus (HIV) infection is characterized
by the progressive depletion of CD4+ T cells, information on the prognostic value of T
cell subsets and their response to nutritional intervention is scarce.
Objective: To estimate the prognostic value of T-cell subsets in Zambian patients
initiating antiretroviral therapy (ART), to assess the impact of nutritional interventions
on T-cell subsets in in vitro and in vivo and to establish the pattern of T-cell distribution
in a healthy population.
Methods: Five studies were conducted that is, cross-section (HIV-negative adults),
retrospective (NUSTART HIV-infected adults), randomised double blind (NUSTART
HIV-infected adults), case-control (HIV-infected and HIV-negative adults) and the in
vitro selenium dose response study (HIV-negative adults) between April 2013 and May
2015. Immunophenotyping was undertaken to characterize T-cell subsets using the
markers CD3, CD4, CD8, CD45RA, CCR7, CD28, CD57, CD31, 47, Ki67, CD25
and HLA-DR.
Results: In the cross section study of 51 healthy adults, the majority of the CD4+ T-
cells were naïve and least being cells expressing proliferating marker (Ki67).
Retrospective results for the 267 records reviewed showed that there was a significant
increase in total CD4 count at p<0.0001 from baseline to twelve weeks of receiving
ART plus nutritional support. For the randomised double blind study, among 181 adults
enrolled, 36 (20%) died by 12 weeks after starting ART. In univariate analysis, patients
who died had fewer proliferating, more naïve and fewer gut homing CD4+ T-cells
compared to survivors; and more senescent and fewer proliferating CD8+ T-cells. In a
x
multivariate Cox regression model high naïve CD4+, low proliferating CD4
+, high
senescent CD8+ and low proliferating CD8
+ subsets were independently associated with
increased risk of death. Recent CD4+ thymic emigrants increased less between
recruitment and 12 weeks of ART in the intervention group compared to the control
group.
Case-control results for 50 healthy adults and 50 HIV-infected adults receiving ART
treatment plus nutritional intervention for three months showed that by three months T-
cells were not comparable to the healthy population. And lastly, in the in vitro selenium
dose response study, most of CD4 and CD8 T cell subsets showed significant response
to selenium. These results mean that selenium might have transcriptional effects.
Conclusions: Although we found that high naïve CD4+ and high senescent CD8
+ T cells
were not protective against early mortality in HIV-infected adults, most of the T cells in
the healthy population equally were naïve. Thus, measuring specific CD4+ T-cell subsets
should be considered for prognostic significance in patients initiating ART in Zambia.
Furthermore, although there was some good response in the in vitro study, only thymic
output responded to this nutritional intervention.

xi
Acknowledgments
I would like to sincerely thank all those who made this work possible: my wise and
encouraging supervisors (Prof. Paul Kelly, Prof. Suzanne Filteau and Dr. Andrew J.
Prendergast), the energetic and diligent NUSTART team, TROPGAN team, SACORE
administrators, SACORE PhD scholars and my supportive TROPGAN colleagues and
friends, Patrick Kaonga and Mpala M. Lisulo for the excellent technical assistance in
this study.

xii
List of Publications During the Course of Study
1. Chisenga CC, Filteau S, Siame J, Chisenga M, Prendergast AJ, Kelly P (2015) T-
Cell Subsets Predict Mortality in Malnourished Zambian Adults Initiating
Antiretroviral Therapy. PLoS ONE 10(6): e0129928.
doi:10.1371/journal.pone.0129928.
2. C. C. Chisenga and P. Kelly (2014) The Role of Selenium in Human Immunity.
Medical Journal of Zambia, Vol. 41, No. 4: 181-185.
3. Zulu JM, Lisulo MM, Besa E, Kaonga P, Chisenga CC, Mumba C, Simuyandi M,
Banda R and Kelly P. (2014). Improving Validity of Informed Consent for
Biomedical Research in Zambia Using a Laboratory Exposure Intervention. PLoS
ONE 9(9): e108305. doi:10.1371/journal.pone.0108305.
4. C. C. Chisenga, Suzanne Filteau, Andrew J. Prendergast, Paul Kelly. Selenium
responsive α4β7 integrin expression on T lymphocytes in Zambian adults with and
without Se deficiency. Manuscript under review.

xiii
Table of Contents
COPYRIGHT…………………………………………………………………………...ii
STATEMENT OF OWN WORK……………………………………………………..iii
DEDICATION…………………………………………………………………….……iv
QUOTE…………………………………………………………………………………..v
CERTIFICATE OF COMPLETION…………………………………………………vi
SECOND SUPERVISOR……………………………………………………………..vii
CERTIFICATE OF APPROVAL…………………………………………………...viii
ABSTRACT……………………………………………………………………….........ix
ACKNOWLEDGMENTS……………………………………………………………...xi
LIST OF PUBLICATIONS…………………………………………………………...xii
TABLE OF CONTENTS……………………………………………………………..xiii
LIST OF TABLES…………………………………………………………………..xviii
LIST OF FIGURES……………………………………………………………………xx
LIST OF ABBREVIATIONS……………………..………………………………...xxiv
Thesis outline.…………………..………………………………………………………...1
Chapter 1 Introduction……………………………………………………………………3
Chapter 2 Background…………………………………………………………………....4
2.1 NUSTART Main trial and sub-study overview ………………………………...........4
2.1.1 NUSTART trial study objectives………………………………………………......7
2.1.2 NUSTART participant eligibility, recruitment and location…………………….....8
2.1.3 Assessment for adherence………………………………………………………….9
2.1.4 Randomization and blinding…………………………………………………........10
2.1.5 Clinical outcomes…………………………………………………………………10
2.1.6 Ethics……………………………………………………………………………...12
2.2 Sub-study overview…………………………………………………………………13
2.3 Hypothesis tested in this sub-study……………………………………………........13
Chapter 3 Literature review……………………………………………………………..14
3.1 HIV virus…...………………………………………………………………….........14
3.2 Lymphocyte development…………………………………………………………..17
3.3 CD4+ T Lymphocyte development………………………………………………….18

xiv
3.4 HIV Immunopathogenesis…………………………………………………………..19
3.5 CD4+ T cell dynamics during HIV-infection…………………………………….....23
3.5.1 Ki67………………………………...……………………………………………..23
3.5.2 Cluster of differentiation 31 (CD31)……………………………………………...24
3.5.3 CD45RA…………………………………………………………………………..25
3.5.4 CC-chemokine receptor 7 (CCR7)…………………………………………..........25
3.5.5 Human lymphocyte antigen class II (HLA-DR)………………………………….26
3.5.6 Alpha4 and beta7 integrins…………………………………………………..…....26
3.5.7 Cluster of differentiation 25 (CD25)………………………………………….......27
3.5.8 Cluster of differentiation 57 (CD57)...………………………………………........27
3.5.9 Cluster of differentiation 28 (CD28)…………...…………………………………29
3.5.10 Cluster of differentiation 27 (CD27)...…………………………………………..30
3.5.11 7AAD………………………………………………………………………........30
3.6 CD4 counts in healthy adults……………………………………………………….32
3.7 ART and immune reconstitution inflammatory syndrome (IRIS)…………….........32
3.8 Malnutrition in HIV………………………………………………………………...33
3.9 Nutritional deficiencies, BMI, ART and mortality………………………………....37
3.10 The impact of nutrient interventions during HIV-infection……………………….39
3.11 CD4 reconstitution during ART……………………………………………….......46
3.12 CD4 T cell reconstitution and nutrition in HIV……………………………………47
3.13 Selenium and HIV………………………………………………………………....49
3.13.1 Selenium and human requirements……………………………………………...49
3.14 The role of selenium in human physiology………………………………………..50
3.14.1 Selenium and oxidative stress…………………………………………………...50
3.15 Transcriptional effects of selenium………………………………………………..51
3.16 Impact of selenium on immunity……………………………………………...…...51
3.16.1 Innate immunity…………………………………………………………….........51
3.16.2 Humoral immunity………………………………………………………………52
3.16.3 T cell immunity……………………………………………………………….....53
3.17 Selenium, cardiomyopathy and coxsackie virus…………………………………..54
3.18 HIV………………………………………………………………………………...54

xv
3.18.1 Observational data…………………………………………………………….....54
3.18.2 Clinical trial data……………………………………………………………..….55
Chapter 4. Statement of the problem……………………………………………..……..59
4.1 Statement of the problem………………………………………………..…………..59
4.1.1 Study justification 1……………………………………………………..………...60
4.1.2 Study justification 2 (Selenium)…………………………………………………..65
4.2 Conceptual framework……………………………………………………………...65
4.3 General objective……………………………………………………………………65
4.3.1 Specific objectives……………………………………………………………...…66
4.4 Research question………………………………………………………………..….66
4.5 Study design……………………………………………………………………..….66
Chapter 5: Research methods (FACS…………………………………………………..67
5.1 T cell subset profile in healthy Zambian adults (cross sectional study)………........67
5.1.1 Sample size calculation-cross sectional study……………………………………67
5.1.2 Study participants and area…………………………………………………….…67
5.1.3 Sample collection and transportation………………………………………..........68
5.1.4 Haematological analysis…………………………………………………………..68
5.1.5 Total CD4 and CD8 estimation…………………………………………………...68
5.1.6 CD4+ and CD8
+ T cell subset testing (Immunophenotyping)…………………….69
5.1.7 Qualitative testing HIV-1/HIV-2, HCV and HBsAg………………………….….69
5.2 Overview of the NUSTART trial and the sub-study reported here………………...70
5.2.1 An overview of the study (sub-study) design and sample size…………………...71
5.2.2 Study subjects and area…………………………………………………………...72
5.2.3 Sample collection and transportation………………………………………..........72
5.3 Experimental in-vitro sample prosessing (exploratory)…………………………....73
5.3.1 Method for selenium measurement in plasma.…………………………………...74
5.3.2 Calculation………………………………………………………………………..74
5.4 Survey……………………………………………………………………………….74
5.5 Data Analysis………………………………………………………………………..75
5.6 Ethical Considerations………………………………………………………………76
5.6.1 Study Approval……………………………………………………………………76

xvi
5.6.2 Validation of experiment (quality assurance and procedures)……………………76
5.6.3 Benefits……………………………………………………………………………76
5.6.4 Risks………………………………………………………………………………76
5.6.5 Reimbursement……………………………………………………………………77
5.6.6 Confidentiality…………………………………………………………………….77
5.6.7 Injury Clause……………………………………………………………………...77
5.6.8 Right to Refuse or Withdraw……………………………………………………..77
Chapter 6: Study Results………………………………………………………………..78
6.1: Normal distribution of T cell subsets in HIV Negative
Adults……………………...............................................................................................78
6.2 Retrospective analysis of overall changes in total CD4 count in NUSTART study..88
6.2.1 Randomised controlled trial-NUSTART……………………………………….…89
6.3 Analysis of CD4 and CD8 T cell subsets at baseline and week 12……………........97
6.4 Sub study analysis of CD4 and CD8 change by arm………………………………105
6.5 Selenium dose response (in-vitro) study results…………………………………...111
6.6 Results for a survey of treated HIV-infected patients and HIV- adults…………...135
Chapter 7: Discussion………………………………………………………………….151
7.1 What is the Distribution of CD4 and CD8 T Cell Subsets in HIV-negative adults?151
7.2 What are the Immunological Risk Factors Associated with Death Within 12 Weeks
of Initiating ART and Do CD4 or CD8 T Cell Subsets Respond to Extra Vitamins and
Minerals in vivo?............................................................................................................156
7.3 What is the Effect of Selenium on T Cell Subsets In-Vitro?...................................161
7.4 Are CD4 and CD8 T cell subsets in HIV+ adults comparable to HIV- adults after 3
months of ART plus nutritional support?.......................................................................164
Chapter 8: Conclusions and future work………………………………………………167
8.1 Overall findings.…………………..……………………………………………….167
8.2 Significance of the Research……………………………………………………....167
8.3 Contribution of knowledge to Science…………………………………………….169
8.4 Application of Results in Public Health…………………………………………...169
8.5 Future work………………………………………………………………………..169
APPENDIX A Publication from the PhD study……………………………………….170

xvii
APPENDIX B Awards won during the PhD work……………………………….........171
APPENDIX C Sub study information sheet…………………………………………...172
APPENDIX D Consent form…………………………………………………………..174
APPENDIX E Questionnaire………………………………………………………….175
APPENDIX F NUSTART trial study ethics approval letter (Lusaka)…………...........177
APPENDIX G NUSTART trial study ethics approval letter (London)……….............178
APPENDIX H Sub study ethics approval letter……………………………………….179
APPENDIX I Protocol modification ethics approval (Selenium study)………………180
APPENDIX J Laboratory protocol details………………………………………….....181
APPENDIX K: Laboratory practices and safety procedures…………………………198
References……………………………………………………………………………..201
xviii
List of Tables
Table 2-1: Nutritional composition of trial supplements amounts per day.……...………5
Table 2-2: Summary of study tests.……………………………………………………..11
Table 3-1: Summary of antibodies and populations of cells……………………………31
Table 3-2: Mean CD4 counts in HIV-negative African population…………………….32
Table 3-3: Summarizes CD4+ T cell changes during ART……………………………..47
Table 3-4: Effects of Selenium on absolute CD4 count………………………………..58
Table 4-1: Summary of the effects of micronutrients on CD4+ T cells and mortality....61
Table 4-2: Summary of Interventional Studies and Effects on Total CD4/CD8 Count..64
Table 5-1: Sample size calculations……....…………………………………………….67
Table 5-2: Study sample size calculations……………………………………………...72
Table 5-3: Survey Sample Size Calculation…………………………………………….75
Table 6-1: Baseline characteristics for the participants…………………………………79
Table 6-2: CD4 and CD8 Subset Reference Intervals in Healthy Population Stratified by
Sex………………………………………………………………………………………81
Table 6-3: CD4 and CD8 Subset in Healthy Population Stratified by Sex……………..87
Table 6-4: Baseline Clinical and Nutritional Characteristics of HIV-infected Adult
Zambian Men and Women……………………………………………………………...91
Table 6-5: Immunological Risk Factors for Death within 12 weeks of Initiating
Antiretroviral Therapy………………………………………………………………….93
Table 6-6: T Cell Subset Markers at Baseline and After ART and Nutritional
Support………………………………………………………………………………....97
Table 6-7: Baseline T Cell Subset Markers in Patients Allocated to Receive Supplements
with (LNS-VM) or without (LNS) Additional Vitamins and Minerals……………….103
Table 6-8: Increase in T Cell Subset Markers in Patients Receiving Supplements with
(LNS-VM) or without (LNS) Additional Vitamins and Minerals after 12 weeks…….105
Table 6-9: The Delta Changes in T Cell Subset Markers in Patients Receiving
Supplements with (LNS-VM) or without (LNS) Additional Vitamins and Minerals after
12 weeks……………………………………………………………………………….110
Table 6-10: Baseline Characteristics for the Participants……………………………..111
Table 6-11: Baseline CD4 and CD8 T Cell Subsets Between Females and Males…...113

xix
Table 6-12: CD4 and CD8 T Cell Response to 180 µmol/L Selenium Concentration
Between Females and Males…………………………………………………………..114
Table 6-13: CD4 and CD8 T Cell Response to 200 µmol/L Selenium Concentration
Between Females and Males…………………………………………………………..115
Table 6-14: CD4 and CD8 T Cell Response to 220 µmol/L Selenium Concentration
Between Females and Males……………………………………………………….….116

xx
List of Figures
Figure 3-1: HIV prevalence……………………………………………………………..14
Figure 3-2: Global percentage of people receiving ART by region 2009-2012………...15
Figure 3-3: Global new HIV infections…………………………………………………16
Figure 3-4: Global HIV/AIDS deaths from 1980-2010...………………………………16
Figure 3-5: Estimated number of AIDS-related deaths, with/without ART, in low- and
middle-income countries, and by region.……………………………………………….17
Figure 3-6 Lymphocyte development…………………………………………………..17
Figure 3-7: CD4+ T lymphocyte development.…………………………………………19
Figure 3-8: HIV pathogenesis…………………………………………………………..20
Figure 3-9: Post thymic development of CD4+ T cells ……………………...................24
Figure 3-10: Summary of activated induced cell death………………………………....28
Figure 3-11: The combined effect of BMI and weight change after 3 months of ART on
the risk of mortality……………………………………………………………………..38
Figure 3-12: Impact of poor nutrition and HIV…………………………………………40
Figure 3-13: Selenium supplementation and mortality in adults with HIV-infection…..41
Figure 3-14: Selenium supplementation and viral load in adults with HIV-infection.....41
Figure 3-15: Selenium supplementation and CD4 count change in adults with HIV-
infection...........................................................................................................................42
Figure 3-16 Micronutrient supplementation and mortality in adults with HIV-
infection………………………………………………………………………………...43
Figure 3-17: Micronutrient supplementation and mortality in adults with HIV-
infection…………………………………………………………………………………43
Figure 3-18: Micronutrient supplementation and mortality in adults with HIV-infection
(severe immunodeficiency)……………………………………………….…………….44
Figure 3-19: Micronutrient supplementation and CD4 counts in adults with HIV-
infection…………...........................................................................................................44
Figure 3-20: Micronutrient supplementation and CD4 change at 12 months in adults
with HIV-infection……………………………………………………………………...45
Figure 4-1: Study conceptual frame work (substudy)…………………………………..65
Figure 5-1: Relationship between NUSTART main trial and the sub-study……………70

xxi
Figure 5-2: Selenium measuring and sample incubation……………………………….73
Figure 6-1: Flow diagram for the participants enrolled in the study……………………78
Figure 6-2: Total CD4 and subset distribution in healthy Zambian adults using surface
marker expression……………………………………………………………………….83
Figure 6-3: Distribution of functional status of CD4 cells in healthy Zambian adults....84
Figure 6-4 Shows total CD8 and subset distribution in healthy adults using surface
marker expression …………………………………………………………………..…85
Figure 6-5 Distribution of functional status of CD8 cells in healthy Zambian
adults……………………………………………………………………………………86
Figure 6-6: Shows baseline CD4 count and 12 weeks after ART and nutritional……...88
Figure 6-7: Flow of participants through the study…………………………………......90
Figure 6-8: Kaplan-Meier plot of survival……………………………………………...95
Figure 6-9: Kaplan-Meier plot of survival……………………………………………...96
Figure 6-10: Naive CD4+ T-cells at different selenium concentrations…………….....117
Figure 6-11: Central memory CD4+ T cells at different selenium concentrations……117
Figure 6-12: Effector memory CD4+ T cells at different selenium concentrations…...118
Figure 6-13: Effector CD4+ T cells at different selenium concentrations…………….118
Figure 6-14: Gut homing CD4+ T cells at different selenium concentrations………...119
Figure 6-15: Activated gut homing CD4+ T cells at different selenium
concentrations…………………………………………………………………………119
Figure 6-16: Activated CD4+ T cells at different selenium concentrations…………...120
Figure 6-17: Proliferating CD4+ T-cells at different selenium concentrations..............120
Figure 6-18: Proliferating and activated CD4+ T-cells at different selenium
concentrations………………………………………………………………………….121
Figure 6-19: Senescent 1 CD4+ T-cells at different selenium concentrations…………121
Figure 6-20: Senescent 2 CD4+ T cells at different selenium concentrations…………122
Figure 6-21: Recent thymic emigrant CD4+ T cells at different selenium
concentrations………………………………………………………………………….122
Figure 6-22: Naive CD8+ T-cells at different selenium concentrations…………….....123
Figure 6-23: Central memory CD8+ T cells at different selenium concentrations…….124
Figure 6-24: Effector memory CD8+ T cells at different selenium concentrations..….124
Figure 6-25: Effector CD8+ T cells at different selenium concentrations…………......125
xxii
Figure 6-26: Gut homing CD8+ T cells at different selenium concentrations………....125
Figure 6-27: Gut homing and activated CD8+ T cells at different selenium
concentrations………………………………………………………………………….126
Figure 6-28: Activated CD8+ T cells at different selenium concentrations…………...126
Figure 6-29: Proliferating CD8+ T cells at different selenium concentrations...............127
Figure 6-30: Proliferating and activated CD8+ T cells at different selenium
concentrations………………………………………………………………………….127
Figure 6-31: Senescent 1 CD8+ T cells at different selenium concentrations………....128
Figure 6-32: Senescent 2 CD8+ T cells at different selenium concentrations…………128
Figure 6-33: Recent thymic emigrant CD8+ T cells at different selenium
concentrations………………………………………………………………………….129
Figure 6-34: CD4 homing cells in deficient and non-deficient individuals…………...130
Figure 6-35: CD4 homing and activated cells in deficient and non-deficient
individuals……………………………………………………………………………..130
Figure 6-36: CD4 naive cells in deficient and non-deficient individuals……………..131
Figure 6-37: CD4 senescent 1 cells in deficient and non-deficient individuals……....131
Figure 6-38: CD8 homing cells in deficient and non-deficient individuals…………..132
Figure 6-39: CD8 homing and activated cells in deficient and non-deficient groups...132
Figure 6-40: CD8 naive cells in deficient and non-deficient individuals……………..133
Figure 6-41: CD8 senescent 1 cells in deficient and non-deficient individuals……....133
Figure 6-42: Median age between the HIV+ and HIV- participants..………………...135
Figure 6-43: Median haemoglobin between the HIV+ and HIV- participants………..136
Figure 6-44: Median body mass index between the HIV+ and HIV- participants……136
Figure 6-45: Median grip strength between the HIV+ and HIV- participants………...137
Figure 6-46: Median absolute CD4 count between the HIV+ and HIV- participants…137
Figure 6-47: Gut homing CD4+ T cells between the HIV+ and HIV- participants……138
Figure 6-48: Activated gut homing CD4+ T cells between the HIV+ and HIV-
participants…………………………………………………………………………….138
Figure 6-49: Recent thymic emigrant CD4+ T cells between the HIV+ and HIV-
participants…………………………………………………………………………….139
Figure 6-50: Senescent 1 CD4+ T cells between the HIV+ and HIV- participants…....139

xxiii
Figure 6-51: Senescent 2 CD4+ T cells between the HIV+ and HIV- participants…....140
Figure 6-52: Naive CD4+ T cells between the HIV+ and HIV- participants..………...140
Figure 6-53: Central memory CD4+ T cells between the HIV+ and HIV- participants.141
Figure 6-54: Effector memory CD4+ T cells between the HIV+ and HIV-
participants…………………………………………………………………………….141
Figure 6-55: Effector CD4+ T cells between the HIV+ and HIV- participants…….…142
Figure 6-56: Proliferating and activated CD4+ T cells between the HIV+ and HIV-
participants……………………………………………………………………….…....142
Figure 6-57: Activated CD4+ T cells between the HIV+ and HIV- participants……...143
Figure 6-58: Proliferating CD4+ T cells between the HIV+ and HIV- participants.…..143
Figure 6-59: Median absolute CD8 count between the HIV+ and HIV- participants…144
Figure 6-60: Gut homing CD8+ T cells between the HIV+ and HIV- participants..…..144
Figure 6-61: Activated gut homing CD8+ T cells between the HIV+ and HIV-
participants………………………………………………………………………...…..145
Figure 6-62: Recent thymic emigrant CD8+ T cells between the HIV+ and HIV-
participants………………………………………………………………………….…145
Figure 6-63: Senescent 1 CD8+ T cells between the HIV+ and HIV- participants……146
Figure 6-64: Senescent 2 CD8+ T cells between the HIV+ and HIV- participants...….146
Figure 6-65: Naive CD8+ T cells between the HIV+ and HIV- participants.................147
Figure 6-66: Central memory CD8+ T cells between the HIV+ and HIV-
participants…………………………………………………………………………….147
Figure 6-67: Effector memory CD8+ T cells between the HIV+ and HIV-
participants…………………………………………………………………………….148
Figure 6-68: Effector CD8+ T cells between the HIV+ and HIV- participants………..148
Figure 6-69: Proliferating and activated CD8+ T cells between the HIV+ and HIV-
participants.....................................................................................................................149
Figure 6-70: Activated CD8+ T cells between the HIV+ and HIV- participants……...149
Figure 6-71: Proliferating CD8+ T cells between the HIV+ and HIV- participants.….150
xxiv
List of Abbreviations
AICD Activated Induced Cell Death
AIDS Acquired Immune Deficiency Syndrome
ART Antiretroviral Therapy
ARV Antiretroviral Drugs
BMI Body Mass Index
CCR7 C-Chemokine Receptor 7
CD Cluster of Differentiation
DAIDS Division of AIDS
DNA Deoxyribonucleic Acid
DSMB Data and safety Monitoring Board
FACS Fluorescence Activated Cell Sorter
FACS Fluorescence-Activated Cell Sorter
Fe Iron
GALT Gut Associated Lymphoid Tissue
HAART Highly Active Anti retroviral Therapy
HIV Human Immunodeficiency Virus
IRIS Immune Reconstitution Inflammatory Syndrome
LNS Lipid-based nutrient supplement
LNS-VM Lipid-based nutrient supplement with vitamins and minerals
NF-KB Nuclear factor Kappa B
NGO Non-governmental organisation
NUSTART Nutritional Support for African Adults Starting Antiretroviral Therapy
OIs Opportunistic Infections
SAEs Serious adverse events
Se Selenium
TB Tuberculosis
TCR T cell Receptor
UNAIDS United Nations Acquired Immune Deficiency Syndrome
WHO World Health Organization

Thesis outline
Caroline Cleopatra Chisenga Ph.D. Thesis
1
Thesis outline
Chapter 1 of this thesis is a brief outline and scope of the work.
Chapter 2 of this thesis outlines the main Nutritional Support for Africans Starting
Antiretroviral Therapy (NUSTART) trial and the concepts that gave birth to the sub
study.
In chapter 3, a detailed review of the literature describing the global effects of the
HIV is given. The focus in this chapter is on prevalence, pathogenesis, mortality,
coverage of antiretroviral therapy (ART) and the dynamics of the CD4+ and CD8
+ T
cell following infection. Finally, what is known about the impact of nutritional
interventions on immune reconstitution is described.
Chapter 4 set out the study justification, aims and objectives.
Chapter 5 describes the methods for analysing T cell subsets using flow cytometry
as well as statistical analysis. Other details such as gating strategies, panel design and
antibody titrations are provided in the appendices.
Chapter 6 is the results chapter. Firstly, the normal distribution of T cell subsets in
healthy Zambian volunteers is described (Cross sectional study). Secondly, a sub-
study of the NUSTART trial, including the relationship between T cell subsets and
mortality, and the impact of the nutritional intervention on T cell subsets (RCT and
retrospective studies) is described, thirdly, T cell subsets of the healthy Zambian
volunteers are compared to the HIV-infected adults in order to understand the impact
of ART plus nutritional supplementation after 3 months (Survey). Finally, the impact
of selenium on T cell subset marker expression during in vitro incubation is
described.
Chapter 7 is the discussion chapter. In this chapter, the relationship of all the studies
is explained including the strengths and limitations of each study.

Thesis outline
Caroline Cleopatra Chisenga Ph.D. Thesis
2
Chapter 8 provides the overall conclusions and future work from the studies
conducted.
Chapter 1: Introduction
Caroline Cleopatra Chisenga Ph.D. Thesis
3
Chapter 1: Introduction
Although data from previous studies show that there is CD4+ and CD8
+ T cell
depletion in HIV-infected individuals, data on how the immune system reconstitutes
is still unclear. Studies of micronutrient supplementation in HIV-infected patients
starting ART have yielded conflicting results on its effects on morbidity and
mortality. There has been little research showing the effects of micronutrients on
immune reconstitution especially in malnourished HIV-infected adults.
Therefore, this thesis describes research designed to understand;
1. The pattern of distribution for T cell subsets in a healthy population.
2. The immunological changes which occur during initiation of antiretroviral
therapy, and the impact of nutritional supplements on T cell subsets.
3. T cell recovery after ART treatment.
4. T cell responses to soluble selenium (Se) in in vitro.
Part of the work was nested in the NUSTART trial, described below, which was a
phase III randomised controlled trial of a lipid-based nutrient supplement (LNS) with
or without vitamins and minerals given during the first 12 weeks after referral for
ART. The NUSTART trial was initiated in 2010 in Lusaka Zambia at the University
Teaching Hospital and in Mwanza, Tanzania.

Chapter 2: Background
4
Caroline Cleopatra Chisenga Ph.D. Thesis
Chapter 2: Background
2.1. NUSTART main trial and sub-study overview
The work described in this thesis was a sub-study of a randomised controlled trial of
a nutritional supplement for patients initiating ART, the NUSTART trial.
NUSTART was a randomised controlled trial of a vitamin and mineral intervention
for HIV-infected adults initiating ART. Participants were recruited in Lusaka,
Zambia and Mwanza, Tanzania from August 2011 to December 2013. NUSTART
was a phase III individually randomised double blind controlled trial which
compared, in a two-stage protocol, vitamins and minerals in a lipid-based nutritional
supplement (LNS-VM) with unfortified LNS given from recruitment (referral for
ART) until 6 weeks after starting ART. In the first stage, during the first two weeks
after ART initiation, the active and control supplements were given with minimal
calories i.e. 30 g/day, 100 kcal/day, then from 2-6 weeks after ART initiation,
patients were given 250 g/day, in two 125 g sachets, comprising 1360 kcal/day in a
calorie-rich supplement. Participants in this trial were allocated to receive nutritional
supplements as shown in Table 2-1.

Chapter 2: Background
Caroline Cleopatra Chisenga Ph.D. Thesis
5
Table 2-1: Nutritional composition of trial supplements – amounts per day1,2
Nutrient First phase supplement
(from recruitment to 2
weeks of ART)
Second phase supplement
(from 2 to 6 weeks of ART)
LNS-VM
(30 g)
LNS
(30 g)
LNS-VM
(250 g)
LNS
(250 g)
Calories (kcal) 139 168 1397 1416
Protein (g) 2.4 2.3 55 55
Fat (g) 11.0 10.9 97.5 97.5
Potassium (mmol) 30 0.9 32 15.8
Phosphorus (mmol) 47 0.4 38 9.3
Magnesium (mmol) 16 0.3 17 5.7
Calcium (mg) 29.8 5.0 140 115
Iron (mg) 0.4 0.4 14.7 8.4
Zinc (mg) 21 0.2 21 3.8
Copper (mg) 3.6 0.06 3.6 1.2
Manganese (mg) 4.2 - 4.2 -
Iodine (g) 420 - 420 -
Selenium (g) 180 - 180 -
Chromium (mg) 75 - 75 -
Retinol (as
palmitate) (mg)
1800 - 1800 -
Vitamin D (g) 10 - 10 -
Vitamin E (mg) 45 - 45 -
Vitamin K (mg) 95 - 95 -
Vitamin C (mg) 120 - 120 -
Thiamin (mg) 2.4 - 2.4 -
Riboflavin (mg) 3.3 - 3.3 -
Niacin (mg) 39 - 39 -

Chapter 2: Background
Caroline Cleopatra Chisenga Ph.D. Thesis
6
Pyridoxine (mg) 3.6 - 3.6 -
Folate (mg) 600 - 600 -
Vitamin B12 (mg) 4.5 - 4.5 -
Pantothenic acid
(mg)
9 - 9 -
1Where nutrient contents are provided for both LNS and LNS-VM, these are values from
analysis by the manufacturer, accounting for inter-batch variability; where values for only
LNS-VM are given, these where not assessed in the prepared foods but refer to amounts
added, that is, they do not include those innate to the LNS.
2ART=antiretroviral therapy; LNS=lipid-based nutritional supplement, LNS-VM=LNS with
added vitamins and minerals.

Chapter 2: Background
7
Caroline Cleopatra Chisenga Ph.D. Thesis
2.1.1 NUSTART Trial Study Objectives
Primary:
To assess the effect on mortality between referral for ART and 12 weeks after
starting ART of a lipid-based nutritional calorie supplement (LNS) with additional
vitamins and minerals (LNS-VM) compared to LNS alone. Both LNS and LNS-VM
were given in two stages, with lower calories and no iron (Fe) initially, and a higher
calorie intake later to permit weight gain.
Secondary:
To determine if LNS-VM, compared to LNS alone, could:
o Decrease admissions to hospital during the study period;
o Increase body mass index (BMI) and lean body mass;
o Increase serum phosphate;
o Reduce total serious adverse events (SAE);
o Increase grip strength, a measure of functional lean body mass;
o Cause appetite to return more rapidly, enabling nutritional recovery;
o Increase adherence to ART;
o Improve immune function;
o Improve functional status and/or quality of life;
o Improve program retention;
To assess the effect of the intervention on serum electrolyte shifts and iron status
early in ART.

Chapter 2: Background
Caroline Cleopatra Chisenga Ph.D. Thesis
8
2.1.2 NUSTART Participant Eligibility, Recruitment and Location
Male and female patients were recruited from six different clinics (Chilenje,
Kanyama, Mtendere, Kamwala, Chipata and Chawama) that manage ART initiation
and support. The support staff (nurses) in various clinics confirmed eligibility using
patient HIV, CD4+ and BMI results. Eligible candidates were informed about the
study and if willing transported to University Teaching Hospital (UTH). At UTH,
participants were provided with detailed talks using the information sheet and
consent was obtained if willing to participate and interested individuals were
recorded (mobile number, house number and landmarks) and appointments for next
visits set. If a participant declined to participate, recruitment form was completed and
any reasons for not participating listed.
Inclusion criteria were:
At least 18 years old
ART-naive
BMI < 18.5 kg/m2. In the presence of clinical oedema and a BMI < 20 kg/m
2,
BMI was re-measured after loss of oedema, and the patient considered
eligible if BMI < 18.5 kg/m2 and ART had not yet been initiated
Requiring ART was determined by CD4 count < 350/L or stage 3 or 4
disease
Willing to undertake intensive ART follow-up in the study clinic
Providing written, fully informed consent (thumbprint was accepted)
Exclusion criteria was the non-fulfilment of inclusion criteria above plus:
Participation in a potentially conflicting research protocol
Pregnancy (by self-report)

Chapter 2: Background
Caroline Cleopatra Chisenga Ph.D. Thesis
9
The interventions were not expected to have any adverse effects during pregnancy.
However, the exclusion of women known to be pregnant was to avoid the changes in
anthropometry and body composition found especially in late pregnancy. Women
were also asked to exit from the trial and excluded them from body composition
analyses if they were pregnant (either by self report or after examination).
In Zambia it is policy to give a small micronutrient supplement (240 µg vitamin A,
2.5 µg vitamin D and 0.5 mg each of thiamine, riboflavin, pyridoxine and
pantothenic acid) to patients entering HIV care, whether they require ART or not.
This supplement was withheld for the period (usually <16 weeks) of the NUSTART
intervention, and re-introduced after exit from the trial. Open label pyridoxine was
given to all patients also starting TB therapy in order to prevent drug-induced
neuropathy (damage to peripheral nerves due to isoniazid). In addition, patients
(estimated < 1%) with critically low serum electrolytes (phosphate < 0.65 mmol/l,
potassium < 2.5 mmol/l, magnesium< 0.45 mmol/l) were admitted for close
observation and were given oral doses of the minerals as required according to a
standard algorithm.
2.1.3 Assessment for Adherence
Adherence to both LNS-VM and LNS was monitored by questionnaires at all visits
and by asking participants to keep empty LNS packages and bring them to their next
clinic visit. All participants were given dietary advice to increase their caloric intake
and to eat a variety of foods to provide micronutrients. Those too poor to afford such
foods were referred to the ART and food security program in Zambia and to local
services such as non-governmental organisations (NGOs) and church groups that
support HIV-affected families.
Chapter 2: Background
Caroline Cleopatra Chisenga Ph.D. Thesis
10
2.1.4 Randomization and Blinding
Randomization was in blocks of 16 and stratified by country with a separate
computer-generated randomization list for each country. The statistician from the
Data Safety and Monitoring Board generated and held the code. Two codes were
prepared: (1) an allocation code (letters A to H) indicating the contents of the
packets (intervention vs. control) known only to the producer and the DSMB
statistician, and (2) a randomization code related to study ID numbers and held by
the DSMB statistician and study pharmacists. The manufacturer (Nutriset SA,
Malaunay, France) supplied nutriset satches labelled with the allocation code. The
clinic pharmacists further labelled packets with study ID numbers when dispensing.
Participants were given sequential IDs (within clinics) after having signed consent
forms and completed baseline assessments.
2.1.5 Clinical Outcomes
Before initiating ART, as part of routine care, patients were screened, commenced on
treatment for opportunistic infections, and counselled regarding lifelong treatment
adherence. During this pre-ART period, the first stage study interventions were
introduced. Medical care was provided primarily by local health services though
study staff treated and referred as necessary during patients’ study visits. Patients
were seen weekly from referral for ART for 2 weeks, then optional weekly visits
until the ART initiation visit, then at 2, 6, 8, and 12 weeks after starting ART.
Additional optional visits were available at 1 and 4 weeks after ART initiation and
patients who were ill came for unscheduled visits at any time. In addition to standard
medical care, other tests done were as summarized in Table 2-2 below.

Chapter 2: Background
Caroline Cleopatra Chisenga Ph.D. Thesis
11
Table 2-2: Summary of study tests
Consent Baseline Pre-ART ART
Time
(weeks)
N/A 0 1 2 (3) ... 0 (1) 2 (4) 6 8 12
Nutritional
intervention
x x x x x x x x x x
Weight x x x x x x x x x x x x
CD4 count x x
Haemoglobin x x

Chapter 2: Background
Caroline Cleopatra Chisenga Ph.D. Thesis
12
Some visits were optional, and patients decided to attend if they chose to; these are
denoted in brackets.
Information sheet
On the information sheet, participants’ characteristics were filled in as follows;
a) Sex
b) Age
c) Weight
d) Height
e) Education
f) Occupation
g) Marital status
Ascertainment of outcome and follow-up
The primary endpoint for the main NUSTART trial was mortality between the time of
recruitment (referral for ART) and 12 weeks after starting ART. NUSTART study
participants were followed up weekly before starting ART and at weeks 2, 4, 6, 8 and
12 after ART initiation. Whether the patient was still alive, and the dates of death if not,
were ascertained by phone contact or home visit if the patient failed to return to the next
scheduled visit.
2.1.6 Ethics
Ethical approval was obtained from the research ethics committee of the London School
of Hygiene and Tropical Medicine, the University of Zambia Biomedical Research
Ethics Committee (refer to appendix 6 and 7), and the Medical Research Coordinating

Chapter 2: Background
Caroline Cleopatra Chisenga Ph.D. Thesis
13
Committee of NIMR, Tanzania. The NUSTART trial was registered as
PACTR201106000300631. Funding was provided for the NUSTART trial by the
European and Developing Countries Clinical Trials Partnership grant #
IP.2009.33011.004. All participants provided written or thumbprint informed consent.
Medical care of patients was according to national guidelines and provided through the
local health services. Patients with low levels of serum electrolytes according to
Division of AIDS (DAIDS) criteria were provided appropriate electrolyte therapy.
2.2 Sub-study overview
The sub-study was designed to explore the effects of the nutritional supplement on
absolute CD4+ and CD8
+ T cells and their subsets, and also to determine whether an
association exists between CD4+ and CD8
+ T cell subsets and mortality.
2.3 Hypothesis tested in this sub-study
Combined lipid-based nutritional supplementation with added minerals and vitamins
(LNS-VM) is associated with improved early (12 week) absolute CD4+ and CD8
+ T cell
reconstitution and their subsets among malnourished HIV-infected adults starting ART
compared to a lipid-based supplement (LNS) alone.

Chapter 3: Literature review
Caroline Cleopatra Chisenga Ph.D. Thesis
14
Chapter 3: Literature Review
3.1 Human Immunodeficiency Virus
Human Immunodeficiency Virus (HIV) is a lentivirus that belongs to the family of
retroviruses. About 75% of the HIV-infections worldwide are transmitted via sexual
intercourse (Quinn, 1996). In humans, HIV infects immune cells like CD4+ T cells,
macrophages and dendritic cells. The first case of acquired immunodeficiency
syndrome (AIDS) was reported in 1981 (Dehne et al., 1992). Two types of HIV (HIV-1
and HIV-2) exist and both are known to infect humans. Of the two, HIV-1 is widely
distributed whereas; HIV-2 is almost entirely restricted to West Africa (Schim and
Aaby, 1999).
The major contributor to increased susceptibility to infectious disease during HIV-
infection is a lowered CD4 cell count due to destruction by the HIV (Dunham et al.,
2008). Delayed treatment often result in depletion of these immune cells (CD4+), and
ultimately in AIDS, which is characterised by the development of opportunistic
infections and tumours (Quagliarello, 1982).
About 0.8% of adults aged 15–49 years worldwide are infected with HIV, with Sub-
Saharan Africa being most severely affected as shown in Figure 3-1 (WHO, 2013).
Figure 3-1: HIV prevalence (WHO, 2013)
Chapter 3: Literature review
Caroline Cleopatra Chisenga Ph.D. Thesis
15
About 35 million people are living with HIV globally (WHO, 2013).
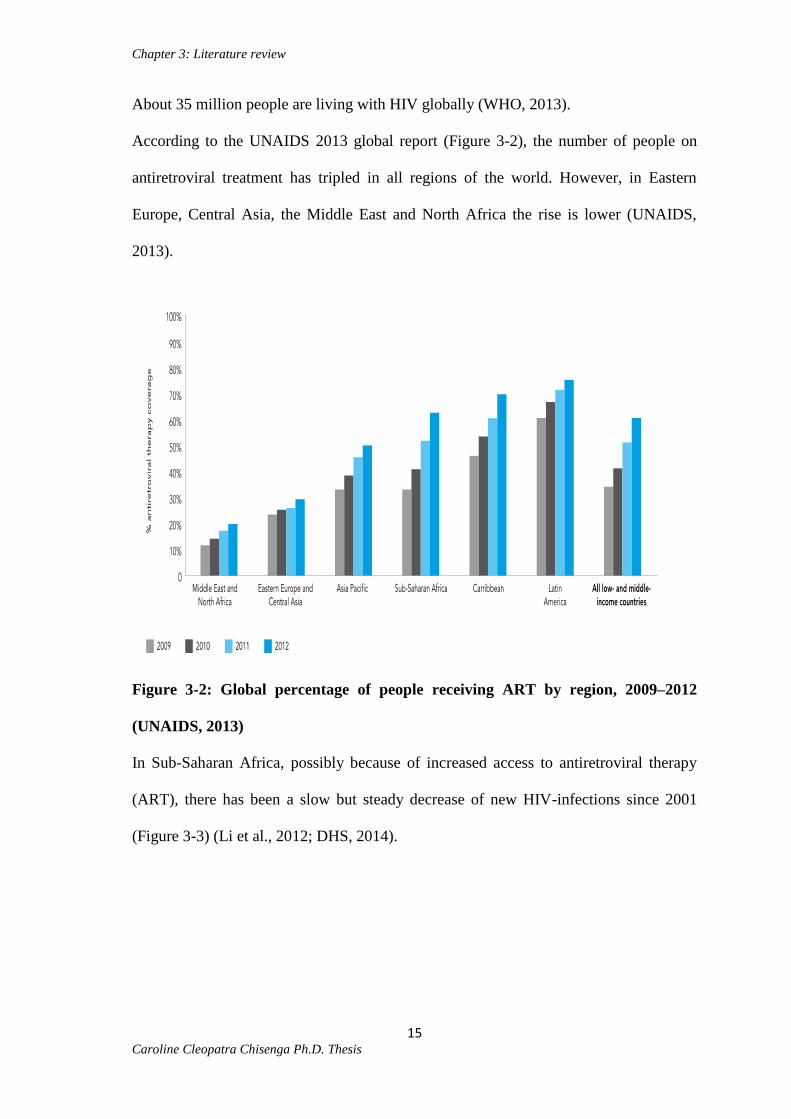
According to the UNAIDS 2013 global report (Figure 3-2), the number of people on
antiretroviral treatment has tripled in all regions of the world. However, in Eastern
Europe, Central Asia, the Middle East and North Africa the rise is lower (UNAIDS,
2013).
Figure 3-2: Global percentage of people receiving ART by region, 2009–2012
(UNAIDS, 2013)
In Sub-Saharan Africa, possibly because of increased access to antiretroviral therapy
(ART), there has been a slow but steady decrease of new HIV-infections since 2001
(Figure 3-3) (Li et al., 2012; DHS, 2014).

Chapter 3: Literature review
Caroline Cleopatra Chisenga Ph.D. Thesis
16
Figure 3-3: Global new HIV infections (UNAIDS, 2013).
HIV/AIDS related mortality remains a leading global cause of mortality (Ortblad et al.,
2013) (Figure 3-4). However this picture is changing with the scale-up of ART.
Figure 3-4: Global HIV/AIDS death from 1980-2010 (Ortblad et al., 2013)
There has been a decline in the annual number of AIDS-related deaths in people
receiving ART, from a high of 2.3 (2.1–2.6) million in 2005, to 1.6 (1.4–1.9) million
(Figure 3-5) in 2012 (UNAIDS, 2013).

Chapter 3: Literature review
Caroline Cleopatra Chisenga Ph.D. Thesis
17
Figure 3-5: Estimated numbers of AIDS-related deaths, with and without
antiretroviral therapy, in low and middle-income countries 1995–2012 (UNAIDS,
2013)
3.2 Lymphocyte Development
Lymphocytes differentiate from stem cells in the bone marrow (Figure 3-6). B cells
develop entirely in the bone marrow. T cells mature in the thymus (located above the
heart) (Janeway et al., 2001).
Figure 3-6: Lymphocyte development gotten from
http://bio1152.nicerweb.com/Locked/media/ch43/43_10LymphocyteDevelop_L.jpg
Chapter 3: Literature review
Caroline Cleopatra Chisenga Ph.D. Thesis
18
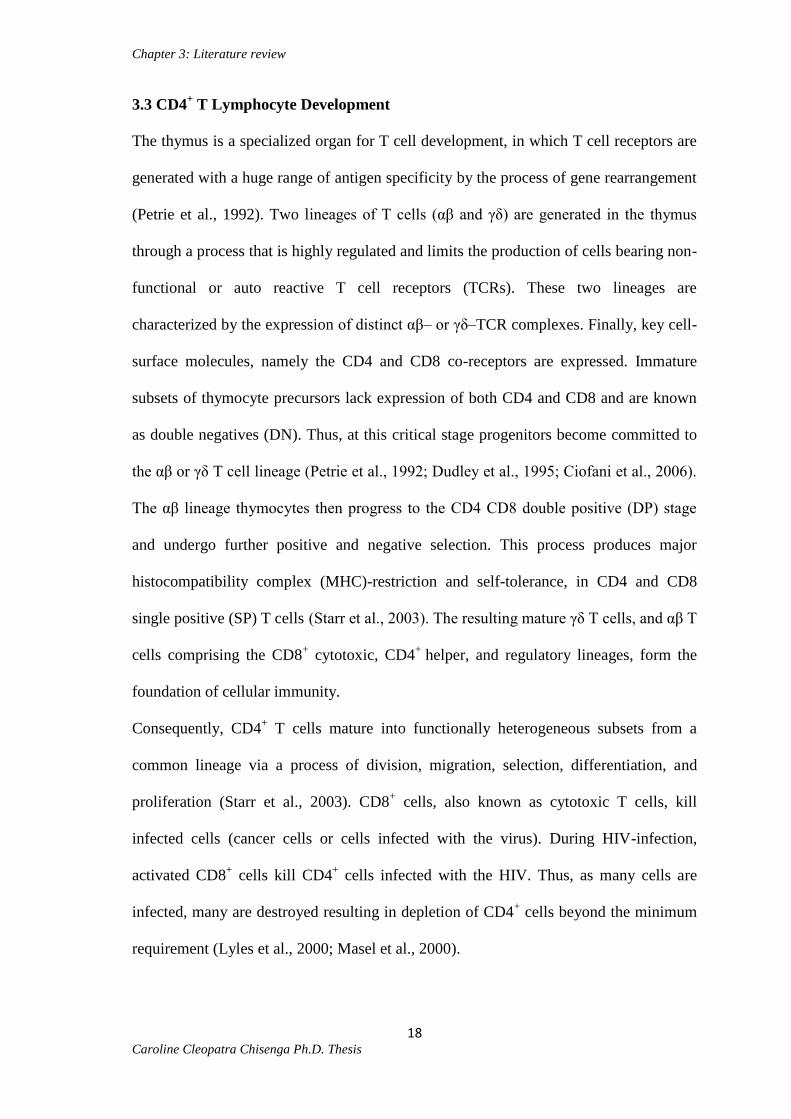
3.3 CD4+ T Lymphocyte Development
The thymus is a specialized organ for T cell development, in which T cell receptors are
generated with a huge range of antigen specificity by the process of gene rearrangement
(Petrie et al., 1992). Two lineages of T cells (αβ and γδ) are generated in the thymus
through a process that is highly regulated and limits the production of cells bearing non-
functional or auto reactive T cell receptors (TCRs). These two lineages are
characterized by the expression of distinct αβ– or γδ–TCR complexes. Finally, key cell-
surface molecules, namely the CD4 and CD8 co-receptors are expressed. Immature
subsets of thymocyte precursors lack expression of both CD4 and CD8 and are known
as double negatives (DN). Thus, at this critical stage progenitors become committed to
the αβ or γδ T cell lineage (Petrie et al., 1992; Dudley et al., 1995; Ciofani et al., 2006).
The αβ lineage thymocytes then progress to the CD4 CD8 double positive (DP) stage
and undergo further positive and negative selection. This process produces major
histocompatibility complex (MHC)-restriction and self-tolerance, in CD4 and CD8
single positive (SP) T cells (Starr et al., 2003). The resulting mature γδ T cells, and αβ T
cells comprising the CD8+ cytotoxic, CD4
+ helper, and regulatory lineages, form the
foundation of cellular immunity.
Consequently, CD4+ T cells mature into functionally heterogeneous subsets from a
common lineage via a process of division, migration, selection, differentiation, and
proliferation (Starr et al., 2003). CD8+ cells, also known as cytotoxic T cells, kill
infected cells (cancer cells or cells infected with the virus). During HIV-infection,
activated CD8+ cells kill CD4
+ cells infected with the HIV. Thus, as many cells are
infected, many are destroyed resulting in depletion of CD4+ cells beyond the minimum
requirement (Lyles et al., 2000; Masel et al., 2000).

Chapter 3: Literature review
Caroline Cleopatra Chisenga Ph.D. Thesis
19
Figure 3-7: CD4+ T lymphocyte development (source:
https://mynotebook.labarchives.com)
3.4 HIV Immunopathogenesis
HIV-1 usually gains entry to its human host by crossing mucosal surfaces (Quinn, 1996)
and subsequently disseminates throughout the lymphatic tissues (LTs). LTs are
reservoirs where the virus is produced and stored throughout the long course of
infection (Tenner-Racz et al., 1988; Parmentier, et al., 1990; Embretson, et al., 1993).
Following infection, HIV infects and replicates in the vaginal or rectal memory T cells
expressing CD4+ and CCR5
+ markers (Mogensen et al., 2010). Highest depletion of
CD4+ and CCR5
+ cells occurs in the gut associated lymphoid tissue (GALT) where the
majority of these cells reside. Throughout the course of infection, CD4+ T cell count in
blood slowly decreases, and at the AIDS-defining level of 200 cells/μL, opportunistic
tumours and infections (OIs) appear that eventually claim the lives of most infected
individuals (Pantaleo, et al., 1993).
Progression to AIDS and death is correlated with the amount of viral RNA in the blood

Chapter 3: Literature review
Caroline Cleopatra Chisenga Ph.D. Thesis
20
stream (Mellors, et al., 1996), which in turn reflects virus production in LT (Haase, et
al., 1996). Increased HIV replication leads to immune cell activation and is directly
proportional to the viral load. Hyper-activation is denoted by expression of activation
markers (CD38 and HLA-DR) on T cells (Mogensen et al., 2010). Additionally,
bacterial products (such as lipopolysaccharide) entering the blood system from a
compromised GALT during HIV-infection also contribute to a continuous immune
activation shown by the red line in Figure 3-8 (Mogensen et al., 2010). Highly active
antiretroviral therapy (HAART) has also contributed to persistent immune activation
due to virus latency, in that latently infected cells might lead to the regeneration and
maintenance of the viral reservoir without cell death (Tyagi and Bukrinsky, 2012).
Figure 3-8: HIV pathogenesis (Mogensen et al., 2010)
The biggest current challenge is failure of ART to eradicate the virus. Even when the
virus is suppressed to undetectable levels for many years, it quickly re-emerges if the
treatment is stopped (Chomont et al. 2009).

Chapter 3: Literature review
Caroline Cleopatra Chisenga Ph.D. Thesis
21
The memory CD4+
T lymphocytes are the main reservoirs of latent HIV. These cells
harbour a set of integrated proviruses that are unable to complete their lifecycle because
of the lack of suitable conditions and are called latent or “transiently silent” proviruses
(Siliciano et al., 2003; Siliciano et al., 2011).
Latent proviruses are well protected from antiretroviral therapies that target actively
replicating viruses, and from the host’s immune system, which fails to differentiate
infected cells from uninfected cells due to the lack of viral activity in latently infected
cells (Pierson et al., 2000). These hibernating latent proviruses wait for favourable
conditions and consequently are the source of replication-competent viruses (Tyagi and
Bukrinsky, 2012).
Evidence from Brenchley and Douek confirm another potential mechanism that could
be central in HIV pathogenesis by the activation of the innate immune system
(Brenchley and Douek 2006). Massive depletion of CD4+ T cells (and perhaps
macrophages and dendritic cells) by HIV-1 in mucosal lymphoid tissues result in
disruption of the different immune components constituting the mucosal barrier in the
gut. This barrier prevents the translocation of intestinal flora and confines pathogens to
the lamina propia and the mesenteric lymph nodes. Compromising the integrity of the
gut often results in microbial translocation to the systemic immune system (Brenchley
and Douek, 2006). Previous studies also report that HIV-1-infection is associated with a
significant increase of plasma lipopolysaccharide (LPS) levels, an indicator of microbial
translocation, which is directly correlated with immune activation (Brenchley and
Douek, 2006). Thus, bacterial translocation may result in an overwhelming activation of
the innate immune response.
Activation of T cells also increases intracellular nuclear factor kappa B (NF-B) levels.
NF-B enhances the transcription of integrated virus and, therefore, the production of

Chapter 3: Literature review
Caroline Cleopatra Chisenga Ph.D. Thesis
22
new virions that infect new targets (Kawakami et al., 1988). It is therefore essential to
understand that the consequence of immune activation in HIV-infection goes far beyond
the simple loss of virus-specific CD4+ T cells and extends to a global decline of the
immune resources.
HIV-infection also results in a deregulation of haematopoiesis (lower numbers of
progenitor cells and decline in their ability to generate new cells) (Marandin et al.,
1996; Jenkins et al., 1998; Moses et al., 1998). The capability of the thymus to
manufacture new fully differentiated (CD27+, CD28
+, CCR7
+ and CD45RA
+) cells is
reduced significantly in HIV-infected individuals (Douek et al., 1998). This could be as
a result of several reasons such as the direct infection of the thymic stroma and
thymocytes by HIV (Schnittman et al., 1990; Stanley et al., 1993) and the atrophy of the
thymus in HIV-infected subjects, which is similar to age-related ‘thymic involution’
(Kalayjian et al., 2003) and is associated with thymosuppressive effects of
proinflammatory cytokines such as IL-6 (Sempowski et al., 2000; Linton et al., 2004).
Hence, it is clear that HIV research activities are progressively enabling researchers to
understand the sophisticated mechanisms that link HIV-infection to the onset of
immunodeficiency. The infection and depletion of CD4+ and CD8
+ T cells represent the
most fundamental events in HIV-infection. However, in recent years, the role-played by
chronic immune activation and surface marker expression during HIV pathogenesis is
becoming increasingly apparent. Paradoxically, immune activation markers are directly
linked to HIV disease progression.

Chapter 3: Literature review
Caroline Cleopatra Chisenga Ph.D. Thesis
23
3.5 CD4+ T cell Dynamics During HIV-Infection
Since CD4+ cells and their subsets are the target cells of the HIV, their loss, exceeding
replacement, leads to T cell deficiency (Ho et al., 1995; Wei et al., 1995; Dunham et al.,
2008). The peripheral blood CD4 count is therefore, a very useful marker of the severity
of HIV-related immune dysfunction, and there is extensive literature on the relationship
between CD4 cell counts and morbidity and mortality in HIV-infection. However, the
proportionate losses of T cell subsets, which bear specific cell surface markers, have not
been thoroughly studied. The following section describes the cell surface markers that
are relevant to the work in this thesis.
3.5.1 Ki67
Ki67 is a nuclear antigen that is expressed exclusively by cells that are in cell cycle and
is frequently used as a surrogate marker for T cell proliferation. Ki67 expression
increases in late G1 phase of the cell cycle and remains elevated throughout mitosis
(Gerdes, et al., 1984). Although the function of Ki67 is not entirely defined, Ki67
molecules expression may be important for cellular proliferation and survival.
Ki67 is not expressed in resting cells and, therefore, makes this molecule a suitable
marker of cell cycle progression. Ki67 expression among naïve CD4+ T cells from HIV-
infected individuals demonstrates that naïve CD4+ T cells from HIV-infected patients
have qualitative defects in cell cycle progression (Sieg, et al., 2003). Rapid turn over of
the Ki67 marker on T cells indicates increased immune activation and if it is in HIV
infected individuals, increased virus (Zack et al., 1990; Bukrinsky et al., 1991).

Chapter 3: Literature review
Caroline Cleopatra Chisenga Ph.D. Thesis
24
3.5.2 Cluster of Differentiation 31
The HIV is known to cause thymic T cell production impairment and a sustained
immune activation (Mackall et al., 1995; Hellerstein et al., 2003; Hakim et al., 2005;
Lee et al., 2006). The thymus is the site of T cell development, producing a variety of T
cells including natural T-regulatory cells, and naïve T cells. Cluster of differentiation 31
(CD31), also known as platelet endothelial cell adhesion molecule-1 (PECAM-1) is
expressed on T cells, platelets, monocytes, granulocytes and endothelial cells. It can
mediate T cell adhesion and inhibit T cell activation (Tanaskovic et al., 2010). CD31
expression on CD4+ T cells seems to indicate recent thymic emigrants (Nickel et al.,
2005; Bofill et al., 2006). Naïve CD45RA+
T cells co-expressing CD31 (a sure recent
thymic emigrant definition) have a higher T cell receptor excision circles (TREC)
content than CD45RA+
cells lacking CD31 expression (Kimmig et al., 2002; Junge et
al., 2007).
Figure 3-9: Post thymic development of CD4+ T cells (Kohler and Thiel 2009)
CD31 expression on CD4+ T cells is lost after repetitive TCR stimulation in vitro
(Stockinger et al., 1992; Demeure et al., 1996) and so may also be lost after post-thymic
peripheral expansion. Most CD8 cells express CD31 as such; expression of CD31 is
relatively high on CD8+ T cells compared to CD4
+ T cells (Stockinger, et al., 1992).

Chapter 3: Literature review
Caroline Cleopatra Chisenga Ph.D. Thesis
25
3.5.3 CD45RA
CD45 is a protein tyrosine phosphatase regulating src-family kinases, and is expressed
on all hematopoietic cells. CD45 can be expressed as one of several isoforms by
alternative splicing of exons that comprise the extracellular domain. CD45RA is
expressed on naïve T cells, as well as the effector cells in both CD4 and CD8. After
antigen experience, central and effector memory T cells gain expression of CD45RO
and lose expression of CD45RA (Sanders et al., 1988). Thus, either CD45RA or
CD45RO is used to generally differentiate the naive from memory populations (Sanders
et al., 1988).
CD45 is also highly glycosylated and naïve T lymphocytes express large CD45
isoforms and are usually positive for CD45RA. CD45RA is found on naïve T cells and
CD45RO is located on memory T cells (Murphy, 2012). During early HIV-infection,
there is a reduction in naïve CD4+ T cells (CD45RA
+), which are progressively depleted
because of their frequent activation and differentiation into memory cells caused by
chronic and high antigenic stimulation (Bandera et al., 2010). This increase in
proliferating CD4+ T cells correlates with high viral load (Koopman et al., 2009).
3.5.4 CC-Chemokine Receptor 7
Chemokines are key controllers of leukocyte trafficking (Murphy 2012). The expression
of most chemokines is induced during infection and inflammation (Forster et al., 2008).
Certain chemokines, including CC-chemokine ligand CCL19 and CCL21 are
constitutively expressed and control cell movement during homeostasis (Rot et al.,
2004). CCL19 and CCL21 are ligands for the CC-Chemokine Receptor 7 (CCR7) that
are expressed by various subsets of immune cells (Rot et al., 2004). CCR7 and its
ligands are involved in homing of various subpopulations of T cells and antigen-

Chapter 3: Literature review
Caroline Cleopatra Chisenga Ph.D. Thesis
26
presenting dendritic cells (DCs) to the lymph nodes. For example, CCL19 and CCL21
have been shown to increase the permissiveness of human resting memory CD4+ T cells
to HIV-1-infection (Rot et al., 2004). Although an interaction of different subsets of the
immune and non-immune cells is required for efficient functioning (i.e. the ability of
the cells to actively migrate to and within tissues) of the immune system.
3.5.5 Human Lymphocyte Antigen Class II
Human Lymphocyte Antigen Class II (HLA-DR) is a glycosylated cell surface
transmembrane protein expressed on antigen-presenting cells and constitutively
expressed on monocytes. Expression of HLA-DR by monocytes is essential for the
presentation of peptides to CD4 positive T cells for initiating a specific immune
response (Perry et al., 2004). Expression of HLA-DR on T cells is a marker of
activation. Expression of HLA-DR on CD4+ T cells is increased in HIV-positive
individuals and becomes relatively more important marker with progression from the
asymptomatic to the symptomatic disease stage (Kestens et al., 1994).
3.5.6 Alpha4 and Beta7 Integrins
The HIV enters into latency (a state of reversibly nonproductive infection of individual
cells) during ART (Siliciano and Greene, 2011). However, replication continues in the
gastrointestinal tract (GIT) and CD4 cells are depleted continually in this site
(Brenchley et al., 2008; Hed et al., 2010). The body compensates this with the help of
gut homing receptors (α4 and β7). T cells express several integrin family members that
are involved in activation, trafficking, and retention in tissue (DeNucci et al., 2010).
The α4 integrin on T cells associates with either the β1 subunit, to form α4β1 integrin,
or the β7 subunit, to form α4β7 integrin. Both α4β1 and α4β7 are expressed at low
Chapter 3: Literature review
Caroline Cleopatra Chisenga Ph.D. Thesis
27
levels on naïve T cells (DeNucci et al., 2010). Lymphocyte migration to the intestine is
through interaction of α4β7 with the mucosal addressin cell adhesion molecule-1
(MAdCAM-1), which is predominantly expressed on venules in the GALT and
intestinal lamina propria (Berlin et al., 1995). Recent evidence also shows that HIV-1
gp120 binds and signals through α4β7 (Wang et al., 2009).
3.5.7 Cluster of Differentiation 25 IL-2R (Activation)
CD25 is a type I transmembrane protein present on activated T cells. In this study,
CD25 was used as a marker of activation when HLA-DR could not be used due to
fluorochrome overlap.
3.5.8 Cluster of Differentiation 57
HIV-infection is characterized by a generalized state of immune activation that is
believed to play the predominant role in immunopathogenesis, aside from the overall
depletion of CD4 T cells and breakdown of T cell homeostasis (Paiardini et al., 2013).
This uncontrolled state of immune activation perturbs the proliferative capacity of T
cells, and leads to increased expression of the phenotypic marker of senescence CD57
(Mojumdar et al., 2011).
CD57 is a terminally sulphated glycan carbohydrate that is commonly expressed on T
cells in persons with chronic immune activation. CD4+ T cell lymphocytes that are
CD57+ have generally undergone more rounds of cell division (replicative senescence)
compared with CD57- memory T cells. Expression of CD57 correlates with T cells
susceptible to activation-induced cell death (AICD) (Tarazona et al., 2000). AICD is a
homeostatic mechanism that eliminates hyper activated cells from the sites of an
immune response thereby limiting immune pathology (Prado-Garcia, et al., 2012). It is

Chapter 3: Literature review
Caroline Cleopatra Chisenga Ph.D. Thesis
28
mediated by pro-apoptotic genes (FasL/Fas) interactions after persistent TCR-
engagement, which provokes T cells to kill each other and themselves (Mak and
Saunders, 2006). Through this mechanism, exhausted (CD28-CD57
+CD4
+) T cells are
eliminated (Prado-Garcia, et al., 2012) as shown in Figure 3-10.
Figure 3-10: Summary of activation induced cell death (https://encrypted-
tbn3.gstatic.com/images)
Furthermore, although CD57+CD4
+ T cells are capable of producing IFN-, they are not
able to proliferate in response to cognate peptide (Brenchley et al., 2003). Thus, CD57+
T cells may not be “end-stage” effector T cells incapable of proliferation but may
represent a highly differentiated subset of T cells capable of rapid (CD8+CD57
+) cell
division, cytotoxicity, and IFN- production, as well as secretion of IL-5 (Chong, et al.,
2008). During infection, CD57 phenotypic marker identifies T cell subpopulations and
proportions that are distorted or ageing (Mojumdar et al., 2011). Previously, it has been
reported that activation and inflammation due to HIV-infection generate an accelerated
replicative senescence of T cells (Appay et al., 2007; Appay and Sauce, 2008;

Chapter 3: Literature review
Caroline Cleopatra Chisenga Ph.D. Thesis
29
Mojumdar et al., 2011; Mendez-Lagares et al., 2013). Hence CD57 is used as an
immunosenescence marker to identify late stage subsets lacking proliferative
capabilities.
3.5.9 Cluster of differentiation 28
CD28 is a glycoprotein expressed on both resting and activated T cells, on almost all
CD4+ and on at least half of the CD8
+ T cells in humans (Mak and Saunders, 2006).
HIV disease also leads to a profound depletion of CD4+ cells co-expressing CD28
(Choremi-Papadopoulou et al., 2000). Absence of CD28 expression on T cells has
functional consequences since CD28 is the primary co-stimulatory molecule for naïve T
cells (Frauwirth and Thompson 2002; Ostrowski et al., 2003), which, upon engagement,
enhances long-term T cell survival and prevents anergy induction (Chambers et al.,
1999). Upon binding of the peptide major histocompatibility complex (pMHC) to the
TCR, CD28 expression is up regulated on the T cell. The interaction of CD28 and its
ligands is critical for antigen-induced T cell activation. Studies have demonstrated the
existence of at least two members of the B7 receptor family that provide co-stimulatory
signals: CD80 (B7-1) mice and CD86 (B7-2) mice. This interaction pushes cells from a
resting state to enter the cell cycle. Studies have also shown that CD28 is essential for
Treg development in the thymus and for Treg survival and homeostasis in the periphery
(Tang et al., 2003; Tai et al., 2005).
Thus, lack of a potent co-stimulation (CD28) leads to lack of Tregs, which are the most
effective mediators of self-tolerance (Guo et al., 2008).

Chapter 3: Literature review
Caroline Cleopatra Chisenga Ph.D. Thesis
30
3.5.10 Cluster of Differentiation 27
CD27 is expressed on the majority of resting CD4+ and CD8
+ T cells in the peripheral
blood and also appears to have a costimulatory role (Mak and Saunders, 2006). It is a
member of the tumor necrosis factor receptor (TNF-R) superfamily and is expressed on
T, B, and NK cells as a disulfide-linked homodimer. The CD27 ligand (CD70) belongs
to the TNF superfamily and is expressed on the surface of activated T and B cells.
Interaction of CD27 on a T cell and CD70 on a B cell enhances T cell activation and
proliferation (Akiba et al., 1998). This in turn leads to the secretion of low amounts of
IL-2.
3.5.11 7-Amino-Actinomycin D
Evaluation of cell viability is essential during HIV-infection. 7-Amino-Actinomycin D
(7-AAD) is a fluorescent label for dead cells. It is excluded from live cells but
penetrates dead or damaged cells to label DNA. Thus, using 7-AAD, the amount of
dead (non viable) CD4+ T cell populations in blood circulation can be identified.
Accumulation of dead cells in blood circulation may be due to delayed elimination by
phagocytic cells or the HIV increasing the level of cellular proteins, which prompt Fas-
mediated apoptosis (Alimonti et al., 2003).
Finally, the summary of all monoclonal antibodies used and the populations of cells
identifiable with these markers are as summarised in Table 3-1 below.

Chapter 3: Literature review
Caroline Cleopatra Chisenga Ph.D. Thesis
31
Table 3-1: Summary of antibodies and populations of cells

Chapter 3: Literature review
Caroline Cleopatra Chisenga Ph.D. Thesis
32
3.6 CD4 counts in healthy adults
Studies that have been conducted in Africa shows that CD4 counts vary in healthy
individuals. This variation could be due to several predisposing factors, which are
beyond the scope of this thesis to delve in. However, a few studies reviewed are
summarized in Table 3-2 below.
Table 3-2: Mean CD4 counts in HIV-negative African population
First author/Country Population
sampled
Number Mean CD4 cell
count
Tsegaye 1999, Ethiopia Healthy adults 142 775 +/- 225
Taylor 1991, Nigeria Healthy adults 183 828 +/- 203
Crampin 2011, Malawi Healthy adults 214 863 +/- 353
Ricard 1994, Guinea Bissau Healthy adults 133 892 +/- 107
Menard 2003, Central African
Republic
Healthy men M 68
F 82
927 +/- 349
940 +/- 291
Levin 1996, Tanzania Healthy adults 147 968 +/-
Tugume 1995, Uganda Healthy adults 183 1256 +/-
Mair 2007, Senegal Healthy adults 850 870+/-
3.7 ART and Immune Reconstitution Inflammatory Syndrome
Many people run a serious risk of suffering from Immune Reconstitution Inflammatory
Syndrome (SE) if not properly managed after ART initiation (French and Colebunders,
2008). ART initiation in HIV-infected patients leads to recovery of CD4+ T cell
numbers and restoration of protective immune responses against a wide variety of
pathogens, resulting in reduction in the frequency of opportunistic infections and
prolonged survival (Murdoch et al., 2008). However, in a subset of patients,
dysregulated immune response after initiation of ART leads to the phenomenon of IRIS
(Antoneli et al., 2010). The paradoxical hallmark of the syndrome is worsening of an
existing infection or disease process or appearance of a new infection/disease process
soon after initiation of therapy. Reported risk factors for developing IRIS include the

Chapter 3: Literature review
Caroline Cleopatra Chisenga Ph.D. Thesis
33
rapid decline in viral load especially during the first three months of ART, low baseline
CD4 count, rapid increase after ART initiation and initiation of ART soon after start of
treatment for opportunistic infection (OI) (Shelburne et al., 2005; Antoneli et al., 2010).
3.8 Malnutrition in HIV
One of the common symptoms responsible for malnutrition in an HIV-infected person is
reduced appetite, which could be due to difficulty with ingesting food as a result of
infections like oral thrush or oesophagitis caused by Candida, a common opportunistic
infection in HIV-infected people and fever, side effects of medicines, or depression
(Kelly et al., 2004). Poor absorption of nutrients may be due to accompanying diarrhoea
caused by bacterial infections like Salmonella or Mycobacterium avium intracellulare;
viral like cytomegalovirus or parasitic infections like Giardia, Cryptosporidium
parvum, and Enterocytozoon bieneusi; due to nausea/vomiting as a side effect of
medications used to treat HIV or opportunistic infections. About 30–50% of HIV-
infected patients in developed and nearly 90% in developing countries complain of
diarrhoea and malabsorption (Smith et al., 1992). The GIT is the largest lymphoid organ
in the body and is directly affected by HIV-infection. HIV causes damage to the
intestinal cells through activation of T cells, which lead to villus flattening, reduced
surface area for absorption, and enterocyte damage (Kelly et al., 2004). This can be
measured as decreased D-xylose absorption (Kelly et al, 2004), and absorption of
micronutrients is likely to be reduced, though this has only occasionally been measured.
Fat malabsorption reduces availability of fat-soluble vitamins like vitamins A and E to
immune cells, and these are important for proper functioning of the immune system.
Nutrient requirements are increased during fever and infections that accompany HIV-
infection, but the body utilizes them poorly and excretion is increased during

Chapter 3: Literature review
Caroline Cleopatra Chisenga Ph.D. Thesis
34
inflammation (particularly vitamin A and zinc). The combination of reduced intake due
to anorexia, malabsorption, and increased resting energy expenditure leads to loss of
weight and lean muscle tissue (Macallan et al, 1995). In their study, Kelly and
colleagues comment that anaemia causes lethargy, further reduces food intake and
nutrient absorption, and also causes disruption of metabolism, chronic infections,
muscle wasting, or loss in lean body tissue (Kelly et al, 1997). AIDS-related dementia
or neuropsychiatric impairment may make the patients unable to care for themselves,
forget to eat, or unable to prepare balanced meals. Even in households with HIV-
infected members, nutritional impacts can be seen if the infected adult becomes too sick
to work and provide food for themselves and their families (Bijlsma 2000; Piwoz and
preble 2000). Dietary intake also varies inversely with intensity of the virus, suggesting
that viral replication directly or indirectly suppresses appetite (Arpadi, 2005).
Malnutrition is frequent and is considered a marker for poor prognosis among HIV-
infected subjects (Suttmann, 1995). Malnutrition and HIV-related immunosuppression
form a vicious cycle and ultimately reduces the immunity of the patient.
There is abundant evidence that HIV causes reduced numbers of circulating CD4 cells,
but the evidence that malnutrition causes reduced CD4 cell counts is much less
convincing. Clear evidence that malnutrition causes reduced T-lymphocyte numbers
(Chandra 1999) has been discredited as fraudulent (Stephens and Avenell, 2006).
However there is other evidence of delayed cutaneous sensitivity and reduced
bactericidal properties (Beisel, 1996), and impaired serological response after
immunizations. Guarino and colleagues reported that approximately 30 to 60% of
asymptomatic children infected with HIV malabsorb carbohydrates, 30% malabsorb fat,
and 32% malabsorb proteins (Guarino et al., 1993).
Whereas micronutrient deficiencies may affect replication of the invading virus, they
Chapter 3: Literature review
Caroline Cleopatra Chisenga Ph.D. Thesis
35
also induce several metabolic alterations in the body, i.e. changes in whole-body protein
turnover, increased urinary nitrogen loss, elevated hepatic protein synthesis, increased
skeletal muscle breakdown providing for proliferation of neutrophils, lymphocytes, and
fibroblasts, and for synthesis of immunoglobulins and hepatic acute phase proteins,
manifesting clinically as fever (Duggal et a., 2012). It also includes
hypertriglyceridaemia, elevated hepatic de novo fatty acid synthesis, decreased
peripheral lipoprotein lipase activity, hyperglycaemia, insulin resistance, and increased
gluconeogenesis. Serum concentrations of iron and zinc fall dramatically due to
redistribution within the body, with accumulation in the liver (Friis and Michaelsen,
1998). Glutathione, which is the principle intra-cellular antioxidant, was reported to
have been reduced in children with HIV-infection, especially those showing growth
failure (Rodriguez et al., 1998).
During infection, reactive oxygen molecules and prooxidant cytokines are released from
activated phagocytes (Schwarz, 1996) leading to increased consumption of vitamins
like E, C, and β-carotene which serve as antioxidants and of minerals like zinc, copper,
manganese, and selenium, which serve as components of antioxidant enzymes
(Bendich, 1990). Deficiencies of antioxidants cause increased oxidative stress which
leads to apoptosis of T cells and indirectly compromise cell-mediated immunity and
may stimulate HIV replication (Schwarz, 1996). In cell cultures, HIV replication was
shown to be inhibited by various antioxidants but stimulated by reactive oxygen radicals
via activation of nuclear transcription factor cell gene (Kalebic et al., 1991).
HIV-infection in nutritionally deprived individuals intensifies the nutritional deficits
and further enhances cellular oxidative stress. This affects the functions of transcription
factors such as NF-kB and contributes to HIV replication and progression. Although

Chapter 3: Literature review
Caroline Cleopatra Chisenga Ph.D. Thesis
36
HIV attacks only a limited variety of T-lymphocyte subspecies, AIDS-induced
malnutrition can lead to the secondary development of nutritional-acquired immune
deficiency syndrome (NAIDS) through the action of pro-inflammatory cytokines. Also,
malnutrition could hasten the development of AIDS in an HIV-infected person (Beisel,
1996).
Though antioxidants inhibit HIV replication, they may actually promote opportunistic
infections by preventing the oxidative burst which is considered important for the
bactericidal properties of phagocytes (Schwarz, 1996). Therefore, balanced nutrition
and dietary consultation with experts helps in balancing immune effects, malnutrition,
and HIV-infection (Olsen et al., 2014). FAO (2003) stated that “Food is not a magic
bullet. It won’t stop people from dying of AIDS but it can help them live longer, with
more comfortable and productive lives.” Evidence-based nutrition interventions should
be part of all national HIV care and treatment programs. Routine assessment should be
made of diet and nutritional status (weight and weight change, height, body mass index
or mid upper arm circumference, symptoms and diet) for people living with HIV
(WHO, 2010).
Finally, Baum and colleagues concluded that “intake of nutrients at levels
recommended for the general population does not appear to be adequate for HIV-1-
infected patients” (Baum et al., 1997).” An active non-HIV-infected adult requires
approximately 2070 kcal/day including about 57 grams/day of protein. An HIV-infected
adult requires 10 to 15 percent more energy per day and approximately 50 to 100
percent more protein (Woods, 1999; WHO, 1985).
Chapter 3: Literature review
Caroline Cleopatra Chisenga Ph.D. Thesis
37
3.9 Nutritional Deficiencies, BMI, ART and Mortality
The World Health Organization defines nutritional status as follows: Mild malnutrition
(Body mass index (BMI), 17.00–18.49 kg/m2), moderate malnutrition (BMI, 16.00–
16.99 kg/m2), and severe malnutrition (BMI, 16.00 kg/ m
2) (United Nations
ACC/SCN, 2000). Food insufficiency, anorexia, increased basal metabolic rate;
malabsorption, opportunistic infections and reduced intake may all contribute to
malnutrition and weight loss during HIV-infection (Koethe et al., 2009). Anorexia is
one of the symptoms suffered by HIV-infected patients and is the major contributor to
lessened food intake (Koethe et al., 2009) and weight loss (Macallan et al, 1995).
Studies show that low BMI at ART initiation is an independent predictor of mortality
(Moh, et al., 2007; Sieleunou, et al., 2009; Hanarahan, et al., 2010). A study conducted
by Verguet and colleagues in the U.S, though not powered to comment on the effect of
BMI on mortality, showed that there was an increase in mortality during the first 6
months of ART for individuals starting ART, especially those with low CD4 count
(100 cells/L) compared to those above 100 cells/L (Verguet et al., 2013). A study
by Liu and colleagues concluded that poor nutritional status at ART initiation is
independently correlated with a high risk of mortality within the first 3 months. Equally
weight loss decreases in the first 3 months of ART were associated with a further
increased risk of subsequent mortality (Liu et al., 2011). This is shown in Figure 3-11
below.

Chapter 3: Literature review
Caroline Cleopatra Chisenga Ph.D. Thesis
38
Figure 3-11: The combined effect of BMI and weight change after 3 months of
ART on the risk of mortality (Liu et al., 2011)
Such results suggest that provision of nutritional interventions may be helpful before,
and in the early weeks after ART initiation. Other researchers have also reported that
HIV-infected patients starting ART with low BMI risk dying during the first few weeks
(Stringer et al., 2006; Zachariah et al., 2006; Johannssen et al., 2009). Stringer and
colleagues reported that in Zambia, patients commencing ART with a BMI of 16.0
kg/m2 had a higher mortality rate in the first 90 days of therapy (adjusted hazard ratio
(HR), 2.4; 95% confidence interval (CI), 1.8–3.2), compared to those initiating ART
with BMI 16.0 kg/m2 (Stringer et al., 2006). A study conducted in more than 1500
Malawians starting ART reported that participants with BMI 15.9 kg/ m2 had a 6-fold
increased risk of death at 3 months, in comparison with those with a BMI of 18.5
kg/m2 (adjusted HR, 6.0; 95% CI, 4.6–12.7). For individuals with a BMI of 16.0–16.9
kg/m2, the risk was 2-fold (adjusted HR, 2.4; 95% CI, 1.7–6.3) (Zachariah et al., 2006).
Data from Tanzania showed that patients with BMI 16.0 kg/m2 at the start of ART had

Chapter 3: Literature review
Caroline Cleopatra Chisenga Ph.D. Thesis
39
a double mortality rate compared to that of patients with BMI 18.5 kg/m2 (adjusted
HR, 2.1; 95% CI, 1.1–4.2) (Johannssen et al., 2009). This evidence suggests that a
correlation exists amongst ART, mortality and BMI during HIV-infection.
Other authors report an increased risk of early mortality among HIV-positive patients
starting ART in resource-constrained countries compared to high-income countries
(Kelly et al., 1999; Zulu et al., 2008; Koethe et al., 2009). Increased early mortality rate
is associated with the loss of immunocompetence and the evolving opportunistic
infections common amongst HIV-positive individuals (Zulu et al., 2008). Koethe and
colleagues reported that mortality in HIV-positive persons initiating ART were
dependent on serum biomarker levels i.e. albumin, phosphates and ferritin (Koethe et
al., 2011). Low levels of albumin and a body mass index of 16 prior to initiation of
ART especially in HIV-infection, increases susceptibility to a number of infections as
well as the mortality rates (Koethe et al., 2010).
3.10 The Impact of Nutrient Interventions During HIV-Infection
During HIV-infection a number of nutrient deficiencies occur, resulting from
malabsorption, reduced dietary intake or compromised stores as demonstrated in Figure
3-12. Malabsorption of trace elements and macronutrients may result from GIT
infections, disturbances in the gut barrier and an altered metabolism (Semba and Tang,
1999).

Chapter 3: Literature review
Caroline Cleopatra Chisenga Ph.D. Thesis
40
Figure 3-12: Impact of poor nutrition and HIV (Semba and Tang, 1999)
Individual micronutrient deficiencies may impact on the immune system response to
infection. Humans use many metabolic control mechanisms to prevent oxidative
damage from free iron (Puntarulo, 2005; Arosio et al., 2009). These controls involve
both protein synthesis and adequate nutritional status in relation to key antioxidant
micronutrients. Both protein synthesis and antioxidant micronutrient status are impaired
in severe malnutrition (Ashworth et al., 2003), hence re-feeding malnourished people or
animals without caution is associated with infection and death. Several randomized
controlled trials have been undertaken to explore the potential for micronutrient
treatment, both to restore micronutrient status and to improve immune function. These
have recently been summarized in a Cochrane review as exemplified with forest plots
below (Figures 3-13-3-21) (Irlam et al, 2012).

Chapter 3: Literature review
Caroline Cleopatra Chisenga Ph.D. Thesis
41
Figure 3-13: Selenium supplementation and mortality in adults with HIV-infection
Figure 3-14 Selenium supplementation and viral load in adults with HIV-infection

Chapter 3: Literature review
Caroline Cleopatra Chisenga Ph.D. Thesis
42
Figure 3-15: Selenium supplementation and CD4 count change in adults with HIV-
infection

Chapter 3: Literature review
Caroline Cleopatra Chisenga Ph.D. Thesis
43
Figure 3-16: Micronutrient supplementation and mortality in adults with HIV-
infection
Figure 3-17: Micronutrient supplementation and mortality in adults with HIV-
infection

Chapter 3: Literature review
Caroline Cleopatra Chisenga Ph.D. Thesis
44
Figure 3-18: Micronutrient supplementation and mortality in adults with HIV-
infection (severe immunodeficiency)
Figure 3-19: Micronutrient supplementation and CD4 counts in adults with HIV-
infection

Chapter 3: Literature review
Caroline Cleopatra Chisenga Ph.D. Thesis
45
Figure 3-20: Micronutrient supplementation and CD4 change at 12 months in
adults with HIV-infection
A study conducted in Mwanza Tanzania reported a reduction in mortality (RR 0·29; 95
% CI 0·10, 0·80; interaction ratio 0·52) in HIV-positive TB patients allocated to receive
a combination of multivitamins, minerals and zinc (Range et al., 2006). A similar study
conducted in South African on TB patients showed no significant effects following
supplementation with vitamin A and zinc (Visser et al., 2011). In another study,
micronutrient supplementation increased HIV in the vagina of HIV-positive women
(McClelland et al., 2004). A question that remains unanswered is whether
supplementation during HIV-infection should be encouraged seeing there is increased
risk of HIV transmission during supplementation.
However, vitamin supplementation in HIV infected patients under oxidative stress has
been found to reduce lymphocyte DNA damage (Jaruga et al., 2002). Kelly and
colleagues also reported reduced mortality (p=0.029) in HIV-infected individuals
following micronutrient supplementation compared to participants that received

Chapter 3: Literature review
Caroline Cleopatra Chisenga Ph.D. Thesis
46
placebos (Kelly et al., 1999). Results from the main NUSTART trial also showed that
the bulk of mineral given at the start of ART did not reduce mortality or any serious
adverse events but showed an increased CD4 count as a secondary outcome (Filteau et
al., 2015). These and other studies demonstrate that there is urgent need for further
investigation into the effect of micronutrient supplementation as regards HIV-infection.
It is also clear that micronutrient supplements have a potential benefit for people living
with HIV-infection. However, in order to understand the magnitude of this benefit and
how supplements should be positioned alongside the proven advantages of antiretroviral
drugs, robust evidence base to guide policy and practice is required.
3.11 CD4 Reconstitution During ART
In a Zambian study, Chi and colleagues reported that good adherence to ART results in
an increased CD4 count (Chi et al., 2009). Results from this study (Chi and colleagues)
demonstrated that at less than 80% ART adherence for 18 months, there was an increase
of 185 cells/µL vs. 217 cells/µL; P<0.001. At 24 months (213 cells/µL vs. 246 cells/µL;
P<0.001), 30 months (226 cells/µL vs. 261 cells/µL; P<0.001) and 36 months (245
cells/µL vs. 275 cells/µL; P<0.01) (Chi et al., 2009). Another study conducted in
Europe reported a significant increase in CD4 count, which was also dependent on the
duration of ART and the median CD4 count at starting ART was 204 cells/µL (Mocroft
et al., 2007). A yearly mean increase in CD4 count of 100 cells/µL was observed after
starting ART. For patients with initial CD4 count less than 500 cells/µL, lower yearly
increases in CD4 count of about 50 cells/µL, were seen at 5 years after starting ART
(Mocroft et al., 2007).
A study in US, recorded an average improvement of 138 cells/µL (SD = 125) CD4 cells
during ART treatment (Ross-Degnan et al., 2010). Smith and colleagues in a study

Chapter 3: Literature review
Caroline Cleopatra Chisenga Ph.D. Thesis
47
conducted in U.K reported that the median increase in CD4 cell counts after 6, 12, and
24 months of HAART, as 114, 181, and 248 cells/µL, respectively (Smith et al., 2004).
All studies reviewed are summarised in Table 3-3 as shown below.
Table 3-3: Summarizes CD4+ T cell Changes During ART
First author/ Country Mean increase Duration
Ross-Degnan, 2010, USA 138 cells/μL 6 months
Chi, 2009, Zambia 217 cells/μL 18 months
Mocroft, 2007,UK 100 cells/μL 12 months
Smith, 2004, UK 248 cells/μL 24 months
Stringer, 2006, Zambia 175 cells/μL 12 months
3.12 CD4 T cell Reconstitution and Nutrition in HIV
A considerable amount of literature addresses the relationship between CD4 T cell
reconstitution and nutrition during HIV-infection. A study in Rwanda hypothesized that
poor nutritional status was associated with smaller gains in CD4 count in Rwandan
women initiating ART (Kiefer et al., 2011). Seven hundred and ten ART-naive HIV-
positive and 226 HIV-negative women were enrolled in 2005 with follow-up every 6
months. The aim was to assess changes in CD4 count at 6, 12, and 24 months after ART
initiation. Nutritional status measures taken prior to ART initiation were: BMI, height
adjusted fat free mass (FFMI), height adjusted fat mass (FMI), and sum of skin fold
measurements. Findings from this study showed mean changes in CD4 count for HIV-
positive women from pre ART initiation at 6, 12, and 24 months post initiation as 71,
Chapter 3: Literature review
Caroline Cleopatra Chisenga Ph.D. Thesis
48
89 and 153 cells/µL, respectively (Kiefer et al., 2011). It was concluded that no
nutritional variable was found to be associated with change in CD4 count.
Forty HIV-infected patients in the United States of America taking HAART regimen
were prospectively randomized to receive micronutrient supplements or a placebo twice
daily for 12 weeks (Kaiser et al., 2006). The mean absolute CD4 count increased by an
average of 65 cells in the supplemented group versus a 6-cell decline in the placebo
group at 12 weeks (p=0.029). The absolute CD4 count increased by an average of 24%
in the micronutrient group compared to a 0% change in the placebo group (p=0.01). It
was concluded that micronutrient supplementation significantly improves CD4 cell
count reconstitution in HIV-infected patients taking HAART (Kaiser et al., 2006).
Evidence from a study on Kenyan women showed that micronutrient supplementation
when starting ART resulted in higher CD4+ (+23 cells/µL, p=0.03) and CD8
+ (+74
cells/µL, p=0.005) counts compared with a placebo group (McClelland et al., 2004).
And finally, Hurwitz et al., reported an increase in CD4 count of 27.9 ± 150.2 cells/µL
following micronutrient supplementation with selenium (Hurwitz et al., 2007).
In Switzerland macro and micro nutritional intervention on HIV-infected individuals
with a body mass index <21 kg/m2 or CD4
+ T cells <500 L had no significant effect on
lymphocyte CD4 counts/L (Berneis et al., 2000). Another study in South India
evaluated the effects of the high-calorie, high-protein macronutrient supplement, Indian
mix, among HIV-infected adults. From the 361 participants who completed 6 months of
follow-up, a slower decrease in CD4+ cell counts among patients who were provided
supplements was observed (Swaminathan et al., 2010). This study concludes that
supplementation did not result in significantly increased weight gain compared with
standard care among patients with HIV disease (Swaminathan et al., 2010).

Chapter 3: Literature review
Caroline Cleopatra Chisenga Ph.D. Thesis
49
The effect of nutritional deficiencies on mortality has also been widely investigated in
HIV-infected individuals. A study by Kelly and colleagues revealed that
supplementation with vitamin A, C and E plus Se and zinc, showed no changes in CD4+
cell count (Kelly et al., 1999). However, there is a paucity of studies addressing the
association between micronutrients with vitamins and minerals and CD4+ T cell
reconstitution.
3.13 Selenium and HIV
Jons Jacob Berzelius, a Swedish national, discovered selenium (Se) in 1817 (Bowrey et
al., 1999; Stone et al., 2010). Amounts of Se present in the soil fluctuate and it is
incorporated into the food chain via uptake into plant crops (Peters and Takata, 2008).
Eggs, meat and fish contain the highest (87.6-737 μg/kg) Se levels and fruits and
vegetables the lowest being at 1.7-24.9 μg/kg (Ventura et al., 2006). Brazil nuts contain
up to 254 g/100g while crabmeat has about 84 g/100g (Bowrey et al., 1998).
Se in the form of selenite, selenate, or selenocysteine is absorbed in the duodenum
(Bowrey et al., 1998). Red blood cells rapidly absorb Se. In the presence of thiols, Se is
reduced to hydrogen selenide and it is transported bound to alpha and beta globulins
(Bowrey et al., 1998). Se is also found in small amounts in liver (0.63 g/g) and kidney
0.39 g/g tissues (Bowrey et al., 1998).
3.13.1 Selenium and Human Requirements
Although the essential role of Se in human health is established, the actual human
requirement is still uncertain. Brown and Arthur reported that a human body weight of
about 60 kg needs 41 μg of Se per day (Brown and Arthur, 2001). A study by Baum and

Chapter 3: Literature review
Caroline Cleopatra Chisenga Ph.D. Thesis
50
co-workers defined Se deficiency as a serum concentration level of 85 μg/L or less
(Baum et al., 1997). Fairweather-Tait and colleagues reported that dietary Se intake
varies from 7 μg/day to about 4990 μg/day (Fairweather-Tait et al., 2011). In the USA,
dietary Se intake stands at 70 μg/day for men and 55 μg/day in women (Khan et al.,
2012). In Europe, a reduction over several years of average serum Se concentrations to
0.63-1.69 μmol/L has been interpreted as a reflection of the reduction in imported wheat
with high Se content from North America (Brown and Arthur, 2001). The observed
uncertainty in Se requirements is a consequence of differences in the amounts present in
food chains and soils (Johnson et al., 2010). Rayman suggests that on average, women
need about 53 μg/day while men about 60 μg/day (Rayman, 2004). Data from Finland
indicate that 70 μg/day Se supplementation increase serum Se concentrations (Brown
and Arthur, 2001).
3.14 The Role of Selenium in Human Physiology
3.14.1 Selenium and Oxidative Stress
Se can be incorporated in selenoproteins in form of a modified amino acid,
selenocysteine. Selenocysteine is incorporated into proteins in the liver, from which it is
bound and transported by albumin (Brown and Arthur, 2001). About 100 selenoproteins
have been assumed to exist in mammalian tissues, of which about 30 have been
characterized in full. Se-dependent enzymes include classical glutathione peroxidase,
(GPx1), gastrointestinal glutathione peroxidase (GPx2), plasma glutathione peroxidase
(GPx3) and phospholipid hydrogen peroxide glutathione peroxidase (GPx4) (Brown
and Arthur, 2001; Reeves and Hoffmann, 2010). The marked preponderance of
antioxidant enzymes among Se dependent enzymes strongly suggests that Se has
important antioxidant effects. Hydrogen peroxide (H2O2) is toxic to all cells, especially

Chapter 3: Literature review
Caroline Cleopatra Chisenga Ph.D. Thesis
51
when Se is deficient (Brown and Arthur, 2001). Adequate detoxification of free radicals
results in a decrease in oxidative stress due to reactive oxygen species (ROS) with a
consequent decrease in cellular pathology (Brown and Arthur, 2001).
3.15 Transcriptional Effects of Selenium
Nuclear factor Kappa B (NF-KB) controls the transcription of pro-inflammatory
cytokine genes (Tak and Firestein, 2001; Youn et al, 2008). Increased replication of
several viruses is seen when NF-KB is activated (Schreck et al. 1991). In a study
conducted in Japan by Maehira and colleagues on 141 healthy individuals, human
hepatoma cell lines were grown for 3 days in medium containing 2% foetal calf serum
with the aim of investigating the regulatory effect of Se on NF-KB (Maehira et al.,
2003). Following this, cells were cultured in the same type of medium containing
sodium selenite for another 3 days (Maehira et al., 2003). Se, at a concentration of
0.51 mol/l which is about half the serum concentration for healthy individuals, was
sufficient for maximum inhibition of activated NF-KB. As Se concentrations in this
range are common in the serum of subjects with elevated C-reactive proteins (CRP)
levels (Maehira et al., 2003), they postulated that low Se might contribute to NF-KB-
mediated inflammation.
3.16 Impact of Selenium on Immunity
3.16.1 Innate Immunity
Se deficiency has been shown to impair the phagocytic function of neutrophils and
macrophages (Arthur et al., 2003), Although the number of circulating neutrophils was
normal in Se deficient experimental animals, the ability to kill an ingested organism was
compromised (Arthur et al., 2003), and this defect was attributed to a drop in the

Chapter 3: Literature review
Caroline Cleopatra Chisenga Ph.D. Thesis
52
cytosolic GPx1 activity in the neutrophils. Thus, instead of the organism being killed,
neutrophils were killed.
In another experimental system, Listeria monocytogenes was administered orally to
mice to assess the effect of Se on innate immunity (Wang et al., 2009). Mice were
infected with L. monocytogenes and categorised into four classes as follows: Group I,
non-infected Se-adequate; Group II, non-infected Se-deficient; Group III, infected Se-
adequate; and Group IV, infected Se-deficient. Glutathione activity was lowered in Se
deficient mice as compared to replete mice, and L. monocytogenes persisted in-group IV
compared to group III. These data suggest that the innate immune response in Se
deficient mice is defective in L. monocytogenes infection (Wang et al., 2009). Another
interesting outcome of this experiment was the discovery of increased numbers of
natural killer cells and production in the Se supplemented mice.
3.16.2 Humoral Immunity
A study conducted in rats infected with Trypanosoma brucei brucei suggested that Se
supplementation could play a role in the humoral immune response. Antibody titers
were increased in supplemented rats compared to the control group (p<0.05). Mortality
was 100% in the infected non-supplemented group but was reduced to 40% in rats that
received 4 and 8 parts per million (ppm) Se in feeds (Eze et al., 2011).
In a double-blinded study conducted by Broome et al., 22 individuals with a low plasma
Se measure were chosen as study participants. These participants were allocated to
receive either a 50 μg, or 100 μg or placebo every day for a period of 15 weeks
(Broome et al., 2004). An oral live attenuated polio vaccine was administered at week 6

Chapter 3: Literature review
Caroline Cleopatra Chisenga Ph.D. Thesis
53
to all twenty-two subjects. Se supplementation increased poliovirus antibody titers in
adults challenged with the poliovirus.
3.16.3 T Cell Immunity
Several studies highlight the importance of Se to proper functioning of the immune
system, particularly in CD4+ T cell functioning and mounting responses against
infection. In the aforementioned study by Broome and colleagues a T lymphocyte
(CD3+) immune response was enhanced in persons that received the sodium selenite by
day 7 giving rise to an effective cellular elimination of the poliovirus. An increase in the
clearance of the poliovirus in subjects that received the sodium selenite was made
possible by an increased proliferation and differentiation of the T cells and CD4+ cells
(Broome et al., 2004). However, in participants receiving placebos there was no
detectable increase in Se plasma level or change in T cells. A mutation also occurred in
the polio viral genome of the placebo group, giving rise to a more virulent form of a
virus, which did not occur in the supplemented group. Interferon gamma (IFN-)
increased in both groups (placebo and supplemented), but the increase was much higher
in the group that received 100 μg Se/day. Still in the supplemented group, peak levels
for IFN- production was at day 7 while in the placebo group the reported peak was at
day 14 (Broome et al., 2004).
In another study, mice were randomised to receive low (0.08 mg/kg), medium (0.25
mg/kg), or high (1.0 mg/kg) Se diets for 8 weeks (Hoffmann et al., 2010). These mice
were challenged with Lymphocytic choriomeningitis (LCMV) gp66–77 with the aim of
assessing the role of Se on CD4 T cell proliferation and maturation. There was a
skewing towards a Th1 response with an increase in IFN- production in mice on a high
Se diet as opposed to the other two groups. IFN- was also found to play a role in
macrophage activation and increased inhibition of viral replication

Chapter 3: Literature review
Caroline Cleopatra Chisenga Ph.D. Thesis
54
3.17 Selenium, Cardiomyopathy and Coxsackie Virus
In China, Keshan and Kashin-Beck diseases are human conditions that are associated
with Se deficiency (Su et al., 1979; Rayman, 2000; Rayman, 2012). This may be as a
result of a direct effect of Se deficiency on cardiac muscle (Broome et al., 2004), but
Keshan and Kashin-Beck diseases may also result from defective surveillance allowing
the pathogenic coxsackie virus to develop enhanced virulence (Broome et al., 2004).
Beck and colleagues carried out an experiment in Se deprived mice. Se deficient mice
were inoculated with a benign strain of coxsackie type of the virus. A virulent type of a
virus evolved following mutations in its genome. The resulting virus was reported to
cause a type of myocarditis in mice similar to that of humans. When isolated, the
mutated virulent virus was inoculated in mice that had sufficient Se. Heart damage was
still induced, which demonstrated that Se deficiency causes permanent damage or
mutation to the virus (Beck et al., 1998).
3.18 HIV
During HIV-infection a number of micronutrient deficiencies occur, perhaps resulting
from malabsorption. Malabsorption of trace elements and micronutrient is attributed to
gastrointestinal tract infections, mucosal damage, and altered metabolism (Semba and
Tang, 1999).
3.18.1 Observational Data
Several studies report observational data. Rayman (2004) has reported a correlation
between low Se and reduced CD4 T cells of HIV infected individuals.
Death rates in HIV-infected persons with lower levels of Se are reported to be 20 times
higher (p<0.0001) than in HIV-infected individuals with sufficient Se levels (Baum et

Chapter 3: Literature review
Caroline Cleopatra Chisenga Ph.D. Thesis
55
al., 1997). It seems plausible that this mortality effect might be mediated through
oxidative stress (Baum et al., 1997), although it is possible that both are merely markers
of some other pathophysiological process. Glutathione activity increases helper T cell
count, and cytotoxic cell activities that act against the HIV replication rate and lower
HIV viral load (Stone et al., 2010). However, direct evidence for this is conflicting.
A cross-sectional study was conducted in 400 HIV-1-seropositive women to assess,
among other things, the relationship between plasma Se level and CD4 count. In
univariate analysis, an association existed between low Se and low CD4 count (Drain et
al., 2005). No association was found using multivariate analysis
During HIV-infection interleukin-2 and IFN- levels are reduced. IL-2 is required in
differentiation and activation of effector cells. Activation and proliferation of natural
killer cells is equally dependent on IL-2 production. A compromise in IL-2 cytokine
level leads to rapid progression of HIV disease and a decrease in T lymphocytes (Baum
et al., 2000). Therefore, in HIV-infected individuals Se supplementation is a plausible
adjunct for therapy and combating free radicals constantly produced following chronic
immune activation (Baum et al., 2000; Drain et al., 2005).
3.18.2 Clinical Trial Data
In a double-blinded randomized controlled trial conducted by Hurwitz and colleagues in
Miami USA, 200 g of Se was given to 262 participants for 9 months. One hundred and
twenty one received supplementation (with 200 μg Se) over a 9-month follow-up
assessment while 141 received a placebo. An increase of 32.2 +/- 24.5 g/L in serum Se
concentration was recorded in the treatment group as opposed to 0.5 +/- 8.8 g/L in
placebo. HIV viral load was reduced (p<0.02) and CD4 counts increased (p<0.04)
Chapter 3: Literature review
Caroline Cleopatra Chisenga Ph.D. Thesis
56
compared to placebo (Hurwitz et al., 2007). Furthermore, 200 μg supplementation every
day resulted in an increased CD4 cell count and a reduction in the viral load (Hurwitz et
al., 2007). There were no side effects attributed to the supplementation. In the same
study, the number of hospitalisations reduced (RR = 0.38; p=0.002) (Hurwitz et al.,
2007).
In contrast, a study that was carried out in Tanzania on HIV-positive pregnant women,
using the same amount of Se supplementation (200 μg) did not show any reduction in
the viral load nor an increase in CD4 cell counts but reduced the chances of CD4
decline to >50 cells/mm3 (Kupka et al., 2008). A decrease in the mortality rates and a
slight increase in the birth weight of the infants born from HIV-positive women were
reported (Kupka et al., 2008). This reduction was attributed to the increased supply of
Se via the umbilical cord, placenta and breast milk to the infants.
In another double-blinded, randomized trial conducted among 400 HIV-1 women in
Mombasa Kenya, McClelland tested whether multivitamin plus Se supplementation
decreases genital HIV-1 shedding. The odds of detection of vaginal HIV-1-infected
cells were higher (2.5-fold; p=0.001) among women who received micronutrients in
comparison to placebo. Supplementation also resulted in higher CD4 (+23 cells/mL,
p=0.03) and CD8 (+74 cells/mL, p=0.005) counts compared with placebo but did not
alter the plasma viral load (McClelland et al., 2004).
During HIV-infection, Se deficiency increases susceptibility and accelerates progression
of the disease. To confirm that Se supplementation can be used to increase body Se, two
small studies were conducted in France and U.S on people living with HIV. In a study
conducted in France, reduced serum Se levels increased from an average of 0.75 +/−

Chapter 3: Literature review
Caroline Cleopatra Chisenga Ph.D. Thesis
57
0.27 μmol/L to 1.63 +/− 0.27 μmol/L following 21days of Se supplementation (Stone et
al., 2010). Whilst in the U.S, serum Se in people living with HIV increased from a mean
of 1.55 +/− 0.38 μmol/L as compared to 2.47 +/− 0.25 μmol/L in the control group
(Olmstead et al., 1989). Based on these and other related trials, it is probable that
supplementation could be useful in boosting the serum Se levels (Broome et al., 2004;
Stone et al., 2010).
Brief overview of the effects of Se on CD4 count is as summarized in Table 3-4 below.

Chapter 3: Literature review
Caroline Cleopatra Chisenga Ph.D. Thesis
58
Table 3-4: Effects of Selenium on Absolute CD4 count
First author
& year
Study design Cohort & amount
given
Findings
Kamwesiga,
2015
A multicenter,
double-blinded,
placebo-controlled,
randomized clinical
trial
Of the 300 participants,
149, HIV-infected
adults (≥21 years)
received 200g Se
once-daily or identical
placebo.
CD4 depletion was
reduced by 43.8%
[95%
Confidence interval
(CI) 7.8–79.8%
decrease] in the
treatment arm – from
mean
3.97 cells/L per
month to mean 2.23
cells/L per month.
Kupka, 2008 Randomized,
double-blind,
placebo-controlled
trial
Women between 12 and
27 wk. of gestation
received
200 μg Se or placebo as
supplements
from recruitment until 6
months after delivery.
No significant effect
on maternal
CD4 cell counts or
viral load. Selenium
was marginally
associated
with a reduced risk
of low birth weight
[relative risk (RR)
0.71;
95% CI: 0.49, 1.05;
P=0.09]
Hurwitz,
2007
Double-blinded
randomised
controlled trial
121 received 200 μg Se
over 9-months while
141 received a placebo.
HIV viral load was
reduced (P<0.02)
and CD4 counts
increased (P<0.04)
compared to placebo
Drain, 2006 Cross-sectional 400 HIV-1 seropositive
women
Association between
low Se and low CD4
count
Broome,
2004
Double-blind study 22 healthy individuals
with low Se received
either a 50 μg or 100 μg
or placebo every day
for a period of 15
weeks
Effective cellular
elimination of the
poliovirus in persons
that received the
sodium selenite

Chapter 4: Statement of the problem, research questions, aims and objectives
Caroline Cleopatra Chisenga Ph.D. Thesis
59
Chapter 4. Statement of the Problem
4.1 Statement of the Problem
A good number of studies have explored the prognostic value of T cell subsets in HIV-
treated individuals and immune reconstitution following nutritional interventions (Table
4-1). However, data on the prognostic value of T cell subsets in malnourished untreated
HIV-infected adults and the effects of minerals (Table 4-2) on CD4+ and CD8
+ T cell
subsets is inadequate. From the literature reviewed, the following knowledge gaps are
apparent:
a. The prognostic value of T cell subsets in untreated malnourished HIV-infected
adults initiating ART
b. The effects of micronutrient interventions on CD4+ and CD8
+ T cell subsets in
African HIV-infected adults on ART.
c. There are no data on whether T cell subsets after immune reconstitution
approach normal levels.
d. In vitro response of T cell subsets to individual micronutrients.
e. No studies have separately analysed the effects of minerals (potassium,
phosphorous and magnesium), which are important for rebuilding lean tissue
mass on T cells.

Chapter 4: Statement of the problem, research questions, aims and objectives
Caroline Cleopatra Chisenga Ph.D. Thesis
60
4.1.1 Study Justification 1
Although the prognostic value of T cell subsets have been investigated, only a few
markers (at most six) have been used (Table 4-1). It is likely that the prognostic value of
certain markers might have been overlooked. In addition, while immune reconstitution
as regards nutritional supplementation has been investigated in HIV-infected
individuals, none has been conducted in HIV-infected individuals receiving bulky
minerals (Table 4-2). Therefore this study set out to investigate two fundamental issues;
1. The prognostic value of T cell subsets using 18 different monoclonal
antibodies to categorise the CD4+ and CD8
+ T cells by stage of life cycle
(Proliferation, senescence, naïve, central memory, effector memory and
effector), by gut homing potential and thymic production.
2. CD4+ and CD8
+ T cell subset responses to a cocktail of micronutrients with or
without vitamins and minerals (in vivo) and selenium in vitro.
It is envisaged that the cellular subsets associated with early mortality after ART
initiation may provide insight into the mechanisms contributing to immunological
dysfunction and impaired immune reconstitution.
Eventually, the information derived from this study would provide insight into the
optional composition of any nutritional rehabilitation trends for HIV-infected patients.

Chapter 4: Statement of the problem, research questions, aims and objectives
Caroline Cleopatra Chisenga Ph.D. Thesis
61
Table 4-1: T cell subsets and Mortality
First Author
& Year
Study Design &
Population
Antibodies Used Findings Mortality
Hunt, 2014 64 case patients
who died within 12
months of treatment-
mediated viral suppression
were each matched to 2
control individuals total
number of controls, 128
CD3, CD4, CD8,
CD28, CD45RA,
CD31, CCR7,
CD57,
CD27, HLA-DR,
CD38, CCR5,
A higher percentage of CD38+HLA-DR+
cells in the CD8+ T-cell population was a
predictor of mortality
before but not after adjustment for
proximal CD4+ T-cell count. Frequencies
of senescent, naive, and CMV-specific T
cells did not predict mortality.
Gut epithelial barrier
integrity markers predict mortality
in patients with ART-suppressed
HIV infection and a history of
AIDS
Lee, 2014 141 ART-suppressed
participants
CD4, CD8, CD57,
CD28
Abnormally low proportions of
CD28−CD8
+ T cells expressing CD57
Low proportions of CD28−CD8
+
T cells expressing CD57 predict
increased mortality during treated
HIV infection
Rainwater-
Lovett, 2012
Prospective, observational
study, 149 HIV-infected
children
CD3, CD4/CD8,
HLA-DR, CD38,
CCR7, CD45RA
Increase in CD8+ effector T cells increased
the odds of overall mortality
Effector T cell subsets may be
more accurate predictors of early
mortality
Ronsholt,
2012
101 HIV-infected patients CD4/8, CD45RA,
CD62, CD45RO,
HLA-DR, CD38
High level of memory CD8+ T cells, was
an independent predictor of increased
overall survival and immune activation
showed no prognostic value
T cell activation was not
associated with increased risk of
death.
van Dijk,
2011
A prospective cohort
study, 267 HIV-infected
children
CD3, CD4 Younger age, higher viral load, lower
CD4+ T-cell percentage and lower weight-
for-age z-scores at ART initiation was
associated with higher risk of mortality
Higher HIV viral load was
associated with an increased risk
of mortality
Hunt, 2011 Prospective cohort study,
451 HIV-infected adults
CD4, HLA-DR,
CD38
Higher CD8+ T cell activation levels
during early ART
T cell activation independently
predicted mortality
Srinivasula, 41 HIV-infected patients CD4/8, CD38, CD4/CD8 Activation & proliferation was Not reported

Chapter 4: Statement of the problem, research questions, aims and objectives
Caroline Cleopatra Chisenga Ph.D. Thesis
62
2011 HLA-DR, Ki67,
CD45RA, CD27
associated with viral load
Lederman
, 2011
60 immune failure,
188 immune, success &
21 healthy subjects
CD4/8, CD45RA,
CCR7, CD38, Ki67
CD4/8 activation was used to described
immune failures & success
Not reported
Rickabaugh,
2011
Cross- section
47 HIV seronegative & 19
HIV seropositive
CD4, CD45RA,
CD31, CD28,
CD27, 7AAD
Partial explanation both for the faster
disease progression of older adults and the
observation that viral responders to ART
present with clinical diseases associated
with older adults
Not reported
Ganesan,
2010
466 HIV-infected subjects CD4/8, CD45RO,
CCR5, CCR7,
CD27, CD28, Ki67
Expression of Ki67 on CD4+& CD8
+
determined fast progression to AIDS
Not reported
Murray, 2010 13 HIV-infected Double-
blind, randomized
placebo-controlled trial
CD4/8, Ki67,
HLA-DR, CD27,
CD38, CD45RO
Reduction in immune activation during
HIV-infection
Not reported
Schacker,
2010
348 patients from multiple
AIDS Clinical Trials
Group studies
CD4, CD45RA,
CD62L
Lower baseline naive CD4 percent was
associated with greater time spent at lower
CD4 T-cell counts after initiating ARV
Naïve cells identifies individuals
at lower risk of morbidity and
mortality
Cicala, 2009 Not mentioned CD4, CD45RO,
CCR5, Ki67, 4,
7
47 T cell subsets are prone to highly
productive infection
Not reported
Huang, 2008 Retrospective, 13 HIV-
infected patients
CD4/8CD57, CD28 CD4+CD57+ T-cells population were
more susceptible to cell death
Not reported
Elrefaei,
2004
31 HIV-infected & 10 HIV
negative
CD4, CD28,
CCR7, CD45RA
During HIV-infection, there is an impaired
maintenance of central memory CD4+ T
cells
Not reported
Ostrowski,
2003
107 HIV-1–infected
patients and 65 control
subjects
CD4, CD8, CD28,
CD45RA,
CD45RO
Concentration of CD4+ cells markedly
reduced
50% reduction in CD4+CD28+
cells predicted increased mortality

Chapter 4: Statement of the problem, research questions, aims and objectives
Caroline Cleopatra Chisenga Ph.D. Thesis
63
Hazenberg,
2003
Prospective cohort study
of 102 HIV-infected
participants
CD4, CD8, CD70,
CD27, CD38,
CD45RO, HLA-
DR, Ki67
Increased T cell activation has predictive
value for HIV-1 disease progression
Not reported
Choi, 2002 130 HIV-infected people CD4, CD8, CD28,
HLA-DR
CD28/HLA-DR expressions on CD4+ T
cells were more predictable in the
evaluation of the disease progression
Not reported
McCloskey,
2001
Cohort of 112 HIV-
infected children
CD3, CD4, CD8,
CD14, CD45,
CD38, CD95,
CD45RA,
CD45RO, HLA-
DR
Perturbations in the lymphocyte pool
determined HIV disease progression
Not reported
Giorgi, 1999 37 HIV-1–infected men CD3, CD4, CD8,
CD45RA,
CD45RO, CD38,
HLA-DR, CD62
Expression of CD38 antigen on CD4+ and
CD8+ T cells, was strongly associated with
shorter subsequent survival
Not reported
Giorgi, 1993 98 HIV-infected men
CD4, CD8, CD38,
HLA-DR, CD57
CD38+ CD8+ levels had prognostic value
for progression to AIDS
Not reported

Chapter 4: Statement of the problem, research questions, aims and objectives
Caroline Cleopatra Chisenga Ph.D. Thesis
64
Table 4-2: Summary of Interventional Studies and Effects on Total CD4/CD8 Count
First Author Study Design/Population Nutritional Intervention CD4 count Mortality
Low income
Swaminathan, India
(2010)
636 HIV+ patients;
prospective interventional
100 mg/d of whole wheat &
soybean 6months No significant effect Not reported
Ndekha, Malawi (2009) 491 HIV+ patients; RCT 245 g peanut-based 3.5 months No significant effect No significant effect
Cantrell, Zambia (2008)
636 HIV+patients; A pilot
study Home-based adherence No significant effect Not reported
Kelly, Zambia (2008)
276 HIV+ and 224 HIV-; A
cluster RT Micronutrients 1.9 y No significant effect Decreased
Kupka, Tanzania (2008)
913 HIV+ pregnant women;
RCT
Selenium + prenatal iron, folic
acid and vitamins 6 months No significant effect No significant effect
Villamor, Tanzania (2008)
471 HIV+ and 416 HIV-
patients with TB RCT Micronutrients 30 months No significant effect No significant effect
McClellard, Kenya (2004) 400 HIV+ women RT Micronutrients 6 wks. No significant effect Not reported
Jiamton, Thailand (2003) 481 HIV+patients RCT Micronutrients 48 wks. No significant effect Improved survival
High income
Sattler, United States
(2008) 59 HIV+ patients High-calorie protein 12 wks.
Significantly
increased Not reported
Hurwitz, United States
(2007) 310 HIV+ patients High selenium yeast 9 months Increased Not reported
Kaiser, United States
(2006) 40 HIV+ patients Micronutrients 12 wks. Increased Not reported
Burbano, United States
(2002) 186 HIV+ patients Selenium 2 years Increased Not reported
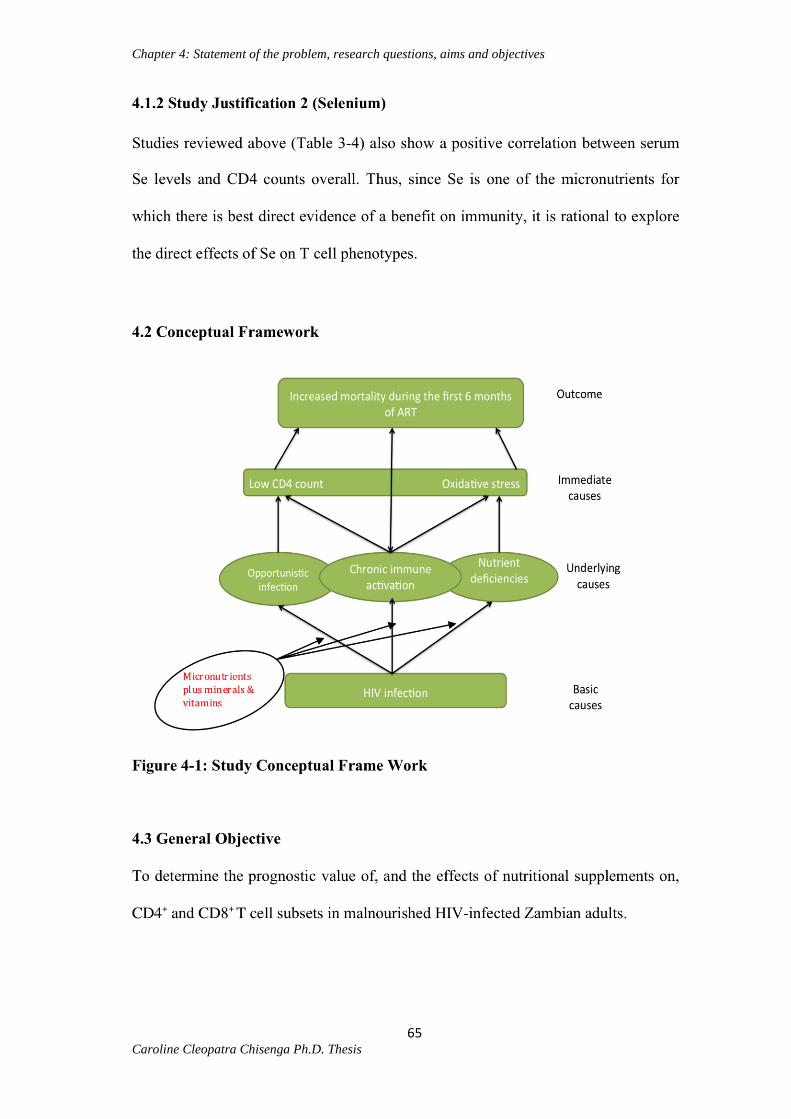
Chapter 4: Statement of the problem, research questions, aims and objectives
Caroline Cleopatra Chisenga Ph.D. Thesis
65

Chapter 4: Statement of the problem, research questions, aims and objectives
Caroline Cleopatra Chisenga Ph.D. Thesis
66
4.3.1 Specific Objectives
1. To describe CD4+ and CD8
+ T cell subpopulations (differentiation, senescence,
thymic and homing) and surface markers in healthy Zambian adults.
2. To determine whether baseline markers profile predict mortality.
3. To define the immunological restitution marked by T cell surface marker
expression in adults receiving vitamins and mineral supplementation on ART.
4. To determine if surface expression changes differ in trial participants receiving
micronutrients plus minerals and vitamins and those receiving micronutrients
only.
5. To determine the effects of Se in vitro on expression of T cell gut homing,
senescent, differentiation and thymic output markers in adult HIV-negative
volunteers.
6. To determine whether T cell subsets after immune reconstitution approach
normal levels.
4.4 Research Question
What is the prognostic value of, and the effects of nutritional supplements on, CD4+ and
CD8+
T cell subsets in malnourished HIV-infected Zambian adults?
4.5 Study Design
In order to address the research question, this research included five distinct designs: a
cross-sectional study, retrospective study, survey, in vitro dose response study, and a
randomized controlled phase III trial.

Chapter 5: Research methods
Caroline Cleopatra Chisenga Ph.D. Thesis
67
Chapter 5: Research Methods
5.1 T Cell Subset Profile in Healthy Zambian Adults (Cross Sectional Study)
In order to understand and describe the CD4+ and CD8
+ T cell subsets distribution in a
healthy population, a cross sectional study was undertaken and sample size calculated
based on a study by Tsegaye et al.,1999 Ethiopia.
5.1.1 Sample Size Calculation-Cross Section Study
n = (Z/)2
n=Minimum sample size
=Standard deviation
=Effect size
Z=1.96
Table 5-1: Sample Size Calculations
CD4 Std
dev.
Effect size Power Sig
.
Numbe
r
Loss to follow up Total
225 65
cells/L
90% 5% 46 10% 51
5.1.2 Study Participants and Area
Participants were identified amongst staff of the University Teaching Hospital (UTH)
between February and March 2015. Participants were taken to the recruitment center at
the UTH-TROPGAN lab where further details were provided through the information
sheet and the consent form filled in if participants were willing. A total of 52 healthy
volunteers consented and were recruited. Of the 52 participants; 20 were lab scientists,
22 medical students from Ridgeway Campus, 4 UTH-OPD data clerks, 1 nurse and the
rest in administration (accountants).
Chapter 5: Research methods
Caroline Cleopatra Chisenga Ph.D. Thesis
68
Inclusion criteria
18 to 65 yrs old (either male or female)
HIV- negative
HbsAg negative
HCV negative
Syphilis-non reactive
Normal full blood count results
Providing written, fully informed consent (thumbprint was accepted)
Exclusion criteria were; not providing consent, pregnancy and having any chronic
disease.
5.1.3 Sample Collection and Transportation
Following consent, 10 mls blood were collected into three EDTA tubes for haematology
testing at the UTH haematology Laboratory, CD4 and CD8 testing at UTH-Virology
Laboratory and for HIV, syphilis, HbsAg and anti-HCV testing at Blood Bank. All the
blood samples were delivered to the Laboratory within 1 hour of collection.
5.1.4 Haematological Analysis
Haemoglobin measurements were undertaken immediately on whole blood on a Sysmex
xt 4000i automated haematology analyser (Sysmex Corporation, Kobe, Japan).
5.1.5 Total CD4 and CD8 Estimation
Briefly, CD4 and CD8 testing was done on the FACSCaliber flow cytometer (Becton
Dickinson, San Jose, U.S.A) with MultiSET V2.2 software. CD3/CD4/CD45 TruC v2.0
(BD Biosciences) were used, and 15000 events were acquired. Antibodies used were

Chapter 5: Research methods
Caroline Cleopatra Chisenga Ph.D. Thesis
69
conjugated to the following flourochromes as follows; CD45-PerCP CD4-PE CD3-
FITC.
5.1.6 CD4+ and CD8
+ T Cell Subset Testing (Immunophenotyping)
Briefly, 100 L of whole blood was stained for each panel of markers; cells were fixed,
washed, and resuspended in 250 L paraformaldehyde or 250 L BD Cell Fix diluted
according the manufacturer’s (BD Biosciences) instructions and 50-100,000
lymphocytes acquired on a FACSverse flow cytometer (Becton Dickinson, San Jose,
U.S.A.). Intracellular Ki-67 staining was carried out following nuclear membrane
permeabilisation (BD Perm/WashTM
buffer from Becton Dickinson, San Jose, U.S.A).
Unstained cells and fluorescence minus one (FMO) controls were used to set all gates.
Analysis of markers was carried out using BD FACSuiteTM
software v1.0.2. Sample
processing steps are summarised in the appendices also other details on panel design,
principle and setup related issues are provided in appendix 10.
5.1.7 Qualitative Testing HIV-1/HIV-2, HCV and HBsAg
The ARCHITECT System Abbott i2000 (Abbott, Germany) was used to qualitatively
detect HIV P24 antigen and antibodies to HIV-1/HIV-2, antibodies to anti-HCV,
HBsAg and syphilis in plasma. The ARCHITECT qualitative assay is a
chemiluminescent microparticle immunoassay (CMIA) for the qualitative detection of
antibodies/antigens in serum or plasma. The presence or absence of antibodies or
antigens in the sample was determined by comparing the chemiluminescent signal in the
reaction to the cutoff signal, which was determined from an active calibration. Samples
with a chemiluminescent signal greater than or equal to the cutoff signal were
considered as reactive.

Chapter 5: Research methods
Caroline Cleopatra Chisenga Ph.D. Thesis
70
5.2 Overview of the NUSTART trial and the sub-study reported here.
Figure 5-1:Relationship Between NUSTART Main Trial and the Sub-Study
Randomized (n=1876)
LNS (n=937) LNS-VM (n=939)
Total CD4 count
HB
BMI
Potassium
Phosphates
Manganese
Urine electrolytes
Saliva
Allocation
Excluded (n=2697)
Not meeting inclusion
criteria (n=2608)
Declined to participate
(n=89)
Assessed for eligibility
(n=4573)
Total CD4 count
HB
BMI
Potassium
Phosphates
Manganese
Urine electrolytes
Saliva
Sub-study recruited 189
Excluded as
BMI >18.5
(n=25)
Excluded as
BMI >18.5
(n=36) Analysed for
LNS (n=93) LNS-VM (n=96
Excluded (n=8)
3=LNS
5=LNS-VM
Sub-study analysis of 181 HIV-infected
Total CD4 and CD8 count
CD4 and CD8 subsets (Randomised controlled trial study
analysis), HB, BMI and Grip strength
Chapter 5: Research methods
Caroline Cleopatra Chisenga Ph.D. Thesis
71
5.2.1 An Overview of the Study (sub-study) Design and Sample Size
Embedded in the sub study was a Retrospective study. This study aimed at
understanding the level of increase in absolute CD4 count following 12 weeks of
receiving nutritional supplements and also to establish the need to explore the T cell
subsets. All adults recruited into the NUSTART trial in Lusaka between March 2011
and April 2012 who had completed their twelve weeks of receiving ART plus
nutritional support were eligible for this study. The inclusion and exclusion criterion
were the same as those of NUSTART. CD4 results for all the 267 NUSTART study
participants who had completed their twelve weeks were collected from their respective
files entered and analyzed using STATA version 12.
Secondly, in order determine whether baseline CD4+
and CD8+
T cell subpopulations
predict mortality and also to understand the effects of the nutrients on the CD4+ and
CD8+ subsets, a sub-study of the RCT was conducted. Patients were followed up and
evaluated at 12 weeks following ART initiation and immunophenotyping was carried
out on baseline and 12 week blood samples. CD4 results for 267 NUSTART study
participants who had completed their twelve weeks were used and sample size
calculated. Briefly, a mean CD4 of 147 at 12 weeks and standard deviation (SD) of 144
was obtained. Assuming an increase of about 100 CD4 cells/L at the end of twelve
weeks in the study, the sample size calculation was done.
n=(22/
2)(Z+Z)
2 (Kadam and Bhalerao, 2010).
n=Minimum sample size; =Standard deviation; Z1-β=Power of study;
Zα=Accepted error; =Effect size; Z=1.96

Chapter 5: Research methods
Caroline Cleopatra Chisenga Ph.D. Thesis
72
Table 5-2: Sample Size Calculations
Std
dev. 1
Std
dev. 2
Effect size Power Sig. Number
per arm
Loss to
follow
up
Number
per arm
Total
144 102 100
cells/L
80% 5% 25 50% 38 76
144 102 100
cells/L
90% 5% 33 50% 50 100
144 144 100
cells/L
90% 5% 44 50% 66 132
Based on this calculation, the sample size was 132.
5.2.2 Study Subjects and Area
Patient selection was the same as for the parent study. All the participants who
consented to be part of the NUSTART between April 2013 and December 2013 were
recruited into this study. Their inclusion and exclusion criteria followed that of
NUSTART as described in section 2.1.2.
5.2.3 Sample Collection and Transportation
At baseline and at week 12 following ART initiation, 3-5 ml of peripheral blood was
collected. Blood samples were collected for haematology plus CD4 and CD8 count with
surface maker testing using EDTA containers. Blood samples reached the laboratory
within 1h of collection and CD4 and CD8 immunophenotyping and full blood count
measurement were undertaken on whole blood. Full blood count was measured on a
Sysmex xt 4000i automated haematology analyser (Sysmex Corporation, Kobe, Japan)
and Immunophenotyping as described for Phase I. However, CD4 and CD8 absolute
counts were done using the lyse no wash protocol on the FACSVerse. Details are
provided in the appendices.

Chapter 5: Research methods
Caroline Cleopatra Chisenga Ph.D. Thesis
73
5.3 Experimental In Vitro Sample Prosessing (Exploratory)
About 10 ml of blood was collected in EDTA and lithium heparin tubes tubes from HIV
negative volunteers. Part of the blood was processed immediately for CD4+ and CD8
+ T
cell subset analysis as shown in the cross sectional study. Another part of the same
sample was incubated for 18-24 hrs. in the incubator with different Se concetrations as
follows; 180 mol/L, 200 mol/L and 220 mol/L.
Figure 5-2: Selenium Measuring and Sample Incubation
Incubated samples were stained with monoclonal antibodies as described in phase I
above and analyzed using the FACSVerse as described in Chapter 5. To establish the
baseline Se level in healthy volunteers before incubating samples with Se, blood
samples in lithium heparin tubes were spun down and plasma samples collected. Plasma
samples were measured on the Optimal Emission Spectrometer 7000 DV (Optima)
serial number 080C1020202 PerkinElmer United States for the determination of Se
levels.
100μLbloodwasincubatedwithdifferentconcentra onsofSefor18-24hrsat37oC.
Differentconcentra onsofSeweremeasured(180μmol/L,200μmol/Land220μmol/L)

Chapter 5: Research methods
Caroline Cleopatra Chisenga Ph.D. Thesis
74
5.3.1 Method for Selenium Measurement in Plasma
Five working standard solutions were prepared using PerkinElmer Pure Instrument
Calibration Standard 4 (N930021). Plasma samples were diluted (1:9 v/v) with an
aqueous solution containing 2% Nitric acid, 3M HCl and 1% Triton. The instrument
was started, brought to operational conditions and stabilized. The sample introduction
system was checked and the wavelengths were tuned to 196.026nm, which is the
standard for Se. The instrument was standardized with the five working standard
solutions (multi-point linear fitting). Samples were measured with standardization
blanks, control samples, and quality control samples (Seronorm L-1). The detection
limit ranges for Se using ICP-OES are 1-10ppb.
5.3.2 Calculation
The data were exported to an Excel spreadsheet. Correction for standardization blanks,
drift correction, and dilution factor application were preset on the instrument software
(WinLab32). Concentrations were reported in mg/L and converted to µmol/L.
5.4 Survey
The overall aim of this study was to determine whether ART plus nutritional
supplementation was able to restore CD4 and CD8 T cell proportions as obtaining in the
healthy volunteers. Fifty-one individuals were randomly selected from the 88
participants that had completed the 3 months of receiving ART plus nutritional support
(at 80% power). These individuals were matched 1:1 with the healthy adult volunteers
for cross section study. Ultimately, there were 51 HIV+ and 51 HIV- calculated as
shown in Table 5-3 below.

Chapter 5: Research methods
Caroline Cleopatra Chisenga Ph.D. Thesis
75
Table 5-3: Survey Sample Size Calculation
M1 M2 CD4 Std.
dev.
Effect size Power Sig. Number
per arm
Loss to
follow up
Total
800 670 227 130
cells/L
80% 5% 49 10% 98
All participants enrolled in the cross section study as described in 5.1.3 were included in
this study.
5.5 Data Analysis
Data were entered and analysed using STATA software version 13 (StataCorp LP,
College Station, Texas, USA). T cell markers were determined to be non-parametrically
distributed using Shapiro-Wilk W test for normality, so with medians and interquartile
ranges presented and variables compared using the Mann-Witney U test, or the
Wilcoxon rank sum test for paired variables and Friedman or Kruskal-Wallis test with
Dunn’s correction for multiple comparison to test three or more matched and
unmatched groups respectively. For parametric analyses, paired or unpaired t-test was
performed comparing two groups. P values less than 0.05 were considered statistically
significant. As follow up was short and uniform, model of death was constructed using
unconditional logistic regression. For multivariate analysis, T cell markers were
dichotomised around the median.
Chapter 5: Research methods
Caroline Cleopatra Chisenga Ph.D. Thesis
76
5.6 Ethical Considerations
5.6.1 Study Approval
The University of Zambia Biomedical Research Ethics Committee (UNZAREC)
approved the sub-study (Ref. No. 009-01-11-for the whole PhD work).
5.6.2 Validation of Experiment (Quality Assurance and Procedures)
Validation of laboratory procedures was done before running experiments on the
FACSVerse. At the start, three different blood samples were sent to different labs
within UTH and one lab outside UTH i.e. (virology, adult center of excellence,
paediatric center of excellence and CIDRZ) to run CD4s and CD8 testing. Other
samples were also run on the FACSVerse and all the results compared for consistency.
However, samples were run parrarel with CIDRZ lab and occasionally with UTH
virology throughout the experiment.
5.6.3 Benefits
There may be no direct benefit to you from participating in the study. However, you
may find out that you have the co-infection of the HIV and HSV-2 or either of the two
and be referred for management, which is free. Counselling will be done before and
after VCT.
5.6.4 Risks
There are no risks except some tolerable pain when drawing venous blood. Steps have
been taken to reduce the risk. You may however, feel some discomfort with some
questions that are unusual.

Chapter 5: Research methods
Caroline Cleopatra Chisenga Ph.D. Thesis
77
5.6.5 Reimbursement
You will be paid transport money to and from home (bus fare). If you are injured as a
result of being in this study, treatment will be available at UTH. The researcher will pay
the costs of such treatment. Additionally, lunch will be provided in an event that the
procedure takes long that it covers the lunch hours.
5.6.6 Confidentiality
The results of all the study will be discussed with you, and kept confidential unless you
wish otherwise. Except for this disclosure, all information obtained in this study will be
considered confidential and used only for research purposes. Your identity will be kept
confidential as far as the law allows.
5.6.7 Injury Clause
In the event that you become injured during the course of the research study,
immediately notify the principal investigator or the chairperson of the Research
Biomedical Ethical committee of the University of Zambia, School of Medicine on
telephone number 256067 or P.O BOX 50110, Ridgeway campus, Lusaka. If you
believe that your injury directly resulted from the search procedures of this study, you
can file a complaint with the principal investigator.
5.6.8 Right to Refuse or Withdraw
Your participation in the study is entirely voluntary, and you are free to refuse to take
part or withdraw at anytime without affecting or jeopardizing your future medical care.
Other ethical considerations have been provided in the appendices.

Chapter 6: Results
Caroline Cleopatra Chisenga Ph.D. Thesis
78
Chapter 6: Study Results
6.1 Normal distribution of T cell subsets in HIV Negative Adults
Figure 6-1 describes the flow of participants enrolled in the cross sectional study and
the experiments done.
Figure 6-1: Flow diagram for the participants enrolled in the study
52 recruited and Screened
for HIV, HCV, HbsAg &
syphilis
51 non reactive to all
tests
One reactive to
HbsAg
Final analysis 51
included
Excluded

Chapter 6: Results
Caroline Cleopatra Chisenga Ph.D. Thesis
79
Table 6-1: Baseline Characteristics for the Participants
Variable Females N=17 Males N=34 p value
Sex 17 (33%) 34 (67%) <0.001
Age (Years) 34 (27, 45) 23 (28, 34) 0.01
Absolute CD4 count (Cells/μL) 1042 (864, 1270)
671 (545, 899) 0.003
Absolute CD8 count (Cells/μL) 1531 (1248, 1740)
1346 (1101, 1801) 0.42
Hb (g/dl) 13.3 (11.3, 14)
15.6 (14.8, 16.6) 0.0001
BMI (Kg/m2) 25.03 (23.3, 28.88)
23.18 (21.18, 25.5) 0.07
Grip strength (Kg) 25.9 (23.8, 27.5)
44.7 (39.9, 47.7) 0.0001
Education
University
College
Secondary
Primary
8 (47%)
6 (35)
2 (12%)
1 (6%)
22 (64%)
6 (18%)
6 (18%)
0
0.21

Chapter 6: Results
Caroline Cleopatra Chisenga Ph.D. Thesis
80
Occupation
Employed
Students
Business
Unemployed
11 (64%)
4 (24%)
1 (6%)
1 (6%)
23 (68%)
11 (32%)
0
0
0.22
Marital status
Married
Single
Divorce
10 (59%)
6 (35%)
1 (6%)
17 (50%)
17 (50%)
0
0.23
1
Mann–Whitney U-tests were used for non-parametric variables and Pearson chi square for categorical variables. Continuous characteristics are
expressed as median (interquartile range) and dichotomous characteristics are expressed as n (%). g/dl=grams per decilitre; Hb= haemoglobin;
BMI= body mass index

Chapter 6: Results
Caroline Cleopatra Chisenga Ph.D. Thesis
81
Table 6-2: CD4 and CD8 Subset Reference Intervals in Healthy Population
Stratified by Sex
Variable Female N=17 Male N=35
CD4 Median (95% RI) Median (95% RI)
Absolute count 1042 (514-1799) 671 (68-1333)
Homing 413 (168-1134) 239 (17-673)
Homing activated 247 (89-628) 161 (21-413)
Thymic 31 (19-45) 28 (9-55)
Senescent 1 30 (1-191) 18 (5-278)
Senescent 2 10 (0-156) 6 (0-133)
Naïve 904 (184-1435) 573 (64-1283)
Central memory 51 (4-309) 43 (4-478)
Effector memory 1 (0-48) 0 (0-56)
Effector 55 (0-497) 9 (0-270)
Proliferating 22 (3-106) 12 (0-59)
Activated 4 (0-29) 7 (0-49)
Proliferating activated 3 (1-15) 4 (0-36)
CD8
Absolute count 1531 (21-2264) 1346 (323-2603)
Homing 537 (11-1488) 627 (140-1436)
Homing activated 0 (0-0) 0 (0-4)
Thymic 146 (1-724) 38 (4-254)
Senescent 1 426 (3-700) 283 (69-1136)
Senescent 2 193 (0-691) 163 (0-1125)
Naïve 227 (3-754) 256 (60-1579)
Central memory 154 (2-494) 204 (37-1145)
Effector memory 435 (0-981) 316 (0-890)
Effector 695 (0-934) 472 (0-999)
Proliferating 28 (1-73) 29 (0-150)
Activated 4 (0-21) 14 (0-41)
Proliferating activated 1 (0-12) 2 (0-1281)
Values are medians, 95 percentiles are in parentheses. RI=Reference interval
In this study, there were more males than females, and the majority of these were in
formal employment with a median age of 29 (IQR, 25-37) Table 6-1. Hb, BMI and
grip strength results for both male and female participants were within the normal
ranges, which are Hb range for females (12 - 15 g/dl) and 13.5 – 18 g/dl in males,
BMI (18.5 – 25 kg/m2). As expected, grip strength differed substantially by sex.
Absolute CD4 was 824 (IQR, 558-1044) and CD8 1371 (IQR, 1136-771) were also

Chapter 6: Results
Caroline Cleopatra Chisenga Ph.D. Thesis
82
within normal ranges (CD4 400 – 1200; CD8 150 – 1000), most of the individuals
were married and had attained university education.
Generally, in both females and males, CD4 and CD8 absolute values were within the
reference intervals (Table 6-2). T cell subset ranges are also shown in Table 6-2.

Chapter 6: Results
Caroline Cleopatra Chisenga Ph.D. Thesis
83
Figure 6-2 Total CD4 and subset distribution in healthy Zambian adults using surface marker expression
Total CD4 Hom Hom_Act Thymic Sene 1 Proli_Act Sene 2 Activ Proli
Median marker number 824 271 170 30 19 16 6 6 4
0
100
200
300
400
500
600
700
800
900
Ce
lls/
μL
Surface marker expression
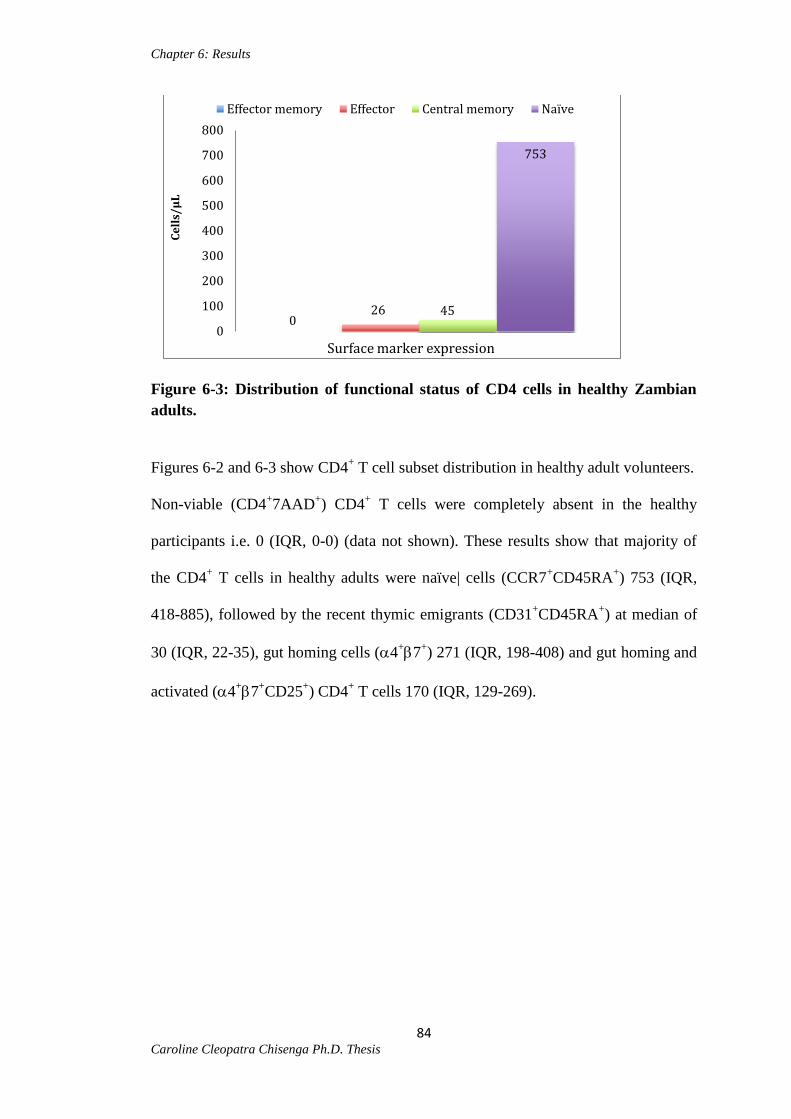
Chapter 6: Results
Caroline Cleopatra Chisenga Ph.D. Thesis
84
Figure 6-3: Distribution of functional status of CD4 cells in healthy Zambian
adults.
Figures 6-2 and 6-3 show CD4+ T cell subset distribution in healthy adult volunteers.
Non-viable (CD4+7AAD
+) CD4
+ T cells were completely absent in the healthy
participants i.e. 0 (IQR, 0-0) (data not shown). These results show that majority of
the CD4+ T cells in healthy adults were naïve| cells (CCR7
+CD45RA
+) 753 (IQR,
418-885), followed by the recent thymic emigrants (CD31+CD45RA
+) at median of
30 (IQR, 22-35), gut homing cells (4+7
+) 271 (IQR, 198-408) and gut homing and
activated (4+7
+CD25
+) CD4
+ T cells 170 (IQR, 129-269).
0 26 45
753
0
100
200
300
400
500
600
700
800
Effector memory Effector Central memory Naïve
Surface marker expression
Ce
lls/
μL
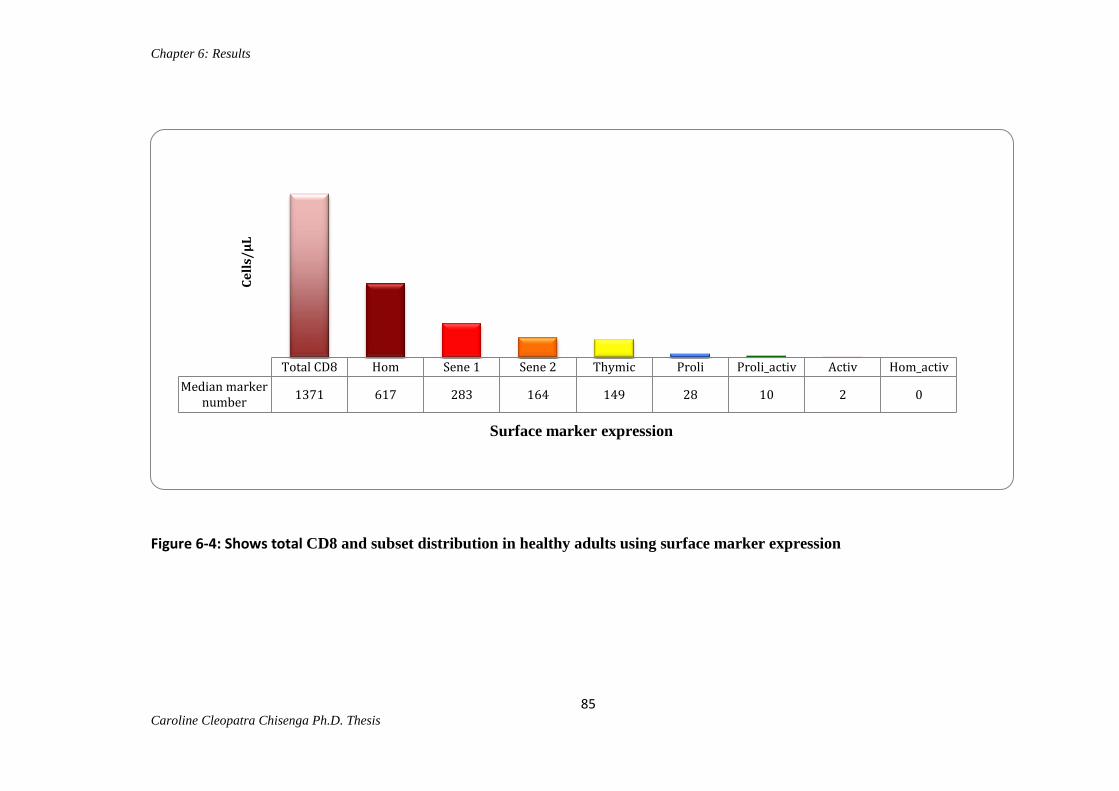
Chapter 6: Results
Caroline Cleopatra Chisenga Ph.D. Thesis
85
Figure 6-4: Shows total CD8 and subset distribution in healthy adults using surface marker expression
Total CD8 Hom Sene 1 Sene 2 Thymic Proli Proli_activ Activ Hom_activ
Median marker number
1371 617 283 164 149 28 10 2 0
Ce
lls/
μL
Surface marker expression

Chapter 6: Results
Caroline Cleopatra Chisenga Ph.D. Thesis
86
Figure 6-5: Distribution of functional status of CD8 cells in healthy Zambian
adults.
In the CD8+ T cell subsets (Figure 6-4), there were no homing activated cells i.e. 0
(IQR, 0-0). Similarly, expression of activation markers was minimal 2 (0, 6), as were
proliferating markers 28 (IQR, 17-38), non-viable cells 0 (0, 0) and cells expressing
both proliferation and activation markers 10 (IQR, 4-19).
CD8+ recent thymic emigrants T cells were moderately expressed i.e. 149 (105, 381),
central memory 191 (IQR, 109-282), senescent 2 (CD57+CD28
-) 164 (IQR, 36-332)
and moderate expression of naïve CD8+ T cells 255 (IQR, 127-401).
Senescent 1 (CD57+ only) CD8
+ T cells were 283 (IQR, 182-452) and effector
memory cells at 374 (IQR, 185-481). Thus, in the CD8+ T cells population, majority
of the subset cells are gut homing cells 617 (IQR, 429-985) followed by effector
cells 564 (IQR, 305-732).
250
560
370
191
0
200
400
600
800
1000
1200
1400
1600 Naïve
Central memory
Effector memory
Effector
Cel
ls/μ
L
Surface marker expression

Chapter 6: Results
Caroline Cleopatra Chisenga Ph.D. Thesis
87
Table 6-3: CD4 and CD8 Subset in Healthy Population Stratified by Sex
CD4 Males
(N=34)
CD4 Females
(N=17)
CD8 Males
(N=34)
CD8 Females
(N=17)
Variable Median (IQR) Median (IQR) P value Median (IQR) Median (IQR) P value
Absolute number 671 (545, 899) 1042 (864, 1270) 0.003 1346 (1101, 1801) 1531 (1248, 1740) 0.42
Homing 239 (183, 354) 413 (324, 471) 0.01 627 (475, 1004) 536 (393, 758) 0.33
Homing and activated 160 (122, 257) 247 (139, 385) 0.07 0 (0, 0) 0 (0,0) 0.22
Thymic 28 (20, 34) 31 (28, 36) 0.21 254 (106, 396) 146 (84, 366) 0.48
Senescent 1 18 (12, 38) 31 (13, 55) 0.63 282 (231, 394) 426 (75, 497) 0.99
Senescent 2 6 (1, 16) 10 (4, 17) 0.46 163 (46, 297) 193 (24, 439) 0.48
Naive 573 (411, 806) 904 (657, 1006) 0.02 256 (134, 587) 227 (83, 380) 0.30
Central memory 43 (14, 90) 51 (14, 99) 0.72 204 (112, 388) 154 (84, 228) 0.23
Effector memory 0 (0, 1) 1 (0, 9) 0.01 316 (73, 455) 435 (348, 514) 0.08
Effector 9 (0, 93) 55 (15, 261) 0.01 472 (106, 628) 695 (533, 776) 0.04
Proliferating 4 (1, 6) 3 (3, 7) 0.30 29 (18, 38) 28 (17, 43) 0.91
Activation 7 (2, 12) 4 (2, 14) 0.85 2 (0, 6) 1 (0, 5) 0.47
Proliferating and activated 12 (8, 21) 22 (14, 28) 0.10 14 (5, 21) 4 (2, 17) 0.08
Mann–Whitney U-tests were used for non-parametric variables and continuous characteristics are expressed as median (interquartile range)

Chapter 6: Results
Caroline Cleopatra Chisenga Ph.D. Thesis
88
Stratification by sex showed very interesting results for the same population. In the
CD4+
population, females had higher absolute CD4+ count, gut homing, naïve,
effector memory and effector CD4+
T cells than males (Table 6-3). However in the
CD8+ population, only effector cells were significantly different between the females
and males (Table 6-3). However, although females had higher CD4 and CD8 cells
than the males, the overall distribution of both CD4 and CD8 was similar.
6.2 Retrospective analysis of overall changes in total CD4 count in NUSTART
study
In this study, 267 files of NUSTART study participants that had completed their 12
weeks were reviewed. Baseline absolute CD4 and week 12 counts were recorded.
Figure 6-6: Shows baseline CD4 count and 12 weeks after ART and nutritional
!
CD4 count at baseline (cells/m CD4 count at 12 weeks (cells/m0
200
400
600
800
1000
CD
4 C
ou
nt
CD4 count at baseline (cells/m CD4 count at 12 weeks (cells/m0
200
400
600
800
1000
CD
4 c
ou
nt

Chapter 6: Results
Caroline Cleopatra Chisenga Ph.D. Thesis
89
supplementation at p<0.0001. There was a significant increase in median CD4 count
after 12 weeks.
In this analysis, although the majority of individuals had an increase in absolute CD4
count, there were a few individuals whose CD4 count actually dropped after 12
weeks of ART and nutritional support. For others, the increase was almost three
times the initial count. The median CD4 count at enrolment was 145 cells/μL
interquartile range of 74-212. After 12 weeks, the median increased to 266 (IQR,
180-390) with the calculated delta change being 140 (IQR, 53-216).
6.2.1 Randomised Controlled Trial-NUSTART
The first aim of this study was to determine whether specific T cell subsets predict
mortality in a cohort of HIV-infected Zambian adults initiating ART. The second aim
was to assess whether T cell subsets change over time in patients randomised to
LNS-VM compared to LNS alone.
A total of 189 HIV-infected adult men and women were enrolled in this sub-study
and randomised to either LNS or LNS-VM. Participants were excluded from analysis
if some baseline CD4+ and CD8
+ T cell panel data were missing (n=3 LNS and n=5
LNS-VM). Of the remaining 181 participants, 90 were in the LNS and 91 in the
LNS-VM group (Figure 8-1). Of 181 participants, 36 (20%) died at median 5.7 (IQR,
3.5-10.1) weeks after ART initiation; 145 (80%) survived through 12 weeks after
initiating ART.

Chapter 6: Results
Caroline Cleopatra Chisenga Ph.D. Thesis
90
Figure 6-7: Flow of participants through the study
Total NUSTART trial
randomized (1815)
T cell sub-study
Recruited (189)
LNS n=93 LNS-VM n=96
Follow-up
Loss to follow-up
-Before week 12 n=2
-Alive but no week 12
data n=25
-Died before week 12
n= 20
-Completed week 12
n=43
Loss to follow-up
-Before week 12 n=4
-Alive but no week 12
data n=26
-Died before week 12
n= 16
-Completed week 12
n=45
Final analysis
Included in analysis for the
effect of LNS on T cell
subsets n=43
Included in the mortality
analysis
Dead n=20
Alive n=70
Included in analysis for the
effect of LNS on T cell
subsets n=45
Included in the mortality
analysis
Dead n=16
Alive n=75
Excluded due to
missing data
n=3
LNS-VM n=91 LNS n=90
Excluded due to
missing data
n=5

Chapter 6: Results
Caroline Cleopatra Chisenga Ph.D. Thesis
91
Table 6-4: Baseline Clinical and Nutritional Characteristics of HIV-infected Adult Zambian Men and Women
Survivor Status Clinical Trial
Variable Died (n=36) Survived (n=145) P value LNS (n=90) LNS-VM (n=91)
Age (years) 36 (34, 42) 35 (30, 41) 0.10 36 (33, 42) 36 (31, 42)
Male 20 (56%) 82 (57%) 0.53 47 (51%) 60 (63%)
Haemoglobin (g/dl) 10.6 (9.2, 12.3) 10.3 (8.7, 11.6) 0.45 10.0 (8.5, 12.0) 10.7 (9.5, 11.4)
Total CD4 (cells/l) 73 (39, 145) 125 (58, 234) 0.01 119 (66, 264) 87 (55, 205)
Total CD8 (cells/l) 893 (516, 1270) 856 (583, 1370) 0.51 962 (596, 1304) 974 (674, 1542)
BMI (kg/m2) 16.4 (15.6, 17.2) 16.7 (15.8, 17.8) 0.07 17.0 (16.0, 18.1) 16.6 (15.8, 17.6)
Grip strength (kg) 14.5 (8.7, 16.8) 20.2 (15.4, 24.9) <0.0001 20.2 (14.9, 26.6) 20.0 (15.5, 24.1)
On TB treatment 6 (17%) 49 (34%) <0.05 19 (21%) 36 (39%)
Education
- No education 5 (14%) 19 (13%) 0.85 14 (15%) 10 (13%)
- Primary 18 (50%) 62 (43%) 37 (42%) 42 (44%)
- Secondary 12 (33%) 59 (41%) 36 (40%) 37 (38%)
- Tertiary 1 (3%) 4 (3%) 3 (3%) 2 (5%)
Occupation
- Employed 14 (39%) 82 (57%) 0.17 47 (51%) 49 (52%)
Marital status
- Single 18 (50%) 57 (39%) 0.45 32 (36%) 35 (38%)
- Married 16 (44%) 74 (51%) 52 (55%) 47 (50%)
- Widowed 2 (6%) 14 (10%) 6 (9%) 9 (12%)
Mann–Whitney U-tests were used for non-parametric variables and t tests for parametric variables. Continuous characteristics are expressed as
median (interquartile range) and dichotomous characteristics are expressed as n (%). g/dl=grams per decilitre; BMI= body mass index;
LNS=lipid-based nutritional supplement; LNS-VM=LNS with added vitamins and minerals

Chapter 6: Results
Caroline Cleopatra Chisenga Ph.D. Thesis
92
Groups randomised to LNS and LNS-VM was similar (Table 6-4). Those who died had lower baseline total CD4+ cell count, lower grip strength
and a small difference in BMI than survivors (Table 6-4).
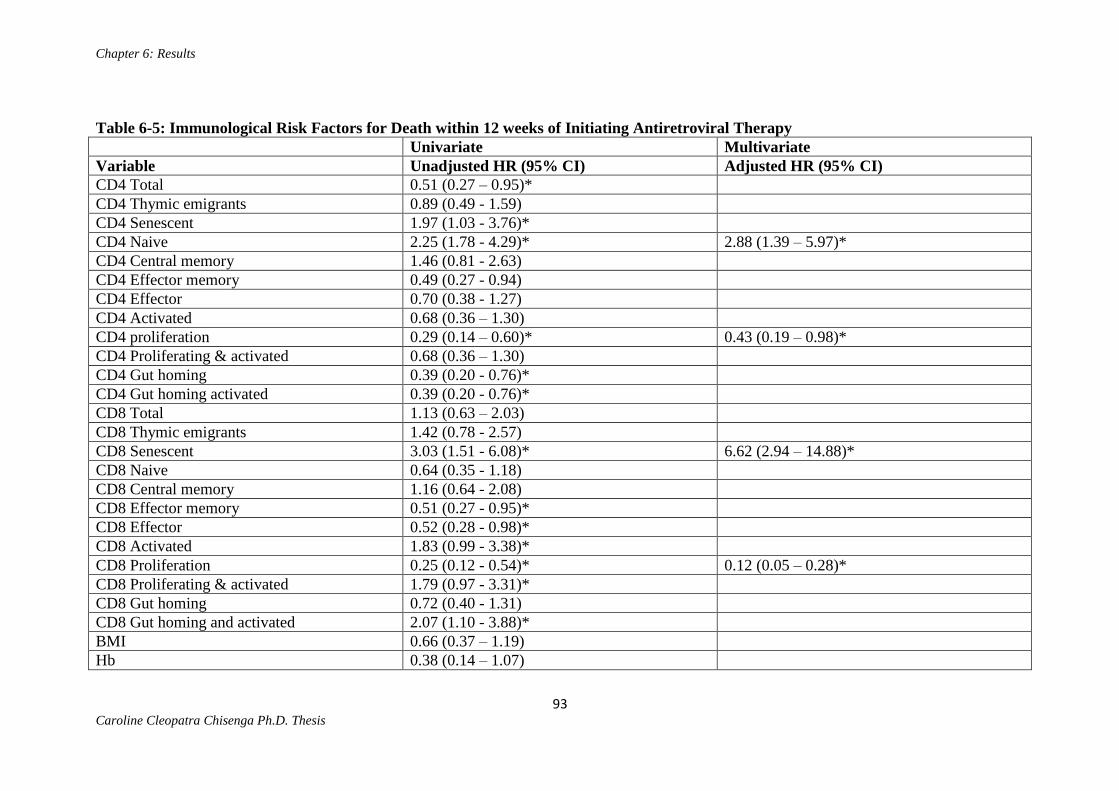
Chapter 6: Results
Caroline Cleopatra Chisenga Ph.D. Thesis
93
Table 6-5: Immunological Risk Factors for Death within 12 weeks of Initiating Antiretroviral Therapy
Univariate Multivariate
Variable Unadjusted HR (95% CI) Adjusted HR (95% CI)
CD4 Total 0.51 (0.27 – 0.95)*
CD4 Thymic emigrants 0.89 (0.49 - 1.59)
CD4 Senescent 1.97 (1.03 - 3.76)*
CD4 Naive 2.25 (1.78 - 4.29)* 2.88 (1.39 – 5.97)*
CD4 Central memory 1.46 (0.81 - 2.63)
CD4 Effector memory 0.49 (0.27 - 0.94)
CD4 Effector 0.70 (0.38 - 1.27)
CD4 Activated 0.68 (0.36 – 1.30)
CD4 proliferation 0.29 (0.14 – 0.60)* 0.43 (0.19 – 0.98)*
CD4 Proliferating & activated 0.68 (0.36 – 1.30)
CD4 Gut homing 0.39 (0.20 - 0.76)*
CD4 Gut homing activated 0.39 (0.20 - 0.76)*
CD8 Total 1.13 (0.63 – 2.03)
CD8 Thymic emigrants 1.42 (0.78 - 2.57)
CD8 Senescent 3.03 (1.51 - 6.08)* 6.62 (2.94 – 14.88)*
CD8 Naive 0.64 (0.35 - 1.18)
CD8 Central memory 1.16 (0.64 - 2.08)
CD8 Effector memory 0.51 (0.27 - 0.95)*
CD8 Effector 0.52 (0.28 - 0.98)*
CD8 Activated 1.83 (0.99 - 3.38)*
CD8 Proliferation 0.25 (0.12 - 0.54)* 0.12 (0.05 – 0.28)*
CD8 Proliferating & activated 1.79 (0.97 - 3.31)*
CD8 Gut homing 0.72 (0.40 - 1.31)
CD8 Gut homing and activated 2.07 (1.10 - 3.88)*
BMI 0.66 (0.37 – 1.19)
Hb 0.38 (0.14 – 1.07)

Chapter 6: Results
Caroline Cleopatra Chisenga Ph.D. Thesis
94
Sex 0.97 (0.54 – 1.74)
Grip strength 0.23 (0.11 – 0.50)* 0.23 (0.10 – 0.53)*
All variables were calculated using absolute numbers. Thirty-six participants died within 12 weeks of follow up. All variables were dichotomized;
univariate logistic regression models were constructed comparing the upper half of the distribution with the lower half. Multivariate analysis was
done using a Cox regression model, and was adjusted for, total CD4 and CD8 counts plus BMI, haemoglobin, sex and grip strength. HR=hazard
ratio *=significant CI (confidence interval).

Chapter 6: Results
Caroline Cleopatra Chisenga Ph.D. Thesis
95
In univariate analysis of dichotomised variables, fewer total CD4+, more senescent or
naive, fewer proliferating, fewer gut homing, and gut homing activated CD4+ T cells
were all predictors of death (Table 6-5). More senescent, activated, activated
proliferating, or activated gut homing, and fewer effector, effector memory or
proliferating, CD8+
T cells also predicted death (Table 6-5).
Using a Cox regression model that included all baseline cellular CD4+ and CD8
+
subsets plus BMI, haemoglobin, grip strength and sex, higher numbers of circulating
naïve CD4+ and senescent CD8
+ cells were associated with increased mortality, whilst
higher numbers of proliferating CD4+ and CD8
+ cells were associated with reduced
risk of mortality by 12 weeks (Table 6-5).
Figure 6-8: Kaplan-Meier plot of survival over time of follow up in patients with
high (dashed line) or low (solid line) absolute number of CD4+ cells expressing the
proliferation marker Ki67 (p=0.0003 using log rank test).

Chapter 6: Results
Caroline Cleopatra Chisenga Ph.D. Thesis
96
Figure 6-9: Kaplan-Meier plot of survival over time of follow up in patients with low
(dashed line) or high (solid line) absolute number of CD4+ cells expressing the naive
markers CD45RA and CCR7 (p<0.001 using log rank test).
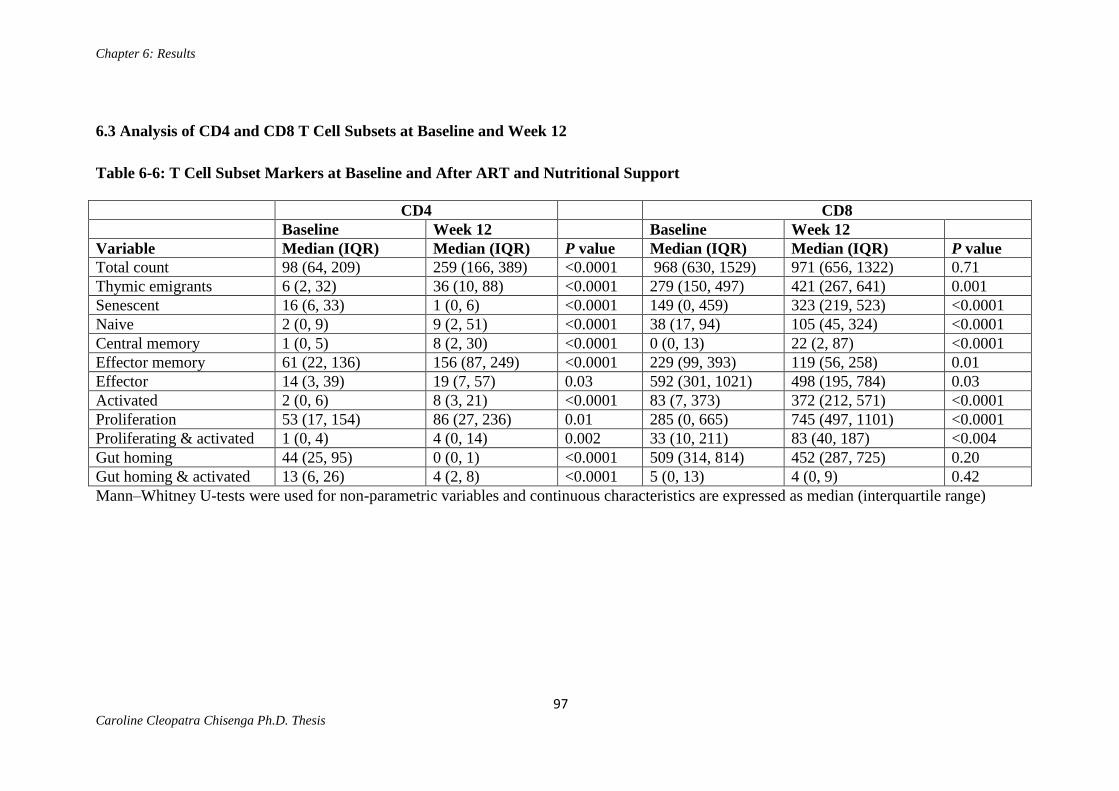
Chapter 6: Results
Caroline Cleopatra Chisenga Ph.D. Thesis
97
6.3 Analysis of CD4 and CD8 T Cell Subsets at Baseline and Week 12
Table 6-6: T Cell Subset Markers at Baseline and After ART and Nutritional Support
CD4 CD8
Baseline Week 12 Baseline Week 12
Variable Median (IQR) Median (IQR) P value Median (IQR) Median (IQR) P value
Total count 98 (64, 209) 259 (166, 389) <0.0001 968 (630, 1529) 971 (656, 1322) 0.71
Thymic emigrants 6 (2, 32) 36 (10, 88) <0.0001 279 (150, 497) 421 (267, 641) 0.001
Senescent 16 (6, 33) 1 (0, 6) <0.0001 149 (0, 459) 323 (219, 523) <0.0001
Naive 2 (0, 9) 9 (2, 51) <0.0001 38 (17, 94) 105 (45, 324) <0.0001
Central memory 1 (0, 5) 8 (2, 30) <0.0001 0 (0, 13) 22 (2, 87) <0.0001
Effector memory 61 (22, 136) 156 (87, 249) <0.0001 229 (99, 393) 119 (56, 258) 0.01
Effector 14 (3, 39) 19 (7, 57) 0.03 592 (301, 1021) 498 (195, 784) 0.03
Activated 2 (0, 6) 8 (3, 21) <0.0001 83 (7, 373) 372 (212, 571) <0.0001
Proliferation 53 (17, 154) 86 (27, 236) 0.01 285 (0, 665) 745 (497, 1101) <0.0001
Proliferating & activated 1 (0, 4) 4 (0, 14) 0.002 33 (10, 211) 83 (40, 187) <0.004
Gut homing 44 (25, 95) 0 (0, 1) <0.0001 509 (314, 814) 452 (287, 725) 0.20
Gut homing & activated 13 (6, 26) 4 (2, 8) <0.0001 5 (0, 13) 4 (0, 9) 0.42
Mann–Whitney U-tests were used for non-parametric variables and continuous characteristics are expressed as median (interquartile range)

Chapter 6: Results
Caroline Cleopatra Chisenga Ph.D. Thesis
98
Together with an overall CD4 and CD8 T cell increase after 12 weeks of ART and
nutritional supplementation, hemoglobin, BMI and grip strength also increased in
HIV-infected adults. The baseline median Hb was 10.35 (IQR, 8.85-11.6), and
increased to 12.4 (IQR, 11.05-13.6) after 12 weeks. These results suggest that ART
with supplementation improves Hb. The baseline BMI was at 16.7 (IQR, 15.9-17.8)
whereas at 12 weeks BMI was at 18.45 (IQR, 17.25-19.3). Similarly, ART with
nutritional supplementation seemed to have improved the BMI. Participants’ grip
strength at enrolment was 20.2 with a median IQR of 15.4-25.1. Following 12 weeks
of ART and nutritional supplementation, the grip strength increased to a median of
21.8 and IQR of 18.2-27.9. These results also indicate that there was an improvement
in grip strength at 3 months of ART and nutritional support.
Among all participants in this sub study, the median CD4 count at week 0
(enrolment) was 98 (IQR, 64-209) and at week 12 (primary endpoint) was 259 (IQR,
166-389) (P<0.0001) Table 6-5. However, although there was an increase in absolute
CD4 count in the majority of participants after 12 weeks, these results also show that
a majority of people seeks medical attention late. The median numbers of homing
cells at baseline were 44 (IQR, 25-95) and decreased to 0 (IQR, 0-1) after 12 weeks
of receiving ART and nutritional supplementation. These results indicate that during
HIV infection and before ART was commenced, there was a significant number of
CD4+ T cells homing to the gut and then reduce drastically after treatment. Similar to
the above, there were more homing and activated CD4+ T cells at baseline compared
to 12 weeks after treatment and the intervention (Table 6-5). Baseline numbers of
activated homing CD4+ T cells were at 13 (IQR, 6-26) and after 12 weeks reduced to
4 (IQR, 2-8).

Chapter 6: Results
Caroline Cleopatra Chisenga Ph.D. Thesis
99
There were also few recent thymic emigrants at baseline median 6 (IQR, 2-32)
compared to 12 weeks after the intervention i.e. 36 (IQR, 10-88). These results could
indicate a strain in the thymus that probably is improved after ART and nutritional
support. There was also a general increase in CD4+
T cells expressing the senescent
marker CD57 after the intervention 16 (IQR, 6-33) compared to baseline numbers 1
(IQR, 0-6). These results could indicate an improved response to the virus after 3
months of ART and nutritional support. Contrary to the findings for senescent 1,
there was no significant difference in cells expressing the marker for senescent 2
(CD4+CD57
+CD28
-) at baseline 8 (IQR, 2-23) and 12 weeks 5 (IQR, 1-19). These
results suggest that there is as much activity at 3 months as there is at baseline in
HIV-infected individuals. Naive CD4+ T cells at baseline were few 2 (IQR, 0-9)
compared to 12 weeks after the intervention 9 (IQR, 2-51). This could mean an
improvement in the production and a reduction in the numbers of differentiating cells
or the antigen.
There was an increase in the number of central memory cells from 1 (IQR, 0-5) at
baseline to 8 (IQR, 2-30) after 12 weeks of receiving ART plus nutritional support.
These results indicate that there is an improvement in the cells that mount a quick
response to infection. Baseline effector memory cells were few 61 (IQR, 22-136) and
doubled 12 weeks after intervention 156 (IQR, 87-249). These results show that there
is good immune response to infection after 12 weeks of ART and nutritional support.
Similar to effector memory CD4+
T cells, effector CD4+ T cells also increased after
the intervention although the increase was not as much as in the effector memory cell
population. This steady increase show a slow but sure improvement in the immune
response to the infection. Baseline effector cells were at 14 (IQR, 3-39) and
increased to 19 (IQR, 7-57) after 12 weeks. Proliferating and activated CD4+ T cells

Chapter 6: Results
Caroline Cleopatra Chisenga Ph.D. Thesis
100
at enrolment were few 1 (IQR, 0-4) compared to 12 weeks after the intervention 4
(IQR, 0-14). These results show that there is an improved response to antigens after
12 weeks of receiving ART plus nutritional support. There was also an increase in
the number of activated cells from 2 (IQR, 0-6) to 8 (IQR, 3-21) after the
intervention. These results could mean that the viral load does not drop immediately
after initiating ART with nutritional support assuming that activation is being
triggered by HIV. The number of proliferating CD4+ T cells also increased from 53
(IQR, 17-154) at baseline to 86 (IQR, 27-236) after the intervention. These results
suggest that there is good clonal expansion following treatment.
In table 6-6, absolute CD8+ T cells were comparable both at baseline 968 (IQR, 630-
1529) and at 12 weeks 971 (IQR, 656-1322). Since these are cytotoxic cells that fight
the virus, these results could mean that the amount of HIV after 3 months of ART
plus nutritional support does not immediately go down. There was an insignificant
change in the number of homing CD8+ T cells after the intervention, also suggesting
that there is still high activity in the gut after 12 week of ART and nutritional
support. Gut homing CD8+ T cells at baseline were 509 (IQR, 314-814) and after 3
months CD8+ T cells were at 452 (IQR, 287-725). Activated gut homing and CD8+
T cells did not significantly decrease by 12 weeks of ART plus nutritional support
i.e. from 5 (IQR, 0-13) at baseline and 4 (IQR, 0-9) at 12 weeks. This could mean
that the high number of CD8+ T cells still homing to the gut after the intervention
could be channeled there for repopulation and not necessarily because of infection.
There were few recent thymic emigrant CD8+
T cells at baseline 279 (IQR, 150-497)
compared to 12 weeks after intervention 421 (IQR, 267-641) in the participants. This
may be an indicator of cell repopulation following destruction by the HIV. The

Chapter 6: Results
Caroline Cleopatra Chisenga Ph.D. Thesis
101
number of senescent 1 CD4+ T cells doubled from median of 149 (IQR, 0-459) at
baseline to 323 (IQR, 219-523) at week 12. These results show that probably
programed cell death is slower than can be corrected within 3 months of treatment.
The numbers of senescent 2 (CD8+CD57
+CD28
-) cells both at baseline and week 12
were comparable after the intervention. There were few naïve cells at baseline 38
(IQR, 17-94) and this increased 105 (IQR, 45-324) by 12 weeks post ART and
supplementation. This could mean that there was a reduction in the rate at which
cells differentiate and also in their antigen encounter. Similarly, central memory cells
were almost completely depleted at baseline 0 (IQR, 0-13) and increased to 22 (IQR,
2-87) by 12 weeks. These results could indicate a good immune response of the body
to the antigens. Effector memory cells were 229 (IQR, 99-393) at baseline and
reduced by 12 weeks to 119 (IQR, 56-258). This could mean that there is still more
interaction between the effector cells and the antigen. The number of effector CD8+
T
cells is more at baseline 592 (IQR, 301-1021) than at 12 weeks 498 (IQR, 195-784).
Since effector cells interact with their cognate antigen in the lymphoid tissues, the
reduction could be an indication of reduced antigen in the lymphoid tissues after the
intervention. There were few proliferating and activated CD8+ T cells at baseline 33
(IQR, 10-211) as opposed to 12 weeks after ART and supplementation 83 (IQR, 40-
187). A similar trend as above was observed for activated CD8+ T cells, in that there
were few activated CD8+ T cells at baseline 83 (IQR, 7-373) compared to the
number of cells at 12 weeks i.e. 372 (IQR, 212-571). This could mean that more cells
are primed for antigen encounter after ART and nutritional support than before
initiating ART with nutritional supplementation. There were also fewer proliferating
CD8+ T cells at baseline i.e. 285 (IQR, 0-665) as compared to 12 weeks 745 (IQR,

Chapter 6: Results
Caroline Cleopatra Chisenga Ph.D. Thesis
102
497-1101) after ART and supplementation. This could also be an indication of a
good immune response to antigen.
In Summary,
There was a significant change in either the CD4+ or CD8
+ T cell subsets from
enrolment to 12 weeks after ART and supplementation. Cells either significantly
increased or significantly decreased. In both the CD8 and CD4 senescent 2 subsets,
there were no significant differences between baseline and after 12 weeks. There
were no significant differences in absolute CD8+ T cells, homing CD8
+ T cells and
homing and activated CD8+ T cells in the HIV sero positive individuals.

Chapter 6: Results
Caroline Cleopatra Chisenga Ph.D. Thesis
103
Table 6-7: Baseline T Cell Subset Markers in Patients Allocated to Receive Supplements with (LNS-VM) or without (LNS) Additional
Vitamins and Minerals
CD4 CD8
LNS-VM group
(N=45)
LNS group
(N=43)
LNS-VM group
(N=45)
LNS group (N=43)
Variable Median (IQR) Median (IQR) P value Median (IQR) Median (IQR) P value
Total count 87 (55, 205) 119 (66, 264) 0.26 974 (674, 1542) 962 (596, 1304) 0.46
Thymic emigrants 6 (3, 33) 7 (2, 32) 0.59 277 (155, 444) 279 (139, 542) 0.83
Senescent 2 (0, 6) 1 (0, 9) 0.59 157 (0, 491) 148 (0, 444) 0.66
Naive 2 (1, 15) 2 (0, 5) 0.20 36 (8, 55) 44 (22, 125) 0.12
Central memory 0 (0, 8) 1 (0, 4) 0.55 0 (0, 14) 0 (0, 10) 0.25
Effector memory 62 (18, 127) 61 (32, 172) 0.31 231 (141, 411) 187 (51, 381) 0.09
Effector 9 (3, 32) 22 (6, 43) 0.11 589 (394, 1060) 598 (252, 978) 0.59
Activated 2 (1, 9) 2 (0, 5) 0.48 88 (61, 464) 78 (10, 312) 0.76
Proliferation 39 (18, 137) 65 (13, 183) 0.62 324 (0, 704) 216 (0, 626) 0.49
Proliferating & activated 1 (0, 8) 0 (0, 3) 0.30 63 (13, 249) 24 (4, 128) 0.06
Gut homing 40 (23, 78) 65 (28, 102) 0.33 513 (330, 914) 505 (292,804) 0.89
Gut homing & activated 11 (4, 25) 15 (7, 27) 0.34 4 (0, 12) 6 (0, 14) 0.93
Mann–Whitney U-tests were used for non-parametric variables and continuous characteristics are expressed as median (interquartile range)

Chapter 6: Results
Caroline Cleopatra Chisenga Ph.D. Thesis
104
In the placebo arm the median baseline Hb was at 10 with (IQR, 8.5-12) while in the
active arm Hb was at median 10.7 (IQR, 9.5-11.4). Thus there were no significant
differences at baseline in the participants enrolled to the sub-study. Participants
receiving placebos increased their Hb 12.5 (IQR, 11.2-13.6) as much as those in the
active group 12.2 (IQR, 10.9-13.3). BMI baseline results were also similar. The
median BMI for participants in the placebo group was 17 (IQR, 16-18.1) and 16.6
(IQR, 15.8-17.6) in the active group. Similarly, there were no significant differences
in BMI after 12 weeks of receiving ART and supplementation in both groups.
Median BMI at 12 weeks for the placebo group was 18.6 (IQR, 17.1-19.2) and 18.3
(IQR, 17.3-19.3) in the active group. Grip strength for both groups was comparable
at baseline. Participants in the placebo arm had median grip strength of 20.2 (IQR,
14.9-26.6) and 20 (IQR, 15.5-24.1) in the active arm. After 12 weeks of ART and
nutritional supplementation, the grip strength in both arms was the same. In the
placebo group, the median grip strength was 20.7 (IQR, 17.8-26.4) and 21.8 (IQR,
18.5-28.1) in the active arm. Analysis of the CD4+ and CD8
+ T cell subsets showed
that all subsets were similar at enrolment in the participants (Table 6-5).
In Summary,
Before the start of ART, there were more absolute CD8 cells compared to the
number of CD4. At enrolment, most of the CD8 were effector cells whereas in the
CD4 population, majority of the cells were effector memory. In both the CD8 and
CD4 population, central memory cells were almost completely absent at enrolment.
And there was a considerable number of gut homing cells in both CD8 and CD4
populations at enrolment compared to 12 weeks after.

Chapter 6: Results
Caroline Cleopatra Chisenga Ph.D. Thesis
105
6.4 Sub Study Analysis of CD4 and CD8 Change by Arm
Table 6-8: Increase in T Cell Subset Markers in Patients Receiving Supplements with (LNS-VM) or without (LNS) Additional Vitamins
and Minerals after 12 weeks.
CD4 CD8
LNS-VM group
(N=45)
LNS group
(N=43)
LNS-VM group
(N=45)
LNS group
(N=43)
Variable Median (IQR) Median (IQR) P value Median (IQR) Median (IQR) P value
Total count 257 (150, 389) 274 (186, 374) 0.61 1096 (720, 1424) 932 (590, 1214) 0.23
Thymic emigrants 25 (8, 83) 47 (18, 95) 0.045 375 (269, 521) 458 (242, 668) 0.40
Senescent 17 (6, 29) 11 (6, 43) 0.85 370 (266, 549) 287 (193, 408) 0.08
Naive 7 (1, 62) 13 (3, 35) 0.77 90 (40, 305) 111 (48, 455) 0.29
Central memory 7 (2, 27) 11 (3,30) 0.56 19 (0, 84) 22 (4, 90) 0.43
Effector memory 160 (96, 219) 155 (86, 274) 0.82 526 (205, 968) 104 (62, 223) 0.16
Effector 20 (6, 54) 19 (9, 69) 0.72 526 (205, 968) 412 (185, 765) 0.26
Activated 8 (3, 22) 8 (3, 20) 0.88 384 (240, 663) 354 (189, 532) 0.26
Proliferation 85 (23, 189) 86 (27, 300) 0.70 736 (445, 1037) 853 (555, 1173) 0.48
Proliferating & activated 4 (0, 10) 3 (0, 15) 0.98 104 (44, 224) 82 (39, 158) 0.41
Gut homing 0 (0,1) 0 (0, 1) 0.18 458 (314, 747) 427 (275, 662) 0.70
Gut homing & activated 4 (2, 7) 4 (2, 9) 0.34 4 (1, 8) 4 (0, 12) 0.95
Mann–Whitney U-tests were used for non-parametric variables and continuous characteristics are expressed as median (interquartile range)

Chapter 6: Results
Caroline Cleopatra Chisenga Ph.D. Thesis
106
There were no significant differences in absolute CD4 counts for the participants
after 12 weeks of ART and nutritional support. The median absolute CD4 count in
the placebo group at 12 weeks was 274 (IQR, 186-374) and 257 (IQR, 150-389) in
the active group (Table 6-8). Homing CD4+ T cells after 12 weeks of receiving ART
plus nutritional supplementation was the same in both arms; 0 (IQR, 0-1) in the
placebo group and 0 (IQR, 0-1) in the active arm. There was a significant difference
between the placebo and the active groups in the CD4+ T cell recent thymic
emigrants after 12 weeks of receiving ART and supplementation. The median
number of CD4+ T cell recent thymic emigrants for the placebo group was 47 IQR
18-95 and 25 IQR 8-83 for the active group. The median CD4 count in senescent 1 in
the placebo group was 11 IQR 6-43 and 17 IQR of 6-29) in the active group
(p=0.85).
The numbers of central memory CD4+ T cells after 12 weeks were comparable; 11
(IQR, 3-30) in the placebo group 7 (IQR, 2-27) in the active group after 12 weeks of
ART and supplementation. After 12 weeks of receiving the intervention, the number
of effector memory CD4+ T cells increased proportionately and were comparable;
155 (IQR, 86-274) in the placebo group and 160 (IQR, 96-219) in the active group.
After 12 weeks of receiving the intervention, although there was a slight decrease in
the placebo group and a slight increase in the active group, the overall figure were
comparable; 19 (IQR, 9-69) in the placebo and 20 (IQR, 6-54) in the active group
after 12 weeks of ART and nutritional support. After 12 weeks of ART plus
nutritional supplementation, proliferating and activated CD4+ T cells similar in both
the placebo and active groups: 3 (IQR, 0-15) and 4 (IQR, 0-10) respectively.
Activated CD4+ T cells were similar in both arms and increased proportionately at 12

Chapter 6: Results
Caroline Cleopatra Chisenga Ph.D. Thesis
107
weeks to 8 (IQR, 3-20) and 8 (IQR, 3-22) respectively. Similarly, there were no
significant differences in the proliferating CD4+ T cells after treatment between the
two groups, although the numbers in both groups increased proportionately. The
median number for proliferating CD4+ T cells at 12 weeks was 86 (IQR, 27-300) in
the active group and 85 (IQR, 23-189) in the active group.
The absolute number of CD8+ T cells did not differ between the two groups; 932
(IQR, 590-1214) in the placebo group and 1096 (IQR, 720-1424) in the active group
after 12 weeks of ART and nutritional supplementation. The number of homing
CD8+ T cells were also similar; 427 (IQR, 275-662) in the placebo group and 458
(IQR, 314-747) in the active group respectively. The median homing and activated
CD8+ T cell number was 6 (IQR, 0-14) in the placebo group and 4 (IQR, 0-12) in the
active group. The number of homing and activated CD8+ T cells was also similar: 4
(IQR, 0-12) in the placebo and 4 (IQR, 1-8) in the active group after 12 weeks of
receiving ART plus nutritional support. The median number in the placebo group
was 458 (IQR, 242-668) and 375 (IQR, 269-521) in the active group. After 12 weeks
of taking ART plus nutritional support, there were no significant differences in the
two arms. However, there was a proportionate increase in the number of senescent 1
CD8+ T cells after 12 weeks compared to the baseline number. The median senescent
1 in the placebo arm after 12 weeks was 287 (IQR, 193-408) and 370 (IQR, 266-549)
in the active group. After 12 weeks of ART and supplementation, senescent 2 CD8+
T cells were similar. In the placebo group, the median number was 245 (IQR, 131-
397) and 324 (IQR, 229-512) in the active group. Similarly, there were no significant
differences in the naive CD8+ T cells after 12 weeks of ART plus nutritional support
in both the placebo group; 111 (IQR, 48-455) and 90 (IQR, 40-305) in the active

Chapter 6: Results
Caroline Cleopatra Chisenga Ph.D. Thesis
108
group. In the placebo group, the median number was 0 (IQR, 0-10) and 0 (IQR, 0-
14) in the active group. At 12 weeks after receiving the intervention, the number of
central memory CD8+ T cells in the placebo arm was 22 (IQR, 4-90) and 19 (IQR, 0-
84). Similarly, there were no significant differences between the two groups in the
central memory cells. There were no significant differences in both groups after 12
weeks of receiving ART with nutritional supplementation. In the placebo arm, the
median was 104 (IQR, 62-223) and 526 (IQR, 205-968) in the active arm. Effector
CD8+ T cells in both groups were similar at baseline. The median effector CD8
+ T-
cells in the placebo group was 598 (IQR, 252-978) and 589 (IQR, 394-1060) in the
active arm. Effector CD8+ T cells after 12 weeks were similar in the arms. The
median number in the placebo group was 412 (IQR, 185-765) and 526 (IQR, 205-
968) in the active group. The median number in the placebo group was 24 (IQR, 4-
128) and 63 (IQR, 13-249) in the active group. Although there was an increase in the
number of proliferating and activated CD8+ T cells by week 12, the increase was
proportionate in both groups. The median number for proliferating and activated
CD8+ T cells in the placebo group was 82 (IQR, 39-158) and 104 (IQR, 44-224) in
the active group. After 12 weeks of receiving ART and nutritional support, there was
no significant difference between the two arms. The placebo arm had a median
number of 354 (IQR, 189-532) and 384 (IQR, 240-663) in the active group.
Proliferating CD8+ T cells were comparable after 3 months of receiving ART and the
nutritional supplementation in the placebo (median 736) and active (median 853)
group. In other words there was no significant difference between the numbers of
CD8+ T cells in both arms.

Chapter 6: Results
Caroline Cleopatra Chisenga Ph.D. Thesis
109
In Summary,
Of all the T cell subsets analysed, only the increase in CD4+ of recent thymic
emigrants was significantly different in the participants allocated to receive LNS-VM
compared to LNS.

Chapter 6: Results
Caroline Cleopatra Chisenga Ph.D. Thesis
110
Table 6-9: The Delta Changes in T Cell Subset Markers in Patients Receiving Supplements with (LNS-VM) or without (LNS) Additional
Vitamins and Minerals after 12 weeks.
CD4 CD8
Change in LNS-
VM group (N=45)
Change in LNS
group (N=43)
Change in LNS-
VM group (N=45)
Change in LNS
group (N=43)
Variable Median (IQR) Median (IQR) P value Median (IQR) Median (IQR) P value
Total count 126 (82, 210) 122 (81, 204) 0.98 -27 (-284, 173) 7 (-300, 213) 0.83
Thymic emigrants 8.5 (1.5, 41) 29 (7, 61) 0.01 144 (-27, 306) 87 (20, 221) 0.88
Senescent -1 (-11, 8) -0.5 (-10, 11) 0.93 44 (-112, 191) 10 (-90, 194) 0.81
Naive 2 (-2, 28) 7 (0, 30) 0.27 46 (0, 221) 32 (-19, 380) 0.90
Central memory 5 (-2, 27) 6.5 (1, 25) 0.40 11 (0, 66) 20 (0, 79) 0.34
Effector memory 91 (39, 145) 64 (25, 169) 0.45 -71 (-141, 30) -65 (228,57) 0.81
Effector 7 (-1, 32) 3 (-10, 30) 0.27 -130 (-299, 72) -78 (-542, 133) 0.80
Activated 4 (0, 16) 4 (-1, 17) 0.73 194 (-31, 431) 196 (52, 371) 0.94
Proliferation 50 (-30, 126) 62 (-6, 106) 0.69 377 (-98, 877) 350 (25, 782) 0.81
Proliferating & activated 1 (-2, 8) 2 (-1, 10) 0.48 25 (-16, 174) 41 (-16, 123) 0.72
Gut homing -39 (-78, -22) -64 (-102, -27) 0.33 -51 (-186, 55) -65 (-273, 62) 0.93
Gut homing & activated -8 (-15, -2) -11 (-20, 0) 0.62 0 (-4, 4) 0 (-6, 3) 0.90
Mann–Whitney U-tests were used for non-parametric variables and continuous characteristics are expressed as median (interquartile range)

Chapter 6: Results
Caroline Cleopatra Chisenga Ph.D. Thesis
111
6.5 Selenium Dose Response (in-vitro) Study Results
Table 6-10: Baseline Characteristics for the Participants
Variable Females N=17 Males N=34 P value
Age (Years) 34 (27, 45) 23 (28, 34) 0.01
Absolute CD4 count (Cells/μL) 1042 (864, 1270)
671 (545, 899) 0.003
Absolute CD8 count (Cells/μL) 1531 (1248, 1740)
1346 (1101, 1801) 0.42
Hb (g/dl) 13.3 (11.3, 14)
15.6 (14.8, 16.6) 0.0001
BMI (Kg/m2) 25.03 (23.3, 28.88)
23.18 (21.18, 25.5) 0.07
Grip Strength (Kg) 25.9 (23.8, 27.5)
44.7 (39.9, 47.7) 0.0001
Plasma Se (μmol/L) 1.33 (1.06, 1.50) 1.38 (0.78, 1.67) 0.64
Education
University
College
Secondary
Primary
8 (16%)
6 (12)
2 (4%)
1 (2%)
22 (43%)
6 (12%)
6 (12%)
0
0.21

Chapter 6: Results
Caroline Cleopatra Chisenga Ph.D. Thesis
112
Occupation
Employed
Students
Business
Unemployed
11 (22%)
4 (8%)
1 (2%)
1 (2%)
23 (45%)
11 (22%)
0
0
0.22
Marital status
Married
Single
Divorce
10 (20%)
6 (12%)
1 (2%)
17 (33.33%)
17 (33.33%)
0
0.23
1
Mann–Whitney U-tests were used for non-parametric variables and Pearson chi square for categorical variables. Continuous characteristics are
expressed as median (interquartile range) and dichotomous characteristics are expressed as n (%). g/dl=grams per decilitre; Hb= haemoglobin;
BMI= body mass index
Although females appeared to have sufficient Se levels, of all the females (17), four (24 %) were deficient. Whilst of the thirty-four males, 10
(29%) were deficient. Individual surface markers were explored by sex at baseline and at 3 different concentrations of Se.

Chapter 6: Results
Caroline Cleopatra Chisenga Ph.D. Thesis
113
Table 6-11: Baseline CD4 and CD8 T Cell Subsets Between Females and Males
CD4 CD8
Variable (%) Females (N= 17) Males (N= 34) P value Females (N=17) Males (N= 34) P value
Thymic 73 (61, 90) 85 (60, 95) 0.22 9 (7, 26) 15 (7, 33) 0.36
Naive 80 (68, 93) 87 (80, 91) 0.20 17 (9, 20) 22 (11, 43) 0.09
Central Memory 6 (1, 8) 6 (2, 12) 0.25 10 (6, 13) 14 (10, 30) 0.03
Effector memory 0 (0, 1) 0 (0, 0) 0.02 30 (25, 38) 27 (5, 31) 0.14
Effector 5 (1, 30) 2 (0, 12) 0.03 43 (39, 51) 38 (8, 47) 0.03
Homing 41 (31, 47) 35 (30, 40) 0.28 41 (32, 46) 47 (41, 59) 0.04
Homing activated 24 (17, 28) 25 (20, 29) 0.68 0 (0, 0) 0 (0, 0) 0.22
Activated 1 (0, 2) 1 (0, 2) 0.29 0 (0, 0) 0 (0, 0) 0.73
Proliferating 0 (0, 1) 1 (0, 1) 0.98 2 (1, 3) 2 (1, 3) 0.89
Proliferating activated 2 (1, 3) 2 (1, 3) 0.65 1 (0, 1) 1 (0, 1) 0.06
Senescent 1 2 (1, 5) 3 (2, 7) 0.46 25 (11, 33) 22 (12, 30) 0.82
Senescent 2 1 (0, 2) 1 (0, 3) 0.87 19 (2, 26) 14 (5, 25) 0.55
Mann–Whitney U-tests were used for non-parametric variables and continuous characteristics are expressed as median (interquartile range)

Chapter 6: Results
Caroline Cleopatra Chisenga Ph.D. Thesis
114
Table 6-12: CD4 and CD8 T Cell Response to 180 µmol/L Selenium Concentration Between Females and Males
CD4 CD8
Variable (%) Females (N= 17) Males (N= 34) P value Females (N=17) Males (N= 34) P value
Thymic 40 (24, 82) 85 (60, 95) 0.22 21 (10, 86) 25 (5, 83) 0.58
Naive 75 (60, 82) 74 (50, 92) 0.67 43 (18, 67) 81 (46, 93) 0.02
Central memory 18 (11, 25) 14 (6, 33) 0.61 21 (4, 45) 3 (0, 9) 0.01
Effector memory 0 (0, 3) 0 (0, 2) 0.86 2 (0, 19) 0 (0, 3) 0. 23
Effector 0 (4, 15) 0 (0, 2) 0.04 6 (0, 25) 0 (0, 7) 0.09
Homing 75 (57, 85) 75 (65, 88) 0.07 28 (4, 68) 57 (17, 99) 0.06
Homing activated 57 (17, 88) 57 (39, 100) 0.53 0 (0, 0) 0 (0, 55) 0.83
Activated 0 (0, 3) 1 (0, 2) 0.29 0 (0, 0) 0 (0, 0) 0.63
Proliferating 0 (0, 0) 0 (0, 0) 0.58 0 (0, 0) 0 (0, 0) 0.18
Proliferating activated 0 (0, 0) 0 (0, 0) - 0 (0, 0) 0 (0, 0) -
Senescent 1 0 (0, 23) 16 (0, 51) 0.08 20 (0, 29) 31 (0, 60) 0.10
Senescent 2 0 (0, 0) 0 (0, 1) 0.01 0 (0, 5) 0 (0, 11) 0.40
Mann–Whitney U-tests were used for non-parametric variables and continuous characteristics are expressed as median (interquartile range)

Chapter 6: Results
Caroline Cleopatra Chisenga Ph.D. Thesis
115
Table 6-13: CD4 and CD8 T Cell Response to 200 µmol/L Selenium Concentration Between Females and Males
CD4 CD8
Variable (%) Females (N= 17) Males (N= 34) P value Females (N=17) Males (N= 34) P value
Thymic 75 (64, 94) 78 (47, 91) 0.67 0 (0, 4) 0 (0, 0) 0.08
Naive 90 (83, 93) 87 (80, 95) 0.84 24 (18, 67) 60 (20, 88) 0.09
Central memory 1 (0, 11) 6 (0, 13) 0.53 33 (9, 44) 10 (0, 46) 0.36
Effector memory 0 (0, 0) 0 (0, 1) 0.71 14 (0, 32) 0 (2, 14) 0.11
Effector 7 (0, 10) 3 (0, 9) 0.40 9 (3, 21) 5 (0, 18) 0.59
Homing 71 (51, 82) 79 (60, 100) 0.93 57 (6, 77) 71 (11, 100) 0.14
Homing activated 35 (28, 80) 42 (31, 57) 0.03 8 (0, 12) 9 (3, 57) 0.22
Activated 0 (0, 3) 0 (0, 5) 0.84 0 (0, 0) 0 (0, 0) 0. 49
Proliferating 0 (0, 0) 0 (0, 0) 0.70 0 (0, 0) 0 (0, 0) 0. 27
Proliferating activated 0 (0, 0) 0 (0, 0) - 0 (0, 0) 0 (0, 0) 0.22
Senescent 1 16 (0, 63) 43 (16, 76) 0.11 25 (0, 48) 38 (0, 70) 0.24
Senescent 2 0 (0, 0) 0 (0, 2) 0.11 1 (0, 3) 0 (0, 23) 0.59
Mann–Whitney U-tests were used for non-parametric variables and continuous characteristics are expressed as median (interquartile range)

Chapter 6: Results
Caroline Cleopatra Chisenga Ph.D. Thesis
116
Table 6-14: CD4 and CD8 T Cell Response to 220 µmol/L Selenium Concentration Between Females and Males
CD4 CD8
Variable (%) Females (N= 17) Males (N= 34) P value Females (N=17) Males (N= 34) P value
Thymic 66 (43, 92) 65 (52, 84) 0.67 2 (0, 6) 2 (0, 9) 0.75
Naive 85 (50, 96) 80 (66, 95) 0.84 36 (0, 50) 61 (0, 93) 0.07
Central memory 0 (0, 11) 8 (2, 14) 0.09 0 (10, 25) 5 (0, 12) 0.38
Effector memory 0 (0, 6) 0 (0, 5) 0.76 6 (0, 14) 0 (0, 12) 0.60
Effector 6 (0, 15) 4 (0, 17) 0.81 14 (0, 29) 0 (0, 12) 0.19
Homing 78 (71, 94) 83 (42, 100) 0.92 23 (8, 84) 64 (19, 100) 0.03
Homing activated 54 (22, 95) 80 (71, 86) 0.05 0 (0, 19) 33 (8, 62) 0.02
Activated 0 (0, 6) 0 (0, 1) 0.62 0 (0, 0) 0 (0, 0) 0.15
Proliferating 0 (0, 0) 0 (0, 0) 0.50 0 (0, 0) 0 (0, 0) 0.21
Proliferating activated 0 (0, 0) 0 (0, 0) 0.49 0 (0, 0) 0 (0, 0) 0.94
Senescent 1 30 (0, 37) 38 (10, 61) 0.15 40 (0, 50) 41 (19, 64) 0.48
Senescent 2 0 (0, 0) 0 (0, 1) 0.01 6 (0, 10) 9 (0, 22) 0.14
Mann–Whitney U-tests were used for non-parametric variables and continuous characteristics are expressed as median (interquartile range)

Chapter 6: Results
Caroline Cleopatra Chisenga Ph.D. Thesis
117
There were some significant differences observed for some markers when CD4 and
CD8 surface markers were analyzed using Friedman test, (Figures 6-10 to 6-33). In
that, some marker expression markedly increased (CD4 gut homing cells) whilst
others decreased (CD4 proliferating cells).
Figure 6-10 shows median naive marker expression on CD4
+ T cells at different
concentrations of selenium in vitro. There was an up and down change observed with
the change in concentration in naive markers expressed. Overall, using Friedman test,
there was a significant change with a p value of 0.041.
Figure 6-11 shows median central memory marker expression on CD4
+ T cells at
different concentrations. There was a significant increase in central memory marker
expression on the CD4+ T cells at 180 µmol/L. However when all concentrations were
compared using Friedman test, overall there was a significant difference (p<0.0001).
Baseline 180 µmol/L 200 µmol/L 220 µmol/L
0
50
100
150
Selenium concentration
Nai
ve C
D4+ T
-cel
l %
p=0.041
Baseline 180 µmol/L 200 µmol/L 220 µmol/L
-50
0
50
100
150
Selenium concentration
Cent
ral m
emor
y CD
4+ T-c
ell %
p<0.0001

Chapter 6: Results
Caroline Cleopatra Chisenga Ph.D. Thesis
118
Figure 6-12 shows median effector memory marker expression on CD4
+ T cells at
different concentrations. There were no observed significant differences in effector
memory marker expression on the CD4+ T cells at any of the concentrations
compared to the baseline marker profile using Friedman test, p=0. 114.
Figure 6-13 shows median effector marker expression on CD4
+ T cells at different
concentrations. There was a significant downward change in effector marker
expression on the CD4+ T cells at 180 µmol/L and 200 µmol/L. However the markers
increased to baseline levels at the highest concentration 220 µmol/L. However,
overall after analysing all different concentrations together using Friedman test, there
was a significant difference (p=0.001).
Baseline 180 µmol/L 200 µmol/L 220 µmol/L
-20
0
20
40
60
80
100
Selenium concentration
Effe
cto
r m
em
ory
CD
4+
T-c
ell
%
p=0.114
Baseline 180 µmol/L 200 µmol/L 220 µmol/L
-20
0
20
40
60
80
100
Selenium concentration
Effe
cto
r C
D4
+ T-c
ells
%
p=0.001

Chapter 6: Results
Caroline Cleopatra Chisenga Ph.D. Thesis
119
Figure 6-14 shows median homing marker expression on CD4
+ T cells at different
concentrations. Although generally there was a significant increase in homing marker
expression on the CD4+ T cells at all the concentrations when compared using the
Friedman test (p=<0.0001), 200 µmol/L showed the highest increase.
Figure 6-15 shows median homing and activated marker expression on CD4
+ T cells
at different concentrations. Although there was a significant (p<0.0001) change, there
was an observed up and down marker expression with change in concentration.
Baseline 180 µmol/L 200 µmol/L 220 µmol/L
0
50
100
150
Selenium concentration
Ho
min
g C
D4
+ T
-ce
lls %
p<0.0001
Baseline 180 µmol/L 200 µmol/L 220 µmol/L
0
50
100
150
Selenium concentration
Ho
min
g a
nd
act
iva
ted
CD
4+ T
-ce
ll %
p<0.0001
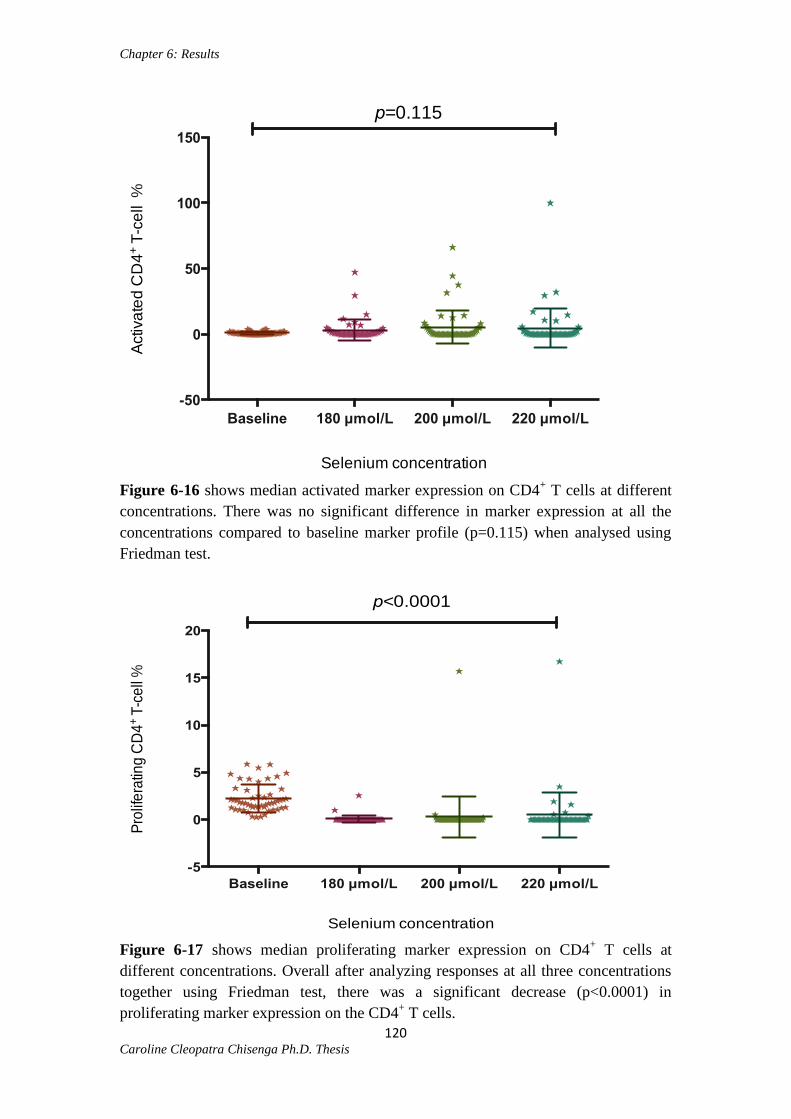
Chapter 6: Results
Caroline Cleopatra Chisenga Ph.D. Thesis
120
Figure 6-16 shows median activated marker expression on CD4
+ T cells at different
concentrations. There was no significant difference in marker expression at all the
concentrations compared to baseline marker profile (p=0.115) when analysed using
Friedman test.
Figure 6-17 shows median proliferating marker expression on CD4
+ T cells at
different concentrations. Overall after analyzing responses at all three concentrations
together using Friedman test, there was a significant decrease (p<0.0001) in
proliferating marker expression on the CD4+ T cells.
Baseline 180 µmol/L 200 µmol/L 220 µmol/L
-50
0
50
100
150
Selenium concentration
Activ
ate
d C
D4
+ T
-ce
ll %
p=0.115
Baseline 180 µmol/L 200 µmol/L 220 µmol/L
-5
0
5
10
15
20
Selenium concentration
Pro
life
ratin
g C
D4
+ T
-ce
ll %
p<0.0001

Chapter 6: Results
Caroline Cleopatra Chisenga Ph.D. Thesis
121
Figure 6-18 shows median number of proliferating and activated marker expression
on CD4+ T cells at different concentrations. Overall after analyzing responses at all
three concentrations together using Friedman test, there was a significant decrease
(p<0.0001) in proliferating and activated marker expression on the CD4+ T cells.
Figure 6-19 shows the median senescent 1 marker expression on CD4
+ T cells at
different concentrations. Compared to baseline marker profile, there was a significant
increase (p<0.0001) in senescent marker expression on the CD4+ T cells with an
increase in selenium concentration.
Baseline 180 µmol/L 200 µmol/L 220 µmol/L
-1
0
1
2
3
4
5
Selenium concentration
Pro
life
ratin
g a
nd
act
iva
ted
CD
4+ T
-ce
ll %
p<0.0001
Baseline 180 µmol/L 200 µmol/L 220 µmol/L
-50
0
50
100
150
Selenium concentration
Se
ne
sce
nt 1
CD
4+ T
-ce
ll %
p<0.0001

Chapter 6: Results
Caroline Cleopatra Chisenga Ph.D. Thesis
122
Figure 6-20 shows the median number of senescent 2 marker expression on CD4
+ T
cells at different concentrations. Compared to baseline marker profile, senescent 2
CD4+
T-cells seemed to decrease with an increase in selenium concentration. After
analyzing responses at all three concentrations together using Friedman test, there was
a significant decrease (p<0.0001) in senescent 2-marker expression on the CD4+ T
cells.
Figure 6-21 shows the median number of recent thymic marker expression on CD4
+
T cells at different concentrations. Although a significant (p<0.0001) change was
observed, there was an observed up and down marker expression with change in
concentration.
Baseline 180 µmol/L 200 µmol/L 220 µmol/L
-10
0
10
20
30
40
50
Selenium concentration
Se
ne
sce
nt
2 C
D4
+ T
-ce
ll %
p<0.0001
Baseline 180 µmol/L 200 µmol/L 220 µmol/L
0
50
100
150
Selenium concentration
Re
cen
t thy
mic
em
igra
nt C
D4
+ T
-ce
ll %
p<0.0001

Chapter 6: Results
Caroline Cleopatra Chisenga Ph.D. Thesis
123
We found that the Se concentration levels were consistent at different concentrations
in all CD4 subset with an exception of effector memory (Figure 6-12) and activated
CD4+ T cells (Figure 6-16). Cells expressing senescent 1 surface marker were
consistently increased at almost all the concentrations in the CD4s whereas cells
expressing senescent 2 markers consistently decreased at all concentrations.
Likewise, the dynamics of individual cell populations expressed on the CD8+ T cells
at different Se concentrations were examined and results presented in Figures 6-22 to
6-33.
Figure 6-22 shows changes in median naive marker expression at different selenium
concentrations in the CD8+ T cells. There was a significant increase in naive marker
expression as the selenium concentration was increased compared to markers
expressed at baseline (P<0.0001)
Baseline 180 µmol/L 200 µmol/L 220 µmol/L
0
50
100
150
Selenium concentration
Na
ive
CD
8+ T
-ce
ll %
p<0.0001

Chapter 6: Results
Caroline Cleopatra Chisenga Ph.D. Thesis
124
Figure 6-23 presents the differences in central memory markers expressed on the
CD8+ T cells during incubations with different concentrations of selenium. Friedman
test showed a significant difference after selenium increase compared to markers
expressed at baseline (p=0.014).
Figure 6-24 shows the median number of effector memory markers expressed on
CD8+ T cells. Using Friedman test, there was an observed significant decreased with
an increase in concentration compared to markers expressed at baseline.
Baseline 180 µmol/L 200 µmol/L 220 µmol/L
-50
0
50
100
150
Selenium concentration
Ce
ntra
l me
mo
ry C
D8
+ T
-ce
ll %
p=0.014
Baseline 180 µmol/L 200 µmol/L 220 µmol/L
-50
0
50
100
150
Selenium concentration
Effe
cto
r m
em
ory
CD
8+ T
-ce
ll %
p<0.0001
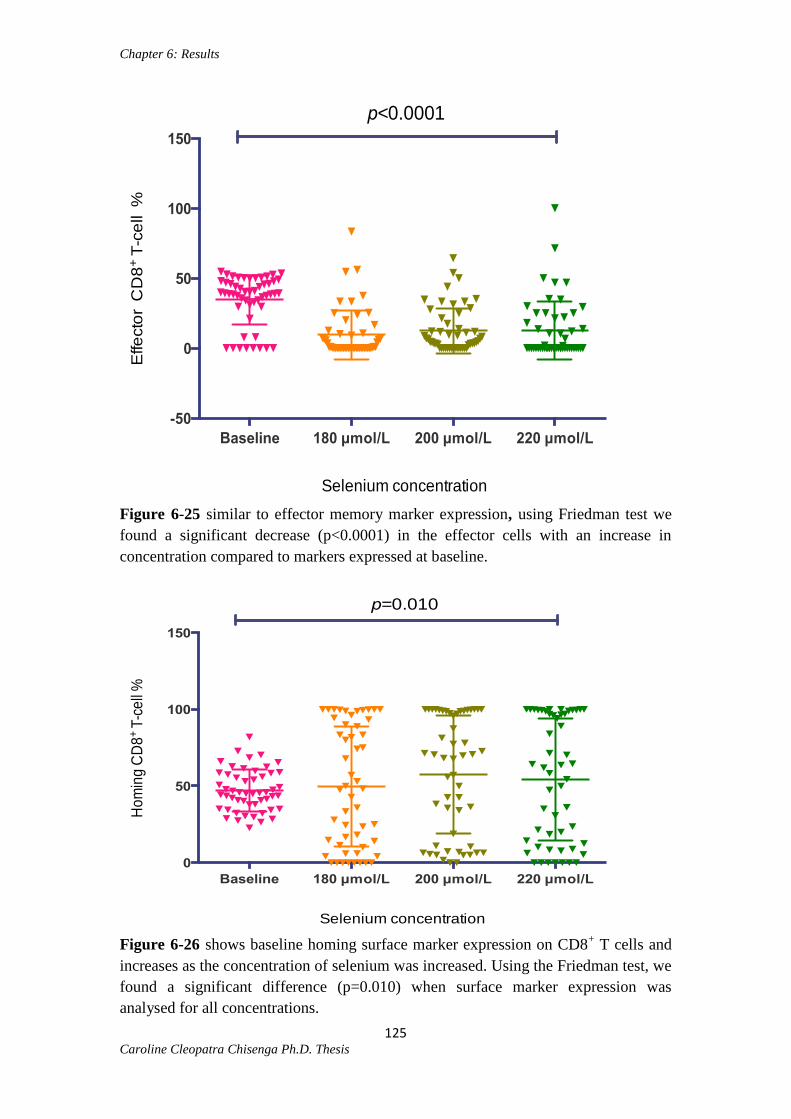
Chapter 6: Results
Caroline Cleopatra Chisenga Ph.D. Thesis
125
Figure 6-25 similar to effector memory marker expression, using Friedman test we
found a significant decrease (p<0.0001) in the effector cells with an increase in
concentration compared to markers expressed at baseline.
Figure 6-26 shows baseline homing surface marker expression on CD8
+ T cells and
increases as the concentration of selenium was increased. Using the Friedman test, we
found a significant difference (p=0.010) when surface marker expression was
analysed for all concentrations.
Baseline 180 µmol/L 200 µmol/L 220 µmol/L
-50
0
50
100
150
Selenium concentration
Effe
cto
r C
D8
+ T
-ce
ll %
p<0.0001
Baseline 180 µmol/L 200 µmol/L 220 µmol/L
0
50
100
150
Selenium concentration
Ho
min
g C
D8
+ T
-ce
ll %
p=0.010

Chapter 6: Results
Caroline Cleopatra Chisenga Ph.D. Thesis
126
Figure 6-27 shows the median number of homing and activated surface markers
expressed at baseline and changes after selenium was increased. The number of
homing and activated markers expressed significantly increased with the increase in
selenium concentration. Using the Friedman test, the p value was less than 0.0001.
Figure 6-28 compared to baseline activated surface markers, as selenium
concentration increased the number of activated surface markers expressed on the
CD8+ T cells completely disappeared (p<0.0001).
Baseline 180 µmol/L 200 µmol/L 220 µmol/L
-50
0
50
100
150
Selenium concentration
Hom
ing
and
activ
ated
CD
8+ T
-cel
l %
p<0.0001
Baseline 180 µmol/L 200 µmol/L 220 µmol/L
-50
0
50
100
150
Selenium concentration
Act
iva
ted
CD
8+ T
-ce
ll %
p<0.0001
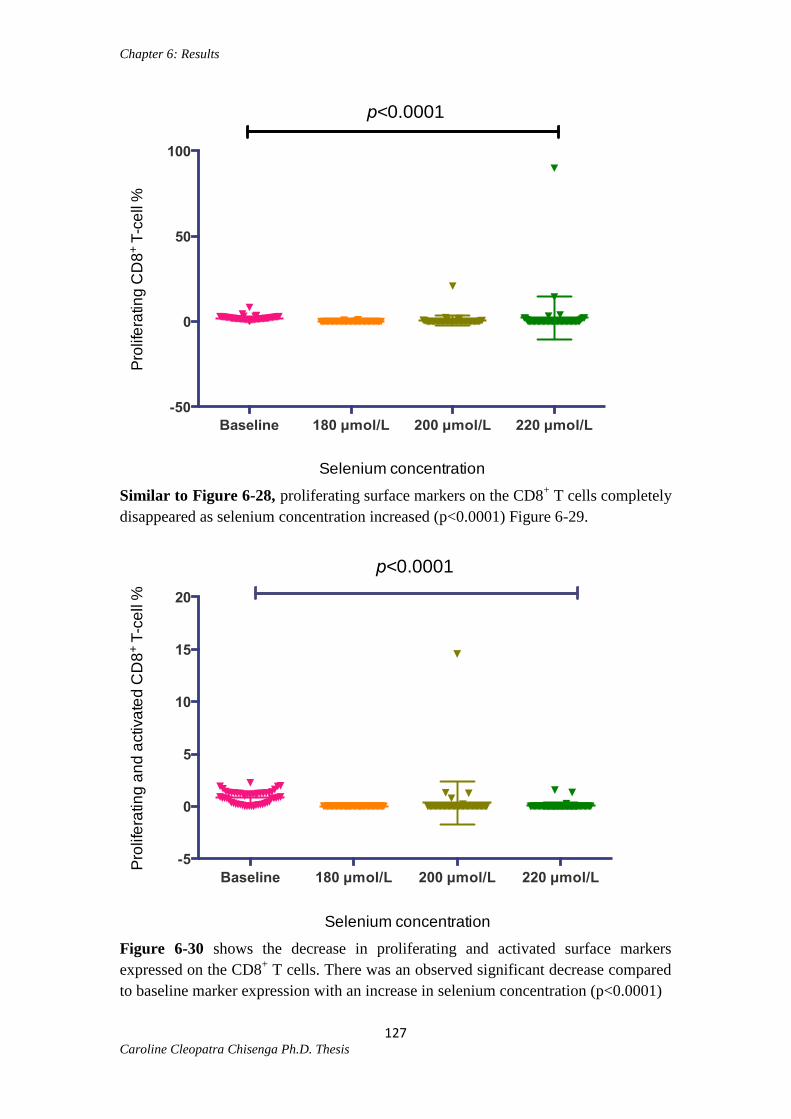
Chapter 6: Results
Caroline Cleopatra Chisenga Ph.D. Thesis
127
Similar to Figure 6-28, proliferating surface markers on the CD8
+ T cells completely
disappeared as selenium concentration increased (p<0.0001) Figure 6-29.
Figure 6-30 shows the decrease in proliferating and activated surface markers
expressed on the CD8+ T cells. There was an observed significant decrease compared
to baseline marker expression with an increase in selenium concentration (p<0.0001)
Baseline 180 µmol/L 200 µmol/L 220 µmol/L
-50
0
50
100
Selenium concentration
Pro
life
ratin
g C
D8
+ T
-ce
ll %
p<0.0001
Baseline 180 µmol/L 200 µmol/L 220 µmol/L
-5
0
5
10
15
20
Selenium concentration
Pro
life
ratin
g a
nd
activa
ted
CD
8+ T
-ce
ll %
p<0.0001

Chapter 6: Results
Caroline Cleopatra Chisenga Ph.D. Thesis
128
Figure 6-31 shows the median senescent 1 marker expression on CD8
+ T cells at
different concentrations. Compared to baseline marker profile, senescent 1 CD8+
T
cells increased with an increase in selenium concentration (p=0.034).
Contrary to Figure 6-31, in Figure 6-32 the median senescent 2 marker expression
on CD8+ T cells decreased with an increase in selenium concentration. When
responses at all three concentrations were analyzed using Friedman test, there was a
significant decrease (p<0.0001) in senescent marker expression on the CD8+ T cells.
Baseline 180 µmol/L 200 µmol/L 220 µmol/L
0
50
100
150
Selenium concentration
Se
ne
sce
nt 1
CD
8+ T
-ce
ll %
p=0.034
Baseline 180 µmol/L 200 µmol/L 220 µmol/L
-20
0
20
40
60
Selenium concentration
Se
ne
sce
nt
2 C
D8
+ T
-ce
ll %
p<0.0001

Chapter 6: Results
Caroline Cleopatra Chisenga Ph.D. Thesis
129
In Figure 6-33 using the Friedman test, recent thymic emigrant surface marker
expression was highest at 180 µmol/L and lowest at the remaining selenium
concentrations (p<0.0001).
In the CD8 population, there was either a consistent increase from baseline to 220
mol/L or a consistent decrease, or an up and down pattern or a down and up surface
marker expression (inconsistent response; up at one concentration and down at the
next).
Baseline 180 µmol/L 200 µmol/L 220 µmol/L
-50
0
50
100
150
Selenium concentration
Re
cen
t th
ymic
em
igra
nt C
D8
+ T
-ce
ll %
p<0.0001

Chapter 6: Results
Caroline Cleopatra Chisenga Ph.D. Thesis
130
Further analysis of these responses in relation to baseline Se concentration, as a
marker of Se status shows that there were significant differences in gut homing
responses in CD4 cells (Figure 6-34).
Figure 6-34 shows that there were more gut homing markers expressed on CD4 cells
in the deficient group compared to the non-deficient group. Using Wilcoxon rank-
sum test the p value was 0.01.
Figure 6-35 shows that expression of homing and activated markers on the CD4
cells in both the deficient and non-deficient individuals was comparable. Using
Wilcoxon rank-sum test, the p value was found to be insignificant (p=0.46) between
the two groups.

Chapter 6: Results
Caroline Cleopatra Chisenga Ph.D. Thesis
131
Figure 6-36 shows that expression of naive markers on the CD4 cells in both the
deficient and non-deficient individuals was comparable. Using Wilcoxon rank-sum
test, the p value was found to be insignificant (p=0.39) between the two groups.
Figure 6-37 shows that there was no significant difference in senescent 1 marker
expression on CD4 cells of the deficient and non-deficient groups. Using Wilcoxon
rank-sum test, the p value was calculated as p=0.89.

Chapter 6: Results
Caroline Cleopatra Chisenga Ph.D. Thesis
132
Figure 6-38 shows gut homing marker expression on CD8 cells in the deficient and
non-deficient individuals. Gut homing marker expression was comparable between
the two groups. Using Wilcoxon rank-sum test, the p value was calculated as p=0.14.
Figure 6-39 shows homing and activated markers CD8 cells in deficient and non-
deficient groups. There was significant difference (p=0.29) found between the two
groups using Wilcoxon rank-sum test.

Chapter 6: Results
Caroline Cleopatra Chisenga Ph.D. Thesis
133
Figure 6-40 shows that expression of naive markers on CD8 cells in deficient and
non-deficient individuals was comparable. Using Wilcoxon rank-sum test, the p
value was p=0.83.
Figure 6-41 shows senescent 1 surface marker expression on CD8 cells in deficient
and non-deficient individuals. In both groups, senescent 1 surface maker expressions

Chapter 6: Results
Caroline Cleopatra Chisenga Ph.D. Thesis
134
on CD8+ cells were comparable. Using Wilcoxon rank-sum test, the p value was
p=0.61.
In Summary;
Most of the CD4 and CD8 T cell subsets showed significant responses to ambient Se
in vitro (Table 10-7 and Table 10-8). Further, baseline Se and both absolute CD4 and
CD8 count were not correlated (CD4 rho=0.08, P=0.58 and CD8 rho= -0.02,
P=0.87). There were some significant differences in CD4 and CD8 T cell subsets
between the males and females, with significant increases seen in males. It was
assumed that this difference might be Se dependent since there were more Se
deficient males than females. Overall, no correlation was found between baseline Se
and surface marker expression, but hut homing response was greater in Se deficient
individuals.

Chapter 6: Results
Caroline Cleopatra Chisenga Ph.D. Thesis
135
6.6 Results for a Survey of Treated HIV-infected Patients and HIV- Adults
In view of the response of CD4 and CD8 response to Se in-vitro, a survey was
undertaken. The objective of this survey was to ascertain whether T cell subset
numbers were restored completely to normal after 12 weeks of ART. In this analysis,
all the HIV negative adults in the cross section study were enrolled. HIV-infected
adults were randomly selected from the 88 that had completed 12 weeks of ART and
nutritional support in the NUSTART trial. Random selection was done using the
“=RAND (1-88)” commands in excel. This yielded a ratio of 1:1 and the results for
each CD4 and CD8 subset studied are presented figures below.
Figure 6-42 shows the mean age between the HIV+ and HIV- individuals. The
HIV+ individuals were older (median 36 IQR, 34-43) than the HIV- individuals
(median 29 IQR, 25-37). The comparisons were made using the two-sample
Wilcoxon rank-sum (Mann-Whitney) test and the p value determined.
HIV+ HIV-0
20
40
60
80
Me
dia
n a
ge
(yrs
)
p=0.0045

Chapter 6: Results
Caroline Cleopatra Chisenga Ph.D. Thesis
136
Figure 6-43 shows the median hemoglobin between the HIV+ and the HIV-
participants. The median hemoglobin (13 IQR, 11-13.6) level for HIV+ individuals
after 3 months of taking ART plus nutritional support was significantly lower than in
the HIV- individuals, (14.85 IQR, 14-16.05). The p value was determined using the
two-sample Wilcoxon rank-sum (Mann-Whitney) test.
Figure 6-44 shows the differences in BMI for the HIV+ and HIV- participants.
HIV+ participants had a significantly lower 18.4 (IQR, 17.3-19.45) BMI than the
HIV- participants 23.78 (IQR, 221.83-26.10) after 3 months of receiving ART. The
comparisons were made using the two-sample Wilcoxon rank-sum (Mann-Whitney)
test and the p value determined.
HIV+ HIV-0
5
10
15
20
Hb
g/d
L
p<0.0001
HIV+ HIV-0
10
20
30
40
BM
I kg
/m2
p<0.0001
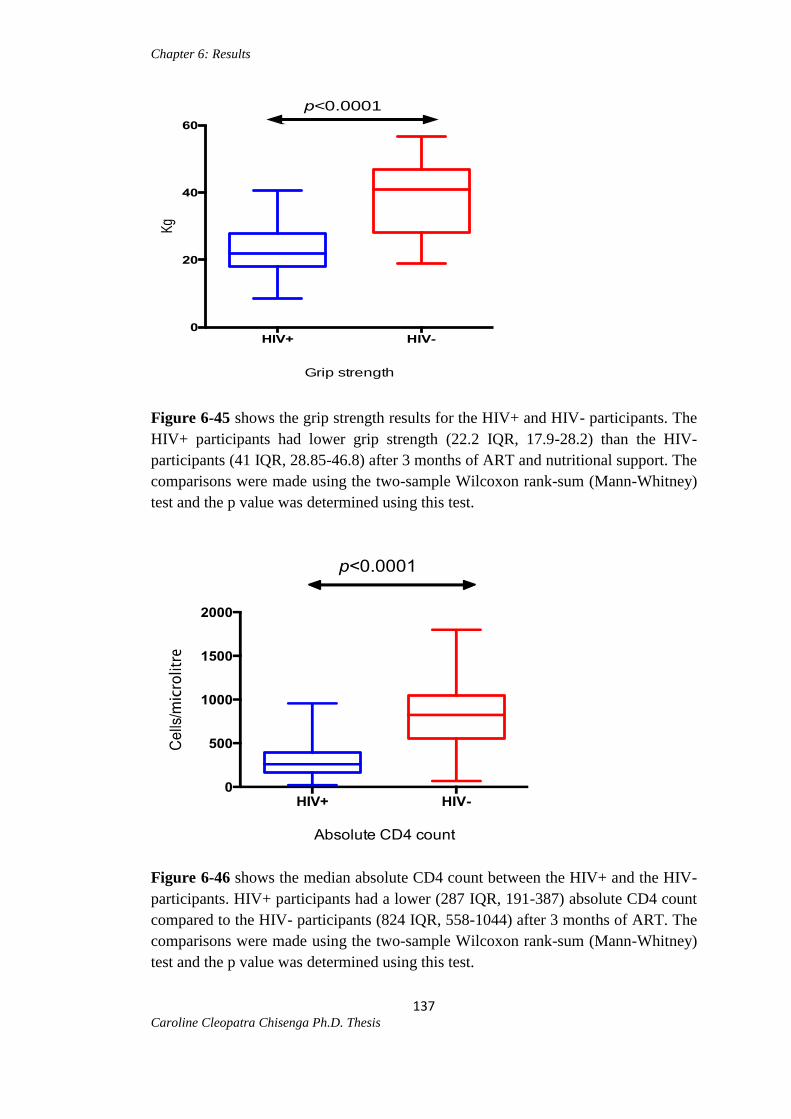
Chapter 6: Results
Caroline Cleopatra Chisenga Ph.D. Thesis
137
Figure 6-45 shows the grip strength results for the HIV+ and HIV- participants. The
HIV+ participants had lower grip strength (22.2 IQR, 17.9-28.2) than the HIV-
participants (41 IQR, 28.85-46.8) after 3 months of ART and nutritional support. The
comparisons were made using the two-sample Wilcoxon rank-sum (Mann-Whitney)
test and the p value was determined using this test.
Figure 6-46 shows the median absolute CD4 count between the HIV+ and the HIV-
participants. HIV+ participants had a lower (287 IQR, 191-387) absolute CD4 count
compared to the HIV- participants (824 IQR, 558-1044) after 3 months of ART. The
comparisons were made using the two-sample Wilcoxon rank-sum (Mann-Whitney)
test and the p value was determined using this test.
HIV+ HIV-0
20
40
60
Grip strength
Kg
p<0.0001
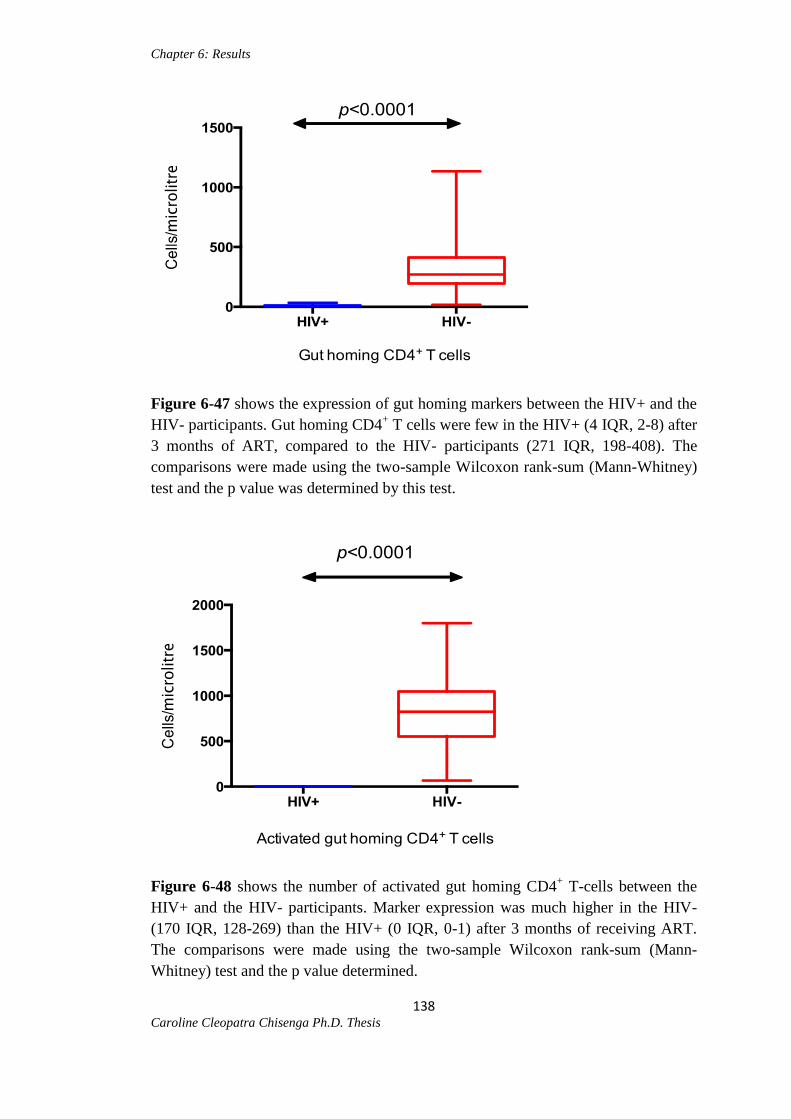
Chapter 6: Results
Caroline Cleopatra Chisenga Ph.D. Thesis
138
Figure 6-47 shows the expression of gut homing markers between the HIV+ and the
HIV- participants. Gut homing CD4+ T cells were few in the HIV+ (4 IQR, 2-8) after
3 months of ART, compared to the HIV- participants (271 IQR, 198-408). The
comparisons were made using the two-sample Wilcoxon rank-sum (Mann-Whitney)
test and the p value was determined by this test.
Figure 6-48 shows the number of activated gut homing CD4+ T-cells between the
HIV+ and the HIV- participants. Marker expression was much higher in the HIV-
(170 IQR, 128-269) than the HIV+ (0 IQR, 0-1) after 3 months of receiving ART.
The comparisons were made using the two-sample Wilcoxon rank-sum (Mann-
Whitney) test and the p value determined.

Chapter 6: Results
Caroline Cleopatra Chisenga Ph.D. Thesis
139
Figure 6-49 shows the number of recent thymic emigrants between the HIV+ and
the HIV- participants. There were more recent thymic emigrant CD4+ T cells in the
HIV+ (40 IQR, 14-94) than the HIV- participants (30 IQR, 22-35) after 3 months of
ART. The comparisons were made using the two-sample Wilcoxon rank-sum
(Mann-Whitney) test and the p value determined.
Figure 6-50 shows the number of senescent 1 CD4
+ T cells between the HIV+ and
the HIV- participants. The numbers of senescent 1 CD4+ T cells were slightly lower
in the HIV+ (17 IQR, 5-36) compared to the HIV- participants (19 IQR 13-53).
Comparisons were made using the two-sample Wilcoxon rank-sum (Mann-Whitney)
test and the p value was determined using this test.

Chapter 6: Results
Caroline Cleopatra Chisenga Ph.D. Thesis
140
Figure 6-51 shows the number of senescent 2 CD4+ T cells between the HIV+ and
HIV- participants. Senescent 2 CD4+ T cells were comparable in both the HIV+ (5
IQR, 1-21) and HIV- participants (6 IQR, 2-17) after 3 months of ART. The
comparisons were made using the two-sample Wilcoxon rank-sum (Mann-Whitney)
test and the p value was determined using this test.
Figure 6-52 shows the distribution of naive CD4+ T cells between the HIV+ and
HIV- participants. The number of naive CD4+ T cells after 3 months of ART was not
comparable between the HIV+ (17 IQR 3-65) and the HIV- (677 IQR, 418-885)
participants. The comparisons were made using the two-sample Wilcoxon rank-sum
(Mann-Whitney) test. The p value was determined using this test.
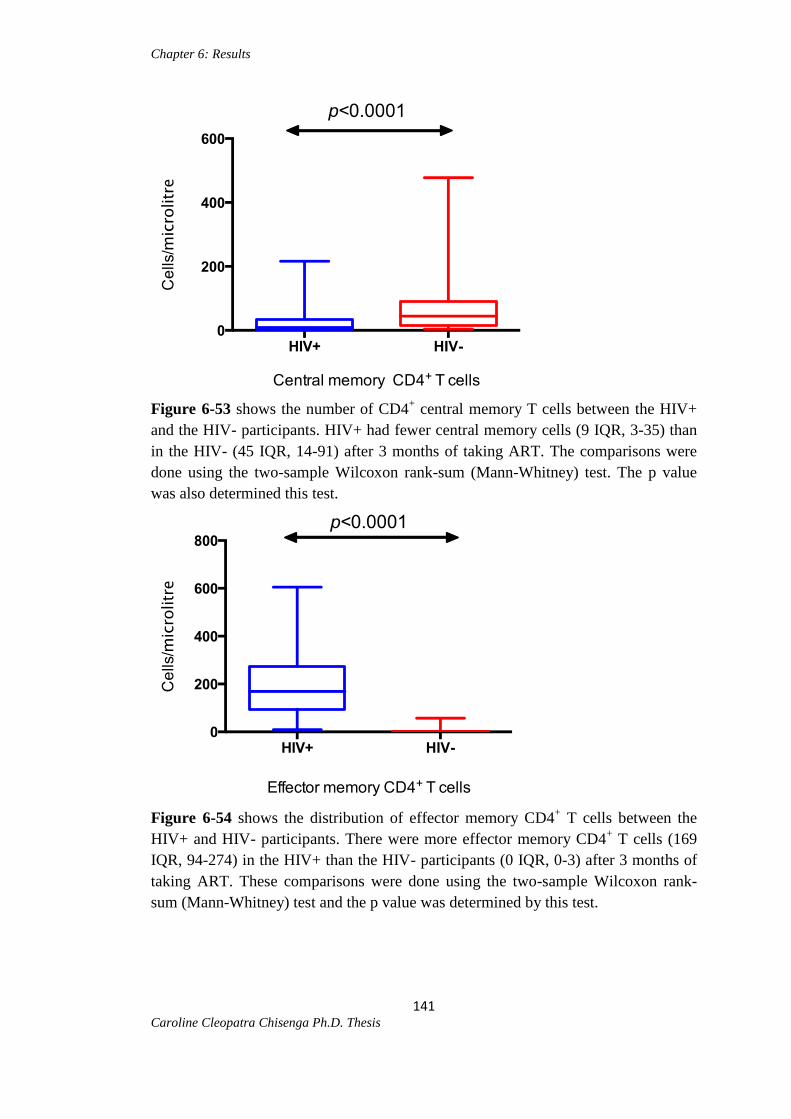
Chapter 6: Results
Caroline Cleopatra Chisenga Ph.D. Thesis
141
Figure 6-53 shows the number of CD4
+ central memory T cells between the HIV+
and the HIV- participants. HIV+ had fewer central memory cells (9 IQR, 3-35) than
in the HIV- (45 IQR, 14-91) after 3 months of taking ART. The comparisons were
done using the two-sample Wilcoxon rank-sum (Mann-Whitney) test. The p value
was also determined this test.
Figure 6-54 shows the distribution of effector memory CD4
+ T cells between the
HIV+ and HIV- participants. There were more effector memory CD4+ T cells (169
IQR, 94-274) in the HIV+ than the HIV- participants (0 IQR, 0-3) after 3 months of
taking ART. These comparisons were done using the two-sample Wilcoxon rank-
sum (Mann-Whitney) test and the p value was determined by this test.

Chapter 6: Results
Caroline Cleopatra Chisenga Ph.D. Thesis
142
In Figure 6-55 show the number of effector CD4
+ T cells between the HIV+ and the
HIV- participants. The numbers of effector CD4+ T cells were comparable in the
HIV+ (18 IQR, 7-57) and the HIV- participants (26 IQR, 0-103) after 3 months of
taking ART. Comparisons were made using the two-sample Wilcoxon rank-sum
(Mann-Whitney) test and the p value was determined using this test.
Figure 6-56 shows the number of proliferating and activated CD4
+ T cells between
the HIV+ and HIV-. There were few proliferating activated CD4+ T cells in the
HIV+ (3 IQR, 0-17) after 3 months of ART compared to HIV- (16 IQR, 8-22) in the
healthy population. Comparisons were made using the two-sample Wilcoxon rank-
sum (Mann-Whitney) test the p value was determined.
HIV+ HIV-0
100
200
300
400
Proliferating and activated CD4+ T cells
Ce
lls/m
icro
litre
p=0.0001

Chapter 6: Results
Caroline Cleopatra Chisenga Ph.D. Thesis
143
Figure 6-57 shows the numbers of activated CD4
+ T between the HIV+ and the
HIV- participants. The number of activated CD4+ T cells in both the HIV+ (8 IQR,
3-25) and the HIV- (6 IQR, 2-12) were comparable at 3 months post ART.
Comparisons were made using the two-sample Wilcoxon rank-sum (Mann-Whitney)
test with the p value determined by this test.
Figure 6-58 shows the numbers of proliferating CD4
+ T cells between the HIV+ and
the HIV- participants. The HIV+ had more proliferating CD4+ T cells (77 IQR, 27-
218) than the HIV- participants (4 IQR, 2-6) after 3 months of ART. Comparisons
were done using the two-sample Wilcoxon rank-sum (Mann-Whitney) test and the p
value was also determined using this test.

Chapter 6: Results
Caroline Cleopatra Chisenga Ph.D. Thesis
144
Figure 6-59 shows the number of absolute CD8+ T cells between the HIV+ and the
HIV- participants. Absolute CD8+ T cell counts in the HIV+ (1042 IQR, 688-1464)
were lower after 3 months of ART than in the HIV- participants (1371 IQR, 1136-
1771). Comparisons were done using the two-sample Wilcoxon rank-sum (Mann-
Whitney) test and the p value determined using this test.
Figure 6-60 shows the number of homing CD8
+ T cells between the HIV+ and the
HIV- participants. Gut homing CD8+ T cells were few in the HIV+ (median 503
IQR, 319-781) after 3 months of ART compared to the HIV- participants (median
617 IQR, 429-985). Comparisons were done using the two-sample Wilcoxon rank-
sum (Mann-Whitney) test and the p value determined.
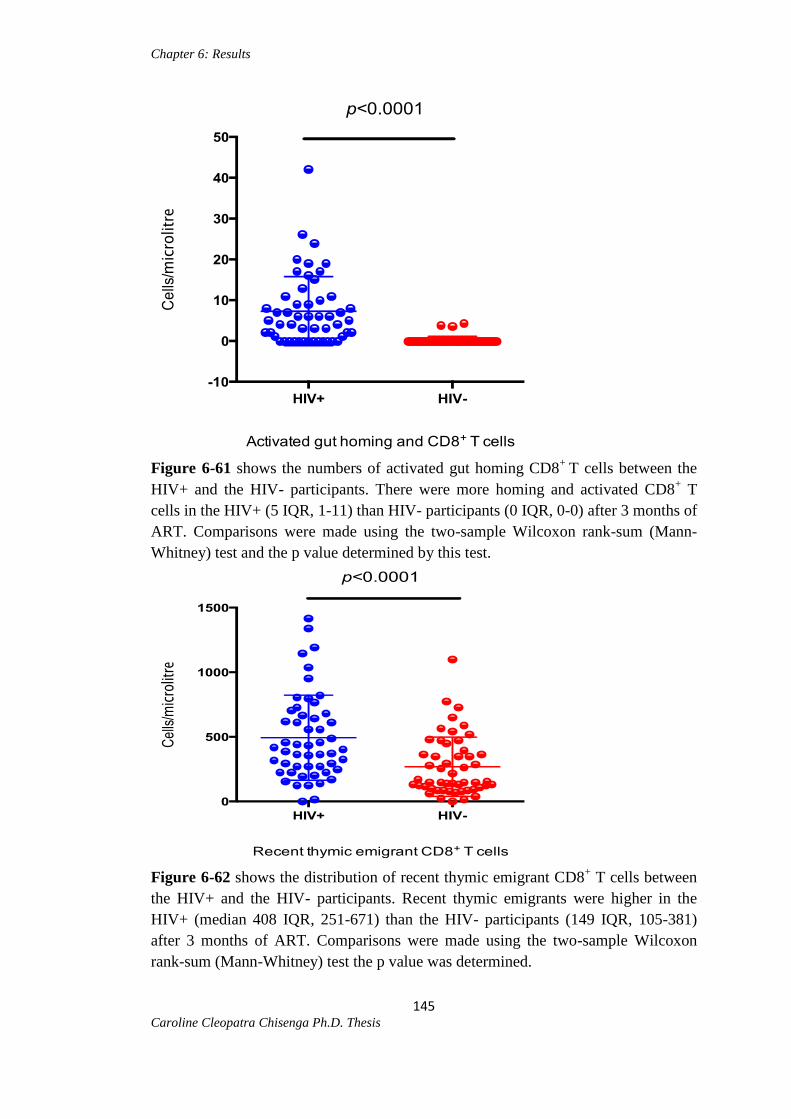
Chapter 6: Results
Caroline Cleopatra Chisenga Ph.D. Thesis
145
Figure 6-61 shows the numbers of activated gut homing CD8
+ T cells between the
HIV+ and the HIV- participants. There were more homing and activated CD8+ T
cells in the HIV+ (5 IQR, 1-11) than HIV- participants (0 IQR, 0-0) after 3 months of
ART. Comparisons were made using the two-sample Wilcoxon rank-sum (Mann-
Whitney) test and the p value determined by this test.
Figure 6-62 shows the distribution of recent thymic emigrant CD8
+ T cells between
the HIV+ and the HIV- participants. Recent thymic emigrants were higher in the
HIV+ (median 408 IQR, 251-671) than the HIV- participants (149 IQR, 105-381)
after 3 months of ART. Comparisons were made using the two-sample Wilcoxon
rank-sum (Mann-Whitney) test the p value was determined.
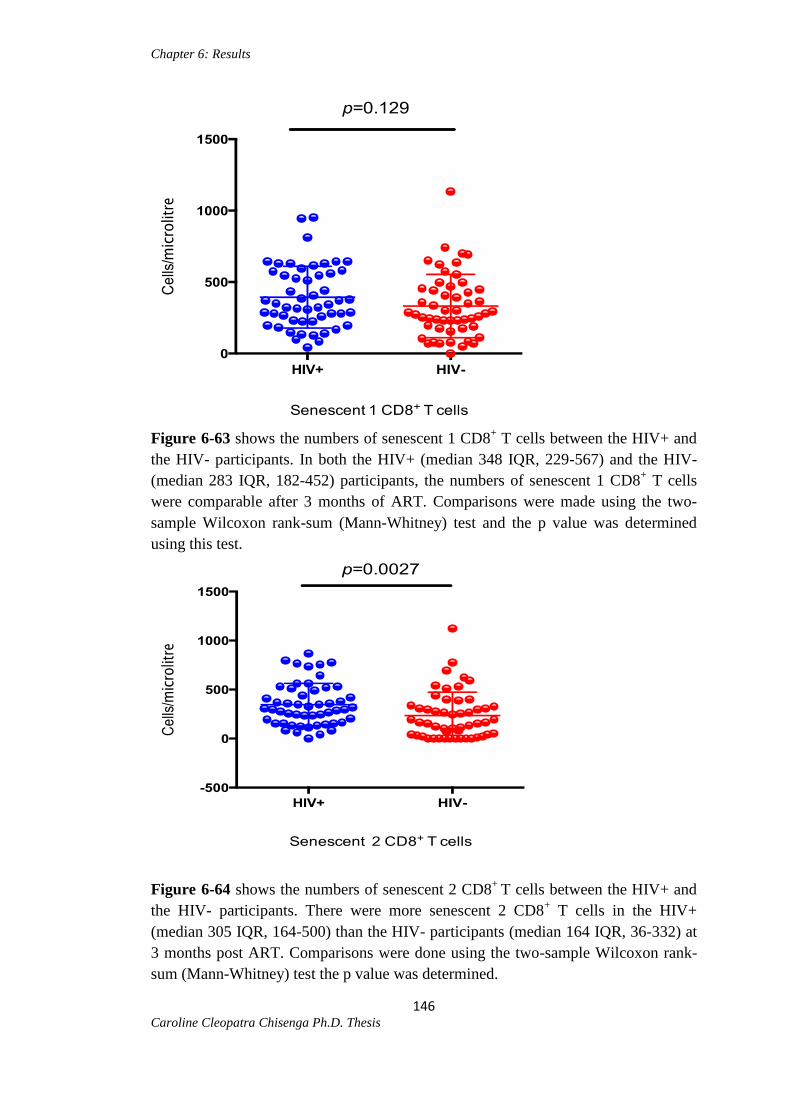
Chapter 6: Results
Caroline Cleopatra Chisenga Ph.D. Thesis
146
Figure 6-63 shows the numbers of senescent 1 CD8
+ T cells between the HIV+ and
the HIV- participants. In both the HIV+ (median 348 IQR, 229-567) and the HIV-
(median 283 IQR, 182-452) participants, the numbers of senescent 1 CD8+ T cells
were comparable after 3 months of ART. Comparisons were made using the two-
sample Wilcoxon rank-sum (Mann-Whitney) test and the p value was determined
using this test.
Figure 6-64 shows the numbers of senescent 2 CD8+
T cells between the HIV+ and
the HIV- participants. There were more senescent 2 CD8+ T cells in the HIV+
(median 305 IQR, 164-500) than the HIV- participants (median 164 IQR, 36-332) at
3 months post ART. Comparisons were done using the two-sample Wilcoxon rank-
sum (Mann-Whitney) test the p value was determined.

Chapter 6: Results
Caroline Cleopatra Chisenga Ph.D. Thesis
147
Figure 6-65 shows the differences in the numbers of naive CD8
+ T cells between the
HIV+ and the HIV- participants. There were fewer naive CD8+ T cells in the HIV+
(median 97 IQR, 47-255) than the HIV- participants (median 255 IQR, 127-401)
after 3 months of ART. Comparisons were done using the two-sample Wilcoxon
rank-sum (Mann-Whitney) test the p value was determined.
Figure 6-66 shows the numbers of central memory CD8
+ T cells between the HIV+
and the HIV- participants. There were few central memory CD8+ T cells in the HIV+
(median 25 IQR, 4-108) compared to the HIV- participants (median 191 IQR, 109-
282) by 3 months of ART. Comparisons were done using the two-sample Wilcoxon
rank-sum (Mann-Whitney) test the p value was determined.

Chapter 6: Results
Caroline Cleopatra Chisenga Ph.D. Thesis
148
Figure 6-67 shows the effector memory CD8+
T cells between the HIV+ and the
HIV- participants. There were few effector memory CD8+ T cells in the HIV+
(median 165 IQR, 75-323) compared to the HIV- participants (median 374 IQR, 185-
481) after 3 months of receiving ART. Comparisons were done using the two-sample
Wilcoxon rank-sum (Mann-Whitney) test and the p value determined using this test.
Figure 6-68 shows the number of effector CD8+ T cells for the HIV+ and HIV-
participants. In both HIV+ (median 535 IQR, 294-820) and the HIV- participants
(median 564 IQR, 305-732), the numbers of effector CD8+ T cells were comparable.
Comparisons were done using the two-sample Wilcoxon rank-sum (Mann-Whitney)
test and the p value determined using this test.

Chapter 6: Results
Caroline Cleopatra Chisenga Ph.D. Thesis
149
Figure 6-69 shows the number of proliferating and activated CD8+ T cells between
the HIV+ and HIV- participants. By 3 months of ART, HIV+ had significantly more
proliferating and activated CD8+ T cells (median 83 IQR, 39-228), than the HIV-
(median 10 IQR, 4-19) participants. Comparisons were done using the two-sample
Wilcoxon rank-sum (Mann-Whitney) test and the p value determined using this test.
Figure 6-70 shows the diffrences in the activated CD8+ T cells between the HIV+
and HIV- participants. Activated CD8+ T cells were significantly higher in the HIV+
(median 387 IQR, 211-593) than the HIV- participants (median 2 IQR, 0-6) at 3
months post ART. Comparisons were done using the two-sample Wilcoxon rank-
sum (Mann-Whitney) test and the p value (p<0.0001) determined using this test.

Chapter 6: Results
Caroline Cleopatra Chisenga Ph.D. Thesis
150
Figure 6-71 shows the differences between the HIV+ and the HIV- participants in
the proliferating CD8+ T cells. Proliferating CD8
+ T cells were significantly
increased in the HIV+ (median 792 IQR, 568-1130) than the HIV- participants
(median 28 IQR, 17-38) at 3 months post ART. Comparisons were done using the
two-sample Wilcoxon rank-sum (Mann-Whitney) test and the p value (p<0.0001)
determined using this test.

Chapter 7: Discussion
Caroline Cleopatra Chisenga Ph.D. Thesis
151
Chapter 7: Discussion
7.1 What is the Distribution of CD4 and CD8 T Cell Subsets in HIV-negative
Adults?
In order to come up with a reference group, a six colour FACSVerse was used to
characterise the CD4+ and CD8
+ T cells in HIV-negative adults in a Zambian
population. When data was stratified by sex (male and female), the mean (SD) CD4+
cell counts was 828 (336) cells/μL, which is higher than the values reported for
healthy adult Ethiopians (Tsegaye et al., 1999), Chinese (Kam et al., 1996), and
Swiss (Bisset et al., 2004). The values were comparable to those in Tanzanians
(Urassa et al., 2004) and Indians (Uppal et al., 2003) and markedly lower than those
reported for Ugandans (Tugume et al., 1996), Kuwaitis (Kaaba et al., 2002), and
Dutch (Tsegaye et al., 1999).
Furthermore, results showed that in healthy adults majority of the CD4+ T cells were
naïve. This finding was similar to findings from a study conducted in a similar cohort
in san Francisco U.S.A (Roederer et al., 1995). Naïve T cell subsets are responsible
for mounting immune responses to newly encountered antigens. Studies also show
that naïve cells have a better capacity for proliferation in response to mitogenic
stimuli (Sanders et al., 1998). A study conducted in healthy Ethiopians and Dutch
showed lower numbers of naïve CD4+ T cells (Massele et al., 1999) compared to
what was found in the Zambian cohort. It is postulated that the difference could be as
a result of differences in average ranges for CD4+ T cells in the different cohorts.
Additionally, high naïve CD4+ T cells in black Africans could mean having an
increased ability to build effective immune responses to newly encountered
infections. Similarly, there were very few circulating effector memory and effector

Chapter 7: Discussion
Caroline Cleopatra Chisenga Ph.D. Thesis
152
CD4+ T cells in the healthy participants. When naïve CD4
+ T cells are stimulated by
their cognate antigen presented by competent antigen-presenting cells they
differentiate into specialized effector and/or memory cells. Effector T cells induce
cytolysis of infected cells or activate other lymphocytes and immune effector cells,
whereas memory T cells maintain the capacity to respond rapidly to previously
encountered antigens. In the healthy volunteers, however, there were very few
circulating effector and or memory CD4+ T cells in the blood.
For people living with HIV, It has been reported that naïve CD4+ T cells are
progressively depleted during infection because of their frequent activation and
differentiation into memory cells (Bandera et al., 2010). A study conducted in the
U.S (Minneapolis) by Schacker and colleagues found that patients with relatively
high numbers of naïve CD4+ T cells were less likely to have failure of immune
reconstitution with ART and had lower risk of opportunistic infections and mortality
(Schacker et al., 2010). By contrast, low pre-ART naïve CD4+ T cell frequencies
predicted poor ART-mediated CD4+ T cell recovery in other studies (Notermans et
al., 1999; Gandi et al., 2006). Additionally, Zhang and colleagues recently showed
that increases in naïve CD4+ T cells following ART initiation independently
predicted subsequent CD4+ T cell increases (Zhang et al., 2013).
Further to this, proliferating, proliferating and activated, activated and both senescent
1 and 2 CD4+ T cells in the healthy volunteers were very few. Since activation is
triggered by the presence of antigen and is followed by proliferation, an indicator of
cell turnover or increase in cell destruction, having minimal cells activated,
proliferating and proliferating and activated may indicate absence of disease in the
healthy population. Additionally, having few cells activated and proliferating could

Chapter 7: Discussion
Caroline Cleopatra Chisenga Ph.D. Thesis
153
mean a good T cell activation regulation (Chattopadhyay and Roederer, 2011). On
the contrary, other studies have shown that CD4+ proliferation correlates with the
amount of antigen present, e.g. HIV (Koopman et al., 2009). Thus, increase in
proliferation means an increase in viral load and this is because proliferating (Ki67+)
CD4+ T cells can efficiently support virus replication (Fleury et al., 2000; Koopman
et al., 2009) and lead to more rapid progression of the disease (Ganesan et al., 2010).
According to literature, most of the lymphocytes are in lymphoid tissues with the
lymph nodes harbouring the majority of the lymphocytes followed by the spleen
(Ganusov and De Boer, 2007). Similarly, we also found a higher number of CD4+ T
cells expressing the gut homing marker (about 35%) and activated gut homing (23%)
in the healthy adults. Gut homing cells are cells that are channelled to gut associated
lymphoid tissues especially when there is an injury to the gut. Having a
representative number of these cells in the peripheral blood could mean that priming
of CD4+ T cells is by the intestinal dendritic cells (Johansson-Lindbom et al., 2003).
There was a different trend, however, in the CD8+ T cell distribution for the healthy
population in that majority of the CD8+ T cells were expressing gut homing markers.
Nevertheless, because of their natural migratory ability, lymphocytes, although
present in the peripheral blood, are capable of returning to the gut associated
lymphoid tissue when there is need (Shacklett et al., 2003). Contrary to the CD4+ T
cell population, there were more effector and effector memory CD8+
T cells in the
healthy adults. These are a population of cells that provide acute defense to the host
and durable immunity (Ahmed and Gray, 1996).
During infection, persistent T cell activation drives proliferation that results in the
accumulation of senescent, antigen-experienced memory T cells with reduced
expression of CD28 and increased expression of CD57 (Focosi et al., 2010).

Chapter 7: Discussion
Caroline Cleopatra Chisenga Ph.D. Thesis
154
Similarly, we also found a higher number of senescent CD8+ T cells in the HIV-
negative cohorts. Expression of CD57 has been linked to greater resistance to
apoptosis in CD8+ T lymphocytes especially during HIV-infection, facilitating
accumulation (Petrovas et al., 2009). Since CD8+
T cells are crucial to the
recognition and clearance of virus-infected cells (Carmichael et al.,1993; Kaech and
Amed 2001), a high number of senescent CD8+ T cells may underlie the inability of
T cell immunity to suppress virus adequately in an event of infection in the healthy
population. In addition, for the healthy population, having senescent cells could also
mean the presence of an insignificant activation, although the numbers of
proliferating, proliferating and activated and activated CD8+ T cells were very low.
Finally, contrary to what has been reported by Aina and colleagues (2005), we found
higher CD4+ count in the female Zambians similar to an Ethiopian study (Lee et al.,
1996) CD4+
cell counts were they reported to be significantly higher in women than
in men, as did studies in Indian (Uppal et al., 2003) and in Uganda (Tugume et al.,
1996). It is not clear whether these are true variations across countries in the
relationship between gender and CD4+ cell counts or these results are due to
confounding factors such as the differences in study participants (Pregnant women in
the case of a study by Aina and colleagues).
In summary, in healthy population, the majority of circulating CD4+ T cells were
naïve. The majority of circulating CD8+ T cells expressed gut homing markers.
Although there are many CD4+ recent thymic emigrants in this population (about
80%), CD8+ recent thymic emigrants were lower (about 10%).
CD8+ senescent T cells were more common in the healthy population than senescent
CD4+ T cells. This might be because of repeated antigenic stimulation, which is
associated with a progressive decline in the CD28. This loss is at an accelerated rate
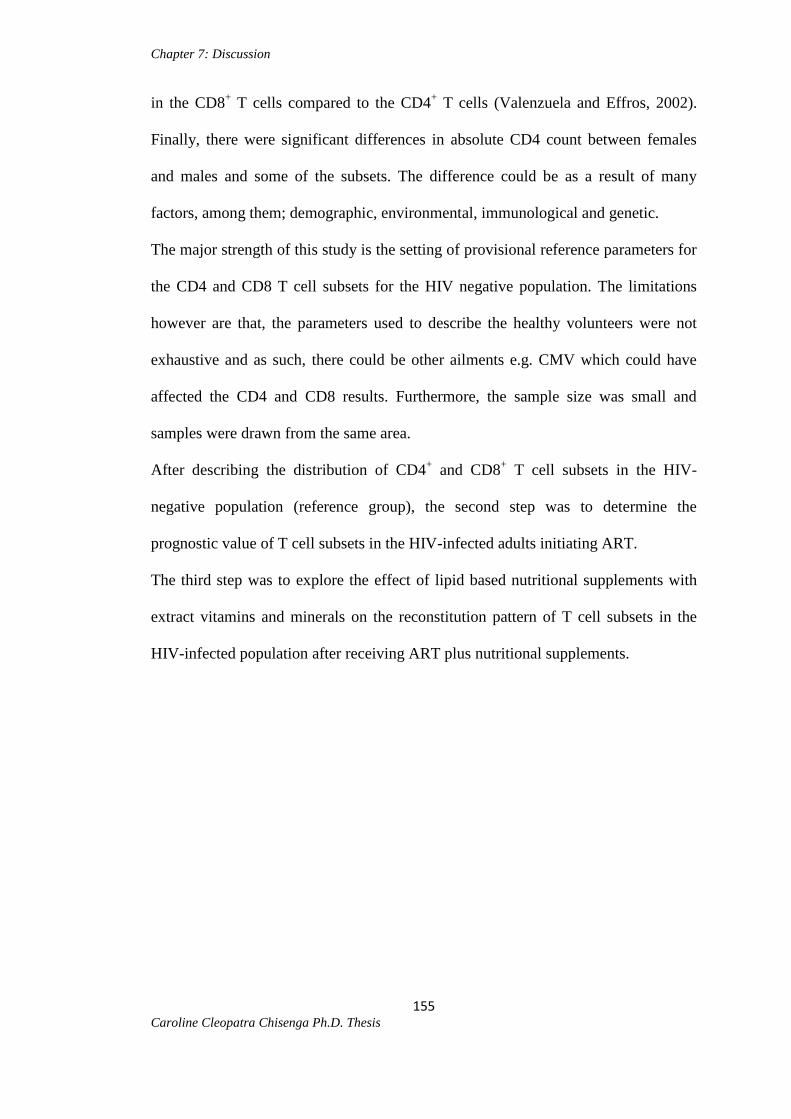
Chapter 7: Discussion
Caroline Cleopatra Chisenga Ph.D. Thesis
155
in the CD8+ T cells compared to the CD4
+ T cells (Valenzuela and Effros, 2002).
Finally, there were significant differences in absolute CD4 count between females
and males and some of the subsets. The difference could be as a result of many
factors, among them; demographic, environmental, immunological and genetic.
The major strength of this study is the setting of provisional reference parameters for
the CD4 and CD8 T cell subsets for the HIV negative population. The limitations
however are that, the parameters used to describe the healthy volunteers were not
exhaustive and as such, there could be other ailments e.g. CMV which could have
affected the CD4 and CD8 results. Furthermore, the sample size was small and
samples were drawn from the same area.
After describing the distribution of CD4+ and CD8
+ T cell subsets in the HIV-
negative population (reference group), the second step was to determine the
prognostic value of T cell subsets in the HIV-infected adults initiating ART.
The third step was to explore the effect of lipid based nutritional supplements with
extract vitamins and minerals on the reconstitution pattern of T cell subsets in the
HIV-infected population after receiving ART plus nutritional supplements.

Chapter 7: Discussion
Caroline Cleopatra Chisenga Ph.D. Thesis
156
7.2 What are the Immunological Risk Factors Associated with Death Within 12
Weeks of Initiating ART and Do CD4 or CD8 T Cell Subsets Respond to Extra
Vitamins and Minerals in vivo?
Although there is vast literature showing an increase in CD4 count after ART and
nutritional support (section 3.12), the magnitude of increase observed in the
NUSTART trial participants was higher than what has been reported previously.
Therefore, it is envisaged that analysis of the effects of nutritional supplementation
on T cell subsets would provide much detail in the causes of sharp rises in CD4
counts.
Consistent with previous reports from sub-Saharan Africa (Stringer et al., 2006;
Verguest et al., 2013), we found high mortality rates (20%) within 12 weeks of
initiating ART among a cohort of malnourished Zambian adults with advanced
stages of HIV-infection (Filteau et al., 2015). We explored T cell subsets as
predictors of mortality and found that they predicted death and displaced total CD4+
count in multivariate models. The nutritional intervention we trialled did not affect
these subsets, so we have not yet found a tool for manipulating T cell subsets or
ameliorating the impact of under nutrition on mortality during ART initiation
(Filteau et al., 2015). In our analysis, a high number of naïve CD4+ T cells and a high
number of senescent CD8+ T cells at ART initiation were associated with higher
mortality rates, whilst a high number of proliferating CD4+ or CD8
+ T cells were
associated with survival meaning the body’s natural way of responding to antigens
was not lost.
We found a consistent effect of proliferating CD4+ and CD8
+ T cells on mortality,
such that higher levels of proliferation were associated with protection against death.

Chapter 7: Discussion
Caroline Cleopatra Chisenga Ph.D. Thesis
157
Other studies have shown that CD4+ proliferation positively correlates with viral
load; it has been suggested that this is because proliferating (Ki67+) CD4
+ T cells can
efficiently support virus replication (Fluery et al., 2000; Koopman et al., 2009) and
lead to more rapid progression to AIDS (Ganesan et al., 2010). In our cohort of
malnourished adults, however, the effect was opposite. Importantly, our cohort was
moderately or severely malnourished, and this may be a critical point of difference.
We speculate that T cell proliferative ability reflects a greater ability to respond to
co-infections (e.g. Tuberculosis), which are the most frequent cause of mortality after
ART initiation (Walker et al., 2012). By contrast, a low proportion of proliferating
cells in those who subsequently died may signify immune exhaustion, which is
known to affect proliferative capacity and may be a pre-terminal event in a
malnourished individual. Although we did not evaluate cellular exhaustion markers,
other studies have shown that elevated T cell expression of PD-1 (Zhang et al.,
2007), CTLA-4 (Kaufmann et al., 2007) and TIM-3 (Jones et al., 2008) in advanced
HIV disease, which correlate inversely with cellular proliferative capacity.
Our results showed that higher numbers of senescent CD8+ T cells predict mortality.
During HIV-infection persistent T cell activation drives proliferation that results in
the accumulation of senescent, antigen-experienced memory T cells with reduced
expression of CD28 and increased expression of CD57 (Focosi et al., 2010).
Expression of CD57 has been linked to greater resistance to apoptosis in CD8+ T
lymphocytes during HIV-infection, facilitating accumulation (Petrovas et al., 2009).
Since CD8+
T cells are crucial to the recognition and clearance of virus-infected cells
(Carmichael et al.,1993; Kaech et al., 2001), a high number of senescent CD8+ T
cells may underlie the inability of T cell immunity to suppress virus adequately.
It has been reported that naïve CD4+ T cells are progressively depleted during HIV-
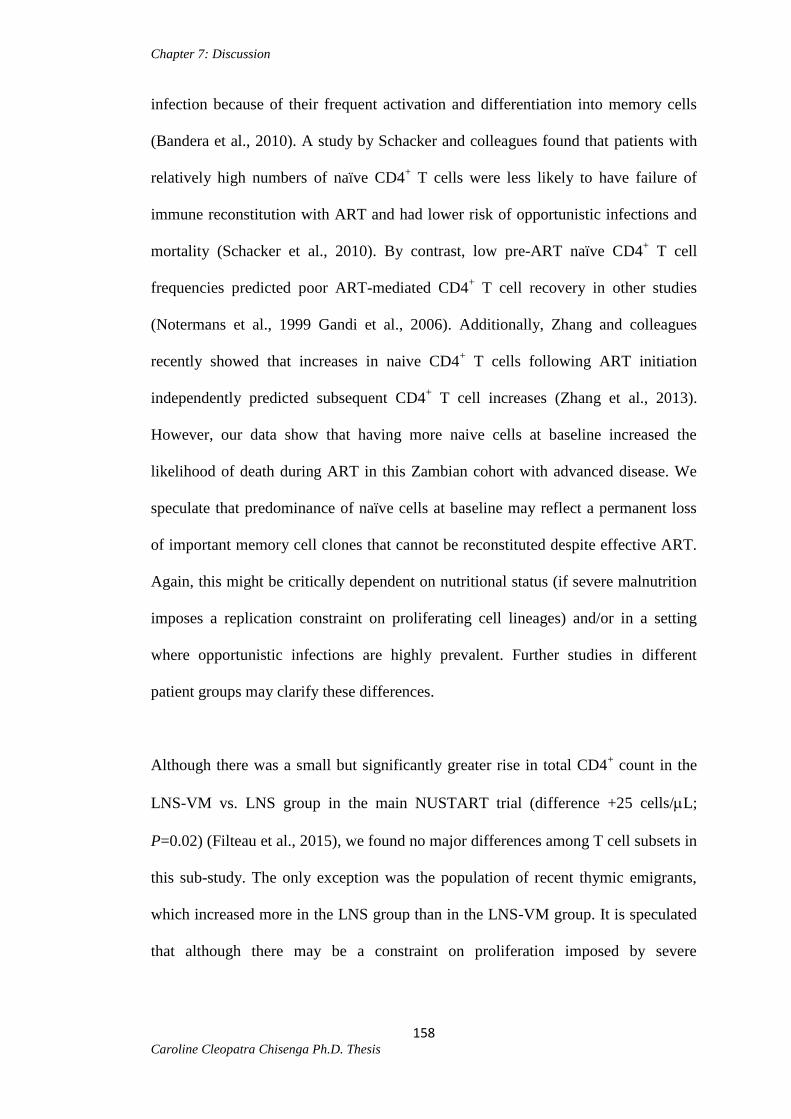
Chapter 7: Discussion
Caroline Cleopatra Chisenga Ph.D. Thesis
158
infection because of their frequent activation and differentiation into memory cells
(Bandera et al., 2010). A study by Schacker and colleagues found that patients with
relatively high numbers of naïve CD4+ T cells were less likely to have failure of
immune reconstitution with ART and had lower risk of opportunistic infections and
mortality (Schacker et al., 2010). By contrast, low pre-ART naïve CD4+ T cell
frequencies predicted poor ART-mediated CD4+ T cell recovery in other studies
(Notermans et al., 1999 Gandi et al., 2006). Additionally, Zhang and colleagues
recently showed that increases in naive CD4+ T cells following ART initiation
independently predicted subsequent CD4+ T cell increases (Zhang et al., 2013).
However, our data show that having more naive cells at baseline increased the
likelihood of death during ART in this Zambian cohort with advanced disease. We
speculate that predominance of naïve cells at baseline may reflect a permanent loss
of important memory cell clones that cannot be reconstituted despite effective ART.
Again, this might be critically dependent on nutritional status (if severe malnutrition
imposes a replication constraint on proliferating cell lineages) and/or in a setting
where opportunistic infections are highly prevalent. Further studies in different
patient groups may clarify these differences.
Although there was a small but significantly greater rise in total CD4+ count in the
LNS-VM vs. LNS group in the main NUSTART trial (difference +25 cells/L;
P=0.02) (Filteau et al., 2015), we found no major differences among T cell subsets in
this sub-study. The only exception was the population of recent thymic emigrants,
which increased more in the LNS group than in the LNS-VM group. It is speculated
that although there may be a constraint on proliferation imposed by severe

Chapter 7: Discussion
Caroline Cleopatra Chisenga Ph.D. Thesis
159
malnutrition, the LNS alone might be sufficient to permit restoration of thymic
output.
This study had several strengths and some limitations. The major strength of this
study is the detailed immunophenotyping that was conducted in malnourished HIV-
infected adults with advanced disease, which allowed us to address questions related
to early mortality, together with the randomized trial design, which allowed us to
evaluate the impact of a nutritional intervention on lymphocyte subsets. Study
limitations included lack of viral loads, which are not generally available in sub-
Saharan Africa for monitoring ART response, and the small sample size at 12 weeks,
due to loss of follow-up. Because the participants in this study had advanced disease
(median CD4 at ART initiation 98 cells/L) and malnutrition, our findings may not
be generalizable to the larger population of HIV-infected adults initiating ART in
sub-Saharan Africa, although it is worth noting that the mean CD4 count at ART
initiation in sub-Saharan African programme in 2002 was 152 cells/L and has not
increased significantly since then, meaning that many patients still start ART in the
setting of advanced immunodeficiency (Siedner et al., 2015).
In this report of a sub-study of a large clinical trial in adults initiating ART, there
were no substantial differences in the effects of a nutritional intervention on specific
T cell subsets, but it was found that baseline numbers of proliferating CD4+ and
CD8+ cells, naive CD4
+ cells, and senescent CD8
+ cells at ART initiation impacted
early mortality on ART. These findings provide insights into the immune
dysfunction of AIDS in the context of malnutrition and suggest that baseline immune
abnormalities in this population render individuals susceptible to co-infections,
which are associated with very high mortality despite ART initiation. Whether
patients would benefit from adjunctive infection control interventions at initiation of

Chapter 7: Discussion
Caroline Cleopatra Chisenga Ph.D. Thesis
160
anti-retroviral therapy (such as additional antiretrovirals and a package of anti-
microbial drugs) in addition to a nutritional intervention, is currently being explored
in Sub-Saharan Africa (REALITY trial; ISRCTN43622374). These findings also
argue strongly for earlier initiation of antiretroviral therapy in sub-Saharan Africa
(Siedner et al., 2015), because the immune perturbations that characterize advanced
immunodeficiency are difficult to reverse.
Although the effects of the nutrients on T cell subsets was not as expected, there is
vast amount of literature that shows the key role that certain micronutrients play in
boosting immune cells. Therefore an in vitro study of the effects of specific
micronutrients on T cells subsets was explored. In particular, an in vitro study of Se
one of the micronutrient present in the bulk of the micronutrients NUSTART trial
participants were receiving would be important. Se is preferred because of its
implication as an immune booster.

Chapter 7: Discussion
Caroline Cleopatra Chisenga Ph.D. Thesis
161
7.3 What is the Effect of Selenium on T Cell Subsets In Vitro?
Similar to what has been reported elsewhere (Dickson and Tomlinson, 1967), plasma
Se for most of the healthy Zambian adult population was within the reported
reference range (1.37; 0.86, 1.53 μmol/L), but about one quarter of healthy adults
were deficient in Se. It is supposed that although the African culture of eating
unprocessed foods is being eroded, there is still a considerable amount of Se present
in the foods available on the market. However, we speculate that since poverty levels
might be escalating in Sub-Saharan Africa, together with climatic changes and the
burden of epidemic and endemic disease (e.g. HIV), the Se status of our population
may change in the future. This study found that Se concentration in the culture
medium increased marker expression on T cell subsets. Importantly, this effect was
most pronounced in individuals with baseline Se levels consistent with deficiency.
This suggests that deficiency has a real and important effect on T cell phenotype as
reported elsewhere (Look et al., 1997).
A study by Broome and colleagues demonstrated that T cell proliferation increased
with an increase in Se. Contrary to these findings, this study found that as the
concentration of Se was increased, both CD4+ and CD8
+ T cell proliferation was
reduced. Thus, it was postulated that the increase in the concentration could have
been toxic to the cells. On the contrary however, one of the significant and
unexpected finding was the consistent increase in the gut homing, homing and
activated CD4+ T cells and gut homing and homing and activated CD8
+ T cells.
These results seem to suggest that an increase in ambient Se concentration positively
affected gut homing CD4+ and CD8
+ T cells and negatively affected the proliferating
cells. These results could mean that T cell subsets respond differently at different Se
concentrations and finding an ideal concentration for each subset require further

Chapter 7: Discussion
Caroline Cleopatra Chisenga Ph.D. Thesis
162
research. A study conducted in HIV-infected and HIV-negative adults with
pulmonary tuberculosis reported that wasting increased as Se levels decreased (van
Lettow et al., 2004). This is because Se plays an important role in the selenoenzyme
glutathione peroxidase that protects cells against free radical damage and oxidative
stress (van Lettow et al., 2004).
In another study, Se increased CD4+ T cell activation, proliferation and
differentiation (Hoffmann et al., 2010). In our study CD4+
T cell activation and
proliferation was decreased and similar to what has been reported by Hoffmann and
colleagues, CD4+ T cell differentiation was increased.
A study by wood and colleagues demonstrated that supplementation with 400 μg Se
per day (as Se yeast), increased the total T cell count significantly by 27% due
largely to the increase in subsets of CD4+ T cells (Woods et al., 2000). This study
however does not indicate which subsets in particular were being altered. Several
studies have reported a positive correlation between low serum or plasma Se and
absolute CD4 count (Look et al., 1997; Drain et al., 2006; Hurwitz et al., 2007;
Kamwesiga et al., 2015). Nonetheless, our study found that both the absolute CD4
and CD8 cells were negatively correlated with plasma Se in our population at
baseline. It is speculated that this finding is odd and therefore difficult to explain.
There is evidence to the effect that inadequate Se intake can result in increased levels
of reactive oxygen species (ROS) or oxidative stress, especially in individuals
deficient in antioxidants like vitamins E and C (Steinbrenner et al., 2009). It has also
been established that ROS related oxidative stress induces cell cycle arrest,
senescence, apoptosis and/or necrotic cell death (Day et al., 2006; Stone et al., 2006).
Nevertheless, in this study, there was a consistent increase in both the CD4 and CD8

Chapter 7: Discussion
Caroline Cleopatra Chisenga Ph.D. Thesis
163
senescent 1 marker expression as the concentration of Se increased. This finding may
mean that at higher concentrations, Se becomes toxic to certain cells. However, when
we baseline number of senescent 1 CD4 cells were compared to baseline plasma Se,
a weak correlation (rho=0.29) was found though the p value was significant
(p=0.04). On the contrary, both the CD4 and CD8s senescent 2 cells disappeared as
Se concentration was increased. It was postulated that increases in Se concentration
enhanced elimination of senescent 2 cells from the cell cycle and ultimately death.
One of the major strength of this study was the detailed analysis of about eighteen
makers expressed on T lymphocytes and their response to Se. However, these results
cannot be generalized to the HIV-infected population since the study was undertaken
in an HIV sero negative population.
Finally, although there was a trend in naïve CD8 to increase with the increase in Se,
this was not very pronounced in the CD4 population. Huang and colleagues report
that higher levels of dietary Se enhanced activation signals in naïve T cells during
TCR-stimulation because higher Se increases free thiols (Huang et al., 2012).
The limitations for this study are that the effects on gut homing cells were shown in
peripheral blood only and it is not known what happened in the gut mucosal
compartment. Additionally, we did not study mRNA of Se dependent enzymes or
proteins or their transcription factors so we do not know how the in vitro effects were
mediated.
In conclusion, this data suggest that Se has rapid effects on T cell subset marker
expression. These effects appear to be direct, although the possibility that other cell
lineages (neutrophils, monocytes, eosinophils) might contribute indirect effects
through cytokines or chemokines cannot be excluded.

Chapter 7: Discussion
Caroline Cleopatra Chisenga Ph.D. Thesis
164
7.4 Are CD4 and CD8 T cell subsets in HIV+ adults comparable to HIV- adults
after 3 months of ART plus nutritional support?
In both the CD4 and CD8 population, results showed that after 3 months of taking
ART plus nutritional support (NUSTART trial participants), most of the markers
were still below what existed in the healthy population.
A review of literature that address changes in CD4 count after ART and nutritional
support report minimal increases in CD4 count for HIV-positive women from pre
ART initiation at 6, 12, and 24 months post initiation as 71, 89 and 153 cells/μL
(Kiefer et al., 2011). Another study conducted in HIV-infected Ethiopian adults
showed that there was a small increase observed following ART plus nutritional
support (25 cells/µL), a borderline significance (Olsen et al., 2014). In a study of 40
HIV-infected patients in the United States, the absolute CD4 count increased by an
average of 24% versus 0% change in the placebo group. This study concluded that
micronutrient supplementation significantly improves CD4 cell count reconstitution
in HIV-infected patients taking HAART (Kaiser et al., 2006). Furthermore, evidence
from a Kenyan study showed that micronutrient supplementation when starting ART
resulted in higher CD4+ (+23 cells/ml, P=0.03) and CD8
+ (+74 cells/ml, p=0.005)
counts (McClelland et al., 2004). Hurwitz and colleagues (Miami USA), also
reported an increase in CD4 count of 27.9 ± 150.2 cells/µL following micronutrient
supplementation with selenium (Hurwitz et al., 2007).
In a recent study by Filteau and team conducted in Zambia, it was been demonstrated
that following ART with a bulk of micronutrients with vitamins and minerals, there
was a significant change in mean CD4 count at 12 weeks post-ART was 25 cells/μL
(95% CI, 4–46) (Filteau et al., 2015). Although all these studies showed an

Chapter 7: Discussion
Caroline Cleopatra Chisenga Ph.D. Thesis
165
improvement in total CD4, our study revealed that CD4+ and CD8
+ T cell subsets do
not reconstitute to levels of healthy controls. We assumed that this could be because
we enrolled participants who were very malnourished with CD4 counts of less than a
100 cells/µL for some of them.
The number of naïve CD4+ T cells in the HIV-infected cohorts after treatment was
low. It is assumed that the loss of naïve T cells has important consequences for the
development of immune responses particularly in HIV-infected individuals. As the
naïve subsets disappear, there will be a progressive inability to mount responses to
novel antigens, which might result in high susceptibility to opportunistic infections
(Janeway et al., 2001). Additionally, this loss compromises the ability to deal with
the constantly mutating virus itself (Janeway et al., 2001). The impairment of
immune function due to the loss of naïve T cells from HIV-infected adults and
children also has important consequences for therapeutic strategies for AIDS
(Roederer et al. 1995). Since responses to novel antigens arise (usually) from the
naïve compartment, the magnitude or effectiveness of such responses is necessarily
dependent on the availability of naive T cells. Therefore, an HIV-infected individual
with no naïve T cells is likely to fail to respond to any primary immunization
involving T cells.
The major limitation for this study is that these patients were not screened for all
opportunistic infections, with that could have confounded the response to treatment.
Furthermore, since these patients were very sick, malnourished and did not undergo
endoscopy, chances are that they could have had HIV enteropathy that could have
affected the absorption of supplements.

Chapter 7: Discussion
Caroline Cleopatra Chisenga Ph.D. Thesis
166
In summary, the survey revealed that functional recovery might be slow in
malnourished HIV-infected individuals.
Chapter 8: Conclusions and Future Work
Caroline Cleopatra Chisenga Ph.D. Thesis
167
Chapter 8: Conclusions and Future Work
8.1 Overall Findings
This study was designed to explore CD4 and CD8 changes during HIV-infection,
how they predict mortality and their response to micronutrients both in vivo and in
vitro. Some prominent findings during this work are that naïve and gut homing CD4
T cell subsets are profoundly depleted in malnourished Zambian adults initiating
ART, T cell subsets do not reconstitute well during the first 3 months of ART even
when additional vitamins and minerals are given, and finally that Se enhances gut
homing marker expression on T cells in vitro.
8.2 Significance of the Research
Throughout the thesis, it has been argued that T cell subsets are more informative
compared to absolute values, both in terms of understanding their prognostic value
and searching for evidence of their response to nutritional interventions.
The predictive value of the proliferation marker Ki67 underlines the importance of T
cell dynamics for outcome. The predictive value of T cell subsets for mortality could
suggest new possibilities for intervention in order to reduce the risk of early
mortality. The data from the clinical trial do not confirm that provision of additional
bulk minerals and micronutrients have a significant impact on T cell subsets; and the
results of the published clinical trial shows that there was no effect on mortality.
However, both study arms were given a lipid-based nutritional supplement and it is
possible that patients in both trial arms benefited. In Zambia it is policy to give
minimal micronutrients to HIV-infected individuals, but it may be that this is
insufficient. Unfortunately, it is unlikely that a placebo-controlled trial will ever be

Chapter 8: Conclusions and Future Work
Caroline Cleopatra Chisenga Ph.D. Thesis
168
carried out because of ethical concerns about giving no nutrients to seriously
malnourished people. It would be sensible for the government to strategise on how to
ensure that this population has an adequate supply of food during the first three
months of commencing treatment. Additionally, it has been shown in this study that
T cell subsets respond well to selenium in vitro. Further work needs to be done to see
if this can be translated into a benefit in patients, and perhaps there is an optimal
micronutrient combination, which would be useful for patients initiating ART.
The in vitro effect of selenium raises another important question. If selenium can
increase expression of gut homing receptors on T cells in vitro, why does a
micronutrient supplement not achieve this in patients? There are several possible
explanations, including poor absorption of selenium, competition for absorption
between micronutrients (iron and zinc are absorbed by a similar range of ion
transporters at supra-physiological levels), or some other aspect of T cell regulation,
which is not yet understood.
In conclusion, I have found that Se can alter gut homing receptor profile on T cells in
vitro, but we have no evidence of a direct effect in patients initiating ART. In
univariate, but not multivariate analysis, gut homing predicted death over the first 3
months of ART treatment. Further work is needed to dissect out the complex
relationships between nutrients and immune responses, in the hope of improving
outcome.

Chapter 8: Conclusions and Future Work
Caroline Cleopatra Chisenga Ph.D. Thesis
169
8.3 Contribution of knowledge to Science
This research has demonstrated the prognostic values of CD4 and CD8 T cell
proliferation markers and also shown for the first time that some T cell subsets
reconstitute slowly during ART initiation in malnourished AIDS patients.
Furthermore, it has been demonstrated that selenium can achieve effects in vitro,
which are not seen in vivo.
8.4 Application of Results in Public Health
These results may help design targeted nutritional interventions that could enhance T
cell proliferation in malnourished HIV-infected adults.
8.5 Future Work
There is urgent need to further look into why giving multiple nutrients did not
improve T cell subset response in vivo, and how to overcome that barrier to
reconstitution. There is also need to understand the mechanism of selenium effect,
and whether other nutrients interfere with it.
micronutrient combinations is key since zinc and iron are known to compete for the
same ion transporters.
APPENDICES
Caroline Cleopatra Chisenga Ph.D. Thesis
170
APPENDIX A Publications from the PhD study

APPENDICES
Caroline Cleopatra Chisenga Ph.D. Thesis
171
APPENDIX B: Awards won during the PhD work
Was awarded the first prize for best oral and poster presenter during the UNZA seminar
week presentations by the director of research and postgraduate studies’ office (DGRS).

APPENDICES
Caroline Cleopatra Chisenga Ph.D. Thesis
172
APPENDIX C NUTRITIONAL SUPPORT FOR AFRICAN ADULTS STARTING
ANTIRETROVIRAL THERAPY (NUSTART)-Effects on T cell subsets
Information sheet (to be kept by participant)
We have invited you to participate in a study that is designed to establish the pattern of
distribution for CD4 T cell subsets in healthy volunteers.
Recent results of HIV-infected adults receiving antiretroviral therapy (ART) plus
nutritional supplementation have shown an improvement in total CD4 count and T cell
subsets by 12 weeks. However, we don’t have information on the pattern of distribution
for CD4 T cell subsets in healthy individuals.
Therefore, in this study we want to find out what the pattern of distribution of CD4 T
cell subsets is like in a healthy population. Results of this study will be used to
determine whether ART plus nutritional supplementation improves CD4 T cell subsets
to clinically significant levels.
What are we asking you to do?
If you are willing to participate in this study, we will collect 10mls of blood (one
tablespoon). During blood collection, you may experience a little discomfort (equivalent
to a mosquito bite) at the time of pricking into the vein on your arm. However, this pain
will quickly disappear or disappear soon after. The whole process will require a
maximum of 30minutes of your time. An HIV test will be done and should you wish to
know your results, you will have to undergo counseling with our nurse counselor. This
will take an extra 45 minutes for both pre and post test.
What do we do with the samples we collect?
The blood samples that we will collect from you will be used for testing HIV, full blood
count, CD4 count and for the analysis of CD4 T cell subset. No blood samples will be
stored for any future work, as this analysis requires fresh blood.
What are the possible benefits to me?
Should we find anything that may require medical attention, this will be facilitated.
What are the possible disadvantages to me?
The only foreseeable disadvantage is the inconvenience of spending 30 minutes at our
lab for blood collection. You may also experience a little discomfort at the site of a
needle prick on your arm.
Confidentiality
Your details will be recorded on a paper form that will be locked away in our office
within UTH. Furthermore, your details will be entered on a computer in a coded form
and your name will not be included, only your enrolment number will be used. Any

APPENDICES
Caroline Cleopatra Chisenga Ph.D. Thesis
173
information and results obtained will remain absolutely confidential, and other family
members and work colleagues will not be granted access to this information.
The study is voluntary
You do not have to participate in this study if you do not wish to, and even if you agree,
you are free to change your mind at a later stage. The Research Ethics Committee of the
University of Zambia has approved this study and their contact details are given below.
Contact details of the Principal investigator: Mrs. Caroline C. Chisenga, Tropical
Gastroenterology & Nutrition Group (TROPGAN), Department of Internal Medicine,
University of Zambia School of Medicine, UTH, Nationalist Rd P.O. BOX 50398,
Lusaka, Zambia (Phone 0953591762)
Contact details of Research Ethics Committee: The Chairperson, REC office,
Department of Anatomy, Ridgeway Campus, Nationalist Rd, Lusaka (Phone 0211
256067)

APPENDICES
Caroline Cleopatra Chisenga Ph.D. Thesis
174
APPENDIX D
NUTRITIONAL SUPPORT FOR AFRICAN ADULTS STARTING
ANTIRETROVIRAL THERAPY (NUSTART)-Effects on T cell subsets
Consent record sheet (to be kept by study team)
I confirm that I have understood the information I have been given about the study. I
agree to participate in the study. I confirm that I am joining the study of my free will
and that I can withdraw at any time without affecting the care available to me. I
understand what will be required of me.
Name:
Signed (or thumbprint)
Date:
Signature (or thumbprint) of witness
Name:
Date:
I confirm that I have explained the information fully and answered any questions
Signed for the study team
Name:
Date:

APPENDICES
Caroline Cleopatra Chisenga Ph.D. Thesis
175
APPENDIX E
NUTRITIONAL SUPPORT FOR AFRICAN ADULTS STARTING
ANTIRETROVIRAL THERAPY (NUSTART)-Effects on T cell subsets
Questionnaire Study ID
NO._____________
1. Date:
2. Age
(years)____________________
3. Sex Male
Female
4. Religion None
Christian
Muslim
Hindu
Other_____________________
5. Occupation Employed
Student
Other_____________________
6. Highest education level completed No education
Primary
Secondary
College
University
7. Marital status Married
Widow/widower
Divorced
Single-never married
Other_____________________

APPENDICES
Caroline Cleopatra Chisenga Ph.D. Thesis
176
General health and well being
1. Have you been sick and or admitted to the hospital for at least overnight in the
last three months? Yes /No
a. If yes, for how long ______________(Days)
b. What was the diagnosis (Problem)?_______________________
2. Currently are you on any medication? Yes/No
2. If yes, indicate the type of medication
a. Antibiotic(s)
b. Other (specify)_____________________________________
Blood Sample
1. Time of phlebotomy (24 hour clock)
______:_____
2. Problems with blood sampling if any
____________
3. Time received in the lab (24 hour clock) ______:_____
General Knowledge Test
1. Have you ever heard of CD4 count testing? Yes/No
2. Do you know what CD4 T cell subsets are? Yes/No
Measure and record height in cm to the nearest 0.1cm
_________________cm
Measure and record weight in kilograms to the nearest 0.1 kg
_________________kg
Grip strength (kg to the nearest 0.1) _________________kg

APPENDICES
Caroline Cleopatra Chisenga Ph.D. Thesis
177
APPENDIX F

APPENDICES
Caroline Cleopatra Chisenga Ph.D. Thesis
178
APPENDIX G

APPENDICES
Caroline Cleopatra Chisenga Ph.D. Thesis
179
APPENDIX H

APPENDICES
Caroline Cleopatra Chisenga Ph.D. Thesis
180
APPENDIX I

APPENDICES
Caroline Cleopatra Chisenga Ph.D. Thesis
181
APPENDIX J Laboratory protocol details.
FACSVerse principle
This is a laser-based, biophysical technology employed in cell counting, cell sorting,
biomarker detection and protein engineering, by suspending cells in a stream of fluid
and passing them through an electronic detection apparatus. It allows simultaneous
multiparametric analysis of the physical and chemical characteristics of up to thousands
of particles per second.
Principles of panel design
a) Matching of fluorochromes was done by brightness and smeared antigens.
Monoclonal antibodies (mAbs) that were used for staining were as follows:
allophycocynanin-H7 (APC-H7) labelled CD3, allophycocyanin (APC) labelled CD27
or CD57 or HLA-DR or integrin β7, phycoerythrin (PE) labelled CCR7 or CD28 or
CD31, peridinin chlorophyll protein (PerCP) labelled CD4 or 7AAD, and fluorescein
isothiocyanate (FITC)-labelled CD28 or CD4 or Ki67 or α4, and phycoerythrin cyanine
dye (PE-CY7) labelled CD25 or CD45RA or CD27.
Panel design
Fluorochrome APC-H7 PerCP FITC APC PE-Cy7 PE
Homing
Activated
CD3 CD4 4 7 CD25
Thymic CD3 CD4 Ki67 HLA-
DR
CD45RA CD31
Senescence CD3 7AAD CD4 CD57 CD27 CD28
Differentiation CD3 CD4 CD28 CD27 CD45RA CCR7
b) The potential for spectra overlap was minimized.
c) Tandem dyes were used with consideration of their technical limitations.

APPENDICES
Caroline Cleopatra Chisenga Ph.D. Thesis
182
Compensation requirements for tandem dye conjugates can vary, even between two
experiments with the same antibody. It requires compensation that is: lot specific,
experiment specific, and label specific. Certain tandem dye conjugates (APC-Cy7, PE-
Cy7) can degrade with exposure to light, elevated temperature, or fixation. As such,
exposure to these conditions was minimized.
d) CS&T beads were used for quality control performance.
e) Fluorescence Minus One (FMO) contains all the lineage markers except the one
of interest. FMO controls were used to determine the gating boundaries and to increase
the accuracy by delineating positively vs negatively stained cells as follows;
FMO for homing panel
Antigen (FMO) APC-H7 PerCP FITC APC PE-Cy7
CD3 - CD4 4 7 CD25
CD4 CD3 - 4 7 CD25
4 CD3 CD4 - 7 CD25
7 CD3 CD4 4 - CD25
CD25 CD3 CD4 4 7 -
FMO for thymic panel
Antigen (FMO) APC-H7 PerCP FITC APC PE-Cy7 PE
CD3 - CD4 Ki67 HLA-
DR
CD45RA CD31
CD4 CD3 - Ki67 HLA-
DR
CD45RA CD31
Ki67 CD3 CD4 - HLA-
DR
CD45RA CD31
HLA-DR CD3 CD4 Ki67 - CD45RA CD31
CD45RA CD3 CD4 Ki67 HLA-
DR
- CD31
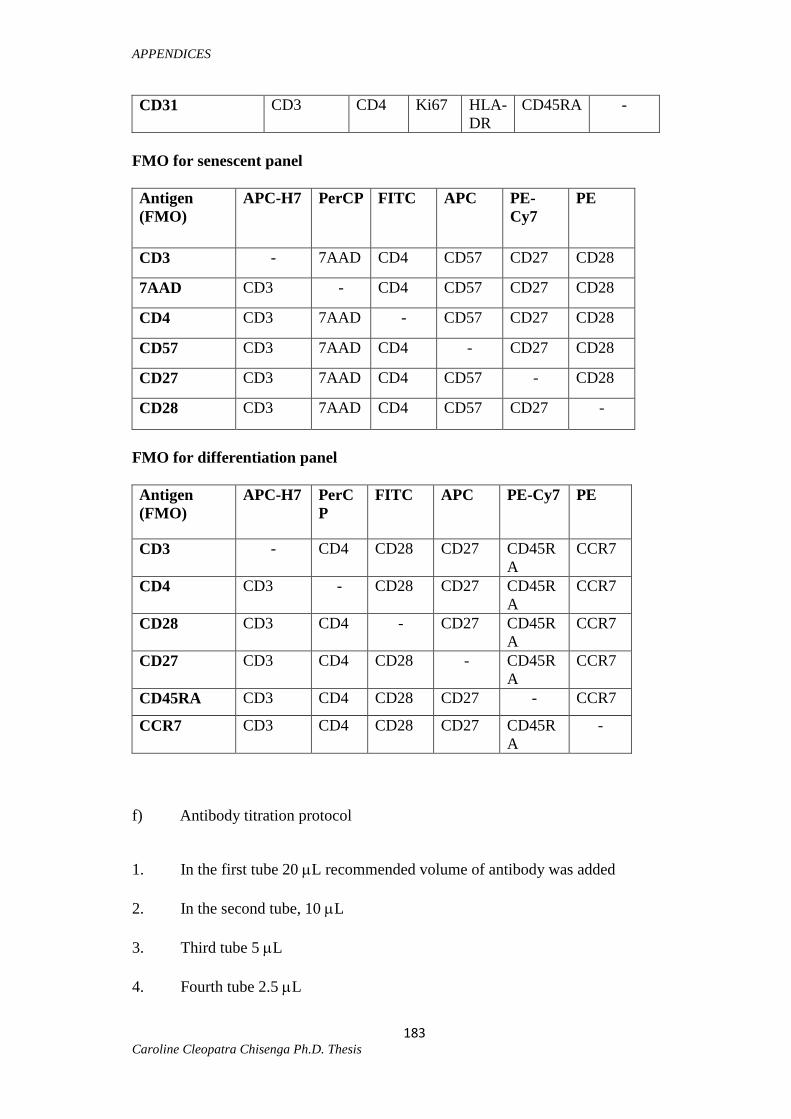
APPENDICES
Caroline Cleopatra Chisenga Ph.D. Thesis
183
CD31 CD3 CD4 Ki67 HLA-
DR
CD45RA -
FMO for senescent panel
Antigen
(FMO)
APC-H7 PerCP FITC APC PE-
Cy7
PE
CD3 - 7AAD CD4 CD57 CD27 CD28
7AAD CD3 - CD4 CD57 CD27 CD28
CD4 CD3 7AAD - CD57 CD27 CD28
CD57 CD3 7AAD CD4 - CD27 CD28
CD27 CD3 7AAD CD4 CD57 - CD28
CD28 CD3 7AAD CD4 CD57 CD27 -
FMO for differentiation panel
Antigen
(FMO)
APC-H7 PerC
P
FITC APC PE-Cy7 PE
CD3 - CD4 CD28 CD27 CD45R
A
CCR7
CD4 CD3 - CD28 CD27 CD45R
A
CCR7
CD28 CD3 CD4 - CD27 CD45R
A
CCR7
CD27 CD3 CD4 CD28 - CD45R
A
CCR7
CD45RA CD3 CD4 CD28 CD27 - CCR7
CCR7 CD3 CD4 CD28 CD27 CD45R
A
-
f) Antibody titration protocol
1. In the first tube 20 L recommended volume of antibody was added
2. In the second tube, 10 L
3. Third tube 5 L
4. Fourth tube 2.5 L

APPENDICES
Caroline Cleopatra Chisenga Ph.D. Thesis
184
5. Fifth tube 1 L
6. Sixth tube 0.5 L
7. After adding the antibody, 100 L whole blood was added to all the tubes.
8. The first tube had a volume of 120 L. The other tubes were brought up to 120
Lwith PBS.
9. This was followed by incubation and lysing as per the staining protocol.
10. The FACSVerse and gating protocol were set up as required.
11. The histogram for the CD4 and or CD8 FITC data were drawn.
12. Data were acquired using the optimized voltage settings. About 50,000 to
100,000 events were acquired.
13. Since these were not single stains, compensation was needed.
14. On the 20 L tube, CD8- population and CD8
+ population on the histogram
were gated.
15. Statistics for these gates were displayed.
16. Statistics were then exported to excel and the ratio between CD8+ and CD8
- cell
populations calculated.
The table below shows the final working volumes of all antibodies after titration. Note
that all the antibodies were titrated as recommended by the manufacturers to suit the
variances in investigations, and the concentrations picked gave the optimal results.

APPENDICES
Caroline Cleopatra Chisenga Ph.D. Thesis
185
Antibody titration and final working volume
Antibody Fluorochrome Recommended
volume
Final
volume
titrated
CD3 APC-H7 20 L 1 L
CD4 Per CP 20 L 1 L
CD8 Per CP 20 L 1 L
7AAD Per CP 5 L 1 L
4 FITC 5 L 2.5 L
CD4 FITC 20 L 1 L
7 APC 20 L 1 L
Ki67 FITC 20 L 1 L
CD28 FITC 20 L 1 L
HLA-DR APC 20 L 1 L
CD57 APC 5 L 1 L
CD27 APC 20 L 1 L
CD25 PE-Cy7 5 L 1 L
CD45RA PE-Cy7 5 L 1 L
CD28 PE 20 L 1 L
CD27 PE-Cy7 5 L 1 L
CCR7 PE 20 L 1 L
CD31 PE 20 L 1 L
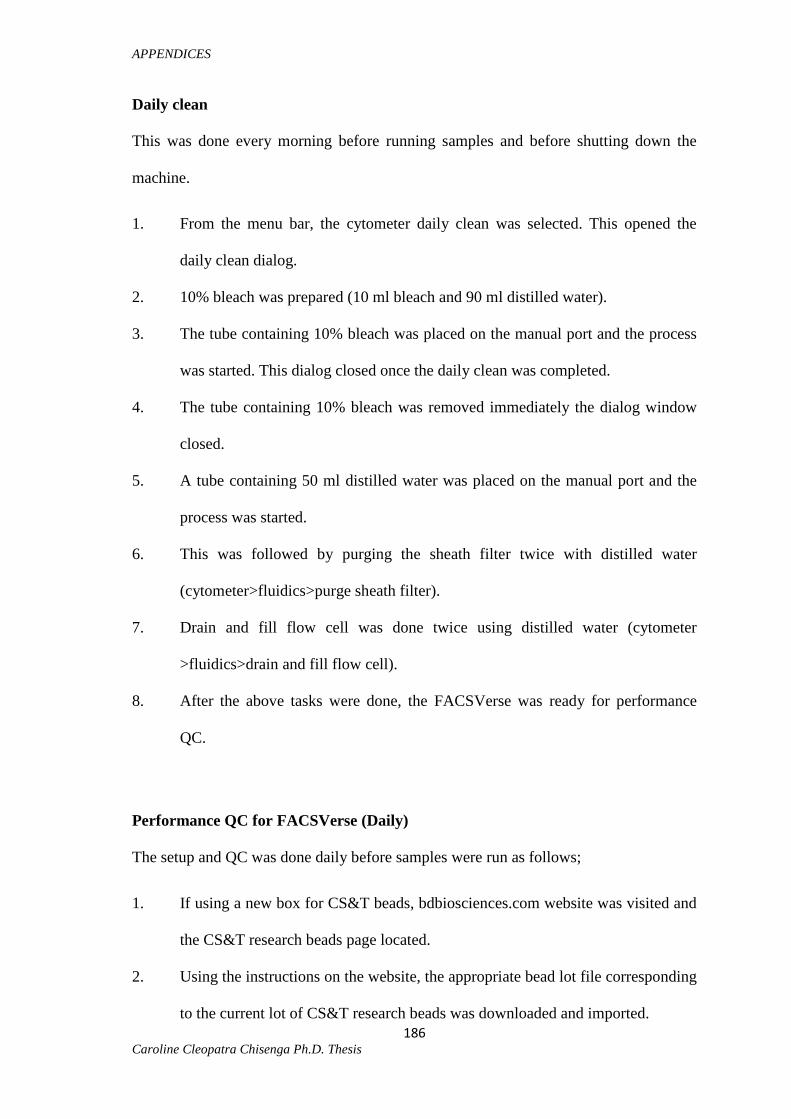
APPENDICES
Caroline Cleopatra Chisenga Ph.D. Thesis
186
Daily clean
This was done every morning before running samples and before shutting down the
machine.
1. From the menu bar, the cytometer daily clean was selected. This opened the
daily clean dialog.
2. 10% bleach was prepared (10 ml bleach and 90 ml distilled water).
3. The tube containing 10% bleach was placed on the manual port and the process
was started. This dialog closed once the daily clean was completed.
4. The tube containing 10% bleach was removed immediately the dialog window
closed.
5. A tube containing 50 ml distilled water was placed on the manual port and the
process was started.
6. This was followed by purging the sheath filter twice with distilled water
(cytometer>fluidics>purge sheath filter).
7. Drain and fill flow cell was done twice using distilled water (cytometer
>fluidics>drain and fill flow cell).
8. After the above tasks were done, the FACSVerse was ready for performance
QC.
Performance QC for FACSVerse (Daily)
The setup and QC was done daily before samples were run as follows;
1. If using a new box for CS&T beads, bdbiosciences.com website was visited and
the CS&T research beads page located.
2. Using the instructions on the website, the appropriate bead lot file corresponding
to the current lot of CS&T research beads was downloaded and imported.
APPENDICES
Caroline Cleopatra Chisenga Ph.D. Thesis
187
3. The CS&T research beads were thoroughly mixed using the vortex.
4. The 12x75-mm capped polystyrene tube was labeled.
5. Using a pipette, 0.5 ml of sheath fluid was drawn into the labeled tube.
6. Following thorough mixing of the CS&T research beads, 2 drops of the beads
were put into the labeled tube and mixed with the sheath fluid.
7. The tube was again vortexed before use.
8. Using the setup and QC option on the FACSverse, the setup and QC tasks was
selected.
9. The CS&T bead lot was selected.
10. Using the performance QC icon, the QC was started.
11. If the performance QC passed, the machine was ready for sample processing.
Characterization QC for FACSVerse (Monthly)
This was done monthly or as and when there was need to do so. Characterization QC
beads were prepared as the performance QC beads. Except for the following;
1. Instead of 0.5 ml sheath fluid, 1.0 ml was used.
2. Four drops of the CS&T research beads were added.
3. On the setup and QC option the setup and QC tasks was selected.
4. The CS&T bead lot was selected.
5. Using the characterization QC icon, the QC was started.
Creating a new experiment for sample acquisition
1. Using the navigation bar, the experiments icon was clicked.
2. The manage experiments tab opened in the experiments workspace.
3. Using the experiments browser panel, the default folder or sub folder was

APPENDICES
Caroline Cleopatra Chisenga Ph.D. Thesis
188
clicked.
4. Then new experiment was clicked. This opens a new experiment with the new
experiment name and creation date displayed.
5. Existing experiments were opened by double clicking.
6. To add tube to an experiment, in the data sources panel, new tube icon was
clicked.
7. To acquire data in the experiment, the tube was loaded onto the manual tube
port.
8. Using data sources, the pointer was set on the sample tube and acquire clicked.
9. During acquisition, the run pointer turned orange and displayed an activity
indicator. Acquisition continued until the stopping rules were satisfied.
10. Following acquisition, the tube icon displayed as a filled tube indicating hat data
had been acquired. To go to the next tube, the run pointer was moved to the next
tube and clicked.
Adjusting data plots
1. Data in a specific tube was previewed by clicking preview.
2. During preview, the pointer runner remained blue whilst displaying the activity
indictor.
3. When data was displayed in plots, adjustments were done using the cytometer
settings and gates drawn in order to identify the populations of interest.
4. To put all the populations on scale, PMT voltages were adjusted.
5. To enable the data sliders, the PMTV button in the lower-left corner of the plot
was clicked.
6. The slider control for each axis was dragged and the PMTV value displayed on

APPENDICES
Caroline Cleopatra Chisenga Ph.D. Thesis
189
the slider control.
7. Threshold values were adjusted as needed using the checkbox.
8. Heights and width were also adjusted as needed
9. To stop previewing, stop was clicked.
Analysis of a sample by flow cytometry showing three different populations
(lymphocytes, monocytes, and granulocytes)
Density plot
Compensation
This ensures that the fluorescence detected in a particular detector derives from the
fluorochrome that is being measured.
Briefly, all fluorochromes have excitation and emission spectra. The excitation
spectrum is a range of light wavelengths that add energy to a fluorochrome, causing it to
emit light in another range of wavelengths, the emission spectrum. Within a flow
cytometer, the appropriate ranges of excitation and emission wavelengths are selected

APPENDICES
Caroline Cleopatra Chisenga Ph.D. Thesis
190
by bandpass filters. However, when emission spectra overlap, fluorescence from more
than one fluorochrome may be detected. To correct for this spectral overlap, a process
of fluorescence compensation is used and the following were the steps used.
1. BD FACSuite FC beads webpage was looked up (bdbiosciences.com)
2. The appropriate bead lot file was imported into BD FACSuite using the
manufactures instructions.
3. The polystyrene tubes were labeled for each fluorochrome in the kit.
4. Bead vials were mixed by gentle vortexing.
5. Two drops of the individual fluorochrome were added to the fluorochrome
labeled tube
6. One drop of the FC beads was also added to the bottom of the tube.
7. The tubes were gently vortexed and incubated for 15-30 minutes at room
temperature in the dark.
8. To each tube, 0.5 ml bead diluent was added and the tubes gently vortexed
before use.
9. An experiment was set up and tubes added for each flourochrome (FITC, PE,
PerCP, APC, PerCP-Cy5.5, PE-Cy7, APC-Cy7 and APC-H7).
10. Dot plots of forward scatter-A (FSC-A) versus side scatter-A (SSC-A) were
drawn. For every other fluorochrome that was used, dot plots were duplicated.
11. The sample was then previewed, followed by right clicking on the tube and
selecting properties.
12. Compensation was selected and values adjusted followed by acquisition.
13. Compensation is correctly set when the median of the negative population is
equal to the median of the positive population in the spillover channel.

APPENDICES
Caroline Cleopatra Chisenga Ph.D. Thesis
191
Compensation for flurochromes without tandems
Fluorochrome in the tube
FITC PE PerCP APC
Fil
ters
(volt
age)
FITC 100 1.00 1.00 0.86
PE 8.53 100 0.85 5.00
PerCP 0.00 1.00 100 9.00
APC 1.10 10.0 0.75 100
Compensation for fluorochromes with tandems
Fluorochrome in the tube
PerCP-Cy5 PE-Cy7 APC-Cy7 APC-H7
Fil
ters
(volt
age)
PerCP-Cy5 100 1.00 1.00 0.84
PE-Cy7 8.45 100 0.80 5.00
APC-Cy7 0.00 1.00 100 1.00
APC-H7 1.10 10.0 0.70 100
Whole blood subset staining and testing-lyse wash protocol
1. A new experiment was created with lyse wash settings.
2. EDTA blood tube was inverted to ensure the cells are well mixed.
3. 100 L of blood was added to the tube and labeled.
4. Titrated volume of antibodies were added to the tube (2 L each)
5. Samples were then vortexed and incubated for 15 minutes at room temperature
(RT) in the dark
6. BD FACSlyse 10X was diluted with distilled water to a 1X working solution
a. This lysing solution was stable for a maximum of 1 week. However, when

APPENDICES
Caroline Cleopatra Chisenga Ph.D. Thesis
192
preparing new lysing solution a new container was always used.
7. 2 ml of 1X lysing solution was added to the tube
8. Samples were vortexed and incubated for 10 minutes at RT in the dark
9. Samples were then Spun at 1500 r. p. m for 5 minutes
10. The supernatant was discarded, leaving behind about 50 L
11. To re-suspend the cells, tubes were vortexed once again
12. 2 ml PBS was added and tubes were centrifuged at 1500 r. p. m for 5 minutes at
room temperature
13. The supernatant was discarded, leaving behind 50 L
14. Samples were vortexed and 250 L PBS added when using immediately, and
250 L 1X cell fix when leaving overnight
15. Samples were then ready for acquisition

APPENDICES
Caroline Cleopatra Chisenga Ph.D. Thesis
193

APPENDICES
Caroline Cleopatra Chisenga Ph.D. Thesis
194
FACS intracellular staining protocol
1. Extracellular staining protocol was followed up to the cell fix stage.
2. A 100 L of cell fix was added to the tubes requiring extracellular staining.
3. Tubes were vortexed and incubated at room temperature for 10 minutes.
4. Cells were washed with 1 ml perm buffer (for permeabilising cells) at 1800 r. p.
m. for 5 minutes.
5. The supernatant was then decanted and 1L intracellular antibody added i.e.
Ki67.
6. Sample tubes were vortexed and incubated at 2-80c in the dark for 30 minutes.
7. Samples were then washed with 1 ml PBS at 1800 r. p. m.
8. The supernatant decanted and 250 L cell fix or PBS added.
9. Samples were then ready for acquisition.
Lyse no wash protocol for absolute CD4 and CD8 count
1. Add 50 L of blood to a BD trucount tube
2. Add 5 L of each flouorochrome and vortex
3. Incubate for 15 minutes in the dark
4. Add 450 L of 1X lysing solution
5. Incubate for another 15 minutes in the dark
6. Sample is ready for acquisition
7. To gate lymphocytes, SSC vs CD45 was plotted
8. SSC vs CD3 was plotted to get T cells
9. CD4 vs CD8 was used to show data from CD3 population
10. An equation was then setup to do the calculations.
(CD4 events/ Bead events) x (bead count/50 L) = CD4 count

APPENDICES
Caroline Cleopatra Chisenga Ph.D. Thesis
195
Number of CD4 events/ number of CD45 events x 100 = CD4%
CD4 and CD8 antibodies and flourochromes
CD45 Per CP CY5.5
CD3 APC-H7
CD4 PE
CD8 FITC
Gating
The data generated via flow-cytometry were plotted in a single dimension, or in two-
dimensional dot plots or even in three dimensions. The regions on these plots were
sequentially separated, based on fluorescence intensity, by creating a series of subset
extractions, termed "gates." The plots were made on logarithmic scales. Because
different fluorescent dyes' emission spectra overlap, signals at the detectors were
compensated electronically as well as computationally.
In immunofluorescence analysis, quadrants are often drawn on a cytogram and the
number of cells in each quadrant recorded. Quadrants were set to delineate the CD4
positive and negative populations.
Data accumulated using the flow cytometer were analyzed using FACSuite software

APPENDICES
Caroline Cleopatra Chisenga Ph.D. Thesis
196
Figure 5-3: Gating strategies

APPENDICES
Caroline Cleopatra Chisenga Ph.D. Thesis
197
The light scatter (SSC-A versus FSC-A) defines three distinct populations; these are
the granulocytes, monocytes and lymphocytes. Similarly, populations of interest
were gated accordingly and statistics for each gate calculated.

APPENDICES
Caroline Cleopatra Chisenga Ph.D. Thesis
198
APPENDIX K: Laboratory practices and safety procedures
The following practices were followed for the prevention of laboratory infection and
disease, as well as for the reduction of the potential for contamination of
experimental material. These practices and procedures provide the foundation for the
more restrictive containment of organisms.
1. Personal Hygiene
1. Do not eat, drink, chew gum, use tobacco, apply cosmetics (including chap
stick), or handle contact lenses in the laboratory.
2. Do not store food for human consumption in laboratory refrigerators.
3. Wash hands frequently after handling infectious materials, after removing
latex/nitrile gloves and protective clothing, and always before leaving the
laboratory.
4. Keep hands away from mouth, nose, eyes, face, and hair.
5. Do not remove personal protective equipment (such as cloth lab coats) from
the lab.
6. First-aid kit(s) should be available.
2. Laboratory Procedures For Handling Infectious Microorganisms
1. A laboratory biosafety manual was assembled outlining activities and
defining standard operating procedures.
2. Training employees and ensuring that all personnel are informed of hazards.
3. Plan and organize materials/equipment before starting work.
4. Keep laboratory doors closed; limit access to lab personnel.

APPENDICES
Caroline Cleopatra Chisenga Ph.D. Thesis
199
5. When pathogens are used in long-term studies, post a biohazard sign at the
laboratory entrance identifying the agents in use and the appropriate
emergency contact personnel.
6. Laboratories should have a sink for hand washing, an eyewash station in
which the eyewash is tested/flushed weekly, be relatively clutter-free, and be
easy to clean.
7. Wear a fully fastened laboratory coat when working with infectious agents.
Wear protective gloves whenever handling potentially hazardous materials,
including human blood and body fluids. Wear eye protection when working
in the BSL2 laboratory when necessary.
8. Remove and leave all protective clothing, including gloves, within the
laboratory before exiting. If transport of research materials through public
spaces is required, one glove may be removed and ungloved hand used to
handle public equipment (door handles, elevator buttons, etc.) and lab coats
may be carried.
9. Never mouth-pipette; use mechanical pipetting devices.
10. When practical, perform all aerosol-producing procedures such as shaking,
grinding, sonicating, mixing, and blending in a properly operating biological
safety cabinet (BSC).
11. Centrifuge materials containing infectious agents in durable, shatter-resistant,
closable tubes. Use a centrifuge with sealed heads or screw-capped safety
cups. After centrifugation, open the tubes within a BSC.

APPENDICES
Caroline Cleopatra Chisenga Ph.D. Thesis
200
12. Minimize the use of needles, syringes, razor blades, and other sharps when
possible. After use, syringe-needle units must be disposed in a dedicated
sharps container without removing or recapping the needles.
13. Cover countertops where hazardous materials are used with plastic-backed
disposable paper to absorb spills and dispose of them daily or following a
spill.
14. Wipe work surfaces with an appropriate disinfectant according to
corresponding IBC protocol after experiments and immediately after spills.
15. Decontaminate all contaminated or potentially contaminated materials by
appropriate methods before disposal (See Chapter V of this Manual).
16. Report all accidents and spills to the laboratory supervisor. All laboratory
personnel should be familiar with the emergency spill protocol and the
location of cleanup equipment. Step-by-step Spill response protocols should
be posted in the laboratory.
17. Good housekeeping practices are essential in laboratories engaged in work
with infectious microorganisms. Do not forget to routinely decontaminate all
shared equipment and equipment in common areas.
18. Be sure to advise custodial staff of hazardous areas and places they are not to
enter. Use appropriate biohazard signs.
19. Equipment used with biohazards must be decontaminated prior to repair.

References
Caroline Cleopatra Chisenga Ph.D. Thesis
201
References
Ahmed, R. and D. Gray. 1996. “Immunological memory and protective immunity:
understanding their relation.” Sci., 272, 54–60.
Aina, O., J. Dadik, M. Charurat, P. Amangaman, S. Gurumdi, E. Mang, R. Guyit,
N. Lar, P. Datong, C. Daniyam, P. Kanki, and A. Abimiku. 2005. “Reference
Values of CD4 T Lymphocytes in Human Immunodeficiency Virus-Negative
Adult Nigerians.” Clin. Diag. Lab. Immunol., 12(4), 525–530.
Akiba, H., H. Nakano, S. Hishinaka, M. Shindo, T. Kobata, M. Atsuta, C.
Morimoto, C. F. Ware, N. L. Malinin, D. Wallach, H. Yagita, and K. Okumura.
1998. “CD27, a member of the tumor necrosis factor receptor superfamily,
activates NF-job and stress-activated protein kinase/c-Jun N-terminal kinase via
TRAF2, TRAF5, and NF-job-inducing kinase.” J. Bolo. Chem., 273, 13353–
13358.
Aliment J. B., T. B. Ball and K. R. Fouke. 2003. “Mechanisms of CD4+T
lymphocyte cell death in human immunodeficiency virus infection and AIDS.” J.
Gen. Viral. 84, 1649–1661.
Apply V, and D. Sauce. 2008 “Immune activation and inflammation in HIV-1
infection: causes and consequences.” J. Pathos. 214, 231–241.
Apply, V., J. R. Almeida, D. Sauce, B. Outran, and L. Paragon. 2007. “Accelerated
immune senescence and HIV-1 infection”. Ext Gerent. 432–437.
Arosio, P., R. Ingrassia, and P. Cavadini. 2009. “Ferritins: A family of molecules
for iron storage, antioxidation and more.” Bioc. Biophy. Acta., 1790, 589-99.
Arpad S. M. 2005. “Growth Failure in HIV-Infected Children Consultation on
Nutrition and HIV/AIDS in Africa”: Evidence, Lessons and Recommendations for
Action Durban, South Africa, World Health Organization, Geneva, Switzerland.
Arthur, J. R., R. C. McKenzie, J. Geoffrey and G. J. Beckett. 2003 “Selenium in
the Immune System.” J. Nutr. 133, 1457S–1459S.
Ashworth, A., S. Khanum, A. Jackson, and C. Schofield. 2003. “Guidelines for the
inpatient treatment of severely malnourished children.”
Antonelli, L. R, Y. Mahnke, J. N Hodge, B. O Porter, D. L. Barber, R
DerSimonian, J. H. Greenwald , G. Roby , J. Mican , A Sher , M. Roederer and I.
References
Caroline Cleopatra Chisenga Ph.D. Thesis
202
Sereti. 2010. “Elevated frequencies of highly activated CD4+ T cells in HIV+
patients developing immune reconstitution inflammatory syndrome.” Bld. 11; 116
(19), 3818-27.
Bandera, A., Ferrario G, Saresella M, I. Marventano, A. Soria, F. Zanini, F.
Sabbatini, M. Airoldi, G. Marchetti, F. Franzetti, D. Trabattoni, M. Clerici and A.
Gori. 2010. “CD4+ T cell depletion, immune activation and increased production of
regulatory T cells in the thymus of HIV-infected individuals.” PloS ONE., 5(5),
e10788.
Baum, M. K., G. Shor-Posner and Y. Lu B. Rosner, H. E. Sauberlich, M. A.
Fletcher, J. Szapocznik, C. Eisdorfer, J. E. Buring and C. H. Hennekens. 1995.
“Micronutrients and HIV-1 disease progression.” AIDS., 9 (9), 1051–1056.
Baum, M. K., S. Lai, S. Sales, J. B. Page and A. Campa. 2010. “Randomized
Controlled Clinical Trial of Zinc Supplementation to Prevent Immunological
Failure in HIV-Positive Adults.” Clin. Infect. Dis., 50, 1653–1660.
Baum, M. K., M. J. Miguez-Burbano, A. Campa, and G. Shor-Posner. 2000.
“Selenium and Interleukins in Persons Infected with Human Immunodeficiency
Virus Type 1.” JID., 182.
Baum, M. K., G. Shor-Posner, S. Lai, G. Zhang, H. Lai, M. A. Fletcher, H.,
Sauberlich and J. B. Page. 1997. “High risk of HIV-related mortality is associated
with selenium deficiency.” J. Acquir. Immun. Defic. Syndr., 15, 370-374.
Beck, M. A., O. A., Levander and J. Handy. 2003. “Selenium deficiency and viral
infection.” J. Nutr., 133, 1463S–67S.
Beck, M. A., R. S. Esworthy, Y. S. Ho and F. F. Chu. 1998. “Glutathione
peroxidase protects mice from viral-induced myocarditis.” FASEB. J., 12, 1143.
Beisel, W. R. 1996. “Nutrition and immune function: overview.” J. Nutrit.,
126(10), 2611S–2615S.
Bendich, A. 1990. “Antioxidant micronutrients and immune responses.” Annals of
the New York Academy of Sci., 587, 168–180.
Benova, L., K. Fielding, J. Greig B-T. Nyang'wa, E. C. Casas, M. S. da Fonseca
and P. du Cros. 2012 “Association of BMI Category Change with TB Treatment
Mortality in HIV-Positive Smear-Negative and Extra pulmonary TB Patients in
Myanmar and Zimbabwe.” PLoS ONE 7(4), e35948.

References
Caroline Cleopatra Chisenga Ph.D. Thesis
203
Berlin, C., E. L. Berg, M. J. Briskin, D. P. Andrew, P. J. Kilshaw, B. Holzmann, I.
L. Weissman, A. Hamann and E. C. Butcher. 1993. “α4β7 integrin mediates
lymphocyte binding to the mucosal vascular addressin MAdCAM-1.” Cell., 74,
185–195.
Berneis, K., M. Battegay, S. Bassetti, R. Nuesch, A. Leisibach, S. Bilz and U.
Keller. 2000. “Nutritional supplements combined with dietary counselling diminish
whole body protein catabolism in HIV-infected patients.” Eur. J. Clin. Invest., 30,
87–94.
Bijlsma, M. 2000. “Nutritional Care and Support for People with HIV: review of
the Literature, Initiatives and Educational Materials in Sub-Saharan Africa and
Recommendations for Developing National Programmes, Report to FAO.”
Bisset, L. R., Lung, T. L., M. Kaelin, E. Ludwig, and R. W. Dubs. 2004.
“Reference values for peripheral blood lymphocyte phenotypes applicable to the
healthy population in Switzerland.” Eur. J. Haematol., 72, 203–212.
Bofill, M., J. Martinez-Picado, R. Ruiz-Hernandez, C. Cabrera, S. Marfil, I. Erkizia
R. Bellido, J. Romeu, B. Clotet and L. Ruiz . 2006. “Naive CD4 (+) T cells and
recent thymic emigrant levels in treated individuals with HIV: clinical relevance.”
AIDS. Res. Hum. Retro., 22, 893–896.
Bowrey, D. J., G. Morris-stiff, and A. M. Puntis. 1998. “Selenium Deficiency and
Chronic Pancreatitis: Disease Mechanism and Potential for Therapy." HPB Surg.,
11, 207-216.
Braitstein, P., M. W. Brinkhof, F. Dabis M. Schechter, A. Boulle, P. Miotti, R.
Wood, C. Laurent, E. Sprinz, C. Seyler, D. R. Bangsberg, E. Balestre, J. A. Sterne,
M. May and M. Egger. 2006. “Mortality of HIV-1-infected patients in the first year
of antiretroviral therapy: comparison between low-income and high-income
countries.” Lan., 367, 817–824.
Brenchley, J. M., N. J. Karandikar, M. R. Betts D. R. Ambrozak, B. J. Hill, L. E.
Crotty, J. P. Casazza, J. Kuruppu, S. A. Migueles, M. Connors, M. Roederer, D. C.
Douek, and R. A. Koup. 2003. “Expression of CD57 defines replicative senescence
and antigen-induced apoptotic death of CD8 T cells.” Bld., 101(7), 2711-2720.
Brenchley, J. M., D. A. Price and D. C. Douek. 2006. “HIV disease: fallout from a
mucosal catastrophe?” Nat. Immunol., 7, 235–239.
Brenchley, J. M., D. A. Price, T. W. Schacker, T. E. Asher, G. Silvestri, S. Rao, Z.

References
Caroline Cleopatra Chisenga Ph.D. Thesis
204
Kazzaz, E. Bornstein, O. Lambotte, D. Altmann, B. R. Blazar, B. Rodriguez, L.
Teixeira-Johnson, A. Landay, J. N. Martin, F. M. Hecht, L. J. Picker, M. M.
Lederman, S. G. Deeks and D. C. Douek. 2006. “Microbial translocation is a cause
of systemic immune activation in chronic HIV infection.” Nat. Med., 12, 1365 –
1371.
Brenchley, J. M., M. Paiardini, K. S. Knox, A. I. Asher, B. Cervasi, T. E. Asher, P.
Scheinberg, D. A. Price, C. A. Hage, L. M. Kholi, A. Khoruts, I. Frank, J. Else, T.
Schacker, G. Silvestri, and D. C. Douek. 2008. “Differential Th17 CD4 T-cell
depletion in pathogenic and nonpathogenic lentiviral infections.” Bld., 112, 2826-
2835.
Broome, C. S., F. McArdle, J. A. M. Kyle, F. Andrews, N. M. Lowe, C. A. Hart, J.
R. Arthur and M. J. Jackson. 2004. “An increase in selenium intake improves
immune function and poliovirus handling in adults with marginal selenium status.”
Am. J. Clin. Nutr., 80, 154–62.
Brown, K. M., K. Pickard, F. Nicol, G. Duthie, G. Beckett and J. R. 2000. “Arthur
Effects of organic and inorganic selenium supplementation on selenoenzyme
activity in blood lymphocytes, granulocytes, platelets and erythrocytes.” Clin. Sci.,
98, 593-9.
Brown, K. M and J. R. Arthur. 2001. “Selenium, selenoproteins and human health:
a review.” Pub. Heal. Nutrit., 4, 593-599.
Bukrinsky, M. I., Stanwick, T. L., Dempsey, M. P. & Stevenson, M. (1991)
Science 254, 423–427
Burbano, X., M. J. Miguez, R. Lecusay, A. Rodriguez, P. Ruiz, G. Morales, G.
Castillo, M. Baum and Shor-Posner G. 2002. “Thrombocytopenia in HIV- infected
drug users in the HAART era.” Platelets., 12, 456–61.
Butcher, E. C., M. Williams, K. Youngman, L. Rott and M. Briskin. 1999.
“Lymphocyte trafficking and regional immunity.” Adv. Immunol., 72, 209–253.
Cantrell, R. A., M. Sinkala, K. Megazinni, S. Lawson-Marriott, S. Washington, B.
H. Chi, B. Tambatamba-Chapula, J. Levy, E. M. Stringer, L. Mulenga, and J. S.
Stringer. 2008. “A pilot study of food supplementation to improve adherence to
antiretroviral therapy among food-insecure adults in Lusaka, Zambia.” J. Acquir.
Immune. Defic. Syndr., 49, 190–5.
Carmichael, A., X. Jin, P. Sissons and L. Borysiewicz. 1993. “Quantitative analysis
References
Caroline Cleopatra Chisenga Ph.D. Thesis
205
of the human immunodeficiency virus type 1 (HIV-1)-specific cytotoxic T
lymphocyte (CTL) response at different stages of HIV-1 infection: differential
CTL responses to HIV-1 and Epstein Barr virus in late disease.” J. Exp. Med., 177,
249-256.
Chambers, C. A. and J. P. Allison. 1999. “Costimulatory regulation of T cell
function.” Curr. Opin. Cell. Biol., 11, 203–10.
Chandra, R. K. 1999. “Symposium on ‘nutrition, infection and immunity’: nutrition
and immunology: from the clinic to cellular biology and back again.” PNS., 58(3),
681–683.
Chattopadhyay, P.K. and M. Roederer. 2010. “Good cell, bad cell: flow cytometry
reveals T-cell subsets important in HIV disease.” Cyto., 77, 614–622.
Chi, B., R. A. Cantrell, I. Zulu, B. L. Mulenga, J. W. Levy, B. C. Tambatamba, S.
Reid, A. Mwango, A. Mwinga, M. Bulterys, M. S. Saag and S. A. J. Stringer. 2009.
“Adherence to first-line antiretroviral therapy affects non-virologic outcomes
among patients on treatment for more than 12 months in Lusaka, Zambia.” Interl. J.
Epidemiol., 38, 746–56.
Choi, B. S., Y. K. Park and J. S. Lee. 2002. “The CD28/HLA-DR expressions on
CD4+T but not CD8+T cells are significant predictors for progression to AIDS.”
Clin. Exp. Immunol., 127, 137–44.
Chomont N, et al. 2009. “HIV reservoir size and persistence are driven by T cell
survival and homeostatic proliferation.” Nat Med., 15:893–900.
Chong, L. K., R. J. Aicheler, S. Llewellyn-Lacey, P. Tomasec, P. Brennan and E.
C. Wang. 2008. “Proliferation and interleukin 5 production by CD8hi CD57 T
cells.” Eur. J. Immunol., 38(4), 995-1000.
Choremi-Papadopoulou, H., N. Panagiotou, E. Samouilidou, F. Kontopidou, V.
Viglis, A. Antoniadou, J. Kosmidis and T. Kordossis. 2000. “CD28 costimulation
and CD28 expression in T lymphocyte subsets in HIV- 1 infection with and
without progression to AIDS.” Clin. Exp. Immunol., 119, 499–506.
Ciofani, M., G. C. Knowles, D. L. Wiest, H. von Boehmer and J. C. Zúñiga-
Pflücker. 2006. “Stage-Specific and Differential Notch Dependency at the αβ and
γδ T Lineage Bifurcation.” Immun., 25, 105–116.
Crampin, A. C., F. D. Mwaungulu, L. R. Ambrose, H. Longwe, and N. French.
2011. “Normal Range of CD4 Cell Counts and Temporal Changes in Two HIV-

References
Caroline Cleopatra Chisenga Ph.D. Thesis
206
Negative Malawian Populations.” AIDS., 5, 74-79.
Duggal, S., T. D. Chugh, and A. K. Duggal. 2012. “HIV andMalnutrition: Effects
on Immune System.” Clin. Devel.Immunol., ID 784740, 8
Day, R. M and Y. J. Suzuki. 2006. "Cell proliferation, reactive oxygen and cellular glutathione.” Dose Resp., 3, 425–442.
Dehne, K-L., D. Dhlakama, C. Richter, M. Mawadza, D. McLean and R. Huss.
1992. “Herpes Zoster as an Indicator of HIV Infection in Africa.” Trop. Doc., 22,
68-70.
DeNucci, C. C. , A. J. Pagán, J. S. Mitchell and Y. Shimizu. 2010. “Control of
α4β7 Integrin Expression and CD4 T Cell Homing by the β1 Integrin Subunit.” J.
Immunol., 184(5), 2458-2467.
Demeure, C. E., D. G. Byun, L. P. Yang, N. Vezzio and G. Delespesse. 1996.
“CD31 (PECAM-1) is a differentiation antigen lost during human CD4 T-cell
maturation into Th1 or Th2 effector cells.” Immunol., 88, 110–115.
Dickson, R. C and R. H. Tomlinson. 1967. “Selenium in blood and human tissues.”
Clin. Chim. Acta., 16, 311.
Douek, D .C., R. D. McFarland, P. H. Keiser, E. A. Gage, J. M. Massey, B. F.
Haynes, M. A. Polis, A. T. Haase, M. B. Feinberg, J. L. Sullivan, B. D. Jamieson,
J. A. Zack, L. J. Picker and R. A. Koup. 1998. “Changes in thymic function with
age and during the treatment of HIV infection.” Nat., 396, 690 – 695.
Drain, P. K., Baeten, J. M., Overbaugh, J., Wener, M. H., Bankson, D. D., Lavreys,
L., Mandaliya, K., Ndinya-Achola, J. O and R McClelland, R. S. 2006. “Low
serum albumin and the acute phase response predict low serum selenium in HIV-1
infected women.” BMC. Infect. Dis., 6, 85.
Dudley, E.C., M. Girardi, M. J. Owen and A. C. Hayday. 1995. “αβ and γσ T cells
can share a late common precursor.” Curr. Biol., 5, 659–669.
Dunham, R. M., B. Cervasi, J. M. Brenchley, H. Albrecht, A. Weintrob, B.
Sumpter, J. Engram, S. Gordon, N. R. Klatt, I. Frank, D. J. Sodora, D. C. Douek,
M. Paiardini, and G. Silvestri. 2008. “CD127 and CD25 Expression Defines CD4 T
Cell Subsets That Are Differentially Depleted during HIV Infection.” J. Immunol.,
180, 5582-5592.
Embretson, J., M. Zupancic, J. L. Ribas, A. Burke, P. Racz, K. Tenner–Racz and

References
Caroline Cleopatra Chisenga Ph.D. Thesis
207
A. T. Haase. 1993. “Massive covert infection of helper T lymphocytes and
macrophages by HIV during the incubation period of AIDS”. Nat., 362, 359–62.
Eze, J. I., A. A. Ngene, G. N. Anosa and I. O. Ezeh. 2011. “Immnolomodulatory
effect of dietary selenium supplementation on serum antibody response and
leucocytic profile of trypanosome brucei brucei infected rats.” Afr. J. Biotech., 10,
12098-12106.
Fairweather-Tait, S. J., Y. Bao, M. R. Broadley, R. Collings, D. Ford, J. E. Hesketh
and R. 2011. “Hurst, Selenium in human health and disease.” Ant. Red. Sig., 14,
1337–83.
FAO, 2003. http://www.fao.org/docrep/006/j0083e/j0083e00.htm. Accessed
september 17, 2015.
Fawzi, W. W., G. I. Msamanga, D. Spiegelman, E. J. N. Urassa, N. McGrath, D.
Mwakagile, G. Antelman, R. Mbise, G. Herrera, S. Kapiga, W. Willett, and D. J.
M. Hunter. 1998. “Randomised trial of effects of vitamin supplements on
pregnancy outcomes and T cell counts in HIV-1-infected women in Tanzania.”
Lan., (351), 1477-1482.
Fleury, s., G. P. Rizzardi, A. Chapius, G. Tambussi, C. Knabenhans, E. Simeoni, J-
Y. Meuwly, J-M. Corpataux, A. Lazzarin, F. Miedema and G. Pantaleo. 2000.
“Long-term kinetics of T cell production in HIV-infected subjects treated with
highly active antiretroviral therapy.” PNAS., 97(10), 5393-5398.
Förster, R., A. C. Davalos-Misslitz and A. Rot. 2008. “CCR7 and its ligands:
balancing immunity and tolerance.” Nat. Rev. Immunol., 8, 362-371.
Filteau, S., G. PrayGod, L. Kasonka S. Woodd, A. M. Rehman, M. Chisenga, J.
Siame, J. R. Koethe, J. Changalucha, D. Michael, J. Kidola, D. Manno, N. Larke,
D.Yilma, D. C. Heimburger, H. Friis and P. Kelly. 2015. “Effects on mortality of a
nutritional intervention for malnourished HIV-infected adults referred for
antiretroviral therapy: a randomised controlled trial.” BMC Med., 13, 17.
Fleury, S., G. P. Rizzardi, A. Chapuis, G. Tambussi, C. Knabenhans, E. Simeoni,
T-Y. Meuwly, J-M. Corpataux, A. Lazzaarin, F. Miedema and G. pantaleo. 2000.
“Long-term kinetics of T cell production in HIV-infected subjects treated with
highly active antiretroviral therapy”. PNAS., 97(10), 5393–5398.
Florian, S., S. Krehl, M. Loewinger, A. Kipp, A. Banning, S. Esworthy, F.-F. Chu,
and R. Brigelius-Flohé. 2010. “Loss of GPx2 increases apoptosis, mitosis, and

References
Caroline Cleopatra Chisenga Ph.D. Thesis
208
GPx1 expression in the intestine of mice.” Free Radic. Biol. Med., 49, 1694–702.
Focosi, D., M. Bestagno, O. Burrone and Petrini M. 2010. “CD57+ T lymphocytes
and functional immune deficiency.” J. Leukoc. Biol., 87, 107-116.
Fogle, J. E., W. A. Tompkins and M. B. Tompkins.. 2010. “CD4
+CD25
+ T
regulatory cells from FIV+
cats induce a unique anergic profile in CD8+
lymphocyte
targets.” Retro., 7, 97.
Foresta, C., L. Flohé, A. Garolla, A. Roveri, F. Ursini and M. Maiorino. 2002.
“Male fertility is linked to the selenoprotein phospholipid hydroperoxide
glutathione peroxidase.” Biol. Reprod., 67, 967–71.
Fox, C. H., K. Tenner-Racz, P. Racz, A. Firpo, P. A. Pizzo and A. S. Fauci. 1991.
“Lymphoid germinal centers are reservoirs of human immunodeficiency virus type
1 RNA.” J. Infect. Dis., 164, 1051–57.
Frauwirth, K. A. and C. B. Thompson. 2002. “Activation and inhibition of
lymphocytes by costimulation.” J. Clin. Invest., 109, 295–9.
French M and Colebunders R. 2008 “Immune restoration disease.” Curr Opin HIV
AIDS., 3(4):417-418.
Friis, H and K. F. Michaelsen. 1998. “Micronutrients and HIV infection: a review.”
Eur. J. Clin. Nutr., 52(3), 157–163.
Fulwyler, M. J. 1965. "Electronic separation of biological cells by volume.” Sci.,
150(698), 910–911.
Gandi, R. T., J. Spritzler, E. Chan, D. M. Asmuth, B. Rodriguez, T. C. Merigan, M.
S. Hirsch, R. W. Shafer, G. K. Robbins and R. B. Pollard. 2006. “Effect of
baseline- and treatment-related factors on immunologic recovery after initiation of
antiretroviral therapy in HIV-1-positive subjects: results from ACTG 384.” J.
Acquir. Immune Defic. Syndr., 42, 426–434.
Ganesan, A., P. K. Chattopadhyay, T. M. Brodie, Qin, J., W. Gu, J. R. Mascola, N.
L. Michael, D. A. Follmann and M. Roederer. 2010. “Immunologic and Virologic
Events in Early HIV Infection Predict Subsequent Rate of Progression.” J. Infect.
Dis., 201, 272–84.
Ganusov, V. V and R. J. De Boer. 2007. “Do most lymphocytes in humans really
reside in the gut?” Trends Immunol., 28, (12)

References
Caroline Cleopatra Chisenga Ph.D. Thesis
209
Gerdes, J., H. Lemke, H. Baisch, H. H. Wacker, U. Schwab, and H. Stein. 1984.
“Cell cycle analysis of a cell proliferation-associated human nuclear antigen
defined by the monoclonal antibody Ki-67.” J. Immunol., 133, 1710.
Guo, F., C. Iclozan, W. K. Suh, C. Anasetti and X. Z. Yu. 2008. “CD28 controls
differentiation of regulatory T cells from naive CD4 T cells.” J. Immunol., 181,
2285–2291.
Gougeon, M. L and L. Montagnier. 1993. “Apoptosis in AIDS.” Sci., 260, 1269 –
1270.
Grobler, L., N. Siegfried, M. E Visser, S. S. Mahlungulu and J. Volmink. 2013.
“Nutritional interventions for reducing morbidity and mortality in people with
HIV.” Coch. Datab. Syst. Rev., 2, 004536.
Groux, H., G. Torpier, D. Monte, Y. Mouton, A. Capron and J. C. Ameisen. 1992.
“Activation-induced death by apoptosis in CD4+ T cells from human
immunodeficiency virus-infected asymptomatic individuals.” J. Exp. Med., 175,
331–340.
Guarino, A., F. Albano, L. Tarallo, A. Castaldo, A. Rubino, G. Borgia, and N.
Principi. 1993. “Intestinal malabsorption of HIV-infected children: relationship to
diarrhoea, failure to thrive, enteric microorganisms and immune impairment.”
AIDS., 7(11), 1435–1440.
Gupta, A., G. Nadkarni, W-T. Yang A. Chandrasekhar, N. Gupte, G. P. Bisson, M.
Hosseinipour and N. Gummadi. 2011. “Early Mortality In Adults Initiating
Antiretroviral Therapy (ART) In Low- And Middle-Income Countries (LMIC): A
Systematic Review And Meta-Analysis.” PLoS ONE. 6(12), e28691.
Haase, A. T., K. Henry, M. Zupancic, G. Sedgewick, R. A. Faust, H. Melroe, W.
Cavert, K. Gebhard, K. Staskus, Z. Q. Zhang, P. J Daily, H. H Balfour, A. Erice, A.
S Perelson. 1996. “Quantitative image analysis of HIV-1 infection in lymphoid
tissue.” Sci., 274, 985–9.
Hakim, F. T., S. A. Memon, R. Cepeda, E. C. Jones, C. K. Chow, C. Kasten-
Sportes, J. Odom, B. A. Vance, B. L. Christensen, C. L. Mackall and R. E. Gress.
2005. “Age-dependent incidence, time course, and consequences of thymic
renewal in adults.” J. Clin. Invest., 115, 930–93910.
References
Caroline Cleopatra Chisenga Ph.D. Thesis
210
Hanrahan, C. F., J. E. Golub, L. Mohapi, Tshabangu, N., T. Modisenyane, R. E.
Chaisson, G. E. Gray, J. A. and McIntyre, N. A Martinson. 2010 “Body mass index
and risk of tuberculosis and death.” AIDS., 24, 1501–8.
Hed, A. E., A. Khaitan, L. Kozhaya, N. Manel, D. Daskalakis, W. Borkowsky, F.
Valentine, D. R. Littman and D. Unutmaz. 2010 “Human Th17 cells are
susceptible to HIV and are perturbed during infection.” J. Infect. Dis., 201, 843–
854.
Heimburger, D. C, J. R. Koethe, C. Nyirenda, C. Bosire, J. M. Chiasera, M.
Blevins, A. J. Munoz, B. E. Shepherd, D. Potter and I. Zulu. 2010. “Serum
phosphate predicts early mortality in adults starting antiretroviral therapy in
Lusaka, Zambia: a prospective cohort study.” PLoS ONE., 5(5), e10687.
Hellerstein, M. K., R. A. Hoh, M. B. Hanley, D. Cesar, D. Lee, R. A. Neese and J.
M. McCune. 2003. “Subpopulations of long-lived and short-lived T cells in
advanced HIV-1 infection.” J. Clin. Invest., 112, 956–966.
Herzenberg, L. A, Julius M. H. and T. Masuda. 1972. "Demonstration that antigen-
binding cells are precursors of antibody-producing cells after purification with a
fluorescence-activated cell sorter." PNAS. 69 (7), 1934–8.
Ho, D. D., A. U. Neumann, A. S. Perelson, W. Chen, J. M. Leonard and M.
Markowitz. 1995. “Rapid turnover of plasma virions and CD4 lymphocytes in
HIV-1 infection.” Nat., 373, 123-126.
Hoffmann, F. W., A. C. Hashimoto, L. A. Shafer, S. Dow, M. J. Berry and P. R.
Hoffmann. 2010. “Dietary Selenium Modulates Activation and Differentiation of
CD4+ T Cells in Mice through a Mechanism Involving Cellular Free Thiols.” J.
Nutr., 140, 1155–1161.
Huang, Z., A. H. Rose and P. R. Hoffmann. 2012. “The Role of Selenium in
Inflammation and Immunity: From Molecular Mechanisms to Therapeutic
Opportunities.” Mary Ann. Liebert Inc., 16(7), 10-1089.
Hughes, S. M., B. Amadi, M. Mwiya, H. Nkamba, G. Mulundu, A. Tomkins and
D. Goldblatt. 2009. “CD4 Counts Decline Despite Nutritional Recovery in HIV-
Infected Zambian Children With Severe Malnutrition.” Pediatrics, 123, 361- 365.
Hunt, P. W., H. L. Cao, C. Muzoora, I. Ssewanyana, J. Bennett, N. Emenyonu, A.
Kembabazi, T. B. Neilands, D. R. Bangsberg, S. G. Deeks, and J. N. Martin. 2011.
“Impact of CD8 + T-cell activation on CD4 + T-cell recovery and mortality in
HIV- infected Ugandans initiating antiretroviral therapy.” AIDS., 25(17), 2123–

References
Caroline Cleopatra Chisenga Ph.D. Thesis
211
2131.
Hurwitz, B. E., J. R. Klaus and M. M. Llabre. 2007. “Suppression of Human
Immunodeficiency Virus Type 1 Viral Load with Selenium Supplementation.”
Arch. Intern. Med., 167, 148-154.
Imai, H., K. Suzuki, K. Ishizaka S. Ichinose, H. Oshima, I. Okayasu, K. Emoto, M.
Umeda and Y. Nakagawa. 2001. “Failure of the expression of phospholipid
hydroperoxide glutathione peroxidase in the spermatozoa of human infertile
males.” Biol. Reprod., 64, 674–83.
Irlam, J. H., M. M. Visser, Rollins N. N and N Siegfried. 2010. “Micronutrient
supplementation in children and adults with HIV infection.” Coch. Datab. Syst.
Rev., 2, 010666.
Janeway, C. A., P. Travers, M. Walport, and M. J. Shlomchik. (Ed.). 2001. “The
Immune System in Health and Disease.” Immunobiology, 5th ed. New York:
Garland Science.
Jaruga, P., B. Jaruga, D. Gackowski, A. Olczak, W. Halota, M. Pawlowska, and R.
Olinski. 2002. “Supplementation with Antioxidant Vitamins Prevents Oxidative
Modification of DNA in Lymphocytes of HIV-Infected Patients.” Free Radical
Biol Med., 32, 414–420.
Jenkins, M., M. B. Hanley, M. B. Moreno, E. Wieder and J. M. McCune. 1998.
“Human immunodeficiency virus-1 infection interrupts thymopoiesis and
multilineage haematopoiesis in vivo.” Bld., 91, 2672 – 2678.
Jiamton, S., J. Pepin, R. Suttent, S. Filteau, B. Mahakkanukrauh, W.
Hanshaoworakul, P. Chaisilwattana, P. Suthipinittharm, P. Shetty, and S. Jaffar.
2003. “A randomized trial of the impact of multiple micronutrient supplementation
on mortality among HIV-infected individuals living in Bangkok.” AIDS., 17,
2461-9.
Johannesen, A, E. Naman, B. J. Ngowi, L. Sandvik, M. I. Matee, H. I. Aglen. 2009.
“Predictors of mortality in HIV-infected patients starting antiretroviral therapy in a
rural hospital in Tanzania.” BMC Infect. Dis., 8, 52.
Johansson-Lindbom, B., M. Svensson, M. A. Wurbel, B. Malissen, G. Marquez
and W. Agace. 2003. “Selective generation of gut tropic T cells in gut-associated
lymphoid tissue (GALT): requirement for GALT dendritic cells and adjuvant.” J.
Exp. Med., 198, 963–969.

References
Caroline Cleopatra Chisenga Ph.D. Thesis
212
Johnson, C. C., F. M. Fordyce and M. P. Rayman. 2010. “Symposium on
‘Geographical and geological influences on nutrition’: factors controlling the
distribution of selenium in the environment and their impact on health and
nutrition.” Proc. Nutr. Soc., 69, 119–32.
Jones, R. B., L. C. Ndhlovu, J. D. Barbour, P. M. Sheth, A. R. Jha, B. R. Long, J.
C. Wong, M. Satkunarajah, M. Schweneker, J. M. Chapman, G. Gyenes, B. Vali,
M. D. Hyrcza, F. Y. Yue, C. Kovacs, A. Sassi, M. Loutfy, R. Halpenny, D. Persad,
G. Spotts, F. M. Hecht, T. W. Chun, J. M. McCune, R. Kaul, J. M. Rini, D. F.
Nixon and M. A. Ostrowski. 2008. “Tim-3 expression defines a novel population
of dysfunctional T cells with highly elevated frequencies in progressive HIV-1
infection.” J. Exp. Med., 205, 2763-2779.
Judie, B., T. Alimonti, B. Blake, R. F. Keith. 2003. "Mechanisms of CD4+ T
lymphocyte cell death in human immunodeficiency virus infection and AIDS.” J.
Gen. Virol., 84(7), 1649–61.
Junge, S., B. Kloeckener-Gruissem, R. Zufferey, A. Keisker, B. Salgo, J. C.
Fauchere, F. Scherer, T. Shalaby, M. Grotzer, U. Siler, R. Seger and T. Gungor.
2007. “Correlation between recent thymic emigrants and CD31+ (PECAM-1)
CD4+ T cells in normal individuals during aging and in lymphopenic children.”
Eur. J. Immunol., 37, 3270–3280.
Kaaba, S. A., S. Al Fadhli, and A. Khamis. 2002. “Reference values of lymphocyte
subsets in the normal healthy adult Kuwaiti Arab population.” Immunol. Lett., 81,
199–203.
Kaech, S. M and R. Ahmed. 2001. “Memory CD8+ T cell differentiation: initial
antigen encounter triggers a developmental program in naive cells.” Nat.
Immunol., 2, 415-422.
Kaiser, J. D., A. M. Campa, J. P. Ondercin, G. S. Leoung, R. F. Pless, and M. K.
Baum. 2006. “Micronutrient Supplementation Increases CD4 Count in HIV-
Infected Individuals on Highly Active Antiretroviral Therapy: A Prospective,
Double-Blinded, Placebo-Controlled Trial.” J. Acquir. Immune Defic. Syndr., 42,
523-528.
Kalayjian, R. C., A. Landay, R. B. Pollard, D. D. Taub, B. H. Gross, I. R. Francis,
A. Sevin, M. Pu, J. Spritzler, M. Chernoff, A. Namkung, L. Fox, A. Martinez, K.
Waterman, S. A. Fiscus, B. Sha, D. Johnson, S. Slater, F. Rousseau and M. M.
Lederman. 2003. “Age-related immune dysfunction in health and in human
immunodeficiency virus (HIV) disease: association of age and HIV infection with

References
Caroline Cleopatra Chisenga Ph.D. Thesis
213
naive CD8+ cell depletion, reduced expression of CD28 on CD8
+ cells, and reduced
thymic volumes.” J. Infect. Dis., 187, 1924–1933.
Kalebic, T., A. Kinter, G. Poli, M. E. Anderson, A. Meister, and A. S. Fauci. 1991.
“Suppression of human immunodeficiency virus expression in chronically infected
monocytic cells by glutathione, glutathione ester, and N-acetylcysteine,”
Proceedings of the National Academy of Sciences of the United States of America.
88(3), 986–990.
Kam, K. M., W. L. Leung, M. Y. Kwok, M. Y. Hung, S. S. Lee, and W. P. Mak.
1996. “Lymphocyte subpopulation reference ranges for monitoring human
immunodeficiency virus-infected Chinese adults.” Clin. Diagn. Lab. Immunol., 3,
326–330.
Kamentsky in Proceedings of the 1968 Conference “Cytology Automation" (1970),
edited by D. M. D. Evans.
Kamwesiga, J., V. Mutabazi, J. Kayumba, J-C. K. Tayari, J. C. Uwimbabazi, G.
Batanage, G. Uwera, M. Baziruwiha, C. Ntizimira, A. Murebwayire, J. P. Haguma,
J. Nyiransabimana, J. B. Nzabandora, P. Nzamwita, E. Mukazayire. 2015. “Effect
of selenium supplementation on CD4R T-cell recovery, viral suppression and
morbidity of HIV-infected patients in Rwanda: a randomized controlled trial.”
AIDS 29:000–000.
Kamwesiga, J. V. Mutabazi, J. Kayumba, J-C. K. Tayari, J. C. Uwimbabazi, G.
Batanage, G. Uwera, M. Baziruwiha, C. Ntizimira, A. Murebwayire, J. P. Haguma,
Kang, M and S. Cu-Uvin. 2012. “Association of HIV viral load and CD4 cell count
with human papillomavirus detection and clearance in HIV-infected women
initiating highly active antiretroviral therapy.” HIV med., 13, 372-378.
Kaufmann, D. E., D. G. Kavanagh, F. Pereyra, J. J. Zaunders, E. W. Mackey, T.
Miura, S. Palmer, M. Brockman, A. Rathod, A. Piechocka-Trocha, B. Baker, B.
Zhu, S. Le Gall, M. T. Waring, R. Ahern, K. Moss, A. D. Kelleher, J. M. Coffin,
G. J. Freeman, E. S. Rosenberg, and B. D. Walker. 2007. “Upregulation of CTLA-
4 by HIV-specific CD4+ T cells correlates with disease progression and defines a
reversible immune dysfunction.” Nat. Immunol., 8, 1246-1254.
Kawakami, K., C. Scheidereit and R. G. Roeder. 1988. “Identification and
purification of a human immunoglobulin-enhancer-binding protein (NF-κB) that
activates transcription from a human immunodeficiency virus type 1 promoter in
vitro.” Proc. Natl. Acad. Sci., 85, 4700–4704.

References
Caroline Cleopatra Chisenga Ph.D. Thesis
214
Kelly, P., M. Katubulushi, J. Todd, R. Banda, V. Yambayamba, M. Fwoloshi, I.
Zulu, E. Kafwembe, F. Yavwa, I. R. Sanderson, and A. Tomkins. 2008.
“Micronutrient supplementation has limited effects on intestinal infectious disease
and mortality in a Zambian population of mixed HIV status: a cluster randomized
trial.” Am. J. Clin. Nutr., 88(4), 1010-7.
Kelly, P., I. Menzies, R. Crane, I. Zulu, C. Nickols, R. Feakins, J. Mwansa, V.
Mudenda, M. Katubulushi, S. Greenwald and M. Farthing. 2004. “Responses of
small intestinal architecture and function over time to environmental factors in a
tropical population.” Am. J. Trop. Med. Hyg., 70, 412–419.
Kelly, P., Davies SE, Mandanda B, A. Veith, G. Mcphail, I. Zulu, F. Drobniewski,
D. Fuchs, C. Summerbell, N. P. Luo, J. O. M. Pobee and M. J. G. Farthing. 1997.
“Enteropathy in Zambians with HIV related diarrhoea: regression modelling of
potential determinants of mucosal damage.” Gut., 41, 811–816.
Kelly, P., R. Musonda, E. Kafwembe, L. Kaetano, E. Keane, and M. Farthing.
1999. “Micronutrient supplementation in the AIDS diarrhoea-wasting syndrome in
Zambia: A randomized controlled trial.” AIDS., 13, 495–500.
Kestens, L., G. Vanham , C. Vereecken , M. Vandenbruaene , G. Vercauteren , R.
L. Colebunders and P. L. Gigase. 1994. “Selective increase of activation antigens
HLA-DR and CD38 on CD4+ CD45RO+ T lymphocytes during HIV-1 infection.”
Clin. Exp. Immunol., 95(3), 436-41.
Khan, M. S., S. Dilawar, I. Ali and N. Rauf. 2012. “The Possible Role of Selenium
Concentration in Hepatitis B and C Patients.” Saudi J. Gastroenterol., 18, 106-10.
Kiefer, E., D. R. Hoover, Q. Shi, J-C. Dusingize, M. Cohen, E. Mutimura and K.
Anastos. 2011. “Association of Pre-Treatment Nutritional Status with Change in
CD4 Count after Antiretroviral Therapy at 6, 12, and 24 Months in Rwandan
Women.” www.plosone.org. 6, 12.
Kiefer, E., D.R. Hoover, Q. Shi, J-C. Dusingize, M. Cohen, E. Mutimura and K.
Anastos. 2006. “Association of Pre-Treatment Nutritional Status with Change in
CD4 Count after Antiretroviral Therapy at 6, 12, and 24 Months in Rwandan
Women.” PLoS ONE. 6(12), e29625.
Kimmig, S., G. K. Przybylski, C. A. Schmidt, K. Laurisch, B. Mowes, A.
Radbruch and A. Thiel. 2002. “Two subsets of naive T helper cells with distinct T
cell receptor excision circle content in human adult peripheral blood.” J. Exp.
Med., 195, 789–794.

References
Caroline Cleopatra Chisenga Ph.D. Thesis
215
Koethe, J. R., M.
Blevins, C. K.
Nyirenda, E. K. Kabagambe, J. M. Chiasera, B. E.
Shephered, I. Zulu and D. C. Heimburger. 2013. “Serum Phosphate Predicts Early
Mortality among Underweight Adults Starting ART in Zambia: A Novel Context
for Refeeding Syndrome?” J. Nutr. and Metabol., 545439.
Koethe, J. R., M. Blevins, C. Nyirenda, E. K. Kabagambe, B. E. Shepherd, W. C.
Wester, I. Zulu, J. M. Chiasera, Mulenga, L. B., A. Mwango, and C. D.
Heimburger. 2011. “Nutrition and inflammation serum biomarkers are associated
with 12-week mortality among malnourished adults initiating antiretroviral therapy
in Zambia.” J. Internl. AIDS. Soc., 14,19.
Koethe, J. R., A. Lukusa, M. J. Giganti, B. H. Chi, C. K. Nyirenda, M. I. Limbada,
Y. Banda and J. S Stringer. 2010. “Association between weight gain and clinical
outcomes among malnourished adults initiating antiretroviral therapy in Lusaka,
Zambia.” J. Acquir. Immune Defic. Syndr., 53, 507–513.
Kohler, S., A. Thiel. 2009. “Life after the thymus: CD31+ and CD31- human naive
CD4+ T-cell subsets.” Bld., 113: 769–774.
Koopman, G., D. Mortier, S. Hofman, M. Koutsoukos, W. M. Bogers, B. Wahren,
G. Voss and J. L. Heeney. 2009. “Acute-phase CD4+ T-cell proliferation and
CD152 upregulation predict set-point virus replication in vaccinated simian–human
immunodeficiency virus strain 89.6 p-infected macaques.” J. Gen. Virol., 90, 915–
926.
Kupka, R., F. Mugusi, S. Aboud, G. I. Msamanga, J. L. Finkelstein, D.
Spiegelman, and W. W. Fawzi. 2008. “Randomized, double-blind, placebo-
controlled trial of selenium supplements among HIV-infected pregnant women in
Tanzania: effects on maternal and child outcomes.” Am. J. Clin. Nutr., 87(6),
1802–1808.
Lawn, S. D., A. D. Harries, X. Anglaret, L. Myer and R. Wood. 2008. “Early
mortality among adults accessing antiretroviral treatment programmes in sub-
Saharan Africa.” AIDS., 22(15), 1897-908.
Lee, F. A., M. van Lier, I. A. M. Relou, L. Foley, J-W N. Akkerman, H. F. G.
Heijnen and R. W. Farndale.. 2006. “Lipid Rafts Facilitate the Interaction of
PECAM-1 with the Glycoprotein VI-FcR γ-Chain Complex in Human Platelets.” J.
Biol. Chemi., 281, 39330-39338.
Lee, B. W., H. K. Yap, F. T. Chew, T. C. Quah, K. Prabhakaran, G. S. Chan, S. C.
Wong, and C. C. Seah. 1996. “Age and sex related changes in lymphocyte
subpopulations of healthy Asian subjects: from birth to adulthood.” Cytometry. 26,

References
Caroline Cleopatra Chisenga Ph.D. Thesis
216
8–15.
Lei, C., X. Niu, J. Wei, J. Zhu and Y. Zhu. 2009. “Interaction of glutathione
peroxidase-1 and selenium in endemic dilated cardiomyopathy.” Clin. Chim. Acta.,
399, 102–08.
Levin, A., G. Brubaker, J. S. Shao, D. Kumby, T. R. O'Brien, J. J. Goedert, K. W.
Strauss, W. A. Blattner, and I. Hannet. 1996. “Determination of T- lymphocyte
subsets on site in rural Tanzania: results in HIV-1 infected and non-infected
individuals.” Int. J. STD AIDS., 7(4), 288-91.
Li, Y., W. Ling, H. Xu, M. Wang, and C. Wu. 2012. “The activation and dynamics
of cytokine expression by CD4þ T cells and AIDS progression in HIV-1-infected
Chinese individuals.” Microb. Pathog., 53, 189-197.
Linton, P. J and K. Dorshkind. 2004. “Age-related changes in lymphocyte
development and function.” Nat. Immunol., 5, 133–139.
Liu, E., D. Spiegelman, H. Semu, C. Hawkins, G. Chalamilla, A. Aveika, S.
Nyamsangia, S. Mehta, D. Mtasiwa and W. Fawzi. 2011. “Nutritional Status and
Mortality Among HIV- Infected Patients Receiving Antiretroviral Therapy in
Tanzania.” J. Infect. Dis., 204, 282–90.
Lo, K., R. R. Brinkman and R. Gottardo. 2008. "Automated gating of flow
cytometry data via robust model-based clustering.” Cytometry Part A. 73A(4),
321–332.
Look, M. P., J. K. Rockstroh, G. S. Rao, K-A. Kreuzer, S. Barton, H. Lemoch, T.
Sudhop, J. Hoch, K. Stockinger, U. Spengler and T. Sauerbruch. 1997. “Serum
selenium, plasma glutathione (GSH) and erythrocyte glutathione peroxidase (GSH-
Px)-levels in asymptomatic versus symptomatic human immunodeficiency virus-1
(HIV-1)-infection.” Eur. J. Clin. Nutr., 51, 266-272.
Look, M. P., J. K. Rockstroh, G. S. Rao, K. A. Kreuzer, U. Spengler, T.
Sauerbruch. 1997. “Serum selenium versus lymphocyte subsets and markers of
disease progression and inflammatory response in human immunodeficiency virus-
infection.” Biol Trace Elem Res., 56: 31-41.
Lyles, R. H., A. Munoz, T. E. Yamashita, H. Bazmi, R. Detels, C. R. Rinaldo.
2000. “Natural history of human immunodeficiency virus type 1 viremia after
seroconversion and proximal to AIDS in a large cohort of homosexual men.
Multicentre AIDS Cohort Study. J Infect Dis., 181:872-880.

References
Caroline Cleopatra Chisenga Ph.D. Thesis
217
Mackall, C. L., T. A. Fleisher, M. R. Brown, M. P. Andrich, C. C. Chen, I. M.
Feuerstein, M. E. Horowitz, I. T. Magrath, A. T. Shad, S. M. Steinberg, L. H.
Wexler, and R. E. Gress. 1995. “Age, Thymopoiesis, and CD4+ T-Lymphocyte
Regeneration after Intensive Chemotherapy.” N. Engl. J. Med., 332,143-149.
Macallan, D. C., C. Noble, C. Baldwin, S. A. Jebb, A. M. Prentice, W. A. Coward,
M. B. Sawyer, T. J. McManus and G. E. Griffin. 1995. “Energy expenditure and
wasting in human immunodeficiency virus infection.” N. Engl. J. Med., 333, 83–
88.
Maehira, F., Miyagi, Eguchi and N. Yamane. 2003. “Selenium regulates
transcription factor NF-KB activation during the acte phase reaction.” Clinica
Chimica Acta. 334, 163-171.
Mair, C., S. E. Hawes, H. D. Agne, P. S. Sow, I. N’doye, L. E. Manhart, P. L. Fu,
G. S. Gottlieb, and N. B. 2007. “Kiviat, Factors associated with CD4 lymphocyte
counts in HIV-negative Senegalese individuals.” Clin. Exp. Immunol., 151, 432–
440.
Mak, T. W. and M. E. Saunders. 2006. “The immune response: Basic and Clinical
Principles.” Elsevier Academic Press. 30 Corporate Drive, Suite 400, Burlington,
MA 0180, USA.
Marandin, A., A. Katz, E. Oksenhendler, M. Tulliez, F. Picard, W. Vainchenker,
and F. Louache. 1996. “Loss of primitive haematopoietic progenitors in patients
with human immunodeficiency virus infection.” Bld., 88, 4568–4578.
Marazzi, M. C., G. Liotta, P. Germano, G. Guidotti, A. D. Altan, S. Ceffa, M. M.
Lio, K. Nielsen-Saines, L. Palombi. 2008. “Excessive early mortality in the first
year of treatment in HIV type 1-infected patients initiating antiretroviral therapy in
resource-limited settings.” AIDS Res. Hum. Retr., 24, 555–60.
Masel, J., R. A. Arnaout, T. R. O’Brien, J. J. Goedert, A. L. Lloyd. 2000.
Fluctuations in HIV-1 viral load are correlated to CD4+ T-lympghocyte count
during the natural course of infection. J Acquired Immune Defic Syndr., 23:375-
379.
McClelland, R. S., J. M. Baeten, J. Overbaugh, A. Veitch, G. McPhail, I. Zulu, F.
Drobniewski, D. Fuchs, C. Summerbell, N. P. Luo, J. O. Pobee and M. J. Farthing.
2004. “Micronutrient Supplementation Increases Genital Tract Shedding of HIV-1
in Women. Results of a Randomised Trial.” J. Acquir. Immune Defic. Syndr., 37,
1657-1663.

References
Caroline Cleopatra Chisenga Ph.D. Thesis
218
Me ndez-Lagares, G., L. D az, R. Correa-Rocha, J. A. Leo n Leal, S. Ferrando-
Mart nez, E. Ruiz-Mateos, M. M. Pozo-Balado, M. D. Gurbindo, M. I. de Jose,
M. A. Mun oz-Ferna ndez, M. Leal and Y. M. Pacheco. 2013. “Specific patterns of
CD4-associated immunosenescence in vertically HIV-infected subjects.” Clin.
Microbiol. Infect., 19, 558–565.
Mellors, J. W., C. R. Rinaldo, P. Gupta, R. M. White, J. A. Todd and L. A
Kingsley. 1996. “Prognosis in HIV-1 infection predicted by the quantity of virus in
plasma.” Sci., 272, 1167–70.
Menard, D., M. J. Mandeng, M. B. Tothy, E. K. Kelembho, G. Gresenguet and A.
Talarmin. 2003. “Immunohematological reference ranges for adults from the
Central African Republic.” Clin. Diagn. Lab. Immunol. 10(3), 443-5.
Messele, T., M. Abdulkadir, A. L. Fontanet, B. Petros, D. Hamann, M. Koot, M. T.
L. Roos, P. T. A. Schellekens, F. Miedema and T. F. Rinke De Wit. 1999.
“Reduced naive and increased activated CD4 and CD8 cells in healthy adult
Ethiopians compared with their Dutch counterparts”. Clin. Exp. Immunol., 115,
443–450.
Meyaard, L., S. A. Otto, R. R. Jonker, M. J. Mijnster, R. P. Keet and F. Miedema.
1992. “Programmed death of T cells in HIV-1 infection.” Sci., 257, 217–219.
Mocroft, A., A. N. Phillips, J. Gatell, B. Ledergerber, M. Fisher, N. Clumeck, M.
Losso, A. Lazzarin, G. Fatkenheuer and J. D. Lundgren. 2007. “Normalisation of
CD4 counts in patients with HIV-1 infection and maximum virological suppression
who are taking combination antiretroviral therapy: an observational cohort study.”
Lan., 370, 407–13.
Mogensen, T. H., J. Melchjorsen, S. Carsten, C. S. Larsen, and R. S. Paludan.
2010. “Innate immune recognition and activation during HIV infection.”
Retrovirol., 7, 54.
Moh, R., C. Danel, E. Messou, T. Ouassa, D. Gabillard, A. Anzian, Y. Abo, R.
Salamon, E. Bissagnene, C. Seyler, S. Eholié, and X. Anglaret. 2007. “Incidence
and determinants of mortality and morbidity following early antiretroviral therapy
initiation in HIV-infected adults in West Africa”. AIDS., 21, 2483–91.
Mojumdar, K., M. Vajpayee, N. K. Chauhan, A. Singh, R. Singh, and S. Kurapati.
2011. “Loss of CD127 & increased immunosenescence of T cell subsets in HIV
infected individuals.” Indian J. Med. Res., 134, 972-981.

References
Caroline Cleopatra Chisenga Ph.D. Thesis
219
Moses, A., J. Nelson and G. C. Jr. Bagby. 1998. “The influence of human
immunodeficiency virus-1 on haematopoiesis.” Bld., 91, 1479–1495.
Murdoch, D. M., W. D. Venter, C. Feldman, A. Van Rie. 2008 “Incidence and risk
factors for the immune reconstitution inflammatory syndrome in HIV patients in
South Africa: a prospective study.” AIDS., 22(5): 601-610.
Murphy, K. M., P. Travers and M. Walport. 2012. “Janeway’s immunobiology.”
Garland Science New York, NY, USA.
Ndeezi, G., T. Tylleskär, C. M. Ndugwa, and J. K. Tumwine. 2010. “Effect of
multiple micronutrient supplementation on survival of HIV-infected children in
Uganda: a randomized, controlled trial.” J. Inter. AIDS Soc., 13, 18.
Ndekha, M. J., J. J. van Oosterhout, E. E. Zijlstra, M. Manary, H. Saloojee, and M.
J. Manary. 2009. “Supplementary feeding with either ready-to-use fortified spread
or corn-soy blend in wasted adults starting antiretroviral therapy in Malawi:
randomised, investigator blinded, controlled trial.” BMJ., 338, b1867.
Nickel, P., S. Kreutzer, G. Bold, A. Friebe, K. Schmolke, C. Meisel, J. S.
Jurgensen, A. Thiel, K. D. Wernecke, P. Reinke and H. D. Volk. 2005. “CD31+
naive Th cells are stable during six months following kidney transplantation:
implications for post-transplant thymic function.” Am. J. Transplant. 5, 1764–
1771.
Notermans, D. W., N. G. Pakker, D. Hamann, N. A. Foudraine, R. H. Kauffmann,
P. L. Meenhorst, J. Goudsmit, M. T. Roos, P. T. Schellekens, F. Miedema, and S.
A. Danner. 1999. “Immune reconstitution after 2 years of successful potent
antiretroviral therapy in previously untreated human immunodeficiency virus type
1-infected adults.” J. Infect. Dis., 180, 1050–1056.
Nyiransabimana, J, J. B. Nzabandora, P.Nzamwita and E. Mukazayire. 2015.
“Effect of selenium supplementation on CD4R T-cell recovery, viral suppression
and morbidity of HIV-infected patients in Rwanda: a randomized controlled trial.”
AIDS., 29, 000–000.
Ortblad, K. F., R. Lozano and C. J. L. Murray. 2013. “The burden of HIV: insights
from the Global Burden of Disease Study 2010.” AIDS., 27, 2003–2017.
Ostrowski, S. R., J. Gerstoft, B. K. Pedersen and H. Ullum. 2003. “A Low Level of
CD4+CD28+ T Cells Is an Independent Predictor of High Mortality in Human
Immunodeficiency Virus Type 1–Infected Patients.” J. Infect. Dis., 187, 1726–34.
Pantaleo, G., Graziosi, C., A. S. Fauci. 1993. “The immunopathogenesis of human

References
Caroline Cleopatra Chisenga Ph.D. Thesis
220
immunodeficiency virus infection.” N. Engl. J. Med., 328, 327–35.
Pantaleo, G., C. Grazioso, L. Butini, P. A. Pizzo, S. M. Schnittman, D. P. Kotler
and A. S. Fauci. 1991. “Lymphoid organs function as major reservoirs for human
immunodeficiency virus.” Proc. Natl. Acad. Sci. USA., 88, 9838–42.
Pantaleo, G., C. Graziosi, J. F. Demarest, L. Butini, M. Montroni, C. H. Fox, J. M.
Orenstein, D. P. Kotler and A. S. Fauci. 1993. “HIV infection is active and
progressive in lymphoid tissue during the clinically latent stage of disease.” Nat.,
362, 355–9.
Parmentier, H. K., D. van Wichen, D. M. D. S. Sie-Go, J. Goudsmit, J. C. C.
Borleffs and H. J. Schuurman. 1990. “HIV-1 infection and virus production in
follicular dendritic cells in lymph nodes.” Am. J. Pathol., 137, 247–51.
Paton, N. I., S. Sangeetha, A. Earnest and R. Bellamy. 2006. “The impact of
malnutrition on survival and the CD4 count response in HIV-infected patients
starting antiretroviral therapy.” HIV Med., 7, 323–330.
Perry, S. E. , S. M. Mostafa, R. Wenstone, A. Shenkin, and P. J McLaughlin. 2004.
“HLA-DR regulation and the influence of GM-CSF on transcription, surface
expression and shedding.” Int. J. Med. Sci., 1(3), 126-136.
Peters, U and Y. Takata. 2008. “Selenium and the Prevention of Prostate and
Colorectal Cancer.” Mol. Nutr. Food Res., 52, 1261-1272.
Petrie, H.T., R. Scollay and K. Shortman. 1992. “Commitment to the T cell
receptor-αβ or -γσ lineages can occur just prior to the onset of CD4 and CD8
expression among immature thymocytes.” Eur. J. Immunol., 22, 2185–2188.
Petrovas, C., B. Chaon, D. R. Ambrozak, D. A. Price, J. J. Melenhorst, B. J. Hill,
C. Geldmacher, J. P. Casazza, P. K. Chattopadhyay, M. Roederer, D. C. Douek, Y.
M. Mueller, J. M. Jacobson, V. Kulkarni, B. K. Felber, G. N. Pavlakis, P. D.
Katsikis, and R. A. Koup. 2009. “Differential association of programmed death-1
and CD57 with ex vivo survival of CD8+ T cells in HIV infection.” J. Immunol.
Methods. 183, 1120-1132.
Pierson, T., J. McAuthur and R. F. Siliciano. 2000. “Reservoirs for HIV-1:
Mechanisms for Viral Persistence in the Presence of Antiviral Immune Responses
and Antiretroviral Therapy.” Annu. Rev. Immunol., 18, 665-708.
Piwoz, E. G. and E. A. Preble. 2000. “HIV/AIDS and Nutrition: A Review of the
Literature and Recommendations for Nutritional Care and Support in Africa,
Academy for Educational Development,” Washington, DC, USA.

References
Caroline Cleopatra Chisenga Ph.D. Thesis
221
Prado-Garcia, H., S. Romero-Garcia, J. Morales-Fuentes, D. Aguilar-Cazares and
J. S. Lopez-Gonzalez. 2012. “Activation-induced cell death of memory CD8+ T
cells from pleural effusion of lung cancer patients is mediated by the type II Fas-
induced apoptotic pathway.” Cancer Immunol. Immunother., 61, 1065–1080.
Puntarulo, S. 2005. “Iron, oxidative stress and human health.” Molec. Aspects
Med., 26, 299-312.
Qian, Y., C. Wei, F. E-H. Lee, J. Campbell, J. Halliley, J. A. Lee, J. Cai, M. Kong,
E. Sadat, E. Thomson, P. Dunn, A. C. Seegmiller, N. J. Karandikar, C. Tipton, T.
Mosmann, I. Sanz and R. H. Scheuermann. 2010. "Elucidation of seventeen human
peripheral blood B-cell subsets and quantification of the tetanus response using a
density-based method for the automated identification of cell populations in
multidimensional flow cytometry data.” Cytometry Part B: Clinical Cytometry.
78B, S69.
Olsen, M. F., A. Abdissa, P. Kæstel, M. Tesfaye, D. Yilma, T. Girma, J. C. K.
Wells, C. Ritz, C. Mølgaard, K. F. Michaelsen, D. Zerfu, S. Brage, Å. B. Andersen,
H. Friis. 2014 “Effects of nutritional supplementation for HIV patients starting
antiretroviral treatment: randomised controlled trial in Ethiopia.” BMJ, 348:g3187.
Olmstead, L., G. N. Schrauzer, M. Flores-Arce, J. Dowd. 1989. “Selenium
supplementation of symptomatic human immunodeficiency virus infected
patients.” Biol Trace Elem Res., 20(1-2):59–65.
Quagliarello, V. 1982. “The Acquired Immunodeficiency Syndrome: current
status.” Yale J Biol Med., 55:443–452.
Quinn, T. C. 1996. “Global burden of the HIV pandemic.” Lan., 348, 99–106.
Rainwater-Lovett, K., H. C. Nkamba, M. M. Mbewe, C. B. Moore and W. J. Moss.
2012. “Immunologic Risk Factors for Early Mortality After Starting Antiretroviral
Therapy in HIV-Infected Zambian Children.” AIDS Res. Hum. Retro., 29(3),
479–487.
Range, N., J. Changalucha, H. Krarup, P. Magnussen, A. B. Andersen and H. Friis.
2006. “The effect of multi-vitamin/mineral supplementation on mortality during
treatment of pulmonary tuberculosis: a randomised two-by-two factorial trial in
Mwanza,” Tanzania. British J. Nutr., 95, 762–770.
Rayman, M. P. 2000. “Selenium and human health”. Lan., 356, 233–241.
References
Caroline Cleopatra Chisenga Ph.D. Thesis
222
Rayman, M. P. 2012. “The importance of selenium to human health.” Lan., 379,
1256–68.
Rayman, M. P. 2004. “The use of high-selenium yeast to raise selenium status:
how does it measure up?” Br. J. Nutr., 92, 557–73.
Rayman, M. P. 2008. “Food-chain selenium and human: emphasis on intake.” Br.
J. Nutr., 100, 254-68.
Reeves, M. A and P. R. Hoffmann. 2010. “The human selenoproteome: recent
insights into functions and regulation.” Cell Mol. Life Sci., 66, 2457–2478.
Ricard, D., A. Wilkins, P. T. N'Gum, R. Hayes, G. Morgan, A. P. Da Silva and H.
White. 1994. “The effects of HIV-2 infection in a rural area of Guinea-Bissau.”
AIDS., 8(7), 977- 82.
Rodriguez, J. F., J. Cordero, C. Chantry, S. Gonzalez, C. Rivera, I. Febo, A. Colon
and C. Diaz. 1998. “Plasma glutathione concentrations in children infected with
human immunodeficiency virus.” Pediatric Infect. Dis. J., 17(3), 236–241.
Roederer, M., J. G. Gregson, M. T. Anderson, P. A. Raju and L. A. Herzenberg.
1995. “CD8 Naive T Cell Counts Decrease Progressively in HIV-infected Adults.”
J. Clin. Invest., 95, 2061-2066.
Ross-Degnan, D., M. Pierre-Jacques, F. Zhang, H. Tadeg, L. Gitau, J. Ntaganira,
R. Balikuddembe, J. Chalker and A. K. Wagner. 2010. “Measuring adherence to
antiretroviral treatment in resource-poor settings: The clinical validity of key
indicators.” BMC Health Services Research. 10, 42.
Rot, A. and U. H. von Andrian. 2004. “Chemokines in innate and adaptive host
defense: basic chemokinese grammar for immune cells.” Annu. Rev. Immunol., 22,
891–928.
Sanders, M. E., M. W. Makgoba, and S. Shaw. 1988. “Human naive and memory T
cells.” Immunol. 9, 195-199.
Sattler, F. R., N. Rajicic, K. Mulligan, K. E. Yarasheski, S. L. Koletar, A. Zolopa,
B. A. Smith, R. Zackin and B. Bistrian. 2008. “Evaluation of high-protein
supplementation in weight-stable HIV-positive subjects with a history of weight
loss: a randomized, double-blind, multicenter trial.” Am. J. Clin. Nutr. 88, 1313–
21.

References
Caroline Cleopatra Chisenga Ph.D. Thesis
223
Schacker, T. W., R. J. Bosch, K. Bennett, R. Pllard, G. K. Robbins, A. C. Collier,
R. M. Gulick, J. Spritzler and D. Mildvan. 2010. “Measurement of Naive CD4
Cells Reliably Predicts Potential for Immune Reconstitution in HIV.” J. Acquir.
Immune Defic. Syndr., 54(1), 59–62.
Schiavon, R., G. C. Guidi, S. Biasioli, E. De Fanti and L. Targa. 1994. “Plasma
glutathione peroxidase activity as an index of renal function.” Eur. J. Clin. Chem.
Clin. Biochem., 32, 759–65.
Shacklett, B. L., O. O. Yang, M. A. Hausner, J. Elliott, L. Hultin, C. Price, M.
Fuerst, J. Matud, P. Hultin, C. Cox, J. Ibarrondo, J. T. Wong, D. F. Nixon, P. A.
Anton, B. D. Jamieson. 2003. “Optimization of methods to assess human mucosal
T-cell responses to HIV infection and vaccination.” J Immunolo., Methods.
279:17–31
Schim van der Loeff, M. T and Aaby, p. 1999. “Towards a better understanding of
the epidemiology of HIV-2.” AIDS., 13; A:S69-84.
Schmutzler, C., B. Mentrup, L. Schomburg, C. Hoang-Vu, V. Herzog and J.
Köhrle. 2007. “Selenoproteins of the thyroid gland: expression, localization and
possible function of glutathione peroxidase 3.” Biol. Chem., 388, 1053–59.
Schnittman, S. M., S. M. Denning, J. J. Greenhouse, J. S. Justement, M. Baseler, J.
Kurtzberg, B. F Haynes and A. S. Facuci. 1990. “Evidence for susceptibility of
intrathymic T cell precursors and their progeny carrying T cell antigen receptor
phenotypes TCRαβ+ and TCRγδ+ to human immunodeficiency virus infection: a
mechanism for CD4+ (T4) lymphocyte depletion.” Proc. Nat. Acad. Sci., 87,
7727–7731.
Schreck, R., P. Rieber, and P. A. Baeuerle. 1991. “Reactive oxygen intermediates
as apparently widely used messengers in the activation of the NF-kappa B
transcription factor and HIV-1.” EMBO J., 10, 2247–2258.
Schwarz, K. B. 1996. “Oxidative stress during viral infection: a review,” Free
Radical Biology and Medicine. 21(5), 641–649.
Semba, R. D. and A. M. 1999. “Tang Micronutrients and the pathogenesis of
human immunodeficiency virus infection.” British J. Nutr., 81, 181–189.
Sempowski, G. D., L. P. Hale, J. S. Sundy, J. M. Massey, R. A. Koup, D. C Douek,
D. D. Patel and B. F. Haynes. 2000. “Leukemia inhibitory factor, oncostatin M, IL-
6, and stem cell factor mRNA expression in human thymus increases with age and

References
Caroline Cleopatra Chisenga Ph.D. Thesis
224
is associated with thymic atrophy.” J. Immunol., 164, 2180–2187.
Shelburne, S. A., F. Visnegarwala, J. Darcourt, E. A. Graviss, T. P. Giordano, A.
C. White and R. J. Hamill. 2005. “Incidence and risk factors for immune
reconstitution inflammatory syndrome during highly activeantiretroviral therapy.”
AIDS., 19(4):399-406.
Siedner, M. J, C. K Ng , I. V Bassett, I. T. Katz, D. R. Bangsberg and A. C. Tsai.
2015. “Trends in CD4 Count at Presentation to Care and Treatment Initiation in
Sub-Saharan Africa, 2002-2013: A Meta-Analysis.” Clin. Infect. Dis., 1; 60(7),
1120-7.
Sieleunou, I., M. Souleymanou, A. M. Schonenberger, J. Menten and M. Boelaert.
2009. “Determinants of survival in AIDS patients on antiretroviral therapy in a
rural centre in the Far-North Province, Cameroon.” Trop. Med. Int. Health. 14,
36–43.
Sieg, S. F., D. A. Bazdar and M. M. Lederman. 2003. “Impaired TCR-mediated
induction of ki67 by naïve CD4 T-cells is only occasionally corrected by
exogeneous IL-2 in HIV-infection.” J. Immunol., 171, 5208-5214.
Siliciano, R. F and W. C. Greene. 2011. “HIV Latency”. Cold Spring Harb
Perspect Med., 1, a007096.
Siliciano, J. D, J. Kajdas, D. Finzi, T. C. Quinn, K. Chadwick, J. B. Margolick, C.
Kovacs, S. J. Gange and R. F. Siliciano. 2003. “Long-term follow-up studies
confirm the stability of the latent reservoir for HIV-1 in resting CD4+ T cells.”
Nat. Med., 9, 727–72.
Smith, P. D. T, C. Quinn, W. Strober, E. N. Janoff and H. Masur. 1992.
“Gastrointestinal infections in AIDS,” Annals of Internal Medicine. 116(1), 63–77.
Smith, C. J., C. A. Sabin, M. S. Youle, S. Kinloch-de Loes, F. C. Lampe, S.
Madge, I. Cropley, M. A. Johnson and A. N. Phillips. 2004. “Factors Influencing
Increases in CD4 Cell Counts of HIV-Positive Persons Receiving Long-Term
Highly Active Antiretroviral Therapy.” J. Infect. Dis., 190(10), 1860-1868.
Spiegel, H., H. Herbst, G. Niedobitek, H. D. Foss and H. Stein. 1992. “Follicular
dendritic cells are a major reservoir for human immunodeficiency virus type 1 in
lymphoid tissues facilitating infection of CD4+ T–helper cells.” Am. J. Path., 140,
15–22.
Stanley, S. K., J. M. McCune, H. Kaneshima, J. S. Justement, M. Sulli- van, E.
Boone, M. Baseler, J. Adelsberger, M. Bonyhadi, and J. Orenstein. 1993. “Human
immunodeficiency virus infection of the human thymus and disruption of the

References
Caroline Cleopatra Chisenga Ph.D. Thesis
225
thymic microenvironment in the SCID-hu mouse.” J. Exp. Med., 178, 1151–1163.
Starr, T. K., S. C. Jameson and K. A. Hogquist. 2003. “Positive and negative
selection of T-cells.” Annu. Rev. Immunol., 21, 139-176.
Steinbrenner, H. and H. Sies. 2009. “Protection against reactive oxygen species by
selenoproteins.” Biochim Biophys Acta. 1790, 1478–1485.
Stephen, A. I and A. Avenell. 2006. “A systematic review of multivitamin and
multimineral supplementation for infection.” The British Dietetic Association Ltd.
J. Hum. Nutr. Dietet., 19, 179–190.
Stockinger, H., W. Schreiber, O. Majdic, W. Holter, D. Maurer and W. Knapp.
1992. “Phenotype of human T cells expressing CD31, a molecule of the
immunoglobulin supergene family.” Immunol., 75, 53–58.
Stone, C. A., K. Kawai, R. Kupka and W. W. Fawzi. 2010. “The Role of Selenium
in HIV Infection.” Nutr. Rev., 68, 671–681.
Stone, J. R and S. Yang. 2006. “Hydrogen peroxide: A signaling messenger.”
Antioxid. Redox Signal. 8, 243–270.
Stringer, J. S. A., I. Zulu, J. Levy, E. M. Stringer, A. Mwango, B. H. Chi, V.
Mtonga, S. Reid, R. A. Cantrell, M. Bulterys, M. S. Saag, R. G. Marlink, A.
Mwinga, T. V. Ellerbrock and M. Sinkala. 2006. “Rapid Scale-up of Antiretroviral
Therapy at Primary Care Sites in Zambia Feasibility and Early Outcomes.”
JAMA., 296, 782-793.
Suttmann, U., J. Ockenga, O. Selberg, L. Hoogestraat, H. Deicher and M. J.
Muller. 1995. “Incidence and prognostic value of malnutrition and wasting in
human immunodeficiency virus- infected outpatients.” J. AIDS and Hum
Retrovirol., 8(3), 239–246.
Su, C. 1979. “Preliminary results of viral etiology of Keshan disease.” Chin. Med.
J., 59, 466–472.
Swaminathan, S., C. Padmapriyadarsini, L. Yoojin, B. Sukumar, S. Iliayas, J.
Karthipriya, R. Sakthivel, P. Gomathy, B. E. Thomas, M. Mathew, C. A. Wanke
and P. R. Narayanan. 2010. “Nutritional supplementation in HIV-infected
individuals in South India: a prospective interventional study.” Clin. Infect. Dis., 5,
51–7.

References
Caroline Cleopatra Chisenga Ph.D. Thesis
226
Tai, X., M. Cowan, L. Feigenbaum, and A. Singer. 2005. “CD28 costimulation of
developing thymocytes induces Foxp3 expression and regulatory T cell differ-
entiation independently of interleukin 2.” Nat. Immunol., 6, 152–162.
Tak, P. P and G. S. Firestein. 2001. “NF-KB: A key role in inflammatory diseases.
Journal of Clinical Investigation.” 107, 7-11.
Tang, Q., K. J. Henriksen, E. K. Boden, A. J. Tooley, J. Ye, S. K. Subudhi, X. X.
Zheng, T. B. Strom, and J. A. Bluestone. 2003. “Cutting edge: CD28 controls
peripheral homeostasis of CD4+CD25+ regulatory T cells.” J. Immunol., 171,
3348–3352.
Tanaskovic, S., S. Fernandez, P. Price, S. Lee and M. A. French. 2010. “CD31
(PECAM-1) is a marker of recent thymic emigrants among CD4+ T-cells, but not
CD8+ T-cells or γδ T-cells, in HIV patients responding to ART.” Immunol. Cel.
Biol., 88, 321–327.
Tarazona, R., O. DelaRosa, C. Alonso, B. Ostos, J. Espejo, J. Pena and R. Solana.
2000. “Increased expression of NK cell markers on T lymphocytes in aging and
chronic activation of the immune system reflects the accumulation of
effector/senescent T cells.” Mech Ageing Dev., 121(1), 77-88.
Taylor, J. M., S. J. Tan, R. Detels and J. V. Giorgi. 1991. “Applications of a
computer simulation model of the natural history of CD4 T-cell number in HIV-
infected individuals.” AIDS., 5(2),159-67.
Tenner-Racz, K., P. Racz, S. Gartner, J. Ramsauer, M. Dietrich, J. C. Gluckman,
M. Popovic. 1989. “Ultrastructural analysis of germinal centers in lymph nodes of
patients with HIV-1-induced persistent generalized lymphadenopathy: evidence for
persistence of infection.” AIDS Pathology. New York: Field and Wood., 29–40.
Tenner-Racz, K., P. Racz, J. C. Gluckman, Popovic M. 1988a. “Cell-free HIV in
lymph nodes of patients with persistent generalized lymphadenopathy and AIDS.”
N. Engl. J. Med., 318, 49–50.
Tenner-Racz, K., P. Racz, H. Schmidt, M. Dietrich, P. Kern, A Louie, S Gartner,
M Popovic. 1988b. “Immunohistochemical, electron microscopic and in situ
hybridization evidence for the involvement of lymphatics in the spread of HIV-1.”
AIDS., 2, 299–309.
Tsegaye, A., T. Messele, T. Tilahun, E. Hailu, T. Sahlu, R. Doorly, A. L. Fontanet
and T. F. Rinke de Wit. 1999. “Immunohematological reference ranges for adult

References
Caroline Cleopatra Chisenga Ph.D. Thesis
227
Ethiopians.” Clin. Diagn. Lab. Immunol. 6(3), 410-4.
Tugume, S. B., E. M. Piwowar, T. Lutalo, Mugyenyi, P. N., R. M. Grant , F. W.
Mangeni , K. Pattishall , E. Katongole-Mbidde .1995. “Hematological reference
ranges among healthy Ugandans.” Clin. Diagn. Lab. Immunol. 2(2), 233-5.
Tyagi, M and M. Bukrinsky. 2012. “Human Immunodeficiency Virus (HIV)
Latency: The Major Hurdle in HIV Eradication.” Mol Med., 18, 1096-1108.
UNAIDS report on global AIDS epidemic 2013.
http://www.unaids.org/sites/default/files/en/media/unaids/contentassets/documents/
epidemiology/2013/gr2013/UNAIDS_Global_Report_2013_en. Accessed
November 27, 2014.
United Nations ACC/SCN, 2000.
https://ideas.repec.org/a/eee/agecon/v26y2001i1p85-86.html. Accessed May 16,
2015.
Uppal, S. S., S. Verma, and P. S. Dhot. 2003. “Normal values of CD4 and CD8
lymphocyte subsets in healthy Indian adults and the effects of sex, age, ethnicity
and smoking.” Cytometry 52B, 32–36.
Urassa, W., M. Bakari, E. Sandstrom, A. Swai, K. Pallangyo, E. Mbena, F. Mhalu
and G. Biberfeld. 2004. “Rate of decline of absolute number and percentage of
CD4 lymphocytes among HIV-1-infected adults in Dar es Salaam, Tanzania.”
AIDS 18:433– 8.
Ursini, F., S. Heim, M. Kiess, M. Maiorino, A. Roveri, J. Wissing, and L. Flohe.
1999. “Dual function of the selenoprotein PHGPx during sperm maturation.” Sci.,
285(5432), 1393–96.
Valenzuela, H. F., R. B. Effros. 2002. “Divergent telomerase and CD28 expression
patterns in human CD4 and CD8 T cells following repeated encounters with the
same antigenic stimulus.” Clin Immunol 105:117–125.
van Lettow, M., A. D. Harries, J. J. Kumwenda, E. E. Zijlstra, T. D. Clark, T. E
Taha and R. D. 2004. "Semba Micronutrient malnutrition and wasting in adults
with pulmonary tuberculosis with and without HIV co-infection in Malawi.” BMC
Infect. Dis., 4, 61.
References
Caroline Cleopatra Chisenga Ph.D. Thesis
228
Ventura, M. G., M. C. Freitas, A. Pacheco, T. V. Meerten and H. T. Wolterbeek.
2006. “Selenium content in selected Portuguese foodstuffs.” Eur. Food Res.
Technol., 224, 395-401.
Verguet, S., S. S. Lim, C. J. L Murray, E. Gakidou and J. A. Salomon. 2013.
“Incorporating Loss to Follow-up in Estimates of Survival Among HIV-Infected
Individuals in Sub-Saharan Africa Enrolled in Antiretroviral Therapy Programs.” J.
Infect. Dis., 207, 72–9.
Villamor, E., E. Saathoff, F. Mugusi, R. J. Bosch, W. Urassa and W. W. Fawzi.
2008. “Wasting and body composition of adults with pulmonary tuberculosis in
relation to HIV-1 coinfection, socioeconomic status, and severity of tuberculosis.”
Eur. J. Clin. Nutr., 60, 163–171.
Visser, M. E., H. M. S. Grewal, E. C. Swart, M. A. Dhansay, G. Walzl, S.
Swanevelder, C. Lombard and G. Maartens. 2011. “The effect of vitamin A and
zinc supplementation on treatment outcomes in pulmonary tuberculosis: a
randomized controlled trial.” Am. J. Clin. Nutr., 93, 93–100.
Walker, A. S., A. J. Prendergast, P. Mugyenyi, P. Munderi, J. Hakim, A.
Kekitiimwa, E. Katabira, C. F. Gilks, C. Kityo, P. Nahirya-Ntege, K. Nathoo and
D. M. Gibb. 2012. “Mortality in the year following antiretroviral therapy initiation
in HIV-infected adults and children in Uganda and Zimbabwe." Clin. Infect. Dis.,
55(12).
Wang, C., H. Wang, J. Luo, Y. Hu, L. Wei, M. Duan, and H. He. 2009. “Selenium
deficiency impairs host innate immune response and induces susceptibility to
Listeria monocytogenes infection.” BMC Immunol., 10,55.
Wei, X., S. K. Ghosh, M. E. Taylor, V. A. Johnson, E. A. Emini, P. Deutsch, J. D.
Lifson, S. Bonhoeffer, M. A. Nowak, B. H. Hahn, M. S. Saag and G. M. Shaw.
1995. “Viral dynamics in human immunodeficiency virus type 1 infection.” Nat.,
373, 117-122.
Weiss, L., V. Donkova-Petrini, L. Caccavelli, M. Balbo, C. Carbonneil and Y.
Levy. 2004. “Human immunodeficiency virus-driven expansion of CD4+CD25+
regulatory T cells, which suppress HIV-specific CD4 T-cell responses in HIV-
infected patients.” Bld., 104(10), 3249–3256.
WHO. 2002. AIDS epidemic update 2002. UNAIDS.
WHO. 2013. http://www.who.int/entity/gho/hiv. Accessed September 16, 2015.

References
Caroline Cleopatra Chisenga Ph.D. Thesis
229
Wood, S. M., C. Beckham, A. Yosioka, H. Darban and R. R. Watson. 2000. “β-
Carotene and selenium supplementation enhances immune response in aged
humans.” Integr. Med., 2, 85–92.
Woods, M. N. 1999. “Dietary recommendations for the HIV/AIDS patient,” in
Nutritional Aspects of HIV Infection, T. I. Miller and S. L. Gorbach, Eds., Oxford
University Press, New York, NY, USA.
World Health Organisation (WHO), 2010.
http://www.who.int/nutrition/publications/hivaids/en/. Accessed September 17,
2015.
World Health Organization (WHO). 1985. “Energy and protein requirements,
report of Joint FAO/WHO/UNU expert consultation,” Technical Report Series 724,
WHO, Geneva, Switzerland.
Yang, G. Q., S. Z Wang, R. H. Zhou and S. Z Sun. 1983. “Endemic selenium
intoxication of humans in China.” Am. J. Clin. Nutr., 37, 872–881.
Yolken, R. H, W. Hart, I. Oung, C. Shiff, J. Greenson, and J. A. Perman,
“Gastrointestinal dysfunction and disaccharide intolerance in children infected with
human immunodeficiency virus.” J. Pediat., 118(3), 359–363.
Youn, H-S., J. H. Lim, Y. J. Choi, Y. J. Lee, M-Y. Lee, and J-H. Ryu. 2008.
“Selenium supresses the activation of transcription factor NF-KB and IRF3 induced
by TLR3 or TLR4 agonists”. Inter. Immunopharmacol., 8, 495-501.
Zachariah, R., M. Fitzgerald, M. Massaquoi, O. Pasulani, L. Arnould, S. Makombe
and A. D, Harries. 2006. “Risk factors for high early mortality in patients on
antiretroviral treatment in a rural district of Malawi.” AIDS. 20, 2355–2360.
Zack, J. A., Arrigo, S. J., Weitsman, S. R., Go, A. S., Haislip, A. & Chen, I. S.
(1990) Cell 61, 213–222.
Zambia Demographic Health Surey http://www.zamstats.gov.zm/report/Demo.
Accessed June 27, 2014.
Zhang, J-Y., Z. Zhang, X. Wang, J-L. Fu, J. Yao, Y. J., L. Chen, H. Zhang, J. Wei,
L. Jin, M. Shi, G. F. Gao, H. Wu, and F-S. Wang. 2007. “PD-1 up-regulation is
correlated with HIV-specific memory CD8+ T-cell exhaustion in typical
progressors but not in long-term nonprogressors.” Bld., 109, 4671-4678.

References
Caroline Cleopatra Chisenga Ph.D. Thesis
230
Zhang, X., P. W. Hunt, S. M. Hammer, M. S. Cespedes, K. B. Petterson and R. J.
Bosch. 2013. “Immune Activation While on Potent Antiretroviral Therapy Can
Predict Subsequent CD4+ T-Cell Increases Through 15 Years of Treatment.” HIV
Clin. Tri., 14(2), 61–67.
Zulu, I., G. Hassan, R. N. L. Njobvu, W. Dhaliwal, S. Sianongo and P. Kelly.
2008. “Cytokine activation is predictive of mortality in Zambian patients with
AIDS-related diarrhea.” BMC Infect. Dis., 8, 156.