the effects of generalized school choice on achievement...
TRANSCRIPT

Journal of Public Economics 90 (2006) 1477–1503
www.elsevier.com/locate/econbase
The effects of generalized school choice on achievement
and stratification: Evidence from Chile’s
voucher program
Chang-Tai Hsieh a, Miguel Urquiola b,*
a University of California, Berkeley, United Statesb Columbia University, United States
Received 14 April 2005; received in revised form 2 November 2005; accepted 8 November 2005
Available online 18 January 2006
Abstract
In 1981, Chile introduced nationwide school choice by providing vouchers to any student wishing to
attend private school. As a result, more than 1000 private schools entered the market, and the private
enrollment rate increased by 20 percentage points, with greater impacts in larger, more urban, and wealthier
communities. We use this differential impact to measure the effects of unrestricted choice on educational
outcomes. Using panel data for about 150 municipalities, we find no evidence that choice improved average
educational outcomes as measured by test scores, repetition rates, and years of schooling. However, we find
evidence that the voucher program led to increased sorting, as the bbestQ public school students left for theprivate sector.
D 2005 Elsevier B.V. All rights reserved.
JEL classification: H4; I2
Keywords: Generalized school choice; Stratification; Chile
1. Introduction
A central argument in the school choice debate is that public schools are inefficient local
monopolies, and that educational quality would improve dramatically if only parents were
allowed to freely choose between schools. For example, Hoxby (2003) asks bwhat is the range ofproductivity over which choice could cause productivity to vary? Recent history suggests that
school productivity could be much higher than it is now—60% to 70% higher.Q Two arguments
0047-2727/$ - see front matter D 2005 Elsevier B.V. All rights reserved.
doi:10.1016/j.jpubeco.2005.11.002
* Corresponding author.
E-mail addresses: [email protected] (C.-T. Hsieh), [email protected] (M. Urquiola).

C.-T. Hsieh, M. Urquiola / Journal of Public Economics 90 (2006) 1477–15031478
underlie this view. First, there is a widely held belief that private schools are more effective than
public schools. Although the evidence from quasi-experiments with vouchers is mixed, if private
schools are in fact more efficient, then school choice could raise students’ achievement merely
by facilitating their transfer to the private sector.1 A second, perhaps even more compelling
argument for choice comes from the notion that organizations respond to incentives. Therefore,
by correctly aligning the incentives public schools face, choice would force their seemingly
ossified bureaucracies to improve.
This paper assesses these arguments by examining the impact of a comprehensive school
voucher program introduced in Chile. Specifically, in 1981 Chile’s government began to provide
vouchers to any student wishing to attend private school, and to tie the budget of public schools
to their enrollment. We show that this program, whose essential features remain unchanged 20
years later, created a dynamic educational market: more than a thousand private schools entered
the market, and the private enrollment rate increased from 20% to 40% by 1988, surpassing the
50% mark in many urban areas. The Chilean case thus provides a unique opportunity to analyze
the transition from a centrally controlled public school system, to one in which all families can
freely choose between public and private schools.
To measure the effects of the competitive forces unleashed by the voucher program, we exploit
the fact that it had a greater impact in communities with larger markets, and in those where the
demand for private schooling appears to have been greater. For example, from 1981 to 1988, the
private enrollment rate grew by 11 percentage points more in urban than in rural communities.
As long as this differential impact is driven by community characteristics that are fixed over
time, we can measure the impact of the voucher program by comparing the change in
educational outcomes in urban and wealthier communities, to that in communities where private
schooling increased by less. Using this approach with panel data for roughly 150 communities in
Chile, we consistently fail to find evidence that school choice improved average academic
outcomes.2 Specifically, we find that average test scores did not rise any faster in communities
where the private sector made greater inroads, and that average repetition and grade-for-age
measures worsened in such areas (relative to other communities).
This evidence thus suggests that school choice did not improve average schooling outcomes
in Chile. However, a natural alternative explanation is that the reallocation of students did raise
achievement, but that these gains were masked by pre-existing negative trends in communities
where the private sector grew by more. We cannot rule out this possibility, but we provide two
pieces of evidence that are inconsistent with it. First, we show that our estimates do not change
when we introduce a battery of controls for pre-existing and con-current trends, nor when we use
a number of pre-program community characteristics—such as the initial population, urbanization
rate, and degree of inequality—as instruments for the differential impact of the voucher program.
Admittedly, the controls we use may not capture unobservable trends in school quality, and the
instruments may not be ideal, but it is still puzzling that we continue to find no evidence that
choice improved schooling quality.
Second, we explore another way to measure whether school quality has improved in Chile,
one that does not rely on the differential impact of the voucher program across markets. Namely,
we compare the performance of Chilean students in international tests in science and
mathematics (widely known as the TIMSS), in which Chile participated in 1970 and 1999.
This comparison indicates that despite nearly two decades under an unrestricted school choice
1 See Ladd (2002) and Neal (2002) for recent surveys of the large literature on school vouchers.2 As described later in the paper, we define a community (or school bmarketQ) as a Chilean municipality.
C.-T. Hsieh, M. Urquiola / Journal of Public Economics 90 (2006) 1477–1503 1479
regime, the performance of the median Chilean student has not improved relative to that of the
median student in other countries.3
This collective body of evidence presents an enormous puzzle. How canwe reconcile it with our
instinct that when parents are able to choose between schools, they will select the most effective
ones, and that schools should respond to this pressure? Again, it is possible that our estimates are
biased by unobserved trends in schooling outcomes. However, an alternative explanation is that
when parents are allowed to freely choose between schools, they select those that provide bgoodQpeer groups for their children, which might not necessarily be the most productive. In turn, schools
might respond by competing to attract better students, rather than by raising their productivity.
Both forces are obviously complementary, and although they will not necessarily improve average
school quality, they will tend to result in more stratification between schools.
We provide suggestive evidence that this appears to have happened in Chile—that the main
effect of unrestricted school choice was an exodus of bmiddle-classQ students from the public
sector. Specifically, we find that in communities where private schools grew by more, there is a
greater decline in the socioeconomic status (SES, measured by parental schooling and income) of
public school students relative to the community average. In addition, we show that the loss of
these students had a major effect on academic outcomes in the public sector. Namely, the
performance of public schools (measured by test scores and repetition rates relative to the
community average) worsened by more in markets where the voucher program had a larger effect.
The rest of the paper proceeds as follows. We begin by reviewing the institutional details of
Chile’s voucher program. We then describe the challenges evaluating the impact of school
choice presents, and discuss our empirical approach. Finally, we assess how choice affected
achievement and sorting across communities in Chile.
2. Chile’s school voucher program: a brief overview
In 1981, as part of the Pinochet government’s sweeping market-oriented reforms, Chile
introduced a nationwide school voucher program. The easiest way to explain this reform is to
discuss how it modified the manner in which schools were governed and funded. Before the
reforms, there were three types of schools in Chile:
1) Fiscal schools. These public schools were controlled by the national Ministry of Education,
which was responsible for all aspects of their operation. It hired and paid teachers, maintained
facilities, and designed the curriculum. In 1981, 80% of all students were in such institutions.
2) Unsubsidized private schools. These private institutions did not receive public funding. They
charged relatively high tuition and catered primarily to upper income households. Prior to the
reforms, they accounted for about 6–7% of enrollment.
3) Subsidized private schools. These institutions did not charge tuition, received public
subsidies, and were generally religious.4 The size of the subsidy they received depended on
the government’s fiscal condition, but averaged 50% of nominal per-student spending in the
fiscal schools. This aid was supposed to be disbursed at the end of the school year, but was
3 In addition to Chile, twelve other countries participated in the TIMSS in 1970 and 1999. As we document below, after
controlling for variables such as per capita GDP growth, changes in enrollment rates, and educational spending per
student, the performance of the median Chilean student appears to have worsened slightly between 1970 and 1999.4 Espınola (1993) states that in 1970, 53% of private schools were Catholic and the remaining were Protestant or run by
private foundations.

C.-T. Hsieh, M. Urquiola / Journal of Public Economics 90 (2006) 1477–15031480
typically delayed by several months, and was therefore eroded by inflation.5 Prior to the
reform, these schools accounted for 15% of enrollment.
The 1981 reforms sought to create a nationwide voucher program with financial incentives
for both public and private institutions.6 This initiative had three main components:
1) Decentralization of public schools. Fiscal schools were transferred from the Ministry of
Education to roughly 300 municipalities or bcommunesQ, such that they became known as
municipal schools. The contract between the Ministry and the national teachers’ union was
abrogated, and public school teachers had to either transfer to municipal schools as common
public employees, or resign and reapply for teaching jobs as regular private sector workers.
To encourage the latter, the Ministry offered substantial severance payments.
2) Public school funding. Municipal schools continued to be funded centrally, but municipalities
started to receive a per-student payment for every child attending their schools. As a result,
enrollment losses came to have a direct effect on their education budgets.
3) Public funding for private schools. Most importantly, (non-tuition charging) subsidized
private schools began to receive exactly the same per-student payment as the municipal
schools.7 These payments were distributed on a monthly basis, and their initial level was set
30% higher than the pre-1981 average spending per student in the public sector. To distinguish
these institutions from the subsidized private schools that existed before the reforms, we will
call them voucher private schools.8 These retained wide latitude regarding student selection
policies (public schools can only legally turn away students when oversubscribed), and were
allowed to receive outside donations. They were not permitted, however, to charge tuition.9
Tuition-charging private schools mostly continued to operate without public funding. While
they could have stopped charging tuition and started to accept vouchers, these elite institutions in
general chose not to do so.
Finally, because voucher programs are often short-lived, it is worth mentioning that the
essential features of this system have remained in place over the last 20 years. The center-left
coalitions in power since 1990 have chosen to focus their efforts on channeling additional
resources to bvulnerableQ schools, increasing real educational spending and teacher salaries, and
financially rewarding schools with high test scores.10 Nevertheless, the core of the system—the
5 See Schiefelbein (1971). Inflation averaged 5.2% per month in the 1970s. Assuming that public school teachers are
paid every month, the real value of the stipend would be only 35% of real per-student expenditures in the public sector if
the stipends were paid on time (at the end of the school year), and 26% if the payments were delayed by 6 months.6 For further discussion of the school choice reforms in Chile, see McEwan (2000), and McEwan and Carnoy (2000).7 The size of the voucher payment each school receives varies according to: 1) the educational level at which it
operates, 2) whether it offers special programs, and 3) its distance from urban centers. Importantly, a given private school
receives the same payment as a municipal school with similar characteristics.8 In Chile, they continue to be known as subsidized private schools.9 This restriction was largely eliminated in the mid-1990s, but was in place for essentially all of the periods we will
analyze below.10 These are mainly policies aimed at: i) the worst performing schools—the P900 (Programa de las 900 Escuelas)
program, ii) the entire K-12 system—the MECE (Programa de Mejoramiento de la Calidad y Equidad de la Educacion
Preescolar y Basica) initiative, iii) rural schools—the MECE-Rural, and iv) rewarding teachers in schools that perform
well—the SNED (Sistema Nacional de Evaluacion del Desempeno de los Establecimientos Educativos Subvencionados).
Here we focus on the 1980s because it is the period in which the voucher program had its largest effects and was the key
educational intervention, with the government refraining from compensatory initiatives.

C.-T. Hsieh, M. Urquiola / Journal of Public Economics 90 (2006) 1477–1503 1481
per-student voucher payments and the freedom to attend any school, religious or not—has been
left intact.
3. The industrial organization effects of school choice
These reforms led to significant changes in the Chilean educational market. Fig. 1 shows
that the public sector’s enrollment share hovered around 80% throughout the 1970s, but fell
rapidly after 1981, dipping below the 60% level by 1990. The figure also describes the
evolution of private schools’ participation, which beginning in 1981, can be decomposed into
that of voucher and tuition-charging schools. This makes clear that the rise of
private enrollment in the 1980s is almost entirely due to the growth of voucher private
institutions. By 1986, only five years after the per-student payments were introduced, these
schools’ market share crossed the 30% level, doubling relative to that of the pre-1981
subsidized private sector. In contrast, the participation of the beliteQ private schools remained
roughly constant over the 1980s, and experienced a gradual but sustained increase during the
1990s.
This transfer of students was accompanied by a large reallocation of resources towards private
schools. First, because of voucher financing, the 20 percentage point enrollment shift means that
a corresponding percentage of the Ministry of Education’s school-related operational
expenditures were reallocated to private schools. Second, although the transfer of teachers
was more gradual than the shift in enrollment, by 1990 the fraction of teachers working in public
schools had also fallen by 20 percentage points.
The aggregate trends in Fig. 1 conceal considerable variation in the growth of the private
sector across different educational markets. Using Chile’s approximately 300 communes as
proxies for such markets, Fig. 2 (panel A) presents kernel densities of the change in private
enrollment ratios from 1982 to 1996 for all communes in Chile, and for a subset of urban
communes.11 As can be seen, there was a substantial heterogeneity in the impact of the
school voucher program across communes, although it was generally greater in urban
communities.
Table 1 provides further information on the characteristics of the communities that were more
affected by the availability of vouchers.12 The first four columns indicate that the voucher
program had a larger effect in urban and populated communes. For example, our point estimates
indicate that the private enrollment rate grew by 11 percentage points more in a fully urban than
in a wholly rural community. The next two columns suggest that the voucher program also had a
larger effect in more unequal communities, where we proxy inequality by the inter-quartile range
in years of schooling among working age adults.
Over time, such differences have produced substantial cross sectional variation in private
enrollment, as described in Fig. 2 (panel B), which presents density estimates of private
participation in 1996.13 In roughly 40% of the urban communes the public sector has become a
minority player, and in extreme cases, it accounts for only 20% to 25% of all enrollments.
Further, this supply response was not limited to growth in pre-existing schools. Fig. 3 shows that
more than 1000 private schools were created from 1982 to 1985, increasing their number by
almost 30%.
11 Defined as those with urbanization rates above 80% and populations above ten thousand.12 We defer a discussion of the data sources until Section 5.1. Descriptive statistics are in Table 1.13 As all other data presented henceforth, this figure refers only to the primary school sector (grades 1–8).

0
10
20
30
40
50
60
70
80
90
70 71 72 73 74 75 76 77 78 79 80 81 82 83 84 85 86 87 88 89 90 91 92 93 94 95 96
Enr
ollm
ent
shar
e by
typ
e of
sch
ool
Fiscal
Total private
Totalprivate
Municipal
Voucher private (previously subsidized private)
Tuition-charging private
Fig. 1. National enrollment shares by sector, 1970–1996. Data assembled from several issues of the Ministry of
Education’s Compendio Estadıstico.
C.-T. Hsieh, M. Urquiola / Journal of Public Economics 90 (2006) 1477–15031482
A notable fact is that despite extensive private entry and sustained declines in public
enrollments, the aggregate number of municipal schools has barely fallen. Municipal officials
seem to have been unable or unwilling to close public schools. This leaves open the possibility
that public schools did not face strong incentives to compete. This is reinforced by the fact
that for these schools, revenue losses are mediated by municipal educational budgets, which
makes it possible for them to lose students without automatic consequences on their resources.
If indeed incentives were completely blunted for this sector, the gains from school choice
would be entirely due to the reallocation of students to the (presumably) more productive
private sector.
Finally, we note two interesting differences between the subsidized schools which existed
prior to 1982 (which we label incumbent voucher schools) and those that entered thereafter
(which we label voucher entrants). First, while the incumbent voucher schools are almost
entirely religious institutions, the entrants are largely for-profit. For example, 84% of the entrants
Panel A: Within-commune changes, 1982-96
All communes Urban communes
-.2 0 .2 .4 .6
0
Panel B: Levels, 1996
All communes Urban communes
0 .5 1
0
Fig. 2. Private enrollment among communes. Panel A is based on administrative information, data sources (8) and (10) in
Table A.1. It covers all communes in Chile. Panel B refers to communes with positive private enrollment.

Table 1
Explaining the private sector’s growth, 1982–1988
Independent variable—
1982 observation of:
Dependent variable—1982–88 change in private enrollmenta
(1) (2) (3) (4) (5) (6) (7) (8)
Urbanization rateb 0.11*** 0.08*** 0.09*** 0.04*
(0.01) (0.02) (0.01) (0.02)
[0.45] [0.33] [0.37] [0.16]
Populationb 0.67*** 0.54*** 0.40*** 0.40***
(0.19) (0.11) (0.07) (0.06)
[0.21] [0.17] [0.13] [0.13]
Inter-quartile range in years
of schoolingb0.16*** 0.18*** 0.06** 0.13***
(0.02) (0.04) (0.03) (0.04)
[0.34] [0.39] [0.13] [0.28]
Controls: 1982–1988 changes
in population, years of
schooling among adults,
and incomec
No Yes No Yes No Yes No Yes
N 297 171 297 171 297 171 297 171
R2 0.204 0.242 0.046 0.205 0.121 0.263 0.232 0.310
Notes: *, **, and *** indicate significance at the 10%, 5%, and 1% level, respectively. Huber–White standard errors are
in parenthesis. Brackets contain the proportion of a standard deviation change in the dependent variable brought about by
a one standard deviation increase in the independent variable. Sample sizes vary due to the addition of controls with
missing observations.a Based on administrative information, data sources (8) and (9), as described in Table A.1.b Calculated using census micro and summary information, data sources (16) and (17). Urbanization is expressed as a
proportion; population is in units of 10 million; and the inter-quartile range is in units of 10 years of schooling.c Controls for concurrent trends are the 1982–1992 change in population (from data sources 17 and 18), and the 1982–
1996 change in mean years of schooling and imputed labor income among adults (from census and household survey
information, sources 13 and 16).
C.-T. Hsieh, M. Urquiola / Journal of Public Economics 90 (2006) 1477–1503 1483
observed in 1988 are profit seeking institutions.14 Second, the entrants generally attract students
from lower socioeconomic backgrounds. For example, students in the new voucher schools
come from families with less schooling and lower incomes, and have lower test scores than those
in the incumbent voucher schools.15
4. Measuring the effects of school choice
There are two issues one has to address to credibly measure the effects of school choice on
educational outcomes. The first is how to separate those effects that operate through enhanced
school productivity, from those that operate through sorting. The second concerns the need for
an adequate control group or counterfactual. This section addresses these issues in turn.16
14 This number is from a sample of communes for which we have a panel of schools from 1982 to 1988. The communes
in this panel account for about 70% of total enrollment in the country. See Section 5.1 for details on the data.15 Using the Chilean household survey (CASEN), we find that parents in the incumbent voucher schools have 1.35 (S.E.:
0.186) more years of schooling and 0.168 log points higher incomes (S.E.: 0.038) than parents in the entrant voucher
schools. Additionally, SIMCE data reveal that in 1988, incumbents’ average scores were 0.35 standard deviations higher in
math, and 0.4 standard deviations higher in language. See Section 5.1 for additional information on the data.16 A formal version of the arguments in this section is available in Hsieh and Urquiola (2003), which also contains more
extensive references on the school choice literature. For models of competition between schools, see also Epple and
Romano (1998) and Manksi (1992).

0
1,000
2,000
3,000
4,000
5,000
6,000
1980 1985 1990 1995
Num
ber
of s
choo
ls
Municipal
Voucher private
Tuition-charging private
Fig. 3. Number of schools by sector, 1980–1995. Data assembled from several issues of the Ministry of Education’s
Compendio Estadıstico.
C.-T. Hsieh, M. Urquiola / Journal of Public Economics 90 (2006) 1477–15031484
4.1. Disentangling sorting from changes in productivity
A central issue in measuring the effect of school choice is that it can simultaneously affect
both schools’ productivity and the extent of sorting or stratification observed in the educational
system. If it influences schooling outcomes through both of these channels, then it is nearly
impossible to disentangle their respective magnitude.
To illustrate this point, put aside for now the endogeneity of competition. That is, imagine a
setting in which the extent of private school availability is exogenously assigned across markets,
and consider trying to measure the two sources of productivity gains from school choice: the
possibility that private schools are more effective (so that aggregate achievement improves
simply by shifting students into them), and the possibility that competition prompts public
schools to improve.
A first problem is that if cream skimming takes place, even if competition forces public
schools to improve, their average academic outcomes might still fall simply because the best
students leave for private schools. On the other hand, if private schools attract lower income
households, then public school performance might improve simply because the lowest
performing students have exited them.17 Put simply, when choice leads to sorting, there is
simply no instrument that would allow one to isolate the effect of choice on the public sector’s
productivity.
A second problem arises if either type of sorting takes place and additionally, peer effects
are important. In this case, it is difficult to measure whether students that switch to private
17 Later in the paper, we will provide suggestive evidence that bcream skimmingQ is much closer to what happened in
Chile, where the voucher program seems to have lead to an exodus of bbetterQ students from the public sector. Of course,
this need not be the case. In the U.S., for instance, choice programs might attract lower income households unable to
settle into good districts or catchment areas. For instance, Bettinger (1999) provides suggestive evidence that in Michigan
lower income students were the ones that took advantage of charter schools. The bottom line is that either type of sorting
will complicate the analysis.

C.-T. Hsieh, M. Urquiola / Journal of Public Economics 90 (2006) 1477–1503 1485
schools improve because private schools are more productive, or simply because they
now interact with better peers. This matters because the overall peer quality in a community
is fixed, so if there is no private productivity advantage, the gain to students shifting
into private schools may come at the expense of the students who remain in the public
sector.
In short, as long as choice also leads to sorting, one will generally not be able to separately
measure the two potential sources of productivity gains from school choice.18 What we can do is
to approximate a weighted average of these two productivity effects by measuring the average
change in academic outcomes of all students in a given community. This is not a perfect measure
because it also encompasses the net peer effects of sorting induced by school choice.
Nonetheless, the key advantage is that it nets out the bdirectQ effect of changes in each sector’s
student composition.
4.2. Empirical implementation and endogenous private entry
Thus far, our discussion suggests that to adequately study the productivity effects of choice,
one has to look at its effects at the aggregate market level, and preferably in situations in which it
has produced substantial and sustained changes in the educational market. From this point of
view, the Chilean experience is very valuable. On the other hand, we have focused on measuring
the effects of choice in situations in which the private enrollment share is as good as randomly
assigned. Such an experiment would be very difficult to implement, and was not carried out in
Chile, where the voucher program was introduced across the entire country at once. The Chilean
case still offers empirical leverage, however, since in response to this program, the private sector
grew substantially more in some markets.
This differential response is endogenous to the characteristics of a community, but as long as
these characteristics do not change over time, one can difference them away by comparing the
change in outcomes in a given community with the change in its private share. The identifying
assumption is that the rate of improvement in educational outcomes (or the rate of change in
sorting measures) that would have been observed without vouchers is not systematically related
to characteristics that affected the extent of private entry.
There are, however, three reasons why this may not be the case. First, there could be
differences in pre-existing trends that are correlated with the growth of the private sector. For
example, if performance had been falling over time in markets where private enrollment grew
rapidly after 1982, our estimates could understate the improvement due to choice.
Second, differential concurrent trends also pose potential problems. For example, it could be
that the areas where private schools entered more were also ones that subsequently experienced
rapid income growth, and that it was this growth, rather than any productivity effects stemming
from vouchers, that improved outcomes. In this case, our estimates would overstate the gains
from choice.
Third, the existence of heterogeneous treatment effects would also affect both private entry
and subsequent achievement growth. For example, it could be that the voucher program resulted
in greater entry in communities in which the private productivity advantage was greater. In this
case, comparing the change in achievement in communities with more private growth (and a
greater private advantage) with communities with less entry (and a smaller private advantage)
18 One could narrow the bias due to sorting with detailed data on students’ background, but there is still the obvious
problem posed by unobservable characteristics potentially correlated with academic outcomes.

C.-T. Hsieh, M. Urquiola / Journal of Public Economics 90 (2006) 1477–15031486
would overstate the impact of choice in an average community.19 Put differently, what we would
be doing is to estimate the average marginal impact of choice, which would be larger than the
average effect.
There are two ways in which we address these concerns. First, we introduce a number of
controls for pre-existing and concurrent trends. Second, we look for instrumental variables that
affect the extent of private entry, but are ideally uncorrelated with trends in academic outcomes,
or with the productivity advantage of the private sector. While the controls and instruments we
use are not ideal, by comparing how the estimate changes with these modifications, we can
obtain some sense of the magnitude and the direction of bias in our base estimates.
5. Results
Based on the framework presented, we now measure the impact of the voucher program. We
first briefly describe our data, and then present results on academic outcomes. Finally, we turn to
the program’s impact on sorting.
5.1. Data and coverage
The framework sketched above suggests that the proper way to assess the impact of vouchers
is to measure changes in educational outcomes at the aggregate market level. To implement this,
we make use of Chile’s (approximately) 300 communes as proxies for educational markets.
Communes have a median area of about 55 km2 and an average population of 39,000. In 1988,
the average commune had 27 schools, 18 of which were public, 7 private voucher, and 2 tuition
charging. Each commune has an autonomous government that manages schools and other public
services.20
We use three types of outcome measures. The first consists of the average mathematics and
language test score in each commune, which the PER testing program provides for 1982, and the
SIMCE for later years.21 This information is provided at the school level, which we aggregate to
create weighted averages for each commune. A potential problem with these data is that several
rural communes were not covered in the initial year (1982). However, it still reached 90% of all
students, and if the test was administered in a given commune, all the schools in the commune
participated.22
Our second outcome measure is the average repetition rate, which is defined as the fraction of
students who have repeated the same grade at least twice, the official measure of repetition in
Chile. We compiled these data from school-level administrative records collected by the
Ministry of Education for 1982 and 1988. It covers all schools in the country, so it allows us to
check that our results with test scores are not driven by the choice of communes.
Our third outcome variable is the average years of schooling among 10–15-year old children.
This measure captures several dimensions of the educational system’s performance, since it
19 This point is formally set out in Hsieh and Urquiola (2003).20 With the exception of 50 communes in the Santiago metropolitan area, virtually all students attend school in the same
commune in which they live. Because we want to use these as markets, we aggregate the 50 Santiago communes and
consider them as a single school market.21 PER stands for Programa de Evaluacion del Rendimiento Escolar, and SIMCE for Sistema de Evaluacion de Calidad
de la Educacion. These tests have been conducted every year during the period we consider below (with the 4th grade in
even and the 8th in odd years) since 1982, with a suspension during 1985–1987.22 See Espınola (1993).

C.-T. Hsieh, M. Urquiola / Journal of Public Economics 90 (2006) 1477–1503 1487
reflects factors like age at entry, repetition, and dropout patterns. We compiled this variable from
the population census and CASEN household survey micro data.
Finally, we use two sources of data to measure students’ socioeconomic status. First, the
Ministry of Education classifies each school into three to four categories, based on the
educational background of the parents. We use this classification, but it is obviously rather
coarse. To complement it, our second measure is based on household survey data. The Chilean
National Household Survey (CASEN) is unusual in that it identifies the precise school attended
by the children surveyed. With this school identifier, we can link its information to
administrative records and obtain detailed information on the SES profile of individual schools.
The summary statistics for the data are in Table 2, and Table A.1 in the appendix contains further
detail on the precise data sources used.
5.2. Measuring the effects of choice on achievement
We begin by measuring the impact of the voucher program on four measures of academic
achievement: 1) language test scores, 2) math test scores, 3) repetition rates, and 4) average years
Table 2
Descriptive statistics at the commune level
1982 1988 1996
N Mean SD N Mean SD N Mean SD
Outcomes
Language scorea 97 56.0 6.3 293 50.2 6.9 298 68.3 5.8
Math scorea 97 50.7 6.4 293 48.3 5.9 298 68.0 5.7
Repetition rateb 299 0.12 0.05 304 0.08 0.04
Years of schooling, 10–15-year oldsc 170 5.2 0.6 125 6.3 0.4 170 6.2 0.4
Sorting measures
Average among public schools/average among all schools for:
Language scorea 101 0.97 0.04 292 0.98 0.05 298 0.98 0.04
Math scorea 101 0.97 0.04 292 0.98 0.04 298 0.99 0.04
Repetition rateb 299 1.06 0.13 300 1.07 0.17
Socioeconomic status (SES) indexa 101 0.96 0.06 292 0.97 0.08 298 0.96 0.07
Household incomed 185 0.87 0.16
Private enrollment rate e 299 0.12 0.14 304 0.17 0.17 304 0.18 0.18
Controls
Population (hundreds of thousands)f 303 0.37 2.1 310 0.43 2.48
Years of schooling, household headsg 303 6.2 1.5 177 8.5 1.5
Log of average imputed labor incomeg 303 10.4 0.3 177 12.2 0.3
Poverty rateh 164 0.19 0.07
Household incomeh 164 0.33 0.13
Literacy rateh 303 0.90 0.05
a Calculated using test system information, data sources (1), (2), and (4), as described in Table A.1.b Variable comes from administrative information, data sources (8) and (9). It is not available for subsequent years.c Based on micro census information for 1982 (data source 16), and household survey information for 1990 and 1996
(sources 11 and 13).d Variable based on household survey information, pooled data sources (11) and (12).e Variable comes from administrative information, data sources (8), (9), and (10).f Calculated using census summary information, data sources (17) and (18).g For household heads at least 18 years of age. Calculated using census micro data (source 16), and household survey
(data source 13).h Variable based on household survey information, data source (14).

C.-T. Hsieh, M. Urquiola / Journal of Public Economics 90 (2006) 1477–15031488
of schooling among 10–15-year old children. The key independent variable is the change in the
private enrollment rate. These estimates are shown in Table 3. We focus on the 1982–1988
period (panel A) since this is the period where we see the largest changes in private enrollment.
Columns 1 and 4 present the basic bivariate OLS regression for language and math,
respectively. Although statistically insignificant, the point estimates suggest that, if anything, test
scores experienced a relative decline in communities where the private sector made greater
inroads. Columns 7 and 10 turn to repetition rates and years of schooling (among 10–15-year old
children). Once again, the simplest bivariate OLS estimates provide no evidence of a relative
improvement in communes where the private sector grew by more. In fact, column 7 indicates
that repetition rates experienced a relative increase in communes where private schooling grew
by more. The coefficient is statistically significant and large—a one standard deviation increase
in the 1982–88 private enrollment growth increases the observed change in repetition by a
quarter of a standard deviation.
As previously discussed, these estimates are robust to the endogeneity of the growth in
private enrollment to the extent that it is driven by community characteristics that are fixed over
time. However, there could be differential trends in academic outcomes that are correlated with
the differential increase in private enrollment. For example, it might be the case that the private
sector grew by more in areas where schooling outcomes had been worsening over time. To
address this concern, columns 2, 5, 8, and 11 add three controls for pre-existing trends.
First, we include the 1970–1982 change in average years of schooling, which summarizes
several aspects of the educational system’s performance up to the introduction of vouchers.23 It
is an ideal control for our age for grade measure, and also indirectly captures previous
performance on repetition. A second control is the 1980–1982 change in private enrollment.
While this is not a direct outcome measure, the logic is that as a reaction to declining public
performance prior to 1982, households may have started moving to the private sector even
before the introduction of vouchers.24 We would have liked to include data on private enrollment
from years prior to 1980, but unfortunately this is not available at the commune level. Using
information from maps,25 however, we were able to also include the 1978–1982 change in the
proportion of schools private in each commune. When we add these variables, the point
estimates are essentially unchanged, and in the case of repetition rates, they continue to be
significant at the 5% level.
The differential impact of the voucher program might also be correlated with concurrent
trends. For example, if areas with greater private entry also experienced greater income growth
which independently raised achievement, then our results might overestimate the effect of
choice. Columns 3, 6, 9 and 12 add further controls to address this possibility. Specifically, they
include 1982–1988 changes in population, labor income, and average years of schooling among
adults.26 Again, the point estimates are essentially unchanged, and continue to suggest that
greater private growth might have even lowered average achievement.27
23 We compiled this data from the 5% sample of the 1970 and 1982 population censuses.24 We obtained this information from administrative data provided by the Ministry of Education.25 Data source 19 in Table A.1.26 This information is compiled from the 1982 population census and the CASEN; see Table A.1.27 As a further check for the test score results, one can also implement regressions 1–9 focusing only on the performance
of the tuition-charging private sector, which was not directly affected by the reform. Here again we find no clear effect on
achievement, although the estimates are imprecise in part because the sample of municipalities drops substantially. For
instance, for column 1 of Table 3, the corresponding estimate is �6.4 with a standard deviation of 28.5 and a sample size
of 31. The remaining specifications produce similar results, so we omit them for reasons of space.
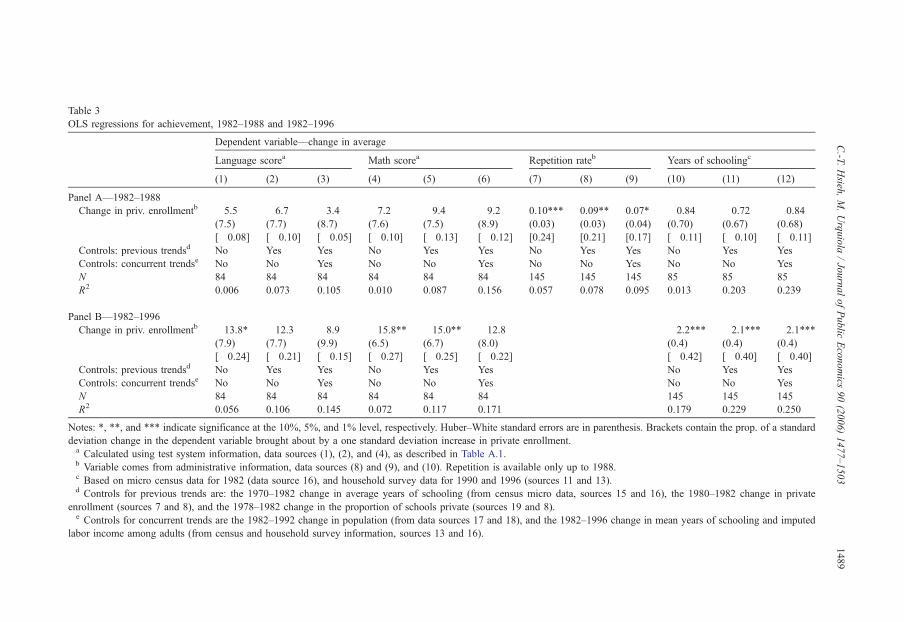
Table 3
OLS regressions for achievement, 1982–1988 and 1982–1996
Dependent variable—change in average
Language scorea Math scorea Repetition rateb Years of schoolingc
(1) (2) (3) (4) (5) (6) (7) (8) (9) (10) (11) (12)
Panel A—1982–1988
Change in priv. enrollmentb �5.5 �6.7 �3.4 �7.2 �9.4 �9.2 0.10*** 0.09** 0.07* �0.84 �0.72 �0.84(7.5) (7.7) (8.7) (7.6) (7.5) (8.9) (0.03) (0.03) (0.04) (0.70) (0.67) (0.68)
[�0.08] [�0.10] [�0.05] [�0.10] [�0.13] [�0.12] [0.24] [0.21] [0.17] [�0.11] [�0.10] [�0.11]Controls: previous trendsd No Yes Yes No Yes Yes No Yes Yes No Yes Yes
Controls: concurrent trendse No No Yes No No Yes No No Yes No No Yes
N 84 84 84 84 84 84 145 145 145 85 85 85
R2 0.006 0.073 0.105 0.010 0.087 0.156 0.057 0.078 0.095 0.013 0.203 0.239
Panel B—1982–1996
Change in priv. enrollmentb �13.8* �12.3 �8.9 �15.8** �15.0** �12.8 �2.2*** �2.1*** �2.1***(7.9) (7.7) (9.9) (6.5) (6.7) (8.0) (0.4) (0.4) (0.4)
[�0.24] [�0.21] [�0.15] [�0.27] [�0.25] [�0.22] [�0.42] [�0.40] [�0.40]Controls: previous trendsd No Yes Yes No Yes Yes No Yes Yes
Controls: concurrent trendse No No Yes No No Yes No No Yes
N 84 84 84 84 84 84 145 145 145
R2 0.056 0.106 0.145 0.072 0.117 0.171 0.179 0.229 0.250
Notes: *, **, and *** indicate significance at the 10%, 5%, and 1% level, respectively. Huber–White standard errors are in parenthesis. Brackets contain the prop. of a standard
deviation change in the dependent variable brought about by a one standard deviation increase in private enrollment.a Calculated using test system information, data sources (1), (2), and (4), as described in Table A.1.b Variable comes from administrative information, data sources (8) and (9), and (10). Repetition is available only up to 1988.c Based on micro census data for 1982 (data source 16), and household survey data for 1990 and 1996 (sources 11 and 13).d Controls for previous trends are: the 1970–1982 change in average years of schooling (from census micro data, sources 15 and 16), the 1980–1982 change in private
enrollment (sources 7 and 8), and the 1978–1982 change in the proportion of schools private (sources 19 and 8).e Controls for concurrent trends are the 1982–1992 change in population (from data sources 17 and 18), and the 1982–1996 change in mean years of schooling and imputed
labor income among adults (from census and household survey information, sources 13 and 16).
C.-T
.Hsieh
,M.Urquiola
/JournalofPublic
Economics
90(2006)1477–1503
1489

C.-T. Hsieh, M. Urquiola / Journal of Public Economics 90 (2006) 1477–15031490
We have so far focused on the 1982–1988 period, since these were the years in which the
voucher program had the greatest effect. However, because it is possible that six years is not
enough time for the productivity effects of choice to be observed, panel B (Table 3) presents
estimates for the impact of the voucher program from 1982 to 1996. Measured by language
scores, math scores, and years of schooling (among 10–15 year old children), the impact of
the voucher program appears to have been even more negative over this longer time
period.28
5.3. Robustness check: instrumental variables
An alternative strategy to check for biases is to identify pre-existing commune characteristics
that explain the differential impact of vouchers. These can then be used as instruments for the
private enrollment growth after 1982, under the assumption that they are uncorrelated with
subsequent achievement changes. We use three instruments below. Our first two variables are the
urbanization rate and the population of a commune in 1982. These capture the effect of market size
on the extent of private entry. A third instrument is the inter-quartile range in years of schooling
observed among adults (also in 1982). We use this as a measure of heterogeneity. The idea is that if
parents consider peer group quality when choosing schools, then the demand for private schools
that are able to admit bgoodQ peer groups will be larger in less homogeneous communities.
Table 1 presents the first stage estimates from OLS regressions of the 1982–1988 change in
private enrollment shares on the three candidate instruments. As can be seen, all three are highly
correlated with the growth in private enrollment after 1982.29
As with any instruments, the estimates these variables yield have to be interpreted with
caution, if only because there is ultimately no way of guaranteeing the instruments’ validity. We
will present standard over-identification tests, but we cannot rule out the possibility that these
instruments are correlated with trends in unobserved determinants of academic outcomes, or that
our controls for trends do not capture such determinants. Nonetheless, a comparison of the IV
and the OLS estimates can provide us with a further sense of the direction of biases in our base
specifications.
With this in mind, Table 4 presents the IV results (Table A.2 in the appendix contains
the corresponding reduced form estimates). The instrumental variables are ordered across
columns, with the last ones presenting the combination of the three variables.30 In each case we
present two specifications, one without and one with the controls for the pre-existing and
concurrent trends introduced above. As the table shows, these estimates continue to suggest
that greater private growth resulted in lower achievement. In fact, the IV estimates suggest
that, if anything, the OLS estimates overstate the impact of the voucher program. Further, the
negative effects for years of schooling also become statistically significant. The only
exception arises when we use population as an instrument and the change in average language
scores as the outcome of interest. Further, our estimates are not affected when we introduce
controls for trends (with the same exception), and all the estimates comfortably pass a
28 We do not have repetition data for 1996.29 We also considered population density as a candidate for an instrumental variable. The results are qualitatively
similar, so we omit them for reasons of space.30 The samples vary according to the outcome measure because of the interaction of two factors: i) in the case of test
scores, the 1982 PER system did not cover all communes and, ii) in some of the household surveys, there are not enough
observations in some communes to estimate a reliable measure of several of the variables we use as proxies for pre-
existing and concurrent trends. We checked that our results are robust to changes in the sample of communes.
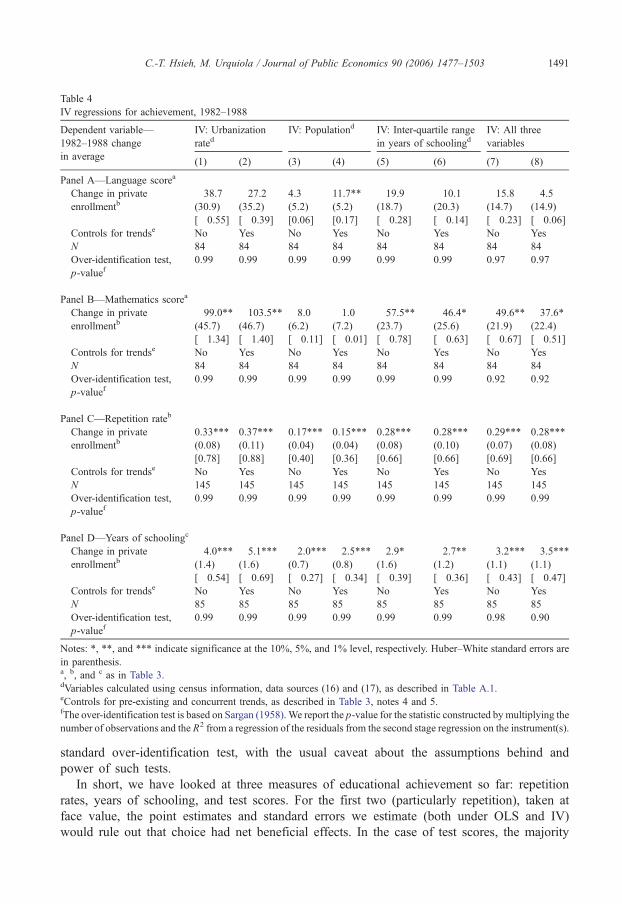
Table 4
IV regressions for achievement, 1982–1988
Dependent variable—
1982–1988 change
in average
IV: Urbanization
ratedIV: Populationd IV: Inter-quartile range
in years of schoolingdIV: All three
variables
(1) (2) (3) (4) (5) (6) (7) (8)
Panel A—Language scorea
Change in private
enrollmentb�38.7 �27.2 4.3 11.7** �19.9 �10.1 �15.8 �4.5(30.9) (35.2) (5.2) (5.2) (18.7) (20.3) (14.7) (14.9)
[�0.55] [�0.39] [0.06] [0.17] [�0.28] [�0.14] [�0.23] [�0.06]Controls for trendse No Yes No Yes No Yes No Yes
N 84 84 84 84 84 84 84 84
Over-identification test,
p-valuef0.99 0.99 0.99 0.99 0.99 0.99 0.97 0.97
Panel B—Mathematics scorea
Change in private
enrollmentb�99.0** �103.5** �8.0 �1.0 �57.5** �46.4* �49.6** �37.6*(45.7) (46.7) (6.2) (7.2) (23.7) (25.6) (21.9) (22.4)
[�1.34] [�1.40] [�0.11] [�0.01] [�0.78] [�0.63] [�0.67] [�0.51]Controls for trendse No Yes No Yes No Yes No Yes
N 84 84 84 84 84 84 84 84
Over-identification test,
p-valuef0.99 0.99 0.99 0.99 0.99 0.99 0.92 0.92
Panel C—Repetition rateb
Change in private
enrollmentb0.33*** 0.37*** 0.17*** 0.15*** 0.28*** 0.28*** 0.29*** 0.28***
(0.08) (0.11) (0.04) (0.04) (0.08) (0.10) (0.07) (0.08)
[0.78] [0.88] [0.40] [0.36] [0.66] [0.66] [0.69] [0.66]
Controls for trendse No Yes No Yes No Yes No Yes
N 145 145 145 145 145 145 145 145
Over-identification test,
p-valuef0.99 0.99 0.99 0.99 0.99 0.99 0.99 0.99
Panel D—Years of schoolingc
Change in private
enrollmentb�4.0*** �5.1*** �2.0*** �2.5*** �2.9* �2.7** �3.2*** �3.5***(1.4) (1.6) (0.7) (0.8) (1.6) (1.2) (1.1) (1.1)
[�0.54] [�0.69] [�0.27] [�0.34] [�0.39] [�0.36] [�0.43] [�0.47]Controls for trendse No Yes No Yes No Yes No Yes
N 85 85 85 85 85 85 85 85
Over-identification test,
p-valuef0.99 0.99 0.99 0.99 0.99 0.99 0.98 0.90
Notes: *, **, and *** indicate significance at the 10%, 5%, and 1% level, respectively. Huber–White standard errors are
in parenthesis.a, b, and c as in Table 3.dVariables calculated using census information, data sources (16) and (17), as described in Table A.1.eControls for pre-existing and concurrent trends, as described in Table 3, notes 4 and 5.fThe over-identification test is based on Sargan (1958). We report the p-value for the statistic constructed bymultiplying the
number of observations and the R2 from a regression of the residuals from the second stage regression on the instrument(s)
C.-T. Hsieh, M. Urquiola / Journal of Public Economics 90 (2006) 1477–1503 1491
.
standard over-identification test, with the usual caveat about the assumptions behind and
power of such tests.
In short, we have looked at three measures of educational achievement so far: repetition
rates, years of schooling, and test scores. For the first two (particularly repetition), taken at
face value, the point estimates and standard errors we estimate (both under OLS and IV)
would rule out that choice had net beneficial effects. In the case of test scores, the majority

A.
1999
1970-1 -.5 0 .5 1
-1
-.5
0
.5
1
IRN
CHL
THA
NLD
ITA
FINBELGBR
USA NZL
AUSHUN JPN
B. Residual Median Test Scores (standard deviation from 13-country average)
1999
1970-1 -.5 0 .5 1
-1
-.5
0
.5
1
ITA
IRNBEL
NZLTHAGBR
CHL
HUNNLD
USA
AUSFIN
JPN
Median Test Scores (standard deviation from 13-country average).
Fig. 4. Chile’s performance in international tests, 1970 and 1999. (Note: The scores for each country subtract the mean
score for the 13 countries and are divided by the standard deviation of U.S. scores in the given year. Residual test scores
are residuals from regression of median test score on GDP/worker, enrollment rate, and ratio of spending per student to
GDP per capita).
C.-T. Hsieh, M. Urquiola / Journal of Public Economics 90 (2006) 1477–15031492
of our point estimates are indicative of a negative effect on outcomes, but a 95% confidence
interval around many of them would still include substantial positive effects. Partially in light
of this, in the next section we look at a couple of further robustness checks.
5.4. Robustness check: international and sectoral comparisons
An alternative manner to determine whether school choice improved schooling quality in
Chile is to measure the country’s performance in international tests in math and science, widely
known as the TIMSS. This is possible because Chile participated in the TIMSS in 1999, and in
its precursor, the IEA, in 1970. While international comparisons should always be interpreted
with caution, in this case they have the advantage of not relying on the differential impact of
vouchers across different markets within Chile. We summarize the results graphically in Fig. 4.
Panel A shows that during the last three decades, the score of the median Chilean student did not

-1.60
-1.40
-1.20
-1.00
-0.80
-0.60
-0.40
-0.20
0.001982 1996
math spanish
Fig. 5. Average test score among municipal and voucher schools, relative to tuition-charging private schools, 1982 and
1996 (Standard deviations below tuition charging).
C.-T. Hsieh, M. Urquiola / Journal of Public Economics 90 (2006) 1477–1503 1493
change relative to that of the median student in the other 12 countries that also participated in
both years.31 This is all the more surprising since Chile’s economy has performed quite well over
the last two decades.32 In fact, when one introduces controls for per capita income growth, and
changes in enrollment rates and school spending, the performance of the median Chilean student
appears to have slightly worsened over the last 30 years (panel B).33
A final way to measure whether average school quality has improved is to use the average test
scores from the PER and SIMCE. Clearly, it would not make much sense to compare the change in
average test scores, since we have no way of knowing that the tests are comparable over time.
However, since the tuition-charging private schools were plausibly unaffected by the voucher
program, we can use these schools as a control and measure the gap between the test scores of the
elite private schools and those of publicly funded (voucher and public) institutions. This evidence,
presented in Fig. 5, similarly provides no indication that vouchers improved outcomes in the schools
they affected. Here the data show a well-known feature of the Chilean education system, namely the
large gap in test scores between the subsidized (voucher and municipal) sector and the tuition-
charging private schools. In 1982 the average score of the publicly funded schools is about 1.3
standard deviations below the elite private schools. By 1996, this gap had actually become larger.34
31 The unit is the standard deviation of U.S. students taking the TIMSS in 1970 and 1999.32 From 1970 to 1999, per capita GDP grew at an annual rate of 4.3% in Chile and at average annual rate of 2.8% in the
other 12 countries (authors’ calculations using the International Financial Statistics).
34 In part, as we discuss in the next section, this in itself may be capturing some sorting, since the tuition-charging
private sector did grow significantly (although from a small base) during this period, presumably bcream skimmingQ some
students from voucher and even municipal schools.
33 The cross-sectional data tells a similar story. For example, the math score of the median Chilean student on the 1999
TIMSS was 1.08 standard deviations below that of the average student in the other 38 countries, while the science score
was 0.7 standard deviations lower (again, the unit is the standard deviation of the U.S. in 1999). After controlling for
GDP per worker, school spending (per student relative to per capita GDP), and enrollment rates, the bresidualQ score ofthe median Chilean student was 0.78 standard deviations below that of 38 other countries in math and 0.33 standard
deviations lower in science. We took the figures on GDP per worker from the Penn World Tables and those on school
spending and enrollment rates from UNESCO’s yearbook.
C.-T. Hsieh, M. Urquiola / Journal of Public Economics 90 (2006) 1477–15031494
5.5. Sorting
We now turn to the effect of the voucher program on sorting. We begin by describing the
relation between a commune’s private enrollment rate, on the one hand, and the ratio between
the average bqualityQ of its public school students and the commune-wide average, on the other.
Note that the latter variable is a within-commune observation—it does not compare public
school students in one commune with those in a different market. The idea is that if private
schools cream skim, then this measure should fall with private enrollment.
Panel A in Table 5 first looks at the cross sectional evidence. The dependent variable in
columns 1 and 2 is the ratio of the educational background of public school students to the
average in the community (for 1996). This data is based on an index of the educational
background of each school, provided by the Ministry of Education. This measure is crude,
but the estimates are nonetheless precisely estimated, and suggest that the relative educational
attainment of parents in public schools is lower in communes with higher private
enrollment.35 Using more detailed household survey data on parental income for 1990/1992,
columns 3 and 4 suggest a similar conclusion. The point estimates are again precisely estimated
and quite large: they suggest that a one standard deviation increase in the private enrollment rate
is associated with 38–43% of a standard deviation decline in the relative income of public school
parents.
Building on this evidence, columns 5–10 turn to indirect measures of sorting, namely the
ratios of the average performance (on test scores and repetition) of public school students and the
average in the entire commune. These are indirect measures, because they are a function of three
effects: sorting, the productivity advantage of private schools, and the public productivity
response. First, if private schools take the best students from the public sector, the sorting effect
suggests that the relative test scores (or relative repetition rates) of public schools should be
lower (higher) in communes with greater private sector penetration.
Second, if private schools are better than public schools, then even in the absence of
sorting, the mere reallocation of students to the private sector will raise average test scores,
and thus lower the relative position of the public sector. Third, as for the public response,
there are effects going in opposite directions. On the one hand, if public schools improve by
more in communes with more competition from the private sector, then the relative grades of
public schools should be higher in communes with greater private enrollment. On the other
hand there is the possibility of endogenous entry: if the private sector grew by more in
communes where public schools were under-performing (prior to the voucher program), then
this would suggest that the relative grades of public schools should be lower in communes
with a larger private enrollment rate.36
In the event, the estimates in columns 5–10 uniformly indicate that when measured by math
scores, language scores, and repetition rates, public schools do worse in communes with a higher
private enrollment rate. All the estimates are precisely estimated, are robust to the introduction of
controls for community characteristics, and suggest that the private enrollment rate has a first
35 For each variable featured in Panel A, we present results using the most recent cross-section in our data. However, we
obtain very similar estimates using the cross-sections from other years. For instance, for the 1988 and 1990 cross-
sections, the point estimates in columns 1 and 2 are �0.15 and �0.15, and �0.16 and �0.14, respectively. In every case
these are significant at the 5% or 1% level (these results are available upon request). Similar robust findings emerge for
the math and language results we discuss below. For income, 1990/1992 is the only cross-section for which we matched
household survey and school level data.36 These points are set out more formally in Hsieh and Urquiola (2003).
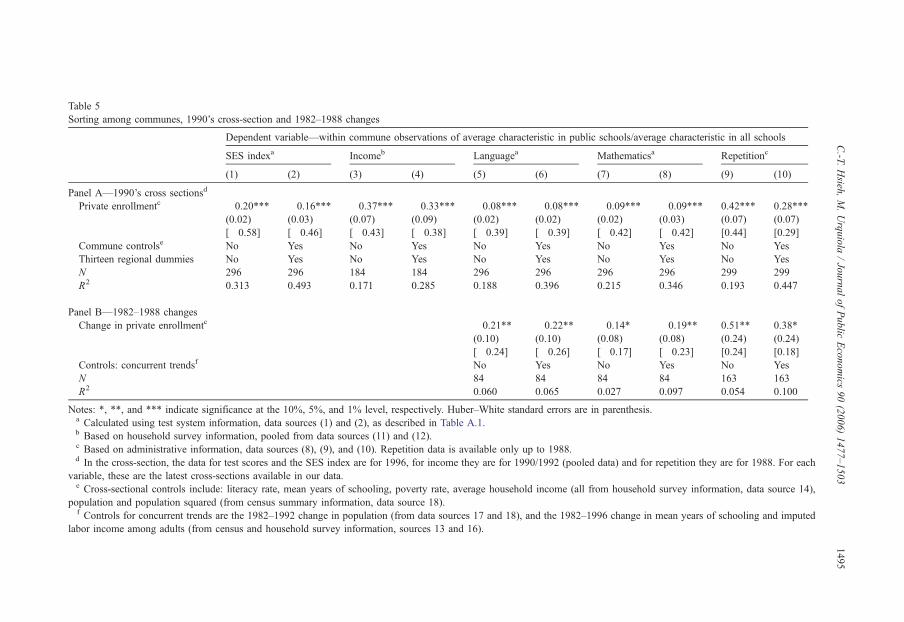
Table 5
Sorting among communes, 1990’s cross-section and 1982–1988 changes
Dependent variable—within commune observations of average characteristic in public schools/average characteristic in all schools
SES indexa Incomeb Languagea Mathematicsa Repetitionc
(1) (2) (3) (4) (5) (6) (7) (8) (9) (10)
Panel A—1990’s cross sectionsd
Private enrollmentc �0.20*** �0.16*** �0.37*** �0.33*** �0.08*** �0.08*** �0.09*** �0.09*** 0.42*** 0.28***
(0.02) (0.03) (0.07) (0.09) (0.02) (0.02) (0.02) (0.03) (0.07) (0.07)
[�0.58] [�0.46] [�0.43] [�0.38] [�0.39] [�0.39] [�0.42] [�0.42] [0.44] [0.29]
Commune controlse No Yes No Yes No Yes No Yes No Yes
Thirteen regional dummies No Yes No Yes No Yes No Yes No Yes
N 296 296 184 184 296 296 296 296 299 299
R2 0.313 0.493 0.171 0.285 0.188 0.396 0.215 0.346 0.193 0.447
Panel B—1982–1988 changes
Change in private enrollmentc �0.21** �0.22** �0.14* �0.19** 0.51** 0.38*
(0.10) (0.10) (0.08) (0.08) (0.24) (0.24)
[�0.24] [�0.26] [�0.17] [�0.23] [0.24] [0.18]
Controls: concurrent trendsf No Yes No Yes No Yes
N 84 84 84 84 163 163
R2 0.060 0.065 0.027 0.097 0.054 0.100
Notes: *, **, and *** indicate significance at the 10%, 5%, and 1% level, respectively. Huber–White standard errors are in parenthesis.a Calculated using test system information, data sources (1) and (2), as described in Table A.1.b Based on household survey information, pooled from data sources (11) and (12).c Based on administrative information, data sources (8), (9), and (10). Repetition data is available only up to 1988.d In the cross-section, the data for test scores and the SES index are for 1996, for income they are for 1990/1992 (pooled data) and for repetition they are for 1988. For each
variable, these are the latest cross-sections available in our data.e Cross-sectional controls include: literacy rate, mean years of schooling, poverty rate, average household income (all from household survey information, data source 14),
population and population squared (from census summary information, data source 18).f Controls for concurrent trends are the 1982–1992 change in population (from data sources 17 and 18), and the 1982–1996 change in mean years of schooling and imputed
labor income among adults (from census and household survey information, sources 13 and 16).
C.-T
.Hsieh
,M.Urquiola
/JournalofPublic
Economics
90(2006)1477–1503
1495

C.-T. Hsieh, M. Urquiola / Journal of Public Economics 90 (2006) 1477–15031496
order effect on the relative performance of public schools. For example, a simple bivariate OLS
regression suggests that a one-standard deviation increase in the private enrollment rate lowers
the relative math score of public schools by about 40% of a standard deviation.
Again, we want to emphasize that the relative performance of public schools is only an
indirect measure of sorting. As we discussed, there are two reasons why the relative performance
of public schools would be lower in communes with a higher private enrollment rate. First, it
might be the case that the public sector improves in response to the competition induced by
private entry. Second, it could also be that private schools are better and the reallocation of
students towards this sector raises average test scores. As we discussed, when choice also results
in sorting, the proper way to measure whether these two productivity effects are present is to
look at aggregate measures of achievement, and the evidence we presented in the previous
section suggests that these productivity effects are not there.
Nonetheless, we cannot rule out that these results may be influenced by the endogenous entry
of private schools in communes where public schools are weakest. One way to deal with this is
to again difference out fixed commune characteristics by looking at changes over time. We do
this in panel B with regressions of the 1982–1988 change in the relative bqualityQ of publicschools (again measured by language and math scores, and by the repetition rate) and the change
in the private enrollment rate. These estimates indicate that the composition effect of choice
seems to dominate any effect of competition on the public schools’ productivity. Although not as
precisely estimated as the cross-sectional estimates, they are generally statistically significant
and indicate that the relative bqualityQ of public schools has worsened in communes where
private enrollment grew by more.37
For completeness, we again use the urbanization rate, population, and the interquartile range
in years of schooling (of working age adults) as instruments for the differential impact of the
voucher program. Table 6 presents these results (the reduced form estimates are in Table A.3).
These estimates provide further evidence that the main effect of school choice in Chile has been
to facilitate greater sorting. In fact, the IV estimates generally indicate that choice led to more
sorting than that suggested by the OLS estimates.
In sum, there are two points we take away from this evidence. First, private schools attracted
students from families with higher levels of income and schooling. Second, because these
characteristics are important determinants of educational outcomes, it will be virtually
impossible to isolate whether public schools improved in response to the competitive forces
unleashed by the private sector. As our estimates show, the relative grades of public school
students fell by more in communes with a larger increase in private enrollment. This does not
necessarily imply that public schools did not improve—it simply indicates that if a productivity
effect is present, it is overwhelmed by the sorting effect.
We note that our findings are consistent with the only two studies that we are aware of that
measure the consequences of comprehensive school choice on sorting. Although they do not
have the data to assess the effect on educational productivity, Fiske and Ladd’s (2000) analysis
of the open-enrollment program among public schools in New Zealand suggests that a major
effect of choice has been to induce greater segregation. A second study, by Berry Cullen et al.
(2005), on Chicago’s open-enrollment program at the high school level, also suggests that the
37 We do not have data on sorting over time based on income measures, since the 1982 population census does not
identify whether a child is enrolled in a public or a private school (this information is only contained in the CASEN
household survey, which is available starting in 1987). We also do not use the SES index, since the way in which it is
calculated has changed over the years.

Table 6
IV regressions for sorting, 1982–1988
Dependent variable—change in
average characteristic in public schools/
average characteristic in all schools
IV: Urbanization
rateaIV: Populationa IV: Inter-quartile range
in years of schoolingaIV: All three
variables
(1) (2) (3) (4) (5) (6) (7) (8)
Panel A: Language scoreb
Change in private enrollmentc �1.04** 1.54* �0.16*** �0.16*** �0.58** �0.78* �0.50** �0.57*(0.51) (0.91) (0.06) (0.06) (0.29) (0.40) (0.23) (0.30)
[�1.21] [�1.79] [�0.19] [�0.19] [�0.67] [�0.91] [�0.58] [�0.66]Controls: concurrent trendsd No Yes No Yes No Yes No No
N 84 84 84 84 84 84 84 84
Over-identification test, p-valuee 0.99 0.99 0.99 0.99 0.99 0.99 0.99 0.99
Panel B: Math scoreb
Change in private enrollmentc �0.69** �1.01* �0.07 �0.08* �0.61** �0.73* �0.42** �0.45*(0.31) (0.59) (0.06) (0.05) (0.24) (0.38) (0.18) (0.26)
[�0.83] [�1.22] [�0.09] [�0.10] [�0.74] [�0.88] [�0.51] [�0.55]Controls: concurrent trendsd No Yes No Yes No Yes No No
N 84 84 84 84 84 84 84 84
Over-identification test, p-valuee 0.99 0.99 0.99 0.99 0.99 0.99 0.99 0.99
Panel C: Repetition ratec
Change in private enrollmentc 1.62*** 1.71** 0.50*** 0.47*** 0.63 0.54 1.03** 0.88**
(0.46) (0.66) (0.14) (0.15) (0.39) (0.44) (0.33) (0.34)
[0.75] [0.79] [0.23] [0.22] [0.24] [0.25] [�0.39] [�0.33]Controls: concurrent trendsd No Yes No Yes No Yes No No
N 163 163 163 163 163 163 163 163
Over-identification test, p-valuee 0.99 0.99 0.99 0.99 0.99 0.99 0.99 0.99
Notes: *, **, and *** indicate significance at the 10%, 5%, and 1% level, respectively. Huber–White standard errors are in parenthesis.a Based on census summary and micro information, data sources (16) and (17), as described in Table A.1.b Calculated using test score information, data sources (1) and (2).c Variable based on administrative information, data sources (8) and (9).d Controls for concurrent trends are the 1982–1992 change in population (from data sources 17 and 18), and the 1982–1996 change in mean years of schooling and imputed
labor income among adults (from census and household survey information, sources 13 and 16).e The overidentification test is based on Sargan (1958). We report the p-value for the statistic constructed by multiplying the number of observations and the R2 from a
regression of the residuals from the second stage regression on the instrument(s).
C.-T
.Hsieh
,M.Urquiola
/JournalofPublic
Economics
90(2006)1477–1503
1497

C.-T. Hsieh, M. Urquiola / Journal of Public Economics 90 (2006) 1477–15031498
main effect has been to induce segregation, without any evidence of increased academic
outcomes (except for career academies).
Finally, we have focused on sorting between the public and the private voucher schools, but the
sorting that took place is clearly more complicated. For example, as previously discussed, the new
private voucher schools generally attracted students from lower SES backgrounds than those in
incumbent institutions. This suggests that it was largely the entrants, and not the incumbents, that
were attracting students from the public schools. To take another example, the gradual growth of
the private tuition-charging school in the 1990s could also reflect bcream skimmingQ, albeit fromthe private voucher schools. Consistent with this, there is evidence that the gap in the
socioeconomic background of students in the private elite schools and the publicly funded
schools narrowed from 1987 to 1998.38 This is consistent with a story in which the SES of students
who switch to the elite private schools is higher than the average SES in the publicly funded sector,
but lower than that in the elite schools, and thus lowers the average SES in both sectors.
6. When schools compete, how do they compete?
In sum, the central effect of the school voucher program in Chile appears to have been to
facilitate the exodus of the Chilean middle class from public schools, without much evidence
that it has improved aggregate academic outcomes. While it is not surprising that choice could
result in sorting, what accounts for the surprising lack of improvement on achievement?
One possibility, often raised by Chilean observers, is that public schools may in fact not have
experienced significant incentives to compete. We presented evidence consistent with this view
in Fig. 3, which suggested that few public schools have been forced to close. In addition, Chilean
authorities might not have provided enough information for parents to determine a school’s
quality. It was only after 1995 that the authorities made test scores widely available, and
newspapers began publishing school rankings based on these.
Nonetheless, even if the public schools were not forced to compete and thus did not improve, as
long as private schools aremore productive than public schools, we should still see better aggregate
performance given the large number of students that transferred to the private sector, andwe simply
find no evidence of this. What can account for the lack of a private productivity advantage?
One possibility is that private schools responded to the competitive pressures unleashed by
the voucher program, not by raising their productivity, but rather by choosing better students.
School administrators in Chile, as in the rest of the world, can raise their schools’ outcomes by
doing things such as identifying and hiring effective teachers, and then supporting and
monitoring their work; but they also realize that this is costly and may not always work. In
contrast, it is easier to improve outcomes simply by picking the best students. Parents can also be
willing participants in this, and their demand for good peer groups obviously reinforces the
desire of school administrators to cream skim.39
In fact, there is abundant institutional evidence that in Chile, private schools do compete by
attempting to select better students. As previously mentioned, private schools are allowed to
reject students, and Gauri (1998) presents evidence that the majority of them do exercise this
39 For suggestive evidence of this in the U.S., see Rothstein (2004).
38 We use the national household survey (CASEN) to measure student characteristics in the private elite schools and in the
publicly funded sector (voucher and municipal schools). This indicates that the average years of schooling of parents in the
private elite schools was 4.49 years (S.E.: 0.08) higher than in the publicly funded schools in 1987, but this gap had fallen
to 2.65 years (S.E.: 0.06) by 1998. When measured by income, the gap between private elite school parents and publicly
funded school parents also narrowed, from 0.969 log points (S.E.: 0.018) in 1987 to 0.655 log points (S.E.: 0.015) by 1998.

C.-T. Hsieh, M. Urquiola / Journal of Public Economics 90 (2006) 1477–1503 1499
ability, screening children either by requiring a parental interview, or by using admissions tests.
Chilean observers have also pointed out that new voucher schools have sought to attract students
by endowing themselves with bsymbolsQ previously associated only with elite, tuition-charging
institutions, such as uniforms, and the use of foreign and particularly English names.40
7. Conclusion
This paper makes two contributions to the school choice debate. First, we make the point
that if choice leads to greater segregation, one will not able to isolate the extent to which
public schools improve their productivity in response to the competitive threat induced by
choice, from the effect of sorting on the public sector’s performance. On the one hand, if
choice results in cream-skimming (as we suggest happened in Chile), the average
performance of public schools might fall even if they become more effective, simply
because they have lost their best students. On the other hand, if low SES students leave the
public sector, as Bettinger (1999) suggests happened in Michigan with charter school entry,
then the average performance of public schools might improve even if they do not raise their
productivity. We argue that the best one can do is to measure changes in outcomes at the
aggregate level.
Second, we focus on a country that implemented an unrestricted nationwide school choice
program. We show that the first order consequence of the voucher program in Chile was
middle-class flight into private schools, and that this shift does not seem to have resulted in
achievement gains, certainly not of the magnitude claimed by some choice advocates. Again,
we cannot rule out the possibility that our estimates are biased by unobserved trends in
schooling outcomes, but we show that our results do not change when we introduce a number
of controls for such trends.
We want to make three points clear. First, we are not claiming that vouchers have not
produced any gains at all. It might be the case, for instance, that after twenty years of choice,
Chilean schools are spending their money in ways that parents value more. For instance, they
may now be emphasizing freshly painted walls more than reduced teaching loads. Additionally,
many families surely value the availability of subsidized religious instruction. In short, school
choice might improve welfare even if it does not improve academic achievement.
Second, it should be clear that the underlying institutions and the precise details of the
program implemented are critically important in thinking about the potential impacts of school
choice. For instance, a choice program in a decentralized schooling system, such as that in the
U.S., is likely to result in a different type of sorting. Additionally, choice programs that do not
allow private schools to select their students, or those that provide incentives to schools that
attract low SES children, might result in less sorting than we find. Finally, it is possible that a
choice program in a school system where private schools are less important than was the case
in Chile in the early 1980s may see a smaller response from the private sector.
Third, we interpret the Chilean evidence as providing strong support for the notion that
schools do respond to incentives. The key question is incentives for what? It seems that if
schools are provided with incentives to improve their absolute outcomes, and are also
allowed to choose their student body, they are likely to respond by attempting to select better
students. This should not be surprising to those familiar with elite universities, since an
40 See Espınola (1993).

C.-T. Hsieh, M. Urquiola / Journal of Public Economics 90 (2006) 1477–15031500
integral part of the perceived quality of these institutions is their ability to skim the very best
students. While there are enormous rewards for the institutions that succeed in this endeavor,
from a societal perspective it may be a zero-sum game, since one school’s selectivity gain is
another’s loss. Therefore, an important topic for further research is the design of mechanisms
that would preserve the competitive effects of vouchers, but force schools to improve by
raising their value added, and not by engaging in rent-seeking behavior.41
Acknowledgement
For useful comments, we thank Harold Alderman, Roland Benabou, Julian Betts, Eric
Bettinger, Stephen Coate, Angus Deaton, Milton Friedman, Varun Gauri, Roger Gordon,
James Heckman, Patrick McEwan, Derek Neal, Lant Pritchett, Pilar Romaguera, Richard
Romano, Cecilia Rouse, Norbert Schady, Ernesto Schiefelbein, and particularly David Card,
Ken Chay, Darren Lubotsky, Enrico Moretti, and an anonymous referee. Marco Galvan and
Lottos Gutierrez provided outstanding research assistance. We thank Dante Contreras, Patrick
McEwan, the Chilean Ministries of Education and Planning, and the National Statistics
Institute for providing data. We worked on this project while at the World Bank’s
Development Research Group (Hsieh as a visitor and Urquiola as staff), and are grateful
for its hospitality. The Smith-Richardson Foundation provided generous financial support. This
paper previously circulated under the title bWhen schools compete, how do they compete? An
assessment of Chile’s nationwide voucher programQ.
Appendix A
Table A.1
Data sources
Data type and source Original unit of
observation
Year
1970 1978 1980 1982 1988 1990 1992 1996 1998 1999
Test scores
PERa School (1)
SIMCEb School (2) (3) (4)
TIMSSc Country (5)
International science examsd Country (6)
Administrative information
Enrollment files School (7) (8) (9) (10)
Household surveys
CASENe Individual (11) (12) (13) (14)
Census
Micro data Individual (15) (16)
Summary files Commune (17) (18)
Other
School mapsf Commune (19)
a Programa de Evaluaciœn del Rendimiento Escolar.b Sistema de Evaluaciœn de Calidad de la Educacion.c Third International Mathematics and Science Study, see http://timss.bc.edu.d International Science Exams, International Education Association, see Comber and Keeves (1973).e Encuesta de Caracterizacion Socioeconomica Nacional.
f See Instituto Geografico Militar (1983).41 See for instance Epple and Romano (2002).

Table A.2
Reduced form regressions for achievement, 1982–1988
Dependent variable—
1982–88 change in
Independent variable—1982 observation of
Urbanization ratea Populationa Inter-quartile range in
years of schoolinga
(1) (2) (3) (4) (5) (6)
Private enrollmentb 0.09*** 0.08*** 0.44*** 0.42*** 0.19*** 0.19***
(0.03) (0.03) (0.07) (0.07) (0.04) (0.05)
[0.32] [0.28] [0.31] [0.30] [0.38] [0.38]
Controls for trendsc No Yes No Yes No Yes
N 84 84 84 84 84 84
R2 0.101 0.222 0.091 0.238 0.150 0.281
Average language scored �3.5 �2.2 1.9 5.0** �3.8 �1.9(2.4) (2.8) (2.2) (2.2) (3.5) (3.8)
[�0.18] [�0.11] [0.02] [0.05] [�0.11] [�0.06]Controls for trendsc No Yes No Yes No Yes
N 84 84 84 84 84 84
R2 0.031 0.113 0.000 0.105 0.012 0.106
Average Math scored �9.0*** �8.2*** �3.5 �0.4 �11.0**** �8.8**(2.2) (2.4) (3.0) (3.1) (3.6) (4.0)
[�0.43] [�0.39] [�0.03] [�0.00] [�0.30] [�0.24]Controls for trendsc No Yes No Yes No Yes
N 84 84 84 84 84 84
R2 0.182 0.277 0.001 0.144 0.091 0.194
Average repetition rateb 0.04*** 0.04*** 0.09** 0.08** 0.06*** 0.06***
(0.01) (0.01) (0.04) (0.04) (0.02) (0.02)
[0.34] [0.34] [0.09] [0.08] [0.26] [0.26]
Controls for trendsc No Yes No Yes No Yes
N 145 145 145 145 145 145
R2 0.119 0.151 0.009 0.078 0.085 0.122
Mean years of schoolinge �0.5*** �0.7*** �1.0** �1.2** �0.8** �0.7**(0.2) (0.2) (0.5) (0.5) (0.3) (0.3)
[�0.26] [�0.37] [�0.09] [�0.11] [�0.22] [�0.19]Controls for trendsc No Yes No Yes No Yes
N 85 85 85 85 85 85
R2 0.077 0.326 0.007 0.239 0.043 0.261
Notes: *, **, and *** indicate significance at the 10%, 5%, and 1% level, respectively. Huber–White standard errors are
in parenthesis. Brackets contain the proportion of a standard deviation change in the dependent variable brought about by
a one standard deviation increase in the private enrollment rate.a Based on census summary and micro information, data sources (16) and (17), as described in Table A.1.b Calculated using administrative information, data sources (8) and (9).c Controls for pre-existing and concurrent trends, as described in Table 3, notes 4 and 5.d Based on test score information, data sources (1) and (2).e Calculated using census and household survey information, data sources (16) and (11).
C.-T. Hsieh, M. Urquiola / Journal of Public Economics 90 (2006) 1477–1503 1501

Table A.3
Reduced form regressions for sorting, 1982–1988
Dependent variable—
1982–88 change in
Independent variable:
Urbanization ratea Populationa Inter-quartile range in
years of schoolinga
(1) (2) (3) (4) (5) (6)
Private enrollmentb 0.08** 0.06** 0.44*** 0.41*** 0.16*** 0.15***
(0.03) (0.03) (0.05) (0.05) (0.04) (0.04)
[0.31] [0.23] [0.33] [0.31] [0.36] [0.34]
Controls: concurrent trendsc No Yes No Yes No Yes
N 84 84 84 84 84 84
R2 0.104 0.183 0.110 0.228 0.138 0.220
Sorting measure for Languaged,e �0.09*** �0.10*** �0.07** �0.06** �0.09** �0.11**(0.03) (0.03) (0.03) (0.03) (0.04) (0.05)
[�0.40] [�0.45] [�0.06] [�0.05] [�0.24] [�0.29]Controls: concurrent trendsc No Yes No Yes No Yes
N 84 84 84 84 84 84
R2 0.151 0.171 0.004 0.011 0.062 0.080
Sorting measure for Mathd,e �0.06*** �0.06** �0.03 �0.03 �0.10*** �0.11**(0.02) (0.03) (0.02) (0.02) (0.04) (0.05)
[�0.28] [�0.28] [�0.02] [�0.03] [�0.28] [�0.30]Controls: concurrent trendsc No Yes No Yes No Yes
N 84 84 84 84 84 84
R2 0.073 0.128 0.001 0.052 0.076 0.120
Sorting measure for repetitionb,d 0.17*** 0.14*** 0.28** 0.07 0.25** 0.09
(0.04) (0.05) (0.11) (0.10) (0.08) (0.07)
[0.31] [0.26] [0.03] [0.02] [0.11] [0.09]
Controls No Yes No Yes No Yes
N 163 163 163 163 163 163
R2 0.100 0.130 0.003 0.076 0.014 0.080
Notes: *, **, and *** indicate significance at the 10%, 5%, and 1% level, respectively. Huber–White standard errors are
in parenthesis. Brackets contain the proportion of a standard deviation change in the dependent variable brought about by
a one standard deviation increase in the private enrollment rate.a Based on census summary and micro information, data sources (16) and (17), as described in Table A.1.b Based on administrative information, data sources (8) and (9).c Controls for concurrent trends are the 1982–1992 change in population (data sources 17 and 18), and the 1982–1996
change in mean years of schooling among adults, and imputed labor income (from census and household survey
information, sources 13 and 16).d The sorting measure is: average characteristic in public schools/average characteristic in all schools.e Based on test score information, data sources (1) and (2).
C.-T. Hsieh, M. Urquiola / Journal of Public Economics 90 (2006) 1477–15031502

C.-T. Hsieh, M. Urquiola / Journal of Public Economics 90 (2006) 1477–1503 1503
References
Bettinger, E., 1999. The Effect of Charter Schools on Charter Students and Public Schools. National Center for the Study
of Privatization in Education. Teachers College, Columbia University. Occasional Paper No. 4.
Berry Cullen, J., Jacob, B., Levitt, S., 2005. The impact of school choice on student outcomes: an analysis of the Chicago
public schools. Journal of Public Economics 5–6, 729–760.
Comber, L., Keeves, J., 1973. Science Education in Nineteen Countries: International Studies in Evaluation I. John Wiley
for the International Association for the Evaluation of Educational Achievement, New York.
Epple, D., Romano, R., 1998. Competition between private and public schools, vouchers, and peer group effects.
American Economic Review 88 (1), 33–62.
Epple, D., Romano, R., 2002. Educational vouchers and cream skimming. NBER Working Paper 9354.
Espınola, V., 1993. The educational reform of the military regime in Chile: The school system’s response to competition,
choice, and market relations. Ph.D. dissertation, University of Wales College Cardiff.
Fiske, E., Ladd, H., 2000. When Schools Compete: A Cautionary Tale. Brookings Institution, Washington, D.C.
Gauri, V., 1998. School Choice in Chile: Two Decades of Educational Reform. University of Pittsburgh Press, Pittsburgh.
Hoxby, C., 2003. School choice and school productivity: could school choice be a tide that lifts all boats? In: Hoxby, C.
(Ed.), The Economics of School Choice. University of Chicago Press, Chicago, IL. for the NBER.
Hsieh, C., Urquiola, M., 2003. When schools compete, how do they compete? An assessment of Chile’s nationwide
voucher program. NBER Working Paper 10008.
Instituto Geografico Militar, 1993. Atlas de la Republica de Chile. Instituto Geografico Militar, Santiago.
Ladd, H., 2002. School vouchers: a critical view. Journal of Economic Perspectives 16 (4), 3–24.
Manski, C., 1992. Educational choice (vouchers) and social mobility. Economics of Education Review 11 (4), 351–369.
McEwan, P., 2000. The effectiveness of public, catholic, and non-religious private schools in Chile’s voucher system.
Education Economics 9 (2), 103–128.
McEwan, P., Carnoy, M., 2000. The effectiveness and efficiency of private schools in Chile’s voucher system.
Educational Evaluation and Policy Analysis 22, 213–239.
Neal, D., 2002. How vouchers could change the market for education. Journal of Economic Perspectives 16 (4), 25–44.
Rothstein, J., 2004. Good principals or good peers? Parental valuation of school characteristics, Tiebout equilibrium, and
the incentive effects of competition among jurisdictions. NBER Working Paper 10666.
Sargan, J.D., 1958. The estimation of economic relationships using instrumental variables. Econometrica 26 (3),
393–415.
Schiefelbein, E., 1971. El financiamiento de la educacion particular en Chile: Problemas y alternativas de solucion,
Mimeo, CIDE.