quarterly journal of economicsfaculty.chicagobooth.edu/chang-tai.hsieh/research/qje oil for...
TRANSCRIPT

DID IRAQ CHEAT THE UNITED NATIONS?UNDERPRICING, BRIBES, AND THE
OIL FOR FOOD PROGRAM*
CHANG-TAI HSIEH AND ENRICO MORETTI
From 1997 through 2003, the UN Oil for Food Program allowed Iraq to exportoil for humanitarian supplies. We hypothesize that Iraq deliberately set the priceof its oil below market prices to solicit bribes from oil buyers. By comparing theprice gap between Iraqi oil and its close substitutes during the Program to the gapprior to the Program, we find evidence of significant underpricing. Our centralestimate suggests that Iraq collected $1.3 billion in bribes from underpricing itsoil, or 2 percent of oil revenues. Underpricing is higher during periods of highvolatility in oil markets—when detection is more difficult—but declines after theUN limited Iraq’s ability to set the price of its oil.
I. INTRODUCTION
In response to Iraq’s invasion of Kuwait, the United Nationsimposed an embargo on exports of Iraqi oil. To alleviate theeconomic hardship caused by the embargo, the UN created the Oilfor Food program that allowed Iraq to export oil in exchange forhumanitarian goods, largely food and medicine. The proceedsfrom the oil exports had to be deposited in an escrow accountcontrolled by the UN and could only be used to purchase humani-tarian supplies.
By some measures, the Oil for Food program was the largesthumanitarian relief program in world history. By the time theprogram ended in 2003, the Oil for Food program had provided$32 billion in humanitarian supplies to Iraq. This makes the Oilfor Food program about 40 percent of the size of the MarshallPlan in absolute terms, and almost five times larger than theMarshall Plan on a per capita basis. There is evidence that thehumanitarian supplies provided by the program significantly im-proved the standards of living of Iraq’s civilian population (espe-cially children) during a period of severe need.1
* We thank Steven Davis, Stefano DellaVigna, Raymond Fisman, RichardGilbert, John Fawcett, Frank Hydoski, Alan Krueger, Charles Jones, MauriceLorenz, Edward Miguel, Mary Jane Schirber, and three referees for helpfulcomments. We are grateful to Eric Chaney, Emily Conover, Daniel Hartley,Bing-ru Teh, and Matthew Wiswall for superb research assistance. Hsieh thanksthe Alfred P. Sloan Foundation for financial support.
1. For example, during the years of the program, chronic malnutrition amongchildren and the overall incidence of vaccine-preventable diseases declinedsharply [FAO and WFP 2003].
© 2006 by the President and Fellows of Harvard College and the Massachusetts Institute ofTechnology.The Quarterly Journal of Economics, November 2006
1211

While an important goal of the Oil for Food program was toprovide humanitarian assistance, the UN was also keen to pre-vent Iraq from obtaining resources that might be used to pur-chase weapons or luxury goods. However, two key features of theOil for Food program potentially made it possible for Iraq toextract cash bribes and political favors from the oil buyers. First,Iraq could freely choose the buyers of Iraqi oil. Second, untilSeptember 2001, Iraq had some discretion over the selling price ofits oil. Therefore, particularly during periods of high oil marketvolatility, Iraq potentially was able to deliberately set the price ofits oil below market prices and then choose buyers that werewilling to pay bribes to obtain the underpriced oil.
The objective of this paper is to measure these bribes.Clearly, because of its illicit nature, finding direct evidence of thealleged cash payments and political favors—a paper trail, forexample—is difficult. On the basis of documents provided byIraq’s oil company, the CIA, and a commission headed by PaulVolcker estimate that Iraq received $230 million in cash bribesthrough the strategic underpricing of its oil [CIA 2004; IIC2005b]. However, this figure may be an underestimate since itdoes not capture the monetary value of the political favors pro-vided by the oil traders (or their associates) in exchange for theunderpriced oil, nor does it include bribes that might have beenpaid to Iraqi officials outside the oil company (for example, toSaddam Hussein).
We take a different approach. Instead of looking for a papertrail, we use publicly available data to uncover patterns sugges-tive of bribery.2 Specifically, we measure the potential bribe bythe gap between the official selling price of Iraqi oil (i.e., the pricepaid to the Oil for Food Program) and our estimates of the“market” price of Iraqi oil (i.e., the price of Iraqi oil at the desti-nation port, typically in Europe and the United States, aftersubtracting shipping and insurance costs). We then compare thisgap with that observed before the program. If Iraqi oil was un-derpriced in an effort to collect bribes, we expect to see twofeatures in the data. First, we expect to see a larger gap betweenthe “market” price and the official price of Iraqi oil during the Oilfor Food program years than before the Program. In the years
2. Our analysis follows the approach taken by Di Tella and Schargrodsky[2003], Fisman and Wei [2004], Olken [2004b], and Reinikka and Svensson [2004]in using patterns in prices and quantities to make inferences about corruption.
1212 QUARTERLY JOURNAL OF ECONOMICS

before the Oil for Food program, Iraq had full control over its oilrevenues and thus did not have any incentive to underprice.Second, we expect the price difference to become smaller andreturn to its historical levels after September 2001. The reason isthat in September 2001, the UN adopted a “retroactive” pricingsystem under which Iraq was forced to set its selling price retro-actively based on the price actually observed in the market.
To illustrate our evidence, consider the gap between theofficial selling price of Basrah Light—one of the two Iraqi oils—and the price of Arabian Light in the top panel of Figure I.Arabian Light and Basrah Light are chemically very similar andare considered close substitutes. The price gap indicates thatunderpricing of Basrah Light was modest in the first few years ofthe program, reached a peak in the 2000–2001 period, and de-clined after the adoption of retroactive pricing in the fall of 2001.Notably, we find a qualitatively similar pattern when we measurethe gap between official selling price of Iraqi oil and the spotmarket price of Iraqi oil itself (after deducting shipping costs).This gap reflects the difference between the price of Iraqi oil whenthe oil is first sold at the Iraqi port under UN supervision and thespot price of the same oil when it reaches its destination and issold to a refiner in Europe or the United States. The price paid tooil traders in these spot market transactions presumably includesthe cost of the bribe paid to the Iraqi regime. Unlike the evidencebased on competitors, this gap cannot be explained by unobservedshocks to the relative demand or relative supply of Iraqi oil.
Furthermore, consistent with the notion that price volatilityin oil markets made it more difficult for the UN to detect under-pricing, we find that underpricing was positively correlated withvolatility in the period before retroactive pricing. In contrast, inthe period after retroactive pricing, when volatility should notmatter, we find no relationship between underpricing and pricevolatility. In addition, we find that underpricing was associatedwith changes in the composition of oil buyers. While a multina-tional oil company might be reluctant to pay bribes, a small oiltrader operating in Russia or Switzerland might be more pliant.We find a positive correlation between the degree of underpricingand the fraction of oil sold to individual oil traders (rather than tolarge oil multinationals).
On the basis of this evidence, we interpret the product of thechange in the price gap (relative to the price gap prior to theprogram) and the quantity of oil sold as an estimate of the rent
1213DID IRAQ CHEAT THE UNITED NATIONS?

Difference between Arabian Light and Basrah
1985 1990 1995 2000 2003
−2
0
2
4
6
8
Difference between Urals and Kirkuk
1985 1990 1995 2000 2003
−2
0
2
4
6
8
FIGURE IDifference between the Market Price of Close Substitutes
and the Official Selling Price of Iraqi OilsThe top panel shows the difference between the market price of Arabian Light
and the official selling price of Basrah. Arabian Light is the closest substitute ofBasrah. The bottom panel shows the difference between the market price of Uralsand the official selling price of Kirkuk. Urals is the closest substitute of Kirkuk.The first vertical line marks the beginning of the Oil for Food Program. The secondvertical line indicates the beginning of retroactive pricing. The horizontal line isthe average difference for the years before the Oil for Food Program. Iraqi oil wasnot traded in 1991–1993 due to the first Gulf War, and in 1995–1997 due to delaysin the Oil for Food Program.
1214 QUARTERLY JOURNAL OF ECONOMICS
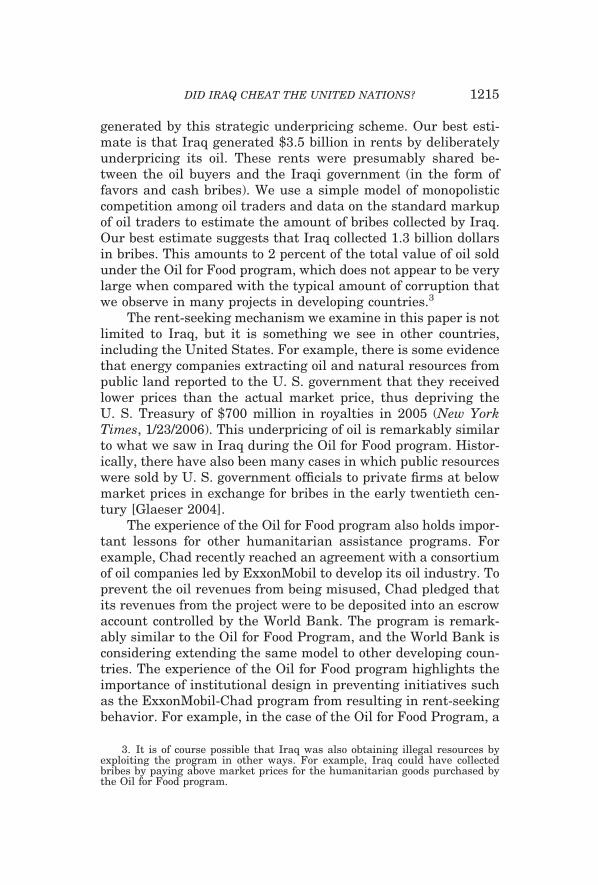
generated by this strategic underpricing scheme. Our best esti-mate is that Iraq generated $3.5 billion in rents by deliberatelyunderpricing its oil. These rents were presumably shared be-tween the oil buyers and the Iraqi government (in the form offavors and cash bribes). We use a simple model of monopolisticcompetition among oil traders and data on the standard markupof oil traders to estimate the amount of bribes collected by Iraq.Our best estimate suggests that Iraq collected 1.3 billion dollarsin bribes. This amounts to 2 percent of the total value of oil soldunder the Oil for Food program, which does not appear to be verylarge when compared with the typical amount of corruption thatwe observe in many projects in developing countries.3
The rent-seeking mechanism we examine in this paper is notlimited to Iraq, but it is something we see in other countries,including the United States. For example, there is some evidencethat energy companies extracting oil and natural resources frompublic land reported to the U. S. government that they receivedlower prices than the actual market price, thus depriving theU. S. Treasury of $700 million in royalties in 2005 (New YorkTimes, 1/23/2006). This underpricing of oil is remarkably similarto what we saw in Iraq during the Oil for Food program. Histor-ically, there have also been many cases in which public resourceswere sold by U. S. government officials to private firms at belowmarket prices in exchange for bribes in the early twentieth cen-tury [Glaeser 2004].
The experience of the Oil for Food program also holds impor-tant lessons for other humanitarian assistance programs. Forexample, Chad recently reached an agreement with a consortiumof oil companies led by ExxonMobil to develop its oil industry. Toprevent the oil revenues from being misused, Chad pledged thatits revenues from the project were to be deposited into an escrowaccount controlled by the World Bank. The program is remark-ably similar to the Oil for Food Program, and the World Bank isconsidering extending the same model to other developing coun-tries. The experience of the Oil for Food program highlights theimportance of institutional design in preventing initiatives suchas the ExxonMobil-Chad program from resulting in rent-seekingbehavior. For example, in the case of the Oil for Food Program, a
3. It is of course possible that Iraq was also obtaining illegal resources byexploiting the program in other ways. For example, Iraq could have collectedbribes by paying above market prices for the humanitarian goods purchased bythe Oil for Food program.
1215DID IRAQ CHEAT THE UNITED NATIONS?

relatively minor change in design (the introduction of retroactivepricing) appears to have dramatically curtailed the scope forbribes.
Finally, we want to stress that there is evidence that the Oilfor Food program provided food and medicines to Iraqi civilians ina period of acute need, and reduced malnutrition and malariarates among children. Our paper does not measure the benefits ofthe humanitarian assistance provided by the Oil for Food Pro-gram, and therefore does not speak to the issue of whether theprogram overall was successful.
II. THEORY: BRIBES AND UNDERPRICING OF STATE-SOLD GOODS
In this section we sketch a simple model to illustrate theincentive for Iraq to underprice its oil. The model is borrowedfrom Shleifer and Vishny’s [1992] analysis of bribes and under-pricing in state owned firms in the former Soviet Union. Glaeser[2004] has a similar model, applied to the sale of public assets atbelow-market prices by local governments in the United States.Suppose that the inverse demand curve for Iraqi oil is repre-sented by D(Q), the cost of producing oil by C(Q), and the officialprice of Iraqi oil by Pofficial. The key assumption is that Iraq doesnot keep any of the official revenues and places no value on thefood and medicine purchased by the Oil for Food Program. There-fore, instead of maximizing its profits, Iraq maximizes profits netof the official revenues, or D(Q) � Q � C(Q) � Pofficial � Q.Assuming for now that Pofficial is exogenous and that bribery isnot penalized, the first-order condition is that the marginal rev-enue is equal to the sum of the marginal cost and the official price:R�(Q*) � C�(Q*) � Pofficial. This equilibrium is represented inFigure II, where Pmarket represents the market price, Q* theequilibrium quantity, and the shaded area represents the rentcreated by underpricing.
What happens if the official price is not exogenous, but isendogenously set by Iraq? It is easy to see that Iraq would benefitfrom having the official price set as low as possible. In the absenceof any constraints on the official price, Iraq would set Pofficial � 0.In reality, the constraint that prevented Iraq from setting thisprice as low as it would have liked was that the official price hadto be approved by the UN at the beginning of each month. The UNtried to make sure that the price was set as close as possible to theexpected market price over the month.
1216 QUARTERLY JOURNAL OF ECONOMICS

We therefore assume that Iraq can choose the official price,but that there is uncertainty over the future market price andthat Iraq is punished if the UN is reasonably certain that theofficial price is deliberately set below market prices. Specifically,we assume that the expected punishment is an increasing convexfunction of the gap between the market price and the official pricedivided by the standard deviation of the market price:
(1) f�Pmarket � Pofficial
SD �.
We scale the price gap by the standard deviation of the marketprice to capture the idea that it was more difficult for the UN todetermine whether the proposed official price was abnormally lowin periods of high oil market volatility. In other words, the ex postrealization of a positive price gap could reflect deliberate under-
MC + Pofficial
Pofficial
Pmarket
Q
P
Q*
MC
MR
D
FIGURE IIUnderpricing and Bribes
The equilibrium spot price and quantity are Pmarket and Q*. The official pricepaid by the oil traders is Pofficial. The shaded area is the total amount of illegalrents. These rents are presumably split between Iraq and the traders.
1217DID IRAQ CHEAT THE UNITED NATIONS?

pricing, or could simply reflect ex ante uncertainty over futureprices. (More volatility implies more ex ante uncertainty.) Withthis assumption, the “optimal” official price chosen by Iraq isdetermined by Q* � f�(Pmarket � Pofficial/SD). Intuitively, Iraqchooses the official price such that the marginal gain from low-ering the official price is equal to the marginal increase in theexpected punishment from lowering the official price.
There are two straightforward implications of this model. Afirst implication is that increased volatility lowers the marginalprobability of detection for any given price gap. Therefore, Iraqwill choose to lower the official price in response to an increase inprice volatility. Intuitively, higher price volatility implies greateruncertainty over whether a given price gap reflects cheating orwhether it simply reflects the higher volatility in the marketprice. Therefore, if our story of underpricing and bribes is correct,we expect that Iraq will take advantage of the greater uncer-tainty due to higher volatility to lower the official price of its oil.We will provide empirical evidence in support of this hypothesisin subsection V.A.
A second implication has to do with buyer heterogeneity.While the cost of detection was probably low for many obscureindividual traders, it was high for large reputable multinationals.One would expect the first group to be more likely to pay bribesthan the second. Under this scenario, some of the rent was ap-propriated by reputable buyers in the form of low oil prices.Obviously, Iraq would prefer to deal only with individual traderswilling to pay bribes. However, it is possible that, in some periods,the supply of Iraqi oil exceeded the demand from nonreputablebuyers or that Iraq had to deal at least in part with reputable oilcompanies to minimize international scrutiny. We will examinethis hypothesis in subsection V.B.
III. EMPIRICAL EVIDENCE ON UNDERPRICING
In this section we document the extent by which Iraqi oil wasunderpriced when compared with the market price of severalcomparison crude oils. First, we compare the official selling priceof Iraqi crude oils with the price of its closest substitutes: ArabianLight, Arabian Medium, and Urals. Second, we compare theofficial selling price of Iraqi crude oils with the spot market priceof Iraqi crude oil itself. The data used are described in theAppendix.
1218 QUARTERLY JOURNAL OF ECONOMICS

III.A. Close Competitors
Iraq produces two types of crude oil, known as Basrah Lightand Kirkuk. The closest substitute of Basrah Light is ArabianLight, a crude oil produced in Saudi Arabia. In turn, the RussianUrals crude oil is widely regarded as the closest substitute forKirkuk. Because these oils are physically so similar, their pricesare almost perfectly correlated. In the years before the program,the correlation between the price of Arabian Light and BasrahLight is 0.993, while the correlation between the price of Kirkukand Urals is 0.985.4
Another way to assess the comparability of Arabian Lightand Urals to the two Iraqi oils is to plot the price gap between thecomparison oils and the Iraqi official prices. The top panel inFigure I plots the difference between the price of Arabian Lightand the official selling price of Basrah. The bottom panel showsthe difference between the market price of Urals and the officialselling price of Kirkuk. The first vertical line marks the beginningof trading under the Oil for Food Program (tenth week of 1997)and the horizontal line is the average difference for the yearsbefore the Oil for Food Program. As can be seen, the price gapbetween Basrah and Arabian Light averages zero in the yearsprior to the Oil for Food program. The price gap between Kirkukand Urals in the 1980s is also zero. Together with the almostperfect correlation in the price level, the absence of a price gapprovides some reassurance that Arabian Light and Urals arereasonably close substitutes for the Iraqi oils.
After the Oil for Food Program is introduced, this differenceis clearly larger for Basrah: the gap averages $2 in 1997 and 1998,and climbs above $5 between 2000 and 2001. Notably, afterretroactive pricing is introduced in September 2001, the differ-ence drops quickly to its historical level (the second vertical linein Figure I indicates the beginning of retroactive pricing). There
4. The market price of Arabian Light and official prices of the two Iraqi oilsare quoted as a fob price, while the market price of Urals is typically quoted as adelivered price in the port of Augusta (Italy). To compare the market price of Uralswith the official selling price of Kirkuk, we convert the delivered price of Urals inItaly to a fob price by subtracting oil tanker rates from the Black Sea to Italy. Theaverage transportation cost between 1989 and 2002 is $.87. During the programyears, transportation costs fluctuate between .58 in 1999 and 1.22 in 2000.Transportation costs are slightly higher during the Oil for Food program years. Aregression of transportation cost on a dummy for the Oil for Food years yields .10(.04). Transportation costs are also positively correlated with the price of oil.
1219DID IRAQ CHEAT THE UNITED NATIONS?

is also some evidence that Kirkuk was underpriced from 2000–2001, albeit by not as much as Basrah.
We can quantify the average price gap by estimating thefollowing regression:
(2) �Pt � � � �Programt � t,
where t indexes week, �Pt is the difference between the marketprice of the comparison crude and the official selling price of therelevant Iraqi crude, and Programt is an indicator variable forperiods of the Oil for Food Program in which sales of Iraqi oil tookplace (March 1997–December 2002). The excluded category, cap-tured by the intercept, is the period before the Oil for FoodProgram (in most cases it includes years 1980–1996). The coeffi-cient � measures the average change in the price difference dur-ing the Program relative to the historical baseline before theprogram. Because the figures indicate that the price gaps varysignificantly between 1997 and 2002, we also estimate a modelthat allows the gap to differ in different periods:
(3) �Pt � � � �1Program1t � �2Program2t � �3Program3t � t,
where Programjt is an indicator variable for the jth subperiod ofthe Oil for Food Program (for example, j � 1997–1999, 2000–2001, 2002).
One concern is that the error term t might be autocorre-lated. The residual is the difference between shocks to Iraqi oiland shocks to its competitors. Serial correlation might occur if theshocks to the demand and supply of Iraqi oil relative to itscompetitors are serially correlated. To account for possible serialcorrelation, we estimate models where the error structure isassumed to be autocorrelated up to five lags and heteroskedastic[Newey and West 1987].5
Table I quantifies the visual impression one gets from FigureI by presenting estimates of � [from (2)]. The first column pre-sents the estimates of the change in the gap between ArabianLight and Basrah. The estimate in the top panel indicates that
5. We have also experimented with models where the error structure isassumed to be autocorrelated up to ten lags, and found that results do not changesignificantly. Because of the gaps in our series, we have also experimented withthe Baltagi and Wu [1999] estimator for cases where the observations that areunequally spaced over time and the residual follows an AR(1) process. Results aresimilar. We have also experimented with models where we cluster the standarderrors at the trimester-year level. This is not ideal, because it assumes no corre-lation between shocks in different trimesters.
1220 QUARTERLY JOURNAL OF ECONOMICS

the underpricing averaged $2.44 a barrel during the Oil for FoodProgram years (relative to the years before the program).6 Be-cause the price gaps appear to vary over time, in the bottom panelwe show separate estimates for three subperiods (3). These esti-mates indicate that the price gap was significantly different fromzero in the 1997–1999 period, reaches a peak in the 2000–2001period, and declines in 2002.
An alternative substitute for Basrah Light is the Saudi crudeoil Arabian Medium. While the Arabian Light has historicallybeen the closest substitute of Basrah light, there is some evidencethat the quality of Basrah Light became much closer to that of
6. Specifically, this is the gap from the tenth week of 1997 through the lastweek of 2002 relative to the fifteen years prior to the program.
TABLE IDIFFERENCE BETWEEN THE MARKET PRICE OF CLOSE COMPETITORS AND THE
OFFICIAL SELLING PRICE OF IRAQI OILS
ArabianLight–Basrah
(1)
ArabianMedium–Basrah
(2)
Urals–Kirkuk
(3)
Model 1: Overall estimatesDifference for 1997–2002 �
difference for 1980–1995 2.44** (0.25) 1.24** (0.34) 0.69** (0.18)
Model 2: Estimates by periodDifference for 1997–1999 �
difference for 1980–1995 2.07** (0.18) 0.84** (0.24) 0.53** (0.15)Difference for 2000–2001 �
difference for 1980–1995 3.91** (0.41) 2.67** (0.61) 1.07** (0.40)Difference for 2002 �
difference for 1980–1995 0.68 (0.36) �0.40 (0.49) 0.45 (0.29)
Total revenue fromunderpricing (billion) 4.12 2.28 0.76
Standard errors are in parentheses. The dependent variable is the difference between the price of theclosest competitor and the official selling price of the relevant Iraqi crude oil, in dollars per barrel. The entryin row 1 is the coefficient on a dummy equal 1 for observations during the Oil for Food Program (between thetenth week of 1997 and the last week of 2002). The excluded category includes observations before the Oil forFood Program (between 1980 and 1996). The level of observation is a week. Entries in rows 2–4 are from oneregression, and are coefficients on dummies equal 1 for observations during the stated period. The errorstructure is assumed to be autocorrelated up to five lags and heteroskedastic. The entry in the bottom rowis obtained by multiplying the amount of the relevant Iraqi oil sold in each week between 1997 and 2002 bythe difference between the price difference observed in each week between 1997 and 2002 and the averageprice difference for the period 1980–1995. (See (4).) Sample size in columns (1)–(3) is, respectively, 785, 667,and 690. **Significant at the 5 percent level.
1221DID IRAQ CHEAT THE UNITED NATIONS?

Arabian Medium by the end of the program.7 For this reason, incolumn (2) we present a comparison based on the price of ArabianMedium. We find that the estimated underpricing averaged $1.24a barrel during the Oil for Food Program years (relative to theyears before the program). This estimate is smaller than thecomparison based on Arabian Light (column (1)), which suggeststhat part of the increase in the price gap between Arabian Lightand the official selling price of Basrah Light after 1997 may bedue to the deteriorating quality of the Iraqi oil. Finally, theestimate based on the comparison between Urals and Kirkuk(column (3)) suggests an average underpricing of only $0.69 abarrel.8
On the basis of the estimates of these price gaps, we cancalculate the rents created by the underpricing of Iraqi oil. Spe-cifically, we estimate these rents as the product of quantity soldin each week and the difference between that week’s price gapand the baseline price gap:
(4) I � �t
��Pt � �̂� � Qt ,
where �Pt is the actual price gap in a given week, �̂ is theestimate of the average price gap in the years before the Program(the intercept in (2)), and Qt is the quantity of the relevant Iraqioil sold that week. This estimate indicates that the underpricingof Iraqi oil created $2.28 billion to $4.12 billion in rents for buyersof Basrah Light (depending on whether Arabian Light or Mediumis used a comparison) and $0.76 billion in rents for buyers ofKirkuk. These rents were presumably split between the Iraqiregime and oil buyers.9
III.B. Market Price of Iraqi Oil
We now turn to our second measure of the market value ofIraqi oil: the spot market price of Iraqi oil itself. That is, wecompare the official selling price of Iraqi oil with the spot market
7. Authors’ personal communication with Mr. Maurice Lorenz (American oiloverseer for the Oil for Food program from 1997 to 1998).
8. The estimated AR(1) parameters in columns (1) and (3) are 0.88 and 0.62.9. For completeness, we have also investigated the gap between the official
price of the Iraqi oils and the market price of West-Texas Intermediate (WTI) andBrent. WTI and Brent are two crude oils widely used as benchmarks for the worldprice of oil. The patterns of the price gap are shown are generally similar to thepatterns in Figure I (see Hsieh and Moretti [2005]). The patterns of the price gapare generally similar to the patterns in Figure I.
1222 QUARTERLY JOURNAL OF ECONOMICS

price of the same oil. Oil traders that received Iraqi oil contractssold these contracts in spot markets in Europe and the UnitedStates. The price paid to oil traders in these spot market trans-actions presumably includes the cost of the bribe paid to the Iraqiregime. After an adjustment for transportation costs, the gapbetween the spot market price and the official selling price shouldbe the most direct measure of underpricing. However, the spotmarket data of Iraqi oil are of lower quality than the data on thespot market prices of the other four comparison crude oils.10
Figure III shows the price difference between the marketprice of Iraqi crude and its own official selling price. The top panelis for Basrah. As can be seen, the overall picture is qualitativelysimilar to Figure I. The figure suggests that underpricing wassomewhat limited from 1997 to 1999, large from 2000 to 2001,and declined after September 2001. The bottom panel is forKirkuk. The graph is noisier than the previous figures, and theevidence for underpricing for Kirkuk appears therefore weakerthan that for Basrah. We do not know exactly why the docu-mented price gap appears to be larger for Basrah than forKirkuk.11
Table II quantifies the magnitude of the price gap. Looking atthe overall estimates, the point estimates are 1.64 and 0.29 forBasrah and Kirkuk, respectively. The estimate for Basrah isremarkably close to the estimate based on the comparison be-tween Arabian Medium and Basrah (column (2) in Table I), whilethe estimate for Kirkuk is lower than the previous estimate.12
Estimates by period show a pattern similar to the one shownin Table I, with the peak of the underpricing reached in the
10. In particular, we have data on the spot market price of Kirkuk andBasrah from three independent sources (ICISLOR, Platts, and Petroleum Argus;see the Appendix). But no data source covers the entire period. To construct aseries for the spot market price of the two Iraqi crude oils over the entire timeperiod, we simply take the average of the price gaps from the data sourcesavailable in each week.
11. We offer a potential explanation in Section IV.12. The estimated AR(1) parameters are .78 and .54. Clustered standard
errors are, respectively, .28 and .15. We have also reestimated all the modelsassuming that the error structure is autocorrelated up to ten lags. The standarderrors increased slightly, without changing the qualitative conclusions on signifi-cance of the coefficients. For example, the standard errors in column (1)–(3) inTable I become .32, .32, and .16. Standard errors in column (1) and (2) of Table IIbecome .25 and .13. We have reestimated the models in Tables I and II limitingthe preprogram samples to be the same in both tables. The estimates do notchange significantly. To check robustness, we reestimated all the models control-ling for the price of Brent. Results do not change very much. For example,estimates in column (1)–(3) in Table I become 2.47 (.24), 1.19 (.22), and .65 (.12).Estimates in column (1) and (2) of Table II became 1.25 (.16) and .27 (.13).
1223DID IRAQ CHEAT THE UNITED NATIONS?

2000–2001 period. Although the patterns over time are generallysimilar, it appears that the findings in column (1) and (3) of TableI may be an overestimate of the true magnitude of the price gap.
Difference between Basrah Spot and Basrah OSP
1990 1995 2000 2003
−2
0
2
4
6
8
Difference between Kirkuk Spot and Kirkuk OSP
1990 1995 2000 2003
−2
0
2
4
FIGURE IIIDifference between the Market Price of Iraqi Oils and the
Official Selling Price of Iraqi OilsThe top panel shows the difference between the market price of Basrah and the
official selling price of Basrah. The bottom panel shows the difference between themarket price of Kirkuk and the official selling price of Kirkuk. The first verticalline marks the beginning of the Oil for Food Program. The second vertical lineindicates the beginning of retroactive pricing. The horizontal line is the averagedifference for the years before the Oil for Food Program. Iraqi oil was not tradedin 1991–1993 due to the first Gulf War, and in 1995–1997 due to delays in the Oilfor Food Program.
1224 QUARTERLY JOURNAL OF ECONOMICS

However, the estimate of underpricing based on the comparisonof Basrah Light with Arabian Medium is remarkably similar tothe estimate obtained from the spot market price of Basrah Light.Estimates of the illegal revenues are $3.03 billion and $0.48billion, respectively.
Our estimates of underpricing match fairly well the onlyexisting piece of documentary evidence of underpricing. This docu-mentary evidence is from a report by the commission headed byPaul Volcker, and refers to five purchases of Kirkuk crude oil (fora total of 7.3 million barrels) by an oil trading company called theAfrica Middle East Petroleum Company (AMEP). Based on writ-ten documentation on the price paid by AMEP to Iraq and on theprice received by AMEP on the spot market by refiners (mostly byShell), the Volcker commission calculates that Kirkuk was un-
TABLE IIDIFFERENCE BETWEEN THE MARKET PRICE OF IRAQI OILS AND THE OFFICIAL
SELLING PRICE OF IRAQI OILS
Basrah market price �Basrah officialselling price
(1)
Kirkuk market price �Kirkuk officialselling price
(2)
Model 1: Overall estimatesDifference for 1997–2002 �
difference for 1980–1995 1.64** (0.20) 0.29** (0.12)
Model 2: Estimates by periodDifference for 1997–1999 �
difference for 1980–1995 0.85** (0.15) 0.33** (0.13)Difference for 2000–2001 �
difference for 1980–1995 2.82** (0.24) 0.40* (0.21)Difference for 2002 �
difference for 1980–1995 1.46** (0.22) �0.03 (0.21)
Total revenue fromunderpricing (billion) 3.03 0.48
Standard errors are in parentheses. The dependent variable is the difference between the market priceof an Iraqi crude oil and the official selling price of the same Iraqi crude, in dollars per barrel. The entry inrow 1 is the coefficient on a dummy equal to 1 for observations during the Oil for Food Program (between thetenth week of 1997 and the last week of 2002). The excluded category includes observations before the Oil forFood Program (between 1980 and 1996). The level of observation is a week. Entries in rows 2–4 are from oneregression, and are coefficients on dummies equal to 1 for observations during the stated period. The errorstructure is assumed to be autocorrelated up to five lags and heteroskedastic. The entry in the bottom row isobtained by multiplying the amount of the relevant Iraqi oil sold in each week between 1997 and 2002 by thedifference between the price difference observed in each week between 1997 and 2002 and the average pricedifference for the period 1980–1995. (See (4).) Sample size in columns (1) and (2) is, respectively, 458 and 487.**Significant at the 5 percent level; * significant at the 10 percent level.
1225DID IRAQ CHEAT THE UNITED NATIONS?

derpriced by an average of $.25 in these five cases [IIC 2005a].Our estimates based on the comparison between the OSP pricefor Kirkuk and the market price for Kirkuk in the five three-weekwindows centered around the date of the AMEP sales is $.27,which is remarkably consistent with the evidence provided by theVolcker commission.
In an ideal world we would want to have the kind of docu-mentary evidence compiled by the Volcker commission for theAMEP oil sales for all 1300 oil contracts during the Oil for FoodProgram, but this would be prohibitively costly. As an alterna-tive, our estimates of underpricing have the advantage of beingeasy to compute and for relying only on publicly available marketdata. In addition, it is worth noting that the five transactionsexamined in detail by the Volcker commission do not appear to berepresentative of the underpricing during the Program. First, theAMEP contracts were for Kirkuk, and we have shown that un-derpricing was much less prevalent with Kirkuk than with Bas-rah. Second, three of the sales are from the 1998 to 1999 period,where underpricing was generally low.
IV. ALTERNATIVE EXPLANATIONS
In the previous section we have presented evidence thatthere seems to have been significant underpricing of Iraqi oil(especially of Basrah). We interpret the underpricing as adeliberate attempt by Iraq to extract bribes from the oil buyers.Of course, this is not the only possible interpretation. In thissection we analyze whether alternative interpretations areconsistent with the evidence and ultimately conclude that theyare not.
(1) Stigma Associated with Buying Iraqi Oil. It is possiblethat in the years after the first Gulf War, dealing with the Iraqiregime carried a stigma in the eyes of the world public opinion.Large multinational oil companies interested in preservingtheir reputation might have been particularly sensitive to this,and thus chose not to purchase Iraqi oil. If this is true, thedemand for Iraqi oil might have declined relative to the de-mand of its close competitors. This decline in relative de-mand—not strategic underpricing aimed at obtaining bribes—could in theory explain the lower prices of Iraqi oil relative toits competitors.
1226 QUARTERLY JOURNAL OF ECONOMICS

However, this hypothesis is not consistent with threepieces of evidence. First, it is difficult to reconcile with theexistence of a gap between the market price of Iraqi oil and itsown official selling price. Any stigma associated with purchas-ing Iraqi oil should affect both the official selling price and themarket price of Iraqi oil. If the stigma effect was the onlyexplanation of underpricing, we should not see underpricingwhen we compare the market price of Iraqi oil with its ownofficial selling price. Second, to explain the decline in under-pricing after the introduction of retroactive pricing, the stigmahypothesis would require a significant improvement in theperception of the Iraqi regime in the eyes of the world publicopinion after September 2001.
Third, underpricing does not appear to be more prevalentduring periods when world public attention was focused onIraq.13 One way to directly quantify such attention is to measurethe coverage of Iraq in the media. Figure IV plots the totalnumber of articles that appeared in the New York Times and theWall Street Journal between 1996 and 2002 that contain the word“Iraq” (top panel), “Iraq” and “Weapons” (middle panel), and“Iraq” and “Human Rights” (bottom panel). As can be seen, therewas a spike in news coverage about Iraq in 1998 and 1999 (largelyon weapon inspections), but this was a period of relatively lowunderpricing. There also does not appear to be any particulardecline in the number of articles after September 2001, nor doesit show any particular increase in the peak underpricing period in2000–2001.14
(2) Decline in Iraq Shipping Facilities. An alternative expla-nation for the lower prices commanded by Iraqi oil is the decline
13. In particular, the UN was focused on Iraq in 1998 and 1999 due to thestruggle over the weapons inspections regime. Yet, this was a period whenunderpricing was relatively low. In contrast, the peak underpricing period appar-ently began in the May 2000 when the UN did not have its eyes on Iraq, but ratherwas focused on two crises in Africa: the kidnapping of UN peacekeepers in SierraLeone and an impending war between Ethiopia and Eritrea. In May 2000 theSecurity Council was so preoccupied with events elsewhere in the world that it didnot have time to authorize a routine renewal of the Oil for Food program, and itwas precisely in May 2000 that the peak underpricing period began. Platt’sOilgram News (6/1/2000) reports “With the UN Security Council overloaded withwork on the world’s crisis spots this week, members have decided to delay a voteon the rollover of the Iraq oil-for-food program until next week.”
14. In the top panel in Figure IV, a regression of underpricing on number ofarticles yields �.001 (.001). In the middle panel this regression yields �.030(.023). In the bottom panel it yields �.005 (.003). Results based on the number offirst-page articles or the total number of words in articles about Iraq are similar.
1227DID IRAQ CHEAT THE UNITED NATIONS?

FIGURE IVThe Relationship between Newspaper Coverage of Iraq and Underpricing
In the top panel, the line with circles shows the number of articles that containthe word “Iraq” published in the New York Times and the Wall Street Journal, bymonth. The solid line shows the estimated underpricing, by month (based on thedifference between market price and OSP of Basrah). The scale on the y-axisrefers to the number of articles. A regression of underpricing on number of articlesyields �.001 (.001). In the middle panel the line with circles shows the number ofarticles that contain the words “Iraq” and “Weapons” published in the New YorkTimes and the Wall Street Journal, by month. A regression of underpricing onnumber of articles yields �.030 (.023). In the bottom panel, the line with circlesshows the number of articles that contain the words “Iraq” and “Human Rights”published in the New York Times and the Wall Street Journal, by month. Aregression of underpricing on number of articles yields �.005 (.003).
1228 QUARTERLY JOURNAL OF ECONOMICS

in Iraq shipping facilities. Years of embargo are likely to havecurtailed Iraqi access to new technologies and to the spare partsnecessary to keep its oil terminals up to date. As a consequence,it is possible that the decline in the price of Iraqi oil simplyreflects longer delays experienced by oil tankers loading oil atIraqi port, or higher variance of these delays. Both an increase inmean or an increase in variance in loading time would make Iraqioil relatively less attractive and could therefore cause a decline inits relative price.
Can a decline in shipping facilities explain the underpric-ing? It seems unlikely. First, there is no particular reason forwhy the ports should have improved substantially after Sep-tember 2001. More importantly, to measure delays experiencedby oil tankers, we collected data on the arrival and departuredate of every ship that loaded oil at the Basrah oil terminal,which is the main port facility in Iraq.15 If shipping facilitiesdeteriorated, we should see an upward trend in the number ofdays that it takes to load an oil tanker, holding constant thenumber of ships. If port deterioration can explain underpric-ing, we should also see that periods when the delays arelongest or when the variance in delay is highest are alsoperiods when underpricing is largest.
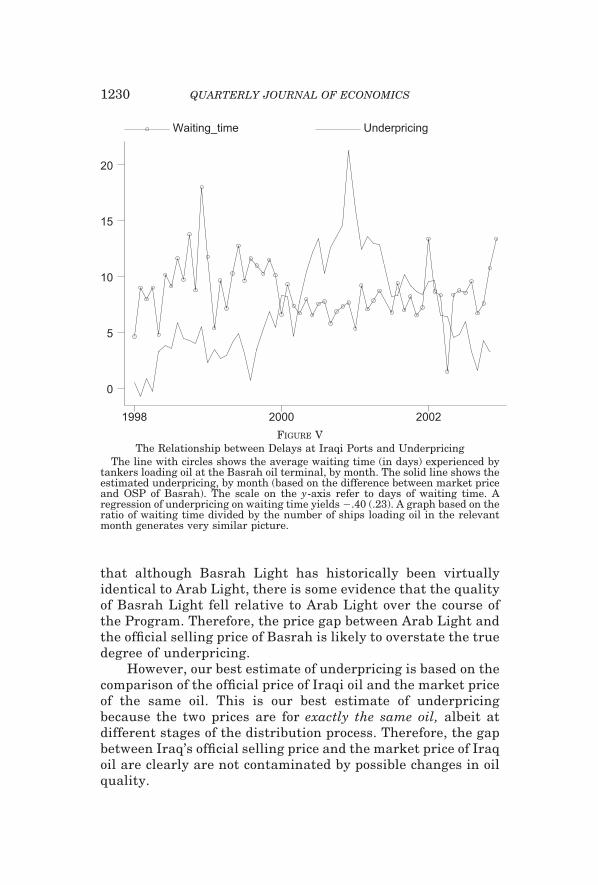
Figure V shows that there does not seem to be any particu-lar trend in the loading time in the five years under consider-ation. It also indicates that variation in underpricing is notpositively correlated with changes in the length of time it takesto load tankers, or change in its variance. A regression ofunderpricing on average waiting time yields a negative butstatistically insignificant coefficient (coeff: �.40; std error: .26).A regression of underpricing on the standard deviation of wait-ing time calculated across all shipments in the relevant monthyields an insignificant coefficient (coeff: �.05; std error: .26).These results do not change if we control for number of ships toaccount for possible crowding at the port or if we use asdependent variable delays divided by tonnage to account forheterogeneity in the sizes of the tankers.
(3) Decline in the Quality of Iraqi Oil. A decline in the priceof Iraqi oil could in theory be explained by a decline in therelative quality of Iraqi oil. For example, we have suggested
15. We purchased these data from Lloyds of London.
1229DID IRAQ CHEAT THE UNITED NATIONS?
that although Basrah Light has historically been virtuallyidentical to Arab Light, there is some evidence that the qualityof Basrah Light fell relative to Arab Light over the course ofthe Program. Therefore, the price gap between Arab Light andthe official selling price of Basrah is likely to overstate the truedegree of underpricing.
However, our best estimate of underpricing is based on thecomparison of the official price of Iraqi oil and the market priceof the same oil. This is our best estimate of underpricingbecause the two prices are for exactly the same oil, albeit atdifferent stages of the distribution process. Therefore, the gapbetween Iraq’s official selling price and the market price of Iraqoil are clearly are not contaminated by possible changes in oilquality.
Waiting_time Underpricing
1998 2000 2002
0
5
10
15
20
FIGURE VThe Relationship between Delays at Iraqi Ports and Underpricing
The line with circles shows the average waiting time (in days) experienced bytankers loading oil at the Basrah oil terminal, by month. The solid line shows theestimated underpricing, by month (based on the difference between market priceand OSP of Basrah). The scale on the y-axis refer to days of waiting time. Aregression of underpricing on waiting time yields �.40 (.23). A graph based on theratio of waiting time divided by the number of ships loading oil in the relevantmonth generates very similar picture.
1230 QUARTERLY JOURNAL OF ECONOMICS

Finally, we note again that the price gap between Iraqi oiland other oils drops to zero after the introduction of retroactivepricing, and there is no reason to believe that quality differencesabruptly ended in September 2001.
(4) Increased Supply. It is in theory possible that the fall inthe official price of Iraqi oil was a consequence of a deliberateeffort by the Iraqi regime to sell more oil. Specifically, if Iraqvalued the humanitarian supplies purchased by the Oil for FoodProgram, it might have chosen to sell more oil to increase theresources flowing into the program at a time when the marginalutility of consumption was particularly high. If the demand curvefor Iraqi oil is not perfectly elastic, the increased supply of oil willresult in a decline in the price of Iraqi oil.
Two pieces of evidence argue against this hypothesis.First, although it is probably less than infinite, the demand forIraqi oil is likely to be very elastic.16 If the demand curve forIraqi oil is very elastic, the large price differences documentedin the previous section (more than $1 on average, with peaks ofup to $4) would imply enormous increases in quantity sold.However, we simply do not observe such large variations inquantity sold. Figure VI presents a scatter-plot of the price gapand the quantity sold of Basrah (top panel) and Kirkuk (bottompanel). If the episodes of underpricing were triggered by anoutward shift in the relative supply of Iraqi oil, we should seea positive relationship between the price gap and the quantity.However, the relationship between the price difference andquantity is either not statistically different from zero or nega-tive.17 Second, the supply hypothesis cannot explain the evi-dence of underpricing even when we measure the gap betweenthe market price of Iraqi oil and its official selling price.
(5) Market Volatility. Next, we address the impact of oilmarket volatility on our measures of underpricing. Until Septem-ber 2001, the price of Iraqi oil was set a month in advance, andthis price was stipulated as a fixed discount to the future price of
16. How elastic is the price elasticity of demand for Iraqi oil? In Hsieh andMoretti [2005], we use an exogenous change in the supply of Iraqi oil to show thatthe elasticity of demand of Iraqi oil is quite high.
17. A regression of quantity sold on the price gap yields a coefficient (std.error) of �2.17 (4.00) for Basrah and �8.61 (4.34) for Kirkuk. We note,however, that it is of course possible that these coefficients are biased, ifunobserved shocks to the demand of Iraqi oil are systematically correlatedwith changes in its supply.
1231DID IRAQ CHEAT THE UNITED NATIONS?

benchmark oils. Since the future price of the benchmark oils isnot known at the time the buyer enters into a contract to pur-chase Iraqi oil, the buyer of Iraqi oil bears the risk of any pricevolatility. This volatility presumably lowers the value of an Iraqioil contract.
Could this risk explain the lower price of Iraqi oil relativeto its competitors that we have documented in the years beforeSeptember 2001? It seems unlikely. The reason is that thecompetitors’ oils are priced in a way similar to Iraqi oil. Spe-cifically, Arab Light, Arab Medium, and Urals are priced at adiscount to the future price of world benchmark oils. The priceof Iraqi oil sold by oil traders is also quoted at a discount to the
Unspent_Funds Underpricing
1998 2000 2002
−5
0
5
10
FIGURE VIQuantity of Iraqi Oil Sold and Underpricing of Iraqi Oil
The top figure shows the quantity of Basrah oil sold and the difference betweenthe market price of its closest competitor, Arabian Light, and the official sellingprice of Basrah. A larger price difference means a larger underpricing of Basrah.A regression of quantity sold on the price gap yields a coefficient (std error) of�2.17 (4.00). The bottom figure shows the quantity of Kirkuk oil sold and thedifference between the market price of its closest competitor, Urals, and theofficial selling price of Kirkuk. A larger price difference means a larger under-pricing of Kirkuk. A regression of quantity sold on the price gap yields a coefficient(std error) of �8.61 (4.34).
1232 QUARTERLY JOURNAL OF ECONOMICS

relevant benchmark oils.18 Therefore, prior to September 2001,volatility in oil markets should have exactly the same effect onthe comparison oils as on the official price of Iraqi oil.
It is the introduction of retroactive pricing in September 2001that should have lowered the value of an official Iraqi oil contractrelative to its competitors. The reason is that after the introduc-tion of retroactive pricing, buyers of Iraqi oil learn the pricingformula only after the oil had been loaded onto the ships. There-fore, the observed price gap after September 2001 is likely tooverstate the “risk-adjusted” price gap between Iraqi oil and thecomparison oils. This could in part explain why the observeddecline in underpricing is not sharper after September 2001. Toget a sense of how much this may matter, we use options to valuethis risk. We purchased daily options data from NYMEX for theperiod 1998–2002 and run a regression of the call options price onthe strike price and the strike date to estimate the price of aone-month call option for a strike price equal to the actual real-ized value of the oil price one month in the future.19 Our estimatesuggests that the price gap after September 2001 is likely to beoverstated by 30 cents. In other words, in the risk-adjusted ver-sion of Figure I, the underpricing line should be 30 cents lowerafter September 2001.
Finally, we note that our underpricing estimates are largelyunchanged when we introduce controls for oil market volatility.20
In the next section we show that volatility does affect underpric-ing, but only during the Oil for Food period.
(6) Reduced Effort. The official revenues of the Oil for FoodProgram were largely spent on humanitarian supplies. However,there were periods in which these funds were not spent due toadministrative delays in the UN. Therefore, if Iraq did valuethese humanitarian supplies, but was frustrated by the fact that
18. The pricing of Saudi oils is identical to that of Iraqi oils. That is, the pricesare set at a discount to world benchmark oils, where the relevant discount andbenchmark used varied depending on the destination of the oil. The discountsobviously differed from that used by Iraqi oils, but the benchmarks oils used areexactly the same. In turn, since Urals is sold on a delivered basis in Italy, it ispriced at a fixed discount to the benchmark oil on the day the oil is delivered inItaly. However, this price is obviously not known when the buyer of Urals entersinto a contract to purchase the Russian oil.
19. Specifically, we ran a regression of the log of the option price on aquadratic in the log of the strike price and in the length of the strike date.
20. For example, estimates in column (1)–(3) in Table I became 2.45 (.25),1.19 (.25), and .61 (.12). Estimates in column (1) and (2) of Table II became 1.49(.21) and .32 (.13).
1233DID IRAQ CHEAT THE UNITED NATIONS?

some of these funds were not spent, Iraq may have chosen toreduce its effort to obtain the best price for its oil. According tothis “reduced effort” interpretation, Iraq did not underprice in aneffort to extract bribes, but because the UN was not spending theofficial revenues in a timely manner. To investigate this possibil-ity, we collected data on the amount of undisbursed funds in theUN escrow account. We focus on the fraction of revenues that isnot spent for humanitarian aid in Iraq in each six-month periodover the total oil revenues in that period as a measure of theimplicit tax-rate faced by Iraq.21 If this argument is correct, weshould observe that higher tax rate are associated with lowereffort and therefore higher underpricing. Figure VII shows thatthis does not appear to be the case. Overall, the fraction ofundisbursed funds is negatively, not positively, correlated withunderpricing. The correlation is �.46.
V. COMPARATIVE STATICS: MARKET VOLATILITY AND TYPE OF BUYERS
In this section we investigate two implications of our hypothe-sis. First, we test whether underpricing was higher in periods ofhigh price volatility, and lower in periods of price stability. Sec-ond, we test whether episodes of underpricing are associated witha decline in the share of major oil multinationals among the oilbuyers.
V.A. The Relationship between Underpricing and PriceVolatility
In this subsection we propose a specification check based onthe notion that monitoring is easier when volatility is low. UntilSeptember 2001, Iraq could set the price of its oil, but the pricehad to be approved by the UN. In particular, each month Iraq setthe price of its oil for transactions that would take place thefollowing month. This price had to be approved by the UN, whohad to ascertain that the price set was as close as possible to theexpected market price for the following month. Since there are nofuture prices for Iraq oil, this was not an easy task for the UNoverseers, especially in periods when world oil markets werevolatile. When the price of oil on the world markets was stable,predicting the future price of oil was relatively easy. However, inperiods when the price of oil was very volatile, predicting the
21. These data are available only every six months.
1234 QUARTERLY JOURNAL OF ECONOMICS

future price of oil became much harder. This suggests that itshould have been easier for Iraq to get away with a low price inperiods characterized by high volatility in world oil prices. It was
Qua
ntity
Price Gap − Basrah0 2 4 6
0
50
100
Qua
ntity
Price Gap − Kirkuk−2 0 2 4
0
50
100
FIGURE VIIThe Relationship between Unspent Funds and Underpricing
The line for “Unspent Funds” represents the fraction of revenues that is notspent for humanitarian aid in Iraq in each six-month period over the total oilrevenues in that period.
1235DID IRAQ CHEAT THE UNITED NATIONS?

harder for the UN overseers to object to a low price in periodswhere the future price of oil was very uncertain.
After September 2001, the UN changed the way Iraqi oil waspriced. Specifically, after this date, the price of Iraqi oil was notknown until after the oil had already been loaded on the oiltankers. That is, the price of Iraqi oil was set by the UN only afterthe UN could observe the actual price in the market. Therefore,the relationship between underpricing and volatility presumablychanged after the introduction of retroactive pricing, since retro-active pricing effectively forced Iraq to set prices equal to theactual market price, irrespective of volatility.
If this is true, we should observe two features in the data.First, in the period before the introduction of retroactive pricing,we should see that our estimates of underpricing are higher inweeks of high oil price volatility. Second, in the period after theintroduction of retroactive pricing, we should see that our esti-mates of underpricing are not correlated with volatility. Findinga correlation between underpricing and volatility after the adop-tion of retroactive pricing would cast doubt on the validity of theinterpretation of this specification test.
Table III presents estimates from four regressions of under-pricing on market volatility. Because the UN overseers used theprice of Brent (a widely used international benchmark price) as areference price for shipments going to Europe, we measure vola-tility on the world oil market as the standard deviation of theprice of Brent in the ten weeks preceding the observed transac-
TABLE IIITHE RELATIONSHIP BETWEEN UNDERPRICING AND THE VOLATILITY
OF WORLD OIL PRICES
Basrah(1)
Kirkuk(2)
Before retroactive pricingCoeff. on std. dev. of price of Brent 0.916** (0.094) 0.306** (0.084)
After retroactive pricingCoeff. on std. dev. of price of Brent 0.190 (0.176) �0.067 (0.191)
Standard errors are in parentheses. Each entry is from a separate regression. The dependent variable isthe estimated underpricing by week. The independent variable is the standard deviation of the price of Brentin the ten weeks preceding the relevant week. Estimates in row 1 are based on a sample that includes weeksbefore the introduction of retroactive pricing (September 2001). Estimates in row 2 are based on a sample thatincludes weeks after the introduction of retroactive pricing. The error structure is assumed to be autocorre-lated up to five lags and heteroskedastic. The unit of measurement for both the dependent and independentvariable is dollar per barrel. **Significant at the 5 percent level.
1236 QUARTERLY JOURNAL OF ECONOMICS

tion.22 (Note that the dependent variable is of course a pricedifference, while the dependent variable is volatility in the pricelevel.)
The table shows a pattern that matches remarkably well ourpredictions. In the period before retroactive pricing (September2001), there is a positive association between our estimates ofunderpricing and volatility, both for Basrah and Kirkuk.23 Tohave a sense of the magnitude of the coefficient, consider that amove from the twenty-fifth percentile of the standard deviationdistribution to the seventy-fifth percentile (i.e., from a standarddeviation of 0.89 to one of 1.77) would be associated with anincrease in underpricing equal to $0.80 for Basrah and $0.26 forKirkuk. Such an effect seems quantitatively large, especially forBasrah. Notably, after retroactive pricing is introduced, the cor-relation between underpricing and volatility disappears. The co-efficients in the second row for both Basrah and Kirkuk are notstatistically different from zero.24
Overall, it appears that it was easier for Iraq to underpriceits oil in periods of high price volatility than in periods of pricestability. This finding is interesting for three reasons. First, itlends further credibility to our interpretation of underpricing.Second, it is useful in explaining the timing of the documentedunderpricing. Why was Iraq able to dramatically expand its un-derpricing in the spring of 2000? The evidence on the link be-tween volatility and underpricing suggests that part of the an-swer may lie with the increased volatility of the price of oil inworld markets. The months of peak underpricing (2000 and thefirst half of 2001) are months characterized by high volatility inthe price of oil markets. By contrast, volatility was much lower in1997, 1998, and 1999. Third, one might in theory be concerned
22. Using five weeks does not significantly change the results.23. This association is stronger for Basrah than for Kirkuk. One possible
explanation for this pattern is that Basrah is typically shipped to theUnited States, while Kirkuk is exported to European markets. Since it takes fourto six weeks for Basrah to reach the United States from the Persian Gulf and onlya few days for Kirkuk to reach its final destination in Europe (Kirkuk is shippedfrom a Turkish port on the Mediterranean), price volatility is likely to increaseuncertainty about the final market price at the destination port by more forBasrah than for Kirkuk.
24. We also estimated models that include the price of Brent among thecontrols. The coefficients for Basrah become .445 (.174) and .122 (.131), while thecoefficient for Kirkuk become .368 (.113) and �.0000 (.151). When we include yearfixed effects, the coefficients for Basrah drop to .248 (.094) and .027 (.135), whilethe coefficient for Kirkuk become .346 (.093) and �.007 (.138).
1237DID IRAQ CHEAT THE UNITED NATIONS?

that after the September 11 terrorist attacks, the Iraqis wereworried that the United States could use the attacks as an excusefor heightened anti-Iraq actions and decided that continuing tosolicit bribes from the Oil for Food program was too risky. Wethink that a more direct and likely explanation is that the end ofunderpricing was due to the adoption of the retroactive pricingscheme in September 2001. The finding that after retroactivepricing, the correlation between underpricing and volatility dis-appears is more consistent with our interpretation.
V.B. Underpricing and the Composition of Oil Buyers
In this subsection we investigate the relationship betweenunderpricing and the importance of major oil companies as afraction of Iraqi oil buyers. We stress that this evidence is veryindirect and only suggestive, although it is consistent with theevidence presented so far. There were three types of buyers ofIraqi oil. First, there were major multinational oil companies thatoperate in Iraq as well as in many other oil markets. Examplesinclude Shell, BP, Total (France), Agip (Italy), and Gasprom(Russia). On the other extreme, there were many individual deal-ers with no connection to reputable companies. These dealerswere typically from countries such as Russia, Ukraine, or Swit-zerland, which are not major oil importers. Third, there weresmall but legitimate oil companies (not major multinationals). Weexpect that while a major multinational oil company might find itdifficult to pay bribes, a small oil trader operating in Russia orSwitzerland might be more willing to do so. Therefore, if greaterunderpricing was in fact associated with greater bribes, weshould see a larger fraction of oil sold to obscure oil traders duringperiods when underpricing was more prevalent.25
The top panel in Figure VIII shows the estimated totalamount of illegal revenues, by period.26 Most of the illegal reve-nues were obtained between 2000 and 2001. The middle panelpresents the fraction of buyers of Iraqi oil that are individualtraders (as opposed to corporations, both major and minor). This
25. The likelihood that the third type of buyers was willing to pay bribes isprobably in between the likelihood for the first and the second type.
26. The evidence on buyers is based on data provided by the CIA’s IraqSurvey Group [CIA 2004], which lists the buyers of Iraqi oil in each three- tosix-month period. The largest number of contracts went to Russian traders. SeeHsieh and Moretti [2005] for descriptive statistics.
1238 QUARTERLY JOURNAL OF ECONOMICS

Illegal Revenues0
500
1000
1500
1997.1 1998.1 1998.4 2000.1 2001.1 2002.1
Fraction of Buyers Who Are Individual Traders0
.5
1
1997.1 1998.1 1998.4 2000.1 2001.1 2002.1
Fraction of Buyers Who Are Major Oil Companies0
.5
1997.1 1998.1 1998.4 2000.1 2001.1 2002.1
FIGURE VIIIThe Relationship between Illegal Revenues and Type of Buyers
In the top panel each bar shows the estimated total amount of illegalrevenues in each period. In the middle panel each bar shows what fraction ofthe buyers of Iraqi oil are individuals (as opposed to corporations). In thebottom panel each bar shows what fraction of buyers of Iraqi oil are one of the200 major oil companies (as defined by Forbes [2004]). The correlation betweenthe top and the middle panel is .48. The correlation between the top and thebottom panel is �.42.
1239DID IRAQ CHEAT THE UNITED NATIONS?

fraction is low in the years before 2000, and grows with time. Itreaches a peak in the first trimester of 2001, and declines afterthat. A comparison with the top panel indicates that the firsttrimester of 2001 is the time when underpricing of Basrahreached its peak. The correlation between the degree of under-pricing and the fraction of buyers that are individuals is .48. Thebottom panel shows what fraction of buyers of Iraqi oil that aremajor oil companies, defined as the ones listed among the top 200oil companies in the world. (Not all the companies are major oilcompanies, and so the fraction of major oil companies is not 1minus the fraction of individual traders.) A large fraction ofbuyers are major oil companies in the earlier years of the programwhen underpricing was less prevalent. The share of major oilcompanies declines over time. Notably, there are no major oilcompanies among the oil buyers in the first trimester of 2001,which is exactly when underpricing reached its peak. The corre-lation between underpricing and the fraction of buyers that aremajor oil corporations is �.42.
VI. ESTIMATING THE TOTAL AMOUNT OF BRIBES TO IRAQ
In this final section we aim to quantify the amount of bribesthat the Iraqi government may have received from this under-pricing mechanism. Our best estimate of underpricing (based onthe gap between the official price of Iraqi oil and the market priceof the same oil) suggests that the rents generated through under-pricing totaled $3.5 billion.27 Of course, not all this revenue endsup in Iraqi coffers. Presumably, the buyers (at least some of them)demand a share of the illegal revenues.
We have no direct information on the intermediary’s share.However, we can use a simple monopolistic competition frame-work to estimate the split of the rents between the intermediaryand the Iraqi regime. Specifically, if the demand for oil providedby each trader is isoelastic, the market price will simply be aconstant markup over the trader’s marginal cost:
(5) Pmarket � � � �Pofficial � Bribe�.
Here, � is the markup over marginal cost and is equal to (� � 1)/�where � is the elasticity of substitution between traders. The
27. That is, the total rent is the sum of the two entries in the bottom row inTable II.
1240 QUARTERLY JOURNAL OF ECONOMICS

important thing to notice about this expression is that the trad-er’s marginal cost is the sum of the official price of Iraqi oil andthe bribe paid to Iraq to obtain the underpriced oil. Therefore, ifone knows the markup, the total amount of bribes obtained byIraq could be estimated as
(6) �t
Bribet � �t
� ��Pt � �̂� � �1 � �� Pofficial
� � � �Qt � �t�,
where �t is the fraction of the relevant oil in week t that wasbought by buyers willing to pay bribes. Here, we use the fact thatwe estimate Pmarket � Pofficial as (�Pt � �̂) (3).
We have no direct information on the markup charged bytraders of Iraqi crude oil. However, we can get an approximateestimate by examining evidence on the standard markup chargedby crude oil traders. The 1997 U. S. Service Census indicates thatthe markup of crude oil traders is 1.6 percent.28 We therefore use� � 1.016 as our central estimate. This implies a very highelasticity of substitution between traders (� � 62), which is con-sistent with the fact that oil is commodity. However, it is possiblethat the elasticity of substitution is lower than that implied by amarkup of 1.6 percent. For this reason, we also provide alterna-tive estimates of the total bribes under different assumptions onthe size of �.
In Table IV we present estimates of (6) under different as-sumptions on � and �. Our central estimate of the split of the $3.5billion rent between trader profits and bribes paid to Iraq (firstentry in column (1) assumes that the dealers’ markup is 1.6percent and that � � 1. In this case, the total amount of bribesobtained by Iraq would be $2.60 billion, or 75 percent of the totalrent. If the dealers’ markup was instead 3 or 5 percent, the totalamount of bribes obtained by Iraq would be lower.
However, not all buyers may have been willing to paybribes. As we argue above, major oil companies may be con-cerned about their reputation and may find it difficult to paybribes. Entries in column (2) show estimates of the amount ofbribes obtained by Iraq under the assumption that only indi-vidual traders not affiliated with oil companies are willing to
28. U. S. Census Bureau [2001]. We define crude oil traders as “agents,brokers, and commission merchants for petroleum wholesale” (NAICS code42272).
1241DID IRAQ CHEAT THE UNITED NATIONS?

pay bribes. Those entries are obtained by applying (6), where �t
is estimated as the fraction of buyers who are individual trad-ers in the relevant period of the Oil for Food Program. Notethat under this scenario, the major oil companies that wereallocated contracts for underpriced Iraqi oil get to keep theentire rent. Individual traders, on the other hand, would buyIraqi oil below market price, resell it at market price, butwould have to split the rent with the Iraqi regime. Obviously,the Iraqi regime would prefer to deal only with individualtraders. But it is possible that, in some periods, the supply ofIraqi oil exceeded the demand from traders that were willing topay bribes to purchase underpriced oil. Alternatively, it ispossible that Iraq felt compelled to deal at least in part withreputable oil companies to minimize international scrutiny.
On the basis of the estimates in column (2), the total amountof bribes obtained by Iraq would be between $0.47 billion and $1.3billion, depending on the dealer’s markup. Because 1.6 percent isour best guess of the magnitude of the markup, our estimate inrow 1 provides our best estimate of the bribes obtained by Iraq:$1.3 billion. The estimated bribes amount to 2 percent of the totalvalue of oil sales during the Oil for Food Program. Compared withthe amount of corruption typically observed in projects in somedeveloping countries, a 2 percent of funds lost to corruption does
TABLE IVESTIMATED AMOUNT OF BRIBES OBTAINED BY IRAQ FROM UNDERPRICING
If all buyers pay bribes(� � 1)
If only individual traderspay bribes
(� is estimated)
Iraqi bribes(billion)
(1)
Iraqi shareof totalrent (%)
(2)
Iraqi bribes(billion)
(3)
Iraqi shareof totalrent (%)
(4)
Dealer’s markup is 1.6% 2.64 75 1.30 76Dealer’s markup is 3% 1.82 52 0.95 51Dealer’s markup is 5% 0.78 22 0.47 28
Entries in column (1) and (3) are estimates of (6). Underpricing is estimated using the difference betweenthe market price of Iraqi oil and the official selling price of Iraqi oil. Entries in column (3) are obtained byestimating � as the fraction of buyers that are individual traders in the relevant phase of the Oil for FoodProgram.
1242 QUARTERLY JOURNAL OF ECONOMICS

not appear to be particularly large.29 However, it is possible thatthere were other irregularities in the Oil for Food Program thatallowed Iraq to siphon funds from the program. For example, it ispossible that overbilling took place in the purchase of humani-tarian goods. We do not measure this in this paper, as we do nothave a tractable way of measuring its magnitude. For this reason,the 2 percent figure should be interpreted as a lower bound.
How does our estimate of the total amount of bribes comparewith the existing estimates? The CIA [2004] estimates that Iraqobtained $230 million in bribes. This estimate is based on docu-mentation provided by Iraq’s state-owned oil company on the cashbribes paid by the oil buyers.30 However, there are several rea-sons to believe that the CIA’s data might understate the amountof the illegal cash payments. First, bribes may have also beenpaid to other branches of the Iraqi government (other than the oilcompany) and to Iraqi officials on a personal basis. The CIAestimate would miss these bribes. Second, the source of the CIA’sdata—Iraq’s oil company—has an obvious incentive to minimizethe extent of the bribes. This is a common problem with allself-reported data on illegal activities.
More importantly, it is possible that some recipients of the oilcontracts (or their associates) compensated Iraq with political favorsinstead of monetary bribes. If Iraq was compensated by some buyersin the form of political favors, the CIA’s estimate would understatethe degree by which Iraqi oil was underpriced and, by extension, theillegal resources that Iraq might have been able to obtain throughthis scheme. For example, the head of the Oil for Food program isalleged to have obtained oil allocations for a shell company calledAMEP. In exchange, the Iraqis wanted assistance in getting permis-sion to use the Oil for Food program funds to purchase oil-industryequipment [IIC 2005a]. In this specific example, documentary evi-dence compiled by the Volcker commission indicates that a cashbribe was paid in only one of the five AMEP transactions and that
29. For example, Olken [2004a] finds that 29 percent of funds allocated to aroad building project in Indonesia were stolen. In another program in Indonesia,Olken [2004b] finds that 18 percent of subsidized rice in a large antipovertyprogram in Indonesia is stolen. A study of hospital procurement in Argentina findsa 15 percent overcharging for inputs [Di Tella and Schargrodsky 2003]. A study ofUganda schools finds that 80 percent of the funds allocated by the Ministry ofEducation for schools never reached the schools [Reinikka and Svensson 2004].
30. The Volcker Commission [IIC 2005b] provides similar estimates based onthe same data. The GAO [2004] estimates that Iraq obtained almost $900 millionin bribes. However, the GAO’s estimate is not based on any evidence, but simplyassumes that Iraq collected a 50-cent bribe on every barrel of oil.
1243DID IRAQ CHEAT THE UNITED NATIONS?

the cash bribe equaled only a tenth of the rent generated by under-pricing. In contrast, we remind the reader that our estimates areremarkably consistent with the Volcker commission’s documentaryevidence of underpricing in the AMEP oil sales. Therefore, ourestimates based on the price gap are arguably a more accuratemeasure of the sum of the monetary bribes and the monetary valueof the political favors that Iraq obtained through the deliberateunderpricing of its oil.
VII. CONCLUSION
In this paper we find modest evidence that the official sellingprice of Iraqi oil was below its market value from 1997 through1999, but clear evidence of underpricing from May 2000 throughSeptember 2001. In addition, there is little evidence of underpric-ing after September 2001, when the UN introduced a retroactivepricing scheme that made it more difficult for Iraq to underprice.Moreover, we find that it was easier for Iraq to underprice its oilin periods of high price volatility in world oil markets. This isexpected, as detection of underpricing by the UN is more difficultin periods of high volatility. As expected, the relationship be-tween underpricing and volatility disappears after the adoptionof retroactive pricing. We also find a suggestive relationshipbetween the degree of underpricing and the composition of thebuyers of Iraqi oil. Periods of underpricing were periods in whicha larger share of the oil was purchased by obscure oil tradersrather than by multinational oil companies. The peak of theunderpricing occurred at a time when no major multinationalcompanies appear among the buyers.
Why did Iraq sell its oil below market price? We hypothesizethat underpricing was a way for the Iraq regime to obtain illegalkickbacks or political favors from the oil buyers. Because all thelegal oil revenues were controlled by the UN, the Iraq regime hadan incentive to sell its oil below its market price in exchange fora bribe from the buyer. Our estimates suggest that Iraq created3.5 billion dollars in rents by underpricing the oil. Using a simplemonopolistic competition framework and an estimate of the elas-ticity of substitution between traders, we calculate that Iraqillegally received 1.3 billion dollars in bribes, or 2 percent of theoil sales under the Oil for Food program. This estimate should beinterpreted as the sum of the direct cash payments and themonetary value of the political favors provided by the oil buyers.
1244 QUARTERLY JOURNAL OF ECONOMICS

Compared with the amount of corruption observed in projects indeveloping countries, this estimate appears to be small.
There are a number of important questions we do not addressin this paper. First, we only focus on the bribes that Iraq mighthave been able to obtain through underpricing its oil, and not onother mechanisms by which Iraq could have obtained illegalresources (for example, overinvoicing the purchases of humani-tarian goods). We focus on illicit income from oil sales, ratherthan on illegal revenue from other sources, because we have atractable way of measuring the bribes Iraq might have been ableto extract from the oil buyers.
Second, we clearly cannot say much about the benefit of theprogram. Although we find evidence of underpricing, the programdid provide valuable aid that significantly alleviated the humani-tarian crisis in Iraq. Furthermore, it appears that the UN weresuccessful in reducing the scope of underpricing after September2001. Indeed, it is remarkable how much a small change in therules of the program—specifically, the introduction of retroactivepricing—was able to reduce the scope of underpricing. Therefore,one obvious lesson from the Oil for Food program is that incen-tives do matter, and careful institutional design on the part ofinternational development agencies is crucial to minimize theamount of waste in humanitarian programs.
APPENDIX: DATA
Prior to September 2001, Iraq (with the approval of the UN’soil overseers) set the official selling price of Basrah Light andKirkuk at the end of the month. The quoted prices are “free onboard” (fob) prices for loadings in Ceyhan in Turkey (Kirkuk) orat Mina-ak-Bahr (now renamed as Basrah) in the Persian Gulf(Basrah Light) and apply to oil liftings over the subsequentmonth. The price of Iraqi oil is set as fixed discount to dated Brentfor oil shipped to European markets, as a discount to second-month West Texas Intermediate for shipments to theUnited States, and as a discount to an average of Oman andDubai for exports to Asia. There are two implications from the useof this pricing formula. First, the fob price clearly can differdepending on the destination of the oil. Second, although thepricing formula is known at the beginning of the month, the exactprice is not. Specifically, because second-month WTI refers to theprice of WTI in the first day of the second month after the oil is
1245DID IRAQ CHEAT THE UNITED NATIONS?

loaded, the final price of oil shipped to the United States is onlyknown one month after the oil has been lifted from an Iraqi port.In turn, dated Brent refers to the price of Brent no more thanseven days in the future, the final price of oil shipped to Europeis known seven days after the oil has been shipped from Turkey.After September 2001, the exact discount to the price of thebenchmark oils was only set at the end of the month, and so thebuyers of Iraqi oil would not even know the pricing formula at thetime the oil is lifted.
Starting in September 1998, the UN reports the averageofficial selling price of Iraqi crude oil each week.31 The UN doesnot provide information on the individual prices of the two Iraqicrude oils, nor does it provide the fob prices for the differentmarkets. For this reason, we obtained the official selling price ofthe two Iraqi crude oils from Platts.32 Because Basrah Light istypically exported to the United States, we take the official sellingprice for Basrah Light destined for the United States. In turn,Kirkuk is largely exported to Europe, and so we take the officialselling price of Kirkuk destined for European markets.
We compare the official selling price of Iraqi oil with themarket price of Arabian Light and Arabian Medium (Saudi Ara-bia) and Urals (Russia). The oil industry press frequently cites“Arab Light,” a crude oil produced by Saudi Arabia, as the closestsubstitute for Basrah Light. In turn, a Russian crude oil known as“Urals” is widely viewed as a close substitute for Kirkuk. Wedefine the price of the two Saudi crude oils as the fob price in thePersian Gulf (from ICIS-LOR, obtained from Datastream’s data-base). In turn, the market price of Urals is typically quoted as adelivered (or cif) price in Italy (also from ICIS-LOR, providedthrough Datastream). We convert the delivered price of Urals inItaly to a fob price by subtracting oil tanker rates from the BlackSea to Italy.33 The average transportation cost used for Uralsbetween 1989 and 2002 is $.87. During the program years, trans-
31. Available from http://www.un.org/Depts/oip.32. We purchased these data from Platts. There are no price data in 1995 and
1996, because no trading took place. The data from the UN match reasonably wellthe properly weighted data from Platts for the years when both sources areavailable (mid-1998–2002).
33. For the years 1991–2002, we use weekly shipping data from Bloomberg.Unfortunately the Bloomberg series is not available prior to 1991. For the years1987–1990, we use the monthly series from the annual issues of OPEC’s Statis-tical Bulletin (OPEC). We could not find monthly level data for 1985 and 1986. Weimpute transportation costs in 1985 and 1986 based on the mean transportationcost observed between 1987 and 1990.
1246 QUARTERLY JOURNAL OF ECONOMICS

portation costs fluctuate between .58 in 1999 and 1.22 in 2000.Transportation costs are slightly higher during the Oil for Foodprogram years. A regression of transportation cost on a dummyequal to one for the Oil for Food years yields .10 (.04). Transpor-tation costs are also positively correlated with the price of oil.
Turning to the market price of the Iraqi oils, we combine datafrom three sources to obtain the spot market price of BasrahLight and Kirkuk. These three sources are ICIS-LOR, Platts, andPetroleum Argus.34 For Kirkuk, oil traders will sell the oil con-tracts to the end users on a fob basis in Turkey. The end user willthen be responsible for dispatching a tanker to Turkey to load theoil. The market price for Kirkuk provided by all three sources aretherefore spot fob prices for loadings at the port of Ceyhan (inTurkey). For Basrah Light, oil-traders typically sell the oil on adelivered basis in the U. S. Gulf Coast. Therefore, ICIS-LOR andPetroleum Argus reports the cif price at the U. S. Gulf Coast. Weconvert the cif price to a fob price by subtracting the shippingrates for crude oil from the Persian Gulf to the U. S. Gulf Coast.35
Platts also reports the cif price of Basrah Light in the U. S. GulfCoast, but our sources that report Platts’ data already adjust thecif price for shipping costs from the Persian Gulf. Unfortunately,no individual source for spot prices covers the entire period. Toconstruct a series for the spot market price of the two Iraqi crudeoils over the entire time period, we take the average of the pricegaps from the data sources available in each week. We choose asimple average as the most transparent way of combining thethree alternative series.
Finally, the web site of the UN Oil for Food program reportsthe weekly quantity of oil sold. Starting in mid-1998, these dataare reported separately for exports through Ceyhan (Turkey) andMina-ak-Bahr (on the Persian Gulf) for most weeks, but there aremany weeks in which this breakdown is not provided publicly.
UNIVERSITY OF CALIFORNIA, BERKELEY AND NBER
34. The data from Petroleum Argus are obtained from weekly issues of“Petroleum Argus Weekly Global Markets.” We obtained Platts data on the spotprice of Iraqi oil from OPEC’s annual statistical bulletin and weekly issues of theEnergy Information Administration’s “Weekly Petroleum Status Report.” Finally,we purchased data on the spot prices of the two Iraqi oils from ICIS-LOR.
35. We obtained weekly series on shipping costs from the Persian Gulf to theU. S. Gulf Coast from Bloomberg.
1247DID IRAQ CHEAT THE UNITED NATIONS?

REFERENCES
Baltagi, Badi H., and Ping X. Wu, “Unequally Spaced Panel Data Regressionswith AR (1) Disturbances,” 1999.
Central Intelligence Agency (CIA), Iraq Survey Group, Comprehensive Report ofthe Special Advisor of the DCI on Iraq’s WMD (I), Washington, DC: CentralIntelligence Agency, 2004. http://www.cia.gov/cia/reports/iraq_wmd_2004/.
Di Tella, Rafael, and Ernesto Schargrodsky, “The Role of Wages and Auditingduring a Crackdown on Corruption in the City of Buenos Aires,” Journal ofLaw and Economics, XLVI (2003), 269–292.
FAO, and WFP, Special Report: FAO/WFP Crop. Food Supply and NutritionAssessment Mission to Iraq, 2003.
Fisman, Ray, and Shang-Jin Wei, “Tax Rates and Tax Evasion: Evidence from‘Missing Imports’ in China,” Journal of Political Economy, CXII (2004),471–496.
General Accounting Office (GAO), Observations of the Oil for Food Program andIraq’s Food Security, Washington, DC: GAO, 2004. http://www.gao.gov/cgi-bin/getrpt?GAO-04-880T.
Glaeser, Edward, “Public Ownership in the American City, in Urban Issues andPublic Finance,” in Essays in Honor of Dick Netzer, A. E. Schwartz, ed.(Northampton, MA: Edward Elga Publishing, 2004), pp. 130–162.
Hsieh, Chang-Tai, and Enrico Moretti, “Did Iraq Cheat the United Nations?Underpricing, Bribes, and the Oil for Food Program,” NBER Working PaperNo. 11202, 2005.
Independent Inquiry Committee into the United Nations Oil for Food Program(IIC), Interim Report, New York, NY: IIC, 2005a.
——, Manipulation of the Oil-For-Food Program by the Iraqi Regime, New York,NY: IIC, 2005b.
Newey, Whitney K., and Kenneth D. West, “A Simple, Positive Semi-definite,Heteroskedasticity and Autocorrelation Consistent Covariance Matrix,”Econometrica, LV (1987), 703–708.
Olken, Ben, “Monitoring Corruption: Evidence from a Field Experiment in Indo-nesia,” Harvard University, 2004a.
——, “Corruption and the Costs of Redistribution: Micro Evidence from Indone-sia,” Harvard University, 2004b.
Reinikka, Ritva, and Jacob Svensson, “Local Capture: Evidence from a CentralGovernment Transfer Program in Uganda,” Quarterly Journal of Economics,CXIX (2004), 679–705.
Shleifer, Andrei, and Robert Vishny, “Pervasive Shortages Under Socialism,”RAND Journal of Economics, XXIII (1992), 237–246.
U. S. Census Bureau, Miscellaneous Subjects: 1997 Economic Census, WholesaleTrade, Subject Series (Washington, DC: U. S. Census Bureau, 2001).
1248 QUARTERLY JOURNAL OF ECONOMICS