the effects of chili pepper on reaction to ostracism · pdf filethe effects of chili pepper on...
TRANSCRIPT

Purdue UniversityPurdue e-PubsCollege of Health and Human Sciences HonorsProgram Undergraduate Theses
College of Health and Human Sciences HonorsProgram
5-2013
The Effects of Chili Pepper on Reaction toOstracismMun Sun ChoiPurdue University
Follow this and additional works at: http://docs.lib.purdue.edu/hhstheses
This document has been made available through Purdue e-Pubs, a service of the Purdue University Libraries. Please contact [email protected] foradditional information.
Recommended CitationChoi, Mun Sun, "The Effects of Chili Pepper on Reaction to Ostracism" (2013). College of Health and Human Sciences Honors ProgramUndergraduate Theses. Paper 11.


Abstract
Functional magnetic resonance imaging research has shown that ostracism and physical
pain share a common neurological basis in the anterior cingulate cortex. This evidence supports
the idea that the sensations of social and physical pain overlap and interact [1]. We evaluated this
relationship in human subjects by having 90 psychology students consume spicy tomato soup
(the spice used is Capsaicin) to trigger physical pain, and by having them play Cyberball
immediately after (Cyberball is an online-ball toss game that is used to manipulate whether the
participant is included or ostracized to trigger social pain [2]). Our hypothesis is two-tailed: that
chili pepper consumption may increase or decrease feelings of ostracism. To test our hypothesis,
we randomized 90 subjects to receive 1 of 4 manipulations: spicy soup and excluded-in-
Cyberball, spicy soup and included-in-Cyberball, mild soup and excluded-in-Cyberball, or mild
soup and included-in-Cyberball. After these manipulations, the subjects had to answer a
validated retrospective needs satisfaction index. This validated index was used to determine the
effect of soup and Cyberball on the participant's feelings of social pain. To analyze our results,
we used repeated measures ANOVA and then conducted post-hoc analysis with the Tukey HSD
to compare multiple least square means. The results show that there was a significant time and
group interaction on feelings of belonging, control, self-esteem and meaning existence
(P=0.0024). The results suggest that chili-pepper might have a distracting or analgesic effect on
social pain.
Literature Review
Social Pain/ Physical Pain Overlap Theory

According to International Association for the Study of Pain, physical pain is described as “an
unpleasant sensory and emotional experience associated with actual or potential tissue damage, or
described in terms of such damage” [11]. Yet, there is no definition of social pain and harder to capture
to define. Social pain is conceptualized as “the distressing experience arising from the perception of
psychological distance from close others or from the social group” [1]. Social Pain/ Physical Pain Overlap
Theory (SPOT) states that social pain caused by damaged or lost social relationships and physical pain
caused by physical injuries share parts of the same underlying processing system in the brain. However,
even though there are growing numbers of literature showing the relationship between social pain and
physical pain in neural system, there are many aspects of this theory that remain unclear. Yet, the
overlap between pain types could be explained by the human evolution; and it could possibly explain
why and how our neural system is designed to maintain both physical health and social relationships,
which is crucial in the survival of human survival.
Evolutionary hypothesis proposes that as mammalian infants grow, social attachment system,
which keeps human organisms to stay near others, develops on top of the pre-existing pain in order to
warn them to avoid the social separation. To mammalian infants, maintaining stable relationship with a
caregiver is critical. By staying close to a caregiver, infants are fed and protected by them promising the
stable and optimal physical health. At the same time, infants are able to receive attention and learn to
develop their first relationship with the caregiver; however, unstable infant-mother attachment could
lead to delayed physical and cognitive development in mammalian infants affecting their survival [13].
Indeed, the pain system may be shared due to avoid negative consequences. SPOT, therefore, monitors
for harm and motivates recovery when harm is detected.
Social pain may include rejection, ostracism, exclusion, or other social cues that may trigger
uncomfortable feelings in individuals. This develops the sense of perceived social distance and cause
psychological distress in an individual. The sense of social distance may persist throughout the life span,
even though it is understood that separation distress diminishes as a human matures [12]. Therefore, if
evolutionary hypothesis is correct, perceived social distance should continue if physical pain system is
intact due to borrowed mechanisms in the neural system [1].
There are four hypotheses proposed regarding SPOT [1]. The first hypothesis that this study is
based on is that both physical and social pain share a common phenomenon and neural system. Leary
believe that those pain types share the same vocabulary, meaning the usage of same words in the
English language to describe those pain types such as stomachache and heartache [15]. For the neural
system, the anterior cingulate cortex (ACC) involving distress associated with the physical-social pain
overlap has been described [14]. It is widely known that the ACC plays a significant role in the
experience of physical pain; and many medical procedures have involved the circumscribed lesioning of
the ACC to treat intractable chronic pain disorders [14]. Results from several studies, therefore, show
that there is a notable relationship between physical pain and the activation of ACC.
Even though not much research has been done to clarify the relationship between social pain
and the activation of ACC in humans, it is safe to assume its reasonable relationship from what
researches have been conducted on animals. There was a study noting that lesioning of ACC for chronic
pain or anxiety disorders had positive social consequences. Patients became less shy, less socially
sensitive and less socially inhibited [15] meaning that they became less socially concerned. The results
from this study show that there may be a possible relationship between the social pain and ACC as well.
Measurements and Scales
In many food companies, consumer acceptability is commonly assessed for production and
improvement of their products. Consumer acceptability is measured in many ways using different scales,
but in many cases hedonic 9-point scale is used to measure consumers’ preferences of a certain item. It
is also true that scales are commonly used when making across-group comparisons in different fields of
research. Hedonic 9-point scale is easy to understand by panelists and can be used to test many
different aspects of food and products. However, because it is simple it may miss several important
factors affecting the responses from panelists. Weaknesses of hedonic 9-point scale include making false
assumptions and not considering gender and/or cultural background of panelists [17].
The general Labeled Magnitude Scale (gLMS) is a scale that ranges from -100 to 100 which -100
indicates “strongest imaginable disliking of any kind”, zero indicates “neutral”, and 100 indicates
“strongest imaginable liking of any kind”. Because hedonic 9-point scale does not provide valid and
reliable information when making across-group comparisons, the gLMS may be used to obtain more
precise and valid information.
The magnitude matching is the gold standard when making those comparisons (gLMS) [18].
Generalized Labeled Magnitude Scale is a line scale with verbal anchors. In between verbal anchors, the
space is present to “provide magnitude estimates of different verbal descriptors” [18]. Panelists
consider those verbal anchors and spaces when responding to a given question; therefore, the
responses are very subjective. Before the gLMS evolved, Green found a problem with the LMS when
rating oral sensations such as pain in 1996 [19]. LMS with the high end anchor caused a smaller range of
rating for the taste stimuli, restricting panelists’ perception of the sample. Fortunately, Bartoshuk
stretched out the scale with a top anchor “strongest imaginable sensation of any kind” to create the
gLMS [20]. Testing on gLMS was also done to magnitude matching with a tone standard to check its
ability to provide across-group comparisons. Results of the testing showed that the methods were
equivalent [20].
Labeled Hedonic Scale (LHS) shares a fundamental property with the gLMS [20]. The LHS can be
assumed to provide meaningful semantic information due to the locations of its semantic labels that
were determined by direct estimation of perceptual and psychological magnitude within the context of
a wide range of remembered and imagined experiences [7]. Also the study has found that the presence
of the semantic descriptors on the LHS does not distort the hedonic ratings and therefore, their spacing
is valid [7].
Ethnicity, Frequency and Chili Pepper
As the number of ethnic groups increases in America, savory and spicy dishes become more
popular and are welcomed by people. People have different perception to spiciness of foods due to
exposure and adaptations, and different cultural backgrounds. It has been found that people who are
frequent users of spicy foods rate spicy foods as more palatable and are able to differentiate the burn
caused by spicy foods [23].
Spicy food is highly desired and essential in the Korean diet. Koreans consume about 7 g of hot
red pepper (RP) per day while 10.5% of the American population consumes any kinds of pepper on a
daily basis [22]. Differences in the preference of spicy food in ethnic groups are not clear; however, it is
safe to hypothesize differences in sensory, physiological, personality, and cultural backgrounds play
significant roles when determining the preference of spicy food in people. Studies have reported that
repeated experience with spicy solutions over a 2-week period reduces the ratings of burn intensity [21],
and repeated exposure to extremely hot or cold climates causes metabolic adaptations such as an
altered rate of thermogenesis and redistribution of body heat [21]. These studies have shown that
adaptations induced with regular and repeated exposure can increase individuals’ tolerance to spicy
foods.
Risk-taking and Fundamental Social Needs
Risk-taking, also known as sensation seeking, can predict individual’s food preference. The
previous study has found that individuals that are high sensation seekers, or risk-taking, tend to prefer
spicy foods, meats and alcoholic beverages [24]. The linkage between food preferences and personality
traits may be different between different races; however, the study has proven that regardless of race,
individuals that are high sensation seekers, or risk-taking, tend to prefer spicy foods overall [24].
Therefore, during this study, participants were asked to complete Domain Specific Risk Taking Scale to
determine any correlation between risk-seeking behavior and chili pepper preference.
The fundamental social needs met in individuals can be determined using Needs Satisfaction
Index (NSI). NSI measures the feelings of belonging, control, self-esteem and meaningful existence in an
individual. The feelings of belonging, control, self-esteem and meaningful existence may alter depending
on the social status of an individual, either included or excluded. When an individual experiences social
exclusion, it is very likely that an individual may not sense those feelings; however, when an individual
experiences social inclusion, it is very likely that an individual may sense those feelings [25]. During this
study, NSI was measured to determine participants’ basic fundamental social needs and to detect the
changes in feelings after experiencing either social inclusion or exclusion and consuming either mild or
spicy soup.
Hypothesis
Spicy tomato soup containing capsaicin will modulate feelings of ostracism.
Methods
Subjects
Subjects were recruited from the Psychology 12000 (formerly Psychology 120) subject
pool using the web-based SONA sign-up program and using public advertisements. Both groups
of participants were initially blinded from the study’s aims and were told that they were going to
participate in study on chili pepper’s effects on mental visualization. Subjects from the
Psychology 12000 subject pool participated in this experiment as part of their course requirement
while those recruited via public advertisements volunteered their time for the study. The
eligibility criteria included: 1) age 18 to 65 years; 2) any gender; 3) any ethnicity; 4) any
spiciness preference; 5) willingness to consume tomato soup of varied spiciness; and 6)
participants must not have played Cyberball before. 90 participants whose median age was 22
with mean age being 24 (range 18-57) completed the study. Subjects were randomized to 4
groups: 1) a group that consumed mildly spiced soup and were included in the Cyberball game,
2) a group that consumed mildly spiced soup and were ostracized in the Cyberball game, 3) a
group that consumed spicy soup and were included in the Cyberball game, and 4) a group that
consumed spicy soup and were ostracized in the Cyberball game. The amount of chili pepper
used in the mildly spiced and spicy soup is explained below. 4 participants dropped out of the
study due to last minute withdrawal from the study or failure to show up for clinic visits. An
additional 4 participants who took part in the study were privy to the Cyberball manipulation and
hence were excluded as well. As a result, data from 82 participants were used in the analysis.
The study was approved by the Purdue University Biomedical Institutional Review
Board. All subjects were provided written informed consent and received participation credit if
they were from the Psychology 12000 subject pool or received a selection of commercial brand
snacks after completing the study if they were recruited from the public. At the end of the study,
all participants were individually informed of the study’s real aims, given a standardized debrief
and were provided with a post consent form to acknowledge that they were informed about the
true aim of the study.
General Protocol
Testing was conducted through a randomized controlled design. Most participants
responded to the web-based SONA sign-up program for the students enrolled in Psychology
12000. If the criteria were met, the subjects were schedule to complete two study visits: screen
day (visit 1) and test day (visit 2). Prior to each visit, subjects were instructed to avoid using any
oral health products, such as toothpaste or mouthwash, and to not eat or drink any food and
beverages except water 2 hours before the visit. This is so that every participant starts from the
similar baseline; therefore, the effects of food and beverage intake prior to the study will be
minimalized. Then a more accurate spiciness and hedonic rating can be attained from
participants.
During their screening visit, preliminary baseline data was acquired from participants.
They were first provided the study's consent form to acknowledge and sign. They then completed
3 sets of questionnaires: 1) a demographic questionnaire (see appendix A), 2) The Hedonics of
Capsaicin Containing Foods Questionnaire to determine the participant’s experience with chili
pepper and liking for its sensory properties [5] and 3) The Domain Specific Risk Taking Scale to
determine any correlation between risk seeking behavior and chili pepper preferences [4]. After
the questionnaire, the participants took part in a taste test of up to 11 samples (0, 0.5, 1, 1.5, 2,
2.5, 3, 3.5, 4, 4.5, 5g per serving) of tomato soup of increasing levels of spiciness. These samples
were kept in a water bath during the taste test, and were served to participants at a temperature of
60 ˚ C. Participants swished the tomato soup sample in their mouth for 15 seconds per sample
and then expectorated the sample. They were then asked to rate the sample's burn intensity using
a general labeled magnitude scale (gLMS, a variation of a line scale) (cite) and its palatability on
a labeled hedonic scale (LHS) (cite). Subjects rinsed their mouth with water before trying the
next sample. To determine burn intensity and palatability ratings, the researcher used a ruler to
measure the largest numeric ratings on the line in millimeters, and the sample with the highest
numeric rating on the LHS was determined to be the preferred concentration of red pepper in
tomato soup.
Upon arrival for the test day, subjects consumed a bowl (150mL; 0.63 US cup) of tomato
soup in its entirety within 10 minutes, which was more than enough time for the subjects to
complete the task. Depending on the randomization, some subjects received a bowl of soup
containing red pepper concentration equal to either 50% of their preferred concentration (mild
group) or two-times their preferred concentration (spicy group). Immediately after they drank
their soup, they were asked to play Cyberball. After the game, subjects filled out a validated
post-Cyberball questionnaire which asked for their thoughts and feelings [2]. Finally, subjects
were asked to watch 2 (10 to 15 second long) video clips, comment on the videos and answer the
post-Cyberball questionnaires one last time.
Intake and Experience with Spicy Foods
A taste test comprising of tomato soup containing 11 ascending concentrations of red
pepper (0, 0.5, 1, 1.5, 2, 2.5, 3, 3.5, 4, 4.5, and 5g per 30mL serving) and spice irritancy hedonic
scale were used to determine the concentration of red pepper that each subject found most
palatable and most preferred. Subjects were asked to swish each sample for 15 seconds and then
expectorate. In between each sample, subjects were instructed to 1) rate the sample's burn
intensity and its palatability and then, 2) rinse their mouth with water before they tried the next
sample. Testing stopped when higher concentrations are rated lower in palatability than lower
concentrations. The concentration of red pepper that was rated most palatable by the subject was
deemed as their preferred concentration.
Individuals that were randomized to drink “spicy” soup on the actual test day received a bowl of

soup with a red pepper amount that was double their preferred concentration; while, individuals
randomized to drink “mild” soup, received a bowl of soup with red pepper that was half the
subject's preferred concentration.
Statistical Analysis
JMP (Version 8) was used to perform all statistical testing. Repeated measures analysis
of variance (ANOVA) was used to test the effects of Group (G), Subject (S), Time (T) , Group x
Time (GT) and Subject X Time (ST) on their fundamental needs (Y) before and after the filler
task. [Model: Y = Gi + Si(j)+ T k+ GTik + STi(j)k for i = 4 j= 82; k= 2 ] Post hoc analyses were
completed using Tukey’s Honest Significant Difference (HSD) test. Significance was defined as
p<0.05 unless otherwise stated.
Results
Demographics
Racial Categories Male Female Total
American
Indian/Alaska
Native
1 0 1 (~1%)
Asian 16 22 38 (~42%)
Native Hawaiian or
Pacific Islander
1 0 1 (~1%)
Black or African
American
1 3 4 (~4%)
White 23 21 40 (~44%)
Unknown or
unreported
2 0 2 (~2%)
44 (48.9%)
46 (51.1%)
90
Table 1 Participant Demographics – Race. Most participants were either White or Asian. There were almost an
equal number of both male and female participants.

Figure 1 Participant Demographics – Age. Most participants were in their 20s and the median age of
22 (Mean=24). The minimum age is 18 years old and the maximum age is 57 years old.
Figure 2 Percentage of responses for Hedonics of Capsaicin Containing Foods Questionnaire
I think chili pepper makes food
taste better.
Without hot spices, I find that
food tastes too bland.
I find it hard to appreciate the
flavors of food when the food
contains hot spices.
I grew up eating foods that
contain chili peppers
Age. Most participants were in their 20s and the median age of
22 (Mean=24). The minimum age is 18 years old and the maximum age is 57 years old.
Hedonics of Capsaicin Containing Foods Questionnaire from participants.
66
28
22
45
16
54
60
37
0% 20% 40% 60% 80% 100%
I think chili pepper makes food
Without hot spices, I find that
I find it hard to appreciate the
flavors of food when the food
I grew up eating foods that
Percentage of Participants
Agree
Disagree
Age. Most participants were in their 20s and the median age of participants is
from participants.
Agree
Disagree
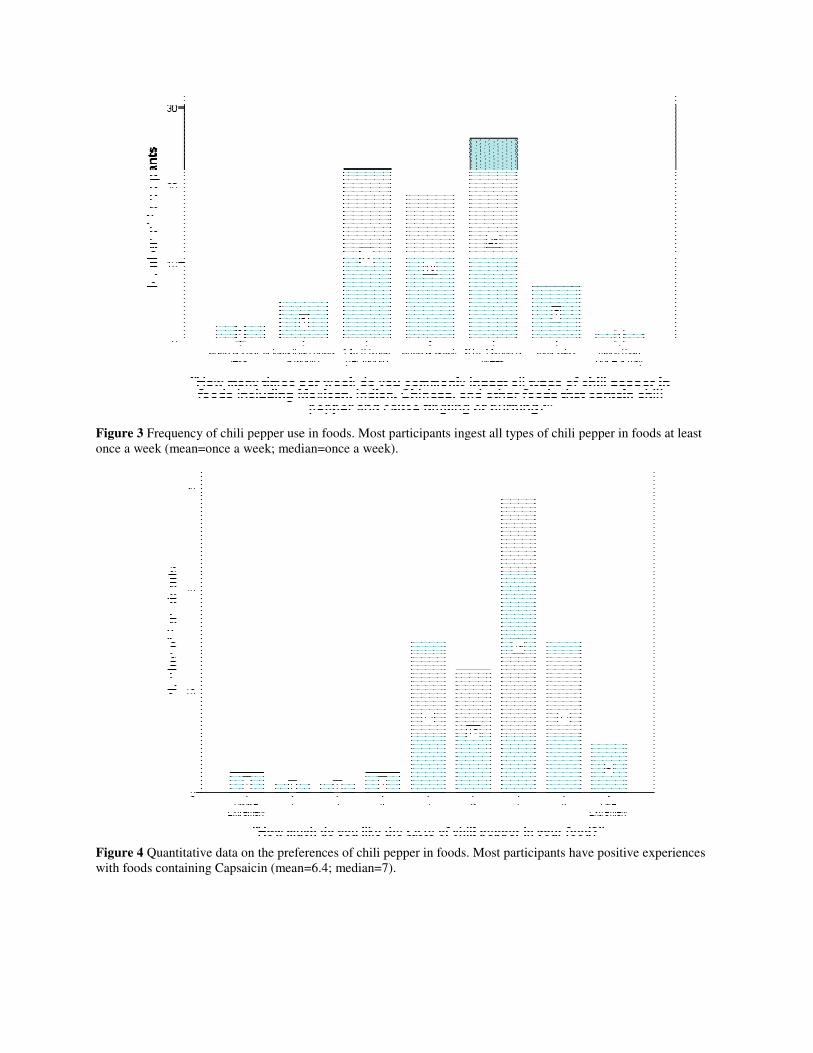
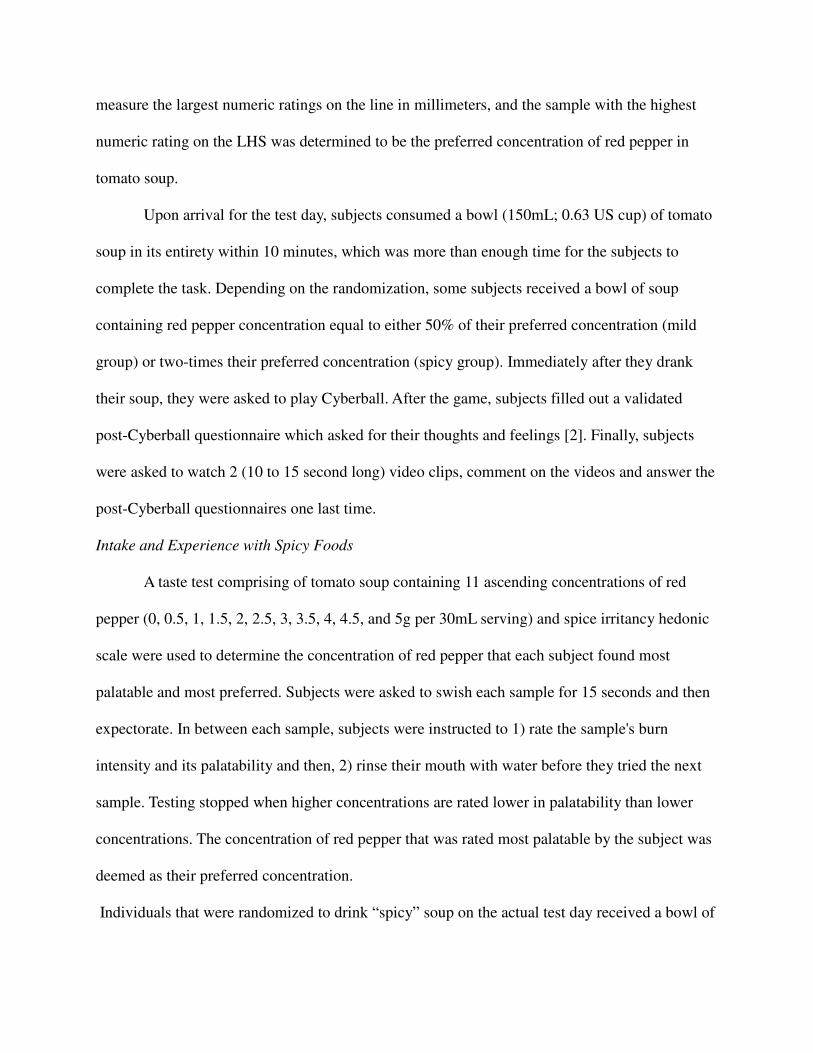
Figure 3 Frequency of chili pepper use once a week (mean=once a week; median=once a week).
Figure 4 Quantitative data on the preferences of chili pepper in foods. Most participants have positive experiences with foods containing Capsaicin (mean=6.4; median=7).
Frequency of chili pepper use in foods. Most participants ingest all types of chili pepper in foods at least once a week (mean=once a week; median=once a week).
Quantitative data on the preferences of chili pepper in foods. Most participants have positive experiences oods containing Capsaicin (mean=6.4; median=7).
in foods. Most participants ingest all types of chili pepper in foods at least
Quantitative data on the preferences of chili pepper in foods. Most participants have positive experiences

Figure 5 Quantitative data on the preferences of burning sensation from chili pepper in foods. Most participants enjoy the burn of chili pepper in their foods (mean=5.34; median=6).
90 participants participated; however, only results obtained from 82 participants were
used for analysis. The median age of participants was 22 with mean age 24. The range of age is
18-57 (Figure 1). Most participants were either Whites (n=40) or Asians (n=38) (Table 1).
Responses for questionnaires that participants were asked to complete, including Hedonics of
Capsaicin Containing Foods Questionnaire, were obtained during participants’ first visit.
According to responses, most participants ingest foods containing chili pepper
week (Figure 3) and enjoy the taste and burning sensation from Capsaicin (Figure 4 and 5).
Quantitative data on the preferences of burning sensation from chili pepper in foods. Most participants enjoy the burn of chili pepper in their foods (mean=5.34; median=6).
cipated; however, only results obtained from 82 participants were
used for analysis. The median age of participants was 22 with mean age 24. The range of age is
57 (Figure 1). Most participants were either Whites (n=40) or Asians (n=38) (Table 1).
nses for questionnaires that participants were asked to complete, including Hedonics of
Capsaicin Containing Foods Questionnaire, were obtained during participants’ first visit.
According to responses, most participants ingest foods containing chili pepper at least once a
week (Figure 3) and enjoy the taste and burning sensation from Capsaicin (Figure 4 and 5).
Quantitative data on the preferences of burning sensation from chili pepper in foods. Most participants
cipated; however, only results obtained from 82 participants were
used for analysis. The median age of participants was 22 with mean age 24. The range of age is
57 (Figure 1). Most participants were either Whites (n=40) or Asians (n=38) (Table 1).
nses for questionnaires that participants were asked to complete, including Hedonics of
Capsaicin Containing Foods Questionnaire, were obtained during participants’ first visit.
at least once a
week (Figure 3) and enjoy the taste and burning sensation from Capsaicin (Figure 4 and 5).
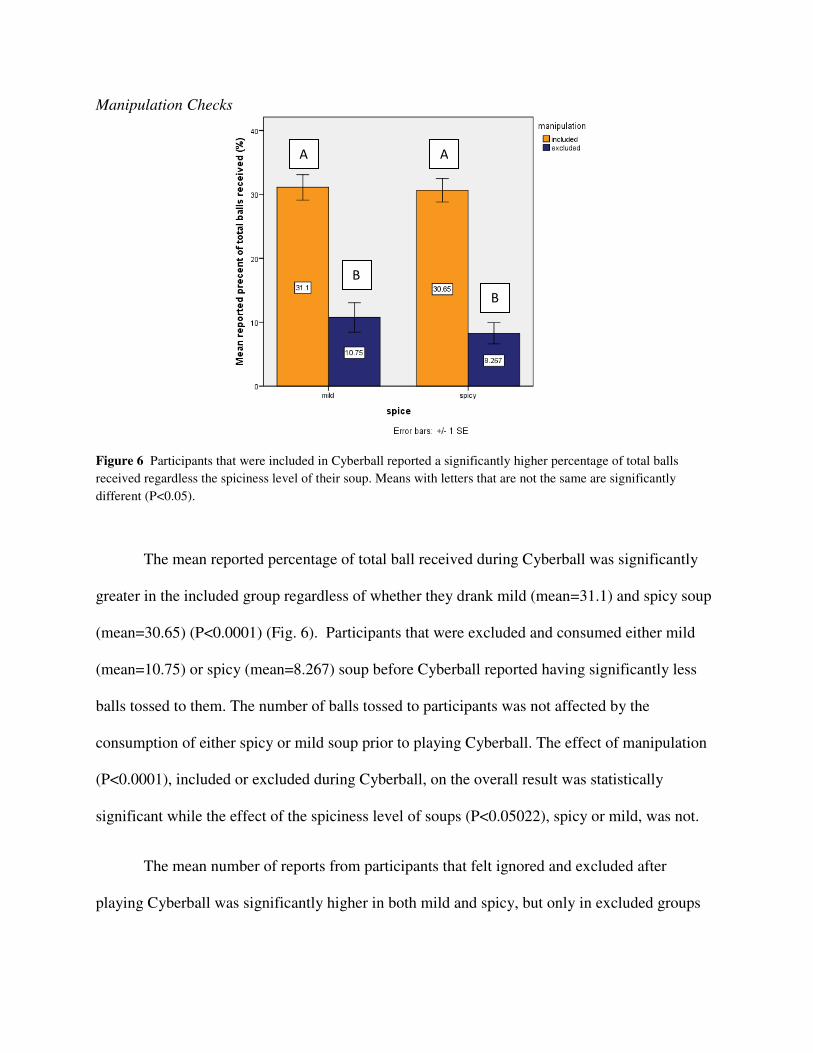
Manipulation Checks
Figure 6 Participants that were included in Cyberball reported a significantly higher percentage of total balls
received regardless the spiciness level of their soup. Means with letters that are not the same are significantly
different (P<0.05).
The mean reported percentage of total ball received during Cyberball was significantly
greater in the included group regardless of whether they drank mild (mean=31.1) and spicy soup
(mean=30.65) (P<0.0001) (Fig. 6). Participants that were excluded and consumed either mild
(mean=10.75) or spicy (mean=8.267) soup before Cyberball reported having significantly less
balls tossed to them. The number of balls tossed to participants was not affected by the
consumption of either spicy or mild soup prior to playing Cyberball. The effect of manipulation
(P<0.0001), included or excluded during Cyberball, on the overall result was statistically
significant while the effect of the spiciness level of soups (P<0.05022), spicy or mild, was not.
The mean number of reports from participants that felt ignored and excluded after
playing Cyberball was significantly higher in both mild and spicy, but only in excluded groups
A A
B
B
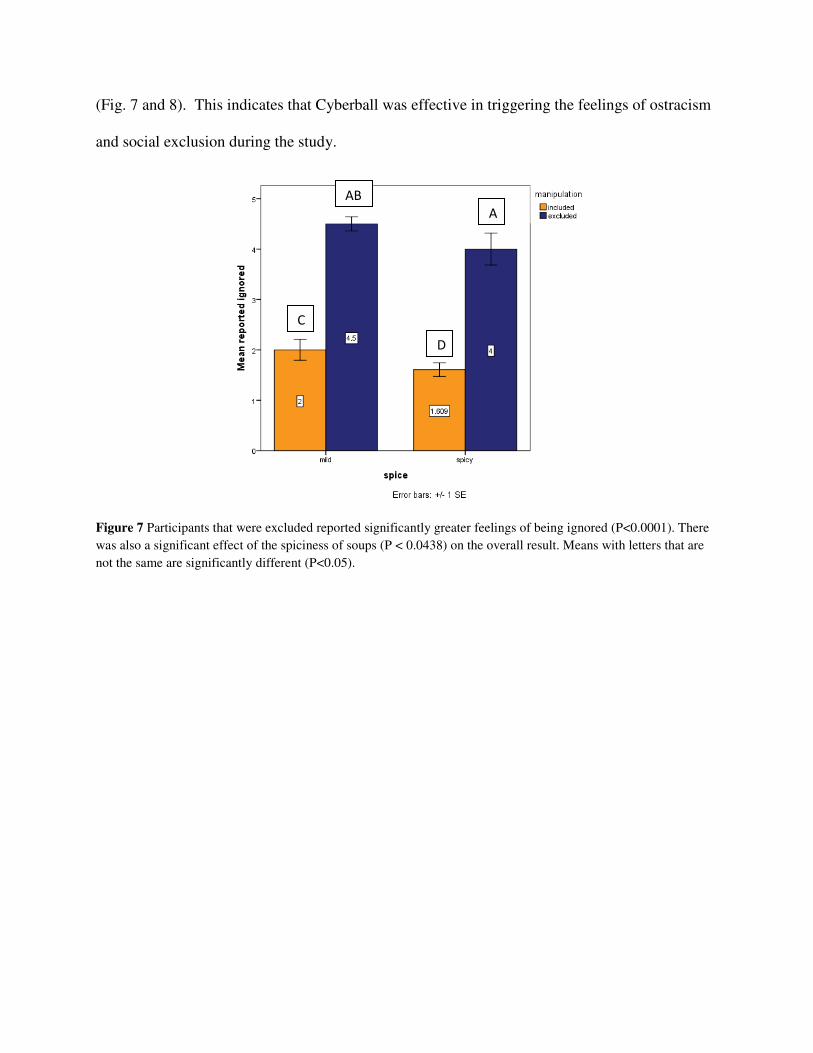
(Fig. 7 and 8). This indicates that Cyberball was effective in triggering the feelings of ostracism
and social exclusion during the study.
Figure 7 Participants that were excluded reported significantly greater feelings of being ignored (P<0.0001). There
was also a significant effect of the spiciness of soups (P < 0.0438) on the overall result. Means with letters that are
not the same are significantly different (P<0.05).
C
A
D
AB
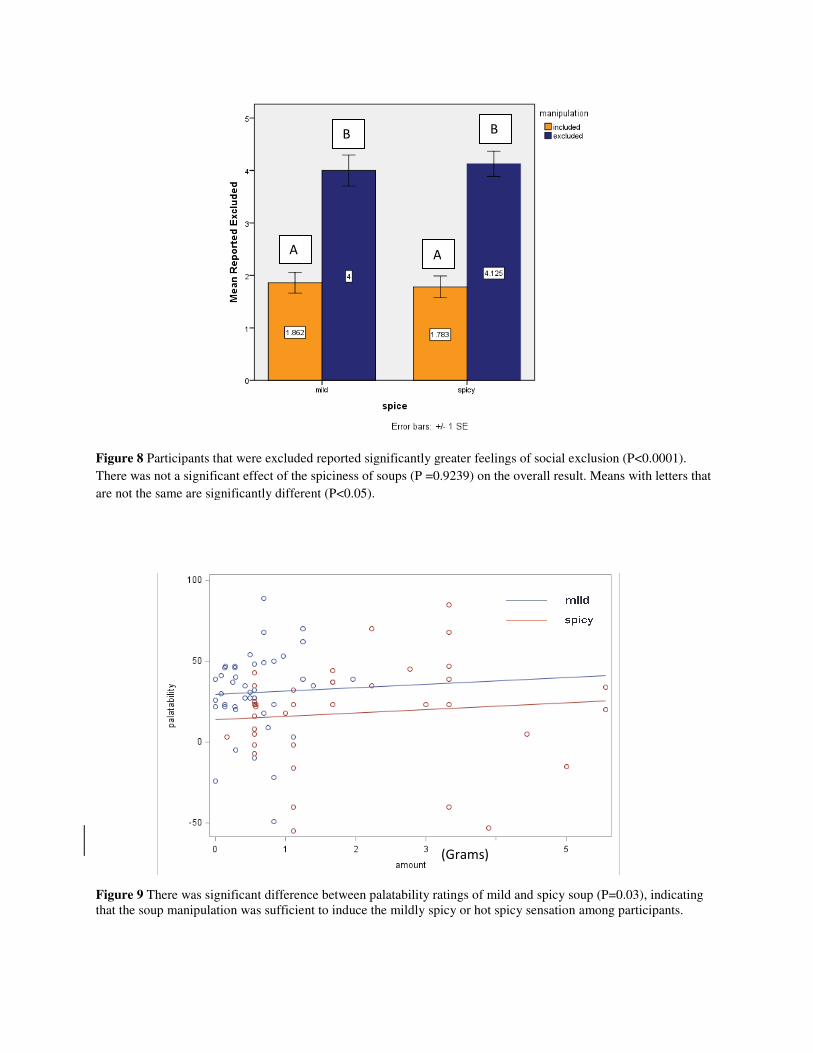
Figure 8 Participants that were excluded reported significantly greater feelings of social exclusion (P<
There was not a significant effect of the spiciness of soups (P =0.9239) on the overall result. Means with letters that
are not the same are significantly different (P<0.05).
Figure 9 There was significant difference between palatability ratings of mild and spicy soup (P=0.03), indicating that the soup manipulation was sufficient to induce the mildly spicy or hot spicy sensation among participants.
A
Participants that were excluded reported significantly greater feelings of social exclusion (P<
There was not a significant effect of the spiciness of soups (P =0.9239) on the overall result. Means with letters that
are not the same are significantly different (P<0.05).
There was significant difference between palatability ratings of mild and spicy soup (P=0.03), indicating that the soup manipulation was sufficient to induce the mildly spicy or hot spicy sensation among participants.
A
B B
(Grams)
Participants that were excluded reported significantly greater feelings of social exclusion (P<0.0001).
There was not a significant effect of the spiciness of soups (P =0.9239) on the overall result. Means with letters that
There was significant difference between palatability ratings of mild and spicy soup (P=0.03), indicating that the soup manipulation was sufficient to induce the mildly spicy or hot spicy sensation among participants.
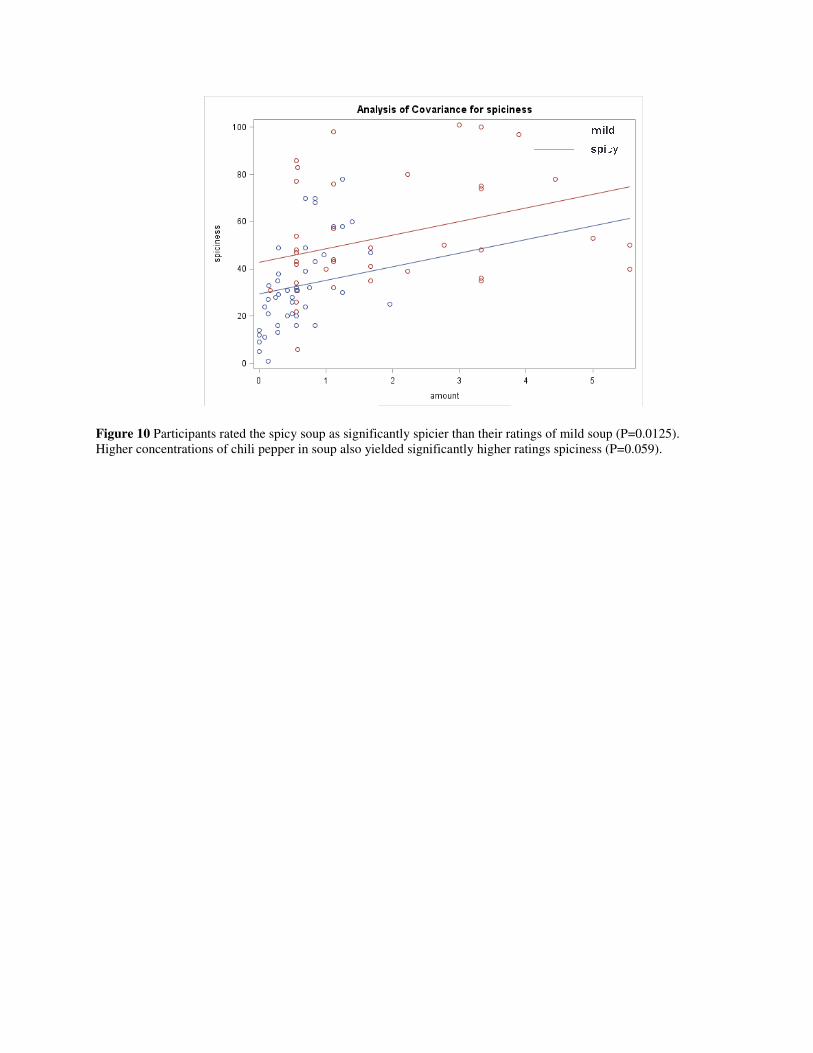
Figure 10 Participants rated the spicy soup as significantly spicier than their ratings of mild soup (P=0.0125). Higher concentrations of chili pepper in soup also yielded significantly higher ratings spiciness (P=0.059).
Participants rated the spicy soup as significantly spicier than their ratings of mild soup (P=0.0125).
Higher concentrations of chili pepper in soup also yielded significantly higher ratings spiciness (P=0.059).Participants rated the spicy soup as significantly spicier than their ratings of mild soup (P=0.0125).
Higher concentrations of chili pepper in soup also yielded significantly higher ratings spiciness (P=0.059).
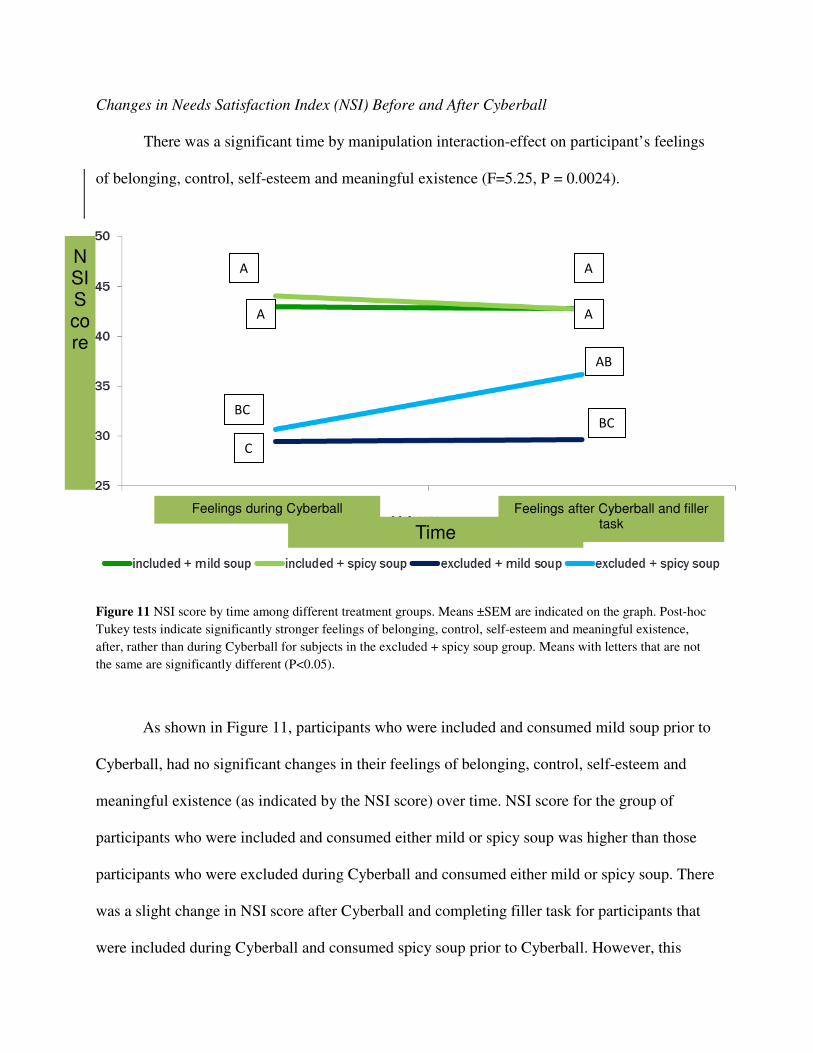
Changes in Needs Satisfaction Index (NSI) Before and After Cyberball
There was a significant time by manipulation interaction-effect on participant’s feelings
of belonging, control, self-esteem and meaningful existence (F=5.25, P = 0.0024).
Figure 11 NSI score by time among different treatment groups. Means ±SEM are indicated on the graph. Post-hoc
Tukey tests indicate significantly stronger feelings of belonging, control, self-esteem and meaningful existence,
after, rather than during Cyberball for subjects in the excluded + spicy soup group. Means with letters that are not
the same are significantly different (P<0.05).
As shown in Figure 11, participants who were included and consumed mild soup prior to
Cyberball, had no significant changes in their feelings of belonging, control, self-esteem and
meaningful existence (as indicated by the NSI score) over time. NSI score for the group of
participants who were included and consumed either mild or spicy soup was higher than those
participants who were excluded during Cyberball and consumed either mild or spicy soup. There
was a slight change in NSI score after Cyberball and completing filler task for participants that
were included during Cyberball and consumed spicy soup prior to Cyberball. However, this
NSI Score
Time
Feelings during Cyberball Feelings after Cyberball and filler task
A
A
A
A
BC
AB
BC
C

change was not as significant. Participants who were excluded during Cyberball and consumed
spicy soup prior to Cyberball had weaker feelings of belonging, control, self-esteem and
meaningful existence during Cyberball. However, after Cyberball and completing filler tasks,
their NSI score improved significantly (P=0.05). This indicates the possible delayed effect of
Capsaicin in soup.
Race and the Effect of Capsaicin on Reactions to Ostracism
Figure 12 Main effect of race was significantly different in Whites and Asians (F=6.1391, P<0.0001).
NSI Before Video NSI After Video
White, Included+Mild 40.1 40.7
White, Included+Spicy 43.11 20.5
White, Excluded+Mild 18.75 20
White, Excluded+Spicy 28.5 35.5
Asian, Included+Mild 44.47 44.33
Asian, Included+Spicy 43.73 42.64
Asian, Excluded+Mild 35.25 34.63
Asian, Excluded+Spicy 37.25 38 Table 2 Differences in NSI score in White and Asian Participants. Both groups had similar effect when consumed
mild or spicy soup in the presence of social exclusion. Figure 13a and b will show the statistical significance of these
results.
0
10
20
30
40
50
60
1
Me
an
Ne
ed
s S
ati
sfa
ctio
n I
nd
ex
American Indian
Asians
Black
Pacific Islander
Unknown
White
A
A
B
ABAB
AB

Figure 13a and b. Whites that were excluded during Cyberball had significant improvements in NSI scores than
Asians when consumed spicy soup. NSI scores for both Whites and Asians that were included during Cyberball had
higher NSI scores than both Whites and Asians that were excluded during Cyberball. Means with letters that are not
the same are significantly different (P<0.05)
0
5
10
15
20
25
30
35
40
45
50
During After
Me
an
Ne
ed
s S
ati
sfa
ctio
n I
nd
ex
(N
SI)
Asians
Included and Mild
Included and Spicy
Excluded and Mild
Excluded and Spicy
AAAAAAA
A
0
5
10
15
20
25
30
35
40
45
50
During After
Me
an
Ne
ed
s S
ati
sfa
ctio
n I
nd
ex
(N
SI)
Whites
Included and Mild
Included and Spicy
Excluded and Mild
Excluded and Spicy
AAA
A
B B
B
A
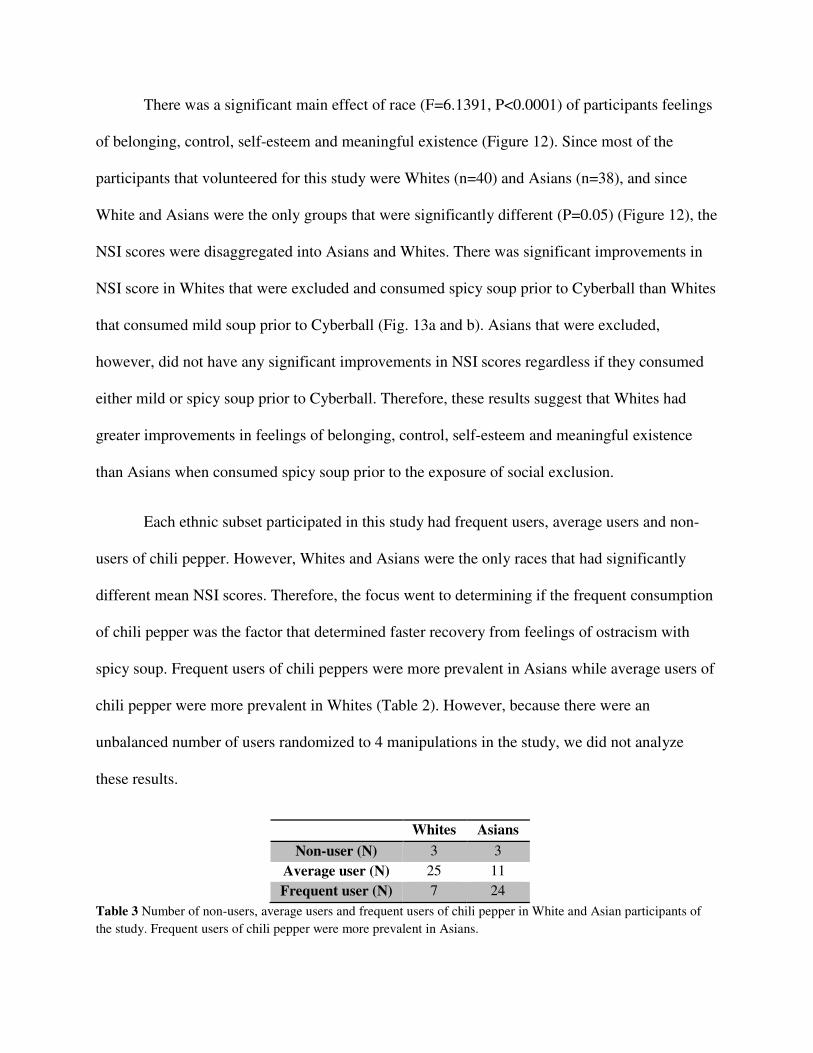
There was a significant main effect of race (F=6.1391, P<0.0001) of participants feelings
of belonging, control, self-esteem and meaningful existence (Figure 12). Since most of the
participants that volunteered for this study were Whites (n=40) and Asians (n=38), and since
White and Asians were the only groups that were significantly different (P=0.05) (Figure 12), the
NSI scores were disaggregated into Asians and Whites. There was significant improvements in
NSI score in Whites that were excluded and consumed spicy soup prior to Cyberball than Whites
that consumed mild soup prior to Cyberball (Fig. 13a and b). Asians that were excluded,
however, did not have any significant improvements in NSI scores regardless if they consumed
either mild or spicy soup prior to Cyberball. Therefore, these results suggest that Whites had
greater improvements in feelings of belonging, control, self-esteem and meaningful existence
than Asians when consumed spicy soup prior to the exposure of social exclusion.
Each ethnic subset participated in this study had frequent users, average users and non-
users of chili pepper. However, Whites and Asians were the only races that had significantly
different mean NSI scores. Therefore, the focus went to determining if the frequent consumption
of chili pepper was the factor that determined faster recovery from feelings of ostracism with
spicy soup. Frequent users of chili peppers were more prevalent in Asians while average users of
chili pepper were more prevalent in Whites (Table 2). However, because there were an
unbalanced number of users randomized to 4 manipulations in the study, we did not analyze
these results.
Whites Asians
Non-user (N) 3 3
Average user (N) 25 11
Frequent user (N) 7 24
Table 3 Number of non-users, average users and frequent users of chili pepper in White and Asian participants of
the study. Frequent users of chili pepper were more prevalent in Asians.
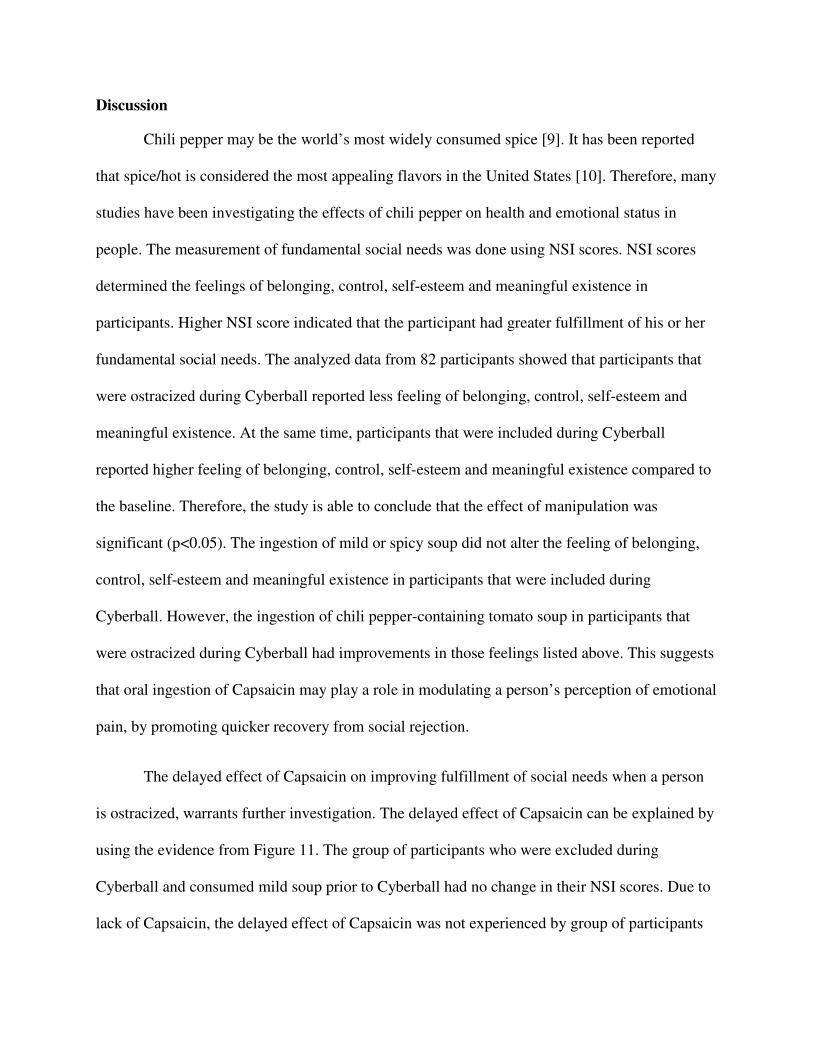
Discussion
Chili pepper may be the world’s most widely consumed spice [9]. It has been reported
that spice/hot is considered the most appealing flavors in the United States [10]. Therefore, many
studies have been investigating the effects of chili pepper on health and emotional status in
people. The measurement of fundamental social needs was done using NSI scores. NSI scores
determined the feelings of belonging, control, self-esteem and meaningful existence in
participants. Higher NSI score indicated that the participant had greater fulfillment of his or her
fundamental social needs. The analyzed data from 82 participants showed that participants that
were ostracized during Cyberball reported less feeling of belonging, control, self-esteem and
meaningful existence. At the same time, participants that were included during Cyberball
reported higher feeling of belonging, control, self-esteem and meaningful existence compared to
the baseline. Therefore, the study is able to conclude that the effect of manipulation was
significant (p<0.05). The ingestion of mild or spicy soup did not alter the feeling of belonging,
control, self-esteem and meaningful existence in participants that were included during
Cyberball. However, the ingestion of chili pepper-containing tomato soup in participants that
were ostracized during Cyberball had improvements in those feelings listed above. This suggests
that oral ingestion of Capsaicin may play a role in modulating a person’s perception of emotional
pain, by promoting quicker recovery from social rejection.
The delayed effect of Capsaicin on improving fulfillment of social needs when a person
is ostracized, warrants further investigation. The delayed effect of Capsaicin can be explained by
using the evidence from Figure 11. The group of participants who were excluded during
Cyberball and consumed mild soup prior to Cyberball had no change in their NSI scores. Due to
lack of Capsaicin, the delayed effect of Capsaicin was not experienced by group of participants
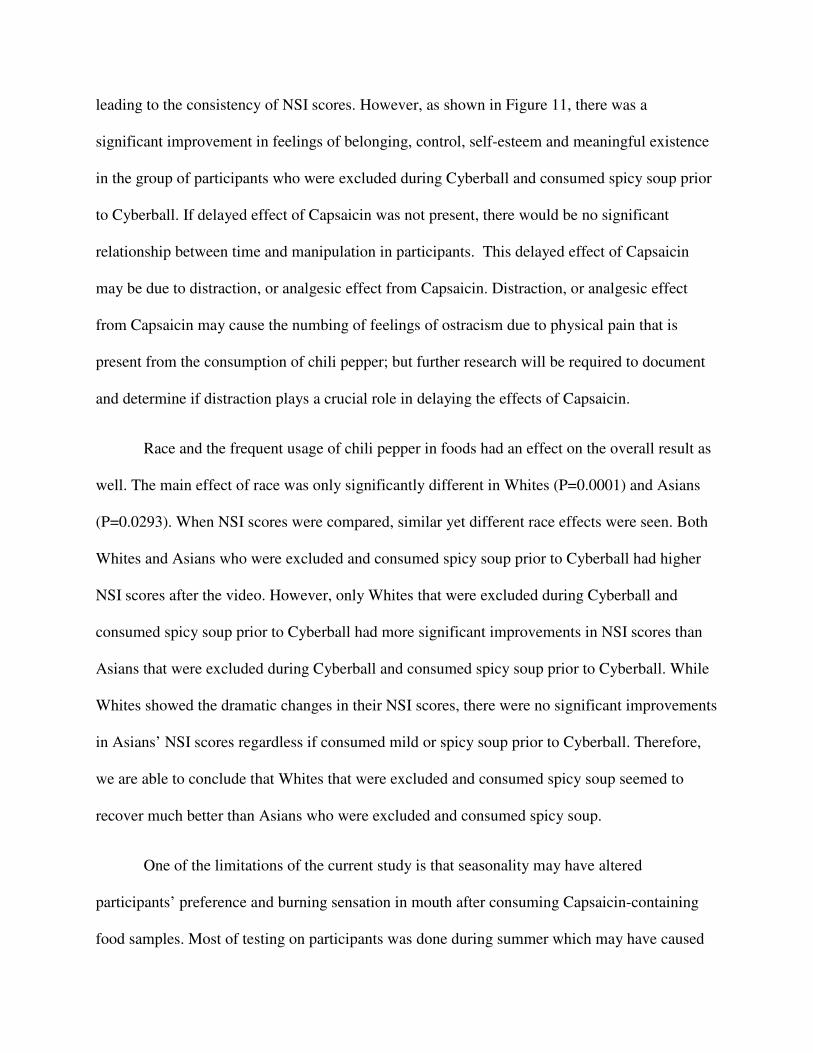
leading to the consistency of NSI scores. However, as shown in Figure 11, there was a
significant improvement in feelings of belonging, control, self-esteem and meaningful existence
in the group of participants who were excluded during Cyberball and consumed spicy soup prior
to Cyberball. If delayed effect of Capsaicin was not present, there would be no significant
relationship between time and manipulation in participants. This delayed effect of Capsaicin
may be due to distraction, or analgesic effect from Capsaicin. Distraction, or analgesic effect
from Capsaicin may cause the numbing of feelings of ostracism due to physical pain that is
present from the consumption of chili pepper; but further research will be required to document
and determine if distraction plays a crucial role in delaying the effects of Capsaicin.
Race and the frequent usage of chili pepper in foods had an effect on the overall result as
well. The main effect of race was only significantly different in Whites (P=0.0001) and Asians
(P=0.0293). When NSI scores were compared, similar yet different race effects were seen. Both
Whites and Asians who were excluded and consumed spicy soup prior to Cyberball had higher
NSI scores after the video. However, only Whites that were excluded during Cyberball and
consumed spicy soup prior to Cyberball had more significant improvements in NSI scores than
Asians that were excluded during Cyberball and consumed spicy soup prior to Cyberball. While
Whites showed the dramatic changes in their NSI scores, there were no significant improvements
in Asians’ NSI scores regardless if consumed mild or spicy soup prior to Cyberball. Therefore,
we are able to conclude that Whites that were excluded and consumed spicy soup seemed to
recover much better than Asians who were excluded and consumed spicy soup.
One of the limitations of the current study is that seasonality may have altered
participants’ preference and burning sensation in mouth after consuming Capsaicin-containing
food samples. Most of testing on participants was done during summer which may have caused

the elevation of body temperature in participants. Therefore, the elevated body temperature may
have affected participants’ preference and burning sensation in mouth after consuming
Capsaicin-containing food samples. Further research will be required to have better control over
the body temperature by conducting the experiment in the fall, spring and winter to determine if
there are any seasonality differences. There are other limitations of the current study such as the
short period of assessment, an unbalanced proportion of chili users and inconsistency of the
water bath temperature which may have affected spiciness and hedonic rating of the tomato soup
samples. These may be required to be controlled in further research studies for more accurate
results.
References
1. Eisenberger, N. I. (2003). Does Rejection Hurt? An fMRI Study of Social Exclusion.
Science, 302(5643), 290–292. doi:10.1126/science.1089134
2. Williams, K. D., & Jarvis, B. (2006). Cyberball: a program for use in research on
interpersonal ostracism and acceptance. Behav Res Methods, 38(1), 174-180.
3. Baron, R., Wasner, G., Borgstedt, R., Hastedt, E., Schulte, H., Binder, A., … Fields, H. L.
(1999). Effect of sympathetic activity on capsaicin-evoked pain, hyperalgesia, and
vasodilatation. Neurology, 52(5), 923–932.
4. Blais, A.-R., & Weber, E. U. (2006). A Domain-Specific Risk-Taking (DOSPERT) scale
for adult populations. Judgment and Decision Making, 1(1), 33–47.
5. Lawless, H., Rozin, P., & Shenker, J. (1985). Effects of oral capsaicin on gustatory,
olfactory and irritant sensations and flavor identification in humans who regularly or
rarely consume chili pepper. Chemical Senses, 10(4), 579–589.
doi:10.1093/chemse/10.4.579
6. Bartoshuk, L. M., Duffy, V. B., Green, B. G., Hoffman, H. J., Ko, C.-W., Lucchina, L. A.,
… Weiffenbach, J. M. (2004). Valid across-group comparisons with labeled scales: the
gLMS versus magnitude matching. Physiology & behavior, 82(1), 109–114.
doi:10.1016/j.physbeh.2004.02.033
7. Lim, J., Wood, A., & Green, B. G. (2009). Derivation and Evaluation of a Labeled
Hedonic Scale. Chemical Senses, 34(9), 739–751. doi:10.1093/chemse/bjp054
8. Williams, K. D. (2001). Ostracism: The power of silence. New York, NY US: Guilford
Press.
9. Rozin P, Schiller D. (1980). The nature and acquisition of a preference for chili pepper by
humans. Motiv Emotion, 4, 77-101.
10. Solan A. (2010). What, when, and where America eats. Food Technology, 64, 19-27.
11. Merskey, H. & Bogduk, N. (1994) International Association for the Study of Pain Task
Force On Taxonomy. Classification of Chronic Pain: Description of Chronic Pain
Syndromes and Definition of Pain Terms, edn. 2, Seattle, IASP Press.
12. Herman, B.H., & Panksepp, J. (1978). Effects of morphine and naloxone on separation
distress and approach attachment: evidence for opiate mediation of social affect.
Pharmacology and Biochemical Behavior, 9, 213-220.
13. Nelson, E.E. & Panksepp, J. (1998). Brain substrates of infant-mother attachment:
Contributions of opioids, oxytocin, and norepinephrine. Neuroscience and Biobehavioral
Reviews, 22, 437-452.
14. Davis, K.D., Hutchison, W.D., Lozano, A.M., & Dostrovsky, J.O. (1994). Altered pain
and temperature perception following cingulotomy and capsulotomy in a patient with
schizoaffective disorder. Pain, 59, 189-199.
15. Tow, P.M. & Whitty, C.W.M. (1953). Personality changes after operations of the
cingulate gyrus in man. Journal of Neurology, Neurosurgery, and Psychiatry, 16, 186-
193.
16. Leary, M.R. & Springer, C.A. (2001). Hurt feelings: The neglected emotion, in R.M.
Kowalski (Ed). Behaving Badly: Aversive Behaviors in Interpersonal Relationships, pp.
151-175. Washington, DC, US: American Psychological Association.
17. Lawless HT, Heymann H. (1998). Sensory evaluation of food; principles and practices.
New York, NY. Chapman and Hall.
18. Bartoshuk LM. (2000). Comparing sensory experiences across individuals: Recent
psychophysical advances illuminate genetic variation in taste perception. Chem Senses
25(4):447-60.
19. Cardello A, Lawless HT, Schutz HG. (2008). Effects of extreme anchors and interior
label spacing on labeled affective magnitude scales. Food Qual Prefer 19(5):473-80.
20. Bartoshuk LM, Duffy V, Green BG, Hoffman HJ, Ko CW, Lucchina LA, Marks LE,
Snyder DJ,
Weiffenbach JM. (2004a). Valid across-group comparisons with labeled scales: the
gLMS versus magnitude matching. Physiol Behav 82(1):109-14.
21. Prescott, J. and Stevenson, R.J. (1995b). The effects of oral chemical irritation on tastes
and flavors in frequent and infrequent users of chili. Physiol. Behav., 58, 1117–1127.
22. Ku Y, Choi S. (1990). The composition of foods. The Scientific Technology of Kimchi.
Seoul, Korea: Korean Institute of Food Development. 33-34
23. Ludy M, Mattes R. (2011). The effects of hedonically acceptable red pepper doses on
thermogenesis and appetite. Physiol. Behav., 102, 251-258.
24. Terasaki M, Imada S. (1987). Sensation seeking and food preferences. Person. Individ.
Diff. 9(1), 87-93.
25. Zadro L, Williams K, Richardson R. (2004). How low can you go? Ostracism by a
computer is sufficient to lower self-reported levels of belonging, control, self-esteem and
meaningful existence. Journal of Experimental Social Psychology. 40(4), 560-567.