the effect of temperature and heating time on the
TRANSCRIPT

THE EFFECT OF TEMPERATURE AND HEATING TIME ON THE FORMATION
OF ALPHA, BETA UNSATURATED HYDROXYALDEHYDES IN VARIOUS
VEGETABLE OILS AND FATS
A THESIS
SUBMITTED TO THE FACULTY OF
UNIVERSITY OF MINNESOTA
BY
XIAOYU LIU
IN PARTIAL FULFILLMENT OF THE REQUIREMENTS
FOR THE DEGREE OF
MASTER OF SCIENCE
A. SAARI CSALLANY
AUGUST 2014

© Xiaoyu Liu 2014

i
Acknowledgements
I would like to express appreciation to my advisor, A. Saari Csallany, who gave me
instruction, support and help during my research and the writing of the thesis.
I would like to thank my examining committee members, Dr. Gary Reineccius and
Dr. Daniel Gallaher.
I am also grateful to Dr. Don Shoeman who is a senior scientist in the lab and he
made my research process smoothly, and Dr. Cheryl Ainslie who assisted me in learning
the operation of HPLC.
Finally, I would thank my family and friends for their unconditional love, support
and encouragement.

ii
Abstract
A certain group of secondary lipid oxidation products, α, β-unsaturated-4-
hydroxyaldehydes, is of special interest because of their high reactivity to various
biologically important compounds like proteins and DNA. The formation of
4-hydroxy-2-trans-nonenal (HNE), 4-hydroxy-2-trans-hexenal (HHE),
4-hydroxy-2-trans-octenal (HOE) and 4-hydroxy-2-trans-decenal (HDE), as well as total
polar and nonpolar aldehydes was investigated in commercial corn, soybean, peanut,
canola oils, lard and beef tallow which were heat treated at different temperatures (145,
165 and 185°C) for different length of heating time. The formation of the four
hydroxyaldehydes was monitored by the high-performance liquid chromatography
(HPLC).
These oils and fats were selected based on their different degree of unsaturation and
fatty acid distributions. Preliminary experiments were conducted using the thiobarbituric
acid (TBA) assay to select the proper conditions of temperatures and heating time before
the measurement of the aldehyde concentration by HPLC. These oils and fats were heat
treated at 145, 165 and 185°C for 1, 3, and 5 hours to measure the formation of the α,
β-unsaturated-4-hydroxyaldehydes as 2,4-dinitrophenylhydrazone derivatives using
HPLC system.
In general, the formation of HHE, HOE, HNE and HDE increased with higher
temperatures (145, 165 and 185°C), longer heating time (in the range of 0 to 5 hours) and
higher unsaturation in the samples. As was expected, the concentration of HNE was

iii
much higher than that of the other three 4-hydroxyaldehydes in all the samples measured.
The sum total of polar aldehydes increased with higher temperatures and longer heating
time. The sum total of nonpolar aldehyde concentration increased slightly with increased
temperatures and heating time in vegetable oils which contain longer chain fatty acids,
while the concentration did not change or even decreased along with temperatures and
heating time in animal fats which contain more short-chain fatty acids. The decrease of
total nonpolar aldehydes formation seems to be related to the volatility of the short chain
aldehydes at elevated temperatures.
It was found that the formation of all the four toxic α, β-unsaturated-4-
hydroxyaldehydes was dependent on temperature, time of heat treatment and the level of
linoleic acid in the oils.
Therefore, to minimize the formation of these toxic compounds in high linoleic acid
containing oils, the lowest temperature and the shortest heating time should be used.

iv
Table of Contents
Acknowledgements .............................................................................................................. i
Abstract ............................................................................................................................... ii
Table of Contents ............................................................................................................... iv
List of Tables .................................................................................................................... vii
List of Figures .................................................................................................................. viii
Introduction ......................................................................................................................... 1
Part I: Literature Review ..................................................................................................... 3
Thermal oxidation and its chemical reactions ................................................................ 3
Secondary oxidation and the formation of aldehydes in thermal oxidation ................... 6
Recent studies measuring oxidation in various oils and fats ........................................ 10
The formation of 4-hydroxy-2-nonenal (HNE) ............................................................ 15
Health aspects of thermoxidized oils and fats and recent studies on HNE in food
systems .......................................................................................................................... 20
Objectives ..................................................................................................................... 27
Part II: Experiments .......................................................................................................... 28
Methods and Materials .................................................................................................. 28
Chemicals and Instruments ....................................................................................... 28
Thermal Treatments of the Oil Samples ................................................................... 29

v
Peroxide Value .......................................................................................................... 29
Fatty Acid Distribution by Gas Chromatography ..................................................... 30
Thiobarbituric Acid (TBA) Test ............................................................................... 30
Method to Determine the Secondary Oxidation Products of Samples ..................... 33
Statistical Analysis .................................................................................................... 40
Results ........................................................................................................................... 41
A. Preliminary Experiments...................................................................................... 41
B. Formation of HNE, the Major Toxic α, β-Unsaturated-4-Hydroxyaldehyde, in
Commercial Corn, Soybean, Peanut, Canola oils, Lard and Beef Tallow Due to 0, 1,
3 and 5 Hours of Thermal Oxidation at 145°C,165°C and 185 °C ........................... 48
C. Formation of HHE, HOE and HDE, the Minor Toxic α, β- unsaturated-4-
hydroxyaldehydes, in Commercial Corn, Soybean, Peanut and Canola Oils Due to 0,
1, 3 and 5 Hours of Thermal Oxidation at 145°C,165°C and 185 °C ....................... 61
D. Comparison between the Formation of HHE, HOE, HNE and HDE in
Commercial Corn, Soybean, Peanut and Canola Oils Heat Treated for 5 Hours at
185°C ........................................................................................................................ 81
E. The Formation of the Sum Total of the Four α, β-Unsaturated
4-Hydroxyaldehydes including HHE, HOE, HNE and HDE in Commercial Corn,
Soybean, Peanut and Canola Oils at 145, 165 and 185°C over 5 hours Heating
Period ........................................................................................................................ 89

vi
F. The Formation of the Sum Total of Individual Polar Lipophilic Aldehydes in
Commercial Corn, Soybean, Peanut, Canola oils, Lard and Beef Tallow Heat
Treated for up to 5 Hours at 145, 165 and 185°C ..................................................... 94
G. The Formation of the Sum Total of Individual Nonpolar Lipophilic Aldehydes in
Commercial Corn, Soybean, Peanut, Canola oils, Lard and Beef Tallow Heat
Treated for up to 5 Hours at 145, 165 and 185°C ................................................... 104
Discussion ................................................................................................................... 113
References ....................................................................................................................... 116
Appendix A: Statistical Analyses ................................................................................... 127
Appendix B: Figures ....................................................................................................... 141

vii
List of Tables
Table 1. The Concentration of MDA for TBARS standard curve ............................. 32
Table 2. Peroxide value of unheated oils and fats ........................................................ 41
Table 3. Retention times of pure fatty acids using GC ................................................ 42
Table 4. Percent fatty acid distribution for unheated commercial corn, soybean,
peanut, canola oils, lard and beef tallow (Unit: %) ..................................................... 42
Table 5. Rates of HHE, HOE, HNE and HDE formation in commercial corn,
soybean, peanut, canola oils, lard and beef tallow heated at 185, 165 and 145°C for 5
hours ................................................................................................................................. 88
Table 6. Rates of total polar aldehydes formation in commercial corn, soybean,
peanut, canola oils, lard and beef tallow heated at 185, 165 and 145°C for 5 hours
......................................................................................................................................... 103
Table 7. Rates of total nonpolar aldehydes formation in commercial corn, soybean,
peanut, canola oils, lard and beef tallow heated at 185, 165 and 145°C for 5 hours
......................................................................................................................................... 112

viii
List of Figures
Figure 1. The initiation, propagation, and termination of free radical induced thermal
oxidation of oils and fats ..................................................................................................... 5
Figure 2. General scheme for lipid oxidation (From Ref.(19)) ........................................... 6
Figure 3. Mechanism of hydroperoxide decomposition to form secondary oxidation
products (From Ref. (22)) ................................................................................................... 7
Figure 4. The classes of substances formed by enzymatic or non-enzymatic peroxidation
of PUFA (from Ref (23) ) ................................................................................................... 8
Figure 5. Generalized scheme for thermal decomposition of lipids (From Ref.(19)) ........ 9
Figure 6. Chemical structures of the four α, β-unsaturated-4-hydroxyaldehydes ............ 16
Figure 7. Formation of 9- and 13- hydroperoxides from linoleic acid ............................. 18
Figure 8. Mechanism of formation of HNE from 13(S)-HPODE (A) and 9(R)-HPODE (B)
........................................................................................................................................... 19
Figure 9. Michael addition reaction and HNE adduct products of cysteine, lysine, and
histidine. (From Ref. (2)) .................................................................................................. 23
Figure 10. TBA assay standard curve ............................................................................... 32
Figure 11. Position of polar and nonpolar aldehydes-DNPH derivatives after TLC
Development. Plate was developed in HPLC-grade dichloromethane. ............................ 37
Figure 12. HPLC separation of a mixture of standards. DNPH derivatives of A: HHE, B:
HOE, C: HNE and D: HDE. ............................................................................................. 39

ix
Figure 13. TBARS formation at various temperatures and heating time for commercial
corn, soybean, and canola oils .......................................................................................... 45
Figure 14. TBARS formation at various temperatures and heating time for corn, peanut
oils, lard and beef tallow ................................................................................................... 46
Figure 15. The HNE formation in commercial corn oil at various heating time and
temperatures ...................................................................................................................... 49
Figure 16. The HNE formation in commercial soybean oil at various heating time and
temperatures ...................................................................................................................... 51
Figure 17. The HNE formation in commercial peanut oil at various heating time and
temperatures ...................................................................................................................... 53
Figure 18. The HNE formation in commercial canola oil at various heating time and
temperatures ...................................................................................................................... 55
Figure 19. The HNE formation in lard at various heating time and temperatures............ 56
Figure 20. The HNE formation in beef tallow after 185°C and 5 hours of heating period
........................................................................................................................................... 57
Figure 21 (a). Comparison of HNE concentration in 6 different oils and fats heat treated
for 1, 3 and 5 hours at 185 °C. .......................................................................................... 59
Figure 22. The HHE formation in commercial corn oil at various heating time and
temperatures ...................................................................................................................... 62
Figure 23. The HOE formation in commercial corn oil at various heating time and
temperatures ...................................................................................................................... 63

x
Figure 24. The HDE formation in commercial corn oil at various heating time and
temperatures ...................................................................................................................... 63
Figure 25. The HHE formation in commercial soybean oil at various heating time and
temperatures ...................................................................................................................... 65
Figure 26. The HOE formation in commercial soybean oil at various heating time and
temperatures ...................................................................................................................... 66
Figure 27. The HDE formation in commercial soybean oil at various heating time and
temperatures ...................................................................................................................... 66
Figure 28. The HHE formation in commercial peanut oil after 185°C and 5 hours of
heating period.................................................................................................................... 68
Figure 29. The HOE formation in commercial peanut oil after 185°C and 5 hours of
heating period.................................................................................................................... 68
Figure 30. The HDE formation in commercial peanut oil after 185°C and 1, 3 and 5 hours
of heating periods .............................................................................................................. 69
Figure 31. The HHE formation in commercial canola oil at various heating time and
temperatures ...................................................................................................................... 71
Figure 32. The HOE formation in commercial canola oil at various heating time and
temperatures ...................................................................................................................... 71
Figure 33. The HDE formation in commercial canola oil at various heating time and
temperatures ...................................................................................................................... 72
Figure 34 (a). Comparison of HHE concentrations between four different oils heat treated
for 1, 3 and 5 hours at 185 °C. .......................................................................................... 74

xi
Figure 35 (a). Comparison of HOE concentrations between four different oils heat treated
for 1, 3 and 5 hours at 185 °C. .......................................................................................... 77
Figure 36 (a). Comparison of HDE concentrations between four different oils heat treated
for 1, 3 and 5 hours at 185 °C. .......................................................................................... 79
Figure 37. Comparison between the formation of HHE, HOE, HNE and HDE in
commercial corn oil heat treated for 5 hours at 185°C ..................................................... 81
Figure 38. Comparison between the formation of HHE, HOE, HNE and HDE in
commercial soybean oil heat treated for 5 hours at 185°C ............................................... 82
Figure 39. Comparison between the formation of HHE, HOE, HNE and HDE in
commercial peanut oil heat treated for 5 hours at 185°C ................................................. 83
Figure 40. Comparison between the formation of HHE, HOE, HNE and HDE in
commercial canola oil heat treated for 5 hours at 185°C .................................................. 84
Figure 41. Comparison between the concentration of HHE, HOE, HNE and HDE in
commercial corn, soybean, peanut and canola oils heat treated for 5 hours at 185°C ...... 86
Figure 42. The formation of the sum of four α, β-unsaturated- 4-hydroxyaldehydes
including HHE, HOE, HNE and HDE in corn oil at 145, 165 and 185°C over 5 hours
heating period.................................................................................................................... 90
Figure 43. The formation of the sum of four α, β-unsaturated- 4-hydroxyaldehydes
including HHE, HOE, HNE and HDE in soybean oil at 145, 165 and 185°C over 5 hours
heating period.................................................................................................................... 91
xii
Figure 44. The formation of the sum of four α, β-unsaturated-4- hydroxyaldehydes
including HHE, HOE, HNE and HDE in peanut oil at 145, 165 and 185°C over 5 hours
heating period.................................................................................................................... 92
Figure 45. The formation of the sum of four α, β-unsaturated- 4-hydroxyaldehydes
including HHE, HOE, HNE and HDE in canola oil at 145, 165 and 185°C over 5 hours
heating period.................................................................................................................... 93
Figure 46. The formation of the sum total of polar lipophilic aldehydes in commercial
corn oil heat treated for up to 5 hours at 145, 165 and 185°C .......................................... 95
Figure 47. The formation of the sum total of polar lipophilic aldehydes in commercial
soybean oil heat treated for up to 5 hours at 145, 165 and 185°C .................................... 95
Figure 48. The formation of the sum total of polar lipophilic aldehydes in commercial
peanut oil heat treated for up to 5 hours at 145, 165 and 185°C ...................................... 96
Figure 49. The formation of the sum total of polar lipophilic aldehydes in commercial
canola oil heat treated for up to 5 hours at 145, 165 and 185°C ....................................... 96
Figure 50. The formation of the sum total of polar lipophilic aldehydes in lard heat
treated for up to 5 hours at 145, 165 and 185°C ............................................................... 97
Figure 51. The formation of the sum total of polar lipophilic aldehydes in beef tallow heat
treated for up to 5 hours at 185°C ..................................................................................... 97
Figure 52 (a). The formation of the sum total of individual polar lipophilic aldehydes in
commercial corn, soybean, peanut, canola oils, lard and beef tallow heat treated for 1, 3
and 5 hours at 185 °C ...................................................................................................... 100

xiii
Figure 53. The formation of the sum total of nonpolar lipophilic aldehydes in commercial
corn oil heat treated for up to 5 hours at 145, 165 and 185°C ........................................ 105
Figure 54. The formation of the sum total of nonpolar lipophilic aldehydes in commercial
soybean oil heat treated for up to 5 hours at 145, 165 and 185°C .................................. 105
Figure 55. The formation of the sum total of nonpolar lipophilic aldehydes in commercial
peanut oil heat treated for up to 5 hours at 145, 165 and 185°C .................................... 106
Figure 56. The formation of the sum total of nonpolar lipophilic aldehydes in commercial
canola oil heat treated for up to 5 hours at 145, 165 and 185°C ..................................... 106
Figure 57. The formation of the sum total of nonpolar lipophilic aldehydes in lard heat
treated for up to 5 hours at 145, 165 and 185°C ............................................................. 107
Figure 58. The formation of the sum total of nonpolar lipophilic aldehydes in beef tallow
oil heat treated for up to 5 hours at 185°C ...................................................................... 107
Figure 59 (a). The formation of the sum total of individual nonpolar lipophilic aldehydes
in commercial corn, soybean, peanut, canola oils, lard and beef tallow heat treated for 1,
3 and 5 hours at 185 °C ................................................................................................... 109
Figure 60. Comparison of the sum total of polar aldehydes and HNE formation in
commercial corn oil heated for 1, 3 and 5 hours at 145, 165 and 185°C ........................ 141
Figure 61. Comparison of the sum total of polar aldehydes and HNE formation in
commercial soybean oil heated for 1, 3 and 5 hours at 145, 165 and 185°C .................. 141
Figure 62. Comparison of the sum total of polar aldehydes and HNE formation in
commercial peanut oil heated for 1, 3 and 5 hours at 145, 165 and 185°C .................... 142

xiv
Figure 63. Comparison of the sum total of polar aldehydes and HNE formation in
commercial canola oil heated for 1, 3 and 5 hours at 145, 165 and 185°C .................... 142
Figure 64. Comparison of the sum total of polar aldehydes and HNE formation in lard
heated for 1, 3 and 5 hours at 145, 165 and 185°C ......................................................... 143
Figure 65. Comparison of the sum total of polar aldehydes and HNE formation in beef
heated for 5 hours at 185°C ............................................................................................ 143

1
Introduction
Lipid oxidation causes major chemical changes in oils and fats, especially at elevated
temperatures. Degradation products include the primary oxidation product
hydroperoxides and secondary lipid oxidation products, such as alkanals, alkenals,
alkadienals and α, β- unsaturated-4-hydroxyaldehydes. The group of four α,
β-unsaturated-4-hydroxyaldehydes is of particular interest because of their high reactivity
to various compounds including biomolecules such as DNA and proteins (1-4). These
four compounds are: 4-hydroxy-2-trans-nonenal (HNE), 4-hydroxy-2-trans-hexenal
(HHE), 4-hydroxy-2-trans-octenal (HOE) and 4-hydroxy-2-trans-decenal (HDE). α,
β-Unsaturated-4-hydroxyaldehydes are cytotoxic and mutagenic because they can react
with the thiol (SH) and amino (NH2) groups and this reaction results in DNA and protein
modification. Recent experiments reported in the literature relate the toxicity of these
compounds, especially HNE, to numerous diseases such as atherosclerosis, stroke, liver
disease, Parkinson’s disease, Alzheimer’s disease and Huntington’s disease (5-7). HNE
can alter the structure and function of these disease related proteins. HNE has been
shown to form in highly polyunsaturated fatty acids (PUFAS) oils and can be
incorporated into food from the frying oil during the frying process (8, 9). Though this
group of compounds is attracting more attention, there is still little study on HHE, HOE
and HDE formation. In this laboratory, Seppanen and Csallany detected HHE, HOE,

2
HNE and HDE in heat-treated soybean oil (10, 11). Lang and Surh with their colleagues
reported HHE in vegetable oils such as sunflower, olive, sesame, corn, soybean and
perilla oils (12, 13).
The objective of this study was to determine the influence of temperature, heating
time and unsaturation on toxic α, β-unsaturated-4-hydroxyaldehydes formation in frying
oils and fats.

3
Part I: Literature Review
This literature review contains five parts. The first section introduces thermal
oxidation and basic chemical reactions. The second section discusses the formation of
secondary oxidation products. The third section reviews studies on oxidation
measurement and the effects of temperature and time on oxidation in fats and oils. The
fourth section contains the formation of HNE. Finally, the fifth section investigates the
health aspects of thermal oxidized fats and oils.
Thermal oxidation and its chemical reactions
In the food industry and culinary practice, the thermal treatment of edible fats and
oils like frying is one of the main methods used for food processing. Fried foods have
desirable flavor, color and textural attributes which make them very popular to
consumers (14).The frying temperature is usually between 150°C and 190°C (15). During
this common process, fatty acids react with oxygen in the air, and free radicals,
hydroperoxides, aldehydes, related carbonyl compounds and polymers are produced. This
reaction is called peroxidation, or thermal oxidation, when oils and fats are subjected to
heat.
The mechanism of primary oxidation or autoxidation involves three stages: initiation,
propagation and termination. Figure 1 shows the primary oxidation mechanism. In

4
initiation, the hydrogen with the weakest bond on the carbon will be removed and forms
an alkyl free radical (R ); this hydrogen is usually on the methylene groups adjacent to
the double bond, and it is very easily attached to the carbon between the two double
bonds. A molecule of oxygen is then reacted with this carbon free radical forming a lipid
peroxy radical (ROO ). This peroxy radical then attracts a hydrogen atom from another
free fatty acid (RH) to form hydroperoxide (ROOH) in propagation and a new alkyl
radical (R ) is formed on the other lipid acid. The new lipid free radical (R ) reacts with
molecular oxygen and the sequence of reactions is repeated, forming a chain reaction.
This chain reaction can greatly accelerate the thermal oxidation process. Propagation is
followed by the reaction of two free radicals which form non radical compounds so that
the oxidation is terminated.

5
Initiation RH → R· + H·
Propagation R·+O2 → ROO·
ROO· + RH → ROOH + R·
Termination ROO· + R· → ROOR
R· + R· → RR2
R: lipid alkyl
Figure 1. The initiation, propagation, and termination of free radical induced
thermal oxidation of oils and fats
Many factors influence oxidative susceptibility in food systems. The main factors are
fatty acid composition, temperature, time, oxygen concentration, catalysts and
antioxidants (16). Unsaturated fatty acids, especially the highly unsaturated fatty acids,
are more reactive than saturated fatty acids in thermal oxidation (17). High temperature
leads to faster thermal oxidation, more secondary oxidation and polymerization products
(18).

6
Secondary oxidation and the formation of aldehydes in thermal oxidation
Primary oxidation products, i.e. hydroperoxides, are easily decomposed to a wide
variety of compounds such as aldehydes, ketones and short-chain hydrocarbons. Figure 2
shows the general scheme for lipid autoxidation.
Figure 2. General scheme for lipid oxidation (From Ref.(19))

7
In hydroperoxide decomposition, first, homolytic cleavage between oxygen and a
hydroxyl forms alkoxy and hydroxy radicals. The breakdown of alkoxy radicals produces
oxo-compounds and alkyl radicals; this step is also called β-scission. After a number of
rearrangements, secondary oxidation products such as aldehydes and ketones are
produced (20, 21). Figure 3 shows the general mechanism of hydroperoxide
decomposition which forms secondary oxidation products and Figure 4 shows the classes
of substances formed by peroxidation of polyunsaturated fatty acid (PUFA).
Figure 3. Mechanism of hydroperoxide decomposition to form secondary oxidation
products (From Ref. (22))

8
Figure 4. The classes of substances formed by enzymatic or non-enzymatic
peroxidation of PUFA (from Ref (23) )
1) chain cleavage and recurrent oxidation products
n-alkanals, 2-alkenals, 2,4-alkadienals, alkatrienals,
α-hydroxyaldehydes, hydroperoxialdehydes,
4-hydroxyaldehydes, 4-hydroperoxialkenals,
malondialdehydes, α-dicarbonyls, saturated and unsaturated
ω-aldehydocarboxylic acids, saturated and unsaturated
ketones, alkanes, alkenes
2) rearrangement and consecutive products
hydroxyacids, keto-acids, keto-hydroxy-acids,
epoxy-hydroxy-acids, colneleic acid, dihydroxy acids,
keto-dihydroxy acids, trihydroxy acids
3) further peroxidation products
cycloendoperoxides (PGG2) and analogous
4) di- and polymerization products
di- and polymers linked by ether-, peroxi- or C-C- bridges
R· O2
R· ROOH
RH ROO·

9
Lipid oxidation at elevated temperatures is more complex than at lower temperatures.
Both saturated and unsaturated fatty acids can react and decompose when exposed to heat
and oxygen. A summary of these pathways is shown in Figure 5.
Figure 5. Generalized scheme for thermal decomposition of lipids (From Ref.(19))
10
Recent studies measuring oxidation in various oils and fats
Many studies have found that, in general, the higher the temperature and the longer
heating time, the greater the oxidation. Researchers usually measure the change of color,
peroxide values, iodine values, anisidine values, acid values, fatty acid content, total
polar compounds and polymers to evaluate the oxidative status of oils. In recent years,
some researchers have used HPLC and H NMR to monitor oil degradation processes.
These methods can provide information on the nature and proportions of the aldehydes
generated in these processes which are present in the oil liquid phase (24). Some methods
are not feasible to directly monitor oxidation at high temperatures. Since hydroperoxides
do not accumulate during frying as they are rapidly destroyed at temperatures near or
above 100 °C, peroxide values cannot be used to evaluate the oxidation at high
temperatures. The thiobarbituric acid (TBA) test can measure secondary lipid oxidation
product such as aldehydic degradation products and related carbonyl compounds
including malonaldehydes (25).
Some studies measure several oxidation indexes to evaluate the oxidation of edible
oils. In a study conducted by Coscione and Artz (26), the thermoxidation of partially
hydrogenated soybean oil was investigated by heating oil samples continuously for 72
hours and sampling every 12 hours at 120, 160, 180 and 200 °C. They examined the acid
value, p-anisidine value, color, dielectric constant and the triacylglycerol polymer content

11
of oil samples. It was demonstrated that the value of each oxidation index increased with
an increase in temperature and heating time.
Tyagi and Vasishtha (18) studied the changes in the characteristics and composition
of soybean oil during deep-fat frying at 170, 180 and 190°C. The refractive index,
specific gravity, color, viscosity, saponification value, and free fatty acids of soybean oil
increased with frying temperature, whereas the iodine value decreased. Deep-fat frying
for 70 hours at 170, 180, or 190°C produced an increase in the conjugated fatty acids
from initial values; the higher temperature of frying yielded somewhat higher quantities
of conjugated dienes. Trans fatty acids, which were initially absent in both soybean oil
samples, were present after 70 h of frying at 170, 180, and 190°C. No differences were
found between trans isomer content of soybean oils at 170 and 180°C; however, at 190°C,
trans isomers increased in soybean oils.
Aladedunye and Przybylski (27) investigated degradation and nutritional quality
changes in regular canola oil heated at 185 ± 5 and 215 ± 5 °C. Results showed that total
polar components (TPC), anisidine value, color and trans fatty acid content increased
significantly as a function of frying temperature and time. The extent of oxidative
deterioration, as measured by TPC formation, was 2.6 times faster during frying at
215 °C compared to 185 °C. For anisidine value, thermal degradation of the aldehydes
occurred at higher temperature, which resulted in a lower accumulation in the oil at the

12
higher frying temperature. The PUFA in the oil decreased in direct proportion to frying
temperature and time. After 7 days of frying at 215°C, the amount of PUFA was reduced
by half and the trans isomer concentration increased 2.5 times.
Some studies measured compounds that were produced during the oxidation process
at various temperatures. Houhoula, Oreopoulou, and Tzia (28) studied the thermoxidative
alterations of cottonseed oil during frying in the temperature range between 155 and
195°C. They found that the content of polar compounds, conjugated dienes, conjugated
trienes, and anisidine value increased linearly with the time of frying at a rate depending
on temperature. The FA content, as a function of time during frying at 185°C, showed a
significant increase in palmitic acid (C16:0) and a significant decrease in linoleic acid
(C18:2). Oleic acid (C18:1) also showed a small but significant decrease. The same
results were obtained for cottonseed oil heated at 185°C. Examination of anisidine value
or conjugated dienes with polar compounds showed that both anisidine value and
conjugated dienes had a linear relationship with increase of total polar compounds.
Chung, Eiserich, and Shibamoto (29) identified many volatile compounds in
headspace samples of peanut oil heated under temperatures ranging from 50 to 200 °C
using gas chromatography (GC) and gas chromatography/mass spectrometry (GC/MS).
42 Hydrocarbons, 22 aldehydes, 11 fatty acids, 8 alcohols, 8 ketones, 4 furans, 2 esters,
and 2 lactones were identified. The total amount of volatile compounds increased

13
remarkably as the temperature of the oil was increased. Fatty, deep-fried, and rancid
aromas were also found to be intensified as the temperature increased in heated peanut
oil.
Some studies were conducted to measure the relationship between temperature and
oxidation in relation to toxicity. Goicoechea and Guillen (30) investigated sunflower oil
oxidation at two different temperatures (70 and 100 °C) in the presence of air until total
polymerization using 1H nuclear magnetic resonance (
1H NMR). They monitored several
functional groups. Two groups, which were identified as oxidized triacylglycerol
structures with epoxy groups and oxygenated alpha, beta-unsaturated aldehydes, were
given special attention because of their toxicity. Differences between the oxidation
processes at two temperatures were tested. It was observed that the molar percentage of
linoleic acyl group chains began to decrease after 120 hours of heating at 70 °C with the
rate of 0.6% per hour and after 6 hours of heating at 100 °C with the rate of 1.6% per
hour. In the same study, the evolution of the iodine value showed the same trend. It was
also shown that at lower temperature`s, oxygenated alpha, beta-unsaturated aldehydes
were generated at a higher rate in the sunflower oil, whereas toxic monoepoxy
unsaturated acyl compounds were generated at a higher rate at higher temperatures in the
sunflower oil degradation.

14
Guillén and Ruiz (24) observed that there were great differences between the nature
and proportions of the various aldehydes generated at 70 and 190 °C in various oils. At
70 °C, the formation of 4-hydroperoxy-trans-2-alkenals and of 4-hydroxytrans-2-
alkenals was noteworthy, while the first were not detected in oils submitted to 190 °C and
the second ones were detected in much smaller proportions. It showed that the reactions
in which oxygen was involved were favored at intermediate temperatures whereas the
formation of 2,4-alkadienals was favored at high temperatures. In addition, they found
that oils rich in oleic acyl groups were more resistant to degradation and produced lower
proportions of toxic aldehydes than oils rich in linoleic and linolenic acyl groups.
Some studies suggest that frying fats should not be heated to 180°C (31). Fats and
oils heated below 180°C can reduce the formation of highly harmful cyclic fatty acids
monomers, decomposition products, and polymers. Higher temperatures could accelerate
the oxidative and thermal alterations, especially over 200°C (32).
There are a lot of studies on the oxidation of oils, however they usually measure or
monitor a group of compounds, therefore more detailed and specific compounds that are
of interest need to be researched under various conditions.

15
The formation of 4-hydroxy-2-nonenal (HNE)
Among secondary oxidation products, aldehydes are a major class of compounds.
These aldehydes include n-alkanals, 2-alkenals, 2,4-alkadienals, 4-hydroxyalkenals and
malonaldehyde. Oils which are rich in PUFAS will generate high levels of aldehydes and
ketones, whereas oils which are low in PUFAS will form low concentrations of selected
aldehydes (33). Among the aldehydes, one important group is identified as α, β-
unsaturated-4-hydroxyaldehydes. α, β-Unsaturated-4-hydroxyaldehydes includes
4-hydroxy-2-trans-hexenal (HHE), 4-hydroxy-2-trans-octenal (HOE),
4-hydroxy-2-trans-nonenal (HNE) and 4-hydroxy-2-trans-decenal (HDE). Figure 6 shows
the general structures of these compounds. 4-Hydroxyalkenals include a carbonyl group,
a trans double bond in position two and a hydroxyl group in position four. Only the chain
length is different between the above four compounds. It has been found that linoleic acid
is a precursor for HNE formation. HHE is from linoleic and linolenic acids with
concentration higher in linolenic acid than in linoleic acid. HOE also comes from both
linoleic and linolenic acids (34).

16
R = C2H5: 4-hydroxy-2-hexenal, HHE
R = C4H9: 4-hydroxy-2-octenal, HOE
R = C5H11: 4-hydroxy-2-nonenal, HNE
R = C6H13: 4-hydroxy-2-decenal, HNE
Figure 6. Chemical structures of the four α, β-unsaturated-4-hydroxyaldehydes
Among these aldehydes, HNE is the most important because it has been found to be
the most toxic compound and it is abundant in high PUFA oils after heat treatment. In
1993, it was suggested by Grein et al. (35) that HNE was originating from linoleic acid
through the formation and decomposition of 2,4-decadienal. Han and Csallany in this
laboratory did not find decadienal to be a precursor for HNE (34). The presently
acknowledged pathways for the formation of HNE were published by Schneider et al.
(36). In their study, 9- and 13-hydroperoxides of linoleic acid were used as starting
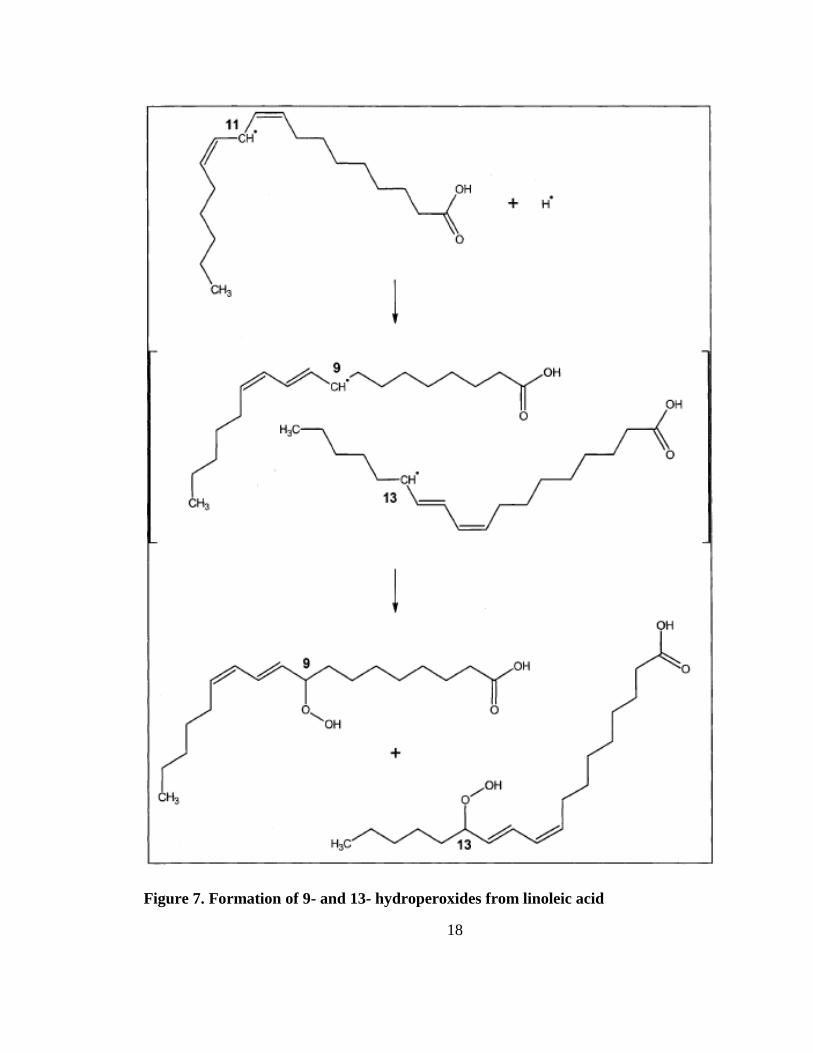
materials. Figure 7 shows the formation of 9- and 13-hydroperoxides from linoleic acid.
Two different pathways lead to the formation of 4-hydroperoxy-2E-nonenal (4-HPNE)

17
from the hydroperoxides of linoleic acid (Figure 8). One pathway is C-8 of 13S-
hydroperoxyoctadecenoic acid (HPODE) attracts a hydrogen and then forms
10,13-dihydroperoxide. The cleavage between C-9 and C-10 of 10, 13-dihydroperoxide
yields 4S-HPNE. The other pathway is 9S-HPODE cleaves directly to form 3Z-nonenal.
3Z-nonenal can be converted to 4-HPNE by 3Z-alkenal oxygenase. Then 4-HPNE can be
subsequently converted to HNE (37).
18
Figure 7. Formation of 9- and 13- hydroperoxides from linoleic acid

19
Figure 8. Mechanism of formation of HNE from 13(S)-HPODE (A) and
9(R)-HPODE (B)
20
Health aspects of thermoxidized oils and fats and recent studies on HNE in
food systems
When oils and fats are subjected to high temperatures, their physical and chemical
characteristics can be changed by oxidation (18, 38). The oxidation reaction can produce
undesirable flavors and odors which lower the quality of food. Furthermore, it can result
in the loss of nutrients, even forming toxic compounds which affect human health (39).
Liposoluble vitamins, essential fatty acids and proteins decompose during the thermal
oxidation process (40). Animal and biochemical studies show that lipid oxidation
products represent health risks. Though the acute toxicity is very low, chronic uptake of
large amounts of oxidized lipids have shown to give rise to a higher incidence of tumor
formation and atherosclerosis in animals (41).
Secondary oxidation products like aldehydes, ketones, hydroxyketones, epoxides and
dicarboxylic compounds can react with amino acids and proteins (42). These reactions
produce acrylamide at a heating temperature of above 100˚C and increase with increasing
temperature (43). Acrylamide is identified as a probable cause for the formation of
carcinogens in human body (44).
It is postulated worldwide that PUFAS have potential health benefits and people are
advised to substitute PUFAS for saturated fatty acids. There are a number of studies show
that PUFAS, mainly ω6 and ω3 PUFAS, can reduce the risk of coronary heart disease
21
(CHD), and have beneficial effects in patients with diseases such as dyslipidemia,
atherosclerosis, hypertension, diabetes mellitus, metabolic syndrome, obesity, and
inflammatory diseases (45-47). However, some researchers have found that PUFAS may
be a potential hazard to human health. Grootveld, Silwood and Claxson warned that when
subjected to frying temperature, culinary oils rich in PUFAS could produce detectable
toxic aldehydic components. Using NMR, they have shown that trans-2-nonenal and
trans-2-pentenal could be absorbed from the gut in vivo, metabolized and excreted in the
urine (48). Kim, Gallaher and Csallany also found that lipophilic aldehydes and other
carbonyl products of lipid peroxidation were detected in rat and human urine, indicating
similarity between the lipophilic product of lipid oxidation formed in vivo and in vitro
(49). These findings go against the worldwide dietary advice to substitute
polyunsaturated fats including the most abundant PUFA ω6 linoleic acid for saturated
fats (50).
It has been found that aldehydes can diffuse and move in or between cells to react
with biomolecules such as DNA and proteins, disrupting cell functions, gene expression,
and even leading to cell death (51). Among the aldehydes, 4-hydroxyalkenals seem to be
the most reactive and have caused great concern about their effect on health. Their three
functional groups—a carbonyl group, a trans double bond and a hydroxy group—are the
causes of their high reactivity and toxicity (52). The aldehydic carbonyl group is able to

22
react with primary amine groups in amino acids, phospholipids and proteins to produce
Schiff bases. This reaction can modify the functional groups of these molecules in
biological systems (51, 53). The aldehydic group can also react with NH2 groups so
2,4-dinitrophenyl hydrazine (NH2-NH-(C6H3)-(NO2)2 forms a hydrazine which can be
used to obtain more stable derivatives for analytical purposes (25). Another functional
group of 4-hydroxyalkenals, the conjugated double bond, can react with nucleophilic
compounds containing thiol, amino, or imidazole groups by Michael addition. This
reaction can occur in both food and biological system (54-56). The third functional group
hydroxy group can be transformed to oxo group (57).
Because of their high reactivity, many studies of 4-hydroxyalkenals were made in
biological systems and it has been shown that they are cytotoxic and mutagenic (58, 59).
HNE, one kind of 4-hydroxyalkenals, is known to be the most abundant and major toxic
compound produced during the oxidation of ω6 PUFAS, such as linoleic acid and
arachidonic acid. HNE can covalently attach to proteins through the Michael addition and
form stable adducts with cysteine, lysine and histidine amino acid residues (Figure 9).
Therefore the structure of protein is altered, resulting in the loss of protein function and
activity (2). In addition, HNE can modulate the expression of several genes and inhibit
growth (6, 7). An increasing body of evidence shows that HNE is related to
atherosclerosis, Alzheimer’s disease, Parkinson’s disease, Huntington disease and some

23
other cancers (1, 3, 4). In the concentration range of 1 to 20μM, HNE can inhibit DNA
and protein synthesis. Even at a very low concentration (less than 0.1μM), HNE can
affect cellular metabolism (25). Nowadays HNE is also used as a biomarker for
pathophysiological processes (60).
Figure 9. Michael addition reaction and HNE adduct products of cysteine, lysine,
and histidine. (From Ref. (2))
Because of the increasing concern of the risk of HNE to human health, more and
more studies were being conducted to investigate HNE formation in oils after heat
treatment. The formation of HNE was monitored in soybean oil which was heated at

24
frying temperature185°C for 2, 4, 6, 8 and 10 hours in a recent study by Seppanen and
Csallany (61). Results showed that unheated soybean oil contained no HNE and a very
low concentration of polar lipophilic secondary oxidation products. A great increase in
the concentration of both HNE and the total lipophilic polar oxidation products was
observed with increased heating time at frying temperature. A considerable concentration
of HNE had already formed at 2 hours and the concentration continued to increase at 4
and 6 hours of heating time in soybean oil which contains a high level of linoleic acid
(45-52%). After 6 hours, the concentration of HNE started to decrease due to possible
thermal decomposition. In addition, it was found that the tocopherol concentration
decreased as the lipid peroxidation and the secondary oxidation products increased.
The above mentioned authors also found that HNE could be incorporated into fried
food from the frying oil which had been heated at 185°C for 5 hours (8). Similar
concentrations of HNE were found in the oil prior to and after frying and in the oil
extracted from the fried potato. This showed that HNE was readily incorporated into food
fried from the thermally oxidized oil.
By the same authors, the temperature dependence of the formation of HNE was
demonstrated in high linoleic acid containing oils such as corn and soybean oils and low
linoleic acid containing butter oil (62). The oils were heated at 190°C and 218°C. The
concentration of HNE at 218°C increased greatly for all the three oils compared to the

25
lower temperature of heating 190°C for the same heating period. In comparison, HNE
concentration at higher temperature (218°C) was 4.9, 3.7, and 8.7 times higher than at the
lower temperature (190°C) for corn, soybean and butter oils after only 30 min of heat
treatment, respectively. This proved that HNE formation was temperature dependent in
the tested oils.
The effect of intermittent heating on the formation of HNE in soybean oil was
compared with continuous heating (11). Soybean oil samples were heated either for 1 h
each day for five sequential days or for 5 h continuously at 185±5°C. The thermally
oxidized samples were analyzed for the presence of HNE, HHE, HOE and HDE. It was
found that the concentration of these four α, β-unsaturated-4-hydroxyaldehydes increased
similarly under both intermittent and continuous heating conditions over a total of 5 h.
These results demonstrated that the formation of HNE and other α, β-unsaturated-4-
hydroxyaldehydes at frying temperature is a cumulative result of the peroxidation process
of PUFA over time.
The formation of α,β-unsaturated-4-hydroxyaldyhydes was investigated in fatty acid
methyl ester format (34). Fatty acid methyl esters (FAMEs) of stearic, oleic, linoleic and
linolenic acids were heated separately at 185°C for 0 to 6 hours. As a result, methyl
stearate (MS) and methyl oleate (MO) did not produce any of the α,β-unsaturated-
4-hydroxyaldehydes after thermally induced lipid peroxidation. The formation of HHE

26
was detected in both methyl linoleate (ML) and methyl linolenate (MLN), with
concentration higher in MLN than in ML. HOE was detected in both ML and MLN, too.
HNE was found only in ML and HDE was not detected in any of the four heat treated
FAMEs.
Because of the incorporation of HNE into fried food and its toxicity, studies were
carried out on the prevention of its formation. Gerde and Hammond treated soybean oils
with polydimethylsiloxane (PDMS) heated at 180°C for 48 h. They found that when the
amount of PDMS was greater than that necessary to form a monolayer in the air-oil
interface, PDMS had a positive effect in preventing the formation of HNE (63).
Though these above studies were carried out on HNE formation and prevention,
there is almost no information on the effect of temperature, heating time and linoleic acid
concentration on HNE formation in various commercial edible oils and fats.

27
Objectives
The objective of the present experiments was to measure the formation of α,
β-unsaturated-4-hydroxyaldehydes (4-hydroxy-2-trans-nonenal (HNE),
4-hydroxy-2-trans-hexenal (HHE), 4-hydroxy-2-trans-octenal (HOE) and
4-hydroxy-2-trans-decenal (HDE)) resulting from various heating time, temperatures and
the levels of unsaturation in oil/fat sample.

28
Part II: Experiments
Methods and Materials
Chemicals and Instruments
2, 4-Dinitrophenylhydazine was purchased from Eastman Kodak Co.(Rochester, NY).
2-thiobarbituric acid, thichloroacetic acid, HPLC-grade methanol, HPLC-grade water,
HPLC-grade dichloromethane, and boron trifluoride-methanol solution were obtained
from Sigma Chemical Company (St. Louis, MO); sodium thiosulfate and glacial acetic
acid were from Fisher Scientific (Fair Lawn, NJ); hydrochloric acid and potassium iodide
were from Mallinckrodt Baker Inc. (Paris, KY). HPLC-grade hexane was from EMD
Chemicals, Inc. (Gibbstown, NJ). HNE was from Cayman Chemical Co. (Ann Arbor,
MI). No. 1 filter paper and 0.45um syringe filters were purchased from Whatman Ltd.
(Kent, England). Plates for thin layer chromatography (TLC) were purchased from EMD
Millipore, Inc. (Billerica, MA).
Corn oil, soybean oil, canola oil (Crisco®, the J.M. Smucker Company, Orrville, OH)
and peanut oil (Planters®, Kraft Foods Global, Inc. East Hanover, NJ) were purchased
from retail stores (Roseville, MN). Lard and beef tallow were obtained from meat
laboratory of the University of Minnesota.
The gas chromatograph used a 18835B capillary inlet system (5830A Gas
Chromatograph, Hewlett-Packard, Saginaw, MI).
29
The HPLC system consisted of a sample injector (712 WISP, Waters, Milford, MA),
a solvent delivery system (9050, Varian, Walnut Greek, CA) and a UV-Vis detector
(9010, Varian). The HPLC column was Ultrasphere ODS (5×4.6 mm, 25 cm, Hichrom,
Berkshire, UK). Detailed operating parameters are provided later in the methods section
(G).
Thermal Treatments of the Oil Samples
Duplicate 5g ± 0.05g oil or fat samples were placed in open test tubes (16×150mm)
in a sand bath and continuously heated at 145, 165 and 185°C for 1, 2, 3, 4, 5, and 6
hours. Target temperatures were reached in 30 minutes.
Peroxide Value
Peroxide value determination of the unheated oil samples was done following the
method of the American Oil Chemists’ Society (64). One g sample of unheated oils (in
duplicate) were placed into Erlenmeyer flasks and dissolved with 15 mL of a solution
containing 6 parts glacial acetic acid and 4 parts USP chloroform. One mL saturated
aqueous potassium iodide solution was added and mixed by swirling for 1 minute. After
5 minutes, 15 mL distilled water was added and mixed as before. The mixture was
titrated with 0.002N sodium thiosulfate until yellow color became faint. Several drops of
starch solution were added and the titration was ended up with a clear endpoint.

30
The peroxide value was calculated by (volume of sodium thiosulfate × normality of
sodium thiosulfate×1000) / weight of fat (g) and expressed as milliequivalents of
peroxide per 1000g of sample.
Fatty Acid Distribution by Gas Chromatography
Fatty acid distribution of unheated oils and fats was determined by gas
chromatography (65). Three mL of BF3-Methanol (14% BF3 in methanol) was added to 2
drops of each unheated oils or fats in a 20mL test tube in duplicate. The test tubes were
capped and shaken vigorously. Then they were placed in boiling water bath for 1 h. After
cooling, 3 mL distilled water and 10mL hexane were added and the mixture was shaken
for 10 minutes. After separation into 2 layers, the top hexane layer was removed and
saved. The hexane samples were dried with the addition of 1-2 grams of sodium sulfate.
Five μL of the dry hexane samples were injected into GC and the fatty acid distribution
was measured by comparison with the retention times of fatty acid standards.
Thiobarbituric Acid (TBA) Test
In order to determine the rate and the extent of oxidation under different temperature
and time conditions, the thiobarbituric acid test was used to measure the formation of
TBARS in the samples. Duplicate samples of 5g (±0.05g) corn, soybean, canola, peanut
oils, lard and beef tallow were placed in open test tubes (16×150mm) inserted into a sand
bath and heated continuously at 145°C or 165°C or 185°C for 1, 2, 3, 4, 5, and 6 hours.

31
The TBARS values of each sample were measured under the above mentioned time and
temperature conditions.
TBA test is one of the oldest, most commonly used methods for determining lipid
oxidation. It is based on the color reaction between TBA and secondary oxidation
products such as aldehydes and ketones. TBA test measures all aldehydes and related
carbonyl compounds including malonaldehyde (MDA), exhibiting colored complex
absorption at 530-532nm. MDA is used to develop a standard curve and the test results
were expressed as MDA equivalents (66, 67).
The thiobarbituric acid reactive substances (TBARS) were measured by the TBA test.
The TBA test was done by the method of Buege and Aust (68). The standard curve was
determined by combining 200 μL of malondialdehyde (MDA)/water with 4 mL of
TCA/TBA/HCl solution (equal volumes of 15% w/v thichloroacetic acid (TCA), 0.375%
w/v 2-thiobarbituric acid (TBA), and 0.25N HCl). MDA concentration was made by the
dilution with distilled water as listed in Table 1 below. The mixture of MDA and
TCA/TBA/HCl solution was heated for 15 minute in a boiling water bath. Absorbance of
the sample was measured at 535 nm with a UV/Vis spectrophotometer (Spectronic 20,
Bausch&Lomb). The standard curve is shown in Figure 10.

32
Table 1. The Concentration of MDA for TBARS standard curve
Tube Number MDA(5×10⁻⁵
M) (μL) Water (μL) Concentration of MDA (µg/mL)
1 0 200 0
2 10 190 0.0086
3 25 175 0.0214
4 50 150 0.0429
5 100 100 0.086
6 150 50 0.129
7 200 0 0.171
Figure 10. TBA assay standard curve
Measurement of the samples: 200 μL of oil was combined with 4 mL of
TCA/TBA/HCl solution (equal volumes of 15% w/v thichloroacetic acid (TCA), 0.375%
w/v 2-thiobarbituric acid (TBA), and 0.25N HCl). The mixture was heated for 15 minute
y = 1.0899x + 0.0281
R² = 0.9833
0.00
0.05
0.10
0.15
0.20
0.25
0.0000 0.0500 0.1000 0.1500 0.2000
Abso
rban
ce
MDA Concentration (ug/mL)

33
in a boiling water bath. Absorbance of the sample was measured at 535 nm with a
UV/Vis spectrophotometer.
Method to Determine the Secondary Oxidation Products of Samples
The method was developed by Seppanen and Csallany (10). The principle of the
method was that hydroxyalkenals can react easily with 2, 4-dinitrophenylhydrazine
(DNPH) to form hydroxyalkenal-DNPH derivatives through Schiff base formation; the
hydroxyalkenal-DNPH derivatives which actually are 2, 4-dinitrophenylhydrazones can
be measured by ultraviolet (UV) light at 378nm. DNPH is a large compound and has high
molar extinction coefficient at the given wavelength. Due to the formation of
hydroxyalkenal-DNPH derivatives, hydroxyalkenals can be easily detected and
measured.
A) Recrystallization of DNPH
One g DNPH was dissolved in 20 mL methanol and heated at 60°C for 30 minutes.
The dissolved DNPH was placed in an ice bath for at least 18h for crystallization. The
crystallized DHPN was filtered by No. 1 filter paper and redissolved in about 20 mL
methanol. The crystallization process was repeated at least two more times and the
collected DNPH crystals were placed in a desiccator for 3 days for drying.
B) Preparation of DNPH Reagent
34
DNPH reagent was prepared freshly for each assay. Recrystallized DNPH (10 mg)
was dissolved in 20mL 1 N hydrochloric acid and heated at 50 °C for 1 h.
After cooling, the DNPH reagent was washed four times with 10 ml of HPLC-grade
hexane (total 40mL) to remove impurities and the hexane layer was discarded.
C) Preparation of the DNPH reagent blank and the acetone-DNPH standard
The DNPH reagent blank and the acetone-DNPH standard were made by combining
3mL HPLC-grade water for the reagent blank or 3mL 1% acetone for the acetone-DNPH
standard with 3mL freshly prepared DNPH reagent. The mixture was incubated at the
speed of 120 oscillations/min shaking at room temperature overnight. After incubation,
the DNPH derivatives were extracted three times with 5mL dichloromethane. The solvent
was evaporated from the combined extracts under N2 gas to a volume of 0.5mL.
D) Preparation of HNE-DNPH standard
One hundred μL (5mg/500μL of ethanol) HNE was added to 10mL freshly made
DNPH reagent, the mixture was incubated at room temperature overnight in the dark with
shaking at the speed of 120 oscillations/min. HNE-DNPH was extracted with 10mL
dichloromethane three times. The combined dichloromethane extract was evaporated
under N2 gas to about 1.5mL. All of the concentrated HNE-DNPH in dichloromethane
was applied to two Thin Layer Chromatography (TLC) plates. The polar region was

35
extracted from the TLC plates three times with 10mL methanol. The combined methanol
extract was evaporated under N2 gas to an exact volume of 10mL.
E) Preparation of DNPH-hydrazones of lipophilic aldehydes and related carbonyl
compounds from oils and fats
One g of unheated or heat-treated oil sample (in duplicate) was reacted with 5mL of
freshly prepared DNPH reagent same as above in a 25mL Erlenmeyer flask. The mixture
was incubated at room temperature overnight in the dark with shaking at the speed of 120
oscillations/min.
The DNPH derivatives were extracted three times with 10mL methanol/water (75:25,
vol/vol) and separated by centrifugation at 2000 rpm for 10 min. The DNPH derivatives
in the combined methanol extracts were further extracted three times with 10mL
dichloromethane and separated by centrifugation as before. The combined
dichloromethane layer was evaporated under N2 gas until the sample volume was about
1mL.
F) Preliminary separation of DNPH-hydrazones of lipophilic aldehydes and related
carbonyl compound by Thin Layer Chromatography (TLC)
The concentrated dichloromethane extract (about 1mL) was applied to two silica gel
thin-layer chromatographic plates. The sample was applied in a very thin line across the

36
plate with a 250μL micropipette attached to a Hamilton syringe with a piece of flexible
rubber tubing. Half of the sample (about 0.5mL) was applied to each plate, then about
0.2mL dichloromethane was used to rinse the test tube and this was also applied to the
plate. The DNPH reagent blank and acetone-DNPH standard were spotted next to the
sample on the plate and they would help identify the position of the polar and nonpolar
aldehyde-DNPH in samples. The plates were developed in HPLC-grade dichloromethane.
Figure 11 shows a diagram of a typical TLC plate. The nonpolar and polar
aldehydes and other related carbonyl compounds were separated by the location of
DNPH reagent and acetone-DNPH standards. Polar carbonyl compounds (PC), including
the hydroxyaldehydes, were located between the origin and the DNPH reagent band.
Nonpolar carbonyl compounds (NPC), such as alkanals, alkenals, alkadienals and ketones
were located between the acetone-DNPH band and the solvent front. The polar and
nonpolar regions were cut from the plate into small pieces and placed in 25 mL
Erlenmeyer flasks. The compounds were extracted from the plate three times with 10mL
methanol. The combined methanol extracts were evaporated under N2 gas to the exact
volume of 1mL in a volumetric flask and stored in amber vials tightly covered with
Parafilm at -20°C until HPLC analysis.

37
Figure 11. Position of polar and nonpolar aldehydes-DNPH derivatives after TLC
Development. Plate was developed in HPLC-grade dichloromethane.
Solvent front
Nonpolar Aldehyde-DNPH
Acetone-DNPH band
Osazones
DNPH band
Polar Aldehyde-DNPH
Origin
DNPH
standard
Acetone
-DNPH
standard

38
G) Separation and identification of DNPH derivatives of polar (PC) and nonpolar
(NPC) lipophilic aldehydes and related carbonyl compounds from oils and fats by
HPLC
One hundred μL aliquots of PC-DNPH derivatives and NPC-DNPH derivatives were
injected into an HPLC reverse-phase C18 column, equiped with a guard column.
a) For polar compounds (PC), 10 min of isocratic elution with methanol/water
(50:50, vol/vol) was followed by a linear gradient to 100% methanol for 20 min,
then 100% methanol for an additional 10 min at a flow rate of 0.8mL/min.
Absobance was measured at 378 nm.
b) For nonpolar compounds (NPC), an initial isocratic elution was methanol/water
(75:25, vol/vol) for 10 min and was followed by a linear gradient to 100%
methanol for 20 min, then 100% methaol for an additional 10 min at a flow rate
of 0.8mL/min. Absorbance was also measured at 378 nm.
Each day, prior to injection of samples, a mixture of known standards or a single
standard was injected into the HPLC column and eluted with the solvent system to be
used that day in order to check the reproducibility of the HPLC system. Figure 12 shows
a typical separation and the retention times of the pure standards in the PC solvent
system.

39
Fig
ure
12. H
PL
C s
epara
tion
of
a m
ixtu
re o
f st
an
dard
s. D
NP
H d
eriv
ati
ves
of
A:
HH
E, B
: H
OE
, C
: H
NE
an
d D
: H
DE
.
A
B
C D
Ret
enti
on T
ime
(min
ute
s)

40
Identification of the individual polar and nonpolar aldehydes and related carbonyl
compounds from oils are accomplished by:
a) Comparing the retention times of known standards to the retention times of peaks
derived from the oil or fat samples.
b) Co-chromatography of sample mixed with a small amount of pure standards. The
chromatogram was then examined for 1) single retention time of sample and pure
standard 2) the ratio of increased peak area to the added pure standard compared
to the original area of the sample.
Aldehydes were quantified by comparing the peak area of aldehyde- DNPH with the
peak area of hexanal-DNPH standard and expressed as g hexanal equivalent/g oil. For
HHE, HOE, HNE and HDE, hexanal equivalent was converted to ng hydroxyaldehyde
(HHE/ HOE/ HNE/ HDE)/g oil by calculation based on the molecular weights of hexanal
and hydroxyaldehyde (HHE/ HOE/ HNE/ HDE). For total polar and nonpolar lipophilic
aldehydes, since the individual aldehyde molecular weights are unknown, the results
were represented as µg hexanal equivalent/g oil.
Statistical Analysis
ANOVA was used to determine if there were significant differences between the
groups. A Tukey test was conducted to calculate the p values. Statistically significant
differences were determined at p ≤ 0.05.

41
Results
A. Preliminary Experiments
a) Peroxide Value
Before heat treatment, the initial oxidation concentrations of all samples were
measured by peroxide value. (69). Table 2 shows the peroxide values of commercial corn,
soybean, canola, peanut oils, lard and beef tallow measured in duplicate per sample. The
peroxide values were in the range between 1.26-3.56 milliequivalents of peroxide per
1000g. These values are relatively low which indicate that all samples were minimally
oxidized at the start of the thermal oxidation process.
Table 2. Peroxide value of unheated oils and fats
Oil or fat
Peroxide value (milliequivalents of peroxide
per 1000g)
Corn 3.56±0.08
Soybean 2.94±0.03
Canola 1.26±0.15
Peanut 2.48±0.09
Lard 3.66±0.09
Beef tallow 2.98±0.39
b) Fatty Acid Distribution
The fatty acid distributions of commercial corn, soybean, peanut, canola oils, lard
and beef tallow were measured to determine the concentrations of linoleic and linolenic
42
acids in the samples since these fatty acids are precursors for the formation of α,
β-unsaturated-4-hydroxyaldehydes (34).
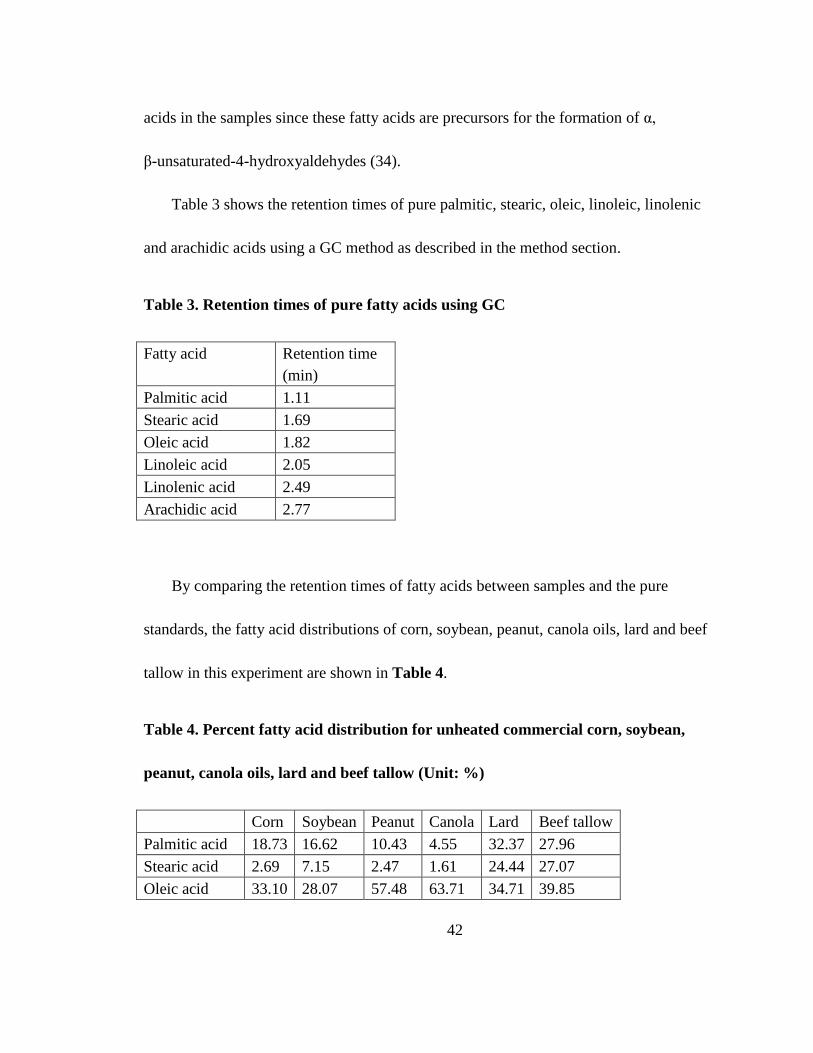
Table 3 shows the retention times of pure palmitic, stearic, oleic, linoleic, linolenic
and arachidic acids using a GC method as described in the method section.
Table 3. Retention times of pure fatty acids using GC
Fatty acid Retention time
(min)
Palmitic acid 1.11
Stearic acid 1.69
Oleic acid 1.82
Linoleic acid 2.05
Linolenic acid 2.49
Arachidic acid 2.77
By comparing the retention times of fatty acids between samples and the pure
standards, the fatty acid distributions of corn, soybean, peanut, canola oils, lard and beef
tallow in this experiment are shown in Table 4.
Table 4. Percent fatty acid distribution for unheated commercial corn, soybean,
peanut, canola oils, lard and beef tallow (Unit: %)
Corn Soybean Peanut Canola Lard Beef tallow
Palmitic acid 18.73 16.62 10.43 4.55 32.37 27.96
Stearic acid 2.69 7.15 2.47 1.61 24.44 27.07
Oleic acid 33.10 28.07 57.48 63.71 34.71 39.85
43
Linoleic acid 44.19 42.97 26.97 20.04 8.27 1.91
Linolenic acid 0.71 4.56 0.17 9.40 - -
Arachidic acid 0.58 0.63 1.50 0.55 - -
It can be seen in Table 4 that the linoleic acid in corn oil had the highest
concentration in unheated oil followed by soybean oil, peanut oil, canola oil, lard and
beef tallow. It should be noticed that canola oil had a highest level of linolenic acid
concentration followed by soybean oil. However, both corn and peanut oils had less than
1% linolenic acid. And in lard and beef tallow linolenic acid was not determined.
c) Thiobarbituric Acid Reactive Substances (TBARS)
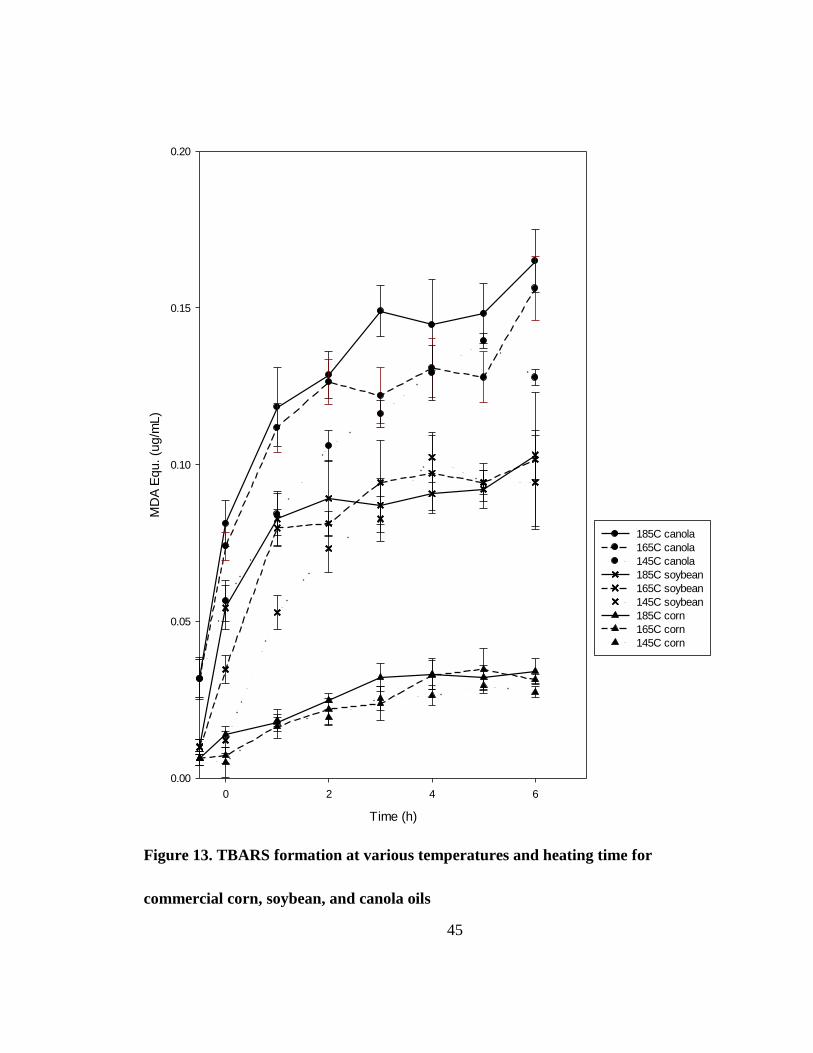
Figure 13 and Figure 14 show the results of TBARS formation of the 6 oils: corn,
soybean, peanut, canola oils, lard and beef tallow at 3 different temperatures and various
times including 0, 1, 2, 3, 4, 5 and 6 hours of thermal treatments.
From the results, it can be seen that the TBARS measured as the MDA equivalents
increased with higher temperatures and longer heating time for all the oils. The maximum
TBARS values were reached at 185°C for 5 or 6 hours for all the oils and fats. Among all
the oils, the oxidation of canola and soybean oils were extremely high compared to corn
oil, peanut oil, lard and beef tallow. Corn oil, peanut oil, lard and beef tallow had
relatively predictable increases with the increased heating time and temperatures. Beef
tallow, as predicted, did not change too much during the heat treatments over 6 hours in
all 3 temperatures. Canola oil showed the highest TBAR values, which was unexpected

44
since canola oil is high in oleic acid and relatively low in linoleic acid (20%). The reason
may be that canola oil has a higher concentration of linolenic acid (9.4%) which has three
double carbon bonds and is more susceptible to oxidation than the other oils. This
explanation was also applicable to soybean oil. Following canola oil, soybean oil was the
second one in terms of MDA equivalents, and then followed by corn oil, peanut oil, lard
and beef tallow. This ranking was consistent with the concentration of linoleic acid.
45
Time (h)
0 2 4 6
MD
A E
qu. (u
g/m
L)
0.00
0.05
0.10
0.15
0.20
185C canola
165C canola
145C canola
185C soybean
165C soybean
145C soybean
185C corn
165C corn
145C corn
Figure 13. TBARS formation at various temperatures and heating time for
commercial corn, soybean, and canola oils

46
Time (h)
0 2 4 6
MD
A E
qu. (u
g/m
L)
0.00
0.01
0.02
0.03
0.04
0.05
185C corn
165C corn
145C corn
185C peanut
165C peanut
145C peanut
185C lard
165C lard
145C lard
185C beef tallow
165C beef tallow
145C beef tallow
Figure 14. TBARS formation at various temperatures and heating time for corn,
peanut oils, lard and beef tallow
(Corn oil is shown again as reference because units are different on this figure)

47
Based on the results of oxidation rates measured by TBARS of the 6 oils and fats, the
following conditions were selected to measure the formation of nonpolar and polar
lipophilic aldehydes including the α, β-unsaturated-4-hydroxyaldehydes such as HHE,
HOE, HNE and HDE: temperatures 145, 165 and 185°C and heating time 0, 1, 3 and 5
hours.

48
B. Formation of HNE, the Major Toxic α, β-Unsaturated 4-Hydroxyaldehyde, in
Commercial Corn, Soybean, Peanut, Canola oils, Lard and Beef Tallow Due to 0, 1,
3 and 5 Hours of Thermal Oxidation at 145°C,165°C and 185 °C
HNE is the major α, β-unsaturated 4-hydroxyaldehyde which was measured in each
of the above mentioned oils and fats by HPLC. Figure 15 to Figure 21 show the HNE
formation in corn, soybean, peanut, canola oils, lard and beef tallow at the selected
heating time and temperatures.
a) Corn oil
Figure 15 shows the HNE formation in heated corn oil at 145, 165 and 185 °C for 1,
3 and 5 hours and the concentration of HNE in the unheated oil at 0 time. HNE was not
detected in the unheated corn oil. At 145°C, the formation of HNE increased slightly
along with heating time, however there were no significant differences between 1, 3 and
5 hours. At 165°C and 185°C, the formation of HNE increased remarkably and there was
significant difference between the heating periods. The HNE formation at 165°C for
5-hour heating was 5 times higher than the HNE formation at 165°C for 1-hour heating.
HNE formation at 185°C for 5-hour heating was 7 times higher than HNE formation at
185°C for 1-hour heating. In terms of 1-hour heating, however, HNE formation did not
reach significant differences between the three temperatures. Both at 3 and 5 hours of
heating time, the HNE formation at 185°C was the highest and again with a lower level at

49
145°C. HNE formation was greatly influenced both by temperature and the time of
heating period.
Heating Time (h)
0 1 2 3 4 5 6
ng
HN
E/g
oil
0
1000
2000
3000
4000
5000
6000
7000
8000
185C
165C
145C
b
a
ab
ab
d
c
ab
e
d
ab
Figure 15. The HNE formation in commercial corn oil at various heating time and
temperatures

50
b) Soybean oil
Figure 16 shows the HNE formation in heated soybean oil at 145, 165 and 185 °C for
1, 3 and 5 hours. No HNE was detected in the unheated soybean oil at 0 time of heating.
For all three above temperatures, the formation of HNE increased along with heating time.
At 145°C, HNE formation increased with no significant difference between 1, 3 and 5
hours. However at 165°C and 185 °C, the HNE formation increased dramatically along
with heating time. HNE formation at 185 °C for 5 hours was 6 times higher than HNE
formation at 185 °C for 1 hour. At 165 °C, HNE formation with 5-hour heating was also
roughly 6 times higher than HNE formation with 1-hour of heating. In the same heating
period, higher temperatures led to higher HNE formation. It is interesting to note that
HNE formation at 165°C for 5 hours heating was almost as high as that at 185°C for the
same heating time. This may be due to the fact that soybean oil is relatively high in
linolenic acid (4.56%) which would probably induce the oxidation even at somewhat
lower temperature to a faster rate.

51
Heating Time (h)
0 1 2 3 4 5 6
ng
HN
E/g
oil
0
1000
2000
3000
4000
5000
6000
7000
8000
185C
165C
145Ca
abc
d
e
abc
c
de
ab
abc
bc
Figure 16. The HNE formation in commercial soybean oil at various heating time
and temperatures
52
c) Peanut oil
Figure 17 shows the HNE formation in heated peanut oil at 145, 165 and 185 °C for
1, 3 and 5 hours. No HNE formation was detected in unheated peanut oil at 0 time of
heating. For all three above temperatures, the increase of HNE formation along with the
increased heating time was significant, which was different from corn and soybean oils at
the lowest heating temperature 145°C. After heating at 185°C for 5 hours, HNE
formation was 5 times higher than heating for 1 hour. HNE formation at 165°C after 5
hours of heating was 3 times the concentration of HNE formation after 1 hour heating.
However at 145°C the HNE formation after 5 hours heating was 4 times higher compared
with HNE formation after 1 hour heating. The reaction rate of oxidation as expected was
lower than that in corn and soybean oils due to the difference in fatty acid distribution of
peanut oil. There were no significant differences between the three temperatures for 1 and
3 hours, and the HNE formation was close at 145°C and 165°C under these two heating
time. However, the HNE concentration was significantly higher at 185°C than 145 and
165°C after 5 hours of heating.

53
Heating Time (h)
0 1 2 3 4 5 6
ng
HN
E/g
oil
0
1000
2000
3000
4000
5000
6000
7000
8000
185C
165C
145Ca
ab
bc
bc
cd
d
e
f
g
d
Figure 17. The HNE formation in commercial peanut oil at various heating time and
temperatures

54
d) Canola oil
Figure 18 shows the HNE formation in heated canola oil at 145, 165 and 185 °C for
1, 3 and 5 hours. No HNE formation was detected in the unheated canola oil at 0 time of
heating. At each of the temperatures, the HNE formation was very low. The HNE
formation hardly increased along with heating time from 1 hour to 5 hours at 145°C and
165°C. At 185°C, the HNE formation after 5 hours of heating was only 2 times as much
as that after 1 hour of heating. HNE formation at 185°C was significantly different from
HNE formation at 145°C after 3 hours of heating but the rate was also very low. HNE
formation at 185°C was significantly higher than HNE formation at 145°C and 165°C
after 5 hours heating. Canola oil had low HNE formation even at 185°C after 5 hours of
heating. This is expected because linoleic acid concentration in this oil is low (only 20%)
compared to the high linoleic acid containing oils such as corn and soybean oils.

55
Heating Time (h)
0 1 2 3 4 5 6
ng
HN
E/g
oil
0
1000
2000
3000
4000
5000
6000
7000
8000
185C
165C
145Ca ab abcababc
abcbc bc
cd
Figure 18. The HNE formation in commercial canola oil at various heating time and
temperatures

56
e) Lard
Figure 19 shows the HNE formation in heated lard at 145, 165 and 185 °C for 1, 3
and 5 hours. No HNE formation was detected in the unheated lard at 0 time of heating.
The HNE formation increased heavily at all the three temperatures, especially at 185°C.
After 5 hours of heating at 185°C, the HNE formation was 4 times as high as the HNE
formation after 1 hour heating. HNE formation at 165°C and 145°C after 5 hours of
heating was approximately 4 times the concentration of HNE formation after heating for
1 hour. The HNE formation at 185°C was much higher than the heating for 1 or 3 hours
at 165°C and 145°C.
Heating Time (h)
0 1 2 3 4 5 6
ng
HN
E/g
oil
0
1000
2000
3000
4000
5000
6000
7000
8000
185C
165C
145Ca ab
bccd
dd d
e
f
g
Figure 19. The HNE formation in lard at various heating time and temperatures

57
f) Beef tallow
Figure 20 shows the HNE formation in heated beef tallow at 185°C for 5-hour of
heating. Beef tallow has very low, only 1.9%, linoleic acid concentration which is a
precursor of HNE, therefore HNE formation is minimal. Only the condition that may
produce relatively measurable HNE formation was investigated at present. HNE
formation at 185°C after 5-hour heating time of beef tallow was measurable but its
formation was very low.
Heating Time (h)
0 1 2 3 4 5 6
ng
HN
E/g
oil
0
1000
2000
3000
4000
5000
6000
7000
8000
185C
Figure 20. The HNE formation in beef tallow after 185°C and 5 hours of heating
period

58
g) Comparison of HNE concentration in commercial corn, soybean, peanut, canola
oils, lard and beef tallow heat-treated for 1, 3 and 5 hours at 185°C or 165°C or
145°C
Figure 21 (a), (b) and (c) shows the comparison of HNE formation in corn, soybean,
peanut, canola oils, lard and beef tallow under three different temperature treatments at
various times. The linoleic acid concentrations of corn oil, soybean oil, peanut oil, canola
oil, lard and beef tallow were 44%, 43%, 27%, 20%, 8% and 2%, respectively. For beef
tallow, due to its very low linoleic acid concentration, the HNE formation was measured
only at 185°C for 5 hours of heat treatment. As it was expected that even at the higher
temperature and longest heating time, HNE formation in beef tallow was very low
compared to the other oils and fats. It was surprising to see that canola oil which
contained 20% linoleic acid had much lower HNE formation at each temperature than
peanut oil which had 27% linoleic acid. The differences of HNE formation at 145°C and
165°C between corn, soybean and peanut oils were not significant except for the lower
level of HNE in peanut oil after 5 hours of heat treatment at 165°C. In contrast, at the
highest temperature 185°C, the HNE formation showed differences between corn,
soybean and peanut oils, reflecting the differences of the linoleic acid concentration in
these oils. It was surprising to see in lard that the elevated levels of HNE formation under
all levels of temperature and time of heat treatment, even that its linoleic acid
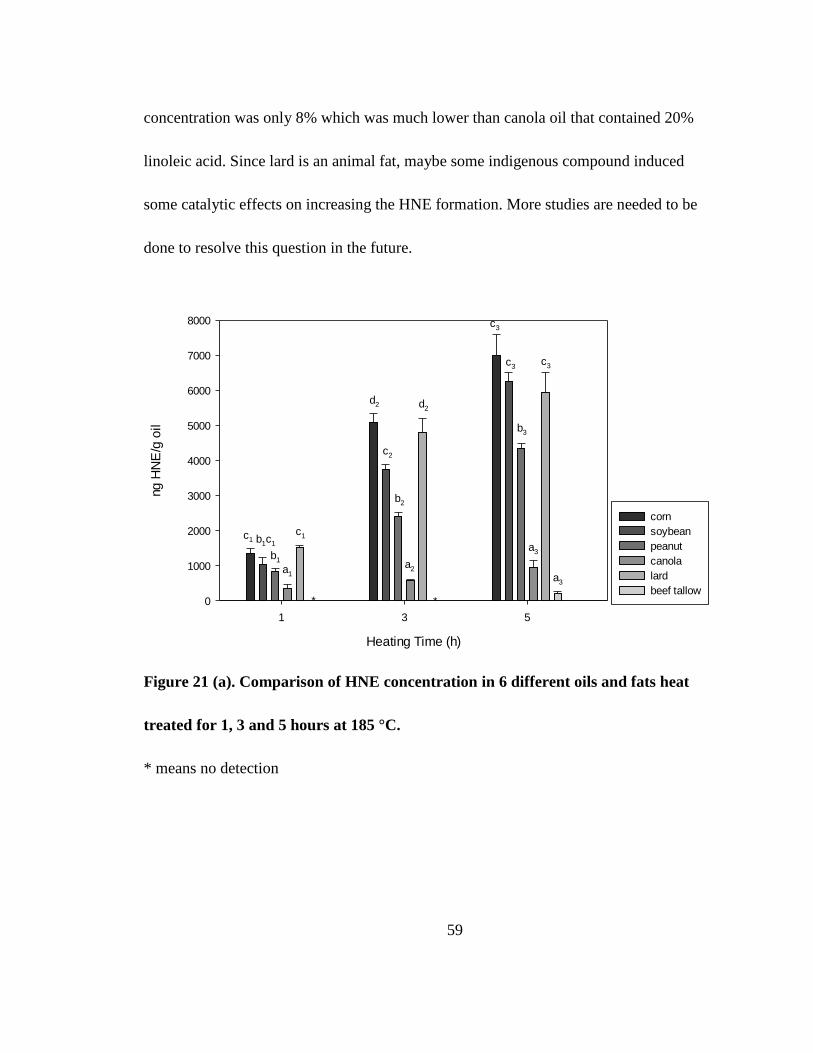
59
concentration was only 8% which was much lower than canola oil that contained 20%
linoleic acid. Since lard is an animal fat, maybe some indigenous compound induced
some catalytic effects on increasing the HNE formation. More studies are needed to be
done to resolve this question in the future.
Heating Time (h)
1 3 5
ng
HN
E/g
oil
0
1000
2000
3000
4000
5000
6000
7000
8000
corn
soybean
peanut
canola
lard
beef tallow
a1
b1
b1c1c1
c1
a2
b2
c2
d2 d2
a3
a3
b3
c3c3
c3
* *
Figure 21 (a). Comparison of HNE concentration in 6 different oils and fats heat
treated for 1, 3 and 5 hours at 185 °C.
* means no detection
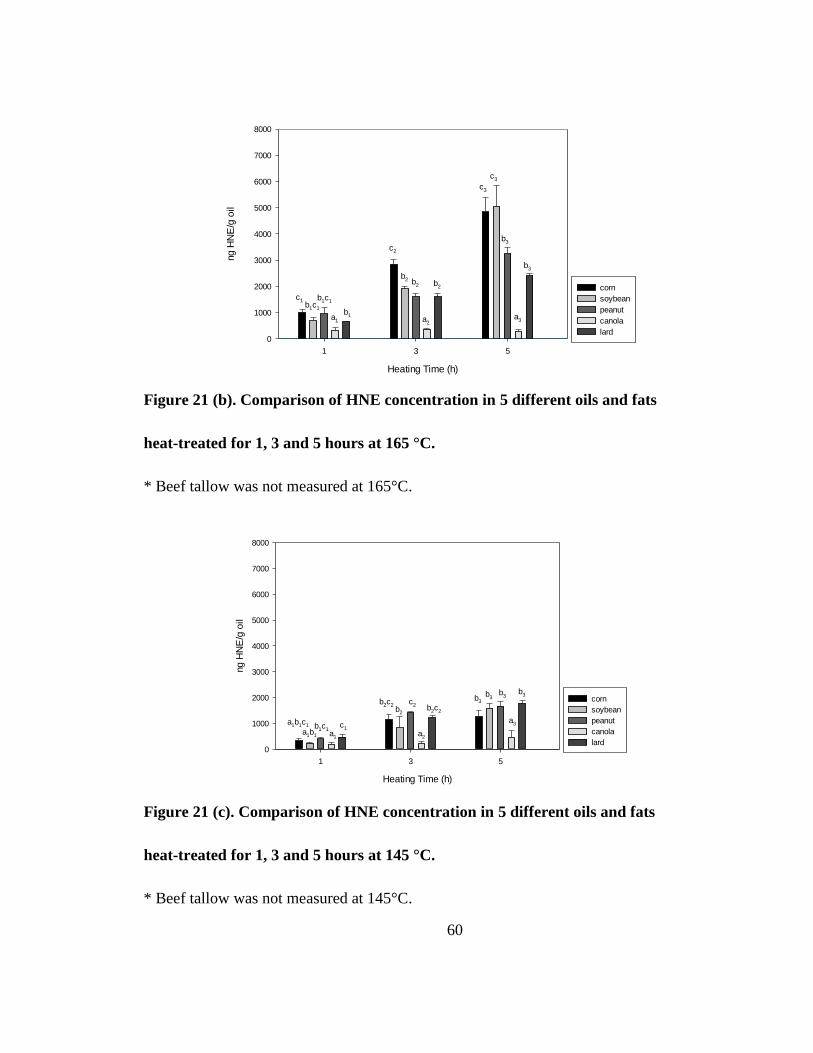
60
Heating Time (h)
1 3 5
ng
HN
E/g
oil
0
1000
2000
3000
4000
5000
6000
7000
8000
corn
soybean
peanut
canola
lard
a1
b1
b1c1
b1c1c1
a2
c2
b2 b2 b2
a3
b3
b3
c3
c3
Figure 21 (b). Comparison of HNE concentration in 5 different oils and fats
heat-treated for 1, 3 and 5 hours at 165 °C.
* Beef tallow was not measured at 165°C.
Heating Time (h)
1 3 5
ng
HN
E/g
oil
0
1000
2000
3000
4000
5000
6000
7000
8000
corn
soybean
peanut
canola
larda1
a1b1
a1b1c1 b1c1c1
a2
b2
b2c2 b2c2
c2
a3
b3
b3b3b3
Figure 21 (c). Comparison of HNE concentration in 5 different oils and fats
heat-treated for 1, 3 and 5 hours at 145 °C.
* Beef tallow was not measured at 145°C.
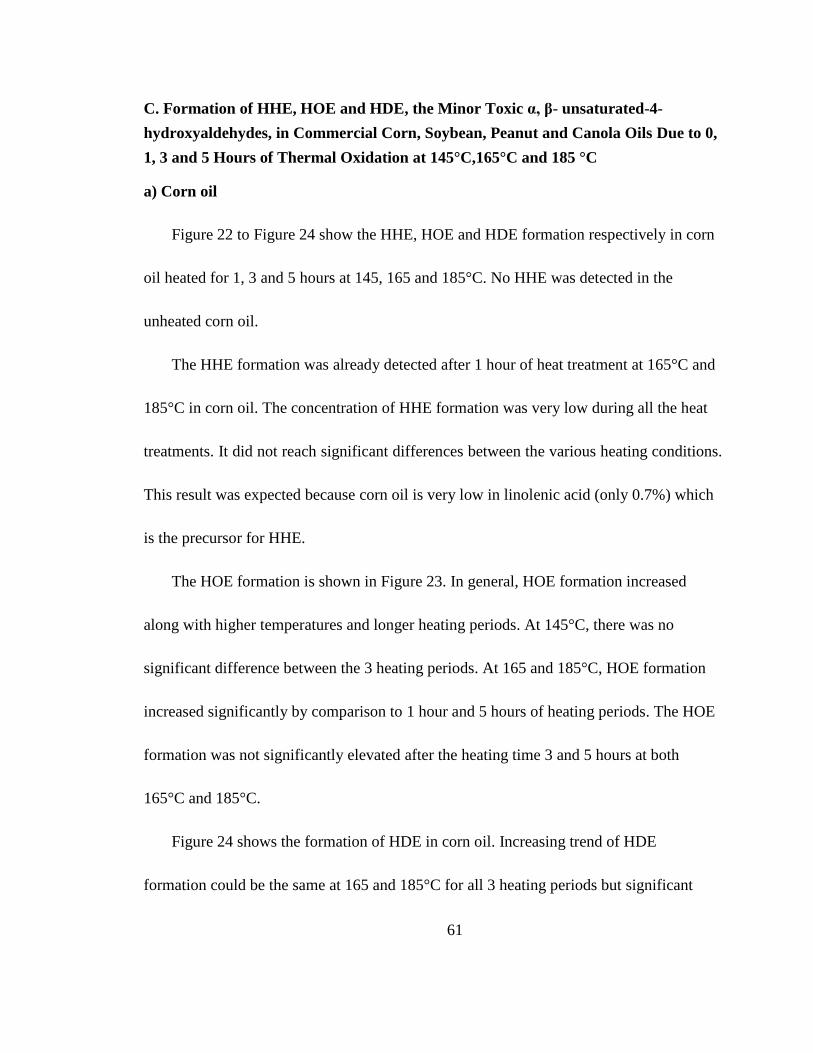
61
C. Formation of HHE, HOE and HDE, the Minor Toxic α, β- unsaturated-4-
hydroxyaldehydes, in Commercial Corn, Soybean, Peanut and Canola Oils Due to 0,
1, 3 and 5 Hours of Thermal Oxidation at 145°C,165°C and 185 °C
a) Corn oil
Figure 22 to Figure 24 show the HHE, HOE and HDE formation respectively in corn
oil heated for 1, 3 and 5 hours at 145, 165 and 185°C. No HHE was detected in the
unheated corn oil.
The HHE formation was already detected after 1 hour of heat treatment at 165°C and
185°C in corn oil. The concentration of HHE formation was very low during all the heat
treatments. It did not reach significant differences between the various heating conditions.
This result was expected because corn oil is very low in linolenic acid (only 0.7%) which
is the precursor for HHE.
The HOE formation is shown in Figure 23. In general, HOE formation increased
along with higher temperatures and longer heating periods. At 145°C, there was no
significant difference between the 3 heating periods. At 165 and 185°C, HOE formation
increased significantly by comparison to 1 hour and 5 hours of heating periods. The HOE
formation was not significantly elevated after the heating time 3 and 5 hours at both
165°C and 185°C.
Figure 24 shows the formation of HDE in corn oil. Increasing trend of HDE
formation could be the same at 165 and 185°C for all 3 heating periods but significant

62
differences were hardly achieved due to the very low concentration of HDE. HDE
formation at 165 and 185°C was much higher than that at 145°C for the same heating
time. It should be noted that in contrast to HHE, HOE and HDE can also be formed from
linoleic acid which is high in corn oil (34).
Comparing HHE, HOE and HDE formation, the HOE and HDE formation were
much higher than the HHE formation.
Heating Time (h)
0 1 2 3 4 5 6
ng
HH
E/g
oil
0
200
400
600
800
1000
1200
1400
185C
165C
145Ca
aaa
a
aa
aaa
Figure 22. The HHE formation in commercial corn oil at various heating time and
temperatures
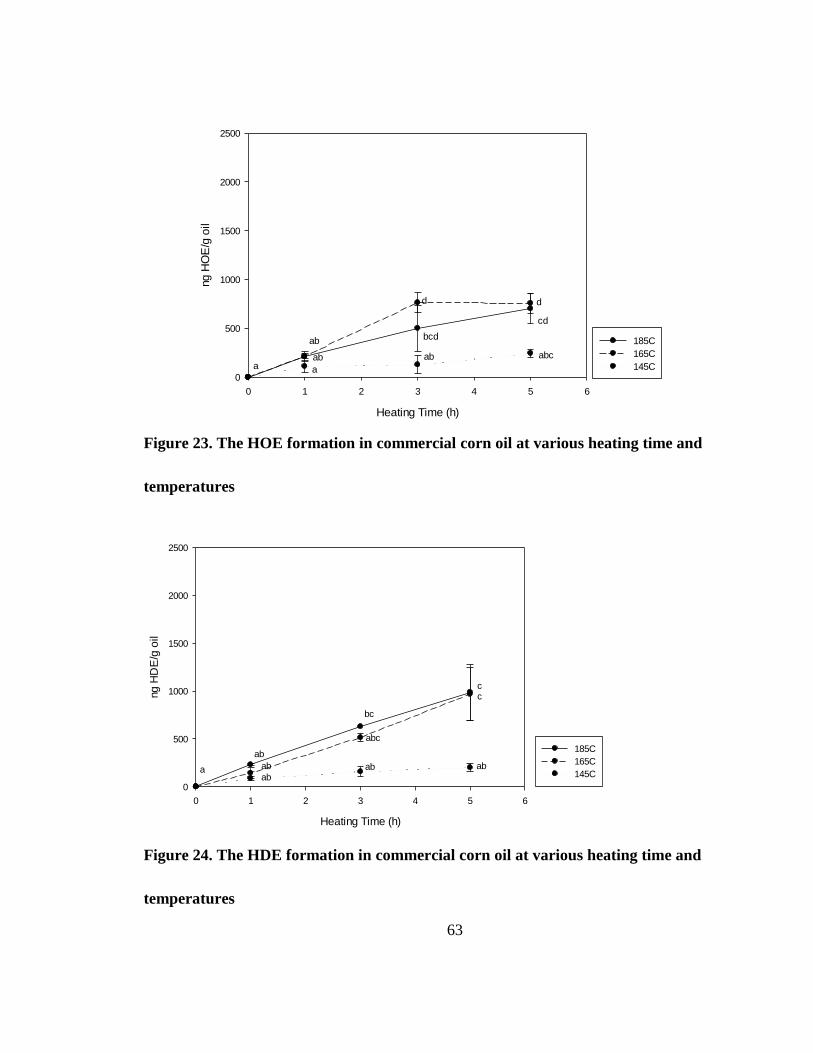
63
Heating Time (h)
0 1 2 3 4 5 6
ng
HO
E/g
oil
0
500
1000
1500
2000
2500
185C
165C
145Caaabab
ab
abc
bcd
cd
dd
Figure 23. The HOE formation in commercial corn oil at various heating time and
temperatures
Heating Time (h)
0 1 2 3 4 5 6
ng
HD
E/g
oil
0
500
1000
1500
2000
2500
185C
165C
145Ca
ab
ab
ab
bc
abc
ab
cc
ab
Figure 24. The HDE formation in commercial corn oil at various heating time and
temperatures

64
b) Soybean oil
Figure 25 to Figure 27 show the HHE, HOE and HDE formation respectively in
soybean oil heated for 1, 3 and 5 hours at 145, 165 and 185°C.
The HHE formation in soybean oil is shown in Figure 25. No HHE was detected in
unheated soybean oil. Because soybean oil contained relatively high concentration of
linolenic acid (4.5%) which is a precursor to HHE, the HHE formation in heated soybean
oil was as expected. It increased along with higher temperatures and longer heating
periods. At 185 °C, the formation of HHE at 3 hours reached a maximum and remained
the same level at 5 hours of heat treatment. At the lowest temperature 145 °C, the
formation of HHE after 5 hours of heating was 5 times higher than that at 1 hour heating.
Differences in heating time showed great effect on the formation of HHE.
Figure 26 shows the HOE formation in soybean oil. It should be noted again that the
precursors for HOE formation are both linoleic and linolenic acids. In general, the HOE
formation increased along with higher temperatures and longer heating periods. At 5
hours of heating, the concentration of HOE formation at 145°C and 165°C increased,
however it reached maximum concentration at 185 °C. But the increase of heating time to
5 hours had no significant effect on HOE formation.

65
Figure 27 shows the formation of HDE in soybean oil. Its precursors could be both
linoleic and linolenic acids. Its increasing trend due to temperature and the time of heat
treatment was similar to HOE, but the concentration of HDE was lower than that of HOE.
Heating Time (h)
0 1 2 3 4 5 6
ng
HH
E/g
oil
0
200
400
600
800
1000
1200
1400
185C
165C
145Ca a
abab
abbc
bcd
cd
cdd
Figure 25. The HHE formation in commercial soybean oil at various heating time
and temperatures

66
Heating Time (h)
0 1 2 3 4 5 6
ng
HO
E/g
oil
0
500
1000
1500
2000
2500
185C
165C
145Ca
a
aa
ab abc
abc
cd
d
bcd
Figure 26. The HOE formation in commercial soybean oil at various heating time
and temperatures
Heating Time (h)
0 1 2 3 4 5 6
ng
HD
E/g
oil
0
500
1000
1500
2000
2500
185C
165C
145Caaa
a
aa
ab
ab
ab
b
Figure 27. The HDE formation in commercial soybean oil at various heating time
and temperatures
67
c) Peanut oil
Figure 28 to Figure 30 show the HHE, HOE and HDE formation respectively in
heated peanut oil at 185°C. In the unheated peanut oil, HHE, HOE and HDE were not
detected. Furthermore, at lower temperatures less than 185°C with 1, 3 and 5 hours
heating periods, no HHE, HOE and HDE were detected. Even at 185°C after 5-hour
heating, the formations of HHE and HOE in peanut oil were relatively very little (Figure
28 and Figure 29).
The HDE formation in peanut oil heated at 185°C for 1, 3 and 5 hours is shown on
Figure 30. The HDE formation increased steadily with heating time and it was
significantly different between 3 and 5 hours of heating time compared to 1 hour of
heating. The very low formation of the three minor α, β- unsaturated-4-hydroxyaldehydes
is not surprising since linoleic acid concentration of peanut oil was 27.0%, however its
linoleic acid level was only 0.17% (Table 4).

68
Heating Time (h)
0 1 2 3 4 5 6
ng
HH
E/g
oil
0
200
400
600
800
1000
1200
1400
185Ca
a
Figure 28. The HHE formation in commercial peanut oil after 185°C and 5 hours of
heating period
Heating Time (h)
0 1 2 3 4 5 6
ng
HO
E/g
oil
0
500
1000
1500
2000
2500
185Ca
a
Figure 29. The HOE formation in commercial peanut oil after 185°C and 5 hours of
heating period
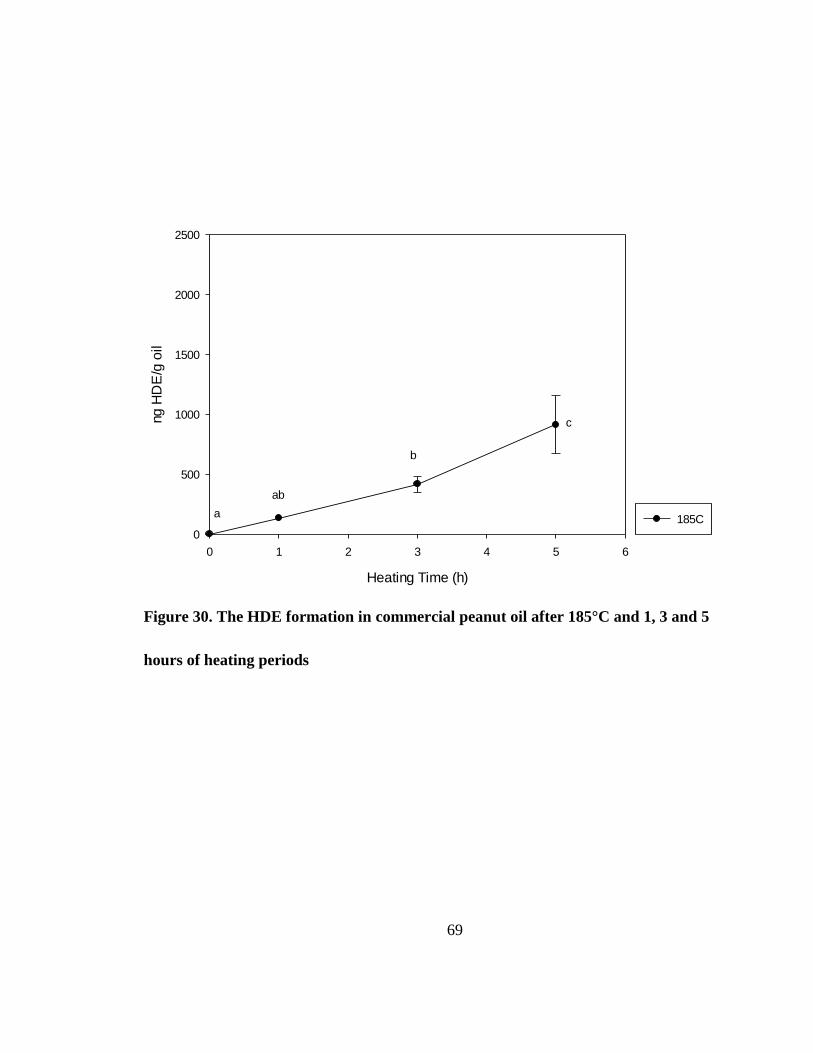
69
Heating Time (h)
0 1 2 3 4 5 6
ng
HD
E/g
oil
0
500
1000
1500
2000
2500
185Ca
ab
b
c
Figure 30. The HDE formation in commercial peanut oil after 185°C and 1, 3 and 5
hours of heating periods

70
d) Canola oil
Figure 31 to Figure 33 show the HHE, HOE and HDE formation respectively in
heated canola oil for 1, 3 and 5 hours at 145, 165 and 185°C. In the unheated canola oil,
HHE, HOE and HDE were not detected.
The HHE formation is shown in Figure 31. In general, the formation of HHE
increased mildly with higher temperatures and longer heating periods. At 165°C, the
HHE formation seemed to decrease slightly along with the increased heating time to 5
hours, but it did not reach significance compared with 3 hours of heating. It seems that
significant differences were not achieved between the groups because of extremely low
concentrations. Since linolenic acid is a precursor for HHE and canola oil contained 9.3%
of it, it is not surprising that some HHE formation can be detected under the time and
temperature treatments.
The HOE and HDE formation (Figure 32 and Figure 33) were similar to HHE
formation, both of their formation increased slightly along with higher temperatures and
longer heating periods. The high levels were found at 185°C after 5 hours of heating
period.

71
Heating Time (h)
0 1 2 3 4 5 6
ng
HH
E/g
oil
0
200
400
600
800
1000
1200
1400
185C
165C
145Ca ab
abc
abc
abcbc
bc
bcd cd
d
Figure 31. The HHE formation in commercial canola oil at various heating time and
temperatures
Heating Time (h)
0 1 2 3 4 5 6
ng
HO
E/g
oil
0
200
400
600
800
1000
1200
1400
185C
165C
145Cab ab
ababbc
bcbc
c
ab
Figure 32. The HOE formation in commercial canola oil at various heating time and
temperatures

72
Heating Time (h)
0 1 2 3 4 5 6
ng
HD
E/g
oil
0
100
200
300
400
500
600
700
800
900
1000
185C
165C
145Ca ab ababc
abcabc
abc bcdcd
d
Figure 33. The HDE formation in commercial canola oil at various heating time and
temperatures
73
e) Comparison between HHE, HOE and HDE concentration in commercial corn,
soybean, peanut and canola oils after heat treated for 1, 3 and 5 hours at 185°C or
165°C or 145°C
Figure 34 (a), (b) and (c) show the comparison of HHE concentration in corn,
soybean, peanut and canola oils treated at 185°C, 165°C and 145°C for 1, 3 and 5 hours
respectively.
Soybean and canola oils had relatively high levels of HHE concentration compared
to corn and peanut oils at every temperature and heating time. HHE formation in soybean
oil was generally somewhat higher than that in canola oil. Corn oil had very low HHE
concentrations at all temperature and heating time, except at 145°C with 1 hour of
heating it was not detected. HHE concentration was only detected in peanut oil when it
was heated for 5 hours at 185°C. These results were consistent with the linolenic acid
concentration in these oils, since linolenic acid is a precursor for HHE. Soybean and
canola oils contain high levels of this fatty acid, while corn and peanut oils contained
very low levels, 0.70 and 0.17% respectively.

74
Heating Time (h)
1 3 5
ng
HH
E/g
oil
0
200
400
600
800
1000
1200
1400
corn
soybean
peanut
canola
a1
a1b1
b1
a2
a2
b2
a3a3
b3
c3
* *
Figure 34 (a). Comparison of HHE concentrations between four different oils heat
treated for 1, 3 and 5 hours at 185 °C.
* means no detection.
Heating Time (h)
1 3 5
ng
HH
E/g
oil
0
200
400
600
800
1000
1200
1400
corn
soybean
peanut
canola
a1
b1a1b1
a2
a2
b2
a3 a3
b3
* * *
Figure 34 (b). Comparison of HHE concentrations between four different oils heat
treated for 1, 3 and 5 hours at 165 °C.
* means no detection.

75
Heating Time (h)
1 3 5
ng
HH
E/g
oil
0
200
400
600
800
1000
1200
1400
Corn
soybean
peanut
canola
a1a1
a2
a2 a2
a3
a3
b3
* * * *
Figure 34 (c). Comparison of HHE concentrations between four different oils heat
treated for 1, 3 and 5 hours at 145 °C.
* means no detection.
76
Figure 35 (a), (b) and (c) show the comparison of HOE concentration between corn,
soybean, peanut and canola oils treated at 185°C, 165°C and 145°C for 1, 3 and 5 hours
respectively. HOE concentration in soybean oil was the highest in all 3 temperatures after
5 hours of heat treatments. After 3 hours of heat treatment, soybean and corn oils seem to
have similar concentrations. After 1 hour of heat treatment, all oils except peanut oil had
similar low concentrations. For peanut oil, HOE concentration was measurable only at
185°C after 5 hours of heat treatment. Previous study in this laboratory showed that HOE
comes from both linoleic acid and linolenic acid (34). Soybean oil has the highest
combined level of linoleic and linolenic acid concentration (42.9% and 4.5%
respectively), therefore it is not surprising that its HOE concentration was the highest
among all the four tested oils. Corn oil has a high level of linoleic acid concentration,
therefore it was the second in the ranking of HOE formation.

77
Heating Time (h)
1 3 5
ng
HO
E/g
oil
0
500
1000
1500
2000
2500
corn
soybean
peanut
canola
a1
a1
a1a2
a2
b2
a3
b3
b3c3
c3
* *
Figure 35 (a). Comparison of HOE concentrations between four different oils heat
treated for 1, 3 and 5 hours at 185 °C.
* means no detection.
Heating Time (h)
1 3 5
ng
HO
E/g
oil
0
500
1000
1500
2000
2500
corn
soybean
peanut
canola
a1a1
a1 a2
b2
b2
a3
a3b3
b3
* * *
Figure 35 (b). Comparison of HOE concentrations between four different oils heat
treated for 1, 3 and 5 hours at 165 °C.
* means no detection.

78
Heating Time (h)
1 3 5
ng
HO
E/g
oil
0
500
1000
1500
2000
2500
Corn
soybean
peanut
canola
a1
a1 a1
a2
a2
a2 a3
a3
a3
* * *
Figure 35 (c). Comparison of HOE concentrations between four different oils heat
treated for 1, 3 and 5 hours at 145 °C.
* means no detection.

79
Figure 36 (a), (b) and (c) show the comparison of HDE concentration between corn,
soybean, peanut and canola oils treated at 185°C, 165°C and 145°C for 1, 3 and 5 hours
respectively. Interestingly, in peanut oil HDE was detected after all these heating periods
1, 3 and 5 hours at 185°C, but was not detected at 165°C and 145°C after heating even as
long as 5 hours. HDE seemed to form at all the temperatures and all the heating time
treatments in corn oil, followed by soybean oil and then canola oil with minimal
formation. Due to the small amount of HDE formation, significant differences could be
detected only at 3 or 5 hours of heat treatments at 185°C. During these conditions, canola
oil produced significantly less HDE than the other three oils.
Heating Time (h)
1 3 5
ng
HD
E/g
oil
0
500
1000
1500
2000
2500
corn
soybean
peanut
canola
a1a1b1
a1b1b1
a2
b2b2
b2
a3
a3b3
b3
b3
Figure 36 (a). Comparison of HDE concentrations between four different oils heat
treated for 1, 3 and 5 hours at 185 °C.
* means no detection.

80
Heating Time (h)
1 3 5
ng
HD
E/g
oil
0
500
1000
1500
2000
2500
corn
soybean
peanut
canola
a1 a1a1 a2
b2
c2
a3
a3b3
b3
* * *
Figure 36 (b). Comparison of HDE concentrations between four different oils heat
treated for 1, 3 and 5 hours at 165 °C.
* means no detection.
Heating Time (h)
1 3 5
ng
HD
E/g
oil
0
500
1000
1500
2000
2500
Corn
soybean
peanut
canola
a1a1 a1
a2
a2
a2a3
a3
a3
* * *
Figure 36 (c). Comparison of HDE concentrations between four different oils heat
treated for 1, 3 and 5 hours at 145 °C.
* means no detection.

81
D. Comparison between the Formation of HHE, HOE, HNE and HDE in
Commercial Corn, Soybean, Peanut and Canola Oils Heat Treated for 5 Hours at
185°C
a) Corn oil
Figure 37 shows the comparison between the formation of HHE, HOE, HNE and
HDE in corn oil heat treated at 185°C for 5 hours. The formation of HNE was much
higher than the other three hydroxyaldehydes. The concentration of HNE was about 56
times higher than the concentration of HHE, 10 times higher than the concentration of
HOE and 7 times higher than the concentration of HDE. HNE was the major α,
β-unsaturated-4-hydroxyaldehyde in corn oil followed by the other three
hydroxyaldehydes with much smaller formations, but significant differences between the
minor compounds were not achieved.
HHE HOE HNE HDE
ng
/g o
il
0
2000
4000
6000
8000 a
b
b
b
Figure 37. Comparison between the formation of HHE, HOE, HNE and HDE in
commercial corn oil heat treated for 5 hours at 185°C

82
b) Soybean oil
Figure 38 shows the comparison between the formation of HHE, HOE, HNE and
HDE in soybean oil heat treated at 185°C for 5 hours. The concentration of HNE was
about 7 times higher than the concentration of HHE, 6.6 times higher than the
concentration of HOE and 11 times higher than the concentration of HDE. There were no
significant differences between the formation of HHE, HOE and HDE.
HHE HOE HNE HDE
ng
/g o
il
0
2000
4000
6000
8000
a
b
b
b
Figure 38. Comparison between the formation of HHE, HOE, HNE and HDE in
commercial soybean oil heat treated for 5 hours at 185°C

83
c) Peanut oil
Figure 39 shows the comparison between the formation of HHE, HOE, HNE and
HDE in peanut oil heat treated at 185°C for 5 hours. The concentration of HNE was
about 53 times higher than the concentration of HHE, 38 times higher than the
concentration of HOE and 5 times higher than the concentration of HDE. There was no
significant difference between the formation of HHE and HOE. But HDE formation was
significantly higher than HHE and HOE. HNE in peanut oil was much higher than the
other three hydroxyaldehydes.
HHE HOE HNE HDE
ng
/g o
il
0
2000
4000
6000
8000
a
c c
b
Figure 39. Comparison between the formation of HHE, HOE, HNE and HDE in
commercial peanut oil heat treated for 5 hours at 185°C

84
d) Canola oil
Figure 40 shows the comparison between the formation of HHE, HOE, HNE and
HDE in canola oil heat treated at 185°C for 5 hours. The concentration of HNE was the
highest among the four compounds in canola oil. The concentration of HNE was
relatively low compared to corn and soybean oils. Interestingly, HDE formation was
significantly lower than both the formation of HHE and HOE. HNE was 2.1 times higher
than the concentration of HHE, 2.3 times higher than the concentration of HOE and 5
times higher than the concentration of HDE.
HHE HOE HNE HDE
ng
/g o
il
0
2000
4000
6000
8000
a
b bc
c
Figure 40. Comparison between the formation of HHE, HOE, HNE and HDE in
commercial canola oil heat treated for 5 hours at 185°C

85
e) Comparison of HHE, HOE, HNE and HDE formation in commercial corn,
soybean, peanut and canola oils heated at 185 °C for 5 hours
Figure 41 shows the comparison between the four hydroxyaldehydes HHE, HOE,
HNE and HDE formation in corn, soybean, peanut and canola oils, respectively.
HHE concentration was significantly higher in soybean oil than in canola oil. And
HHE concentrations in soybean and canola oils were significantly higher than in corn and
peanut oils. It was not surprising because soybean and canola oils contain relatively high
level of linolenic acid which is a precursor for HHE.
Peanut oil had significantly lower level of HOE than corn, soybean and canola oils.
HOE formation is related to the concentration of both linoleic and linolenic acids in the
oil (34).
The highest level of HNE was found in corn oil followed by soybean and peanut oil.
HNE was significantly lower in canola oil which contained the lowest level of linoleic
acid which is the precursor for HNE.
Interestingly, HDE formation in the four oils was almost opposite to HHE formation.
Both corn and peanut oils had the highest concentration but were not significantly
different from soybean oil. However HDE formation in canola oil was significantly lower
than that in both corn and peanut oils. HDE formation is also related to both linoleic and
linolenic acid concentrations in the oil.

86
In total, HNE concentration was much higher than the concentration of the other
three hydroxyaldehydes in corn, soybean and peanut oils. HHE concentration was found
to be very low except in soybean and canola oils which contain relatively high level of
linolenic acid..
HHE HOE HNE HDE
ng
/g o
il
0
2000
4000
6000
8000
corn
soybean
peanut
canola
a1a1
b1
c1
a2
a2b2
b2c2
c2a3
b3
b3c3
c3
a4
a4b4
b4 b4
Figure 41. Comparison between the concentration of HHE, HOE, HNE and HDE in
commercial corn, soybean, peanut and canola oils heat treated for 5 hours at 185°C
87
f) Comparison of the rates of HHE, HOE, HNE and HDE formation in commercial
corn, soybean, peanut, canola oils, lard and beef tallow heated at 185, 165 and 145°C
By doing linear regression analysis, the rates for HHE, HOE, HNE and HDE
formation in commercial corn, soybean, peanut, canola oils, lard and beef tallow heated
at 185, 165 and 145°C for 5 hours were obtained (Table 5). Higher temperature led to a faster
rate of HHE, HOE, HNE and HDE formation. It can be seen that in corn, soybean, peanut and
canola oils, the rates of HNE formation were much higher than that of HHE, HOE and HDE
formation at all the three temperatures. The rates of HHE formation in corn and peanut oils were
much lower than that of HOE and HDE formation. With regard to the rate of HNE formation in
different oils and fats, except lard, corn oil had the fastest rate of HNE formation compared with
the other oils and fats at the same temperature. Then soybean oil had a faster rate of HNE
formation than peanut, canola oils and beef tallow. This result was consistent with the linoleic
acid concentration in the oils and fats. The rates of HHE formation in soybean and canola oils
were relatively higher than that in corn and peanut oils, since soybean and canola oils had higher
levels of linolenic acid which indicates that HHE was mainly from linolenic acid.
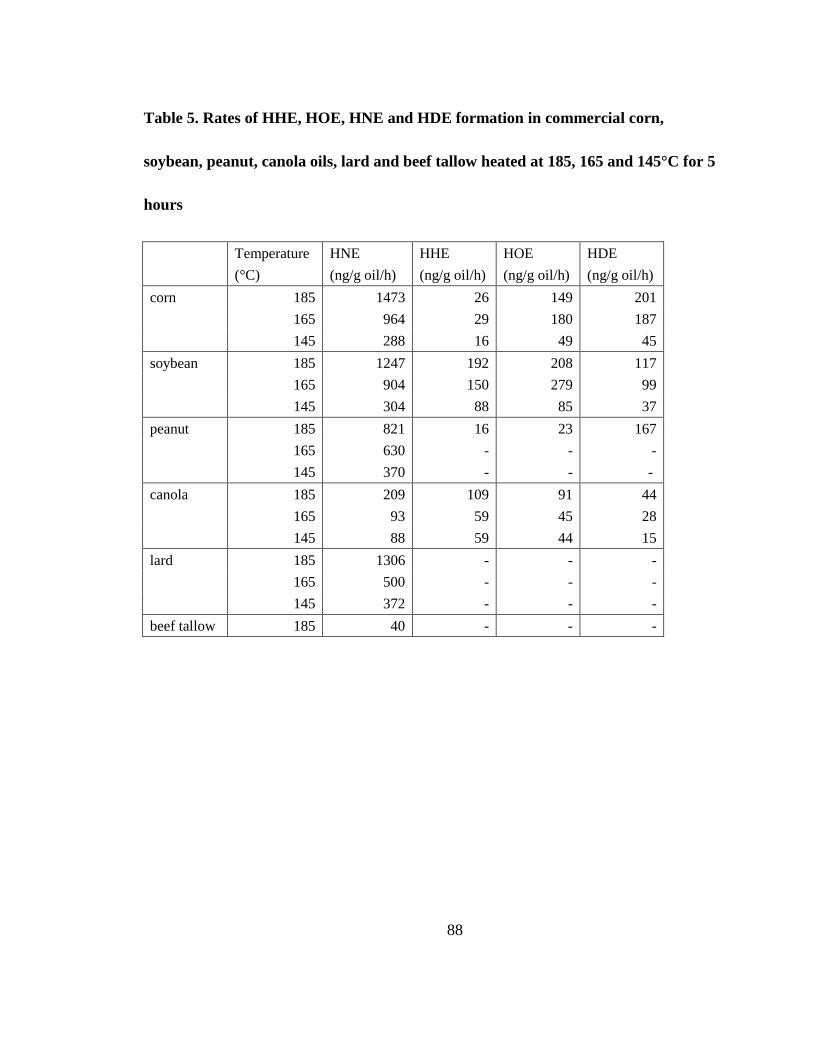
88
Table 5. Rates of HHE, HOE, HNE and HDE formation in commercial corn,
soybean, peanut, canola oils, lard and beef tallow heated at 185, 165 and 145°C for 5
hours
Temperature
(°C)
HNE
(ng/g oil/h)
HHE
(ng/g oil/h)
HOE
(ng/g oil/h)
HDE
(ng/g oil/h)
corn 185 1473 26 149 201
165 964 29 180 187
145 288 16 49 45
soybean 185 1247 192 208 117
165 904 150 279 99
145 304 88 85 37
peanut 185 821 16 23 167
165 630 - - -
145 370 - - -
canola 185 209 109 91 44
165 93 59 45 28
145 88 59 44 15
lard 185 1306 - - -
165 500 - - -
145 372 - - -
beef tallow 185 40 - - -
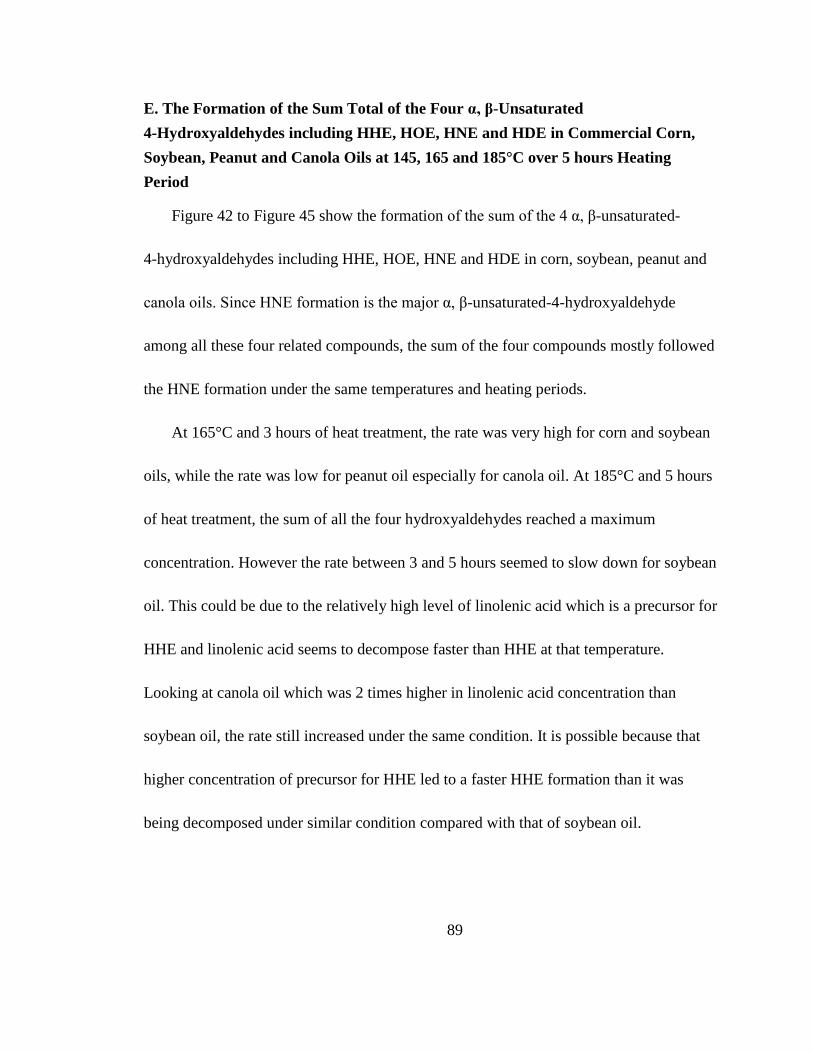
89
E. The Formation of the Sum Total of the Four α, β-Unsaturated
4-Hydroxyaldehydes including HHE, HOE, HNE and HDE in Commercial Corn,
Soybean, Peanut and Canola Oils at 145, 165 and 185°C over 5 hours Heating
Period
Figure 42 to Figure 45 show the formation of the sum of the 4 α, β-unsaturated-
4-hydroxyaldehydes including HHE, HOE, HNE and HDE in corn, soybean, peanut and
canola oils. Since HNE formation is the major α, β-unsaturated-4-hydroxyaldehyde
among all these four related compounds, the sum of the four compounds mostly followed
the HNE formation under the same temperatures and heating periods.
At 165°C and 3 hours of heat treatment, the rate was very high for corn and soybean
oils, while the rate was low for peanut oil especially for canola oil. At 185°C and 5 hours
of heat treatment, the sum of all the four hydroxyaldehydes reached a maximum
concentration. However the rate between 3 and 5 hours seemed to slow down for soybean
oil. This could be due to the relatively high level of linolenic acid which is a precursor for
HHE and linolenic acid seems to decompose faster than HHE at that temperature.
Looking at canola oil which was 2 times higher in linolenic acid concentration than
soybean oil, the rate still increased under the same condition. It is possible because that
higher concentration of precursor for HHE led to a faster HHE formation than it was
being decomposed under similar condition compared with that of soybean oil.

90
a) Corn oil
Figure 42 shows the formation of the sum of HHE, HOE, HNE and HDE in corn oil
at 145, 165 and 185°C over 5 hours of heating period. There was a significant difference
in the sum of hydroxyaldehydes formation for 3 hours of heat treatment at 165°C
compared to that at 145°C. It increased even more at 185°C for 5 hours of heat treatment.
Heating Time (h)
0 1 2 3 4 5 6
ng
/g o
il
0
2x10³
4x10³
6x10³
8x10³
104
185C
165C
145C
ab
a
a
a
c
b
a
c
c
a
Figure 42. The formation of the sum of four α, β-unsaturated- 4-hydroxyaldehydes
including HHE, HOE, HNE and HDE in corn oil at 145, 165 and 185°C over 5 hours
heating period

91
b) Soybean oil
Figure 43 shows the formation of total α, β-unsaturated- 4-hydroxyaldehydes (HHE,
HOE, HNE and HDE) in soybean oil. They increased with higher temperatures and
longer heating time. The increasing trends at 185 and 165°C were more obvious than the
increasing trend at 145°C.
Heating Time (h)
0 1 2 3 4 5 6
ng
/g o
il
0
2x10³
4x10³
6x10³
8x10³
104
185C
165C
145Ca
a
bc
c
a
ab
c
a
a
ab
Figure 43. The formation of the sum of four α, β-unsaturated- 4-hydroxyaldehydes
including HHE, HOE, HNE and HDE in soybean oil at 145, 165 and 185°C over 5
hours heating period

92
c) Peanut oil
Figure 44 shows the formation of total α, β-unsaturated- 4-hydroxyaldehydes (HHE,
HOE, HNE and HDE) in peanut oil. They increased with higher temperatures and longer
heating time. The increasing trend at 145 °C was mild compared with that at 165
and185 °C.
Heating Time (h)
0 1 2 3 4 5 6
ng
/g o
il
0
2x10³
4x10³
6x10³
8x10³
104
185C
165C
145Ca
ab
bc
bc c
c
d d
e
c
Figure 44. The formation of the sum of four α, β-unsaturated-4- hydroxyaldehydes
including HHE, HOE, HNE and HDE in peanut oil at 145, 165 and 185°C over 5
hours heating period
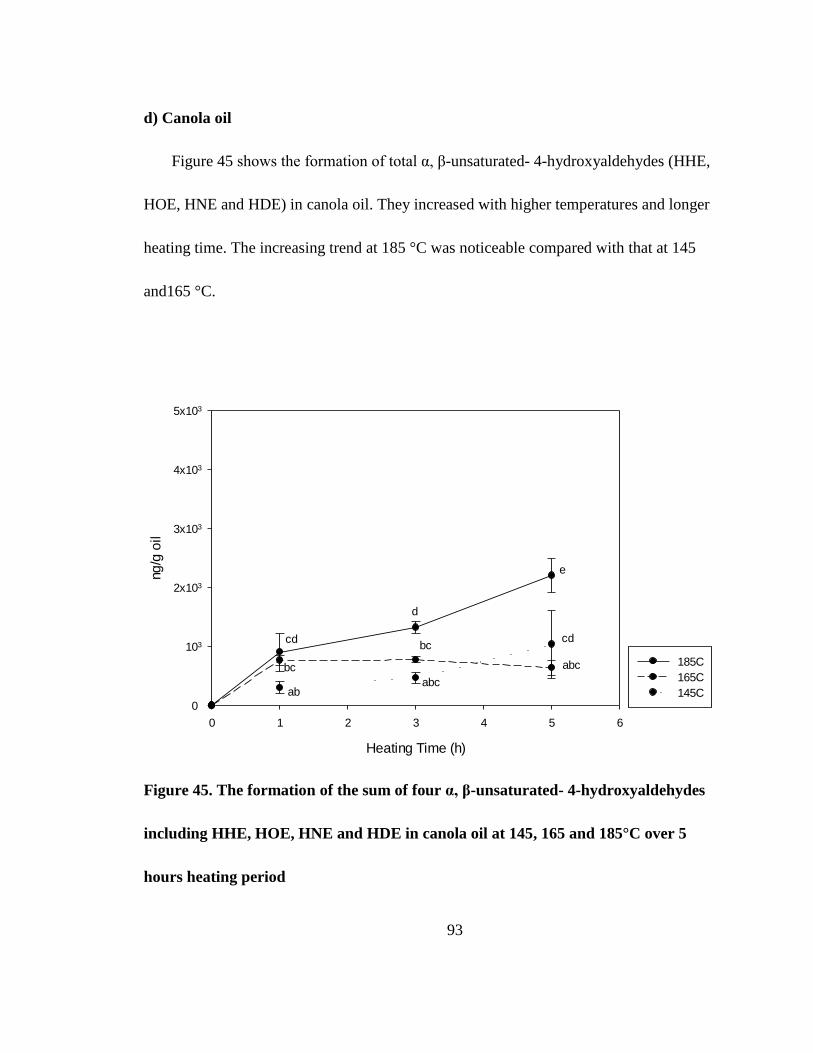
93
d) Canola oil
Figure 45 shows the formation of total α, β-unsaturated- 4-hydroxyaldehydes (HHE,
HOE, HNE and HDE) in canola oil. They increased with higher temperatures and longer
heating time. The increasing trend at 185 °C was noticeable compared with that at 145
and165 °C.
Heating Time (h)
0 1 2 3 4 5 6
ng
/g o
il
0
103
2x10³
3x10³
4x10³
5x10³
185C
165C
145Cababc
abcbc
bccd cd
d
e
Figure 45. The formation of the sum of four α, β-unsaturated- 4-hydroxyaldehydes
including HHE, HOE, HNE and HDE in canola oil at 145, 165 and 185°C over 5
hours heating period

94
F. The Formation of the Sum Total of Individual Polar Lipophilic Aldehydes in
Commercial Corn, Soybean, Peanut, Canola oils, Lard and Beef Tallow Heat
Treated for up to 5 Hours at 145, 165 and 185°C
Figure 46 to Figure 51 show the formation of the sum total of polar lipophilic
aldehydes in corn, soybean, peanut, canola oils, lard and beef tallow, respectively. In
unheated lard and beef tallow, small amounts of total polar aldehydes were detected
which is possible due to the heat treatment used in rendering and melting process. In the
unheated vegetable oils, polar aldehydes were not detected. For the heat-treated oils and
fats, the formation of the sum total of polar aldehydes increased with higher temperatures
and longer heating time. The increasing trends of total polar aldehydes in corn, soybean,
peanut oils and lard were prominent, while the increasing trends of total polar aldehydes
in canola oil and beef tallow were low. The sum total of polar aldehydes in beef tallow
was so low and it was only detected after 5 hours of heat treatment at 185°C.
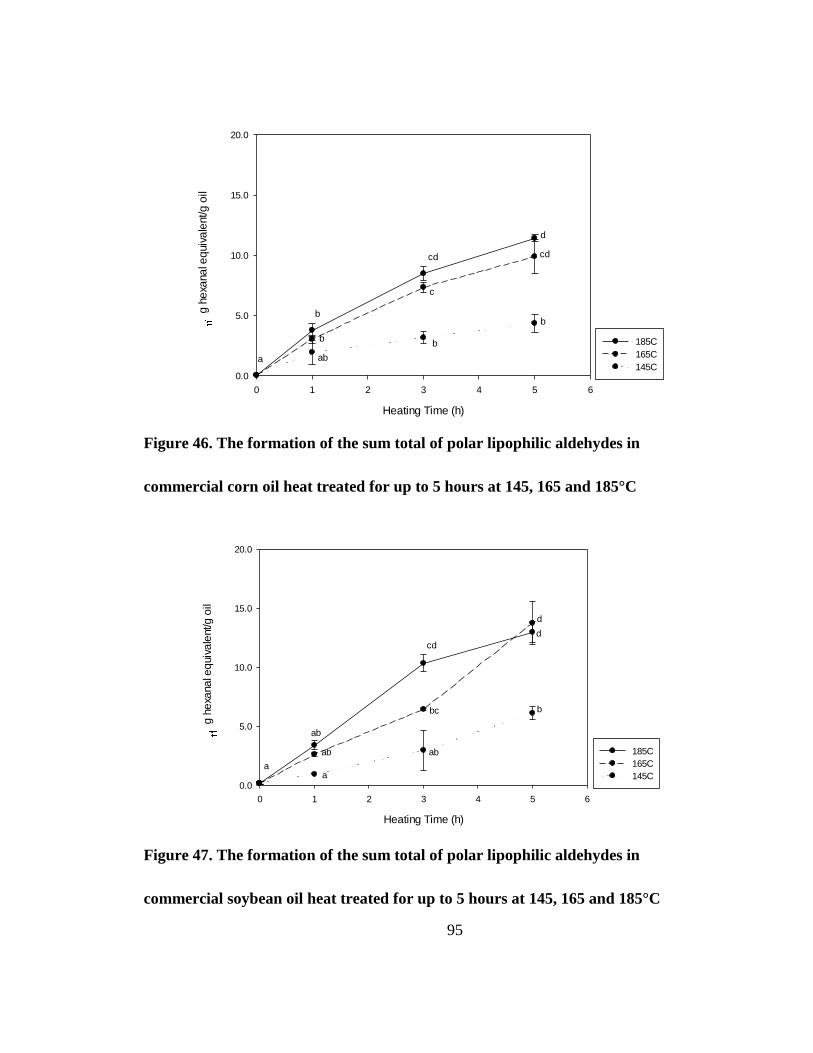
95
Heating Time (h)
0 1 2 3 4 5 6
g h
exa
na
l eq
uiv
ale
nt/g
oil
0.0
5.0
10.0
15.0
20.0
185C
165C
145Caba
bb
bb
c
cd cd
d
Figure 46. The formation of the sum total of polar lipophilic aldehydes in
commercial corn oil heat treated for up to 5 hours at 145, 165 and 185°C
Heating Time (h)
0 1 2 3 4 5 6
g h
exa
na
l eq
uiv
ale
nt/g
oil
0.0
5.0
10.0
15.0
20.0
185C
165C
145Ca
a
ab ab
ab
bbc
cd
d
d
Figure 47. The formation of the sum total of polar lipophilic aldehydes in
commercial soybean oil heat treated for up to 5 hours at 145, 165 and 185°C

96
Heating Time (h)
0 1 2 3 4 5 6
g h
exa
na
l eq
uiv
ale
nt/g
oil
0.0
5.0
10.0
15.0
20.0
185C
165C
145Ca
b
b
bc
c
c cd
e
d
Figure 48. The formation of the sum total of polar lipophilic aldehydes in
commercial peanut oil heat treated for up to 5 hours at 145, 165 and 185°C
Heating Time (h)
0 1 2 3 4 5 6
g h
exa
na
l eq
uiv
ale
nt/g
oil
0.0
5.0
10.0
15.0
20.0
185C
165C
145Ca
a ab
abc
abc
abcd
cd
bcd
dee
Figure 49. The formation of the sum total of polar lipophilic aldehydes in
commercial canola oil heat treated for up to 5 hours at 145, 165 and 185°C

97
Heating Time (h)
0 1 2 3 4 5 6
g h
exa
na
l eq
uiv
ale
nt/g
oil
0.0
5.0
10.0
15.0
20.0
25.0
30.0
185C
165C
145Ca
a
ababc
bcd
cdcd
d
e
e
Figure 50. The formation of the sum total of polar lipophilic aldehydes in lard heat
treated for up to 5 hours at 145, 165 and 185°C
Heating Time (h)
0 1 2 3 4 5 6
g h
exa
na
l eq
uiv
ale
nt/g
oil
0.0
5.0
10.0
15.0
20.0
185Ca
b
Figure 51. The formation of the sum total of polar lipophilic aldehydes in beef tallow
heat treated for up to 5 hours at 185°C

98
Figure 52 (a), (b) and (c) show the comparison of the sum total of polar lipophilic
aldehydes formation between commercial corn, soybean, peanut, canola oils, lard and
beef tallow which were heat treated for 1, 3 and 5 hours at 185, 165 and 145°C. Total
polar aldehydes in beef tallow were only measured at 185°C for 5 hours. At 185°C for 5
hours of heat treatment, a very slow formation of polar lipophilic aldehydes was found in
beef tallow. At all of the three temperatures and heating time, canola oil was found to
contain the lowest level of total polar aldehydes compared with the other oils and lard.
After 1 hour of heating at 145°C (Figure 52 (c)), corn, peanut oils and lard seemed to
contain the highest concentration of total polar aldehydes. After 3 and 5 hours of heating
at 145°C, the concentrations of total polar aldehydes in peanut oil and lard were the
highest.
Figure 52 (b) shows that at 165°C for 3 hours of heat treatment, no significant
differences were found between corn, soybean, peanut oils and lard. After 5 hours of
heating at the same temperature, soybean oil was significantly higher than corn, peanut
oils and lard.
Figure 52 (a) shows that at 185°C for 1 hour of heat treatment, lard was significantly
higher than the four vegetable oils. At 3 hours of heat treatment, canola oil remained the
same as at 1 hour of heating. Corn, soybean and peanut oils were significantly higher
than canola oil and significantly lower than lard. After 5 hours of heating, the significant

99
differences remained the same as at 3 hours of heating but beef tallow had similarly
significant concentration as canola oil.
The relatively high concentration of the sum total of individual polar aldehydes
under all heat treatment conditions in lard was not expected because its unsaturated fatty
acid concentration was very low – linoleic acid concentration was only 8.2% and
linolenic acid concentration was not measurable. Both of these fatty acids are the
precursors for the polar aldehydes. It was postulated that since this is an animal fat it
might contain some catalysts which helped increase polar aldehydes formation especially
at the highest temperature of 185°C and the increasing heating time.

100
Heating Time (h)
1 3 5
g h
exa
na
l eq
uiv
ale
nt/g
oil
0.0
5.0
10.0
15.0
20.0
25.0
30.0
corn
soybean
peanut
canola
lard
beef taloow
a1 a1a1
a1
b1
a2
b2
b2
b2
c2
a3 a3
b3 b3
b3
c3
Figure 52 (a). The formation of the sum total of individual polar lipophilic aldehydes
in commercial corn, soybean, peanut, canola oils, lard and beef tallow heat treated
for 1, 3 and 5 hours at 185 °C
* means no measurement.
* *

101
Heating Time (h)
1 3 5
g h
exa
na
l eq
uiv
ale
nt/g
oil
0.0
5.0
10.0
15.0
20.0
corn
soybean
peanut
canola
lard
a1
b1 b1
b1c1
c1
a2
b2
b2b2
b2
a3
b3
b3
b3
c3
Figure 52 (b). The formation of the sum total of individual polar lipophilic
aldehydes in commercial corn, soybean, peanut, canola oils, lard and beef tallow
heat treated for 1, 3 and 5 hours at 165 °C
* Beef tallow was not measured.

102
Heating Time (h)
1 3 5
g h
exa
na
l eq
uiv
ale
nt/g
oil
0.0
5.0
10.0
15.0
20.0
corn
soybean
peanut
canola
larda1
a1b1
b1c1
b1c1 c1
a2
a2b2
a2b2
b2c2
c2
a3
b3
b3c3
c3
c3
Figure 52 (c). The formation of the sum total of individual polar lipophilic aldehydes
in commercial corn, soybean, peanut, canola oils, lard and beef tallow heat treated
for 1, 3 and 5 hours at 145 °C
* Beef tallow was not measured.
Table 6 shows the rates of total polar aldehydes formation in commercial corn,
soybean, peanut, canola oils, lard and beef tallow heated at 185, 165 and 145°C for 5 hour.
Higher temperature led to a faster rate of total polar aldehydes formation in these oils and fats.
Corn, soybean, peanut oils and lard had relatively faster rates of total polar aldehydes formation
than canola oil and beef tallow.
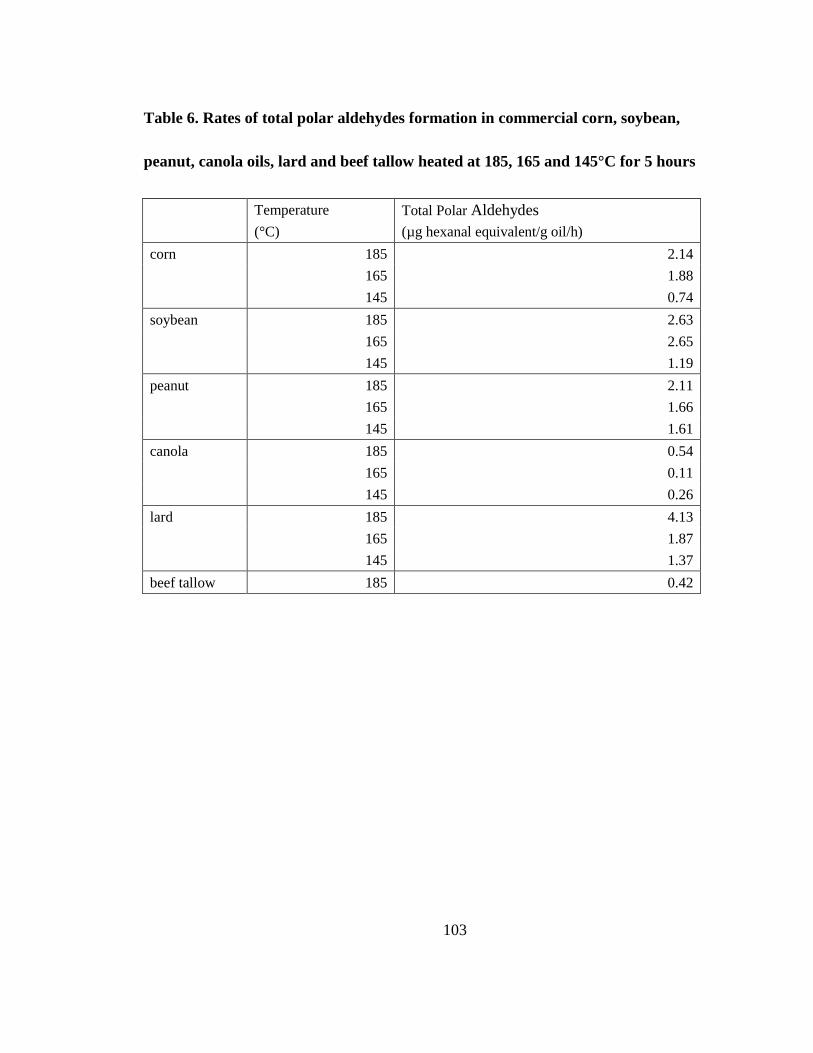
103
Table 6. Rates of total polar aldehydes formation in commercial corn, soybean,
peanut, canola oils, lard and beef tallow heated at 185, 165 and 145°C for 5 hours
Temperature
(°C)
Total Polar Aldehydes
(µg hexanal equivalent/g oil/h)
corn 185 2.14
165 1.88
145 0.74
soybean 185 2.63
165 2.65
145 1.19
peanut 185 2.11
165 1.66
145 1.61
canola 185 0.54
165 0.11
145 0.26
lard 185 4.13
165 1.87
145 1.37
beef tallow 185 0.42
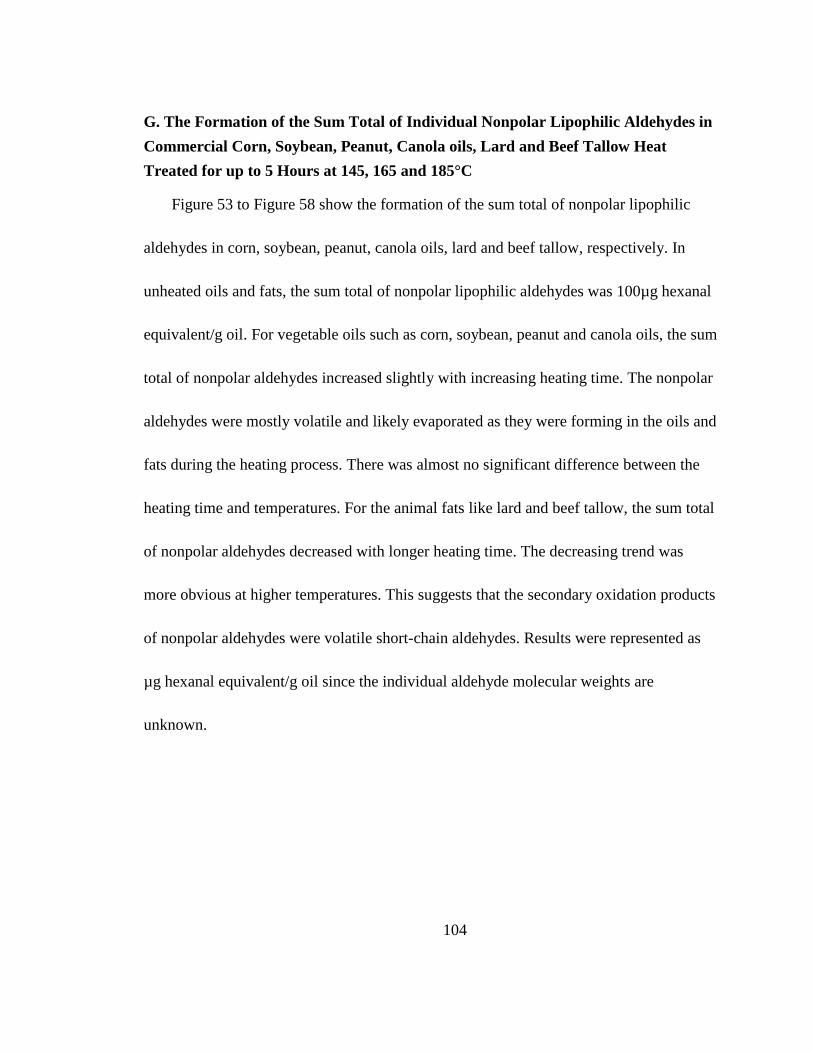
104
G. The Formation of the Sum Total of Individual Nonpolar Lipophilic Aldehydes in
Commercial Corn, Soybean, Peanut, Canola oils, Lard and Beef Tallow Heat
Treated for up to 5 Hours at 145, 165 and 185°C
Figure 53 to Figure 58 show the formation of the sum total of nonpolar lipophilic
aldehydes in corn, soybean, peanut, canola oils, lard and beef tallow, respectively. In
unheated oils and fats, the sum total of nonpolar lipophilic aldehydes was 100µg hexanal
equivalent/g oil. For vegetable oils such as corn, soybean, peanut and canola oils, the sum
total of nonpolar aldehydes increased slightly with increasing heating time. The nonpolar
aldehydes were mostly volatile and likely evaporated as they were forming in the oils and
fats during the heating process. There was almost no significant difference between the
heating time and temperatures. For the animal fats like lard and beef tallow, the sum total
of nonpolar aldehydes decreased with longer heating time. The decreasing trend was
more obvious at higher temperatures. This suggests that the secondary oxidation products
of nonpolar aldehydes were volatile short-chain aldehydes. Results were represented as
µg hexanal equivalent/g oil since the individual aldehyde molecular weights are
unknown.

105
Heating Time (h)
0 1 2 3 4 5 6
g h
exa
na
l eq
uiv
ale
nt/g
oil
0.0
50.0
100.0
150.0
200.0
185C
165C
145C
a
c
bb
Figure 53. The formation of the sum total of nonpolar lipophilic aldehydes in
commercial corn oil heat treated for up to 5 hours at 145, 165 and 185°C
Heating Time (h)
0 1 2 3 4 5 6
g h
exa
na
l eq
uiv
ale
nt/g
oil
0.0
50.0
100.0
150.0
200.0
185C
165C
145C
a
b
ab
ab
Figure 54. The formation of the sum total of nonpolar lipophilic aldehydes in
commercial soybean oil heat treated for up to 5 hours at 145, 165 and 185°C

106
Heating Time (h)
0 1 2 3 4 5 6
g h
exa
nal e
quiv
ale
nt/g o
il
0.0
50.0
100.0
150.0
200.0
185C
165C
145C
a
bab
ab
Figure 55. The formation of the sum total of nonpolar lipophilic aldehydes in
commercial peanut oil heat treated for up to 5 hours at 145, 165 and 185°C
Heating Time (h)
0 1 2 3 4 5 6
g h
exa
na
l eq
uiv
ale
nt/g
oil
0.0
50.0
100.0
150.0
200.0
185C
165C
145C
abab
ab
Figure 56. The formation of the sum total of nonpolar lipophilic aldehydes in
commercial canola oil heat treated for up to 5 hours at 145, 165 and 185°C
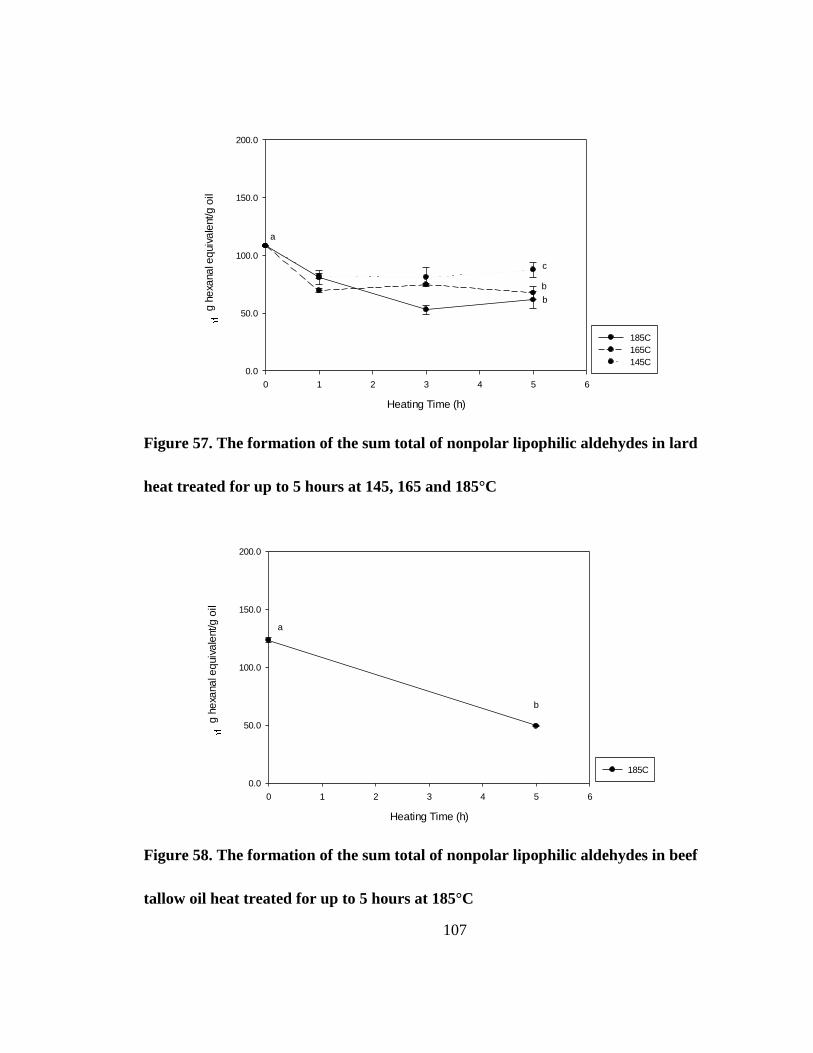
107
Heating Time (h)
0 1 2 3 4 5 6
g h
exa
na
l eq
uiv
ale
nt/g
oil
0.0
50.0
100.0
150.0
200.0
185C
165C
145C
a
b
b
c
Figure 57. The formation of the sum total of nonpolar lipophilic aldehydes in lard
heat treated for up to 5 hours at 145, 165 and 185°C
Heating Time (h)
0 1 2 3 4 5 6
g h
exa
na
l eq
uiv
ale
nt/g
oil
0.0
50.0
100.0
150.0
200.0
185C
a
b
Figure 58. The formation of the sum total of nonpolar lipophilic aldehydes in beef
tallow oil heat treated for up to 5 hours at 185°C

108
Figure 59 (a), (b) and (c) show the comparison of the formation of the sum total of
individual nonpolar lipophilic aldehydes between commercial corn, soybean, peanut,
canola oils, lard and beef tallow which were heat treated for 1,3 and 5 hours at 185°C,
165°C and 145°C.
At the shortest heating time of 1 hour and lowest temperature 145°C (Figure 59 (c)),
the concentrations of the total nonpolar aldehydes of the four oils were significantly
higher than that of lard. Lard remained the lowest concentration compared to the four oils
as the heating time increased to 3 and 5 hours.
At 165°C (Figure 59 (b)), with the increasing heating time, lard remained containing
the significantly lower concentration of nonpolar aldehydes than that of the four oils. At
this temperature and heat treatment of 5 hours, the concentrations of the total nonpolar
aldehydes of corn, soybean and canola oils were significantly higher than that of canola
oil. And canola oil was significantly higher than lard.
At frying temperature of 185°C for 1, 3 and 5 hours of heat treatment (Figure 59 (a)),
lard remained significantly lower than all of the four vegetable oils. In the case of 3 and 5
hours of heat treatment, corn, soybean and peanut oils seemed to be very similarly higher
than canola oil, while lard was significantly lower than all the four oils. Beef tallow was
only measured for total nonpolar aldehydes at 185°C after 5 hours of heat treatment. It
seems that especially at the higher temperature and longer heating period, the nonpolar

109
aldehydes evaporation rate was faster than the rate at lower temperature and shorter
heating period.
Heating Time (h)
1 3 5
g h
exa
na
l eq
uiv
ale
nt/g
oil
0.0
50.0
100.0
150.0
200.0
corn
soybean
peanut
canola
lard
beef tallow
a1
b1
b1c1
c1c1
a2
b2
b2c2
c2c2
a3
a3
b3
b3c3b3c3
c3
Figure 59 (a). The formation of the sum total of individual nonpolar lipophilic
aldehydes in commercial corn, soybean, peanut, canola oils, lard and beef tallow
heat treated for 1, 3 and 5 hours at 185 °C
* means no measurement.
* *
110
Heating Time (h)
1 3 5
g h
exa
na
l eq
uiv
ale
nt/g
oil
0.0
50.0
100.0
150.0
200.0
corn
soybean
peanut
canola
lard
a1
b1
c1
c1d1
d1
a2
a2b2
b2
b2b2
a3
b3
c3
c3c3
Figure 59 (b). The formation of the sum total of individual nonpolar lipophilic
aldehydes in commercial corn, soybean, peanut, canola oils, lard and beef tallow
heat treated for 1, 3 and 5 hours at 165 °C
* Beef tallow was not measured.

111
Heating Time (h)
1 3 5
g h
exa
na
l eq
uiv
ale
nt/g
oil
0.0
50.0
100.0
150.0
200.0
corn
soybean
peanut
canola
lard
a1
b1
b1
b1b1
a2
a2b2
b2c2b2c2
c2
a3
a3b3 b3
a3b3
b3
Figure 59 (c). The formation of the sum total of individual nonpolar lipophilic
aldehydes in commercial corn, soybean, peanut, canola oils, lard and beef tallow
heat treated for 1, 3 and 5 hours at 145 °C
* Beef tallow was not measured.
Table 7 shows the rates of total nonpolar aldehydes formation in commercial corn,
soybean, peanut, canola oils, lard and beef tallow heated at 185, 165 and 145°C for 5 hour.
In the vegetable oils, corn, soybean, peanut and canola oils, the rates of total nonpolar aldehydes

112
formation were positive which means the total nonpolar aldehydes formation increased with
longer heating time. While in the fats, lard and beef tallow, the rates of total nonpolar aldehydes
were negative. Because nonpolar aldehydes are volatile and evaporate easily, the HPLC method
used in this experiment only measured the nonpolar aldehydes retained in the oils and fats after
heat treatment.
Table 7. Rates of total nonpolar aldehydes formation in commercial corn, soybean,
peanut, canola oils, lard and beef tallow heated at 185, 165 and 145°C for 5 hours
Temperature
(°C)
Total Nonpolar Aldehydes
(µg hexanal equivalent/g oil/h)
corn 185 6.68
165 7.74
145 4.98
soybean 185 2.10
165 7.76
145 2.17
peanut 185 2.53
165 3.88
145 1.84
canola 185 0.65
165 1.67
145 1.87
lard 185 -8.68
165 -5.37
145 -2.52
beef tallow 185 -14.82

113
Discussion
From the present experiments, we can conclude that the formation of the α, β-
unsaturated 4-hydroxyaldehydes, HHE, HOE, HNE and HDE, increased with elevated
temperatures from 145°C to 165°C and to 185°C in commercial corn, soybean, peanut
and canola oils. At all of these temperatures, with the increased time of heat treatment
from 0 to 1, 3 up to 5 hours, the oxidation rate increased which led to the higher
concentration of hydroxyaldehydes. The combination of the three factors, unsaturation,
temperature, and time of heat treatment, resulted in highly increased HHE, HOE, HNE
and HDE formation. The concentration of HNE, the most toxic compound of the four α,
β- unsaturated 4-hydroxyaldehydes, was much higher than other three
4-hydroxyaldehydes in all samples. It was found that the oils which contained the higher
concentration of linoleic acid had higher HNE formations compared to the oils with
lower level of linoleic acid. This was expected because linoleic acid is a precursor of
HNE. Soybean and canola oils which contained relatively high levels of linolenic acid
had higher HHE formation than the low linolenic acid containing oils and fats. In beef
tallow, HNE formation was found to be very low even after 5 hours of heating at
185°C.At lower temperatures, it could not even be detected. Lard seemed to be an
exception. Its HNE formation was very high but its linoleic acid concentration was
relatively low. The reason may be that since it is an animal fat. It may contain some
114
compounds which were catalyzing the peroxidation process and cause the increase of the
formation of secondary oxidation products including the α, β-unsaturated
4-hydroxyaldehydes. This question should be further investigated in the future.
Although our objective was to measure the formation and concentration of
α,β-unsaturated 4- hydroxyaldehydes in commercial oils and fats, it should be noted that
the sum total of individual polar aldehydes measured by HPLC also increased and
remained in the oils due to longer heating time and higher temperatures. Total nonpolar
aldehydes remaining in the oil increased slightly with increased temperatures and heating
time in vegetable oils but decreased in lard and beef tallow. The change of total nonpolar
aldehydes which remained in the oil was related to their formation and the evaporation.
The short-chain nonpolar aldehydes easily evaporated at higher temperatures and did not
remain in the animal fats due to longer heating time.
Since the α,β-unsaturated 4- hydroxyaldehydes are very reactive toxic compounds
and they have been shown to relate to a number of diseases, it is important to understand
their formation in commercial oils and fats which are used mostly at high temperatures
especially in commercial frying. Based on the results of this study, the oils or fats that
have low level of unsaturated fatty acids which produce less toxic 4- hydroxyaldehydes
should be used especially for commercial frying. To minimize the formation of α, β-

115
unsaturated 4-hydroxyaldehydes in high linoleic and linolenic acids containing oils in
food, the lowest possible temperature and shortest heating time should be used.
Since HNE is readily absorbed from the diet, its toxicity is well established in the
literature, and it is related to a number of pathological conditions, frequent consumption
of heated oils that contain considerable HNE, a toxic aldehyede, may be of public health
concern.

116
References
1. Liu, Q., A.K. Raina, M.A. Smith, L.M. Sayre, and G. Perry, Hydroxynonenal, toxic
carbonyls, and Alzheimer disease, Mol Aspects Med 24:305-313 (2003).
2. Reed, T.T., Lipid peroxidation and neurodegenerative disease, Free Radical Bio Med
51:1302-1319 (2011).
3. Uchida, K., S. Toyokuni, K. Nishikawa, S. Kawakishi, H. Oda, H. Hiai, and E.R.
Stadtman, Michael Addition-Type 4-Hydroxy-2-Nonenal Adducts in Modified
Low-Density Lipoproteins - Markers for Atherosclerosis, Biochemistry-Us
33:12487-12494 (1994).
4. Yoritaka, A., N. Hattori, K. Uchida, M. Tanaka, E.R. Stadtman, and Y. Mizuno,
Immunohistochemical detection of 4-hydroxynonenal protein adducts in Parkinson
disease, P Natl Acad Sci USA 93:2696-2701 (1996).
5. Grootveld, M., M.D. Atherton, A.N. Sheerin, J. Hawkes, D.R. Blake, T.E. Richens,
C.J. Silwood, E. Lynch, and A.W. Claxson, In vivo absorption, metabolism, and urinary
excretion of alpha,beta-unsaturated aldehydes in experimental animals. Relevance to the
development of cardiovascular diseases by the dietary ingestion of thermally stressed
polyunsaturate-rich culinary oils, J Clin Invest 101:1210-1218 (1998).

117
6. Kruman, I., A.J. BruceKeller, D. Bredesen, G. Waeg, and M.P. Mattson, Evidence
that 4-hydroxynonenal mediates oxidative stress-induced neuronal apoptosis, J Neurosci
17:5089-5100 (1997).
7. Mark, R.J., M.A. Lovell, W.R. Markesbery, K. Uchida, and M.P. Mattson, A role for
4-hydroxynonenal, an aldehydic product of lipid peroxidation, in disruption of ion
homeostasis and neuronal death induced by amyloid beta-peptide, J Neurochem
68:255-264 (1997).
8. Seppanen, C.M., and A.S. Csallany, Incorporation of the toxic aldehyde
4-hydroxy-2-trans-nonenal into food fried in thermally oxidized soybean oil, J Am Oil
Chem Soc 81:1137-1141 (2004).
9. LaFond, S.I., J.P. Jerrell, K.R. Cadwallader, and W.E. Artz, Formation of
4-Hydroxy-2-(E)-Nonenal in a Corn-Soy Oil Blend: a Controlled Heating Study Using a
French Fried Potato Model, J Am Oil Chem Soc 88:763-772 (2011).
10. Seppanen, C.M., and A.S. Csallany, Simultaneous determination of lipophilic
aldehydes by high-performance liquid chromatography in vegetable oil, J Am Oil Chem
Soc 78:1253-1260 (2001).
11. Seppanen, C.M., and A.S. Csallany, The effect of intermittent and continuous
heating of soybean oil at frying temperature on the formation of

118
4-hydroxy-2-trans-nonenal and other alpha-, beta-unsaturated hydroxyaldehydes, J Am
Oil Chem Soc 83:121-127 (2006).
12. Surh, J., and H. Kwon, Estimation of daily exposure to 4-hydroxy-2-alkenals in
Korean foods containing n-3 and n-6 polyunsaturated fatty acids, Food Addit Contam
22:701-708 (2005).
13. Lang, J., C. Celotto, and H. Esterbauer, Quantitative-Determination of the
Lipid-Peroxidation Product 4-Hydroxynonenal by High-Performance
Liquid-Chromatography, Anal Biochem 150:369-378 (1985).
14. Boskou, G., F.N. Salta, A. Chiou, E. Troullidou, and N.K. Andrikopoulos, Content of
trans,trans-2,4-decadienal in deep-fried and pan-fried potatoes, European Journal of
Lipid Science and Technology 108:109-115 (2006).
15. Choe, E., and D.B. Min, Chemistry of deep-fat frying oils, J Food Sci 72:R77-R86
(2007).
16. Barrera-Arellano, D., V. Ruiz-Mendez, J. Velasco, G. Marquez-Ruiz, and C.
Dobarganes, Loss of tocopherols and formation of degradation compounds at frying
temperatures in oils differing in degree of unsaturation and natural antioxidant content, J
Sci Food Agr 82:1696-1702 (2002).
17. Zeb, A., Effects of beta-carotene on the thermal oxidation of fatty acids, Afr J
Biotechnol 10:15346-15352 (2011).

119
18. Tyagi, V.K., and A.K. Vasishtha, Changes in the characteristics and composition of
oils during deep-fat frying, J Am Oil Chem Soc 73:499-506 (1996).
19. Fennema, O.R., Food chemistry, Marcel Dekker, New York, 1996.
20. Chan, H.W.S., and G. Levett, Autoxidation of Methyl Linoleate, Separation and
Analysis of Isomeric Mixtures of Methyl Linoleate Hydroperoxides and Methyl
Hydroxylinoleates, Lipids 12:99-104 (1977).
21. Haywood, R.M., A.W.D. Claxson, G.E. Hawkes, D.P. Richardson, D.P. Naughton, G.
Coumbarides, J. Hawkes, E.J. Lynch, and M.C. Grootveld, Detection of Aldehydes and
Their Conjugated Hydroperoxydiene Precursors in Thermally-Stressed Culinary Oils and
Fats - Investigations Using High-Resolution Proton Nmr-Spectroscopy, Free Radical Res
22:441-482 (1995).
22. Choe, E., and D.B. Min, Mechanisms and factors for edible oil oxidation, Compr Rev
Food Sci F 5:169-186 (2006).
23. Esterbauer, H., Aldehydic products of lipid peroxidation, Free radicals, lipid
peroxidation and cancer:101-128 (1982).
24. Guillén, M.D., and A. Ruiz, Monitoring of heat-induced degradation of edible oils by
proton NMR, European Journal of Lipid Science and Technology 110:52-60 (2008).

120
25. Esterbauer, H., R.J. Schaur, and H. Zollner, Chemistry and Biochemistry of
4-Hydroxynonenal, Malonaldehyde and Related Aldehydes, Free Radical Bio Med
11:81-128 (1991).
26. Coscione, A.R., and W.E. Artz, Vegetable Oil Stability at Elevated Temperatures in
the Presence of Ferric Stearate and Ferrous Octanoate, Journal of Agricultural and Food
Chemistry 53:2088-2094 (2005).
27. Aladedunye, F.A., and R. Przybylski, Degradation and Nutritional Quality Changes
of Oil During Frying, Journal of the American Oil Chemists' Society 86:149-156 (2008).
28. Houhoula, D.P., V. Oreopoulou, and C. Tzia, A kinetic study of oil deterioration
during frying and a comparison with heating, J Am Oil Chem Soc 79:133-137 (2002).
29. Chung, T.Y., J.P. Eiserich, and T. Shibamoto, Volatile Compounds Identified in
Headspace Samples of Peanut Oil Heated under Temperatures Ranging from
50-Degrees-C to 200-Degrees-C, Journal of Agricultural and Food Chemistry
41:1467-1470 (1993).
30. Goicoechea, E., and M.D. Guillen, Analysis of Hydroperoxides, Aldehydes and
Epoxides by (1)H Nuclear Magnetic Resonance in Sunflower Oil Oxidized at 70 and 100
degrees C, J Agr Food Chem 58:6234-6245 (2010).
31. Paul, S., and G.S. Mittal, Regulating the use of degraded oil/fat in deep-fat/oil food
frying, Crit Rev Food Sci 37:635-662 (1997).

121
32. Gere, A., Study of Some Factors Affecting Frying Fat Deterioration, Fett Wiss
Technol 85:18-23 (1983).
33. Claxson, A.W.D., G.E. Hawkes, D.P. Richardson, D.P. Naughton, R.M. Haywood,
C.L. Chander, M. Atherton, E.J. Lynch, and M.C. Grootveld, Generation of
Lipid-Peroxidation Products in Culinary Oils and Fats during Episodes of Thermal
Stressing - a High-Field H-1-Nmr Study, Febs Lett 355:81-90 (1994).
34. Han, I.H., and A.S. Csallany, Formation of Toxic alpha,beta-Unsaturated
4-Hydroxy-Aldehydes in Thermally Oxidized Fatty Acid Methyl Esters, J Am Oil Chem
Soc 86:253-260 (2009).
35. Grein, B., M. Huffer, G. Scheller, and P. Schreier, 4-Hydroxy-2-Alkenals and Other
Products Formed by Water-Mediated Oxidative Decomposition of
Alpha,Beta-Unsaturated Aldehydes, J Agr Food Chem 41:2385-2390 (1993).
36. Schneider, C., K.A. Tallman, N.A. Porter, and A.R. Brash, Two distinct pathways of
formation of 4-hydroxynonenal. Mechanisms of non-enzymatic transformation of the 9-
and 13-hydroperoxides of linoleic acid to 4-hydroxyalkenals. (vol 276, pg 20831, 2001),
Journal of Biological Chemistry 276:32392-32392 (2001).
37. Schneider, C., K.A. Tallman, N.A. Porter, and A.R. Brash, Two distinct pathways of
formation of 4-hydroxynonenal - Mechanisms of nonenzymatic transformation of the

122
9-and 13-hydroperoxides of linoleic acid to 4-hydroxyalkenals, J. Biol. Chem.
276:20831-20838 (2001).
38. Fullana, A., A.A. Carbonell-Barrachina, and S. Sidhu, Volatile aldehyde emissions
from heated cooking oils, J Sci Food Agr 84:2015-2021 (2004).
39. Zhu, X.D., K.X. Wang, J.L. Zhu, and M.R. Koga, Analysis of cooking oil fumes by
ultraviolet spectrometry and gas chromatography-mass spectrometry, J Agr Food Chem
49:4790-4794 (2001).
40. Barrera-Arellano, D., V. Ruiz-M�ndez, J.n. Velasco, G. M�rquez-Ruiz, and C.
Dobarganes, Loss of tocopherols and formation of degradation compounds at frying
temperatures in oils differing in degree of unsaturation and natural antioxidant content,
Journal of the Science of Food and Agriculture 82:1696-1702 (2002).
41. Esterbauer, H., Cytotoxicity and Genotoxicity of Lipid-Oxidation Products, Am J
Clin Nutr 57:S779-S786 (1993).
42. Gardner, D.R., R.A. Sanders, D.E. Henry, D.H. Tallmadge, and H.W. Wharton,
Characterization of Used Frying Oils .1. Isolation and Identification of Compound
Classes, J Am Oil Chem Soc 69:499-508 (1992).
43. Becalski, A., B.P.Y. Lau, D. Lewis, and S.W. Seaman, Acrylamide in foods:
Occurrence, sources, and modeling, Journal of Agricultural and Food Chemistry
51:802-808 (2003).

123
44. International Agency for Research on Cancer. IARC Monographs on the EValuation
of Carcinogenic Risks to Humans; Lyon, France, 1994; Vol. 60, pp 389-433.
45. Erkkila, A., V.D.F. de Mello, U. Riserus, and D.E. Laaksonen, Dietary fatty acids
and cardiovascular disease: An epidemiological approach, Prog Lipid Res 47:172-187
(2008).
46. Yashodhara, B.M., S. Umakanth, J.M. Pappachan, S.K. Bhat, R. Kamath, and B.H.
Choo, Omega-3 fatty acids: a comprehensive review of their role in health and disease,
Postgrad Med J 85:84-90 (2009).
47. Engler, M.M., and M.B. Engler, Omega-3 fatty acids: role in cardiovascular health
and disease, J Cardiovasc Nurs 21:17-24, quiz 25-16 (2006).
48. Grootveld, M., C.J.L. Silwood, and A.W.D. Claxson, Warning: thermally-stressed
polyunsaturates are damaging to health, Food Chem 67:211-213 (1999).
49. Kim, S.S., D.D. Gallaher, and A.S. Csallany, Lipophilic aldehydes and related
carbonyl compounds in rat and human urine, Lipids 34:489-496 (1999).
50. Ramsden, C.E., D. Zamora, B. Leelarthaepin, S.F. Majchrzak-Hong, K.R. Faurot,
C.M. Suchindran, A. Ringel, J.M. Davis, and J.R. Hibbeln, Use of dietary linoleic acid
for secondary prevention of coronary heart disease and death: evaluation of recovered
data from the Sydney Diet Heart Study and updated meta-analysis, Bmj 346:e8707-e8707
(2013).

124
51. Uchida, K., 4-Hydroxy-2-nonenal: a product and mediator of oxidative stress, Prog
Lipid Res 42:318-343 (2003).
52. Schaur, R.J., Basic aspects of the biochemical reactivity of 4-hydroxynonenal, Mol
Aspects Med 24:149-159 (2003).
53. Zarkovic, K., 4-hydroxynonenal and neurodegenerative diseases, Mol Aspects Med
24:293-303 (2003).
54. Lynch, M.P., C. Faustman, L.K. Silbart, D. Rood, and H.C. Furr, Detection of
lipid-derived aldehydes and aldehyde : protein adducts in vitro and in beef, J Food Sci
66:1093-1099 (2001).
55. Uchida, K., and E.R. Stadtman, Covalent attachment of 4-hydroxynonenal to
glyceraldehyde-3-phosphate dehydrogenase. A possible involvement of intra- and
intermolecular cross-linking reaction, J Biol Chem 268:6388-6393 (1993).
56. Witz, G., Biological interactions of alpha,beta-unsaturated aldehydes, Free Radic
Biol Med 7:333-349 (1989).
57. Gardner, H.W., and M.J. Grove, Soybean lipoxygenase-1 oxidizes 3Z-nonenal. A
route to 4s-hydroperoxy-2e-nonenal and related products, Plant Physiol 116:1359-1366
(1998).
58. Eckl, P.M., A. Ortner, and H. Esterbauer, Genotoxic properties of 4-hydroxyalkenals
and analogous aldehydes, Mutat Res 290:183-192 (1993).

125
59. Hu, W., Z. Feng, J. Eveleigh, G. Iyer, J. Pan, S. Amin, F.L. Chung, and M.S. Tang,
The major lipid peroxidation product, trans-4-hydroxy-2-nonenal, preferentially forms
DNA adducts at codon 249 of human p53 gene, a unique mutational hotspot in
hepatocellular carcinoma, Carcinogenesis 23:1781-1789 (2002).
60. Zarkovic, N., 4-hydroxynonenal as a bioactive marker of pathophysiological
processes, Mol Aspects Med 24:281-291 (2003).
61. Seppanen, C.M., and A.S. Csallany, Formation of 4-hydroxynonenal, a toxic
aldehyde, in soybean oil at frying temperature, J Am Oil Chem Soc 79:1033-1038 (2002).
62. Han, I.H., and A.S. Csallany, Temperature dependence of HNE formation in
vegetable oils and butter oil, J Am Oil Chem Soc 85:777-782 (2008).
63. Gerde, J.A., E.G. Hammond, and P.J. White, Influence of Polydimethylsiloxane on
the Formation of 4-Hydroxynonenal in Soybean Oil at Frying Temperature, J Am Oil
Chem Soc 88:1503-1510 (2011).
64. Official Methods and Recommended Practices of the American Oil Chemists’
Society, 4th edn., edited by D. Firestone, American Oil Chemists’ Society, Champaign,
1997, Method Cd 8-53.
65. Metcalfe, L.D., Citation Classic - the Rapid Preparation of Fatty-Acid Esters for
Gas-Chromatographic Analysis, Cc/Life Sci:16-16 (1981).

126
66. Ulu, H., Evaluation of three 2-thiobarbituric acid methods for the measurement of
lipid oxidation in various meats and meat products, Meat Science 67:683-687 (2004).
67. Frankel, E.N., In Search of Better Methods to Evaluate Natural Antioxidants and
Oxidative Stability in Food Lipids, Trends Food Sci Tech 4:220-225 (1993).
68. Buege, J.A., and S.D. Aust, Microsomal lipid peroxidation, Methods Enzymol
52:302-310 (1978).
69. Marmesat, S., A. Morales, J. Velasco, M.V. Ruiz-Mendez, and M.C. Dobarganes,
Relationship between changes in peroxide value and conjugated dienes during oxidation
of sunflower oils with different degree of unsaturation, Grasas Aceites 60:155-160
(2009).

127
Appendix A: Statistical Analyses
HNE-corn
0.000 145-1 165-1 185-1 145-3 165-3 185-3 145-5 165-5
145-1 0.997
165-1 0.147 0.535
185-1 0.040 0.174 0.999
145-3 0.098 0.391 1.000 1.000
165-3 0.000 0.000 0.006 0.020 0.008
185-3 0.000 0.000 0.000 0.000 0.000 0.001
145-5 0.058 0.247 1.000 1.000 1.000 0.014 0.000
165-5 0.000 0.000 0.000 0.000 0.000 0.002 1.000 0.000
185-5 0.000 0.000 0.000 0.000 0.000 0.000 0.004 0.000 0.001
HNE-soybean
0.000 145-1 165-1 185-1 145-3 165-3 185-3 145-5 165-5
145-1 1.000
165-1 0.727 0.975
185-1 0.236 0.535 0.997
145-3 0.497 0.858 1.000 1.000
165-3 0.007 0.017 0.109 0.428 0.196
185-3 0.000 0.000 0.000 0.000 0.000 0.008
145-5 0.024 0.063 0.378 0.899 0.593 0.999 0.002
165-5 0.000 0.000 0.000 0.000 0.000 0.000 0.083 0.000
185-5 0.000 0.000 0.000 0.000 0.000 0.000 0.001 0.000 0.112
HNE-peanut
0.000 145-1 165-1 185-1 145-3 165-3 185-3 145-5 165-5
145-1 0.421
165-1 0.003 0.110
185-1 0.008 0.291 1.000
145-3 0.000 0.002 0.237 0.087
165-3 0.000 0.000 0.041 0.015 0.985
185-3 0.000 0.000 0.000 0.000 0.002 0.011
145-5 0.000 0.000 0.026 0.010 0.919 1.000 0.017
165-5 0.000 0.000 0.000 0.000 0.000 0.000 0.008 0.000
185-5 0.000 0.000 0.000 0.000 0.000 0.000 0.000 0.000 0.001
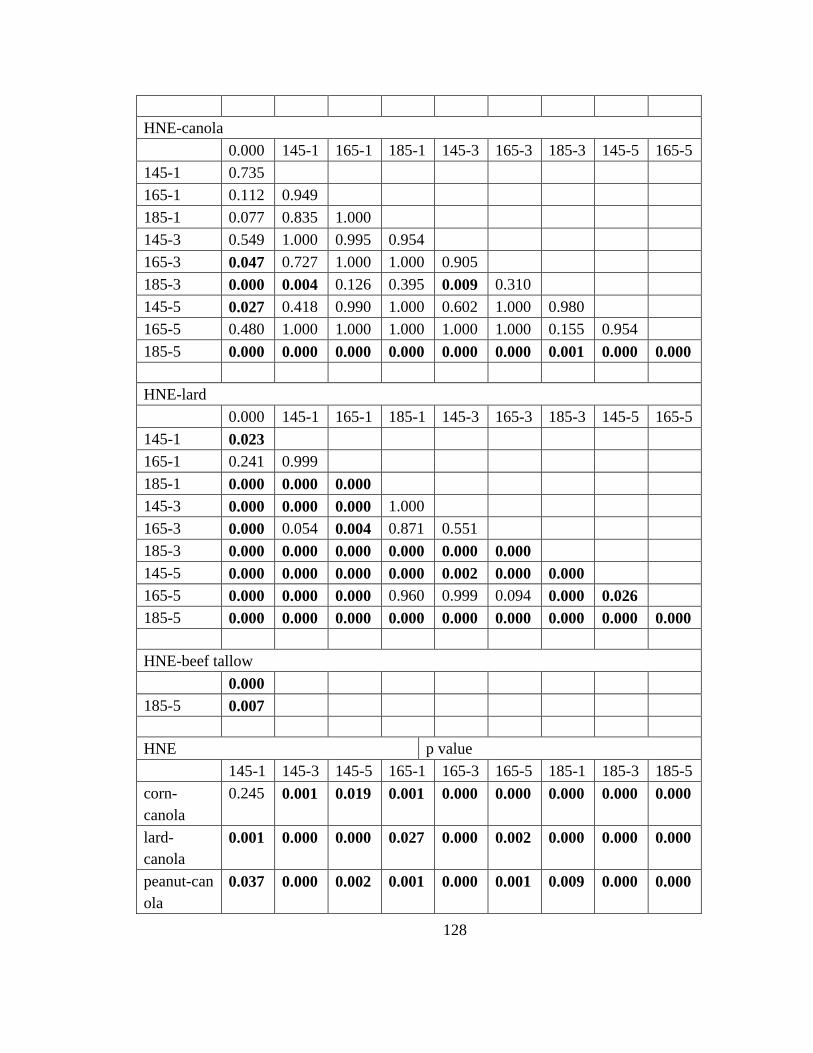
128
HNE-canola
0.000 145-1 165-1 185-1 145-3 165-3 185-3 145-5 165-5
145-1 0.735
165-1 0.112 0.949
185-1 0.077 0.835 1.000
145-3 0.549 1.000 0.995 0.954
165-3 0.047 0.727 1.000 1.000 0.905
185-3 0.000 0.004 0.126 0.395 0.009 0.310
145-5 0.027 0.418 0.990 1.000 0.602 1.000 0.980
165-5 0.480 1.000 1.000 1.000 1.000 1.000 0.155 0.954
185-5 0.000 0.000 0.000 0.000 0.000 0.000 0.001 0.000 0.000
HNE-lard
0.000 145-1 165-1 185-1 145-3 165-3 185-3 145-5 165-5
145-1 0.023
165-1 0.241 0.999
185-1 0.000 0.000 0.000
145-3 0.000 0.000 0.000 1.000
165-3 0.000 0.054 0.004 0.871 0.551
185-3 0.000 0.000 0.000 0.000 0.000 0.000
145-5 0.000 0.000 0.000 0.000 0.002 0.000 0.000
165-5 0.000 0.000 0.000 0.960 0.999 0.094 0.000 0.026
185-5 0.000 0.000 0.000 0.000 0.000 0.000 0.000 0.000 0.000
HNE-beef tallow
0.000
185-5 0.007
HNE p value
145-1 145-3 145-5 165-1 165-3 165-5 185-1 185-3 185-5
corn-
canola
0.245 0.001 0.019 0.001 0.000 0.000 0.000 0.000 0.000
lard-
canola
0.001 0.000 0.000 0.027 0.000 0.002 0.000 0.000 0.000
peanut-can
ola
0.037 0.000 0.002 0.001 0.000 0.001 0.009 0.000 0.000

129
soybean-c
anola
0.963 0.019 0.003 0.042 0.000 0.000 0.001 0.000 0.000
lard-corn 0.139 0.981 0.083 0.041 0.000 0.001 0.408 0.651 0.109
peanut-
corn
0.779 0.542 0.300 0.992 0.000 0.026 0.012 0.000 0.001
soybean-c
orn
0.648 0.390 0.461 0.134 0.000 0.981 0.126 0.003 0.501
peanut-lar
d
0.680 0.703 0.950 0.086 1.000 0.190 0.001 0.000 0.010
soybean-la
rd
0.014 0.130 0.780 0.994 0.041 0.001 0.006 0.006 0.935
soybean-p
eanut
0.165 0.043 0.994 0.244 0.081 0.014 0.462 0.003 0.008
canola-
beef
0.357
corn-beef 0.000
lard-beef 0.000
peanut-
beef
0.000
soybean-b
eef
0.000
HHE-corn
0.000 145-1 165-1 185-1 145-3 165-3 185-3 145-5 165-5
145-1 1.000
165-1 0.564 0.564
185-1 0.586 0.586 1.000
145-3 0.859 0.859 1.000 1.000
165-3 0.123 0.123 0.942 0.989 0.867
185-3 0.735 0.735 1.000 1.000 1.000 0.949
145-5 0.738 0.738 1.000 1.000 1.000 0.948 1.000
165-5 0.281 0.281 1.000 1.000 0.993 1.000 0.999 0.999
185-5 0.141 0.141 0.964 0.994 0.902 1.000 0.968 0.967 1.000
HHE-soybean
0.000 145-1 165-1 185-1 145-3 165-3 185-3 145-5 165-5
145-1 0.998

130
165-1 0.449 0.923
185-1 0.329 0.820 1.000
145-3 0.602 0.981 1.000 1.000
165-3 0.007 0.024 0.221 0.311 0.149
185-3 0.000 0.000 0.001 0.001 0.000 0.033
145-5 0.004 0.015 0.139 0.200 0.093 1.000 0.053
165-5 0.000 0.000 0.002 0.003 0.002 0.173 0.991 0.271
185-5 0.000 0.000 0.001 0.001 0.001 0.056 1.000 0.091 1.000
HHE-peanut
p
value
185-5 vs 0 0.683
HHE-canola
0.000 145-1 165-1 185-1 145-3 165-3 185-3 145-5 165-5
145-1 0.953
165-1 0.037 0.402
185-1 0.007 0.081 0.996
145-3 0.112 0.785 1.000 0.866
165-3 0.175 0.909 0.999 0.723 1.000
185-3 0.001 0.006 0.573 0.999 0.216 0.127
145-5 0.044 0.375 1.000 1.000 0.998 0.988 0.979
165-5 0.918 1.000 0.994 0.798 1.000 1.000 0.363 0.969
185-5 0.000 0.000 0.003 0.062 0.001 0.000 0.240 0.049 0.010
HHE
145-1 145-3 145-5 165-1 165-3 165-5 185-1 185-3 185-5
corn-
canola
0.109 0.099 0.026 0.398 0.933 0.016 0.117 0.001
soybean-c
anola
0.701 0.959 0.061 0.768 0.002 0.042 0.372 0.015 0.002
soybean-c
orn
0.214 0.012 0.087 0.002 0.025 0.068 0.004 0.000
soybean-p
eanut
0.000
peanut-can 0.000

131
ola
peanut-cor
n
0.755
HOE-corn
0.000 145-1 165-1 185-1 145-3 165-3 185-3 145-5 165-5
145-1 0.998
165-1 0.800 0.999
185-1 0.805 0.999 1.000
145-3 0.994 1.000 1.000 1.000
165-3 0.002 0.006 0.019 0.019 0.007
185-3 0.035 0.142 0.447 0.443 0.173 0.562
145-5 0.656 0.991 1.000 1.000 0.997 0.028 0.592
165-5 0.002 0.006 0.021 0.021 0.007 1.000 0.598 0.031
185-5 0.003 0.012 0.040 0.040 0.014 1.000 0.843 0.060 1.000
HOE-soybean
0.000 145-1 165-1 185-1 145-3 165-3 185-3 145-5 165-5
145-1 1.000
165-1 0.986 0.999
185-1 0.806 0.936 1.000
145-3 0.958 0.995 1.000 1.000
165-3 0.061 0.100 0.328 0.646 0.416
185-3 0.003 0.005 0.017 0.041 0.022 0.657
145-5 0.377 0.549 0.951 1.000 0.983 0.973 0.131
165-5 0.000 0.000 0.000 0.001 0.000 0.012 0.243 0.002
185-5 0.005 0.007 0.024 0.059 0.031 0.791 1.000 0.187 0.173
HOE-peanut
185-5 vs 0 0.333
HOE-canola
0.000 145-1 165-1 185-1 145-3 165-3 185-3 145-5 165-5
145-1 1.000
165-1 0.573 0.937
185-1 0.020 0.066 0.351
145-3 0.998 1.000 1.000 0.449

132
165-3 0.288 0.694 1.000 0.655 0.998
185-3 0.007 0.030 0.183 1.000 0.382 0.472
145-5 0.044 0.138 0.623 1.000 0.650 0.899 1.000
165-5 0.301 0.652 0.999 0.949 0.988 1.000 0.926 0.996
185-5 0.000 0.000 0.000 0.146 0.003 0.000 0.033 0.065 0.006
HOE
145-1 145-3 145-5 165-1 165-3 165-5 185-1 185-3 185-5
corn-
canola
0.270 0.939 1.000 0.007 0.000 0.181 0.770 0.165 0.061
soybean-c
anola
0.882 0.608 0.418 0.013 0.001 0.023 0.852 0.002 0.003
soybean-c
orn
0.420 0.689 0.428 0.853 0.326 0.102 0.496 0.023 0.068
soybean-p
eanut
0.000
peanut-
canola
0.023
peanut-
corn
0.003
HDE-corn
0.000 145-1 165-1 185-1 145-3 165-3 185-3 145-5 165-5
145-1 1.000
165-1 0.997 1.000
185-1 0.886 0.997 1.000
145-3 0.992 1.000 1.000 1.000
165-3 0.094 0.226 0.378 0.708 0.424
185-3 0.028 0.070 0.126 0.294 0.144 1.000
145-5 0.949 1.000 1.000 1.000 1.000 0.592 0.224
165-5 0.001 0.003 0.004 0.010 0.005 0.174 0.491 0.007
185-5 0.001 0.002 0.004 0.008 0.004 0.143 0.420 0.006 1.000
HDE-soybean
0.000 145-1 165-1 185-1 145-3 165-3 185-3 145-5 165-5
145-1 1.000
165-1 1.000 1.000

133
185-1 0.994 1.000 1.000
145-3 0.999 1.000 1.000 1.000
165-3 0.830 0.982 0.993 1.000 0.999
185-3 0.106 0.331 0.256 0.418 0.332 0.780
145-5 0.971 0.999 1.000 1.000 1.000 1.000 0.537
165-5 0.007 0.033 0.015 0.026 0.020 0.066 0.647 0.036
185-5 0.121 0.363 0.288 0.464 0.372 0.826 1.000 0.588 0.595
HDE-peanut
0.000 145-1 165-1 185-1 145-3 165-3 185-3 145-5 165-5
145-1 1.000
165-1 1.000 1.000
185-1 0.994 1.000 1.000
145-3 0.999 1.000 1.000 1.000
165-3 0.830 0.982 0.993 1.000 0.999
185-3 0.106 0.331 0.256 0.418 0.332 0.780
145-5 0.971 0.999 1.000 1.000 1.000 1.000 0.537
165-5 0.007 0.033 0.015 0.026 0.020 0.066 0.647 0.036
185-5 0.121 0.363 0.288 0.464 0.372 0.826 1.000 0.588 0.595
HDE-canola
0.000 145-1 165-1 185-1 145-3 165-3 185-3 145-5 165-5
145-1 1.000
165-1 0.100 0.365
185-1 0.342 0.769 1.000
145-3 0.999 1.000 0.346 0.805
165-3 0.257 0.685 1.000 1.000 0.706
185-3 0.001 0.007 0.474 0.241 0.004 0.174
145-5 0.249 0.607 1.000 1.000 0.641 1.000 0.718
165-5 0.023 0.087 0.980 0.844 0.077 0.813 1.000 0.992
185-5 0.000 0.000 0.003 0.002 0.000 0.001 0.278 0.015 0.219
HDE
145-1 145-3 145-5 165-1 165-3 165-5 185-1 185-3 185-5
corn-
canola
0.113 0.148 0.083 0.213 0.000 0.097 0.042 0.000 0.016
soybean-c 0.791 0.303 0.136 0.998 0.003 0.166 0.321 0.000 0.388

134
anola
soybean-c
orn
0.240 0.812 0.801 0.307 0.001 0.792 0.293 0.180 0.113
soybean-p
eanut
0.991 0.293 0.180
peanut-
canola
0.616 0.001 0.024
peanut-
corn
0.324 0.025 0.971
HHE, HNE, HOD and HDE in corn
corn soybe
an
peanu
t
canol
a
HHE-HD
E
0.199 0.884 0.014 0.038
HNE-HD
E
0.000 0.000 0.000 0.000
HOE-HD
E
0.840 0.748 0.017 0.086
HNE-HH
E
0.000 0.000 0.000 0.001
HOE-HH
E
0.439 0.998 0.994 0.933
HOE-HN
E
0.000 0.000 0.000 0.000
185-5
HHE HOE HNE HDE
corn-
canola
0.001 0.234 0.000 0.007
peanut-
canola
0.000 0.108 0.000 0.012
soybean-c
anola
0.002 0.028 0.000 0.185
peanut-
corn
0.751 0.015 0.002 0.965
soybean-c 0.000 0.541 0.240 0.070

135
orn
soybean-p
eanut
0.000 0.003 0.008 0.129
Total polar-corn
0.000 145-1 165-1 185-1 145-3 165-3 185-3 145-5 165-5
145-1 0.372
165-1 0.031 0.836
185-1 0.011 0.426 1.000
145-3 0.035 0.870 1.000 1.000
165-3 0.000 0.001 0.005 0.016 0.005
185-3 0.000 0.000 0.001 0.002 0.001 0.910
145-5 0.004 0.155 0.921 1.000 0.894 0.048 0.005
165-5 0.000 0.000 0.000 0.000 0.000 0.113 0.743 0.000
185-5 0.000 0.000 0.000 0.000 0.000 0.006 0.054 0.000 0.667
Total polar-soybean
0.000 145-1 165-1 185-1 145-3 165-3 185-3 145-5 165-5
145-1 1.000
165-1 0.415 0.838
185-1 0.144 0.410 1.000
145-3 0.264 0.647 1.000 1.000
165-3 0.002 0.005 0.060 0.191 0.102
185-3 0.000 0.000 0.000 0.001 0.000 0.053
145-5 0.003 0.008 0.098 0.299 0.164 1.000 0.033
165-5 0.000 0.000 0.000 0.000 0.000 0.001 0.110 0.000
185-5 0.000 0.000 0.000 0.000 0.000 0.001 0.328 0.001 1.000
Total polar-peanut
0.000 145-1 165-1 185-1 145-3 165-3 185-3 145-5 165-5
145-1 0.007
165-1 0.000 0.104
185-1 0.000 0.237 1.000
145-3 0.000 0.000 0.001 0.001
165-3 0.000 0.000 0.008 0.012 0.910
185-3 0.000 0.000 0.000 0.000 1.000 0.650
145-5 0.000 0.000 0.000 0.000 0.754 0.096 0.848
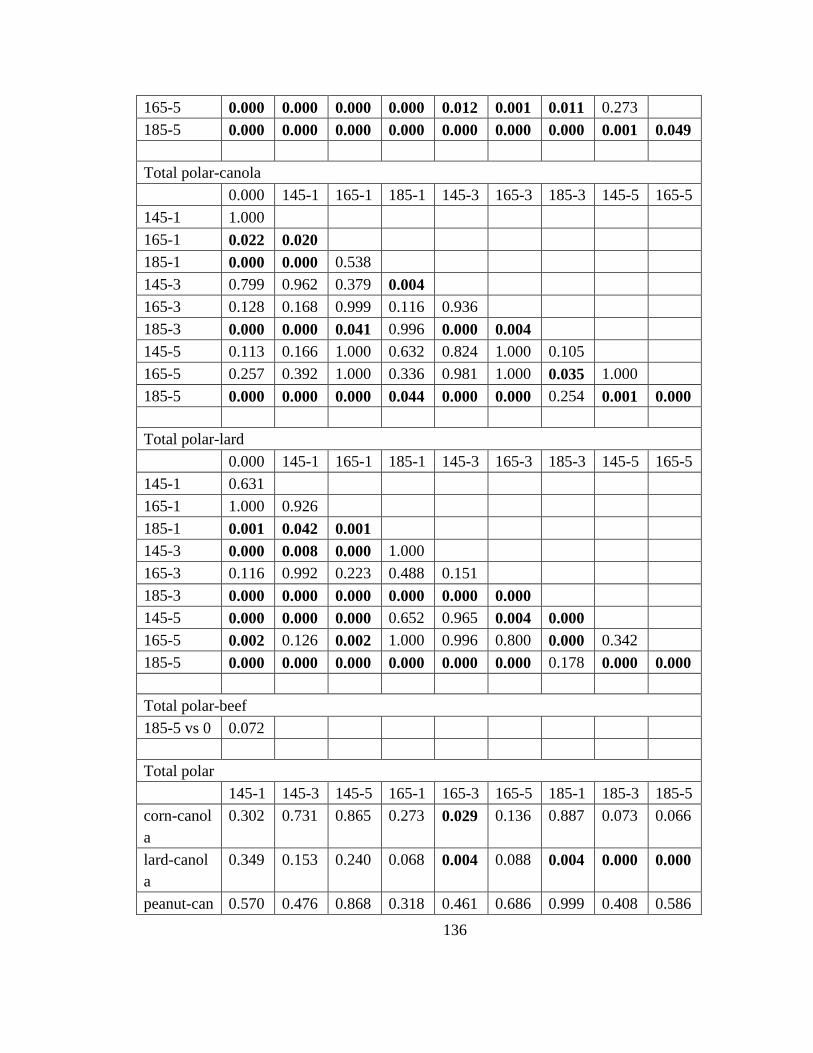
136
165-5 0.000 0.000 0.000 0.000 0.012 0.001 0.011 0.273
185-5 0.000 0.000 0.000 0.000 0.000 0.000 0.000 0.001 0.049
Total polar-canola
0.000 145-1 165-1 185-1 145-3 165-3 185-3 145-5 165-5
145-1 1.000
165-1 0.022 0.020
185-1 0.000 0.000 0.538
145-3 0.799 0.962 0.379 0.004
165-3 0.128 0.168 0.999 0.116 0.936
185-3 0.000 0.000 0.041 0.996 0.000 0.004
145-5 0.113 0.166 1.000 0.632 0.824 1.000 0.105
165-5 0.257 0.392 1.000 0.336 0.981 1.000 0.035 1.000
185-5 0.000 0.000 0.000 0.044 0.000 0.000 0.254 0.001 0.000
Total polar-lard
0.000 145-1 165-1 185-1 145-3 165-3 185-3 145-5 165-5
145-1 0.631
165-1 1.000 0.926
185-1 0.001 0.042 0.001
145-3 0.000 0.008 0.000 1.000
165-3 0.116 0.992 0.223 0.488 0.151
185-3 0.000 0.000 0.000 0.000 0.000 0.000
145-5 0.000 0.000 0.000 0.652 0.965 0.004 0.000
165-5 0.002 0.126 0.002 1.000 0.996 0.800 0.000 0.342
185-5 0.000 0.000 0.000 0.000 0.000 0.000 0.178 0.000 0.000
Total polar-beef
185-5 vs 0 0.072
Total polar
145-1 145-3 145-5 165-1 165-3 165-5 185-1 185-3 185-5
corn-canol
a
0.302 0.731 0.865 0.273 0.029 0.136 0.887 0.073 0.066
lard-canol
a
0.349 0.153 0.240 0.068 0.004 0.088 0.004 0.000 0.000
peanut-can 0.570 0.476 0.868 0.318 0.461 0.686 0.999 0.408 0.586

137
ola
soybean-c
anola
0.622 0.323 0.308 0.150 0.045 0.039 0.909 0.024 0.021
lard-corn 0.989 0.858 0.514 0.936 0.949 1.000 0.016 0.001 0.004
peanut-cor
n
0.984 0.992 1.000 1.000 0.418 0.447 0.764 0.636 0.594
soybean-c
orn
0.923 0.974 0.650 0.993 0.960 0.828 1.000 0.998 0.998
peanut-lar
d
1.000 0.987 0.509 0.898 0.112 0.293 0.003 0.000 0.000
soybean-la
rd
0.991 0.993 0.999 0.997 0.534 0.785 0.006 0.001 0.003
soybean-p
eanut
0.999 1.000 0.644 0.983 0.680 0.103 0.783 0.367 0.308
canola-bee
f
0.996
corn-beef 0.020
lard-beef 0.000
peanut-bee
f
0.283
soybean-b
eef
0.005
NP
corn soybe
an
peanu
t
canol
a
lard beef
145-0 0.000 0.757 0.180 0.040 0.001
165-0 0.000 0.031 0.031 0.250 0.000
185-0 0.000 0.350 0.193 0.356 0.000 0.000
165-145 0.010 0.163 0.725 0.687 0.001
185-145 0.972 0.879 1.000 0.539 0.000
185-165 0.020 0.457 0.700 0.994 0.444
NP
145-1 145-3 145-5 165-1 165-3 165-5 185-1 185-3 185-5
corn-canol
a
0.985 0.149 0.469 0.042 0.399 0.000 0.833 0.004 0.017

138
lard-canol
a
0.000 0.417 0.068 0.000 0.449 0.000 0.000 0.004 0.000
peanut-can
ola
0.151 0.504 0.818 0.616 0.587 0.016 0.057 0.012 0.156
soybean-c
anola
1.000 0.008 0.998 0.036 0.216 0.003 0.014 0.574 0.465
lard-corn 0.000 0.005 0.003 0.000 0.021 0.000 0.001 0.000 0.000
peanut-cor
n
0.262 0.911 0.970 0.448 0.997 0.111 0.008 0.971 0.854
soybean-c
orn
0.993 0.519 0.315 0.000 0.992 0.443 0.002 0.067 0.446
peanut-lar
d
0.000 0.027 0.009 0.000 0.040 0.000 0.000 0.000 0.000
soybean-la
rd
0.000 0.000 0.118 0.127 0.009 0.000 0.000 0.000 0.000
soybean-p
eanut
0.135 0.156 0.650 0.002 0.937 0.893 0.943 0.194 0.976
canola-bee
f
0.000
corn-beef 0.000
lard-beef 0.350
peanut-bee
f
0.000
soybean-b
eef
0.000
Total 4-hydro corn
0.000 145-1 165-1 185-1 145-3 165-3 185-3 145-5 165-5
145-1 0.999
165-1 0.483 0.926
185-1 0.179 0.541 1.000
145-3 0.410 0.875 1.000 1.000
165-3 0.001 0.002 0.017 0.052 0.021
185-3 0.000 0.000 0.000 0.000 0.000 0.037
145-5 0.220 0.627 1.000 1.000 1.000 0.041 0.000
165-5 0.000 0.000 0.000 0.000 0.000 0.045 1.000 0.000
185-5 0.000 0.000 0.000 0.000 0.000 0.000 0.116 0.000 0.096
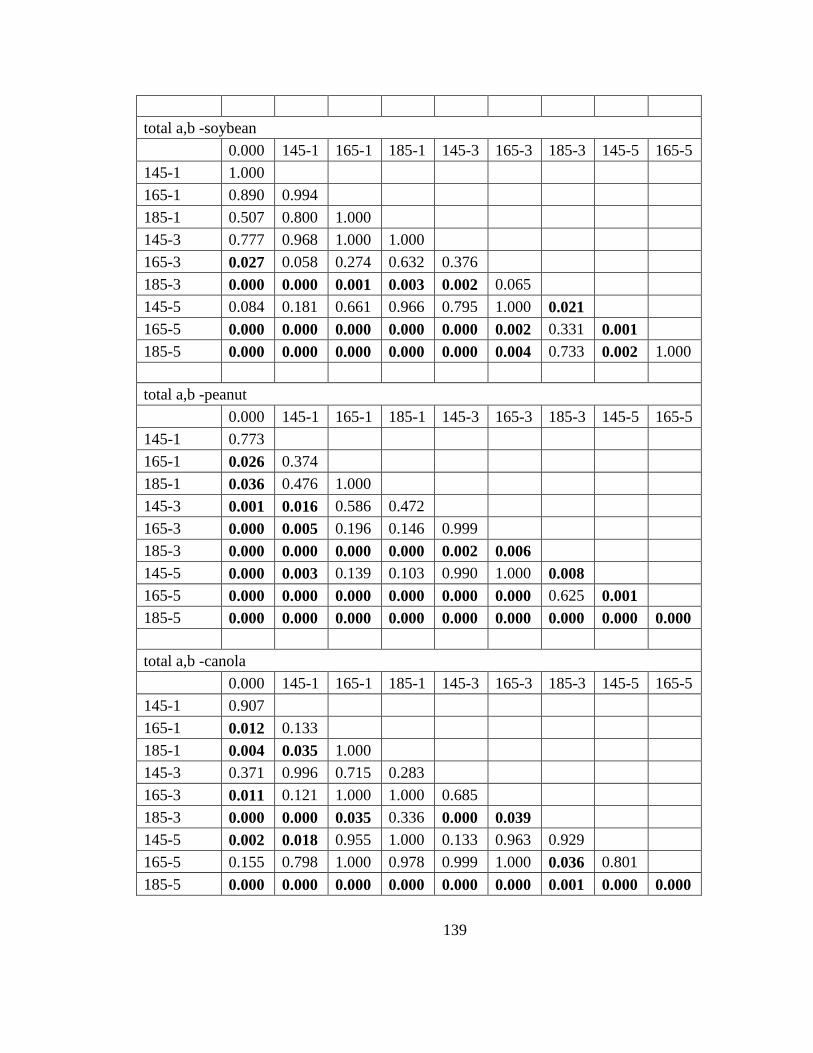
139
total a,b -soybean
0.000 145-1 165-1 185-1 145-3 165-3 185-3 145-5 165-5
145-1 1.000
165-1 0.890 0.994
185-1 0.507 0.800 1.000
145-3 0.777 0.968 1.000 1.000
165-3 0.027 0.058 0.274 0.632 0.376
185-3 0.000 0.000 0.001 0.003 0.002 0.065
145-5 0.084 0.181 0.661 0.966 0.795 1.000 0.021
165-5 0.000 0.000 0.000 0.000 0.000 0.002 0.331 0.001
185-5 0.000 0.000 0.000 0.000 0.000 0.004 0.733 0.002 1.000
total a,b -peanut
0.000 145-1 165-1 185-1 145-3 165-3 185-3 145-5 165-5
145-1 0.773
165-1 0.026 0.374
185-1 0.036 0.476 1.000
145-3 0.001 0.016 0.586 0.472
165-3 0.000 0.005 0.196 0.146 0.999
185-3 0.000 0.000 0.000 0.000 0.002 0.006
145-5 0.000 0.003 0.139 0.103 0.990 1.000 0.008
165-5 0.000 0.000 0.000 0.000 0.000 0.000 0.625 0.001
185-5 0.000 0.000 0.000 0.000 0.000 0.000 0.000 0.000 0.000
total a,b -canola
0.000 145-1 165-1 185-1 145-3 165-3 185-3 145-5 165-5
145-1 0.907
165-1 0.012 0.133
185-1 0.004 0.035 1.000
145-3 0.371 0.996 0.715 0.283
165-3 0.011 0.121 1.000 1.000 0.685
185-3 0.000 0.000 0.035 0.336 0.000 0.039
145-5 0.002 0.018 0.955 1.000 0.133 0.963 0.929
165-5 0.155 0.798 1.000 0.978 0.999 1.000 0.036 0.801
185-5 0.000 0.000 0.000 0.000 0.000 0.000 0.001 0.000 0.000

140

141
Appendix B: Figures
Heating Time (h)
0 1 2 3 4 5 6
g h
exa
na
l eq
uiv
ale
nt/g
oil
0.0
5.0
10.0
15.0
20.0
185C total polar
165C total polar
145C total polar
185C HNE
165C HNE
145C HNE
Figure 60. Comparison of the sum total of polar aldehydes and HNE formation in
commercial corn oil heated for 1, 3 and 5 hours at 145, 165 and 185°C
Heating Time (h)
0 1 2 3 4 5 6
g h
exa
na
l eq
uiv
ale
nt/g
oil
0.0
5.0
10.0
15.0
20.0
185C total polar
165C total polar
145C total polar
185C HNE
165C HNE
145C HNE
Figure 61. Comparison of the sum total of polar aldehydes and HNE formation in
commercial soybean oil heated for 1, 3 and 5 hours at 145, 165 and 185°C

142
Heating Time (h)
0 1 2 3 4 5 6
g h
exa
na
l eq
uiv
ale
nt/g
oil
0.0
5.0
10.0
15.0
20.0
185C total polar
165C total polar
145C total polar
185C HNE
165C HNE
145C HNE
Figure 62. Comparison of the sum total of polar aldehydes and HNE formation in
commercial peanut oil heated for 1, 3 and 5 hours at 145, 165 and 185°C
Heating Time (h)
0 1 2 3 4 5 6
g h
exa
na
l eq
uiv
ale
nt/g
oil
0.0
2.0
4.0
6.0
8.0
10.0
185C total polar
165C total polar
145C total polar
185C HNE
165C HNE
145C HNE
Figure 63. Comparison of the sum total of polar aldehydes and HNE formation in
commercial canola oil heated for 1, 3 and 5 hours at 145, 165 and 185°C

143
Heating Time (h)
0 1 2 3 4 5 6
g h
exa
na
l eq
uiv
ale
nt/g
oil
0.0
5.0
10.0
15.0
20.0
25.0
30.0
185C total polar
165C total polar
145C total polar
185C HNE
165C HNE
145C HNE
Figure 64. Comparison of the sum total of polar aldehydes and HNE formation in
lard heated for 1, 3 and 5 hours at 145, 165 and 185°C
Heating Time (h)
0 1 2 3 4 5 6
g h
exa
na
l eq
uiv
ale
nt/g
oil
0.0
5.0
10.0
15.0
20.0
185C taotal polar
185C HNE
Figure 65. Comparison of the sum total of polar aldehydes and HNE formation in
beef heated for 5 hours at 185°C