the economic contribution of qantas group to australia · the economic contribution of qantas group...
TRANSCRIPT

The Economic Contribution of Qantas Group to Australia
The Qantas Group
November 2016

Key points The economic contribution of Qantas Group (which includes Qantas1, Jetstar and Qantas Freight) is
estimated using an input-output model of the Australian and state economies, based on financial and input data provided by the Qantas Group.
The Qantas Group’s higher profits over the financial year 2016 (FY16) are also reflected in a higher direct contribution to the Australian economy relative to 2015. Based on the modelling, the estimated total economic contribution of the Qantas Group to Australia in FY 2016 is $11.5 billion ($6.8 billion direct and $4.7 billion indirect) while facilitating an additional $10.4b in value added through increased tourism expenditure by those flying on Qantas or Jetstar.
The Qantas Group is also a significant employer. Its total direct employment is 29,266 full time equivalent (FTE) workers with 26,097 based in Australia. A further 29,535 FTEs are employed indirectly as a result of its operations.
Table i: Economic contribution of the Qantas Group, FY 2016
Metric Direct Indirect Total
Value add ($m)
Qantas 5,216 3,452 8,668
Jetstar 1,348 942 2,290
Qantas Freight 237 298 534
Qantas Group 6,801 4,692 11,493
Employment (FTEs)
Qantas 20,467 22,729 43,196
Jetstar 4,439 5,074 9,513
Qantas Freight 1,190 1,732 2,922
Qantas Group 26,097 29,535 55,632
Source: Deloitte Access Economics Note: Value added associated with Qantas Loyalty has been split across Qantas, Jetstar and Qantas Freight.
Sum of ‘Direct’ and ‘Indirect’ may not add to ‘Total’ due to rounding
The economic contribution of the Qantas Group represents 0.7% of total Gross Domestic Product in Australia. This is a significant share of total economic activity for a single corporate group. Considering solely the direct contribution, the operations of the Qantas Group represented approximately 0.4% of GDP, a more significant contribution to Australian GDP than over half the industries categorised in the ABS IO tables and approximately one third of the direct economic contribution of coal mining.
In addition to the economic activity of the operations of the Qantas Group, it plays a vital role in the transport of tourists to and around Australia. Combining the contribution of both domestic and international tourism expenditure from tourists who travel on Qantas and Jetstar, the additional total value added to the Australian economy in FY 2016 is estimated to be $10.4 billion.
Comparing these results with the TRA ‘State Tourism Satellite Accounts’ for 2014-15 indicates that almost one in eight jobs supported by the tourism sector (either directly or indirectly) are attributable to expenditure by those travelling on the Qantas Group airlines.
The Qantas Group also plays an important role in marketing Australian tourism both internationally and domestically, particularly through its contribution to state and territory tourism organisations.
1 Qantas includes Qantas Domestic, Qantas International and QantasLink

The economic contribution of the Qantas Group
2
1 Background and approach Deloitte Access Economics was commissioned by the Qantas Group to undertake an economic study of the Qantas Group’s contribution to the Australian economy for the financial year (FY) 2016. This contribution analysis is an update of a study completed for FY 2015. This contribution is modelled at the national level and reported in terms of value-add and employment (FTEs). Similar to the previous report, values have been disaggregated across Qantas Group’s business units of Qantas, Jetstar and Qantas Freight.
Economic contribution studies provide a snapshot of the contribution of a firm or industry at a particular point in time. The analysis uses common financial measures such as, revenue and cost of goods sold, to estimate a firm’s direct value-add to the Australian economy. This direct impact is calculated using the income approach to Gross Domestic Product (GDP), which builds up the value of a firm or sector’s output by adding the returns to capital (measured in terms of gross operating surplus), and the returns to labour (measured as wages paid). That is, it estimates the total income generated, net of costs, through the activities of the entity being modelled.
This approach is consistent with the framework used by the Australian Bureau of Statistics in compiling the Australian National Accounts. In addition to this direct component, economic contribution studies considers the interlinkages with other sectors of the economy through expenditure on intermediate inputs. This expenditure drives the indirect contribution to value-add and is determined through Deloitte Access Economics’ Regional Input-Output Model (DAE-RIO-M).
Noting the vital role Qantas Group plays in facilitating Australia’s tourism industry, this analysis has also evaluated the economic contribution made through the airline’s support of both domestic and international tourism.
Data provided by Qantas Group
Qantas has provided Deloitte Access Economics with detailed profit and loss data from the financial year 2016. This data was disaggregated by the following business units:
Qantas (incorporating domestic and international operations);
Jetstar;
Qantas Loyalty;
Freight;
Corporate; and
Unallocated/eliminated
The revenue and expenditure numbers for Qantas Loyalty were aggregated with values from Qantas and are not analysed separately. While Qantas Loyalty generates substantial revenue through its own operations, the profitability of this business unit is determined primarily by demand for Qantas Points. This demand is closely tied to the overall performance of Qantas and it is therefore appropriate to aggregate these two business units.

The economic contribution of the Qantas Group
3
The Corporate division’s revenue and expenditure has been distributed across Qantas, Jetstar and Qantas Freight. The Corporate division contributes to the organisation by providing strategic advice, managing finances and providing human resourcing support. While these functions are integral to any firm, the benefits and revenue associated with such services are accrued through other business units. As the revenue is accrued by these business units, the costs should also be distributed so as to accurately reflect the intermediate inputs required to generate revenue. As such, the costs of the Corporate business unit have been distributed as per advice from Qantas, with 71% of costs being allocated to Qantas, Jetstar being allocated 22% and Freight 7%.
In determining Qantas Group’s indirect contribution the Australian economy, expenditure on intermediate inputs has been allocated between expenditure occurring within Australia and that occurring internationally. The majority of Qantas Groups’ expenditure on intermediate expenditure occurs in Australia, with over half of its intermediate inputs sourced locally. The majority of the expenditure on inputs from outside Australia is attributable to jet fuel, commissions and selling costs and aircraft operating lease rentals. These inputs are usually unable to be sourced locally.
Changes from FY 2015
Qantas Group’s operating revenue has improved 2% from FY 2015, increasing from $15.8 billion to $16.2 billion. This increase in revenue was primarily underpinned by improvements in operating revenue for Jetstar and Qantas Freight.
Total operating expenditure declined by 2%, falling from $13.5 billion in FY 2015 to $13.2 billion in FY 2016. Reductions were driven wholly by reductions in operating expenditure for the Qantas business unit, with operating costs falling by 7% over the previous year. Operating costs for both Jetstar and Qantas Freight increased, although this total increase in costs was still less than the reduction in expenditure from Qantas.

The economic contribution of the Qantas Group
4
2 Economic contribution of Qantas Group
Qantas Group’s contribution for FY 2016 is split into direct and indirect components. The first estimates the value added that Qantas Group contributes to the Australian economy directly through its operations. Its indirect contribution represents the economic contribution Qantas Group makes to the Australian economy through its expenditure on intermediate inputs.
Direct contribution
While revenue is more commonly reported in financial accounts, value added provides a more accurate assessment of a firm’s contribution to the overall economy because it nets out the value that is created by upstream industries. The direct contribution therefore isolates the value created by Qantas Group.
The returns to capital, also referred to as the gross operating surplus (GOS), is determined by calculating the ongoing operational profit and operational costs, prior to the impacts of interest, tax, depreciation and amortisation. The returns to labour are calculated by aggregating compensation provided to employees either through wages or other employment benefits.
Indirect contribution
Measuring the indirect contribution involves measuring the indirect or flow-on contribution of Qantas Group’s activities. This is the value added generated in upstream sectors of the economy that produce inputs to the airline’s operation. The flow-on contribution is based on Qantas Group’s expenditure in these industries and the profit and wages that are generated as a result. 2
Qantas Group’s contribution
The direct economic contribution for Qantas Group in FY 2016 was $6.8 billion (Table 2.1). Similar to the contribution for FY 2015, the majority of this economic value-add was a result of the Qantas business unit, making up 77% of the total direct contribution. Jetstar accounted for 20% of direct value added, while Qantas Freight’s share of direct contribution was 3%. The direct economic contribution of the Qantas Group increased by $882 million or just under 15% from FY 2015, reflecting improved profitability for the Qantas Group.
Approximately 57% of Qantas Groups’ direct value-add is attributable to labour income. While the airline industry may appear capital intensive, this split of value-add indicates a large share of the income generated by the airline’s activities flows to employees.
2 There has been a revised treatment of some expenditure items relating to transfers between business units used in this report, relative to the 2015 report. As a result, the indirect contribution results provided here are not directly comparable to those provided in the 2015 report. A discussion of these changes, and a like-for-like comparison with the 2015 report using the previous classification of these items, is provided in the Appendix.

The economic contribution of the Qantas Group
5
As with the direct contribution, Qantas made up the largest share of the indirect contribution (74%) with Jetstar and Freight making up 20% and 6% respectively. The largest share of indirect contribution occurs as a result of expenditure in the transport support services industry and aircraft repair and manufacturing.
Combining the direct and indirect measures, the total economic contribution of Qantas Group to the Australian economy for FY 2016 was $11.5 billion. As a share of Australian GDP, this represents 0.7% of total economic activity in Australia. This is a significant share for a single firm, with the direct economic contribution of the Qantas Group being similar to the direct value added by industries such as broadcasting and rail transport.
In terms of employment, Qantas Group’s direct employment for the FY 2016 was 26,097, while indirect employment was 29,353. Qantas contributed the most significant share (78%), Jetstar making up 17% and Qantas Freight 5%. The indirect component of employment surpassed the direct, reflecting the labour intensive nature of the industries that support Qantas’ operations. As with total economic contribution, the total contribution of the Qantas Group makes up almost 0.6% of total employment in Australia, a significant contribution for a single firm and more than half that of whole industries such as coal mining.
Table 2.1 Economic contribution of Qantas, FY 2016
Metric Direct Indirect Total
GOS ($m)
Qantas 2,277 1,392 3,669
Jetstar 618 443 1,062
Freight 79 140 219
Qantas Group 2,974 1,975 4,949
Labour income ($m)
Qantas 2,939 2,061 4,999
Jetstar 730 499 1,229
Freight 158 157 315
Qantas Group 3,827 2,717 6,543
Value added ($m)
Qantas 5,216 3,452 8,668
Jetstar 1,348 942 2,290
Freight 237 298 534
Qantas Group 6,801 4,692 11,493
Employment (FTEs)
Qantas 20,467 22,729 43,196
Jetstar 4,439 5,074 9,513
Freight 1,190 1,732 2,922
Qantas Group 26,097 29,535 55,632
Source: Deloitte Access Economics Note: All figures have been rounded to the nearest unit so totals may be subject to rounding errors.

The economic contribution of the Qantas Group
6
Qantas Group’s contribution by state
The economic contribution of the Qantas Group by state has been determined by distributing the gross operating surplus generated by the company in Australia by passenger departure data. This departure data was disaggregated by Qantas and Jetstar and a weighted average of the two was used to distribute value-add for Qantas Freight. This distribution of passenger departures at the State and Territory level is presented in Table 2.2 (which excludes freight activity). The direct labour income was allocated to states based on their respective share of employment by business unit. Since direct value added includes both labour income and gross operating surplus, the relative share of States in direct value added will reflect a combination of their employment share and passenger share.
Similarly, the Qantas Group’s expenditure on intermediate inputs is distributed by each State’s relevant industry share. For example, as NSW accounts for 32% of total activity in the transport and support services industry in Australia, this same share of the Qantas Group’s expenditure on transport and support services is distributed to NSW. While this does not directly capture the geographical dispersion of the Qantas Group’s activities (which would require more detailed purchase data) it is a relatively accurate approximation of this dispersion in lieu of this data.
The expenditure on intermediate inputs drives the indirect contribution for each state. In determining the contribution to value-added and employment driven by the company’s expenditure on intermediate inputs, Deloitte Access Economics has disaggregated the national IO table for each individual state. This ensures that industry structure of each state is accurately described and the relevant economic activity is captured.
Table 2.2: Distribution of passenger departures at State and Territory level
State Qantas Jetstar Total
NSW/ACT 29% 28% 29%
VIC 20% 25% 22%
QLD 25% 31% 28%
SA 6% 5% 6%
WA 14% 2% 10%
TAS 1% 7% 4%
NT 3% 2% 3% Source: Qantas Group
As shown in Table 2.3, the Qantas Group’s largest economic contribution is in NSW/ACT, where total activity contributes $4.2 billion to the NSW and ACT economy. This is due to Sydney being home to Qantas’ headquarters and the Qantas Group’s largest global hub. In NSW, a higher proportion of the value add is generated directly (rather than indirectly) as NSW accounts for a relatively high proportion of total employment by the Qantas Group and thus a large proportion of direct labour income is estimated to accrue to NSW.

The economic contribution of the Qantas Group
7
Table 2.3 Economic contribution of Qantas Group by state, FY 2016
Metric Direct Indirect Total
Value added ($m)
NSW/ACT 2,641 1,585 4,226
VIC 1,541 1,241 2,782
QLD 1,484 1,063 2,547
SA 295 243 538
WA 612 447 1,059
TAS 124 60 185
NT 104 52 156
Australia 6,801 4,692 11,493
Employment (FTEs)
NSW/ACT 12,271 10,114 22,384
VIC 6,107 8,033 14,139
QLD 4,689 6,502 11,191
SA 756 1,739 2,495
WA 1,836 2,396 4,232
TAS 303 475 778
NT 135 277 412
Australia 26,097 29,535 55,632 Source: Deloitte Access Economics and the Qantas Group Note: All figures have been rounded to the nearest unit so totals may be subject to rounding errors.
The Qantas Group’s total economic contribution to Victoria is $2.7 billion and this is weighted more heavily than NSW to the indirect component that makes up 44% of the total contribution. While the State makes up 23% of the airline’s direct economic activity, it attracts a larger share of the company’s intermediate expenditure as a result of Victoria’s sizeable transport services industry with Jetstar being based in Melbourne resulting in demand for a range of third party service providers.
In Queensland, the total economic contribution of the Qantas Group was $2.5 billion. This was split relatively evenly between direct and indirect value added. Queensland’s diverse offering of natural assets, such as the Great Barrier Reef and man-made attractions such as its theme parks and casinos make it a popular tourist destination. Qantas also has an extensive network in regional Queensland. These factors are reflected in the large share of departures occurring from the State.
As with Queensland, the largest share of the Qantas Group’s economic contribution in Tasmania, Western Australia and Northern Territory is driven by direct activity whereas the share of indirect activity is larger in South Australia (47%), reflecting the State’s industrial profile and share of total flights.
Table 2.4 further disaggregates the total state economic contribution results by business unit. Qantas’ largest contribution is to NSW, reflecting the high amount of passenger traffic

The economic contribution of the Qantas Group
8
through the state, with NSW accounting for almost one-third of all Qantas passengers nation-wide. Queensland is the state with Qantas’ largest contribution, again with high passenger traffic reflecting the overall level of economic activity. Victoria closely follows behind Queensland, with the total economic contribution of $1.84 billion. While Victoria has less passenger activity than Queensland (20% of total passengers), the state’s industry structure means that it accounts for a much larger share of the total indirect contribution.
Jetstar’s largest contribution is in Victoria, with the business unit contributing $818 million in value add for the FY 2016. The business unit’s second largest contribution is in NSW, with a total value of $619 million, followed by Queensland with a total value add of $565 million. Similar to Qantas, Qantas Freight’s largest contribution is in NSW, where the business unit contributes $206 million of value add. Qantas Freight’s second largest contribution is in Victoria ($124 million) followed by Queensland ($115 million).
Table 2.4 Economic contribution by business unit and by state, FY 2016
Metric Qantas Jetstar Qantas Freight
Value added ($m)
NSW/ACT 3,401 619 206
VIC 1,840 818 124
QLD 1,869 565 115
SA 407 107 24
WA 908 102 48
TAS 121 54 9
NT 123 24 9
Australia 8,668 2,290 534
Employment (FTEs)
NSW/ACT 18,616 2,574 1,195
VIC 9,533 3,912 695
QLD 8,561 2,049 581
SA 1,916 454 125
WA 3,589 413 230
TAS 668 64 46
NT 314 47 51
Australia 43,196 9,513 2,922 Source: Deloitte Access Economics and the Qantas Group Note: All figures have been rounded to the nearest unit so totals may be subject to rounding errors.

The economic contribution of the Qantas Group
9
3 Contribution to domestic and international tourism
In addition to the contribution, generated by its operations, the Qantas Group plays an instrumental role in supporting tourism in Australia, both through facilitating air travel by domestic and international passengers and through marketing Australian tourism destinations to domestic and international consumers. In particular, the extensive network operated by the Qantas Group plays a pivotal role in allowing tourists to access many regional destinations throughout Australia.
The estimated contribution of the Qantas Group in facilitating domestic and international tourism expenditure is based on the estimated spending that occurs by travellers at the destination, and does not include expenditure on airfares which is captured as part of the direct economic contribution. The methodology for measuring the economic contribution of the Qantas Group to tourism in Australia is discussed in more detail below.
Methodology
Domestic tourism
Figure 3.1 provides an overview of the process used to estimate the economic contribution of domestic tourism expenditure facilitated by the Qantas Group. In the first stage, market share information by route provided by the Qantas Group was matched to data on passenger numbers on each route from the Bureau of Infrastructure, Transport and Regional Economics (BITRE). This was used to calculate estimates of passenger numbers carried by Qantas and Jetstar on each route.
Routes were aggregated to a state level by attributing half the traffic on a route pair to each state. For example, 50% of traffic on the Sydney to Melbourne route was attributed to NSW and 50% to Victoria. Market shares by state were developed separately for interstate and intrastate travel.
In the second stage, these market shares were multiplied by estimates of regional expenditure by domestic overnight and domestic day visitors in each state. To calculate regional expenditure, information on average expenditure per night from the Tourism Research Australia (TRA) National Visitor Survey (2015a) was combined with other data from TRA on visitor numbers travelling interstate and intrastate by air.

The economic contribution of the Qantas Group
10
Figure 3.1: Overview of methodology for estimating the domestic tourism contribution
Source: Deloitte Access Economics
In the third stage, estimates of market shares by state are multiplied by total tourism expenditure for air travellers (calculated in the second stage) to develop estimates of total tourism expenditure attributable to Qantas and Jetstar for both interstate and intrastate travel.
This data is then subject to some further adjustments in the fourth stage to ensure it is consistent with the expenditure profile of airline travellers noting that expenditure estimates are based on all domestic tourists not just airline travellers.
First, all expenditure on domestic airfares is excluded to avoid double-counting expenditure already included in the economic contribution of the Qantas Group.
Second, expenditure on vehicle maintenance and repairs is excluded on the basis that this is more likely to be incurred by those on driving holidays.
Finally, expenditure on fuel is reduced to the average amount per day incurred by international tourists as those travelling by air are expected to spend less on fuel than those travelling to a destination by car. These assumptions are likely to be conservative because it is likely that air travellers have a higher average expenditure per night than those travelling by car or bus.
The next stage involves adjusting tourism expenditure, which is recorded in purchaser prices to internal tourism consumption at basic prices by removing the impact of imports and net taxes on production and adjusting for imputed consumption. Finally, input-output modelling is used to convert internal tourism consumption by item to estimates of direct and indirect value added and indirect and direct employment.
Estimate Qantas & Jetstar market share of air traffic by state and territory
Use TRA data to estimate total domestic tourism expenditure by state for those travelling by air
Total tourism expenditure by state attributable to Qantas and Jetstar
Adjust for double counting of airfares and differences in expenditure patterns of air travellers
Convert to internal tourism consumption at basic prices by removing net taxes and imports
Use I-O modelling to estimate direct and indirect value added and employment

The economic contribution of the Qantas Group
11
International tourism
A similar procedure was used to estimate the economic contribution of international tourism facilitated by the Qantas Group. The various stages in this process are outlined in Figure 3.2 below.
Estimating the market share of Qantas and Jetstar is more complicated in the case of international tourism. While BITRE has information on airline travel by route, this does not map neatly to country of origin for some countries and does not account for differences in the ratio of foreign to local residents carried by different airlines.
Tourism Australia does provide airline share data for some of Australia’s largest source countries, which can be used for these countries. Deloitte Access Economics also received detailed data from Qantas and Jetstar on incoming passengers by point of sale. While point of sale is not a perfect measure of country of origin it is likely to be a relatively good approximation. This can then be used to estimate market share of arrivals (after adjusting for the fact that some travellers are not short-term visitors but longer-term visitors or permanent settlers).
The market share of Qantas and Jetstar by country of origin was estimated by combining the Tourism Australia (2015) data (where available) with estimated market shares from point of sale data for source markets which were not included in the Tourism Australia data.
In the second stage this data was multiplied by estimates of expenditure (excluding prepaid airfares and package tours) by country of origin for inbound tourist arrivals for each state from TRA. The resulting estimates reflect the total international tourism expenditure for each state attributable to tourists travelling on Qantas or Jetstar.
The next stage involves adjusting this expenditure to exclude expenditure on international and domestic airfares in Australia to avoid double counting any expenditure as part of the direct economic contribution. As for the domestic tourism expenditure, this was then converted to tourism consumption at basic prices and then converted to estimates of direct and indirect value added and employment using Input-Output modelling.

The economic contribution of the Qantas Group
12
Figure 3.2: Overview of methodology for estimating the international tourism contribution
Source: Deloitte Access Economics
The Qantas Group also contributes in a significant way to supporting marketing activities by State Tourism Organisations (STOs). Qantas Group recently signed new three-year agreements with STOs in NSW, TAS, WA, NT, and QLD, and a new one-year deal with Tourism Victoria. In August 2016, Qantas and Tourism Australia announced a new $20 million partnership to attract more international visitors to Australia, with a focus on the United States, Asia, the United Kingdom and Europe.
While marketing expenditure is captured in the economic contribution of the Qantas Group in Section 3, this marketing expenditure also plays an important role in attracting people to come to Australia, some of whom will travel on Qantas or Jetstar and some of whom will travel on other airlines.
Economic contribution results
The economic contribution of the domestic tourism activity facilitated by the Qantas Group is shown in Table 3.2 below. The total economic contribution associated with expenditure by domestic tourists travelling on Qantas or Jetstar in FY 2016 was $6.5 billion, comprising $3.7 billion in direct value added and $2.8 billion in indirect value added. This represents a 3% increase in the contribution to domestic tourism from FY 2015, with total contribution from domestic tourism increasing from $6.2 billion. Of the total value added, 64% was contributed by passengers carried by Qantas and 36% from passengers carried by Jetstar.
Estimate Qantas & Jetstar market share of air traffic by country of origin
Use TRA data to estimate international tourism expenditure by country of origin and state
Total tourism expenditure by state attributable to Qantas and Jetstar
Adjust for double counting of airfares
Convert to internal tourism consumption at basic prices by removing net taxes and imports
Use I-O modelling to estimate direct and indirect value added and employment

The economic contribution of the Qantas Group
13
The contribution of this tourism expenditure to employment was 71,842 FTEs. This tourism expenditure contributed directly to the employment of 51,440 FTEs and indirectly to the employment of 20,402 FTEs as a result of flow-on effects from tourism expenditure to other sectors of the economy.
Table 3.2: Economic contribution of the Qantas Group to domestic tourism, FY 2016
Metric Direct Indirect Total
Value added ($m)
Qantas 2,356 1,774 4,130
Jetstar 1,324 997 2,321
Qantas Group 3,680 2,771 6,451
Employment (FTEs)
Qantas 32,937 13,062 45,999
Jetstar 18,503 7,340 25,843
Qantas Group 51,440 20,402 71,842 Source: Deloitte Access Economics Note: All figures have been rounded to the nearest unit so totals may be subject to rounding errors.
Table 3.3 shows the estimated economic contribution of the Qantas Group through facilitating international tourism expenditure. In total, expenditure associated with international tourists carried by the Qantas Group was estimated to contribute $3.9 billion in value added to the Australian economy, including almost $2.5 billion in direct value added and $1.5 billion in indirect value added. This is a 21% increase in the contribution to international tourism, as compared with FY 2015, reflecting the surge in international tourism Australia has experienced over the last year, and Qantas Group’s role in facilitating that travel.
The expenditure of international tourists carried by the Qantas Group was estimated to support the employment of 41,078 FTEs, 30,150 directly and 10,928 indirectly as the result of flow-on effects of tourism expenditure to other downstream sectors of the economy.
Table 3.3: Economic contribution of the Qantas Group to international tourism, FY 2016
Metric Direct Indirect Total
Value added ($m)
Qantas 1,824 1,097 2,921
Jetstar 633 390 1,023
Qantas Group 2,457 1,487 3,944
Employment (FTEs)
Qantas 22,331 8,061 30,392
Jetstar 7,820 2,867 10,687
Qantas Group 30,150 10,928 41,078 Source: Deloitte Access Economics Note: All figures have been rounded to the nearest unit so totals may be subject to rounding errors.
The economic contribution of the Qantas Group
14
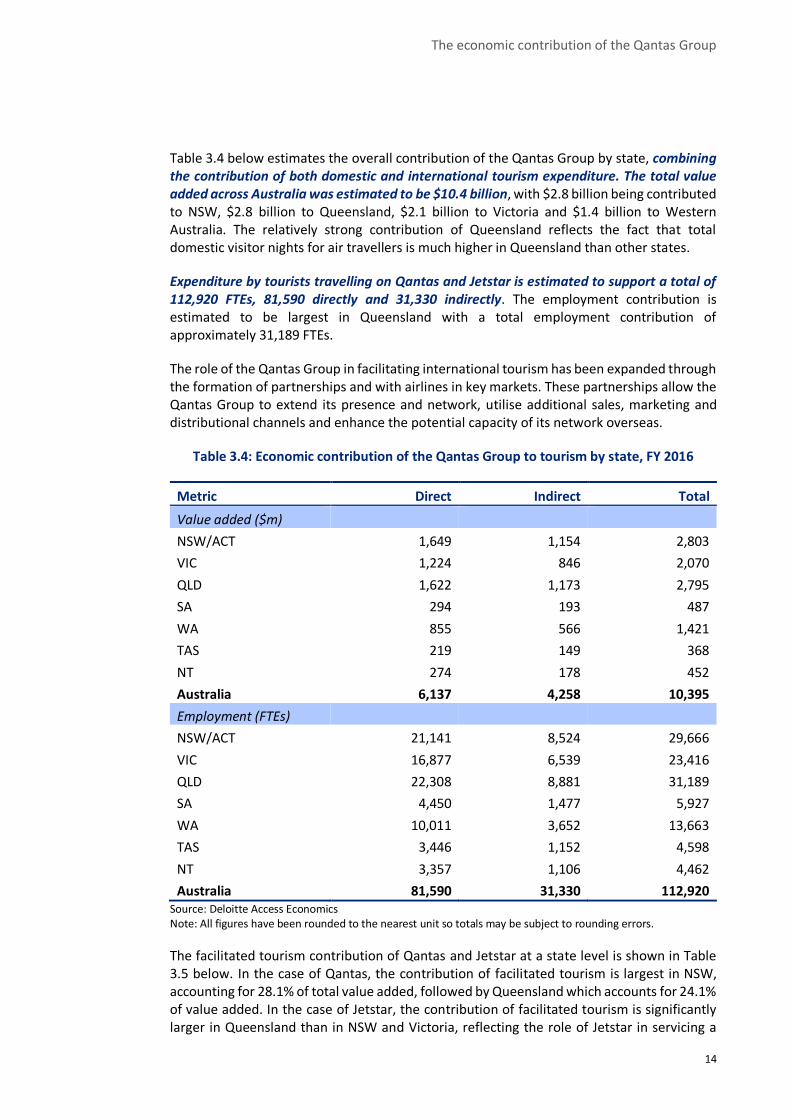
Table 3.4 below estimates the overall contribution of the Qantas Group by state, combining the contribution of both domestic and international tourism expenditure. The total value added across Australia was estimated to be $10.4 billion, with $2.8 billion being contributed to NSW, $2.8 billion to Queensland, $2.1 billion to Victoria and $1.4 billion to Western Australia. The relatively strong contribution of Queensland reflects the fact that total domestic visitor nights for air travellers is much higher in Queensland than other states.
Expenditure by tourists travelling on Qantas and Jetstar is estimated to support a total of 112,920 FTEs, 81,590 directly and 31,330 indirectly. The employment contribution is estimated to be largest in Queensland with a total employment contribution of approximately 31,189 FTEs.
The role of the Qantas Group in facilitating international tourism has been expanded through the formation of partnerships and with airlines in key markets. These partnerships allow the Qantas Group to extend its presence and network, utilise additional sales, marketing and distributional channels and enhance the potential capacity of its network overseas.
Table 3.4: Economic contribution of the Qantas Group to tourism by state, FY 2016
Metric Direct Indirect Total
Value added ($m)
NSW/ACT 1,649 1,154 2,803
VIC 1,224 846 2,070
QLD 1,622 1,173 2,795
SA 294 193 487
WA 855 566 1,421
TAS 219 149 368
NT 274 178 452
Australia 6,137 4,258 10,395
Employment (FTEs)
NSW/ACT 21,141 8,524 29,666
VIC 16,877 6,539 23,416
QLD 22,308 8,881 31,189
SA 4,450 1,477 5,927
WA 10,011 3,652 13,663
TAS 3,446 1,152 4,598
NT 3,357 1,106 4,462
Australia 81,590 31,330 112,920 Source: Deloitte Access Economics Note: All figures have been rounded to the nearest unit so totals may be subject to rounding errors.
The facilitated tourism contribution of Qantas and Jetstar at a state level is shown in Table 3.5 below. In the case of Qantas, the contribution of facilitated tourism is largest in NSW, accounting for 28.1% of total value added, followed by Queensland which accounts for 24.1% of value added. In the case of Jetstar, the contribution of facilitated tourism is significantly larger in Queensland than in NSW and Victoria, reflecting the role of Jetstar in servicing a

The economic contribution of the Qantas Group
15
number of leisure destinations along the Queensland coast. Queensland accounts for almost a third of the increase in value added associated with tourism expenditure facilitated by Jetstar.
Table 3.5 Economic contribution of Qantas and Jetstar to tourism by state, FY 2016
Metric Qantas Jetstar
Total value added ($m)
NSW/ACT 1,981 822
VIC 1,359 710
QLD 1,703 1,092
SA 357 131
WA 1,242 179
TAS 117 251
NT 293 159
Australia 7,051 3,344
Total employment (FTEs)
NSW/ACT 20,950 8,716
VIC 15,438 7,978
QLD 19,191 11,998
SA 4,377 1,550
WA 12,016 1,647
TAS 1,485 3,113
NT 2,934 1,528
Australia 76,390 36,530 Source: Deloitte Access Economics Note: All figures have been rounded to the nearest unit so totals may be subject to rounding errors.

The economic contribution of the Qantas Group
16
Appendix A: Economic contribution modelling framework Economic contribution studies are intended to quantify measures such as value added, exports, imports and employment associated with a given industry or company, in a historical reference year. The economic contribution is a measure of the value of production by a company or industry.
Value added
The measures of economic activity provided by a contribution study are consistent to those provided by the Australian Bureau of Statistics. For example, value added is the contribution the sector makes to total factor income and gross domestic product (GDP) and gross territory product.
There a number of ways to measure GDP:
Expenditure approach – measures the expenditure; of households, on investment, government and net exports
Income approach – measures the income in an economy by measuring the payments of wages and profits to workers and owners
Below is a discussion measuring the value added by an industry using the income approach.
Measuring the economic contribution – income approach
There are several commonly used measures of economic activity, each of which describes a different aspect of an industry’s economic contribution:
Value added measures the value of output (i.e. goods and services) generated by the entity’s factors of production (i.e. labour and capital) as measured in the income to those factors of production. The sum of value added across all entities in the economy plus net taxes less subsidies on products equals gross domestic product. Given the relationship to GDP, the value added measure can be thought of as the increased contribution to welfare.
Value added is the sum of:
Gross operating surplus (GOS). GOS represents the value of income generated by the entity’s capital inputs, generally measured as the earnings before interest, tax, depreciation and amortisation (EBITDA).
Tax on production less subsidy provided for production. Note: given the returns to capital before tax are calculated, company tax is not included or this would double count that tax. In addition it excludes goods and services tax, which is a tax on consumption (i.e. levied on households).
Labour income is a subcomponent of value added. It represents the value of output generated by the entity’s direct labour inputs, as measured by the income to labour.
The economic contribution of the Qantas Group
17
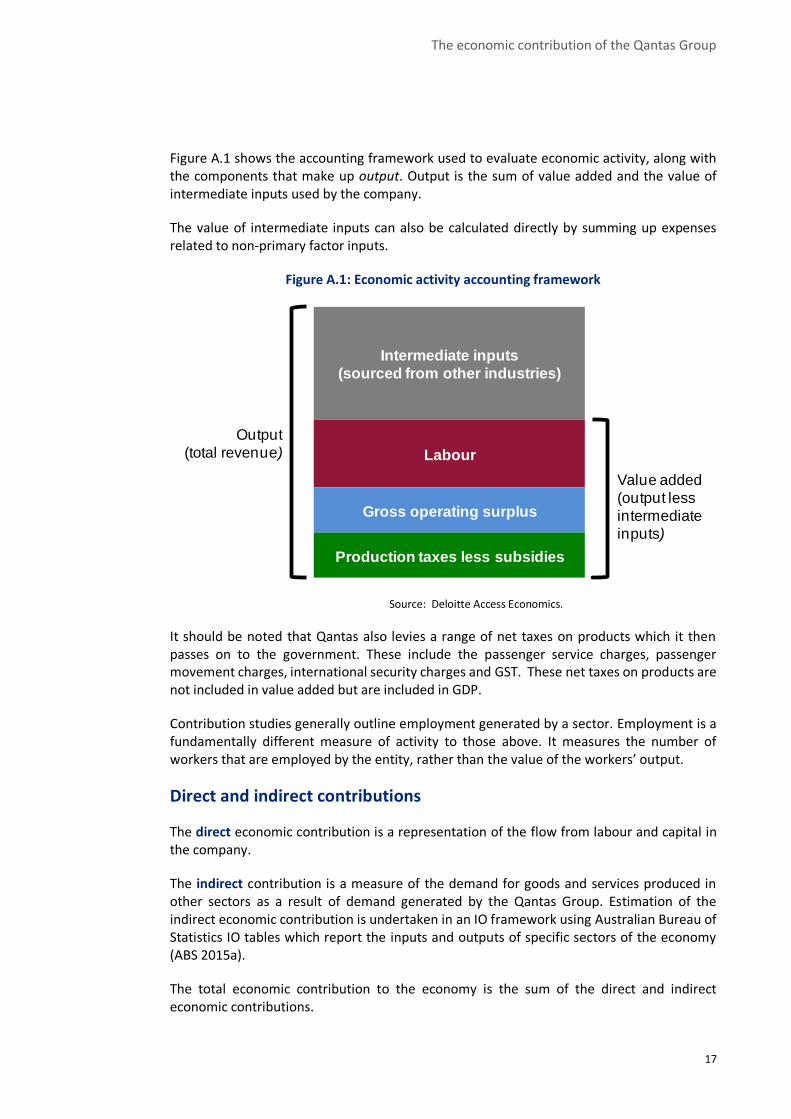
Figure A.1 shows the accounting framework used to evaluate economic activity, along with the components that make up output. Output is the sum of value added and the value of intermediate inputs used by the company.
The value of intermediate inputs can also be calculated directly by summing up expenses related to non-primary factor inputs.
Figure A.1: Economic activity accounting framework
Source: Deloitte Access Economics.
It should be noted that Qantas also levies a range of net taxes on products which it then passes on to the government. These include the passenger service charges, passenger movement charges, international security charges and GST. These net taxes on products are not included in value added but are included in GDP.
Contribution studies generally outline employment generated by a sector. Employment is a fundamentally different measure of activity to those above. It measures the number of workers that are employed by the entity, rather than the value of the workers’ output.
Direct and indirect contributions
The direct economic contribution is a representation of the flow from labour and capital in the company.
The indirect contribution is a measure of the demand for goods and services produced in other sectors as a result of demand generated by the Qantas Group. Estimation of the indirect economic contribution is undertaken in an IO framework using Australian Bureau of Statistics IO tables which report the inputs and outputs of specific sectors of the economy (ABS 2015a).
The total economic contribution to the economy is the sum of the direct and indirect economic contributions.
Intermediate inputs
(sourced from other industries)
Labour
Gross operating surplus
Production taxes less subsidies
Value added
(output less
intermediate
inputs)
Output
(total revenue)

The economic contribution of the Qantas Group
18
Other measures, such as total revenue or total exports are useful measures of economic activity but these measures alone cannot account for the contribution made to GDP. These measures overstate the contribution to value added because they include activity by external companies supplying inputs, in addition they do not discount the inputs supplied from outside Australia.
Input-output analysis
Input-output tables are required to account for the intermediate flows between sectors. These tables measure the direct economic activity of every sector in the economy at the national level. Importantly, these tables allow intermediate inputs to be further broken down by source. These detailed intermediate flows can be used to derive the total change in economic activity associated with a given direct change in activity for a given sector.
A widely used measure of the spill-over of activity from one sector to another is captured by the ratio of the total to direct change in economic activity. The resulting estimate is typically referred to as ‘the multiplier’. A multiplier greater than one implies some indirect activity, with higher multipliers indicating relatively larger indirect and total activity flowing from a given level of direct activity.
The IO matrix used for Australia is derived from the ABS 20012-13 IO tables (2015a). The industry classification used for IO tables is based on ANZSIC, with 114 sectors in the modelling framework.
Comparison with results from FY 2015
Deloitte Access Economics previously undertook an economic contribution study for the Qantas Group for FY 2015. The latest economic contribution analysis, covering FY 2016, has incorporated some methodological changes to better reflect the operations of Qantas Group and the economic activity of each individual business unit.
More specifically, the revised methodology adopts a different approach to the treatment of interfirm transfers. The allocation of interfirm transfers across business units has also been updated based on advice from Qantas to better reflect the relative size of each business unit. The revised methodology results in a lower level of indirect economic contribution and a different split of the direct economic contribution between business units.
To allow for a comparison of changes across years, Table A.2 provides a comparison of the results in the 2015 report and the equivalent results for FY 2016 applying the same methodology as that used in the previous report.

The economic contribution of the Qantas Group
19
Table A.2 Economic contribution of the Qantas Group relative to FY2015
2015 report 2016 results using the 2015 methodology
Metric Direct Indirect Total Direct Indirect Total Value added ($m)
Qantas 4,665 3,717 8,382 4,714 3,869 8,582
Jetstar 960 1,142 2,102 1,493 1,365 2,858
Freight 294 576 870 594 544 1,138
Qantas Group
5,919 5,434 11,354 6,801 5,777 12,578
Source: Deloitte Access Economics and the Qantas Group Note: All figures have been rounded to the nearest unit so totals may be subject to rounding errors.

The economic contribution of the Qantas Group
20
Limitation of our work
General use restriction
This report is prepared solely for the use of the Qantas Group. This report is not intended to and should not be used or relied upon by anyone else and we accept no duty of care to any other person or entity. The report has been prepared for the purpose of understanding the economic contribution of the Qantas Group and communicating this value more generally to government and other stakeholders. You should not refer to or use our name or the advice for any other purpose.

The economic contribution of the Qantas Group
Contact us
Deloitte Access Economics ACN: 149 633 116 8 Brindabella Circuit
Canberra Airport ACT 2609 Australia Tel: +61 2 6175 2000 Fax: +61 2 6175 2001 www.deloitteaccesseconomics.com.au
Deloitte Access Economics is Australia’s pre-eminent economics advisory practice and a member of Deloitte's global economics group. For more information, please visit our website www.deloitteaccesseconomics.com.au
About Deloitte
Deloitte refers to one or more of Deloitte Touche Tohmatsu Limited, a UK private company limited by guarantee, and its network of member firms, each of which is a legally separate and independent entity. Please see www.deloitte.com/au/about for a detailed description of the legal structure of Deloitte Touche Tohmatsu Limited and its member firms.
Deloitte provides audit, tax, consulting, and financial advisory services to public and private clients spanning multiple industries. With a globally connected network of member firms in more than 150 countries, Deloitte brings world-class capabilities and deep local expertise to help clients succeed wherever they operate. Deloitte's approximately 200,000 professionals are committed to becoming the standard of excellence.
About Deloitte Australia
In Australia, the member firm is the Australian partnership of Deloitte Touche Tohmatsu. As one of Australia’s leading professional services firms. Deloitte Touche Tohmatsu and its affiliates provide audit, tax, consulting, and financial advisory services through approximately 6,000 people across the country. Focused on the creation of value and growth, and known as an employer of choice for innovative human resources programs, we are dedicated to helping our clients and our people excel. For more information, please visit our web site at www.deloitte.com.au.
Liability limited by a scheme approved under Professional Standards Legislation.
Member of Deloitte Touche Tohmatsu Limited
© 2016 Deloitte Access Economics Pty Ltd