the dutch mortgage market - nvb (nl)€¦ · the memorandum presents an overview of the dutch...
TRANSCRIPT
The DutchMortgage Market
August 2014

This memorandum was compiled by a working committee, consisting of repre-sentatives of The Dutch Banking Association (NVB), ABN AMRO Bank, ING Bank,NIBC Bank, Rabobank and SNS Bank.The committee was assisted by Periscoop Consult.
© Dutch Banking Association (NVB) 2014.
Material from this memorandum may be quoted or reproduced without priorpermission, provided appropriate credit is given.
The Dutch Mortgage Market
The Dutch Mortgage Market
Contents
1. Why this memo? ... 1
2. The Dutch housing market ... 4
3. Key figures for the Dutch mortgage market ... 8
- box: Interest only and quasi interest only mortgages ... 10
- box: Portfolio LTV and macro LTV ... 12
- box: A real life stress test ... 18
4. Risks in the Dutch mortgage market ... 19
5. Risk mitigating factors ... 24
6. Reforms ... 29
7. Conclusion ... 30
Appendix: References … 31

The Dutch Mortgage Market

The Dutch Mortgage Market 1
1 Why this memo?
On average, Dutch mortgages have high Loan-to-Value and Loan-to-Income rati-
os. Figure 1 and Figure 2 show that LTV and DTI (Debt-to-Income) ratios (both at
origination) in the Dutch market are amongst the highest in Europe. These values
are usually seen as indicators of a high-risk mortgage market.
Yet at the same time, Dutch mortgages have a good track record in terms of per-
formance. According to Fitch (2013, see Figure 3), default rates in the Dutch
mortgage market are low compared to other countries.1 The Netherlands scores
amongst the best markets. The number of foreclosures is equally low. Although
losses have increased over the past years (Figure 4), and may increase further,
the actual loss rate (0.08 percent in 2013) is still very low.
The existence of high LTV and LTI ratios on the one hand, and low defaults and
losses on the other hand, leads to a paradoxical situation. Referring to this para-
dox, the Dutch Central Bank (DNB, 2014) recently called the Dutch mortgage
market ‘a market with a Janus head’. This paradox is the reason for the Dutch
Banking Association (NVB) to compile this memorandum. In line with the position
and the responsibilities of the NVB, the focus of the memorandum lies on indus-
try level, i.e. banks and other mortgage lenders.2 Where applicable, macroeco-
nomic implications are taken into account.
The memorandum presents an overview of the Dutch mortgage market: the
housing market (Chapter 2), the size of the market and outcomes in terms of
defaults, foreclosures and losses (Chapter 3), mortgage market risks (Chapter 4),
and risk mitigating factors embedded in the Dutch institutions, such as the tax
regime, the legal framework for mortgages and the social security system (Chap-
ter 5). Chapter 6 describes some recent reforms in Dutch legislation concerning
the housing and the mortgage market. The memorandum finishes with a conclu-
sion (Chapter 7) and a list of references.
...……………………………1 Credit agencies base their reports on mortgages in RMBS portfolios. These portfolios
cover about twenty percent of the entire value of Dutch mortgage loans. This share islarge enough to render a reliable view of the entire market.
2 Market outcomes and regulatory issues referred to in this memorandum, concern allmortgage-issuing financial institutions, e.g. banks and insurance companies.

The Dutch Mortgage Market 2
Figure 1: LTV ratio (at origination) of a typical securitized portfolio
Source: Fitch (2013)
Figure 2: Market Debt-to-Income ratios for new transactions
Source: Fitch (2013)
0%
10%
20%
30%
40%
50%
60%
70%
80%
0%
5%
10%
15%
20%
25%

The Dutch Mortgage Market 3
Figure 3: Expected default rates
Source: Fitch (2013)
Figure 4: Losses incurred on mortgages by Dutch banks
Source: main Dutch mortgage lenders (ABN AMRO, ING, NIBC, Rabobank, SNS),calculations by Periscoop Consult
0%
5%
10%
15%
20%
0,00%
0,01%
0,02%
0,03%
0,04%
0,05%
0,06%
0,07%
0,08%
2004 2005 2006 2007 2008 2009 2010 2011 2012 2013

The Dutch Mortgage Market 4
2 The Dutch housing market
In the Netherlands, tax facilities have played an important part in shaping both
the housing market and the market for mortgage loans. A strongly regulated
rental segment is another important factor.
The Dutch housing market is shaped by four dominant forces, which stem from
former political choices: (i) income tax deductibility of mortgage interest; (ii) a
rental market in which not-for-profit social housing institutions have a combined
market share of 84 percent; (iii) a scheme involving rent control and strong ten-
ant protection; and (iv) a restrictive regulatory (‘zoning’) regime for the develop-
ment and construction of new homes.
The Dutch housing stock consists of 7.1 million houses, 56 percent of which are
in the owner-occupied segment. This rate is below average in the euro-zone, see
Figure 5. The low share of the owner-occupied segment in itself acts as risk filter,
since access to ownership is restricted to households with a good risk profile.
Figure 5: Owner-occupancy rate euro-zone (2007, average = 62,3%)
Source: ECB (2009)
Due to zoning regulations, additions to the housing stock are low: less than one
percent of total stock is added each year, with an all time low rate of 0.4 percent
in 2013. The lack of newly built homes results in a permanent undersupply of
houses, mainly in the economic dominant region of the Netherlands, the area in
0%10%20%30%40%50%60%70%80%
The Dutch Mortgage Market 5
the west of the country known as the Randstad, notably in Amsterdam and
Utrecht.3
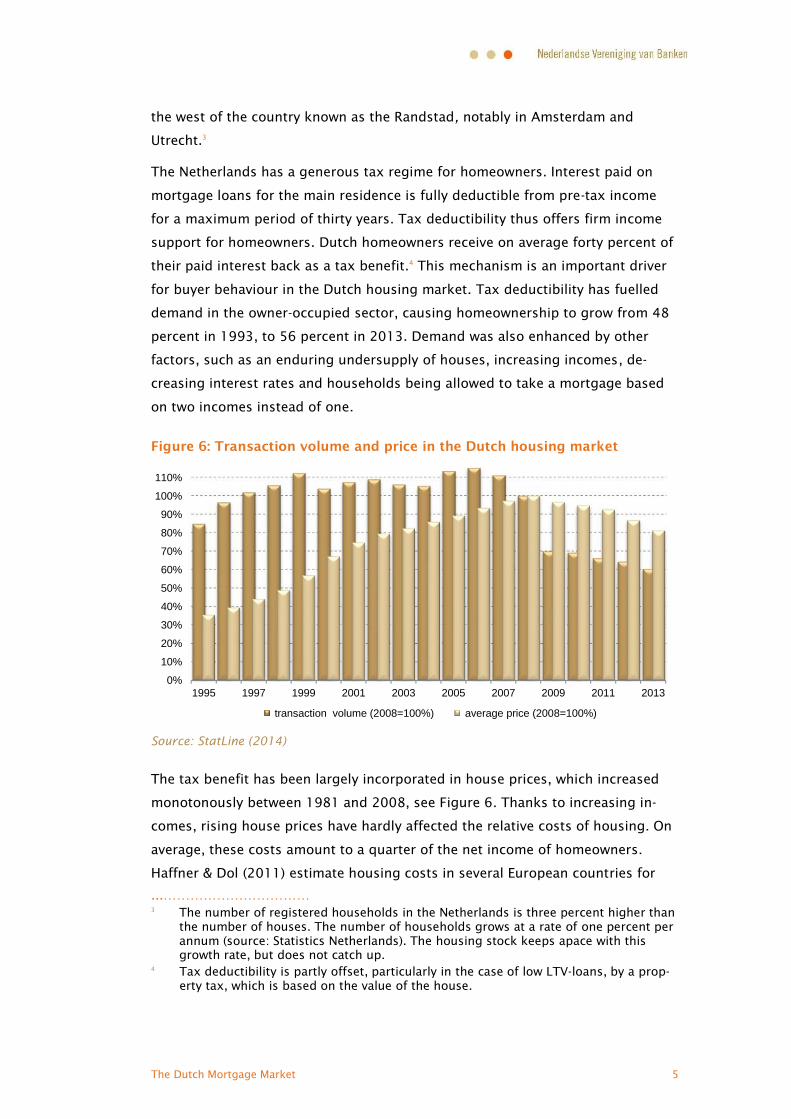
The Netherlands has a generous tax regime for homeowners. Interest paid on
mortgage loans for the main residence is fully deductible from pre-tax income
for a maximum period of thirty years. Tax deductibility thus offers firm income
support for homeowners. Dutch homeowners receive on average forty percent of
their paid interest back as a tax benefit.4 This mechanism is an important driver
for buyer behaviour in the Dutch housing market. Tax deductibility has fuelled
demand in the owner-occupied sector, causing homeownership to grow from 48
percent in 1993, to 56 percent in 2013. Demand was also enhanced by other
factors, such as an enduring undersupply of houses, increasing incomes, de-
creasing interest rates and households being allowed to take a mortgage based
on two incomes instead of one.
Figure 6: Transaction volume and price in the Dutch housing market
Source: StatLine (2014)
The tax benefit has been largely incorporated in house prices, which increased
monotonously between 1981 and 2008, see Figure 6. Thanks to increasing in-
comes, rising house prices have hardly affected the relative costs of housing. On
average, these costs amount to a quarter of the net income of homeowners.
Haffner & Dol (2011) estimate housing costs in several European countries for
...……………………………3 The number of registered households in the Netherlands is three percent higher than
the number of houses. The number of households grows at a rate of one percent perannum (source: Statistics Netherlands). The housing stock keeps apace with thisgrowth rate, but does not catch up.
4 Tax deductibility is partly offset, particularly in the case of low LTV-loans, by a prop-erty tax, which is based on the value of the house.
0%
10%
20%
30%
40%
50%
60%
70%
80%
90%
100%
110%
1995 1997 1999 2001 2003 2005 2007 2009 2011 2013
transaction volume (2008=100%) average price (2008=100%)

The Dutch Mortgage Market 6
2008, the year nominal house prices in the Netherlands broke an all-time record.
Their research shows (Figure 7) that housing cost ratios in the Netherlands are
not high in a European context.5
Figure 7: Housing cost ratios for households with a mortgage loan (2008)
Source: Haffner & Dol (2011)
The Dutch rental market is dominated by social housing. One of every three
houses in the Netherlands is owned by a housing corporation. The non-regulated
rental market is small compared to other countries. Rent controls have ensured
that renting has remained relatively cheap, also while prices in the owner-
occupied segment boomed between 1981 and 2008. Rent controls and tenant
protection have led to a gridlocked rental market. A quarter of the houses in the
controlled rental segment are occupied by middle and even high-income house-
holds. Steps towards market liberalization have been taken recently, mainly by
relaxing rent controls.
Due to the system of rent control and tenant protection, a buy-to-let segment
hardly exists in the Netherlands. Investments of this kind do not tend to be at-
tractive for small investors, also because income tax deductibility of mortgage
interest is restricted to the main residence of households.
...……………………………5 It should however be noted that such an international comparison of mortgage and
housing costs is very difficult, because of the differences in tax regimes, the differentways costs are measured and the unavailability of verifiable data.
0%
5%
10%
15%
20%
25%
housing costs net interest

The Dutch Mortgage Market 7
Impact of the crisis
The characteristics of the Dutch housing market –in particular undersupply and
the regulated and gridlocked rental sector– create a floor in the market, but they
do not make the market immune to adverse circumstances. Recent history illus-
trates this point. The annual transaction volume in the housing market has di-
minished by 55 percent from peak level in 2006. In 2014, prices have come
down 21.5 percent from the peak level attained in 2008 (Figure 6). As a result,
about thirty percent of mortgage loans in the Netherlands exceed the value of
the underlying property (DNB, 2014). However, after a period of six years of
stagnation, the housing market shows signs of a revival. A higher transaction
volume, combined with stabilising prices in the last months of 2013 and the first
quarter of 2014, indicates a (albeit fragile) recovery.

The Dutch Mortgage Market 8
3 Key figures for the Dutch mortgagemarketThe tax deductibility of mortgage interest has greatly influenced the Dutch mort-
gage market. It has encouraged ‘interest only’ mortgages, leading to high portfo-
lio LTVs, and caused a large difference between LTIs based on gross and net in-
come. Yet defaults and losses have remained very low, even in the recent crisis.
The mortgage portfolio of lenders in the Dutch market consists of 3.5 million
households: 83 percent of the 4.3 million Dutch homeowners carry a mortgage
debt, with their property as collateral. In 2013, the total mortgage debt amount-
ed to EUR 637 billion. The value of the housing stock amounts to EUR 1.07 bil-
lion, see Figure 8.
Figure 8: Mortgage debts and housing value of Dutch homeowners
Source: DNB (2013)
Regulation concerning LTI and LTV
Back in 2001, lenders had already begun setting limits on LTI, at first as a form
of self-regulation. A comply or explain system was introduced in 2006, with 6 as
the critical explain-value for LTI. In 2011, a stricter maximum LTI at origination
was defined in the Lenders’ Code of Conduct. In 2013, the Dutch government
incorporated the Code into law. Under the Code, subprime lending is forbidden,
as it was before. The Netherlands Authority for the Financial Markets (AFM) moni-
tors the market.
0
200
400
600
800
1.000
1.200
1995 1997 1999 2001 2003 2005 2007 2009 2011 2013
x 1 billion euro
housing value (all houses in the owner occupied segment) mortgage loans

The Dutch Mortgage Market 9
New borrowers must meet strict requirements governing their income and in-
come expectations. Values for maximum LTI at origination, based on purchasing
power and interest rates, are calculated annually by an independent budget insti-
tute (the NIBUD). In 2014, the maximum LTV is set –by law– at 104 percent. The
maximum value will be brought down stepwise to 100 percent in 2018. Given
these rules, the Dutch LTV-regime for mortgages is one of the most stringent in
Europe.6
In order to prevent consumers’ over-indebtedness, banks are obliged by law to
check the affordability of every new mortgage loan, with the assumption of re-
payment in an annuity scheme, irrespective of the actual form of the loan. So,
even though in the years when I/O loans were very popular, debt service capacity
of the borrower was tested against an annuity repayment profile.
In order to reduce the risk of borrowers being unable to afford their mortgage
after the fixed-interest period expires, banks have to calculate the applicant’s
borrowing capacity based on a ten-year fixed interest rate (set by the AFM), also
for borrowers opting for a shorter interest fix.
Figure 9: LTV ratio (at origination) of a typical securitized portfolio
Source: Fitch (2013) [Figure 9 is identical to Figure 1]
Loan-to-Value
Up to 2005, an LTV at origination of 110 percent was not uncommon in the
Netherlands. Average LTV at origination has come down from 96 percent in 2010
to 89 percent in 2013. The average share of new mortgages with an LTV of more
than hundred percent has been declining, from 55 percent in 2010 to fifty per-
cent in 2013, and is declining further in 2014.
...……………………………6 The OECD (2011) reports for most countries that there are no formal limitations on
LTV.
0%10%20%30%40%50%60%70%80%

The Dutch Mortgage Market 10
Interest only and quasi interest only mortgages
Most mortgages are structured in such a way that maximum gain from the tax
system is attained. Up to 2013 interest payments were fully deductible during
the entire period of the loan. Therefore home-owners had an incentive for choos-
ing I/O mortgages, for which during the loan period no repayments are due.
These mortgages have a large impact on the development of the portfolio LTV
(and LTI) of mortgage lenders.7
When these mortgages came into fashion (in the nineteen eighties), they were
mostly accompanied by a life insurance, the redemption of which was earmarked
for a bullet repayment upon maturity of the loan. These insurance schemes were
treated tax-friendly. Since 2008, bank saving schemes have become popular as a
way of accumulating the sum for repayment of the loan. Such mortgages are
‘quasi I/O’, in a sense that no repayment is done during their lifetime, but the
accompanying savings schemes guarantee repayment in the end.
Particularly in the period 2004-2006 pure –or ‘full’, as Moody’s (2013) calls
them– I/O mortgages were originated, i.e. loans without an accompanying sav-
ings scheme. A typical mortgage closed during these years, would consist of a
mix of pure and quasi I/O elements.
In 2013, the tax deductibility rules were changed. Deductibility for new mortgag-
es is only granted if the mortgage is actually paid off through an annuity or a
linear scheme over a maximum period of thirty years. This requirement has made
I/O mortgages and quasi I/O mortgages unattractive.
Moody’s (2013) estimates the share of pure I/O loans in Dutch RMBS portfolios to
be «less than thirty percent». Statistics Netherlands (2013) reports a share of 35
percent of pure I/O in all new and renewed mortgages for 2012. In 2009 that
share amounted to 37 percent.
LTV at origination is a commonly used indicator, but portfolio LTV (or ‘current’
LTV) is at least as important. Before 2008, even with an I/O mortgage, LTV would
drop by itself, because of increasing house prices. When house prices started
falling in 2008, it worked the other way round: since then, average portfolio LTV
has risen considerably.
...……………………………7 Portfolio LTV changes through changes in the loan (either through repayment or
through additional loans) and changes in house value. Portfolio LTVs are calculatedas current loans divided by indexed house values.

The Dutch Mortgage Market 11
Figure 10 shows the development of portfolio LTV of Dutch mortgage lenders,
increasing from fifty percent in 2006 to 72 percent in 2013. This increase is al-
most exclusively due to decreasing house value, as prices have fallen by 21.5
percent. Because of the share of (quasi) I/O mortgages in the portfolio, increas-
ing portfolio LTV is only partly compensated by regular repayments.8 Given the
signs in the first quarter of 2014 that the decrease of house prices is coming to
an end, and new mortgages on average having lower LTVs, 2014 might be a turn-
ing point. However, it is too early to draw a conclusion.
Figure 10: Portfolio LTV of Dutch homeowners 2006-2013
Source: DNB (2013), StatLine (2014), approximations adapted from Ministerie
van Financiën (2012), additional calculations by Periscoop Consult 9
In order to calculate average net portfolio LTV, the capital accumulation in relat-
ed life insurances and bank savings must be deducted from the mortgage debt. It
should be noted that with I/O and quasi I/O mortgages, it is virtually impossible
to measure or even estimate these savings; savings earmarked for repayment can
be kept with banks or insurers other than the mortgage lender. This matching
problem implies that mortgage-related savings are underestimated, and thus that
net portfolio LTVs are overestimated.
...……………………………8 In 2013, many households made voluntary extra repayments on their mortgage
loans. DNB (2014) notes that most repayments do not concern high LTV-mortgages,but mortgages of elder borrowers who mostly have low LTVs. DNB explains these re-payments by the current low interest rate on regular savings accounts.
9 Portfolio LTV is calculated on the assumption that the average value of houses with amortgage loan is equal to the average value of all houses in the owner-occupiedsegment.
0%
10%
20%
30%
40%
50%
60%
70%
2006 2007 2008 2009 2010 2011 2012 2013
approximate mortage savings approximate net portfolio LTV gross portfolio LTV
Approximate mortgage savings and net portfolio LTV add to gross portfolio LTV.Approximations are only available for 2006-2011.

The Dutch Mortgage Market 12
The Dutch Ministry of Finance (2012) shows an approximation for earmarked
savings, see Figure 10 and Table 1. In this approximation, in 2011 savings
amounted to about ten percent of the entire mortgage debt. This leads to an es-
timated net portfolio LTV of 59 percent in 2011, whereby gross portfolio LTV
equals 66 percent. Given that most of the savings schemes originated about ten
years ago, and have a planned lifetime of thirty years, the savings will start ac-
cumulating fast as from 2025.
Portfolio LTV and macro LTV
Portfolio LTV is the ratio of mortgage debt and house value for all mortgage
borrowers. At macro level, LTV is defined as mortgage debt divided by the value
of the entire housing stock in the owner-occupied segment. Macro LTV and port-
folio LTV denote different risks, and may work out differently. For example, if
only low LTV-loans are paid off, macro LTV decreases whereas portfolio LTV in-
creases at the same time.
In 2013, seventeen percent of Dutch homeowners did not carry a mortgage
debt. This means that macro LTV, as a risk indicator at national level, is seven-
teen percent lower than portfolio LTV.
Table 1: LTV under various definitions2011 2012 2013
portfolio LTV* 66% 70% 72%
net portfolio LTV** 59% n.a. n.a.
macro LTV* 54% 58% 60%
net macro LTV** 51% n.a. n.a.
* DNB (2013), StatLine (2014).** Approximations Ministerie van Financiën (2012).Additional calculations by Periscoop Consult.
Loan-to-Income
Up to the year 2000 LTI values at origination of up to six were not uncommon.
Since then, LTIs at origination have come down, by virtue of the lenders’ self-
regulation and following government legislation. This decrease is still continuing.
In the past three years, average LTI at origination has decreased further, from 4.5
in 2010 to an average of 4.25 in 2013.
Figure 11 shows how average portfolio LTI developed between 2006 and 2013: a
slight increase at gross income level, and an even slighter increase at net income
level. The difference between gross LTI and net LTI shows the impact of tax sub-
sidies. As a consequence of tax deductibility, Dutch LTI-ratios turn out signifi-
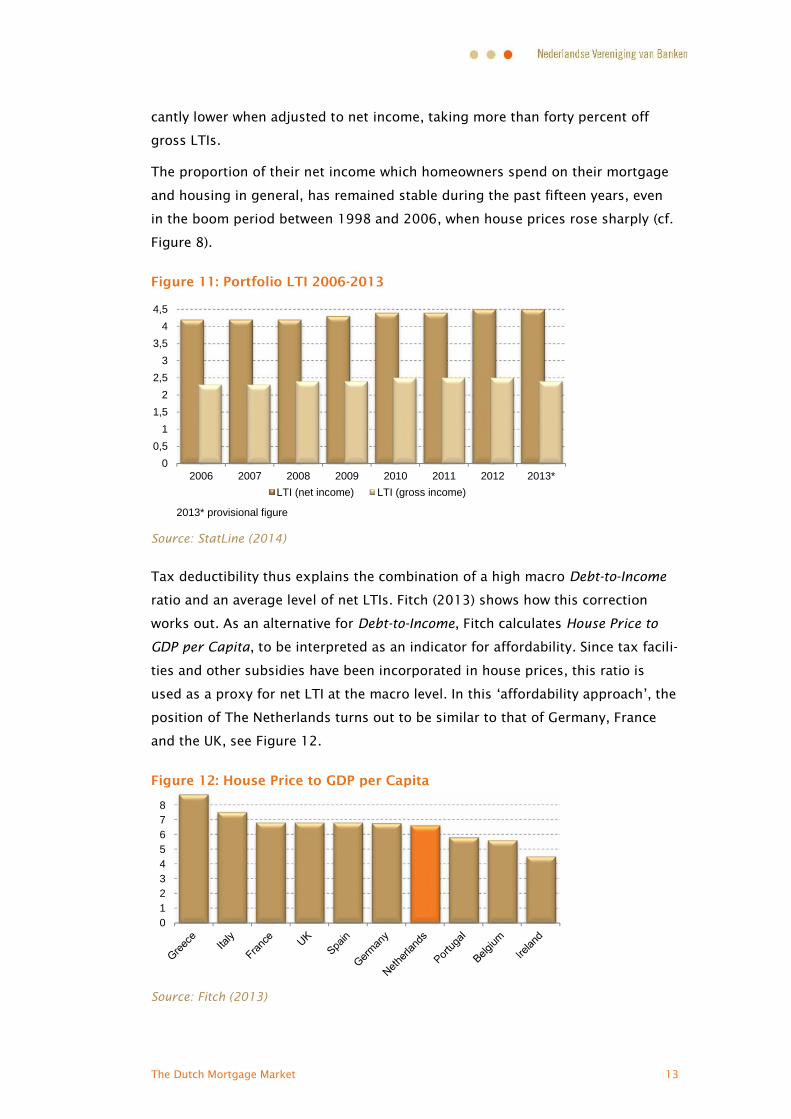
The Dutch Mortgage Market 13
cantly lower when adjusted to net income, taking more than forty percent off
gross LTIs.
The proportion of their net income which homeowners spend on their mortgage
and housing in general, has remained stable during the past fifteen years, even
in the boom period between 1998 and 2006, when house prices rose sharply (cf.
Figure 8).
Figure 11: Portfolio LTI 2006-2013
Source: StatLine (2014)
Tax deductibility thus explains the combination of a high macro Debt-to-Income
ratio and an average level of net LTIs. Fitch (2013) shows how this correction
works out. As an alternative for Debt-to-Income, Fitch calculates House Price to
GDP per Capita, to be interpreted as an indicator for affordability. Since tax facili-
ties and other subsidies have been incorporated in house prices, this ratio is
used as a proxy for net LTI at the macro level. In this ‘affordability approach’, the
position of The Netherlands turns out to be similar to that of Germany, France
and the UK, see Figure 12.
Figure 12: House Price to GDP per Capita
Source: Fitch (2013)
00,5
11,5
22,5
33,5
44,5
2006 2007 2008 2009 2010 2011 2012 2013*LTI (net income) LTI (gross income)
2013* provisional figure
012345678
The Dutch Mortgage Market 14
Defaults, foreclosures and losses
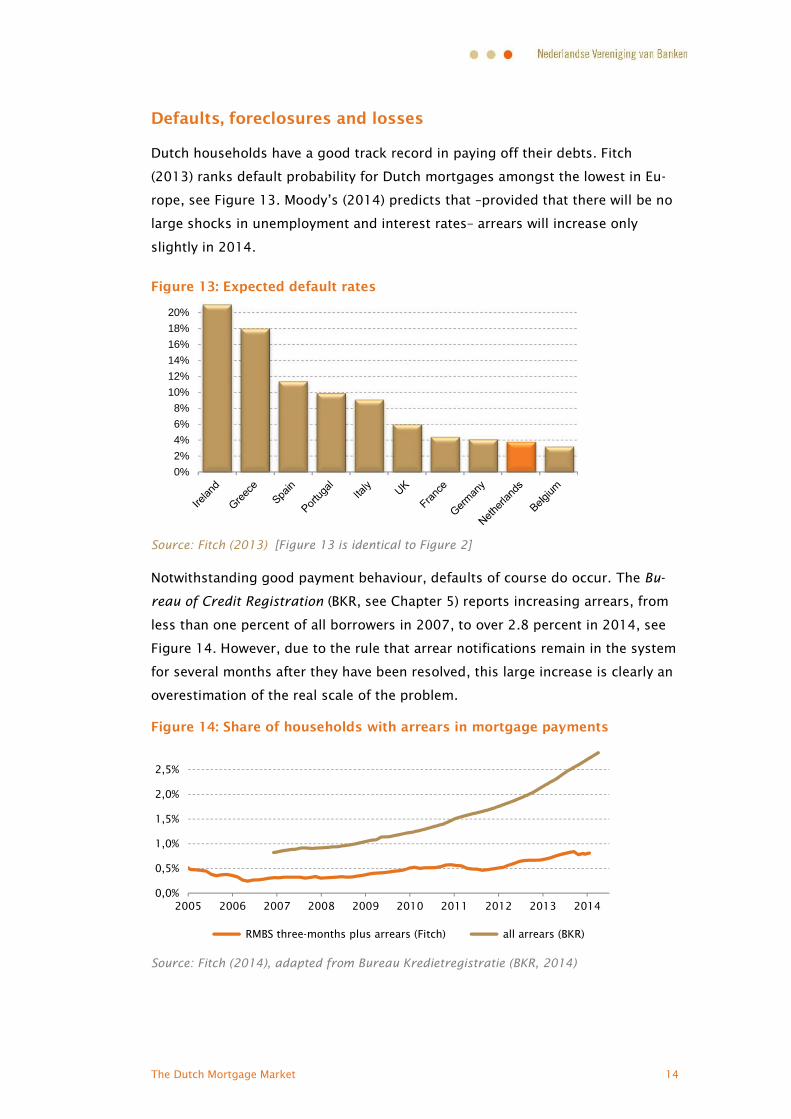
Dutch households have a good track record in paying off their debts. Fitch
(2013) ranks default probability for Dutch mortgages amongst the lowest in Eu-
rope, see Figure 13. Moody’s (2014) predicts that –provided that there will be no
large shocks in unemployment and interest rates– arrears will increase only
slightly in 2014.
Figure 13: Expected default rates
Source: Fitch (2013) [Figure 13 is identical to Figure 2]
Notwithstanding good payment behaviour, defaults of course do occur. The Bu-
reau of Credit Registration (BKR, see Chapter 5) reports increasing arrears, from
less than one percent of all borrowers in 2007, to over 2.8 percent in 2014, see
Figure 14. However, due to the rule that arrear notifications remain in the system
for several months after they have been resolved, this large increase is clearly an
overestimation of the real scale of the problem.
Figure 14: Share of households with arrears in mortgage payments
Source: Fitch (2014), adapted from Bureau Kredietregistratie (BKR, 2014)
0%2%4%6%8%
10%12%14%16%18%20%
0,0%
0,5%
1,0%
1,5%
2,0%
2,5%
2005 2006 2007 2008 2009 2010 2011 2012 2013 2014
RMBS three-months plus arrears (Fitch) all arrears (BKR)

The Dutch Mortgage Market 15
Fitch (2014) present a more realistic approach to the scale of the problem, based
on the number of ‘three-months plus’ arrears. The number of households with
arrears of three months or more has increased, but very slightly. By 2014 the
share in the total number of mortgages is 0.8 percent, see Figure 14. Fitch ex-
pects a further increase in arrears in 2014. The number of one-month arrears is
twice as high (1.6 percent by 2014) as the number of three-month plus arrears:
half of the problems are solved at an early stage. A lot of the arrears as shown in
the BKR-statistics appear to be short-lived.
Banks play an active role in solving payment problems, usually via loan modifica-
tions. Banks also provide budget counselling for customers, aimed at balancing
income and costs. Often, such assistance can avert a default. The Dutch legal
framework governing mortgages (see also Chapter 5), and the efforts of the
banks in ‘servicing’ households with defaults, both contribute to early stage
problem solving.
Figure 15: Foreclosures
Source: OTB (2014), based on Kadaster 2013* three quarters
Voluntary private sales are more common than foreclosures. If payment prob-
lems occur, and these problems cannot be solved in a regular manner, a volun-
tary sale usually leads to a better sales value than foreclosure. The annual num-
ber of foreclosures therefore is low. It fluctuates a around 0.06 percent of the
total number of mortgages. An increase occurred in 2011, but numbers have
fallen since then. As a result, banks’ losses have been modest over the past
years.
Recovery
The Dutch mortgage market is characterized by a fast liquidation and collection
process. A typical unwinding process takes about fifteen months, according to
Fitch (2013), see Figure 16. This is comparable to the UK, but significantly faster
0,00%
0,02%
0,04%
0,06%
0,08%
2007 2008 2009 2010 2011 2012 2013*
relative to the number of mortgages

The Dutch Mortgage Market 16
than in other European countries. The strong legal position of lenders (see Chap-
ter 5), combined with an efficient recovery process, helps lenders to attain recov-
ery rates in line with other European countries, see Figure 17.10
Figure 16: Expected recovery period (in months) by country
Source: Fitch (2013)
Figure 17: Recovery rate expectations (for RMBS) by country
Source: Fitch (2013)
...……………………………10 The recovery rate is defined as the average share of the loan that is recovered, if a
loss has to be taken. It is equal to one minus the ‘loss given loss’ rate.
0
12
24
36
48
60
72
0%
10%
20%
30%
40%
50%
60%
70%
80%

The Dutch Mortgage Market 17
Losses
Data provided by the leading Dutch mortgage lenders, based on their entire port-
folios, show a similar trend (Figure 18). Loss rates have increased from a level of
0.03 percent in 2008 (before the crisis), to 0.08 percent in 2013. Although the
rate of increase is large, the absolute level of losses remains very low.
Figure 18: Losses taken on mortgages by Dutch banks
Source: main Dutch mortgage lenders (ABN AMRO, ING, NIBC, Rabobank, SNS),calculations by Periscoop Consult [Figure 18 is identical to Figure 4]
0,00%
0,01%
0,02%
0,03%
0,04%
0,05%
0,06%
0,07%
0,08%
2004 2005 2006 2007 2008 2009 2010 2011 2012 2013

The Dutch Mortgage Market 18
A real life stress test
During the period 2008–2013 the Dutch mortgage market was subject to a se-
vere real-life stress test. Faced with the worst financial crisis since 1929, the
Dutch housing market was confronted with the following real-life stress test sce-
nario:
a GDP decrease of 3.2 percent;
an unemployment increase from 3.8 percent in 2008 to 8.5 percent in 2013;
average housing prices decreased by 21.5 percent from the peak level
reached in 2008;
transactions in the housing market declined by 55 percent from the peak lev-
el reached in 2006;
RMBS and covered bond markets were significantly impacted by a lack of
trust in financial markets: liquidity was low, and assumed yields were signifi-
cantly higher;
the rules for tax deductibility were amended, resulting in lower affordability
for households in the longer term.
Under these circumstances, Dutch mortgages have held up relatively well.
Actual losses in the mortgage books of Dutch banks have been easily absorbed
by operating income on mortgages.
Foreclosures increased from around 0.06 percent in 2008 to a peak of
0.08 percent in 2011 and then decreased to around 0.05 percent in 2013;
actual losses by Dutch banks on their Dutch mortgages increased from
0.03 percent in 2008 to 0.08 percent in 2013;
the main reasons for write-offs confirm the positive impact of the system of
employment protection and unemployment benefits. Divorce is the main
driver behind defaults and write-offs in the portfolio, not unemployment.
Signs of recovery are evident in 2014. Export and GDP are on the increase up and
the housing market seems to have bottomed out. In some regional markets pric-
es have stopped falling and transaction volume is on the increase. The situation
in the labour market remains worrisome, however. Unemployed still increases,
and there is an ongoing shift from permanent workers to temporary workers and
self-employment.

The Dutch Mortgage Market 19
4 Risks in the Dutch mortgage market
Mortgage markets are subject to various kinds of risks: macroeconomic risks,
mesoeconomic risks (at the level of mortgage lenders) and country-specific insti-
tutional risks. High values of LTV and LTI are not risky in themselves, but are
rather indicators for a situation in which problems may be aggravated in the
event of adverse economic circumstances.
Macroeconomic risk
Macroeconomic risk relates to the impact of a deteriorating economy on the per-
formance of mortgages. The regular risk affecting mortgage lending, consists of
borrowers not being able to pay their monthly interest and meet their loan re-
payment duties. A high LTV (especially an LTV in excess of hundred percent)
leads to a higher risk of borrowers not being able to repay the entire debt when
the house is sold – whether forced by the bank or voluntarily. Divorce is by far
the most important reason for a fall in income and subsequent defaults and loss-
es, as Figure 19 shows. Unemployment and disability together count for 21 per-
cent. As the number of self-employed increases (see below), entrepreneurs expe-
riencing financial distress may become a more important factor.
Figure 19: Drivers for defaults and losses (2013)
Source: Ministerie van Binnenlandse Zaken en Koninkrijksrelaties (2014)
Housing price risk
For about thirty percent of Dutch mortgages, the size of the mortgage exceeds
the value of the underlying property (DNB, 2014).11 These households suffer from
...……………………………11 This figure is based on an approximated correction for mortgage-related savings (cf.
Chapter 3). Without this correction, and including non-bank loans, the percentage ofunderwater loans amounts to 41 percent (CSB Statline).
divorce64%
unemploy-ment18%
over-indebted-
ness15%
disability3%
The Dutch Mortgage Market 20
negative home equity, their mortgages are ‘underwater’. DNB (2014) shows that
the underwater problem affects mainly younger households (20-40 years).
For those who are able to pay their interest and instalments, and want to contin-
ue living in their house, this situation does not cause problems with their mort-
gage. Yet these homeowners can only sell their home at a loss, which compels
them to make up the deficit from other sources, or else remain with a residual
debt after the sale. Banks in the Netherlands are permitted to finance residual
debts (on the previous home) as part of a new mortgage with an LTV above the
104 percent maximum, as long as LTI (the ability to pay the mortgage) remains
within the regular boundaries. The residual debt has to be repaid within a period
of ten years.
Underwater mortgages do not necessarily worsen the banks’ balances. Yet the
situation causes problems at macro level, since it leads to a (further) slowdown
of the housing market. Both economic and psychological factors play a part.
Many homeowners are unable to meet the criteria for refinancing their residual
debt in a new mortgage. This effectively stops them from selling their home. At
least as important is the psychology that comes into play. It is known from be-
havioural economics that losses hurt more than equal gains satisfy. Even if they
are able to take a loss on their home, many people are unwilling to do so. Van
Dijk (2013), taking the work of Kahneman and Tversky as a starting point, argues
that with an underwater mortgage, it is not the market value that may determine
the sellers’ reservation price, but rather the mortgage loan. Sellers are not ready
to lower their asking price to the market level; as a result they fail to sell their
house.
A slowdown of the housing market has negative effects for the entire economy. It
hampers the labour market and, due to the so called ‘housing wealth effect’, it
may decrease consumer spending. It also poses an additional risk of house pric-
es falling further, thus impeding the mortgage market. Moreover, the Dutch gov-
ernment carries the largest part of the residual debt risk (DNB, 2014), with more
than half of the underwater mortgages covered by the National Mortgage Guar-
antee Scheme (NHG, see Chapter 5). According to DNB (2014), it may take at
least ten years before the underwater situation can be resolved.
Risk of a steep rise in interest rates
New borrowers assess the affordability of loans by the interest rate charged by
the lender. Mortgage interest rates in Europe are currently at a historically low
level. In the years to come, interest rates may rise again, with increasing risks for

The Dutch Mortgage Market 21
borrowers and for lenders. For Dutch borrowers, this risk is reduced by the tax
deductibility of mortgage interest. In effect homeowners carry only between fifty
and sixty percent of the interest rate increase. Over seventy percent of Dutch
mortgage loans have a fixed-interest rate of five years or more (Source: DNB). Yet
the European Central Bank (ECB, 2013) ranks the Netherlands’ sensitivity to in-
terest rate shocks as above average, due to «a high proportion of adjustable in-
terest rate mortgages», and the relative high borrowings by Dutch households.12
Concentration risk
Dutch banks have an above average exposure to residential real estate risk. Un-
balanced asset portfolios make Dutch banks vulnerable in economic volatile cir-
cumstances, as stated by the International Monetary Fund (IMF, 2013) and the
Dutch Central Bank (DNB, 2014).
Funding risk
Dutch consumers hold the main share of their savings in pension funds. The lev-
el of bank deposits is therefore relatively low. Consequently, households’ and
corporate deposits in the Netherlands do not suffice for the funding of loans
provided by Dutch banks. At macro level, the ‘deposit gap’ amounted to about
EUR 480 billion by the end of 2012.
Figure 20: The Dutch funding gap
Source: adapted from Dutch Central Bank (2011), p. 28
Figure 21 shows that in relative terms, the Netherlands holds one of the largest
deposit gaps in Europe. The deposit gap forces banks to fund themselves on the
capital market, as pointed out by the Commissie Structuur Nederlandse Banken
(2013). Dutch banks have been able to fund themselves successfully, notwith-
standing the fact that the international market for RMBS has been difficult in re-
...……………………………12 Some countries with a high share of flexible interest mortgages (Denmark, Ireland
and the UK), remain outside the scope of the ECB analysis.
478
0 100 200 300 400 500 600 700 800 900 1000
loans
gap
deposits
x 1 billion Euro
households corporates banking subsidiaries securitized
2011q2

The Dutch Mortgage Market 22
cent years. About twenty percent of Dutch mortgages has been securitized (ex-
cluding covered bonds). The Dutch Central Bank (DNB, 2014) speaks of a vulner-
able situation, but also confirms that access by Dutch banks to capital market
finance is improving.
Figure 21: Share of non-deposit financed loans
Source: DNB (2012)
Regulatory risk
While tax deductibility supports homeownership and affordability, it also has ex-
posed the Dutch mortgage market to the risk of changes in the tax regime.
Dutch mortgage borrowers make optimal use of tax deductibility, see also Chap-
ter 2. This reliance on government subsidies comes at a risk. Tax subsidies and
regulation may change. The more banks and households base their long-term
commitments on existing regulations, the more sensitive the Dutch mortgage
market becomes to policy changes.
Uncertainty about reforms and regulation changes has immediate negative ef-
fects. Uncertainty about government policy regarding transfer tax and the de-
ductibility of mortgage interest contributed heavily to the standstill of the Dutch
housing market in the period 2009–2011. The change in the tax regime as out-
lined in Chapter 3 (a curtailing of tax deductibility) was supported by a broad
spectrum of political parties and by the Dutch Central Bank. The risk of further
shocks due to tax policy changes has therefore been substantially reduced.
-20%
-10%
0%
10%
20%
30%
40%
50%
The Dutch Mortgage Market 23
Institutional risk
Transformations in the labour market carry a specific challenge for the Dutch
mortgage market, and for the Dutch welfare system in general. The number of
temporary workers, self-employed and business owners in the Netherlands is
rapidly increasing. In 2013, together these groups made up thirty percent of the
working population in the Netherlands (source: StatLine). Temporary workers and
self-employed add flexibility to the labour market, but also contribute to erosion
of the Dutch welfare system. They do not participate in pension funds, they do
not enjoy employment protection, and neither do they qualify for unemployment
benefits.
The impact of this labour market transformation on mortgage risk is twofold.
From a macro perspective, a more flexible market should lead to lower unem-
ployment, and thus to fewer mortgage payment problems. At an individual level,
self-employed are strongly exposed to economic volatility. The decline of income
in the event of bankruptcy or invalidity will be more severe than for regular em-
ployees. Moody’s (2014) calculates arrear rates amongst self-employed borrow-
ers to be 1.9 times higher than amongst employed borrowers, with foreclosure
rates being 1.8 times higher. Yet, again according to Moody’s, the impact on
lenders’ risk is limited, because self-employed have loans with lower loan-to-
foreclosure values.
Lenders in the Netherlands also impose higher acceptance criteria on mortgage
underwriting for self-employed and temporary workers. They need to show a
track record of three years income generation capability in order to qualify for a
mortgage loan.
The Dutch Mortgage Market 24
5 Risk mitigating factors
The Dutch mortgage market has held up relatively well during the crisis, despite
its high LTV- and LTI-ratios. This Chapter describes a number of specific factors
which contribute to the strong performance of the Dutch mortgage market.
Pension savings
The Netherlands has one of the most elaborate pension systems in the world.
The first tier is a basic state pension (called AOW), to which everyone aged 65
and older is entitled. The amount of the AOW depends on the number of years
the person has resided in his or her adult life in the Netherlands.13 This tier is
financed by the taxpayer on a ‘pay as you go’ basis.
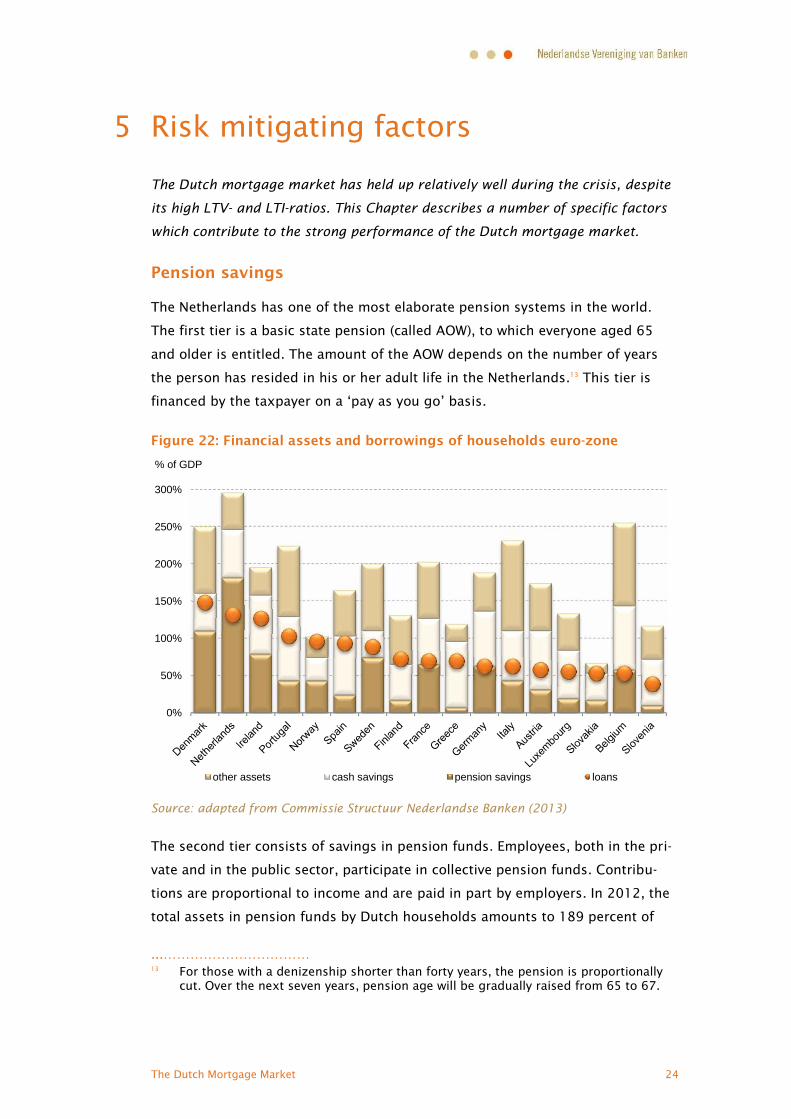
Figure 22: Financial assets and borrowings of households euro-zone
Source: adapted from Commissie Structuur Nederlandse Banken (2013)
The second tier consists of savings in pension funds. Employees, both in the pri-
vate and in the public sector, participate in collective pension funds. Contribu-
tions are proportional to income and are paid in part by employers. In 2012, the
total assets in pension funds by Dutch households amounts to 189 percent of
...……………………………13 For those with a denizenship shorter than forty years, the pension is proportionally
cut. Over the next seven years, pension age will be gradually raised from 65 to 67.
0%
50%
100%
150%
200%
250%
300%
% of GDP
other assets cash savings pension savings loans

The Dutch Mortgage Market 25
GDP, see Figure 22. The third tier consists of tax-efficient individual pension sav-
ing plans. These plans are attractive for business owners, who do not participate
in collective pension funds, and for employees wishing to make voluntary extra
savings. Like the second tier, savings in the third tier are not accessible for pur-
poses other than pension payments.14
Because of the savings in the second and the third tier, the Netherlands has the
largest Pension Assets Per Capita ratio worldwide. As a result of this, in an inter-
national comparison of Debt to Asset Value ratios, Dutch households rate among
the lowest when comparing the level of indebtedness to total assets.
The Dutch pension system serves to reduce mortgages risks considerably. Dutch
homeowners do not depend on the value of their homes for their old-age income.
Thanks to their pension savings, they can afford to pay housing costs (e.g. inter-
est and instalments) even after retirement.
Social security
The Dutch social security system mitigates the consequences of income decline
for employees who lose their job. Permanent employees in the Netherlands enjoy
strong job protection. If workers with a permanent contract are dismissed, they
normally receive a severance payment of up to six months’ salary, depending on
the duration of their employment contract. Those who lose their job, are entitled
to unemployment benefits, calculated at seventy percent of the former income
(capped at about 150 percent of median income), for a period from 3 up to 38
months, depending on their work record.
Severance pay and unemployment benefits assist people through a period be-
tween jobs and helps them to meet their financial obligations. This also gives
them time to sell their house voluntarily, and find cheaper housing if they do not
find work. In this manner, the social security system lowers the risk of mortgage
borrowers being unable to meet their mortgage commitments.
Legal environment
The Dutch have an excellent reputation for paying off their debts. Consistent
payment behaviour is enhanced by the Dutch legal system. Under Dutch civil law,
mortgage lenders enjoy a strong protection in relation to borrowers. Moody’s
...……………………………14 The Dutch Government announced recently that it considers allowing borrowers to
use pension savings for paying their mortgage debts.
The Dutch Mortgage Market 26
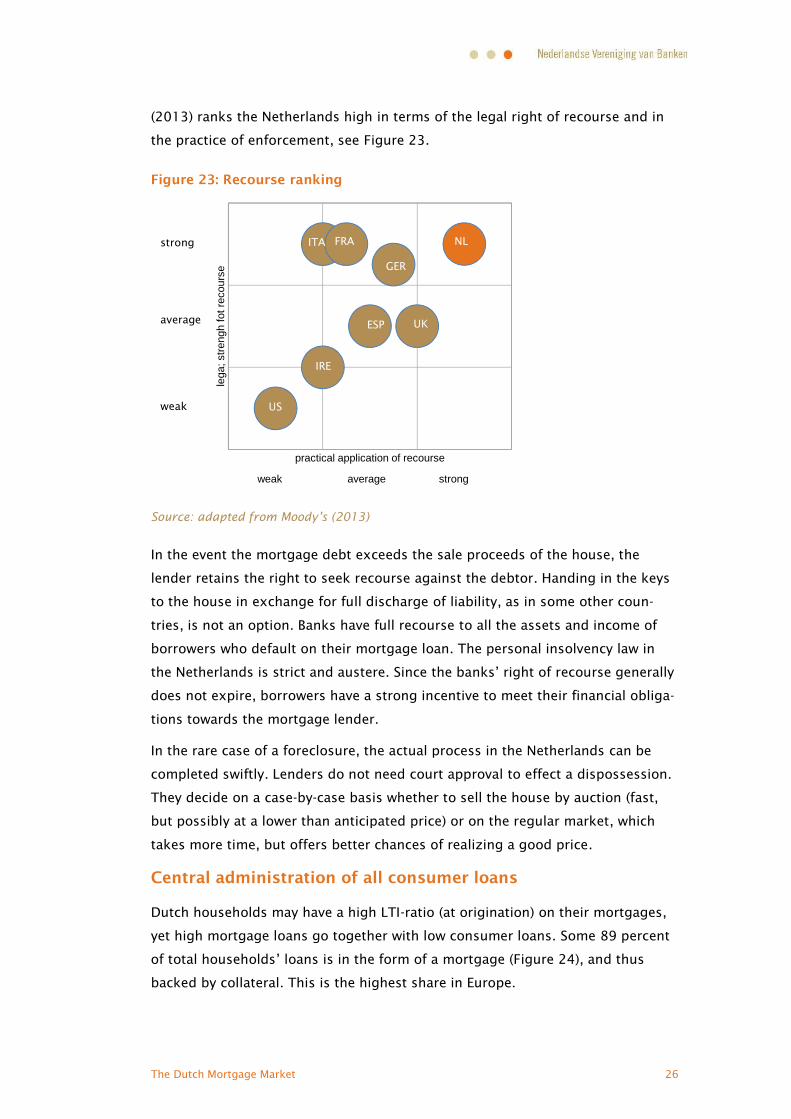
(2013) ranks the Netherlands high in terms of the legal right of recourse and in
the practice of enforcement, see Figure 23.
Figure 23: Recourse ranking
Source: adapted from Moody’s (2013)
In the event the mortgage debt exceeds the sale proceeds of the house, the
lender retains the right to seek recourse against the debtor. Handing in the keys
to the house in exchange for full discharge of liability, as in some other coun-
tries, is not an option. Banks have full recourse to all the assets and income of
borrowers who default on their mortgage loan. The personal insolvency law in
the Netherlands is strict and austere. Since the banks’ right of recourse generally
does not expire, borrowers have a strong incentive to meet their financial obliga-
tions towards the mortgage lender.
In the rare case of a foreclosure, the actual process in the Netherlands can be
completed swiftly. Lenders do not need court approval to effect a dispossession.
They decide on a case-by-case basis whether to sell the house by auction (fast,
but possibly at a lower than anticipated price) or on the regular market, which
takes more time, but offers better chances of realizing a good price.
Central administration of all consumer loans
Dutch households may have a high LTI-ratio (at origination) on their mortgages,
yet high mortgage loans go together with low consumer loans. Some 89 percent
of total households’ loans is in the form of a mortgage (Figure 24), and thus
backed by collateral. This is the highest share in Europe.
lega
; stre
ngh
fot r
ecou
rse
practical application of recourse
average
strong
weak US
IRE
ESP UK
GER
NLFRAITA
weak average strong

The Dutch Mortgage Market 27
Figure 24: Share of mortgage loans in all loans to households
Source: European Banking Federation (2012)
All households’ debts are registered by the Bureau Krediet Registratie (Credit
Registration Office, BKR). This Office registers mortgage loans and other loans,
such as consumer loans and credit card loans, as well as payment arrears on
these loans. Arrears information is shared with lenders. An arrear notification
with the BKR counts as a serious signal. Notifications remain in the system for
five years. If the number of notification exceeds a threshold, borrowers are pre-
vented from taking out commercial loans.
This wide-ranging approach enables mortgage lenders to assess –at the moment
of origination– the customers’ Debt–to-Income (DTI) ratios, instead of the LTI ra-
tio, which is limited to mortgage loans. Banks take DTI into consideration in all
mortgage applications. The thorough assessment procedure has kept the portfo-
lios of Dutch mortgage lenders relatively free from bad risks.
The National Mortgage Guarantee Scheme (NHG)
More than twenty-five percent of Dutch mortgages and over seventy percent of
mortgage loans granted in 2013, were closed under a guarantee scheme, man-
aged by the Waarborgfonds Eigen Woningen (WEW).15 This fund, backed by the
Dutch government, insures the residual debt following a foreclosure sale. As...……………………………15 This scheme was originally aimed at providing starters and lower income households
access to the housing market. In 2011 the price ceiling for participation in thescheme was raised as a stimulus for the housing market. The ceiling was loweredagain in 2014, but remains at a level high enough to accommodate about half of allnew mortgages.
0%
10%
20%
30%
40%
50%
60%
70%
80%
90%
100%
other loans mortgage

The Dutch Mortgage Market 28
from 2014, the first ten percent first loss risk is borne by the bank. In order to
get a claim approved, both the bank and the borrower have to demonstrate that
all possible steps have been taken to prevent foreclosure.
Banks benefit from this scheme by being able to claim a significant share of the
loss on the mortgage. Customers benefit by a lower interest rate and –provided
the claim is granted– by having the banks’ right of recourse relinquished after
foreclosure. A from 1997, in order to qualify for an NHG guarantee, mortgages
may consist of no more than fifty percent of I/O-loans.
Skin in the game
In the Netherlands, the lion’s share of mortgage loans remains on the banks’
balance sheets. In securitizations and in NHG-backed mortgages, lenders almost
always retain the first loss risk. This greatly reduces the risk of moral hazard.
Since they cannot shift the full risk to investors, lenders cannot focus on sales
volume whilst ignoring risk.

The Dutch Mortgage Market 29
6 Reforms
Recently, the Dutch government embarked on a program of reforms in respect of
taxes, social security and pensions. The main aim of these reforms is to retain
the amenities of the system, yet in an affordable manner.
As shown in Chapter 5, the Dutch financial and welfare system includes a lot of
rules and benefits that are directly or indirectly aimed at mitigating the impact of
a fall in income for households, and other risks affecting the mortgage market.
Elements of this structure are regarded by many as rigidities, prohibiting espe-
cially the labour market and the housing market from working effectively.
As for the mortgage market, the new regulations are aimed at limiting risk, e.g.
by encouraging less borrowing and more repayment of mortgage loans. For new
mortgage loans, a maximum share of fifty percent ‘interest only’ is allowed.
Tax deductibility is only granted if the entire mortgage is actually paid off
through an annuity or a linear scheme. This makes new I/O loans de facto infea-
sible. The amount of the tax subsidy has been cut: the maximum marginal rate
at which interest can be deducted, will be gradually decreased from 52 percent in
2013 to 38 percent in 2040, both for incumbent and new mortgages.
LTI and LTV at origination are limited further. In 2014, the maximum allowed LTV
is 104 percent. The maximum will be brought down stepwise to hundred percent
in 2018.
Mortgage regulation and tax measures have a direct impact on the mortgage
market. Other reforms concern the labour market, e.g. a gradual curtailment of
job protection, and a limit on severance pay. The pension system is reformed,
e.g. pension age is raised from 65 to 67, and there is a shift from DB- to DC-
based pension schemes. On the housing market rent controls are liberalised.
A major challenge lies in adapting the Dutch welfare system to the increasing
number of temporary workers and self-employed.
The reforms are meant to improve the way the labour market and the housing
market work. The curtailing of tax deductibility and job security increased the
risk in the mortgage market. These additional risks are offset by tighter mort-
gage rules for new borrowers. However, the most important factor regarding the
impact of the reforms on mortgage risk, is the fact that these reforms will be
implemented gradually. A long transition period, taking up to 25 years for some
elements, will allow the markets to absorb the new rules without too much upset.

The Dutch Mortgage Market 30
7 Conclusion
The Dutch mortgage market is characterized by relatively high LTV and LTI-
levels, amongst others caused by a tax subsidy on homeownership. The actual
risk for mortgage borrowers and lenders is mitigated by the institutional setting
of the market:
an elaborate pension system;
a system of job protection and unemployment benefits;
a strong legal position for lenders;
a credit history check and affordability check for those applying for a new
mortgage; and
the National Mortgage Guarantee Scheme.
The Dutch banks’ mortgage portfolios have held up relatively well during the re-
cent economic crisis. Operating income on mortgages has been sufficient to cov-
er the losses. Foreclosures and losses remain, despite a significant increase, at a
relatively low level compared to other countries.
A program of reforms has been initiated. Some of these have a negative impact
on affordability for homeowners and on the mortgage risks for banks. However,
these measures are to be implemented gradually over a long period of time and
in parallel with the reduction of LTVs. This allows the market to absorb the
measures without too much upset.

The Dutch Mortgage Market 31
Appendix: ReferencesAutoriteit Consument & Markt (2013) Lock-in leidt niet tot uitbuiting van
hypotheekklanten, Den Haag: ACM.
Bureau Kredietregistratie (2014) BKR Hypotheekbarometer, April 24, Tiel: BKR.
Commissie Structuur Nederlandse Banken (2013) Naar een dienstbaar en stabielbankwezen.
Dutch Central Bank (2011) Overview of Financial Stability – Autumn 2011,Amsterdam: DNB.
Dutch Central Bank (2013) Economische Ontwikkelingen en Vooruitzichten,Amsterdam: DNB.
Dutch Central Bank (2014) Overview of Financial Stability – Spring 2014,Amsterdam: DNB.
Dijk, M. van (2013) Verliesaversie op de woningmarkt, The Hague: CPB.
Haffner, M. & K. Dol (2011) Internationale vergelijking van woonuitgaven metEU-SILC, Delft: OTB.
European Central Bank (2009) Housing Finance in the Euro Area, Frankfurt: ECB.
European Central Bank (2013) Financial Stability Review, Frankfurt: ECB.
European Banking Federation (2012) Study on Internal Rating Based (IRB) modelsin Europe; Residential Mortgages, Brussels: EBF.
European Mortgage Federation (2012) Hypostat 2011, Brussels: EMF.
Fitch (2013), Fitch Residential Mortgage Briefing, London: Fitch Ratings.
Fitch (2014), Mortgage Market Index – Netherlands 1Q 2014, London: Fitch Ratings.
International Monetary Fund (2013) Kingdom of the Netherlands, 2012 Article IVConsultation, Washington: IMF.
Janssen, J., M. Bijlsma, M. Kruidhof & C. Pattipeilohy (2013) Financieringsproblemenin de hypotheekmarkt, Amsterdam: DNB Occasional Studies.
Ministerie van Binnenlandse Zaken en Koninkrijksrelaties (2014) ‘Update ontwik-kelingen restschulden’, Letter to the Dutch Parliament, March 20, 2014.
Ministerie van Financiën (2012) ‘Analysebijlage bij Visie toekomstbestendigheidhypotheekrenteaftrek’, Letter to the Dutch Parliament, May 25, 2012.
Moody’s (2013) Dutch RMBS: Market exposure to full interest-only loans ismoderate¸ London: Moody’s.
Moody’s (2014) Flexible mortgage lending to self-employed borrowers is creditpositive for Dutch RMBS¸ London: Moody’s.
OTB (2014) Monitor koopwoningmarkt 4e kwartaal 2013, Delft: OTB.
Statistics Netherlands (2013) Nieuwsbrief Hypotheken, Vol.3, nr. 1,The Hague: CBS.
StatLine, Statistics Netherlands Online, http://statline.cbs.nl/statweb/?LA=en.

The Dutch Mortgage Market 32