the differential effect of revenue rises and cost...
TRANSCRIPT

The Differential Effect of Revenue Rises and Cost Savings on
Investors’ Valuation of Growth Options.
Evidence from a comparative case in the electricity business
ABSTRACT:
This paper seeks to analyze the way investors consider growth option values when pricing
equity. To achieve this objective we study the effect on stock prices of a comparative case of
direct foreign investment involving acquisition of two different growth options, whose valuation
has already been well-documented in prior literature. The case consists of the two sequential
investment stages carried out in the Chilean group Enersis by the Spanish electricity company
Endesa in the second half of the 1990s. The effect of growth option values on investors’
expectations is analyzed on the basis of the abnormal returns in the period around the time of
the investment announcement. Our results show that a growth option which value comes from
future rise in sales has a greater impact on stock returns than that of a growth option whose
value is based on cost savings.
Key words: real options; corporate valuation; abnormal returns, case study; capital budgeting.
JEL: G31
2
1. INTRODUCTION
This paper analyzes the impact of real options value on stock prices. According to the real
options approach, the market value of a firm’s equity, 0E , is the sum of the present value of assets-
in-place attributable to its shareholders, AiP0E , and the present value of its growth option portfolio,
GO0E :
GO0
AiP00 EEE [1]
Assets-in-place (henceforward AiP) refers to the commitments already carried out by the
firm: that is, current investment already accepted. The value of this component is derived from the
stream of cash-flow generated over time, and equals what the traditional discounted cash-flow
(DCF) model attributes to the company as a whole. However, the value of a firm’s liabilities
comes not only from the ownership of cash-flow as generated by a given resource allocation, but
rather from ownership of the resources themselves and, hence, from cash-flow as generated by
any other alternative allocation (Andrés et al., 2005). Growth option (henceforward GO) portfolio
refers to these rights to decide the allocation of resources which have value, to the extent that they
affect future cash-flow. Estimation of this source of value is the principal object of the real options
approach.
In an efficient market, a change in any of these corporate sources of value, such as that
derived from a new investment, should be reflected in stock prices and, therefore, in market
returns. Prior empirical literature has analyzed the relevance of GO values mainly through
evidence provided by case study research. Focusing on the valuation of GOs embedded in a
particular investment presents the advantage of enabling study of the value creation process in
depth and the variables on which it depends1. Some evidence also exists for addressing the impact
of real options on market values by means of indirect approximation in a sample of firms
assuming efficient markets (Kester, 1984; Berger et al., 1996; Danbolt et al. (2002); Andrés et al.,
2006; Alessandri et al., 2007).
However, one issue which remains unexplored is analysis of the impact of real options
value on stock prices from the perspective of market inefficiencies. Previous empirical findings of
market anomalies, such as size, calendar, momentum or value effect, among others, raise the
question of whether stock prices correctly reflect the GO value. Our objective is to analyze the
relation between a firm’s stock prices and the value of its GOs. Our interest stems from the
1 Numerous case studies have been carried out in the area of natural resources due to the greater availability of information (Sick, 1989). More recently, this evidence has extended to biotechnology (Micalizzi, 1999; Kellogg and Charnes, 2000; Stark, 2001; León and Piñeiro, 2004; Rubio and Lamothe, 2006), Internet portals (Sáenz-Diez, 2004), taxi licenses (Albertí et al., 2003), sea ports (Juan et al., 2001), real estate investment (Rocha et al., 2007) and automobile component suppliers (Azofra et al., 2004).
3
intuition that even if equation (1) were right, not all types of GOs should be valued in a correct
manner by investors. The reasons for the mispricing of a firm’s portfolio of GOs may be various
and range from market inefficiencies to investor biases.
In the presence of information inefficiencies, we should consider that investors might
attach different value attributes to equivalent sources of value. Swaminathan and Weintrop
(1991) and Ertimur et al. (2003) find that investors react more strongly to an earnings surprise
that is induced by a dollar of sales increase than by a dollar of cost savings. Furthermore,
Ertimur et al. (2003) provide evidence that these differential market reactions are stronger in the
case of growth companies (which are in the initial stages of their life cycle) than in the case of
value firms. A possible explanation for this asymmetry is that investors interpret information as
a sign of the persistence and/or noise and react more strongly to any surprise which is more
permanent and/or less noisy (Ertimur et al., 2003; Berger, 2003).
This evidence suggests that investor reactions may differ when valuing a firm’s GOs,
depending on its main value source. The value attained by a company from exercising a GO
may increase mainly from two sources: an increase in its revenues or a saving in costs. To the
extent that a revenue increase is more frequent in the initial stages of a firm’s life cycle, it may
be considered a more permanent source of value. Similarly, since an expense reduction is more
typical in the latter stages of a company’s life cycle, its effect on value may be considered less
recurrent or more transitory. This effect may be greater in the presence of market inefficiencies
and information problems, as investors will be more prone to interpret all types of signs in order
to generate their return expectations.
Therefore, we posit the hypothesis that, in the presence of information problems,
investor reactions are stronger for the acquisition of a GO whose value comes from a sales
increase than for the acquisition of a GO whose value is based on cost savings. We evaluate this
hypothesis by analysis of the returns in a period of time around the announcement of two
sequential corporate investment decisions which involve the acquisition of different GOs. This
case consists of actual investments implemented by the Spanish company Endesa when trying to
take control of the Chilean electricity group Enersis in the second half of the 1990s. We
consider that the study of stock price variations associated with a firm’s two consecutive
investments is an appropriate research strategy for two main reasons. Firstly, focusing on a case
study makes it easier to attain the value of GO, which is otherwise an almost unobservable
variable. And secondly, examining the effect of two GO acquisitions undertaken close in time
and by the same firm, but different in the nature of their value source, allows us to isolate and
compare in depth the relevant evidence for the problem under consideration.
The cases analyzed are representative of those investments known as “strategic” or

4
“necessary” which are accepted despite their negative Net Present Value (henceforward, NPV).
These investments could reflect a particular case of the agency problem of free cash flow. In
fact, other authors, such as Trillas (2001), have analyzed this same operation, concluding that it
was a sub-optimal investment which destroyed value for the shareholders. However, it could
also reflect an efficient decision with a strategic value beyond the expected value of direct cash
flows, which comes from new opportunities opened up for the firm, as shown by Alonso et al.
(2009a and 2009b)2. These two papers analyze the initial and final investment in Enersis,
respectively, and interpret each of them as a means of improving the value of Endesa’s GOs in
the Latin American electricity business. Our analysis is based on the research results reported in
these previous papers and explores the relation between real option value estimates and stock
price movements.
These two investments match the criteria of providing GOs of a different nature and,
therefore, are representative of the phenomenon studied. The first investment involved acquiring
29.04% of Enersis equity plus the option to control its future GOs in the Latin American
market. Specifically, Endesa would obtain the option to invest in the Brazilian electricity
distribution market. The value resulting from this option exercise emerged mainly from the
increase in sales. The second investment was designed to gain majority control of Enersis. This
control provided Endesa with the option of taking control of the generating company, Endesa
Chile, through the Chilean holding itself. The benefits to emerge from the exercise of this option
were based mainly on cost savings as a consequence of both the integration of production and
distribution operations and the transfer of Endesa’s experience as an efficient vertically
integrated company.
Our analysis shows that the sign and significance of cumulative abnormal returns
(henceforward CARs) in windows close to the announcement of the investment depend on the
nature of the GO. In the case of the first investment in Enersis, which was designed to gain
control over future sales growth, the CARs, above all in the days prior to the announcement, are
statistically significant and positive. Meanwhile, in the second investment, the CARs obtained in
the days prior to the announcement are statistically not different from zero, but those CARs
obtained in the days following the announcement are significant and clearly negative. In this
case, the major benefits to emerge from the GO exercise were felt to be the expense reductions
achieved by the transfer of Endesa’s know-how.
The remainder of the paper is structured as follows: Section 2 describes the
methodology; Section 3 explains the main characteristics of the comparative case where we
2 There is a third possible explanation based on managerial overconfidence: Overconfident managers tend to overestimate the accuracy of available information and their ability to control, leading them to the acceptance of unprofitable investments (Gervais, 2010).
5
present the analysis of the CARs of Endesa shares; we show the relation between them and
estimated GO values in Sections 4 and 5, respectively, for the first and second investments;
Section 6 discusses the main findings and Section 7 concludes the study.
2. METHODOLOGY
Under the efficient market hypothesis, any change in the nature of the components in
Equation (1) should be reflected in the market value of shares. This means that any
announcement of such a variation should imply a change in expected returns and, consequently,
in stock prices. Accordingly, we analyze the relation between the announcements of the two
corporate investments carried out by Endesa, their AiP and GO imputed values, and stock
prices.
To assess the pricing effects of these events, we estimate the CAR in a time window
around the announcement dates of both investments. We obtain the CAR for different periods of
time around each date of the announcement. The CAR from Day t1 before the announcement
date to Day t2 after the announcement date is calculated by adding the daily abnormal returns
(henceforward AR):
2
1
),( 21
t
tttARttCAR
We compute ARt as the difference between the observed return (Rt) and the “normal” or
risk-adjusted return, as shown in the following equation:
tMtt RRAR ,*ˆˆ [2]
where ̂ and ̂ are the ordinary least squares (OLS) estimated coefficients for the market
model:
ttMt RR ,* [3]
RM,t being the market return, α the expected return which is independent of the market, β the
beta coefficient and, finally, t a mean zero disturbance with a time invariant constant. We
compute normal returns using a period of 180 days of returns prior to the event window which
is used in the calculation of the CAR. As the market return, we use the IBEX-35 Index return.
The significance of the CARs is analyzed by means of the t statistic, in such a way that, if they
are significant, the hypothesis that the CARs are equal to zero is rejected.
To explore, firstly, the impact of these investments on Endesa’s AiPs and GOs values,
and, secondly, the relationship between the variation of the latter and the variation of Endesa
stock prices, we use the findings in Alonso et al. (2009a and 2009b). In these papers, the value
of the AiPs was estimated by using an adaptation of the Kester model (1984) and expected
6
earnings per share from analysts’ mean consensus forecast in the I/B/E/S historical database.
Values of the GO embedded in these investments were estimated by using an adaptation of the
proposal by Longstaff and Schwartz (2001). In Appendix 1 and 2, we present the main valuation
assumptions, inputs and results for both AiPs and GOs values carried out, respectively, in
Alonso et al. (2009a and 2009b).
3. THE INVESTMENT CASES
Announcement of the investment agreement signed between heads of Endesa and
Gestores Clave (a small number of executives who exercised effective control of the Enersis
Board) took place on 30 July, 1997. This initial agreement allowed the Spanish company to
acquire a significant share of Enersis equity and to attain control over its future foreign
investment opportunities, in exchange for the payment of 1,500 million dollars. The main terms
of this deal were the following: in the first place, Endesa would obtain a majority of equity in
Chispas, the second largest shareholder in Enersis, by paying a present value of 1,000 million
dollars for the “ownership rights” associated with the stake of employees or previous employees
of Enersis. Secondly, Endesa would sign certain management contracts with the Key Managers
to obtain the “decision rights” by paying a present value of 500 million dollars. Finally, the
agreement also included the setting up of Endesis whose mission was to channel the investment
of Endesa and Enersis in Latin-American. In accordance with that established, Endesa would
control 55% of Endesis while the remaining 45% would be controlled by the Chilean group.
Despite its initial plans, Endesa’s primary investment did not allow them to obtain the
desired control of Enersis. The main reason was distrust which arose amongst the shareholders
of Enersis with regard to the clauses of the initial deal. Three months after this agreement, at the
end of October 1997, an extensive review of the agreements signed took place, the main
consequence for Endesa being the loss of the decision rights linked to the Key Managers’ stake,
although it maintained the ownership rights acquired. A new way of deciding future joint
investments was established which involved individual study of each opportunity and equal
shareholding of both groups. In exchange, the breaking of the initial agreements freed the
Spanish company from paying 250 million dollars. But the situation after renegotiation did not
respond to the expectations of Endesa: 1,250 million dollars had been spent to acquire 29% of
the ownership rights and 0% of the control rights of Enersis. The Spanish company was the
main shareholder in Enersis in terms of ownership rights but it controlled only three of the
seven members of the Board of Directors.
This situation was maintained for one year. In this period, the second main shareholder
in Enersis, the Pension Fund Administrators (PFAs), exercised effective control of the Board.
The objectives of the PFAs were clearly different from those of the Spanish company: while the

7
aim of Endesa was to use Enersis as a vehicle through which to channel future investments in
Latin America, the PFAs – without the financial ability to undertake the expansion plans of
Endesa – were interested in selling its stake in Enersis and its affiliated generating company,
Endesa Chile.
At the end of December, 1998, the Enersis Board of Directors proposed the sale of its
stake in Endesa Chile, which reached 25.3% of the equity, in order to improve Enersis cash
flows. This announcement caused great tension amongst Enersis shareholders since it involved a
direct reverse of Endesa´s expansion plans. In consequence, on 23 January, 1999, the Spanish
company launched a takeover bid for 32% of Enersis at a price of 1,450 million dollars to attain
control of the company and thus try to avoid having to disinvest in Endesa Chile.
The investment of Endesa in Enersis equity allows us to identify two different
investment cases with their own implications for both sources of value: AiP and GO. These two
events correspond, respectively, to the initial agreement announced on 30 July, 1997 and the
announcement of the second takeover bid for Enersis on 23 January, 1999. The initial
investment agreement with Enersis allowed Endesa to acquire 29.04% of the cash flows which
the Chilean Group AiPs were expected to generate. Further, it allowed the Spanish company to
control future GOs of Enersis in the Latin American market. In consequence, the Extended NPV
derived from initial investment in Enersis equity is the result of comparing the outlay of 1,500
million dollars with the sum of the present value of the AiPs and the present value of the GO
portfolio. The benefits to emerge from the exercise of this option were based on the increase in
future cash-flows as a consequence of the spread of Enersis operations in Latin America. This
option arose from the privatization of the electrical distribution business announced by the
Brazilian government in July, 1997 and sequentially accomplished in the following 5 years.
The last and definitive round in Endesa’s takeover of Enersis began with the decision of
the Enersis Board to dispose of Enersis’ stake in Endesa Chile. The impossibility of setting in
motion the management model sought by the Spanish electricity company in Enersis brought
about the launch of a takeover bid for the Chilean group which, were it successful, would have
allowed Endesa to acquire 32% of the cash flows to be generated by Enersis AiPs. More
importantly, it would confer on Endesa control over management of the future GOs of the
group, the investment option in Endesa Chile being the most imminent of those opportunities.
The benefits to emerge from the exercise of this option were based mainly on cost savings, both
from vertical integration of production and distribution and transfer of Endesa know-how and its
wide experience as a vertically integrated company.
8
4. STOCK PRICES AND THE OPTION TO INVEST IN BRAZIL
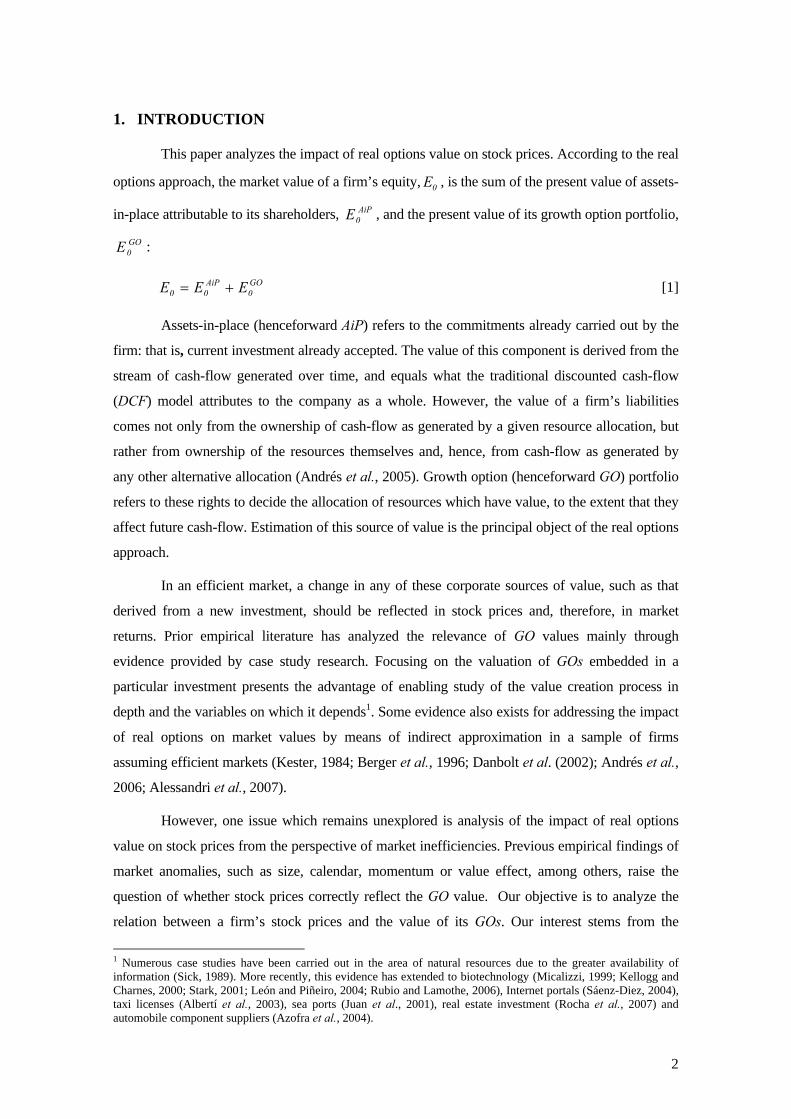
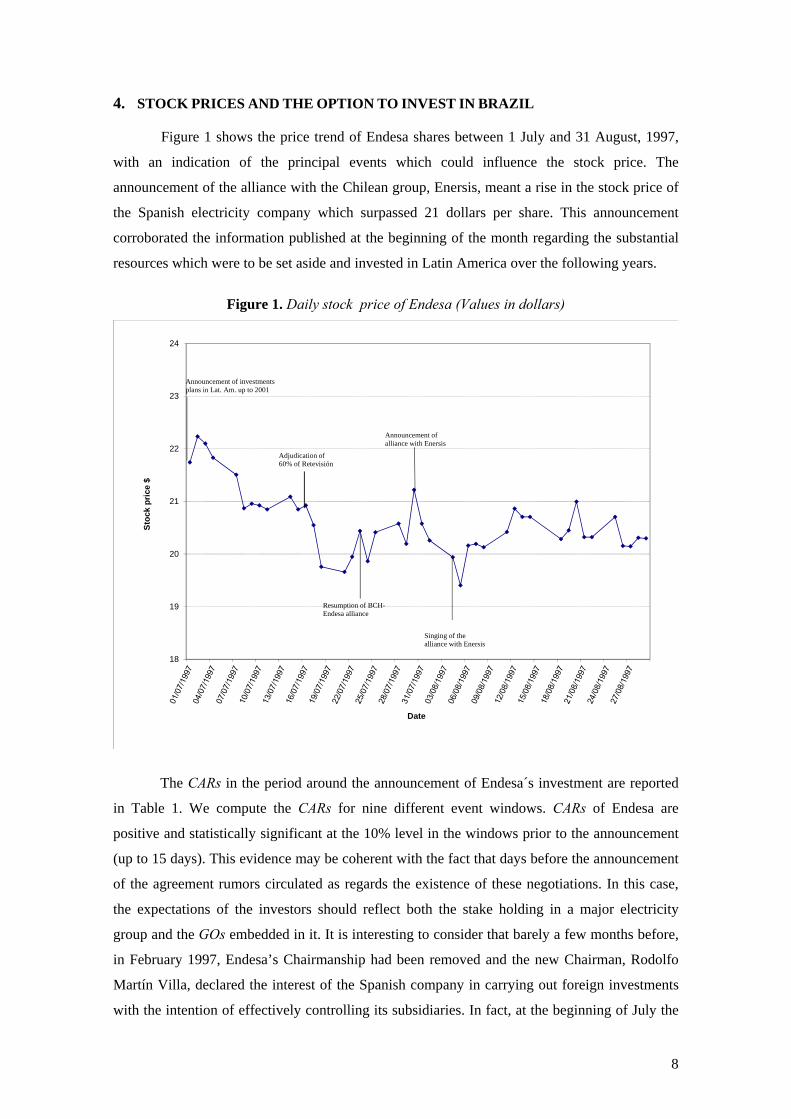
Figure 1 shows the price trend of Endesa shares between 1 July and 31 August, 1997,
with an indication of the principal events which could influence the stock price. The
announcement of the alliance with the Chilean group, Enersis, meant a rise in the stock price of
the Spanish electricity company which surpassed 21 dollars per share. This announcement
corroborated the information published at the beginning of the month regarding the substantial
resources which were to be set aside and invested in Latin America over the following years.
Figure 1. Daily stock price of Endesa (Values in dollars)
The CARs in the period around the announcement of Endesa´s investment are reported
in Table 1. We compute the CARs for nine different event windows. CARs of Endesa are
positive and statistically significant at the 10% level in the windows prior to the announcement
(up to 15 days). This evidence may be coherent with the fact that days before the announcement
of the agreement rumors circulated as regards the existence of these negotiations. In this case,
the expectations of the investors should reflect both the stake holding in a major electricity
group and the GOs embedded in it. It is interesting to consider that barely a few months before,
in February 1997, Endesa’s Chairmanship had been removed and the new Chairman, Rodolfo
Martín Villa, declared the interest of the Spanish company in carrying out foreign investments
with the intention of effectively controlling its subsidiaries. In fact, at the beginning of July the
18
19
20
21
22
23
24
Sto
ck p
rice
$
Date
Adjudication of 60% of Retevisión
Resumption of BCH-Endesa alliance
Announcement of alliance with Enersis
Singing of the alliance with Enersis
Announcement of investments plans in Lat. Am. up to 2001

9
investment plans in Latin America over the coming years were made public with a forecast
investment of over 2,500 million dollars. In consequence, we may consider that the positive
abnormal returns constitute evidence in favor of the relevance of the value of the GOs which
investors attribute to investment in the Chilean group.
Table 1. Cumulative abnormal returns around the announcement of Endesa´s initial investment in Enersis
This table presents the cumulative abnormal return around the announcement of the investment. Risk adjusted returns are obtained using the market model regression, which reports -0.0006125ˆ , 1.2436ˆ and 35.157%R2 .
Accumulation period CAR Average AR CAR Deviation t-statistic p-value (-20; 0) 5.439% 0.259% 0.013 0.893 0.394 (-15; 0) 10.381% 0.601% 0.011 2.086 0.061(*) (-10; 0) 8.831% 0.803% 0.012 2.192 0.063(*) (-20; +20) 6.418% 0.196% 0.013 0.989 0.328 (-15; +15) 12.670% 0.433% 0.012 2.025 0.050(**)(-10; +10) 9.792% 0.523% 0.014 1.739 0.097(*) (-5; +5) 7.988% 0.726% 0.015 1.507 0.163 (-5; +10) 8.927% 0.558% 0.013 1.661 0.129 (0; +10) 1.298% 0.118% 0.014 0.288 0.789 ***Significant at the 0.01 level. **Significant at the 0.05 level. *Significant at the 0.10 level.
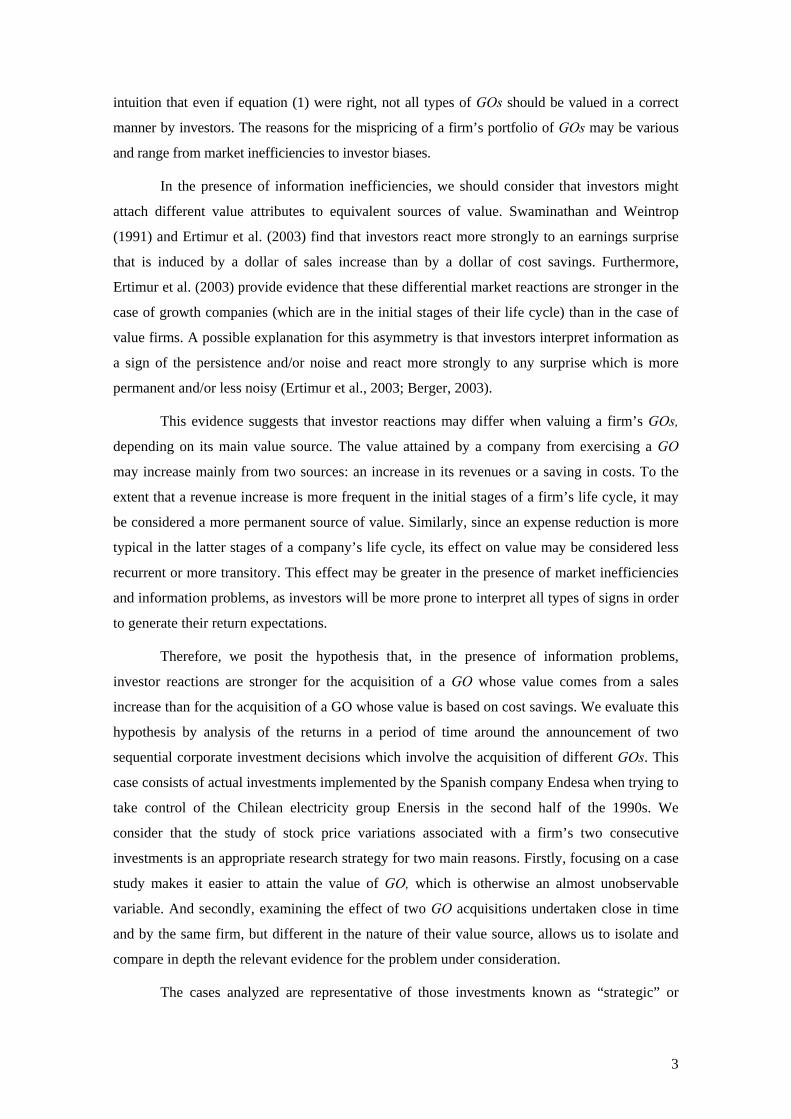
Figure 2 presents the sensitivity of the valuation of the AiP to change in the perpetual
growth rate of cash-flows according to the model in Alonso et al. (2009a). Estimated NPV vary
between minus 835,259,908.42 dollars (which corresponds to a value of minus 0.8031 dollars
for each share in Endesa) when the growth rate is nil (g = 0%), and 472,661,226 dollars (0.4545
dollars for each share in Endesa) when growth rate is six per cent (g = 6%). These results show
that, except for unlikely high values of g, the estimated NPV does not justify per se the
investment decision of Endesa and, therefore, neither a positive change in stock prices in the
period around the announcement of the operation.
Figure 2. NPV per Endesa share of the initial investment in Enersis (Values in dollars)
Results in Table 2 relate the CARs in the period around the time of the investment
announcement and the weight of the investment value attributable to each Endesa share. To
-0,80-0,73
-0,63-0,51
-0,32
-0,04
0,45
-1,00
-0,80
-0,60
-0,40
-0,20
0,00
0,20
0,40
0,60
0% 1% 2% 3% 4% 5% 6%
Val
ue
per
En
des
a sh
are
(do
llars
)
Perpetual growth of the cash flows
10
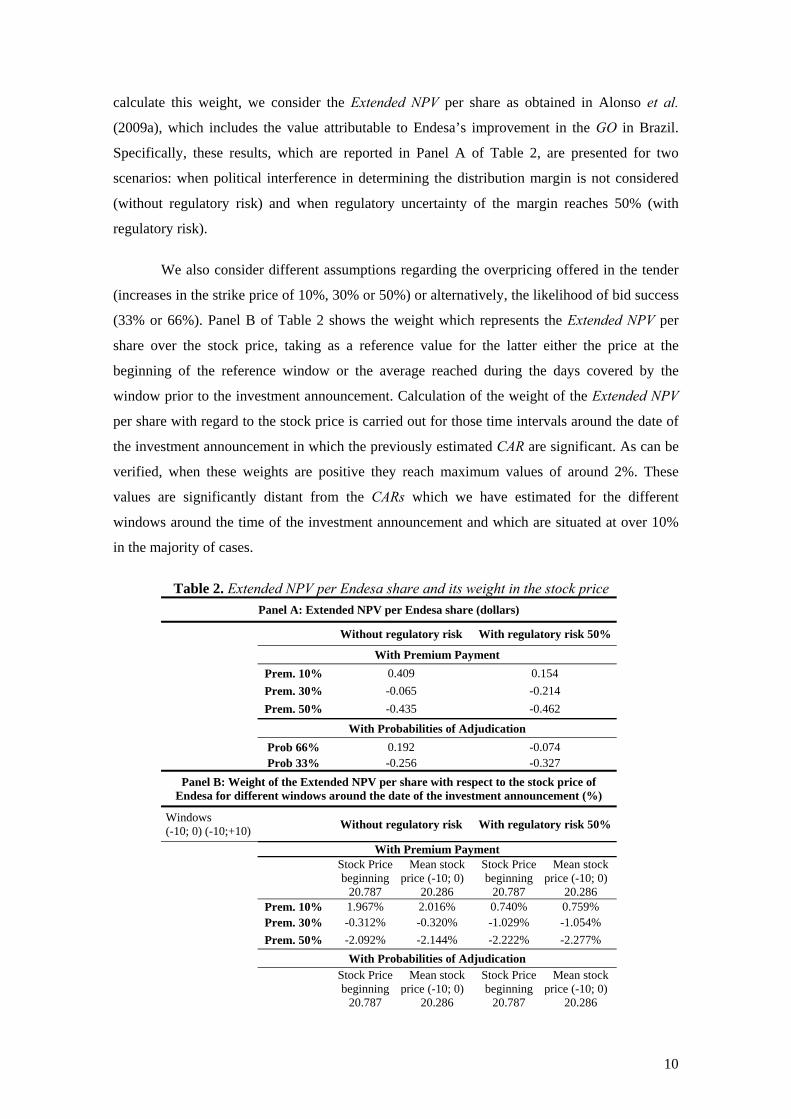
calculate this weight, we consider the Extended NPV per share as obtained in Alonso et al.
(2009a), which includes the value attributable to Endesa’s improvement in the GO in Brazil.
Specifically, these results, which are reported in Panel A of Table 2, are presented for two
scenarios: when political interference in determining the distribution margin is not considered
(without regulatory risk) and when regulatory uncertainty of the margin reaches 50% (with
regulatory risk).
We also consider different assumptions regarding the overpricing offered in the tender
(increases in the strike price of 10%, 30% or 50%) or alternatively, the likelihood of bid success
(33% or 66%). Panel B of Table 2 shows the weight which represents the Extended NPV per
share over the stock price, taking as a reference value for the latter either the price at the
beginning of the reference window or the average reached during the days covered by the
window prior to the investment announcement. Calculation of the weight of the Extended NPV
per share with regard to the stock price is carried out for those time intervals around the date of
the investment announcement in which the previously estimated CAR are significant. As can be
verified, when these weights are positive they reach maximum values of around 2%. These
values are significantly distant from the CARs which we have estimated for the different
windows around the time of the investment announcement and which are situated at over 10%
in the majority of cases.
Table 2. Extended NPV per Endesa share and its weight in the stock price
Panel A: Extended NPV per Endesa share (dollars)
Without regulatory risk With regulatory risk 50%
With Premium Payment
Prem. 10% 0.409 0.154
Prem. 30% -0.065 -0.214
Prem. 50% -0.435 -0.462
With Probabilities of Adjudication
Prob 66% 0.192 -0.074 Prob 33% -0.256 -0.327
Panel B: Weight of the Extended NPV per share with respect to the stock price of Endesa for different windows around the date of the investment announcement (%)
Windows (-10; 0) (-10;+10) Without regulatory risk With regulatory risk 50%
With Premium Payment
Stock Price beginning
20.787
Mean stock price (-10; 0)
20.286
Stock Price beginning
20.787
Mean stock price (-10; 0)
20.286 Prem. 10% 1.967% 2.016% 0.740% 0.759% Prem. 30% -0.312% -0.320% -1.029% -1.054%
Prem. 50% -2.092% -2.144% -2.222% -2.277%
With Probabilities of Adjudication
Stock Price beginning
20.787
Mean stock price (-10; 0)
20.286
Stock Price beginning
20.787
Mean stock price (-10; 0)
20.286
11
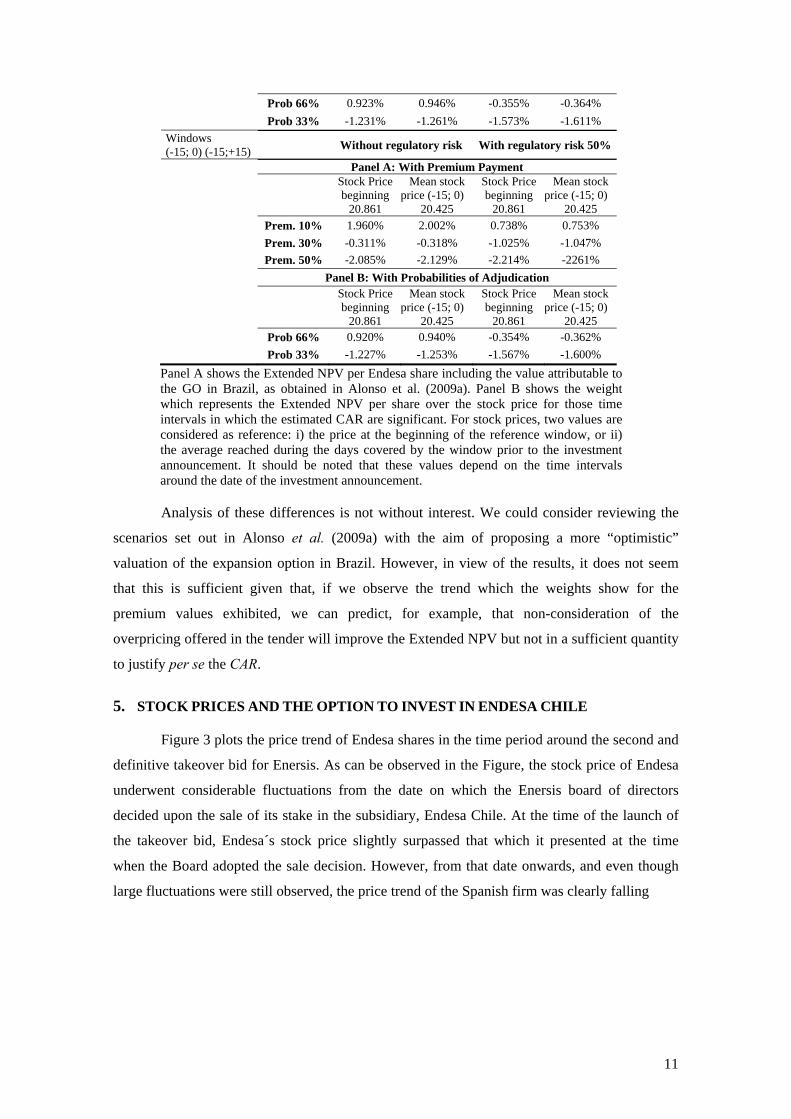
Prob 66% 0.923% 0.946% -0.355% -0.364%
Prob 33% -1.231% -1.261% -1.573% -1.611%
Windows (-15; 0) (-15;+15) Without regulatory risk With regulatory risk 50%
Panel A: With Premium Payment
Stock Price beginning
20.861
Mean stock price (-15; 0)
20.425
Stock Price beginning
20.861
Mean stock price (-15; 0)
20.425 Prem. 10% 1.960% 2.002% 0.738% 0.753%
Prem. 30% -0.311% -0.318% -1.025% -1.047%
Prem. 50% -2.085% -2.129% -2.214% -2261%
Panel B: With Probabilities of Adjudication
Stock Price beginning
20.861
Mean stock price (-15; 0)
20.425
Stock Price beginning
20.861
Mean stock price (-15; 0)
20.425 Prob 66% 0.920% 0.940% -0.354% -0.362%
Prob 33% -1.227% -1.253% -1.567% -1.600%
Panel A shows the Extended NPV per Endesa share including the value attributable to the GO in Brazil, as obtained in Alonso et al. (2009a). Panel B shows the weight which represents the Extended NPV per share over the stock price for those time intervals in which the estimated CAR are significant. For stock prices, two values are considered as reference: i) the price at the beginning of the reference window, or ii) the average reached during the days covered by the window prior to the investment announcement. It should be noted that these values depend on the time intervals around the date of the investment announcement.
Analysis of these differences is not without interest. We could consider reviewing the
scenarios set out in Alonso et al. (2009a) with the aim of proposing a more “optimistic”
valuation of the expansion option in Brazil. However, in view of the results, it does not seem
that this is sufficient given that, if we observe the trend which the weights show for the
premium values exhibited, we can predict, for example, that non-consideration of the
overpricing offered in the tender will improve the Extended NPV but not in a sufficient quantity
to justify per se the CAR.
5. STOCK PRICES AND THE OPTION TO INVEST IN ENDESA CHILE
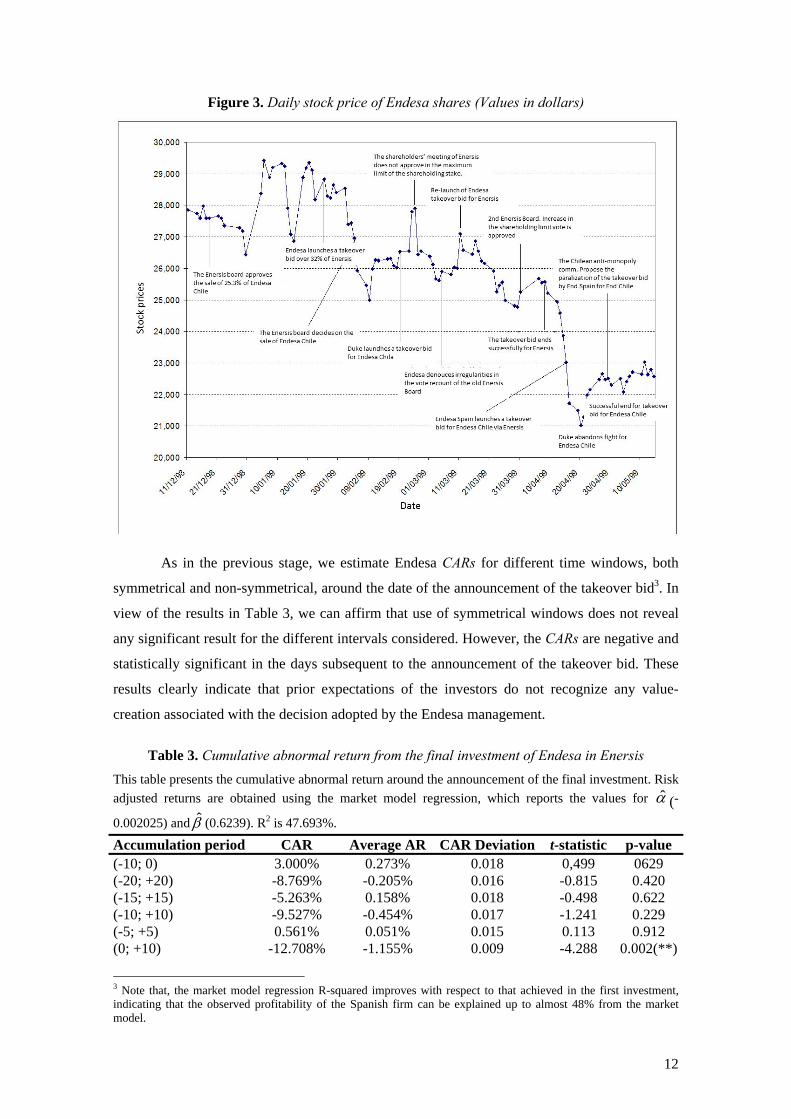
Figure 3 plots the price trend of Endesa shares in the time period around the second and
definitive takeover bid for Enersis. As can be observed in the Figure, the stock price of Endesa
underwent considerable fluctuations from the date on which the Enersis board of directors
decided upon the sale of its stake in the subsidiary, Endesa Chile. At the time of the launch of
the takeover bid, Endesa´s stock price slightly surpassed that which it presented at the time
when the Board adopted the sale decision. However, from that date onwards, and even though
large fluctuations were still observed, the price trend of the Spanish firm was clearly falling
12
Figure 3. Daily stock price of Endesa shares (Values in dollars)
As in the previous stage, we estimate Endesa CARs for different time windows, both
symmetrical and non-symmetrical, around the date of the announcement of the takeover bid3. In
view of the results in Table 3, we can affirm that use of symmetrical windows does not reveal
any significant result for the different intervals considered. However, the CARs are negative and
statistically significant in the days subsequent to the announcement of the takeover bid. These
results clearly indicate that prior expectations of the investors do not recognize any value-
creation associated with the decision adopted by the Endesa management.
Table 3. Cumulative abnormal return from the final investment of Endesa in Enersis
This table presents the cumulative abnormal return around the announcement of the final investment. Risk
adjusted returns are obtained using the market model regression, which reports the values for ̂ (-
0.002025) and ̂ (0.6239). R2 is 47.693%.
Accumulation period CAR Average AR CAR Deviation t-statistic p-value (-10; 0) 3.000% 0.273% 0.018 0,499 0629 (-20; +20) -8.769% -0.205% 0.016 -0.815 0.420 (-15; +15) -5.263% 0.158% 0.018 -0.498 0.622 (-10; +10) -9.527% -0.454% 0.017 -1.241 0.229 (-5; +5) 0.561% 0.051% 0.015 0.113 0.912 (0; +10) -12.708% -1.155% 0.009 -4.288 0.002(**)
3 Note that, the market model regression R-squared improves with respect to that achieved in the first investment, indicating that the observed profitability of the Spanish firm can be explained up to almost 48% from the market model.

13
(0; +15) -10.966% -0.731% 0.0128 -2.278 0.043(**)(0;+20) -10.387% -0.519% 0.013 -1.824 0.090(*) ***Significant at the 0.01 level. **Significant at the 0.05 level. *Significant at the 0.10 level.
To determine whether the value effect of the decision taken by the Endesa management
is properly reflected in its price variations we consider again the Extended NPV of this second
and definitive investment of Endesa in Enersis. This value should be obtained by subtracting the
1,450 million dollar outlay required in the takeover bid from the sum of the present value of
expected cash flows from AiPs and the value provided by the option to invest in Endesa Chile.
The value of AiPs is again determined by means of adaption of the Kester Model (1984) and the
option to invest in Endesa Chile is estimated via adaptation of the proposal of Longstaff and
Schwartz (2001), following Alonso et al. (2009b).4
Valuation of the AiP allows us to evidence its insufficiency when it comes to justifying
the decision adopted by the Spanish electricity company. Figure 4 plots the results of the
valuation of the investment for perpetual growth values of cash flows between 0% and 6%. The
NPV resulting from this second investment in Enersis, bearing in mind the tax saving generated
by the prearranged debt, varies between minus 963,915,820.37 dollars (which corresponds to a
value of minus 0.9268 dollars per Endesa share) when the perpetual growth rate is 0%, and
minus 593,670,002.76 dollars (minus 0.5708 dollars for each Endesa share) when the growth
rate is 6%.
Figure 4. NPV per Endesa share of the second investment in Enersis (Values in dollars)
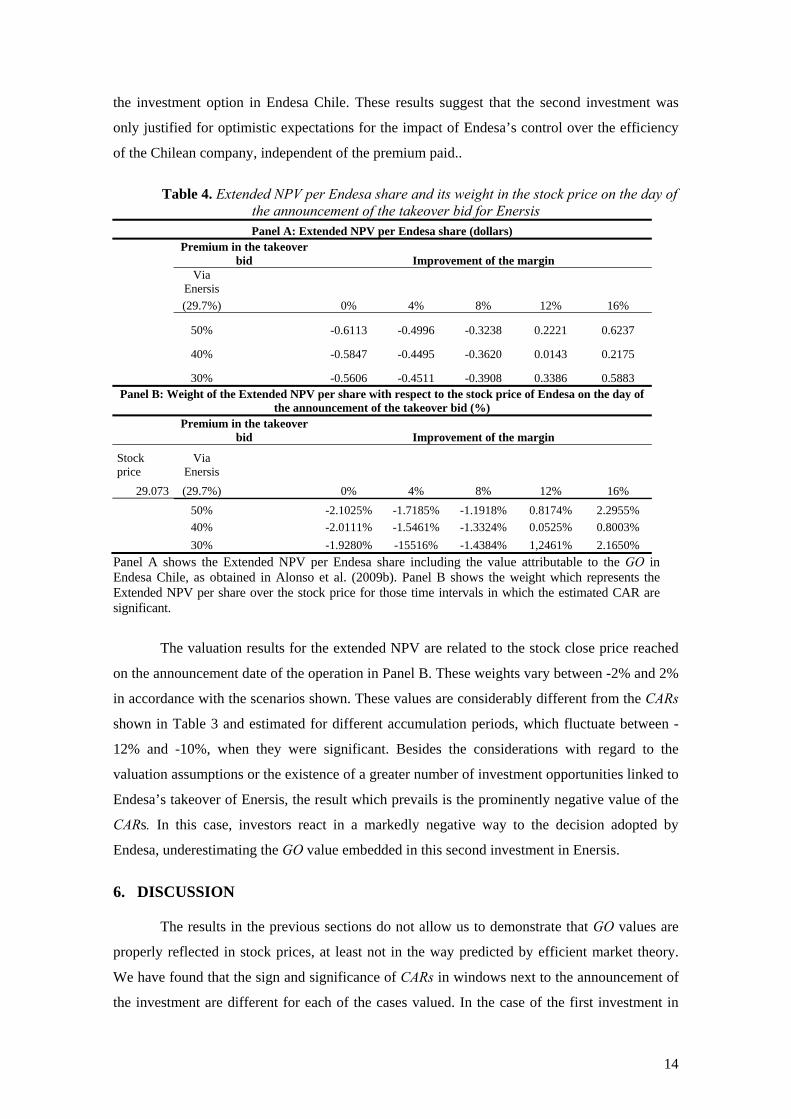
Panel A in Table 4 shows some of the results attained by Alonso et al. (2009b) with
regard to the Extended NPV per share. These values are computed for different assumptions
regarding the improvement in the margin5 and the premium which determines the strike price of
4 Appendix 2 summarizes the main hypotheses, parameters and valuation results carried out in this paper. 5 This margin improvement is due to the greater efficiency which was expected to be attributed to the management of Endesa Chile on the part of the Spanish company
-0,93 -0,90-0,86
-0,81-0,75
-0,67
-0,57
-1,00
-0,90
-0,80
-0,70
-0,60
-0,50
-0,40
-0,30
-0,20
-0,10
0,000% 1% 2% 3% 4% 5% 6%
Val
ue
per
En
des
a sh
are
(do
llars
)
Perpetual growth of the cash flows
14
the investment option in Endesa Chile. These results suggest that the second investment was
only justified for optimistic expectations for the impact of Endesa’s control over the efficiency
of the Chilean company, independent of the premium paid..
Table 4. Extended NPV per Endesa share and its weight in the stock price on the day of the announcement of the takeover bid for Enersis Panel A: Extended NPV per Endesa share (dollars)
Premium in the takeover
bid Improvement of the margin
Via
Enersis
0% 4% 8% 12% 16% (29.7%)
50% -0.6113 -0.4996 -0.3238 0.2221 0.6237
40% -0.5847 -0.4495 -0.3620 0.0143 0.2175
30% -0.5606 -0.4511 -0.3908 0.3386 0.5883 Panel B: Weight of the Extended NPV per share with respect to the stock price of Endesa on the day of
the announcement of the takeover bid (%)
Premium in the takeover
bid Improvement of the margin
Stock price
Via Enersis
0% 4% 8% 12% 16% 29.073 (29.7%)
50% -2.1025% -1.7185% -1.1918% 0.8174% 2.2955%
40% -2.0111% -1.5461% -1.3324% 0.0525% 0.8003%
30% -1.9280% -15516% -1.4384% 1,2461% 2.1650%
Panel A shows the Extended NPV per Endesa share including the value attributable to the GO in Endesa Chile, as obtained in Alonso et al. (2009b). Panel B shows the weight which represents the Extended NPV per share over the stock price for those time intervals in which the estimated CAR are significant.
The valuation results for the extended NPV are related to the stock close price reached
on the announcement date of the operation in Panel B. These weights vary between -2% and 2%
in accordance with the scenarios shown. These values are considerably different from the CARs
shown in Table 3 and estimated for different accumulation periods, which fluctuate between -
12% and -10%, when they were significant. Besides the considerations with regard to the
valuation assumptions or the existence of a greater number of investment opportunities linked to
Endesa’s takeover of Enersis, the result which prevails is the prominently negative value of the
CARs. In this case, investors react in a markedly negative way to the decision adopted by
Endesa, underestimating the GO value embedded in this second investment in Enersis.
6. DISCUSSION
The results in the previous sections do not allow us to demonstrate that GO values are
properly reflected in stock prices, at least not in the way predicted by efficient market theory.
We have found that the sign and significance of CARs in windows next to the announcement of
the investment are different for each of the cases valued. In the case of the first investment in
15
Enersis, which was designed to gain control over the future growth of sales, the cumulative
abnormal returns, above all in the days prior to the announcement, are statistically significant
and positive. This result could, therefore, evidence the effect of GOs on the valuations carried
out by investors. Meanwhile, in the second investment, the CARs obtained in the days prior to
the announcement are statistically not different from zero, but those CARs obtained in the days
following the announcement are significant and clearly negative.
The main difference between both cases is their main source of value. In the first case,
the embedded GO is defined on the stream of cash-flows that emerge from electricity
distribution in Brazil, as a consequence of its imminent privatization. When valuing this GO,
investors not only recognized the existence of future benefits associated with the discretionary
expansion in Brazil but also attributed to them a higher value than that derived from its
valuation by means of appropriate models and extensive information.
In the case of the option to invest in Endesa Chile, the major benefits emerging from its
exercise were felt to be the expense reductions achieved by improving efficiency of both Endesa
Chile’s operations and integration of distribution and generating businesses. The in-depth
analysis in Alonso et al. (2009b) reveals that this efficiency improvement was due to the
transfer of Endesa know-how and experience as a vertically integrated company. However, our
results indicate that investors did not consider this information when pricing Endesa stock prior
to the announcement. Furthermore, even after the announcement was made, investors
considerably underrated the value of this GO, even in the most pessimistic scenarios regarding
the transfer of efficiency and the size of the premium to be paid to gain control of Endesa Chile.
It should be mentioned in this respect that, at the time of the announcement of the
second investment, certain hurdles existed which conditioned its success, such as the need for a
reform of the statutes of the Chilean group in order to increase the maximum stake-holding.
This circumstance might have brought about a seemingly undervaluation of Endesa stocks due
to extreme pessimism on the part of investors. However, our results may be better explained by
the existence of information problems which made investors overreact differently to
economically equivalent events. In fact, our findings are in line with prior literature on investors
reacting differently to an earnings surprise induced by a dollar of sale increase and a dollar of
cost savings (Swaminathan and Weintrop, 1991; Ertimur et al., 2003). These previous works
explain such evidence as a consequence of the different persistence and/or noise of each of these
two sources of value: investors react more strongly to any surprise induced by a sale increase
because it is expected to be more permanent and/or less noisy than any surprise induced by a
equivalent cost saving (Ertimur et al., 2003; Berger, 2003). Furthermore, Ertimur et al. (2003)
provide evidence that these differential market reactions are stronger in the case of growth

16
companies than in the case of value firms.
Our results are consistent with these arguments. They show that investor perceptions regarding
future cash-flows to emerge from the exercise of these two GOs differed significantly. The in-
depth analysis of results in Alonso (2009a and b) reveals that there are no other marked
differences in both cases apart from the nature of their source of value. Both investment outlays
were alike: US$ 1,500 million, in the first case, and US$ 1,450 million, in the second. The
financial policies were also comparable: in the first case, 2/3 of the outlay was financed by debt
and, in the second case, the investment was totally financed by debt. Both projects reported
negative NPV and were considered as strategic investments by Endesa managers. Therefore, the
hypothesis of higher perceived persistence of a sales increase over that of a cost saving can be
seen as a highly credible explanation. There are potential alternative explanations for our
results. Apart from random hypotheses, another possible explanation deals with the increase in
investor pessimism as a consequence of the successive setbacks which occurred during the
operation. Future evidence from additional cases will enable us to shed light on a topic which
has important implications for equity valuation.
7. CONCLUSION
In this paper, we have sought to study how investors incorporate new information into
the valuations of GOs. Specifically, we analyze whether investors are more concerned about
specific GOs sources of value. A comparative case study may be considered an appropriate
research strategy to evaluate how similar GOs affect stock prices. Detailed analysis of sources
of value enables us to determine whether investors attach different value attributes to
comparable GOs and give a basis for discussing its possible explanations. Specifically, we
examine the valuation results reported by Alonso et al. (2009a and b) for the investments carried
out by the Spanish electricity company, Endesa, in the capital of the Chilean group, Enersis. The
takeover of the Chilean group involved two different investments with the consequent variation
in sources of value.
We estimate the CARs of Endesa shares in an interval around the time of the
announcement of both investments. Although the CARs are significant in both investments, in
the initial investment they are clearly positive and are obtained prior to the date of the
announcement, while, for the definitive investment, only the cumulative returns in the days after
the announcement are significant and, further, negative.
In the first investment, in which the CARs are positive, we can state that stock prices
may reflect GO values. On the other hand, evidence for the second case seems to indicate that
they did not consider GO values when pricing Endesa shares, or if they did, they valued the
embedded GO assuming that takeover of Endesa Chile would not lead to any substantial

17
improvements in its performance. Taking into account the differences between both GOs
embedded in these investments, our analysis has allowed us to observe that the market
overreacted positively (negatively) to the announcement of the acquisition of a GO whose value
emerges from a sales increase (expense saving). These results are in line with the intuition that
in the presence of information problems, investors tends to attach different value attributes to
available information regarding GOs, depending on their nature: GOs based on sale increases
seem to be interpreted as a more permanent source of value than GOs based on cost savings.
18
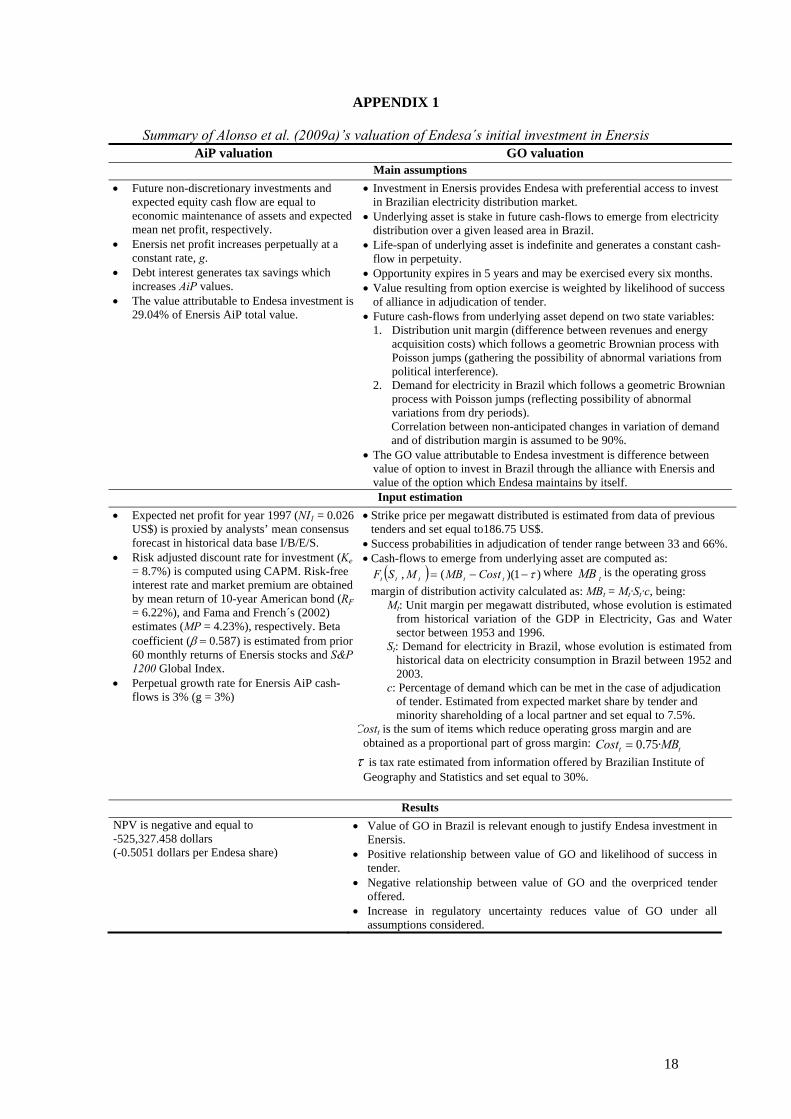
APPENDIX 1
Summary of Alonso et al. (2009a)’s valuation of Endesa´s initial investment in Enersis AiP valuation GO valuation
Main assumptions
Future non-discretionary investments and expected equity cash flow are equal to economic maintenance of assets and expected mean net profit, respectively.
Enersis net profit increases perpetually at a constant rate, g.
Debt interest generates tax savings which increases AiP values.
The value attributable to Endesa investment is 29.04% of Enersis AiP total value.
Investment in Enersis provides Endesa with preferential access to invest in Brazilian electricity distribution market.
Underlying asset is stake in future cash-flows to emerge from electricity distribution over a given leased area in Brazil.
Life-span of underlying asset is indefinite and generates a constant cash-flow in perpetuity.
Opportunity expires in 5 years and may be exercised every six months. Value resulting from option exercise is weighted by likelihood of success
of alliance in adjudication of tender. Future cash-flows from underlying asset depend on two state variables:
1. Distribution unit margin (difference between revenues and energy acquisition costs) which follows a geometric Brownian process with Poisson jumps (gathering the possibility of abnormal variations from political interference).
2. Demand for electricity in Brazil which follows a geometric Brownian process with Poisson jumps (reflecting possibility of abnormal variations from dry periods). Correlation between non-anticipated changes in variation of demand and of distribution margin is assumed to be 90%.
The GO value attributable to Endesa investment is difference between value of option to invest in Brazil through the alliance with Enersis and value of the option which Endesa maintains by itself. Input estimation
Expected net profit for year 1997 (NI1 = 0.026 US$) is proxied by analysts’ mean consensus forecast in historical data base I/B/E/S.
Risk adjusted discount rate for investment (Ke = 8.7%) is computed using CAPM. Risk-free interest rate and market premium are obtained by mean return of 10-year American bond (RF = 6.22%), and Fama and French´s (2002) estimates (MP = 4.23%), respectively. Beta coefficient (0.587) is estimated from prior 60 monthly returns of Enersis stocks and S&P 1200 Global Index.
Perpetual growth rate for Enersis AiP cash-flows is 3% (g = 3%)
Strike price per megawatt distributed is estimated from data of previous tenders and set equal to186.75 US$.
Success probabilities in adjudication of tender range between 33 and 66%. Cash-flows to emerge from underlying asset are computed as:
)1)((, ttttt CostMBMSF where tMB is the operating gross
margin of distribution activity calculated as: MBt = Mt·St·c, being: Mt: Unit margin per megawatt distributed, whose evolution is estimated
from historical variation of the GDP in Electricity, Gas and Water sector between 1953 and 1996.
St: Demand for electricity in Brazil, whose evolution is estimated from historical data on electricity consumption in Brazil between 1952 and 2003.
c: Percentage of demand which can be met in the case of adjudication of tender. Estimated from expected market share by tender and minority shareholding of a local partner and set equal to 7.5%.
Costt is the sum of items which reduce operating gross margin and are obtained as a proportional part of gross margin:
tt MBCost ·75.0
is tax rate estimated from information offered by Brazilian Institute of Geography and Statistics and set equal to 30%.
Results
NPV is negative and equal to -525,327.458 dollars (-0.5051 dollars per Endesa share)
Value of GO in Brazil is relevant enough to justify Endesa investment in Enersis.
Positive relationship between value of GO and likelihood of success in tender.
Negative relationship between value of GO and the overpriced tender offered.
Increase in regulatory uncertainty reduces value of GO under all assumptions considered.
19
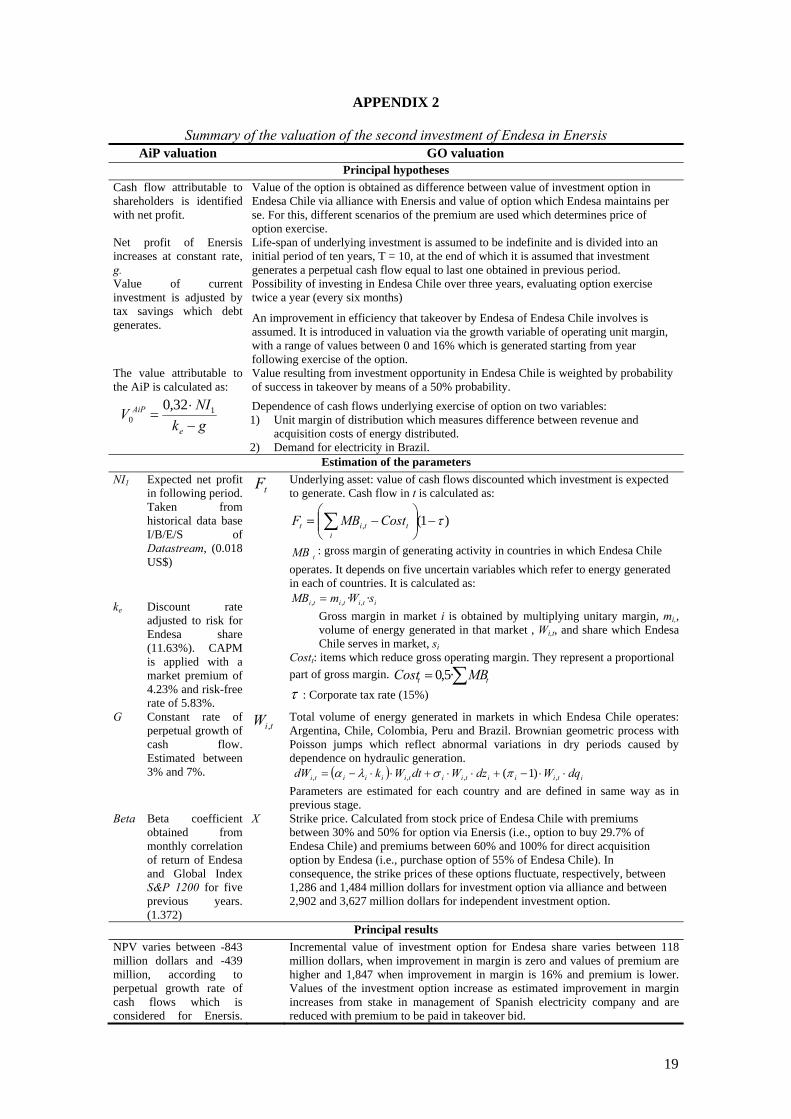
APPENDIX 2
Summary of the valuation of the second investment of Endesa in Enersis AiP valuation GO valuation
Principal hypotheses
Cash flow attributable to shareholders is identified with net profit.
Value of the option is obtained as difference between value of investment option in Endesa Chile via alliance with Enersis and value of option which Endesa maintains per se. For this, different scenarios of the premium are used which determines price of option exercise.
Net profit of Enersis increases at constant rate, g.
Life-span of underlying investment is assumed to be indefinite and is divided into an initial period of ten years, T = 10, at the end of which it is assumed that investment generates a perpetual cash flow equal to last one obtained in previous period.
Value of current investment is adjusted by tax savings which debt generates.
Possibility of investing in Endesa Chile over three years, evaluating option exercise twice a year (every six months)
An improvement in efficiency that takeover by Endesa of Endesa Chile involves is assumed. It is introduced in valuation via the growth variable of operating unit margin, with a range of values between 0 and 16% which is generated starting from year following exercise of the option.
The value attributable to the AiP is calculated as:
gk
NIV
e
AiP
10
32,0
Value resulting from investment opportunity in Endesa Chile is weighted by probability of success in takeover by means of a 50% probability.
Dependence of cash flows underlying exercise of option on two variables: 1) Unit margin of distribution which measures difference between revenue and
acquisition costs of energy distributed. 2) Demand for electricity in Brazil.
Estimation of the parameters
NI1 Expected net profit in following period. Taken from historical data base I/B/E/S of Datastream, (0.018 US$)
tF Underlying asset: value of cash flows discounted which investment is expected to generate. Cash flow in t is calculated as:
)1(,
t
itit CostMBF
tMB : gross margin of generating activity in countries in which Endesa Chile
operates. It depends on five uncertain variables which refer to energy generated in each of countries. It is calculated as:
itititi sWmMB ·· ,,,
Gross margin in market i is obtained by multiplying unitary margin, mi,, volume of energy generated in that market , Wi,t, and share which Endesa Chile serves in market, si
Costt: items which reduce gross operating margin. They represent a proportional
part of gross margin. tt MBCost ·5,0
: Corporate tax rate (15%)
ke Discount rate adjusted to risk for Endesa share (11.63%). CAPM is applied with a market premium of 4.23% and risk-free rate of 5.83%.
G Constant rate of perpetual growth of cash flow. Estimated between 3% and 7%.
tiW , Total volume of energy generated in markets in which Endesa Chile operates: Argentina, Chile, Colombia, Peru and Brazil. Brownian geometric process with Poisson jumps which reflect abnormal variations in dry periods caused by dependence on hydraulic generation. itiiitiitiiiiti dqWdzWdtWkdW ,,,, )1(
Parameters are estimated for each country and are defined in same way as in previous stage.
Beta
Beta coefficient obtained from monthly correlation of return of Endesa and Global Index S&P 1200 for five previous years. (1.372)
X Strike price. Calculated from stock price of Endesa Chile with premiums between 30% and 50% for option via Enersis (i.e., option to buy 29.7% of Endesa Chile) and premiums between 60% and 100% for direct acquisition option by Endesa (i.e., purchase option of 55% of Endesa Chile). In consequence, the strike prices of these options fluctuate, respectively, between 1,286 and 1,484 million dollars for investment option via alliance and between 2,902 and 3,627 million dollars for independent investment option.
Principal results
NPV varies between -843 million dollars and -439 million, according to perpetual growth rate of cash flows which is considered for Enersis.
Incremental value of investment option for Endesa share varies between 118 million dollars, when improvement in margin is zero and values of premium are higher and 1,847 when improvement in margin is 16% and premium is lower. Values of the investment option increase as estimated improvement in margin increases from stake in management of Spanish electricity company and are reduced with premium to be paid in takeover bid.

20
Whatever the case, it is negative and allows us to justify decision adopted by Endesa.
Investment option in Endesa Chile only allows compensation of negative NPV in some scenarios.
21
REFERENCES
Albertí, M., León A., and Llobet G., 2003. Evaluation of a Taxi Sector Reform: A Real Options Approach. CEMFI Working Paper, nº 2003_0312.
Alessandri, T.M., Lander, D.M., Bettis, R.A., 2007. Strategic Implications of Valuation: Evidence from Valuing Growth Options, in: Reuer, J.J., Tong, T.W. (Eds.), Real Options Theory, Advances in Strategic Management, 24, 459-484.
Alonso, S., Azofra, V., and de la Fuente, G., 2009a. Las opciones reales en el sector eléctrico. El caso de la expansión de Endesa en Latinoamérica. Cuadernos de Economía y Dirección de Empresas, 38, 65-94.
Alonso, S., Azofra, V., and de la Fuente, G., 2009b. The value of Real Options: The case of Endesa’s takeover of Enersis. Journal of Finance Case and Research, 10 (1), 1-26.
Andrés de, P., Azofra, V. and de la Fuente, G., 2005. Real options as a component of the market value of stocks: evidence form the Spanish Stock Market. Applied Economics, 37 (14), 1673-91.
Andrés de, P., Azofra, V., and de la Fuente, G., 2006. The real options component of firm market value: The case of the technological corporation. Journal of Business Finance and Accounting, 33 (1&2), 133-149.
Azofra, V., de la Fuente, G. and Fortuna, J.M., 2004. Las opciones reales en la industria de componentes del automóvil: Una aplicación a la valoración de una inversión directa en el exterior. Cuadernos de Economía y Dirección de Empresas, 18, 97-120.
Berger, P.G., 2003. Discussion of “Differential Market Reations to Revenue and Expense Surprises. Review of Accounting Studies, 8, 213-220.
Berger, P.G, Ofek, E. and Swary, I., 1996. Investor valuation of the abandonment option. Journal of Financial Economics, 42, 257-287.
Danbolt, J., Hirst, I., Jones, E., 2002. Measuring Growth Opportunities. Applied Financial Economics, 12, 203-212.
Ertimur, Y., Livnat, J. and Martikainen, M., 2003. Differential Market Reactions to Revenue and Expense Surprises. Review of Accounting Studies 8, 185-211.
Gervais, S., 2010. Capital Budgeting and Other Investments Decisions, in Behavioral Finance, H. Kent Baker and John Nofsinger, eds. (Hoboken:Wiley)
Juan, C., Olmos, F., Pérez, J.C. and Casasus, T., 2001. Optimal Investment Management of Harbour Infrastructures. A Real Option Viewpoint. 6th International Conference on Real Options, Cyprus.
Kellog, D., and Charnes, J.M., 2000. Real-Options Valuation for a Biotechnology Company. Financial Analysts Journal, 56, 76-84.
Kester, W.C., 1984. Today’s options for tomorrow’s growth. Harvard Business Review, 62 (2), 153-160.
León, A., and Piñeiro, D., 2004. Valuation of a biotech company: A real options approach. CEMFI working paper, No. 2004–0420.

22
Longstaff, F.A., and Schwartz, E.S., 2001. Valuing American Options by Simulation: A Simple Least-Squares Approach. Review of Financial Studies, 14 (1), 113-147.
Micalizzi, A., 1999. The Flexibility for Discontinuing Product Development and Market Expansion: The Glaxo Wellcome Case, in L. Trigeorgis (ed.): Real Options and Business Strategy: Applications to Decision Making, Risk Books, London.
Rocha, K., Salles, L., Augusto, F., Sandinha, J.A. and Teixeira, J.P., 2007. Real estate and real options. A case study, Emerging Markets Review, 8 (1), 67-79.
Rubio, G., and Lamothe, P., 2006. Real Options in Firm Valuation: Empirical Evidence from European Biotech Firms, 10th International Real Options Conference, New York.
Sáenz-Diez, R., 2004. Valoración de inversiones a través del método de opciones reales. El caso de una empresa tecnológica, Ph.D. Dissertation, Universidad Pontificia de Comillas, Madrid.
Stark, A., 2001. DixPin Biotech Plc. A Simple example of a binary option, in S. Howell (ed.): Real Options, Evaluating Corporate Investment Opportunities in a Dynamic World, Financial Times-Prentice Hall, London.
Trillas, F., 2001. The takeover of Enersis: the control of privatized utilities, Utilities Policy, 10, 25-45.
Swaminathan, S. and Weintrop, J., 1991. The Information Content of Earnings, Revenues, and Expenses. Journal of Accounting Research, 24 (Supplement), 165-200.